Analysis of Key Drivers of Deforestation and Forest ... · PDF fileAnalysis of Key Drivers of...
128
Analysis of Key Drivers of Deforestation and Forest Degradation in the Philippines 01 Department of Environment and Natural Resources
Transcript of Analysis of Key Drivers of Deforestation and Forest ... · PDF fileAnalysis of Key Drivers of...
Analysis of Key Drivers of Deforestation andForest Degradation in the Philippines
01
Department of Environmentand Natural Resources

Imprint
This publication is by the Deutsche Gesellschaft für Internationale Zusammenarbeit through the Climate-relevant Modernization of Forest Policy and Piloting of Reducing Emissions from Deforestation and Forest Degradation (REDD) Project in the Philippines, funded by the German Federal Ministry for the Environment, Nature Conservation and Nuclear Safety (BMU) under its International Climate Initiative.The BMU supports this Initiative based on a decision of the German Parliament. For more information see http://www.international-climate-initiative.com.
As a federally owned enterprise, GIZ supports the German Government in achieving its objectives in the field of international cooperation for sustainable development.
Items from named contributors do not necessarily reflect the views of the publisher.
Published byDeutsche Gesellschaft für Internationale Zusammenarbeit (GIZ) GmbH
Registered officesBonn and Eschborn, GermanyT +49 228 44 60-0 (Bonn)T +49 61 96 79-0 (Eschborn)
ResponsibleRicardo L. CalderonDirectorForest Management BureauDepartment of Environment and Natural Resouces
Dr. Bernd-Markus LissPrincipal AdvisorClimate-relevant Modernization of Forest Policy and Piloting of REDDE: [email protected]
Department of Environment and Natural ResourcesClimate Change Office, 2nd Floor, FASPO BuildingVisayas Avenue, Quezon City, 1101 Philippines
T: +63 2 929 6626 local 207F: +63 2 829 3374
Source and Copyrights© 2012 Deutsche Gesellschaft für Internationale Zusammenarbeit (GIZ) GmbH
Authors / ResearchersAntonio P. Carandang, Leonida A. Bugayong, Priscila C. Dolom, Leni N. Garcia, Ma. Magdalena B. Villanueva, Nena O. Espiritu and the Forestry Development Center, University of the Philippines Los Banos - College of Forestry and Natural Resources
Copyright on PhotosThe photos in this publication are owned by GIZ unless otherwise indicated in the photo.
MapsThe geographical maps are for information purposes only and do not constitute recognition under international law of boundaries and territories. GIZ does not guarantee in any way the current status, accuracy and completeness of the maps. All liability for any loss or damage arising directly or indirectly from their use is excluded.
Layout / DesignRyan G. Palacol
Printed and distributed byDeutsche Gesellschaft für Internationale Zusammenarbeit (GIZ) GmbH
Place and date of publicationManila, PhilippinesApril 2013

Analysis of Key Drivers of Deforestation and Forest Degradation in the Philippines


v
Foreword
The 2011 Philippine Forestry Statistics of the Forest Management Bureau (FMB) show that based on the interpretation and analysis of 2003 satellite imageries, the national forest cover amounts to 7.168 million hectares or 23.89 per cent of the country’s total land area of around 30 million hectares. While the deforestation rate has stabilized and even reversed in some areas, the forest cover is way below the 1934 data of 17.8 million hectares. The forest loss affects the national interest to produce goods and ecosystem services and translates to a substantial contribution to greenhouse gas emissions.
During the UNFCCC COP-13 in Bali, Indonesia in December 2007, the international community has called upon countries to explore the concept of reducing emissions from deforestation and forest degradation (REDD) as a new mechanism to combine forest protection with objectives of climate protection, biodiversity conservation and improvement of local livelihoods. In the recent international discussions, the concept has been expanded to include conservation of forest carbon stocks, sustainable management of forests and enhancement of forest carbon stocks (REDD-plus). At the country level, the Philippines expressed its high interest to participate as signified by the commitment to adjust its forest policy to the necessities of climate protection in the context of REDD-plus. In this context, the Government in collaboration with a wide range of actors has established the Philippine National REDD-Plus Strategy (PRNRPS) which has become integral part of the Philippine Development Plan 2011-2016 and the National Climate Change Action Plan 2011-2028.
To support the implementation of the PNRPS particularly the REDD-plus readiness phase, the International Climate Initiative of the German Federal Ministry for the Environment, Nature Conservation and Nuclear Safety (BMU) funded the Project “Climate-Relevant Modernization of the National Forest Policy and Piloting of REDD Measures in the Philippines”. The Project is implemented by GIZ with the DENR as the main partner, in cooperation with local government units (LGUs) and a wide range of stakeholders. In line with the country’s efforts towards forest and climate protection and the development of appropriate policy and instruments for pursuing REDD-plus as foreseen under the PNRPS, the Project supported the conduct of four policy studies in collaboration with key stakeholders: (1) Analysis of drivers of deforestation and forest degradation, (2) Forest policy, (3) Clarifying carbon rights, and (4) Analysis of free prior informed consent (FPIC) implementation.
This study aims to assess the key drivers of deforestation and forest degradation, analyze the underlying causes, incentives and relative importance, to develop a policy agenda and to derive differentiated recommendations to address the various drivers of deforestation and forest degradation effectively and to be able to design related REDD+ activities.
Thus, the study could provide pertinent information to policy makers at local and national levels in looking deeply into the drivers of deforestation and forest degradation and craft necessary policy actions to prevent their occurrence and reduce the negative impacts of climate change through mitigation and adaptation. Understanding the direct and indirect causes of forest loss would result in a more focused strategy to reduce greenhouse gas emissions and combat global warming.
vivi
We would like to extend our deep appreciation to the study team of the Forestry Development Center headed by Dr. Antonio P. Carandang, for their tireless efforts in gathering secondary data, interviewing relevant stakeholders in the four (4) study sites, analyzing all the information and preparing a comprehensive report that contributes to a better understanding of key drivers of deforestation and forest degradation in the Philippines.

vii
Acknowledgements
The study team acknowledges the support provided by the implementers of the project “Climate-relevant Modernisation of the National Forest Policy and Piloting of REDD in the Philippines” funded under the International Climate Initiative of the German Federal Ministry for the Environment, Nature Conservation and Nuclear Safety (BMU) and implemented by the Deutsche Gesellschaft für Internationale Zusammenarbeit (GIZ) GmbH together with the Department of Environment and Natural Resources (DENR). The Forest Management Bureau (FMB) helped oversee the conduct of the four policy studies, among which is the “Analysis of Key Drivers of Deforestation and Forest Degradation in the Philippines”. The DENR officials from the Central Office, FMB, Regional Offices (4A, 4B, 8, 10), PENROs, and CENROS have kindly assisted us in coordinating our field visits and the conduct of key informant interviews and focus group discussions. The National Commission on Indigenous Peoples (NCIP), from the Commissioners to the Provincial and local officers, were supportive of our research activities.
The key informants and focus group discussion participants in the four sites – General Nakar, Quezon; Southern Leyte; Palawan; and Mount Malindang – have been kind enough to provide us with their insights and information that have guided us in the analysis. We appreciate the active participation of the various barangay officials and community members, indigenous people’s organizations, non-government organizations, forest products and related industries, and local government units that have all been instrumental in making us understand the drivers of deforestation and forest degradation in their sites. The list of KII and FGD participants are in the Appendix B.
Our appreciation is also forwarded to the officials of the College of Forestry and Natural Resources at the University of the Philippines Los Baños for always supporting the policy studies of the Forestry Development Center’s staff members. Finally, we have benefited from the comments and suggestions of the reviewers of this report, former DENR Secretary Ricardo M. Umali, CFNR Dean Juan M. Pulhin, Mr. Jörg Seifert-Granzin, and Dr. Bernd-Markus Liss.

viii Analysis of Key Drivers of Deforestation and Forest Degradation in the Philippines

Analysis of Key Drivers of Deforestation and Forest Degradation in the Philippines
Table of Contents
FOREWORD
ACKNOWLEDGEMENTS
LIST OF TABLES
LIST OF FIGURES
ExECUTIVE SUMMARy
ACRONyMS
1. INTRODUCTION
Objectives
Methodology
a. Selection of Study Sites
b. Secondary Data Gathering and Analysis
c. Pre-testing and Finalization of Research Tools
d. Respondents
e. Field Surveys
f. Data Analysis
Limitations of the Study
2. THE CONTExT OF DEFORESTATION AND FOREST DEGRADATION
International and Regional Context
The Case of the Philippines
Deforestation in the Philippines
Climate Change and REDD-plus Initiatives in the Philippines
3. ANALyTICAL FRAMEWORK
4. KEy DRIVERS OF DEFORESTATION AND FOREST DEGRADATION
A. Forest Products Extraction
Timber Harvesting - Legal and Illegal Logging / Timber Poaching
Fuelwood Gathering and Charcoal Making
Non-Timber Forest Products Extraction (NTFP)
B. Agricultural Expansion
Kaingin, Shifting Cultivation / Traditional Swidden
Forestlands as Settlement / Resettlement Areas
Conversion of Forestlands to Oil Palm and Rubber Plantations
Highland Vegetable Farming
C. Infrastructure Expansion
Transport: Road Construction
Markets: Sawmills, Furniture and Processing Plants
Mining
Hydropower dam construction
Tourism Facilities Development
D. Biophysical Factors
v
vii
xi
xii
xiii
xv
3
4
4
5
6
6
7
7
8
11
19
19
23
27
33
34
36
39
41
41
43
44
46
46
46
47
48
52
53
54
5. UNDERLyING CAUSES OF DEFORESTATION AND FOREST DEGRADATION
Policy, Institutional and Governance Factors
Socio-Demographic and Cultural Factors
Economic, Market and Technological Factors
6. RELATIVE IMPORTANCE OF DRIVERS OF DEFORESTATION AND FOREST DEGRADATION
Ranking by Key Informants Interviewed
Ranking by FGD Participants
7. LOCAL INITIATIVES TO ADDRESS DRIVERS OF DEFORESTATION AND FOREST DEGRADATION
8. NATIONAL INITIATIVES TO ADDRESS DRIVERS OF DEFORESTATION AND FOREST DEGRADATION
9. POLICIES AND PROGRAMS THAT SERVED AS PERVERSE INCENTIVES LEADING TO DEFORESTATION
10. POLICy AGENDA AND OPRATIONAL RECOMMENDATIONS
REFERENCES
APPENDIx A – KEy DRIVERS OF DEFORESTATION AND FOREST DEGRADATION By SITE
APPENDIx B – LIST OF KII AND FGD PARTICIPANTS
APPENDIx C - PHOTODOCUMENTATION
60
62
63
69
70
73
79
87
95
101
Analysis of Key Drivers of Deforestation and Forest Degradation in the Philippines

xi
List of Tables
TAbLe No. TITLe PAge
1 Number of key informants by sector in the four sites 6
2 Number of participants to the FGDs in the four sites 6
3 Key drivers and underlying causes in Southeast Asian countries, 1990-2008 (Source: Wertz-Kanounnikoff and Kongphan-Apirak, 2008) 16
4 Philippine historical forest cover, all forest types (1575-2005) 19
5 Estimated population of the Philippines, various years 19
6 National land use accounts, in ‘000 ha (1935-2003) 22
7 Forest conversion estimates, ‘000 ha 23
8 Mean above ground carbon density of forestland cover in the Philippines 24
9 Total emissions from the LUCF sector of the Philippines (Gg CO2 equivalent) 24
10 List of direct drivers of deforestation and forest degradation identified by key informants by sector in the four sites 33
11 Area of forest under timber license and management agreements in the Philippines, 1980-2008 34
12 List of logging companies and estimated periods of operation in the four sites 35
13 Estimates of annual per capita wood fuel consumption in the Philippines (various sources) 37
14 Wood fuel consumption by industry, 1990 (in ‘000 cubic meters) 37
15 Production of selected non-timber forest products in the Philippines, 1980-2008 40
16 Exports of selected non-timber forest products in the Philippines, 1980-2008 40
17 Number of wood processing plants in the Philippines, 1980-2008 48
18 Potential environmental and social impacts of mining on ecosystems and local communities 50
19 Foreign tourist arrivals in the Philippines, 1996-2011 53
20 Indirect drivers of deforestation and forest degradation listed by key informants by sector in the four sites 59
21 Net upland migrant population in the Philippines, 1960-1985 62
22 Number of registered chainsaws in Real, Quezon, Southern Leyte and Misamis Occidental (2003-2011) 65
23 KII ranking results of direct drivers of deforestation and forest degradation by stakeholder groups in the four sites 69
24 FGD ranking results of direct drivers of deforestation and forest degradation in the four sites 71
25 Number and area (in ha) of CBFM agreements by region, 2008 82
26 Logging ban / moratorium policy issuances in the Philippines, 1976-2011 83
27 Area reforested by government and non-government sectors (in ha), 1975-2008 85

xii
List of Figures
FIgure No. TITLe PAges
1 Location of study sites 5
2 Proximate causes and underlying forces of tropical deforestation 14
3 Historical population and forest cover in the Philippines 21
4 Framework of analysis for the study 29
5 Fishbone diagram of the underlying causes of drivers of deforestation
and forest degradation in the Philippines 30
6 Location of operating mines in the Philippines 49
7 Climate map of the Philippines showing the climatic types
and percentage frequency of typhoons 55
8 Annual production of logs, fuelwood, and charcoal in the Philippines, in ‘000 cu m 64

xiii
executive summary
The Philippines’ forest cover has declined from 17.8 million hectares or about 60% of the land area in 1934 to about 7.168 million hectares or 23.89 % in 2011 (PFS, 2011). From a position as one of the top ten deforestation countries contributing to global greenhouse gas emissions of 17-20 percent from global forest loss in 2000 (FAO, 2006), the country has since recovered with modest forest cover increase of 55,000 hectares per year (FAO, 2010). The Philippines formulated its National REDD-plus Strategy (PNRPS) in 2009-2010 which indicates that planned (legal) and unplanned (illegal) deforestation and forest degradation need to be identified at multiple scales (national, regional, local) and different geographic areas to inform conservation interventions, financial feasibility of reducing emissions from deforestation and forest degradation (REDD-plus), monitoring approaches and policy reform.
The project “Climate-relevant Modernisation of the National Forest Policy and Piloting of REDD in the Philippines” funded under the International Climate Initiative of the German Federal Ministry for the Environment, Nature Conservation and Nuclear Safety (BMU) and implemented by the Deutsche Gesellschaft für Internationale Zusammenarbeit (GIZ) GmbH together with the Department of Environment and Natural Resources (DENR) supports the implementation of the PNRPS, with REDD-plus readiness activities including the conduct of policy studies. One of the four policy studies supported by the project under the PNRPS is on “Analysis of Key Drivers of Deforestation and Forest Degradation in the Philippines”. It seeks to address the dearth of empirical data on the drivers of deforestation and forest degradation at selected local sites while providing insights into the national situation as basis for conservation interventions and feasibility of REDD-plus in the country.
This study aims to assess drivers of deforestation and forest degradation with focus on the identified items in the PNRPS and relevance to REDD-plus pilot implementation; analyze underlying causes, incentives and perverse incentives / disincentives that cause deforestation and forest degradation; assess the importance of various drivers of deforestation and forest degradation in the Philippines overall nationally and specifically regionally (a priority list); and develop a policy agenda and differentiated recommendations to address the various drivers of deforestation and forest degradation.
Four sites representing four major island groups were selected jointly by representatives of the GIZ-BMU, Forest Management Bureau (FMB), CoDE REDD and other partners. The four sites represent different geographical regions (Luzon, Visayas, Mindanao), forest cover and land use conditions, tenure and objectives. They include: General Nakar, Quezon; Southern Leyte towns of Maasin, Bontoc, Silago, Sogod, and Tomas Oppus; Narra and Quezon municipalities of Palawan; and Mount Malindang Range Natural Park in Misamis Occidental.
The study analyzed secondary data and literature and conducted key informant interviews (n=164), focus group discussions (n=19 with 271 participants) with various sectors, and sample site validation in the four sites to determine the key drivers and underlying causes of deforestation and forest degradation. Survey results include direct drivers grouped into forest products extraction (logging / timber poaching, charcoal production, fuelwood and NTFP gathering), agricultural expansion (kaingin making, forest conversion to settlements, plantations, vegetable gardens, grazing), infrastructure expansion (mining, road construction, hydropower dam and tourism facilities construction). The drivers are grouped following Geist and Lambin’s (2001) categories.
The underlying causes of deforestation and forest degradation are grouped into policy, institutional and governance issues; socio-demographic-cultural factors; and economic-market-technological factors. A fishbone analysis summarizes the indirect causes as follows: weak policies

xiv Analysis of Key Drivers of Deforestation and Forest Degradation in the Philippines
and governance (unstable, confusing, conflicting forest policies and mandates; logging bans as perverse incentives; open access forestlands due to lack of clear tenure; lack of political will and coordination with other sectors; poor monitoring and law enforcement); poverty and population pressure (landlessness and expansion of farms and settlements; forests valued for subsistence and cash income); market demand and economic development (economic growth targets; high demand for forest products; improved market access through road construction); and technological and biophysical factors (inappropriate land uses; low farm productivity; over-extraction and unsustainable harvesting; proliferation of chainsaws; fire, floods, landslides, calamities).
A ranking of relative importance of drivers of deforestation reveal that key informants deemed kaingin-making (in all four sites) as most important followed by mining (in two sites, General Nakar and Palawan) and forest conversion into non-forest uses (i.e., road construction, settlement, conversion into built-up areas). FGD results had the same ranking. With regards to drivers of forest degradation, KII ranked logging (both legal and illegal), natural calamities, and timber poaching as the top three most important drivers. FGDs ranked the top three drivers as logging, charcoal making and timber poaching.
The study recommends policy agenda that include: harmonizing major forestry policies through a forestry summit; a comprehensive review of Executive Order 23 and its impacts on forest protection and conservation; consolidation of a national forest land use plan based on consolidation of provincial and municipal land use plans; legislation of a national policy on co-management; enactment of a sustainable management of forests law; and a review and finalization of the country’s definition of forest.
Operational recommendations forwarded by this study are: decentralization of forest management functions; regular updating of the country’s forest cover and land use data and national database system; development of forest land use plans (FLUP) to support priority development and livelihood programs; massive information and education campaign and comprehensive capability enhancement training program; development of appropriate and acceptable criteria and indicators to measure agreed actions and commitments of various stakeholders; and mainstreaming of anti-corruption efforts at all levels.
xvAnalysis of Key Drivers of Deforestation and Forest Degradation in the Philippines
Acronyms
ADSDPP Ancestral Domain Sustainable Development and Protection Plan
A&D Alienable and Disposable
ANR Assisted Natural Regeneration
BLGU Barangay Local Government Unit
CADC Certificate of Ancestral Domain Claim
CADT Certificate of Ancestral Domain Title
CBFMA Community-Based Forest Management Agreement
CENRO Community Environment and Natural Resources Officer
CLOA Certificate of Land Ownership Award
CO2
Carbon dioxide
CSO Civil Society Organization
DA Department of Agriculture
DAR Department of Agrarian Reform
DAO Department Administrative Order
DENR Department of Environment and Natural Resources
DD Deforestation and forest Degradation
ECAN Environmentally Critical Areas Network
EO Executive Order
FAO Food and Agriculture Organization
FDC Forestry Development Center
FLUP Forest Land Use Plan
FMB Forest Management Bureau
FRA Forest Resources Assessment
FTAA Financial or Technical Assistance Agreement
GHG Greenhouse gases
GPS Global Positioning System
GIZ Deutsche Gesellschaft für Internationale Zusammenarbeit (GIZ) GmbH
IEC Information, Education, Communication
IFMA Integrated Forest Management Agreement
IP Indigenous People
IPRA Indigenous People’s Rights Act
IRR Implementing Rules and Regulations
ISF Integrated Social Forestry
JMC Joint Memorandum Circular
KBA Key Biodiversity Area
LGU Local Government Unit
MENRO Municipal Environment and Natural Resources Officer
MGB Mines and Geosciences Bureau
MMRNP Mount Malindang Range Natural Park
MPSA Mineral Production Sharing Agreement
MRV Measurement, Reporting, Verification
MSEP Municipal Socio-Economic Profile
MWSS Metropolitan Waterworks and Sewerage System
NCIP National Commission on Indigenous Peoples
NAMRIA National Mapping and Resources Information Administration
xvi Analysis of Key Drivers of Deforestation and Forest Degradation in the Philippines
NIPAS National Integrated Protected Areas System
NGO Non-Government Organization
PA Protected Area
PACBRMA Protected Area Community-Based Resource Management Agreement
PAMB Protected Area Management Board
PASU Protected Area Superintendent
PAWB Protected Areas and Wildlife Bureau
PD Presidential Decree
PENRMO Provincial Environment and Natural Resources Management Office
PENRO Provincial Environment and Natural Resources Office(r)
PMRB Provincial Mining Regulatory Board
PNP Philippine National Police
PNRPS Philippine National REDD-Plus Strategy
PO People’s Organization
RA Republic Act
RCC Rattan Cutting Contract
RED Regional Executive Director
REDD Reducing Emissions from Deforestation and Forest Degradation
SEP Strategic Environmental Plan
SIFMA Socialized Industrial Forest Management Agreement
SSMP Small-Scale Mining Permit
SPLTP Special Private Land Timber Permit
SOP Standard Operating Procedure / Payment
TLA Timber License Agreement
TPSA Timber Production Sharing Agreement
UPLBCFNR University of the Philippines Los Baños College of Forestry and Natural Resources
WPP Wood Processing Plant

Analysis of Key Drivers of Deforestation and Forest Degradation in the Philippines
1.0 Introduction


3
Introduction
The Philippines’ forest cover has declined from 17.8 million hectares or about 60% of the land area in 1934 to about 7.17 million hectares or 24% in 2011(PFS, 2011). From a position as one of the top ten deforestation countries contributing to global greenhouse gas emissions of 17-20 percent from global forest loss in 2000 (FAO, 2006), the country has since recovered with modest forest cover increase and is now in the list of countries with positive forest growth (FAO, 2010).
Discussions on reducing emissions from deforestation and forest degradation (REDD) came up in 2005 during the UNFCCC COP-11 in Montreal, Canada, and then led to a decision on REDD under COP-13 in Bali1. The initial concept of REDD as a mechanism to combine forest protection with objectives of climate protection, biodiversity conservation, and improvement of local livelihoods was later on expanded to include conservation and enhancement of forest carbon stocks and sustainable management of forests (REDD-plus). The Philippines has expressed its interest to participate in REDD-plus through initiatives from the Department of Environment and Natural Resources (DENR)-Forest Management Bureau, the CoDE REDD (coalition of civil society organizations), academe, and other partners in drafting a national strategy on REDD-plus that was finally approved by DENR in August 2010. Under its research and development component the PNRPS calls for further studies to ‘identify the primary drivers of deforestation and forest degradation and collaborate with diverse stakeholders to propose science-based conservation interventions such as legislation, incentive structures and capacity building’. This should address a national and site-specific analysis of the drivers of deforestation and forest degradation and inform conservation interventions and core REDD-plus activities.
Pursuant to the Climate Change Act of 2009, the National Framework Strategy on Climate Change (NFSCC) was adopted in April 2010 and it includes the Philippine National REDD-Plus Strategy (PNRPS) as an important element for mitigation and adaptation to climate change. The PNRPS formulated in 2009-2010 indicates that planned (legal) and unplanned (illegal) deforestation and forest degradation need to be identified at multiple scales (national, regional, local) and different geographic areas to inform conservation interventions, REDD-plus financial feasibility, monitoring approaches and policy reform.
The project “Climate-relevant Modernisation of the National Forest Policy and Piloting of REDD Measures in the Philippines” funded under the International Climate Initiative of the German Federal Ministry for the Environment (BMU) and implemented by the Deutsche Gesellschaft für Internationale Zusammenarbeit (GIZ) GmbH together with the Department of Environment and Natural Resources (DENR) supports the PNRPS with various activities towards REDD-readiness, including the conduct of policy studies. One of the four policy studies supported by the project under the PNRPS is on “Assessing the Key Drivers of Deforestation and Forest Degradation in the Philippines”. It seeks to address the dearth of empirical data on the drivers of deforestation and forest degradation at selected local sites while providing insights into the national situation as basis for conservation interventions and feasibility of REDD-plus projects in the country.
objeCTIves
The study had the following objectives:1. Assess drivers of deforestation and forest degradation with focus on the identified items in
the PNRPS and relevance to REDD-plus pilot implementation; 2. Analyze underlying causes, incentives and perverse incentives / disincentives that cause
deforestation and forest degradation;3. Assess the importance of various drivers of deforestation and forest degradation in the
Philippines overall nationally and specifically regionally (a priority list); and
1 FCCC / CP / 2007 / 6 / Add.1, Decision 2 / CP.13

4 Analysis of Key Drivers of Deforestation and Forest Degradation in the Philippines
4. Develop a policy agenda and differentiated recommendations to address the various drivers of deforestation and forest degradation.
MeThodoLogy The key drivers and underlying causes of deforestation and forest degradation (DD) listed in the Philippine National REDD-Plus Strategy (PNRPS 2010) were analyzed at the national level with focus on four REDD-plus pilot / demonstration sites.
The study undertook activities that addressed the tasks corresponding to the four stated objectives both at the national and local levels. Under each task, specific activities were conducted in four selected sites where pilot or demonstration sites on REDD-plus are being implemented by different organizations. The selected sites represent different geographical regions (Luzon, Visayas, Mindanao), forest cover and land use conditions, tenure and objectives. The study tried to ensure that the processes and contents are non-discriminatory and gender-responsive. In all the KIIs and FGDs, the team made sure to invite male and female representatives so that their gender concerns are ventilated and discussed.
A. Selection of Study Sites
Four sites representing four major island groups were selected jointly by representatives of the GIZ, Forest Management Bureau (FMB), CoDE REDD and other partners. The four sites represent different geographical regions (Luzon, Visayas, Mindanao), forest cover and land use conditions, tenure and objectives. They include: General Nakar, Quezon; Southern Leyte towns of Maasin, Bontoc, Silago, Sogod, and Tomas Oppus; Narra and Quezon municipalities of Palawan; and Mount Malindang Range Natural Park in Misamis Occidental (Figure 1).
General Nakar in the province of Quezon, Luzon Island was selected mainly for its large forest area (161,769 ha) and rich biodiversity, which are under threat of illegal forest products extraction. It has been under logging moratorium since 2004 through a Presidential Proclamation which was reinforced with a Provincial Logging Ban Ordinance in 2008. The Agta-Dumagat-Remontados of General Nakar were recently given a Certificate of Ancestral Domain Title (CADT) over 144,000 ha. The area is a pilot site for a REDD-plus demonstration activity implemented by the Fauna and Flora International (FFI) and Non-Timber Forest Products Task Force (NTFP-TF).

5Analysis of Key Drivers of Deforestation and Forest Degradation in the Philippines Analysis of Key Drivers of Deforestation and Forest Degradation in the Philippines
2 The Trees for Travel-funded project is discussed in the Policy Study on Clarifying Carbon Rights
Figure 1. Location of study sites
B. Secondary Data Gathering and Analysis
Related literature, relevant reports, statistics, and maps on the four study sites (General Nakar, Quezon; Southern Leyte; Mount Malindang in Misamis Occidental; and Victoria-Anepahan Range in Palawan) were gathered and reviewed to determine the site conditions with particular focus on the key activities on deforestation and forest degradation. Historical data and information on the events and conditions
MouNT MALINdANgrANge NATurAL PArk, MIsAMIs oCCIdeNTAL,MINdANAo (ProTeCTed AreA)
souTherN LeyTe, vIsAyAs(CbFMA, deMo sITe-deNr-gIZ-redd+)
vICTorIA-ANePAhAN MouNTAIN rANge IN NArrA & QueZoN, PALAwAN
(seP LAw, PILoT sITe oFNTFP-eP, FFI, eLAC)
sIerrA MAdre MouNTAIN rANge IN geNerAL NAkAr, QueZoN
(CAdT, FLuP, deMo sITe - FFI,NTFP-TF, TeFI)
One city and four municipalities of Southern Leyte (Maasin, Bontoc, Silago, Sogod, Tomas Oppus) represent the Visayas Region. These are under the GIZ demonstration project on climate change and REDD-plus. The project involves people’s organizations with Community-Based Forest Management Agreements (CBFMA). Southern Leyte is one of the most deforested provinces and has been under logging ban since the enactment of Administrative Order No. 31 of 1982 and Republic Act No. 9772 in 2009.
The Victoria-Anepahan Range in the municipalities of Narra and Quezon in Palawan province is a pilot site of the EU-funded project on REDD-plus currently implemented by the NTFP-EP, FFI, Environmental Legal Action Committee (ELAC), and NATRIPAL, a local NGO. Victoria-Anepahan Range is a biodiversity-rich area currently under threat of extractive industries such as mining and illegal forest products harvesting. The province of Palawan has been under total commercial logging ban since the implementation of the Strategic Environmental Plan (SEP) for Palawan Act (RA 7611) of 1992.
Mount Malindang is located in 14 municipalities / cities in the province of Misamis Occidental. It is a biodiversity-rich mountain range included among the ten priority areas under the National Integrated Protected Areas System (NIPAS) and was proclaimed as a Natural Park in 2002 through Proclamation No. 228. The Mount Malindang Range Natural Park (MMNP), the only terrestrial protected area in Mindanao, is under threat of illegal forest products harvesting, and conversion of forest land use to highland vegetable farming and settlements. Part of the area is under a rainforestation project funded by Trees for Travel (Netherlands) which is claiming the carbon credits over the forest cover.2
CLosed ForesT LANdoPeN ForesT LANdoTher LANdsoTher wooded LANdsINLANd wATer
LegeNd:
LANd ForesT Cover sTATusCy 2004

6 Analysis of Key Drivers of Deforestation and Forest Degradation in the Philippines
occurring in the four sites, including national and local policies, were collected where these are available. A preliminary analysis of these data and information as well as related literature, policies, and maps served as basis for the survey instruments developed for the study.
C. Pre-testing and Finalization of Research Tools
The policy study team developed guide questions for the key informant interviews (KII) and focus group discussions (FGD). The instruments were pre-tested on March 2-3, 2011 in the Quezon study site with representatives from the DENR, the LGU, the PO / IP, and forest products traders (furniture makers) in the Real, Infanta, and General Nakar areas. The FGD guide questions were also pre-tested with representatives of three barangays in General Nakar, namely Barangays Pesa, Batangan, and Maigang. The FGD participants were composed of the barangay captains, the barangay councilor for environment, and some elders with historical recall of the events and conditions of the area. The research tools were revised based on the results of the pre-testing.
D. Respondents
The study tried to ensure that all key stakeholders are represented in the key informant interviews and focused group discussions in all four sites. Government agencies consulted are the Department of Environment and Natural Resources (DENR), National Commission on Indigenous Peoples (NCIP), Palawan Council for Sustainable Development (PCSD), and Local Government Units (LGUs). Indigenous peoples, local communities, people’s organizations and civil society organizations (CSOs) were likewise included in both KII and FGD. Forest products traders and mining companies were also among those interviewed. Table 1 shows a total of 164 KII respondents from nine sectors while Table 2 shows that 271 participants joined the FGDs held with seven sectors in the four sites.
Table 1. Number of key informants by sector in the four sites
sector general Nakar southern Leyte PalawanMisamis
occidentalTotal
DENR 10 8 12 6 36
LGU 8 9 14 5 36
NCIP 4 - 1 2 7
PCSD - - 1 - 1
CSO 4 2 4 8 18
Indigenous People 20 - - 20
PO, communities 28 101 3 - 132
Forest Products Traders 5 - 3 5 13
Mining company - - 1 - 1
Total 79 120 39 26 164
Table 2. Number of participants to the Fgds in the four sites
sectorgeneral Nakar southern Leyte Palawan Misamis occidental Total
Fgd=8 Fgd=3 Fgd=4 Fgd=4 Fgd=19
DENR - 7 - - 7
LGU 17 8 - 18 43
CSO - 1 - - 1
IP leaders 40 - 15 16 71
PO officers 67 10 - 10 87
BLGU / PO leaders - - 48 48
Forest Products Traders 10 - - 4 14
Total 134 26 63 48 271

7Analysis of Key Drivers of Deforestation and Forest Degradation in the Philippines Analysis of Key Drivers of Deforestation and Forest Degradation in the Philippines
E. Field Surveys
Prior to the field surveys, the study team coordinated with the relevant agencies and sectors at the national level (DENR: FMB, PAWB, NAMRIA; NCIP, GIZ, CoDe REDD and partners, etc.) and at the local levels. A memorandum from DENR’s Undersecretary Adobo (Field Operations) was sent to the regional, provincial and community environment and natural resources offices to facilitate the data gathering and field surveys of the study team. Likewise, this study (along with the three other policy studies: forest policy, carbon rights, and free, prior and informed consent) was presented to the Council Members of the National Council on Indigenous Peoples (NCIP) for clearance and coordination with local NCIP offices in the study sites. Letters were sent to local offices of relevant sectors such as DENR, NCIP, other government agencies, local government units (executive officials and barangays), people’s organizations, civil society organizations, and forest products traders. Contacts with partners and local officials have been made to coordinate the schedule of field activities of the study teams.
The field surveys in the four study sites involved key informant interviews with representatives of various stakeholders, focused group discussions with key stakeholder groups, and site visits to areas with existing deforestation and forest degradation activities. The site visits involved taking GPS readings of the location, actual observation of the existing conditions, and where possible, interviews with local people regarding the historical land use in the area. Selection of sites with deforestation and forest degradation activities was based on consultations with the local stakeholders.
Field validation was done to ascertain current land uses in the site based on interviews of key informants and comparing these with secondary data from previous decades. Due to time constraints, only a few sample sites were visited in each of the four study sites where current land uses were observed and local guides and residents interviewed, and GPS readings were made. The GPS points are indicated on the current land use map of each study site. Land cover maps in 1970, 1980, 2003 and 2009 provided by NAMRIA were digitized and interpreted using available land cover classifications. The said maps were used as basis for validating the respondents’ perceived change in forest cover type in the sample sites in the past years (1970, 1980, 2003 and 2009). There were not enough sample sites visited (due to time constraints) to enable quantification of forest cover changes in the study sites, hence only qualitative descriptions were made.
F. Data Analysis
The secondary and primary data from the key informant interviews, focused group discussions, and visits to sample sites with deforestation and forest degradation activities were analyzed using the framework of analysis in Figure 2 (see Chapter 2.0). Triangulation methods were used to validate the results of the KIIs and FGDs with secondary data and other studies to come up with a comprehensive analysis of the drivers of deforestation and forest degradation in each site. The underlying causes of the direct drivers of

8 Analysis of Key Drivers of Deforestation and Forest Degradation in the Philippines
deforestation and forest degradation are presented using the Fish Bone diagram in Figure 3 (see Chapter 2.0). The relative importance given to the drivers by the respondents was also determined through the KIIs and FGDs. A system of weights was used to determine the relative importance of the drivers. The respondents were asked to give importance to the drivers of deforestation and forest degradation in the form of a scale of 1 to 5 where 1 is the most important driver and 5 is the least important based on their local knowledge of what happened in their respective areas. In the analysis, the most important driver was given a weight of 5 while the least important was given a weight of 1 during the aggregation. Indicatively, the driver that got the most number of points was ranked as first, the next driver that got the second most number of points was ranked as second and so on. This procedure tried to capture the relative importance of each driver as perceived by the respondents themselves. Nevertheless, the study team treats this ranking as only indicative and serves as a guide in identifying priority interventions in terms of national policy reforms and some operational policy adjustments that can be adopted on each site.
The analysis serves as basis for formulating a policy reform agenda and differentiated recommendations to address the various drivers of deforestation and forest degradation at the national level and at each of the sites studied.
LIMITATIoNs oF The sTudy
This study focused on key drivers prevailing in the four study sites representative of various situations in other areas of the country where REDD-plus may be implemented. While there was an attempt to relate the study site scenarios with the national level situation, it is constrained by a number of factors. One is the yet to be completed analysis of more recent national forest cover maps based on high resolution satellite imageries and remote sensing data that could have been used to validate the extent of deforestation as reported by the respondents in the KIIs and FGDs. Also, the limited database on forest lands and resources as well as land use information that are available at the national and field levels make it difficult to validate many of the respondents’ recollections and observations from different time periods. This was compounded by the short duration of data gathering due to fund limitations resulting in gaps in data and observations that could further substantiate the findings and recommendations of this study.

Analysis of Key Drivers of Deforestation and Forest Degradation in the Philippines
2.0 The context of deforestationand forest degradation


11
The CoNTeXT oF deForesTATIoN
INTerNATIoNAL ANd regIoNAL CoNTeXT
Forests are critical to the global climate system due to their ability to absorb and store carbon. Carbon loss due to deforestation is estimated to contribute about 17 to 20 % of global greenhouse gas (GHG) emissions (IPCC, 2007). The loss of forest biomass and oxidation of soil organic carbon through slash-and-burn and subsequent land use releases approximately 5.8 Gt CO2 annually into the atmosphere (Nabuurs et al., 2007). Research shows that much of this deforestation occurs in tropical forests found in many developing countries.
Mitigating climate change through avoided deforestation was discussed as early as 1997 but it was only in 2005, when the concept of reducing emissions from deforestation was brought up to the international climate policy discussion under the Conference of Parties (COP) 11 of the United Nations Framework Convention on Climate Change (UNFCCC) in Montreal. It was then in 2007 that the COP-13 under the UNFCCC agreed to consider mechanisms on Reducing Emissions from Deforestation and Forest Degradation (REDD) as part of the post-Kyoto climate regime. This resulted in a decision of the UNFCCC parties as part of the Bali Action Plan which called for “policy approaches and positive incentives on issues relating to reducing emissions from deforestation and forest degradation in developing countries; and the role of conservation, sustainable management of forests and enhancement of forest carbon stocks in developing countries” (FCCC / CP / 2007 / 6 / Add.1, 14 March 2008; Decision 1 / CP.13 [BAP], paragraph 1(b)(iii)). The Decision also recognizes “the complexity of the problem, different national circumstances and the multiple drivers of deforestation and forest degradation”.
The rationale behind REDD is that land managers are compensated for retaining high carbon stock forests instead of clearing them for low carbon stock agricultural and non-forest land uses. The financial compensation for developing countries that are willing and able to reduce their emissions from forests is based on a reference time period and payments are based on foregone opportunity costs or on the value of carbon market prices (Schmidt and Scholz, 2008). Further discussions on REDD in subsequent COPs led to the recognition of the role of conservation, sustainable management of forests and enhancement of forest carbon stocks, which became the “plus” components in ‘REDD-plus’. It was further highlighted that REDD-plus offers not only financial benefits but also co-benefits such as biodiversity conservation, improving livelihoods, implementing good governance, and enabling adaptation to the impacts of climate change.
In the COP-13 held in Bali, developing countries are encouraged to “explore a range of actions, identify options and undertake efforts, including demonstration activities, to address the drivers of deforestation relevant to their national circumstances, with a view to reducing emissions from deforestation and forest degradation and thus enhancing forest carbon stocks due to sustainable management of forests” (UNFCCC, 2008). The need for all parties to take actions to address drivers of deforestation was reiterated in COP 16 (Decision 1, paragraph 68) where developing countries are requested to address drivers of deforestation and forest degradation when developing and implementing their national strategies and action plans (paragraph 72) (UNFCCC, 2010). However, specific REDD-plus interventions can only be identified based on a closer analysis of the drivers of deforestation and forest degradation and the underlying causes occurring in the specific country or locality. Therefore, COP-16 at Cancun requested the UNFCCC Subsidiary Body for Scientific and Technological Advice to “Identify land use, land-use change and forestry activities in developing countries, in particular those that are linked to the drivers of deforestation and forest degradation, identify the associated methodological issues to estimate emissions and removals resulting from these activities, and assess the potential contribution of these activities to the mitigation of climate change” (FCCC / CP / 2010 / 7 / Add.1).
ANd ForesT degrAdATIoN

12 Analysis of Key Drivers of Deforestation and Forest Degradation in the Philippines
Actions to address drivers of deforestation and forest degradation led to discussions on what these terms mean in the context of climate change mitigation and adaptation strategies but no agreements have been reached on a single definition for all. The REALU (Reducing Emissions from All Land Uses) Reports of Hoang et al. (2010) and Van Noordwijk and Minang (2009) sum up the definitions based on those from UNFCCC and FAO (Food and Agriculture Organization). Forest pertains to “woody vegetation that meets objectively verifiable characteristics of current tree crown cover over minimum areas, or an inferred intention of reaching such minimum standards on “temporarily unstocked” lands and absence of agricultural or urban management targets.” In the forest definition agreed on by UNFCCC in the context of the Kyoto Protocol, forest refers to country-specific choice of a threshold canopy cover (any value between 10 and 30%) and tree height (any value between 2 and 5m), with a minimum area of 0.5 ha. In addition, the [FAO] has excluded woody vegetation on land where ‘agriculture’ is a dominant use, creating ranges of interpretation where ‘tree crops’ are involved that provide domesticated ‘non-timber forest products’, as opposed to ‘timber’ in fastwood plantations.”
The Philippine National REDD-plus Strategy (2010) defines forest as “land with an area of more than 0.5 hectare and tree crown cover (or equivalent stocking level) of more than 10 percent. The trees should be able to reach a minimum height of 5 meters at maturity in situ. It consists either of closed forest formations where trees of various storeys and undergrowth cover a high proportion of the ground or open forest formations with a continuous vegetation cover in which tree crown cover exceeds 10 percent. Young natural stands and all plantations established for forestry purposes, which have yet to reach a crown density of more than 10 percent or tree height of 5 meters are included under forest. These are normally forming part of the forest area, which are temporarily unstocked as a result of human intervention or natural causes but which are expected to revert to forest. It includes forest nurseries and seed orchards that constitute an integral part of the forest; forest roads, cleared tracts, firebreaks and other small open areas; forest within protected areas; windbreaks and shelter belts of trees with an area of more than 0.5 hectare and width of more than 20 meter; plantations primarily used for forestry purposes, including rubber wood plantations. It also includes bamboo, palm and fern formations (except coconut and oil palm).” This definition, formally adopted in DENR Memorandum Circular 2005-005 and NSCB Resolution No. 12 Series of 2004, is based on the FAO’s (2000) forest definition.
Deforestation is defined under the Kyoto Protocol as “the direct human-induced conversion of forested land to non-forested land”. FAO (2001) defines deforestation as “the conversion of forest to another land-use or the long-term reduction of the tree canopy cover below the minimum 10 percent threshold”. According to Schoene et al. (2007), deforestation “includes areas of forest converted to agriculture, pasture, water reservoirs and urban areas” but it excludes areas where trees are harvested through logging and where the “forest is expected to regenerate naturally or with the aid of silvicultural measures”. Deforestation also includes areas where the “impact of disturbance, over-utilization or changing environmental conditions affects the forest to an extent that it cannot sustain a tree cover above the 10% threshold.”
Meanwhile, forest degradation refers to “changes within the forest, whether natural or human-induced, that negatively affect the structure or function of the stand or site, and thereby lower the capacity of the resulting degraded forest to supply products and / or services” (FAO, 2006). While the Intergovernmental Panel on Climate Change (IPCC, 2003) has no specific definition for forest degradation, it is described as the “direct, human-induced, long-term loss (persisting for X years or more) of at least Y % of forest carbon stocks [and forest values] since time T and not qualifying as deforestation”. Schoene et al. (2007) clarify that forest degradation occurs mainly from “human activities such as overgrazing, overexploitation (for fuelwood or timber), repeated fires, or due to attacks by insects, diseases, plant parasites or other natural sources such as cyclones.” Degradation, “in most cases, does not show as a decrease in the area of woody vegetation but rather as a gradual reduction of biomass, changes in species composition and soil degradation. Unsustainable logging practices can contribute to degradation if the extraction of mature trees is not accompanied with their regeneration or if the use of heavy machinery causes soil compaction or loss of productive forest area.” Forest degradation may lead to deforestation but may not always be a precursor of deforestation (Sanz, 2007).
Among the literature on drivers and underlying causes of deforestation, Geist and Lambin’s (2001) meta-analysis of 152 sub-national case studies in three tropical regions (Africa, Latin America, Asia) gives a systematic analysis of the proximate causes and driving forces of deforestation in tropical countries. A
13Analysis of Key Drivers of Deforestation and Forest Degradation in the Philippines Analysis of Key Drivers of Deforestation and Forest Degradation in the Philippines
diagram of the proximate and underlying causes of tropical deforestation is shown in Figure 2.
According to Geist and Lambin, “proximate causes are human activities or immediate actions at the local level that originate from intended land use and directly impact forest cover.” Driving forces, on the other hand, are “fundamental social processes that underpin the proximate causes, and that operate at much broader scales.”3 Their analysis showed that “tropical forest decline is determined by different combinations of various proximate causes and underlying driving forces in varying geographical and historical contexts.” The study revealed differences and commonalities found among tropical countries in the continents of Asia, Latin America, and Africa in the case studies covering the period 1880s to 1990s. The proximate causes are limited to three major categories of activities: wood extraction, agricultural expansion, and infrastructure extension.
The underlying causes are grouped into: demographic, economic, technological, policy and institutional, cultural factors, and other factors (pre-disposing environmental characteristics, biophysical factors, social trigger events). Demographic factors such as increasing population could lead to increased demand for food and in turn cause the clearing of more land for subsistence farming or agricultural expansion (Grainger, 1993).
Economic factors include wealth, market structures and market variables, and commercialization of agricultural, forest and other products (Geist and Lambin, 2001; Kaimowitz and Angelsen, 1999). Economic development is a principal factor where wealth is inversely linked to deforestation. Less employment opportunities are offered in less developed economies so that people are forced to convert forested lands while in wealthier nations, clearing forestlands become less attractive so that forest cover usually increases (Ewers, 2006). Market structures and market variables such as rising demand and price for agricultural products coupled with lower prices for inputs could trigger agricultural expansion. Poverty, lack of off-farm employment, and less income opportunities lead farmers and landless people to clear forestlands for subsistence farming (UNFCCC, 2006). Technological factors include technologies that increase profitability of agricultural extension and could lead to deforestation.
Cultural factors relating to the public in general include lack of social concern with deforestation, lack of spiritual values toward forest ecosystems, low education and public awareness on the consequences of forest cover loss, indifference to the wellbeing of future generations. Individual or household behaviours stem from moral values affecting one’s decision to clear land, lack of concern for environmental services from forests, and continuing inherited practices such as burning to clear land (Geist and Lambin, 2001).
Policies and institutions directly or indirectly promote economic activities that lead to deforestation. The negative effects of public policies have been demonstrated by the undervalued benefits of forests (limited to wood); by ignoring the environmental costs of exploiting forests; by development planners allowing exploitation of forests with little scientific information; and by national governments not investing enough resources to properly manage forest resources (Repetto and Gillis, 1988). Policies outside the forestry sector (currency devaluation making agriculture profitable; gasoline and transport subsidies that facilitate timber harvesting and land development in remote areas; programs on resettlement and colonization based on agricultural expansion; lack of family planning policies) that disregard the social, economic and environmental costs of deforestation. Institutional weakness and corruption lead to poor governance and limited enforcement. Poorly defined property rights and land tenure also promote deforestation (UNFCCC, 2006).
Geist and Lambin’s study also presents patterns of causality or inter-linkages including chain-logical connections as well as variations of results in terms of forest type, spatial pattern and process at work, deforestation rate, poverty- versus capital-driven deforestation, among other things. The report recognized deforestation processes (agricultural by subsistence farmers, wood extraction by local users and logging companies, infrastructure expansion through roadside clearing and river-bound colonization) and categorized spatial deforestation patterns in terms of geometric (large-scale clearings), corridor (roadside colonization), fishbone (planned and unplanned settlements), diffuse (smallholder, subsistence agriculture), patchy (high population density areas with residual forests) and island patterns.
3 In the international debate, Geist and Lambin’s “causes” are considered “drivers” and their “driving forces” are addressed as “underlying causes”.

14 Analysis of Key Drivers of Deforestation and Forest Degradation in the Philippines
Figure 2. Proximate causes and underlying forces of tropical deforestation (from
geist and Lambin, 2001, LuCC report)
INFrAsTruCTure eXTeNsIoN
• Transport
(roads, railroads, etc.)• M
arkets
(public & private,
e.g. saw
mills)
• Settlements
(rural &
urban)• Public Service
(water lines, electrical
grids, sanitation, inc.)
• Private Com
pany
(hydropower, m
ining, oil
exploration)
ProXIMATe CAuses
uNderLyINg CAuses
PoLICy & INsTITuTIoNAL FACTors
• Formal Policies
(e.g. on econom
ic
development, credit)
• Policty Clim
ate
(e.g. corruption,
mism
anagement)
• Properly Rights
(e.g. land races, titling)
TeChNoLogICAL FACTors
• Agro-technical C
hange
(e.g. in / extensification)• A
pplications in the wood
sector
(e.g. m
ainly wastage)
• Agricultural production
factors
eCoNoMIC FACTors
• Market G
rowth &
C
omm
ercialization• E
conomic Structures
• Urbanization &
Industrialization
• Special Variables
(e.g. price increases,
comparative cost
advantage)
deMogrAPhIC FACTors
• Natural Increm
ent
(fertility, mortality)
• Migration
(in / out m
igration)• Population D
ensity• Population D
istribution• Life C
ycle features
wood eXTrACTIoN
• Com
mercial
(State-run, private
grow
th coalition, etc.)• Fuelw
ood
(mainly dom
estic
usage)• Polew
ood
(mainly dom
estic
usage)• C
harcoal production
(domestic &
industrial
uses)
CuLTurAL FACTors
• Public Attitudes, Values
& Beliefs
(e.g. unconcern about
forest, frontier m
entality)• Individual &
Household
Behaviour
(e.g. unconcern about
forests, rent-seeking,
im
itation)
oTher FACTors
• Pre-disposing
environmental factors
(land characteristics, e.g.
soil quality, topography,
forest fragm
entation, etc.)• Biophysical drivers
(triggers, e.g. fires,
droughts, floods, pests)• Social Trigger E
vents
(e.g. war, revolution,
social disorder, abrupt displacem
ents, economic
shocks, abrupt policy shifts)
AgrICuLTurAL eXPANsIoN
• Permanent C
ultivation
(large-scale vs.
smallholder, subsistence
vs. com
mercial)
• Shifting Cultivation
(slash &
burn vs.
traditional swidden)
• Cattle Ranching
(large-scale vs.
sm
allholder)• C
olonization
(incl. transmigration &
resettlem
ent projects)

15Analysis of Key Drivers of Deforestation and Forest Degradation in the Philippines Analysis of Key Drivers of Deforestation and Forest Degradation in the Philippines
At the regional and global level, initiatives to identify major underlying causes of deforestation and forest degradation were undertaken in 1998 under the Intergovernmental Forum on Forests (IFF) of the UN Commission on Sustainable Development. They held various workshops in the different regions culminating in a global workshop in 1999 (Verolme and Moussa, 1999). The Asian workshops identified the underlying causes of deforestation and forest degradation in the region as follows: Socio-demographic-
• Lack of recognition of real value and integral role of forests in maintaining life support systems
cultural: • Population growth, migration and the poverty created by deficient land and resource allocation system as well as lack of alternative livelihoods forces rural communities to clear forests and practice unsustainable agriculture for subsistence and for income-generation
• Lack of appropriate knowledge of forest biodiversity and ecosystem management and an inadequate understanding of indigenous knowledge among forest policy implementers
Economic: • Consumerism and growth leading to high demand for natural resources including timber
Policy: • Governmental policies have created subsidies and other perverse incentives and with lack of proper forest and land use policies and control measures, the intrinsic value of forests was superseded by mining, agriculture, transportation, dams, etc.
• Land and land resource allocation systems concentrated under the domain of a few and block the access of indigenous and local peoples to their territories and resources
• International financial and aid institutions and private capital investors, through their role in structural adjustment programs, contribute to policies that lead to deforestation and forest degradation
Governance: • Corrupt political and government systems including lack of decentralization, participation and transparency in government decision-making lead to arbitrary decisions on natural resources management
The Asian workshop participants forwarded some recommendations to address the above-mentioned underlying causes (Verolme and Moussa, 1999). These are categorized into: market forces (consumer awareness education, sustainable agriculture, rationalization of industrial practices, sustainable forest management, etc.); economic policies (eliminate inappropriate subsidies, assess export credits, support community-based economies, etc.); legal measures (enact laws recognizing rights of local communities in forest management; effective enforcement of legal measures to prevent corruption, etc.); institutional (participation and transparency in forest land use, management and decision making, institutional strengthening, decentralize forest governance, etc.); policy (eliminate contradictory policies, national forest policy to define forest estates and land use, effectively implement national forest policies, etc.); and social (land reform, building environmental awareness and of forest functions, provide technical and financial support to local communities for forest management, etc.).
More recently and in response to the call for action to address the underlying causes of deforestation and forest degradation, the Global Forest Coalition (GFC) held 22 national workshops with participants (indigenous peoples organizations, local communities, civil society organizations, government and academia) from 24 countries all over the world. The resulting GFC Report (2010) identified underlying causes among which are: excessive demand for wood; demand for land for plantations (particularly agro-fuel and wood-based bio-energy) and other forms of agriculture and disputes on land and forest ownership and rights; development of infrastructure and mining, and urbanization and industrialization; governments’ failure to develop and implement proper forest policies; entrenched corruption; lack of alternative economic opportunities; climate change; and neo-liberal economic policies and trade liberalization.
The GFC (2010) report concludes that the most effective measures to stop deforestation and forest degradation and promote forest conservation are: reducing demand for wood; reducing demand for land; supporting cultural values, indigenous territories and community conserved areas; redirecting financial

16 Analysis of Key Drivers of Deforestation and Forest Degradation in the Philippines
investments; addressing lack of political will and capacity, curbing corruption; integrating forest and poverty reduction; halting climate change; and changing the system where international financial institutions invest more in profitable forest-destroying industries rather than in forest conservation. Strategies to address deforestation and forest degradation and promoting forest conservation “require approaches that build on the rights, needs and cultural value systems of indigenous peoples and local communities.”
In 2011, the Union of Concerned Scientists (UCS) published a report on “The Root of the Problem: What’s Driving Tropical Deforestation Today?” The report focuses on the economic agents of deforestation such as soybeans, beef cattle, palm oil, timber and pulp, wood for fuel, and small farmers. Key underlying factors examined are population and diet that drive the demand for tropical commodities causing deforestation. The report highlights that palm oil plantations are expanding in Southeast Asia although concentrated in Indonesia and Malaysia and there are complex interactions between logging and palm oil plantations. Logging of many commercially valuable tree species in Southeast Asia can be an important cause of forest degradation but it can also lead to deforestation. The report also finds that although firewood collection is generally not causing significant forest loss, commercial charcoal production can be an important driver of degradation and eventual deforestation. Likewise, small-scale farming and traditional shifting cultivation in Southeast Asia has diminished over time. The report further concludes that there has been considerable decline in tropical deforestation mentioning the gains in both Brazil and Indonesia through their REDD-plus supported programs (Boucher et al., 2011).
Within Southeast Asia Wertz-Kanounnikoff and Kongphan-Apirak (2008) reviewed some drivers of land use change and how payments for environmental services (PES) can affect them. The authors contend that “deforestation occurs because non-forest uses are more profitable than forest uses.” The review shows that agricultural expansion and logging are the key drivers of deforestation in the region while “public policies, international market demand, and governance weaknesses are reported as important underlying causes of deforestation.” Table 3 lists the key drivers and underlying causes in Southeast Asian countries taken from various sources cited in Wertz-Kanounnikoff and Kongphan-Apirak (2008). Interestingly, the key drivers of deforestation in the Philippines listed in the study are logging, both legal and illegal, and the underlying causes are population pressure and economic factors.
Table 3. key drivers and underlying causes in southeast Asian countries, 1990-2008
Country key drivers underlying causes
Cambodia Shifting cultivationWood extraction (illegal logging, fuelwood, timber production)
Demographic factors (population pressure and poverty)Institutional factors (weak governance and corruption)
Indonesia Wood extraction (illegal logging, industrial timber plantation)Agricultural expansion (oil palm cultivation, small scale rubber plantations)
Public policy and institutional factors (weak institutions, corruption)International demand from palm oil, other cash crops and timberPoverty
Laos Wood extraction (logging, shifting cultivation)
Economic factorsDemographic factors (population pressure and urban expansion)
Malaysia Agricultural expansion (oil palm and other cash crops, shifting cultivation)LoggingInfrastructure extension (settlements)
Institutional factors (weak governance)International demand for palm oil and other cash crops
Myanmar Agricultural expansion (oil palm)Wood extraction: fuelwood, logging
Demographic factors (population pressure and distribution)International demand for timber
Papua New Guinea
Agricultural expansionLoggingInfrastructure development (logging roads)Mining industry (copper)
Institutional factors (corruption for logging concessions)Demographic factorsPovertyInternational demand for timber
Philippines LoggingIllegal logging
Population pressureEconomic factors (national development)
Thailand Illegal loggingInfrastructure extension (private company, settlement)
Economic factors
Vietnam Agricultural expansionSubsistence farmingMining and shifting cultivation
Economic factorsPoverty
Source: Wertz-Kanounnikoff and Kongphan-Apirak, 2008
17Analysis of Key Drivers of Deforestation and Forest Degradation in the Philippines Analysis of Key Drivers of Deforestation and Forest Degradation in the Philippines
In Vietnam, the proximate drivers are agricultural expansion (conversion of forest land to industrial plantations, conversion of mangrove forest to shrimp farming, shifting cultivation); wood extraction (commercial logging, overharvesting, illegal logging, fuelwood collection), infrastructure development (hydropower projects, development of road network) and other factors (agent orange, forest fires). The underlying causes include: demographic factors (high population density and migration), economic factors (economic development and market growth, urbanization / industrialization, poverty), policy and institutional factors (government support to forest land conversion, corruption and mismanagement, property rights), and others (cultural factor: forest as common resource pool; lack of financial and technical capacity of forestry sector) (Gupta, nd).

18 Analysis of Key Drivers of Deforestation and Forest Degradation in the Philippines

19Analysis of Key Drivers of Deforestation and Forest Degradation in the Philippines Analysis of Key Drivers of Deforestation and Forest Degradation in the Philippines
The CAse oF The PhILIPPINes
Deforestation in the Philippines
Before the Spanish colonization of the country, at least 92 percent of the Philippines was covered by rain forest. Based on records gathered by Revised Master Plan for Forest Development (RMPFD, 2003), the country then had an estimated 27.5 million ha of forest cover (Table 4).
Table 4. Philippine historical forest cover, all forest types (1575-2005)
yearForest Cover (million ha)
% of Total Area
1575 27.5 91.67
1863 20.9 69.67
1920 18.9 63.00
1934 17.8 59.33
1970 10.9 36.33
1980 7.4 24.67
1990 6.7 22.33
2005 7.2 24.00Source: RMPFD, 2003 (Note: 2005 data based on PFS, 2011)
When the Spanish arrived in the 16th century, many scattered coastal areas had already been cleared for agriculture and villages. By 1600, the human population of the Philippines probably numbered about 200,000. There was a steady increase in Philippine population that in 1900, around 7.6 million people inhabited the Islands (Table 5). At present, it is estimated the Philippine population is well within the vicinity of 100 million.
Table 5. estimated population of the Philippines, various years
year Population
1591 166,712
1799 1,502,674
1887 6,984,727
1898 7,832,719
1903 7,635,428
1941 16,000,328
1960 27,087,685
1970 36,684,948
1980 48,098,460
1990 60,703,206
2000 76,504,077
2010 97,976,603Source: Wikipedia: Demographics of the Philippines
After the Spanish colonial rule, lush rainforest still covered about 68 percent of the Philippines. The rate of deforestation was varied among the islands during the Spanish colonial rule. Cebu experienced rapid deforestation. As early as 1916, the need for reforestation was already felt in the province, thus, the establishment of the first reforestation project. Other islands such as Negros and Iloilo were also badly deforested as these areas became the object of agricultural expansion by elite and rich families. The neighboring islands of Bohol and Panay had less than half of their original forest by this time. Much of the fertile lowland plains of Luzon had been cleared for rice cultivation. However, much of the highland rainforest remained intact such as those found in Mindoro and Palawan islands. Mindanao’s forest was largely left untouched because of the aggressive independence of the Moro people. The colonial rule of Spain in the country saw the commercial potential of forests, particularly to support the galleon trade and keeping the Spanish navy supplied with timber.
During the American Colonial rule, the US Congress enacted the first Forest Act in 1904 (Chandrasekhran, 2003). This was to form the basis of forestry legislation in the Philippines until 1975. The Bureau of Forestry was also established during this period. The Americans introduced the first modern logging operations in
20 Analysis of Key Drivers of Deforestation and Forest Degradation in the Philippines
1904 when the Insular Lumber Company was granted a 20-year renewable concession to log approximately 300 km² of rich Dipterocarp forest in Northern Negros in the Visayas (Roth, 1983 as cited by Pulhin et. al., 2006). By 1940, 163 sawmill and logging companies were operating nationwide.
Meanwhile, conversion of forest areas into farmlands was ongoing. Although, records of forestland cultivation existed even during the Spanish times, large scale conversion happened in the late 70s and 80s. There were also deliberate programs at that time to clear forest areas for agriculture and human habitation. The government then had a policy of allowing forest conversion into settlements and agricultural areas to be given to poor and landless farmers. This policy traces its roots from early 1900 when the American Congress passed the Public Land Act (1902), the Friar Lands Act (1903), and the Rice Share Tenancy Act (1933). These laws provided for land entitlements and extended the possibility of landless tenants gaining title to land. Many forest areas in Mindanao and Palawan were converted to non-forest uses through these laws. Likewise, in the early 1950s, the Government launched a nationwide land classification program that classified many forested lands as more suited to agriculture and other non-forestry uses based on the criterion of slope (18 percent and above classified as forestlands). Many forested areas then were converted to agricultural farms, settlements, townships, and other uses.
The post-war period started with Philippine independence (1946) and lasted until the late 1980s. The government then saw the need to rebuild the country and develop its economy through forest industries. The country had already adopted the Regalian Doctrine as provided in the 1935 Constitution that all timber lands belong to the state. Forest policy did not change much, but greater emphasis was placed on the production of timber. This meant more revenues for the state, hence, generation of much needed government income to accelerate development. This period also saw the change to modern mechanized technology and hence the ability of the forest industry to have a major impact on the forest over a large area. Also introduced was the application of selective logging of the Dipterocarp forests. This period was the peak of exploitation of Philippine forests starting in the early 1960s. In the 1970s, there were around 400 business entities directly involved in exploiting the forests either through leases, permits, license agreements or just written authority from the President to harvest timber. This has provided substantial employment opportunities for many of our countrymen. Add to this the many downstream businesses created by the logging industry.
However, harvests from the forest rose rapidly with little concern for long term sustainability of this resource. This was aggravated by lack of management and protection of logged areas. The impetus for this “rush to destruction” came from three sources. The large multi-national logging companies were able to make enormous profits capturing most of the forest rents from the continued growth of harvesting volumes, often in association with local business people and the government. The government also took pride in the ever-increasing harvest which meant more foreign exchange and increased revenues. By 1969, forest products constituted 33 percent of total export revenues, whereby 80 percent of the recorded log production was exported as logs (Chandrasekharan, 2003). The international forestry community warned the government of serious resource loss and ecological damages if there was no significant change in this forest management policy. Ironically, the revenues generated from forest harvesting were not used to restore the integrity of the forest resources and to scientifically manage them. There were policies towards integration of forestry businesses that greatly benefited the larger and powerful businessmen but never ensured the integrity of forest production systems or the long-term built-up of sustainable forest industries.
Deforestation further worsened during the Marcos regime. The logging industry was on a rampage with Timber Licensing Agreements (TLAs) and other timber permit holders controlling over 10 million ha of forests. From 1965 to 1986, the Philippines lost 7 million ha of forests (Pamintuan, 2011). This came as a result of so many people given access to previously inaccessible areas due to logging roads and lure of employment in the logging companies. When the licensees stopped operations, many people employed by the companies together with their families stayed in these areas to earn a living. In an FDC study (1986) on the status of cancelled and expired TLAs conducted with PCARRD-DOST funding, the research team found that 27 out of 32 cancelled / expired TLAs surveyed had their forest areas significantly destroyed due to the cultivation of these areas by displaced workers as well as the entry of adjacent local community members after the TLA holders left. Incidentally, these people were also victims of poverty perpetuated by economic woes that the country continues to experience today.

21Analysis of Key Drivers of Deforestation and Forest Degradation in the Philippines Analysis of Key Drivers of Deforestation and Forest Degradation in the Philippines
For the Philippines, the rapidly expanding population has direct relations to the loss of forests as shown in Figure 3 below.
Figure 3. historical population and forest cover in the Philippines
The country’s forest resources continuously declined through the years due to a number of inadequate and poorly-implemented forest policies which led to the rapid exploitation of timber from old growth and residual forests as well as other non-timber forest resources. The proliferation of short duration timber licenses in the past discouraged long term investments in forest development and dampened private sectors’ initiatives in contributing to forest recovery (RMPFD, 2003). Forest rehabilitation through natural and artificial means as initiated by various sectors never coped up with the rate of forest destruction.
According to Kummer (1992), the main causes of deforestation and land degradation after World War II include intensive logging (both legal and illegal) and agricultural expansion (partly linked to upland migration). Commercial logging started the process by opening up the forests and providing access roads for agricultural expansion. Cruz et al. (1986) traced the underlying causes to structural forces such as (a) the elite’s control of wealth in the lowlands and uplands, and large-scale exploitation of forest resources for private gain, and (b) inequitable access to land and assets for the majority, high population growth, and lack of urban job creation leading to poverty, migration and dependence on forests and uplands.
In 2011, the official forestry statistics showed that the country had only around 7.2 million ha of forests. The Philippines lost around 10 million ha of its forests over the last seven decades, placing the country among those with the highest deforestation rates in the world. The magnitude of such destruction is now being felt adversely in many areas. Mountain slips, landslides, flash floods, and massive soil erosion are now a common phenomenon in the country. These calamities continue to occur resulting to untold miseries and sufferings to the people. These calamities are further aggravated by pervasive poverty of people in the countryside, people that continue to depend on the fragile uplands which they themselves continue to destroy to eke a living, thus, perpetuating the never-ending cycle of poverty and environmental degradation.
One of the oldest forestry maps (1934) at the UPLB College of Forestry and Natural Resources library shows that the country then had around 17 million ha of forested forest lands (Table 6). The latest forestry statistics (2011) released by the Forest Management Bureau (FMB) shows that the country has 7.2 million ha of remaining forests including those in alienable and disposable lands. This is a dramatic rise from recorded forest area in 1997 which had 5.392 million ha. However, this increase is mainly due to a change in the forest definition from earlier 40% crown cover to 10% crown cover in 2011, which resulted in inclusion of those areas which were not defined forests before. Therefore, the 2003 data are not comparable with those of earlier years. Table 8 shows the depletion trend of forest areas in the country.
90
80
70
60
50
40
30
20
10
0 1575 1863 1920 1934 1970 1980 1990 2005
y e A r
ForesT Cover (mil ha)
esTIMATed PoPuLATIoN (Mil.)

22 Analysis of Key Drivers of Deforestation and Forest Degradation in the Philippines
Table 6. National land use accounts, in ‘000 ha (1935-2003)
National Land use Accounts 1935 / a 1970 / b 1975 1980 / c 1984 / c 1992 1997 2003 / d
Total land area 29,629 30,000 30,000 30,000 30,000 30,000 30,000 30,000
Forest 16,968 9,878 9,410 7,402 6,621 5,900 5,392 7,159
Dipterocarp 13,254 8,281 7,863 5,820 5,056 3,937 3,536 3,446
Old growth 10,731 4,789 3,982 2,443 1,681 847 805 771
Residual 2,523 3,492 3,880 3,377 3,375 3,132 2,731 2,675
Pine 525 267 202 248 241 234 228 201
Closed 525 nda nda 135 131 127 124 nda
Open nda nda nda 114 110 107 104 nda
Mossy 2,576 1,092 1,092 1,092 1,092 1,092 1,040 1,040
Mangrove 613 238 254 242 232 126 112 249
other Forests e 1,596
Brushland / grassland / submarginal
5,543 3,738 3,398 3,212 2,888 2,900 2,707 3,876
Inland waters / marshlands 298 132 132 115 106 298 298 298
Forest Plantations nda 78 96 319 465 587 676 627
Upland agriculture & settlements, traditional agroforestry, others / f
nda 3,674 4,264 5,683 6,068 6,708 7,256 4,819
Forestlands 22,511 17,500 17,300 16,731 16,148 15,882 15,855 15,855
Other land use / g 7,118 12,500 12,700 13,269 13,852 14,118 14,145 14,145Sources: Philippine Forestry Statistics (various years)
a – Based on Bureau of Forestry Map, 1934, with assumed value on inland waters & 0 record for kaingin; b – Mostly based on PFS, with old-growth Dipterocarp and Pine forests based on ENRAP 4 computations; c – From PFS with values on Dipterocarp and Pine forests computed from NRAP 1; d – Based on National Forest Resources Assessment results by DENR between 2003-2005; e – ‘Other forests’ is a new entry in the National Forest Resources Assessment results by DENR between 2003-2005; f – Values from 1970-1997 were computed based on data from other land uses; g – Included lowland agricultural areas, built-up areas, etc.; nda – no data available
In a study by Carandang (2008) that examined deforestation, the country’s forestry history was divided into three major periods: (1) when logging was already mechanized but was disrupted by war (1935–1970), (2) when there was logging boom and later decline in number of forest active concession in later years (1971–1991), and (3) when many bans on logging, log and lumber exports were implemented (1992-2003). It is interesting to note that the period with greatest depletion happened during the first period, when logging was just starting as a small industry and the number of sawmills was less than 50. However, during the mid-1960s, logging began as a major backbone of the country’s economy. There were however, no forest inventory records available during this period to analyze the rates of forest loss, hence the lumping of the 1935 to 1970 period as one major significant era.
The rate of deforestation during this 36-year period was 203,000 ha per year (Table 7). One plausible explanation for this is that during and immediately after the war, many displaced farmers ventured to go into the uplands and started opening up the forests for agricultural production. This has been observed in Mount Makiling in Laguna when most of the occupants traced their families going up to the forests during this period. The government then had a policy of allowing forest conversion into settlements and agricultural areas to be given to poor and landless farmers. This policy traces its root from early 1900 when the American Congress passed the Public Land Act (1902), the Friar Lands Act (1903), and the Rice Share Tenancy Act (1933). Each of these laws provided for land entitlements and extended the possibility of landless tenants gaining title to land (Henderson, 2002). The object of these laws was private landholdings but was later expanded to include public lands. Many forest areas in Mindanao and Palawan were converted to non-forest areas through this process.
The logging boom period actually began a little later and ended in the mid-1980s, but for purposes of deforestation rate analysis in conjunction with some policy reforms in the early 1990s (as a consequence of the Earth Summit in 1992 and crafting of Philippine Agenda 21), the period included years between 1971–1992. During this period, the rate of forest depletion was also high at 181,000 ha annually. This happened when the number of logging concessions, both under short- and long-term leases and permits, rose to over 200 in number (total for the period, not necessarily operating at the same time) practically covering over

23Analysis of Key Drivers of Deforestation and Forest Degradation in the Philippines Analysis of Key Drivers of Deforestation and Forest Degradation in the Philippines
10 million ha of forest lands. More and more people occupied the forests during this period. As logging concessions came and went, many of their displaced workers opted to stay in these areas to eke out some livelihood by opening up second growth forest areas for farming purposes. This move was logical to them as they can no longer seek employment in other areas and the opportunities of possessing public lands by virtue of occupation and farming were present.
Beginning the early 1990s, much of the glitter of the logging industry was gone. The government became stricter in the disposition of public forest areas. This was the period when logging in old-growth forest was banned that also prohibits logging in all protected areas (RA 7586 or NIPAS ACT of 1991), and when export of logs from natural forests and ordinary lumber was also banned (DAO No. 5, 1990) and where only kiln-dried S4S (surfaced four sides) lumber can be exported. Based on forest conversion estimates by Carandang (2008), the country lost around 9.8 mil ha of forest between 1935 to 2003 for an annual average of 144,200 ha (Table 7). About half of these (4.82 mil ha) is attributed to increase in upland agriculture and settlements.
Table 7. Forest conversion estimates, ‘000 ha
Forest TypeTotal Area
in 1935Total Conversions by Period Annual Conversion ToTAL
1935-1970 1971-1991 1992-2003 1935-1970 1971-1991 1992-2003 Conversion Annual
Forest 16,968.0 7,090.2 3,977.6 (1,259.1) 202.6 180.8 (114.5) 9,808.7 144.2
dipterocarp 13,254.0 4,972.7 4,344.5 (1,732.4) 142.1 197.5 (157.5) 7,584.8 111.5
- Old growth 10,731.0 5,942.0 3,942.0 76.4 169.8 179.2 6.9 9,960.4 146.5
- Residual 2,523.0 (969.3) 360.4 396.9 (27.7) 16.4 36.1 (212.0) (3.1)
Pine 525.0 258.2 32.9 33.1 7.4 1.5 3.0 324.2 4.8
- Closed 525.0 525.0 (127.0) 127.0 15.0 (5.8) 11.5 525.0 7.7
- Open nda - (106.9) 106.9 - (4.9) 9.7 -
Mossy 2,576.0 1,484.5 - 51.2 42.4 - 4.7 1,535.7 22.6
Mangrove 613.0 374.8 111.9 (122.6) 10.7 5.1 (11.1) 364.1 5.4
Brushland / Grassland / Submarginal
5,543.0 1,804.9 837.7 (975.8) 51.6 38.1 (88.7) 1,666.8 24.5
Inland Waters / Marsh 298.0 166.9 (166.9) - 4.8 (7.6) - - -
Forest Plantations nda (78.2) (508.9) 262.6 (2.2) (23.1) 23.9
Upland Agriculture & Settlements, Traditional
nda (3,674.4) (3,033.4) 1,888.2 (105.0) (137.9) 171.7 (4,819.5) (70.9)
Source: Carandang, 2008Note: Those numbers in (parenthesis) are actually area additions.
An analysis of the regional pattern of forest cover change in Southeast Asia (Stibig et al., 2007) shows that forest conversion by small-holder agriculture is still taking place in the higher mountain forests (Cordillera region) of the Philippines. The encroachment into the mostly secondary forests of the country is said to be driven by population increase and unfavourable socio-economic and living conditions of farmers. Concession logging (at the time the report was written) is also still considered as a driver of forest loss in Mindanao (Surigao, Agusan, Bukidnon), usually followed by encroachment by shifting cultivators and small holder farming. The report claims that illegal logging is an ongoing concern in the degraded secondary forests of Quezon (Sierra Madre Mountains), Palawan and Eastern Samar provinces. The findings confirm that existing forest cover change patterns remain a threat to the forest and forest ecosystem particularly on sustainability and biodiversity conservation.
Climate Change and REDD-Plus Initiatives in the Philippines
As a non-Annex 1 country with remaining natural tropical forests, the Philippines has embarked on REDD-plus readiness activities. One of the initiatives is the formulation in 2009-2010 of the Philippine National REDD-plus Strategy (PNRPS) which is included in the country’s National Framework Strategy on Climate Change (NFSCC) and the National Climate Change Action Plan (NCCAP) 2011-2028 which was approved by the Climate Change Commission chaired by the President on 22 November 2011. The PNRPS thus is an integral part of the country’s climate regime.

24 Analysis of Key Drivers of Deforestation and Forest Degradation in the Philippines
The PNRPS contains seven components that serve as guidance in the implementation of REDD-plus programs and activities. The components include enabling policy; governance; resource use, allocation and management (RUAM); research and development (R&D); measurable, reportable and verifiable (MRV) conditions; capacity building and communication; and sustainable financing. One of the priorities under the R&D component is the analysis of drivers of deforestation and forest degradation. It seeks to identify both immediate and underlying causes as well as their manifestation and trends at multiple levels (regional, local and site-specific) and in different geographical areas. The analysis is expected to aid in identifying conservation interventions, determining REDD-plus feasibility, carbon monitoring approaches, and policy reforms.
The Philippines has about 7.2 million ha remaining natural forest (FMB, 2011), described mostly as remnant and non-frontier (Bryant et al., 1997). Deforestation from the 1500 to the present is estimated to have contributed 3.7 Gt CO2 to the atmosphere, with 70% of that emission occurring in the last century (Lasco, 1998; Lasco and Pulhin, 2003). The country remains a net carbon sink with the land use change and forestry (LUCF) sector sequestering over 100,000 Gg of carbon dioxide annually (Lasco and Pulhin, 2000, 2001; Pulhin and Lasco, 2009). By land cover (Table 8), secondary forests have the highest mean above ground carbon density of 207.9 tC / ha as compared to tree plantations with 59 tC / ha and grasslands with 12.1 tC / ha (Lasco et al., 2003). Table 8. Mean above ground carbon density of forestland cover in the Philippines
Land Cover Carbon (tC / ha)
Protection forests
Old growth (from IPCC default values, Houghton et al., 1997) 165-260
Mossy 183.8
Pine 90.1
Mangrove 176.8
secondary forests 207.9
brushlands 29.0
Tree plantation 59.0
Agroforestry 45.4
grasslands 12.1Source: Lasco et al., 2003
The country’s annual forest cover loss was pegged at 157,000 ha for the period 2000-2005 with estimated aggregate emissions of 0.12587 Gt CO2 (FAO, 2005). Total emissions from the land use change and forestry (LUCF) sector (Table 9) ranged from 128,620 Gg CO2 equivalent in 1990 to 100,738 Gg CO2 equivalent in 1998. Based on the greenhouse gas inventory of the Philippines, the contribution of the LUCF sector on total GHG emissions shows that from a net source in 1990, the country has become a net sink in 1998 (Lasco et al., 2009). Studies on rates of sequestration show that Philippine forests sequester around 7.1 to 27.2 Tg C per year (Lasco, 1998; Lasco and Pulhin, 1998; Lasco and Pulhin, 2000).
Table 9. Total emissions from the LuCF sector of the Philippines (gg Co2 equivalent)
source1990 Inventory (1997 us
Country studies)1990 Inventory (1998 ALgAs)
1994 Inventory (1999 Philippine Nat. Comm.)
1998 Inventory (Lasco & Pulhin, 2001)
Change in forests and biomass stocks
-48,654 2,622 -68,323 -190,522
Forest and grassland conversion
120,738 80,069 68,197 46,624
Abandonment of managed lands
-1,331 -1,331 Not determined Not determined
Net emissions 70,753 81,360 -126 -142,007
Total Philippine emissions 128,620 164,103 100,738 100,738
% of Total Philippine emissions
55.01 49.58 -0.13 -142.00
Source: Lasco et al., 2009
25Analysis of Key Drivers of Deforestation and Forest Degradation in the Philippines Analysis of Key Drivers of Deforestation and Forest Degradation in the Philippines
The impact of deforestation to carbon budgets was assessed by Lasco and Pulhin (2009) who found that from a carbon density of 518 Mg per hectare, deforestation can reduce it to 13.1 MgC / ha (estimates for grasslands) or only 2.5 percent of the original carbon in primary forests. Tree plantations in various areas of the country have carbon densities ranging from 35 Mg C / ha to 264 Mg C / ha, which are much lower than the 518 Mg / ha in natural forests. Likewise, carbon densities in various agroforestry systems are lower than in natural forests. The authors cited studies showing that Leucaena leucocephala fallow field in Cebu had mean carbon density of 16 Mg C / ha; a coconut-multi-storey system in Mount Makiling had 39 Mg C / ha; and a mature coconut plantation in Leyte contained 86 Mg C / ha in above-ground biomass.
Lasco and Pulhin also reported that reforestation species planted in Nueva Ecija were found to have carbon densities ranging from 3.47 Mg C / ha (6-year old Acacia auriculiformis and Gmelina arborea) to 48.52 Mg C / ha (13-year old Pinus kesiya). Eighty-year old plantations in Mount Makiling had carbon densities ranging from 125.61 to 285.75 Mg C / ha with highest carbon accumulation in Swietenia macrophylla (3.57 Mg / ha / year) and the least accumulation from combinations of Parashorea malaanonan and Dipterocarpus grandiflorus (1.57 Mg / ha / year). The authors found that mature plantations can approximate the carbon stocks of secondary forests (estimated at 305.5 Mg C / ha in Mount Makiling) but bringing back the original amount of carbon in forestlands can take a long time.
FAO data shows that avoiding aggregate emissions of 125.87 Mt CO2 from forest cover loss of 157,000 ha / year (2000-2005) through REDD-plus could translate to financial payments from US$377.61 to $1,258.70 million if carbon credits were traded (FAO, 2005). However, apart from the financial gains from REDD-plus payments, the co-benefits from reducing deforestation and forest degradation, conserving biodiversity, sustainably managing forests, and enhancing carbon stocks, are far more significant for the Philippines (FAO, 2010). Having lost most of its frontier forest, the country needs to enhance its forest carbon stocks and sustainably manage its remaining forest cover for it to benefit from REDD-plus. The challenge remains in addressing the drivers of forest degradation and deforestation that continue to plague the nation’s forestlands.
At the field level, there are REDD-plus demonstration sites which include the following:
1. Forest Policy and Piloting REDD measures through DENR with support from BMU / GIZ – the site is located in the five municipalities of Bontoc, Maasin, Silago, Sogod, and Tomas Oppus in the province of Southern Leyte, Leyte Island;
2. Advancing Development of Victoria-Anepahan Communities and Ecosystems through REDD (ADVANCE REDD) which is funded by the European Union Delegation (Southern Palawan) and implemented through NTFP-EP in the municipalities of Narra and Quezon in Palawan Province; and
3. Community Carbon Pools Programme (C2P2) implemented through FFI and NTFP-TF with funding from Team Energy Foundation and the EU-REDD Project – the site is in General Nakar, Quezon.
Other sites for scaling up of previous projects are those implemented by Kalahan Educational Foundation (KEF) in Nueva Vizcaya, Tebtebba in the Cordillera, and Conservation International-Philippines.


3.0 Analytical framework


29
ANALyTICAL FrAMework
The analytical framework (Figure 4) for this study follows some of the categories listed in the meta-analysis by Geist and Lambin (2001) of proximate or direct causes and underlying forces of tropical deforestation. Direct causes of deforestation and forest degradation are both planned and unplanned forest products extraction, agricultural expansion, and infrastructure expansion. The underlying causes are grouped into socio-demographic and cultural factors, economic-market and technological factors, policy-institutional-governance factors, and other factors (biophysical drivers such as floods, landslides, fires, drought). The grouping and combinations of direct drivers and underlying causes reflect the complexity of inter-relationships of said factors occurring in various areas of the country. The relative importance of the drivers of deforestation and forest degradation are determined based on perception of the respondents. The analysis concludes with a number of policy agenda and recommendations to address the drivers of deforestation and forest degradation in the country.
The underlying causes and indirect drivers of deforestation and forest degradation are further depicted through a fishbone diagram in Figure 5. The main fishbone corresponds to the planned and unplanned activities such as forest products extraction, agricultural expansion, infrastructure expansion driving deforestation and forest degradation while the secondary bones reflect the underlying forces and the smaller bones show more specific causes. Poverty and population pressure drive illegal timber and non-timber harvesting and shifting cultivation due to limited livelihood options, subsistence / cash income values associated to forest resources, and landlessness triggering expansion for settlements and farms. Market demand and economic growth find roots in the increasing domestic and international demand for wood, non-timber products, mined ores, and tourism destinations as well as infrastructure expansion for access of these industries to the market. Financing of illegal harvesting activities is practiced by traders and middlemen to ensure steady supply of raw materials needed by construction and processing industries. Policy weaknesses pertain to unstable, confusing and conflicting issuances and institutional mandates, de facto open access areas left unmanaged, and logging bans as perverse incentives for illegal activities. Governance issues refer to weak institutional capacities, poor monitoring and law enforcement, corruption and collusion, lack of political will and coordination. Further, inappropriate land uses, low farm productivity, over-extraction and unsustainable harvesting, proliferation of unmonitored chainsaws as well as recurring floods, landslides, fires, and drought are among the technological and biophysical drivers of deforestation and forest degradation.
Figure 4. Framework of Analysis for the study
UnDERlyInG CAUSES
PolICy REFoRm AGEnDA & RECommEnDATIonS
RElATIvE ImPoRTAnCE oF DRIvERS oFDEFoRESTATIon & FoREST DEGRADATIon
DIRECT DRIvERS *
Socio-Demographic & Cultural Factors
Economic market &
Technological Farctors
Policy-Institutional-Governance
Factors
Forest Products Extraction• Timber (legal, illegal)• Wood fuel - fuelwood charcoal• Non-timber
Agricultural Expansion• Shifting cultivation (slash and burn, traditional swidden)• Permanent cultivation• Plantations• Migration, resettlement
Infrastructure Expansion• Transport (road)• Market (sawmills, furniture, processing plants)• Mining, hydropower, tourism
other Factors• Biophysical drivers (floods, landslides, fire, calamities, etc.)
* Modified from Geist and Lambin (2002)

30 Analysis of Key Drivers of Deforestation and Forest Degradation in the Philippines
Figure 5. Fishbone diagram of the underlying causes of drivers of deforestation and forest degradation in the Philippines
mA
Rk
ET
DE
mA
nD
&E
Co
no
mIC
DE
vE
loPm
En
T
TE
Ch
no
loG
ICA
l &B
IoPh
ySIC
Al FA
CT
oR
Sw
EA
k Po
lICIE
S &G
ov
ER
nA
nC
E
Financing forillegal activities
DE
FoR
ESTA
TIo
n A
nD
FoR
EST
D
EG
RA
DA
TIo
nPlanned and U
nplanned Forest products extraction, A
gricultural expansion, Infrastructure expansion
Poor monitoring &
law enforcem
ent
Institutionalw
eaknessesU
nstable, confusing, conflictingforest policies &
mandates
Logging bans as perverse incentives
Open A
ccess
Lack of politicalw
ill & coordination
Corruption &
collusionProliferationof chainsaw
s
Over-extraction
& unsustainable
harvesting
fire, floods,landslides,calam
ities
Low farm
productivityInappropriate
land uses
Population pressure&
migration
Rural poverty
Value of forests as subsistence&
source of cash
Limited livelihood
options
Landlessness / farm&
settlements
expansion
Econom
icgrow
th targets
High dem
and for wood,
NTFP, ores, tourism
areas Improved
market access
Pov
ER
Ty
& Po
PUlA
TIo
nPR
ESSU
RE

Analysis of Key Drivers of Deforestation and Forest Degradation in the Philippines
4.0 key drivers of deforestationand forest degradation


33
Deforestation and forest degradation activities in this study are categorized into forest products extraction, agricultural expansion, and infrastructure expansion. Table 10 lists the direct drivers identified by the key informants interviewed by sector. About 41 percent of the key informants cited logging, whether legal, illegal or poaching, as a direct driver of deforestation and forest degradation. Around 17 percent cited kaingin making while some 13 percent mentioned that biophysical factors such as climate change, typhoons, floods, landslides are contributors to deforestation and forest degradation. About nine percent of the respondents also identified mining while another eight percent cited charcoal making as direct drivers. This trend is the same across sectors except for the indigenous peoples with almost the same number citing logging and mining as direct drivers. The various focus group discussions in the four sites gave similar results.
Table 10. List of direct drivers of deforestation and forest degradation identified by key informants by sector in the four sites
direct drivers of deforestation and forest degradation
Frequency by sectorToTAL %
deNr Lgu Po IP Traders Cso NCIP PCsd
Forest products extraction
Legal / illegal logging / poaching
26 23 138 13 12 19 7 1 239 40.58
Charcoal making 3 12 17 6 3 5 2 48 8.15
Fuelwood gathering 1 6 16 2 1 26 4.41
NTFP gathering 2 6 1 2 11 1.87
Agricultural expansion
Kaingin making 23 21 28 4 9 11 3 1 100 16.98
Conversion of forests (plantations, agroforestry, fishpond)
5 2 6 1 5 1 20 3.39
Grazing 3 1 4 0.68
Infrastructure expansion
Mining 9 9 9 12 5 1 4 1 50 8.49
Road construction 1 1 1 1 4 0.68
Hydropower dam construction 3 3 0.51
Tourism facilities 3 3 0.51
Biophysical factors
Climate change, typhoons, floods, landslides
2 4 62 2 2 1 2 75 12.73
Forest / brush fire 3 1 2 6 1.02
Total 76 82 282 47 34 46 18 4 589 100.00
A. ForesT ProduCTs eXTrACTIoN
Timber harvesting, fuelwood gathering, charcoal making, and non-timber forest products (NTFP) collection continue to contribute to deforestation and forest degradation. Historical accounts and official forestry statistics have shown that logging, both legal and illegal, have caused much of the forest loss in the country. Woodfuel production and non-timber forest products extraction for subsistence or supplementary livelihood purposes are expected to continue and if uncontrolled, will threaten any REDD-plus mechanism.
Planned or government-sanctioned extraction of timber and NTFPs (rattan, bamboo, resin, and other products) is allowed through the issuance of tenurial instruments and permits to ensure sustainability of the resources. Timber harvesting is one of the activities in the forest management plans required under the TLAs, integrated forest management agreements (IFMAs), industrial tree plantation agreements (ITPLAs),
key drIvers oF deForesTATIoNANd ForesT degrAdATIoN

34 Analysis of Key Drivers of Deforestation and Forest Degradation in the Philippines
socialized industrial forest management agreements (SIFMAs), or community-based forest management agreements (CBFMAs) among other instruments. Annual allowable cuts (AAC) for timber and non-timber products are approved by DENR to ensure sustainability of the resources. Since the issuing of EO 23 in early 2011 banning logging in natural forests, there is no more planned timber harvesting in natural forests.
Timber harvesting – legal and Illegal logging / Timber Poaching
The 2011 Philippine Forestry Statistics show a drastic drop in the number, area covered and annual allowable cut of TLAs from 1980 to 2011. From 191 TLAs covering 6.5 million ha and AAC of 13.699 million cu.m., it was down to 75 with 2.812 million ha and 4.73 million cu.m. in 1990 and further dropped to 19 with only 0.864 million ha and 0.689 million cu.m. In 2011, there were only 3 left covering an area of 177,000 ha with no allowable cut. The reverse happened for IFMAs and ITPLAs where there were only 12 covering 88,000 ha in 1980, ballooned to 184 with 548,000 ha in 2000 and slightly decreased to 146 in 2011 but the area covered increased to 1.034 million ha (Table 11). The 1987 Constitution replaced the timber licensing system to other modes of forest allocation such as production sharing, joint venture, and co-production. Other forms of tenure with harvesting rights for community organizations include the SIFMA and CBFMA. Indigenous peoples with certificates of ancestral domain claims (CADC) or titles (CADT) are given user rights over natural resources such as timber, non-timber or minerals through their ancestral domain sustainable development and protection plans (ADSDPP).
Table 11. Area of forest under timber license and management agreements in the Philippines, 1980-2011
1980 1990 2000 2011
TLA
Number 191 75 19 3
Area (ha) 6,500,000 2,812,000 864,000 177,000
AAC (cu m) 13,699,000 4,730,000 689,000 No Approved IAOP
IFMA / ITPLA
Number 12 81 184 146
Area (ha) 88,000 304,000 548,000 1,034,000
ToTAL
Number 203 156 203 149
Area (ha) 6,588,000 3,116,000 1,412,000 1,211,000Source: Philippine Forestry Statistics, 2011As recalled by the key informants and FGD participants in the four sites, commercial logging occurred from the 1950s to the 1990s, first through the TLAs and then followed by other tenurial instruments such as IFMA, SIFMA, and SLTP. It was in the late 1990s that communities were allowed to harvest forest products through their resource use permits under the community-based forest management agreements (CBFMA).
Table 12 shows some of the companies that the respondents recalled had operations in the four sites. At least 15 companies and sawmill operators were listed by the respondents in General Nakar that did logging in the area between 1950 and 2000. In Southern Leyte, five companies (ARTIMCO, Veloso Logging, MASCTICOR, Cuison, TPMC) were cited as having logged the area from the 1950s to 1980s while eight companies were listed in Palawan that operated from the 1950s to 1980s. Three companies (MATCO, Luga and Sons, Maderero de Misamic) also had logging concessions in Misamis Occidental, two of them from 1967 to 1982 while the third from 1979 to 1989. The DENR no longer has records of the logging companies in these sites.

35Analysis of Key Drivers of Deforestation and Forest Degradation in the Philippines Analysis of Key Drivers of Deforestation and Forest Degradation in the Philippines
Table 12. List of logging companies and estimated periods of operation in the four sites
general Nakar* southern Leyte** Palawan*** Misamis occidental****
Hama Logging, La Fortuna Logging and Sawmill, Tecson, Eastern Plywood (1950s-1980s)
ARTIMCO (1950s-1970s)
Veloso Logging Company (1960s)
ACME Palawan (1950s-1980s) Tinio Logging – 1960s RTG Company (1960s-1970s)Western Palawan Timber Corporation (1960s-1984)
Mt. Ampero Tor Co. (MATCO) (1967-1982)
De Dios Logging, IDI (1960s-1970s), Ravago Corporation, Guerrero (1960s-1980s)
Sitech / Gopuansoy / Green Circle Properties (1960s-2000s)
Masticor Logging Corp., Cuison Logging company (no date)
Pagdanan Timber (1970s-1990s) Palawan Lumber Corporation (PALUMCO) (1975-1978) Neri-Tavera Lumber Company (1972-1982), Palawan Apitong Corporation (1973-1983)
Luga and Sons, Inc. (1967-1982)
Don Boro Timber, Davao Timber, Infanta Timber, Qualim (1970s-1980s)
Timber Producer Marketing Corp. (TPMC) (1986-1989)
Maderero de Misamis Co., Inc. (1979-1989)
Manuel Barba, Marcon Sawmill, Pristine Logging (1980s-1990s)
Sources: *FGD and General Nakar Forest Land use Plan (FLUP), **KII, ***KII / FGD, Vitug (1983), ***FMB records
Respondents said that in the 1950s-1970s, the logging companies practiced selective logging system (SLS) where they cut only the large-diameter (>60 cm) trees and export the logs to other countries. The respondents recalled that the logging companies preferred to cut down the larger premium trees, some big enough to be contained in one truck. This was how old growth primary forests were transformed to secondary growth forests where the smaller trees or residuals were left for the next cutting cycle. At that time most of the logs were exported directly to other countries. It was only in the 1990s when a log export ban was imposed that the logs were processed into lumber and other wood products before these were exported. Other key informants also mentioned that there were also irresponsible commercial loggers that were cutting more than was allowed due to uncertainties in government policies such as the frequent pronouncements and lifting of logging bans and moratorium especially during the 1970s to the present.
Through the years, the number of logging concessions had been declining which left many of the cancelled and terminated TLA areas largely unprotected. Illegal logging and timber poaching have reportedly become rampant in many of the forests of the country particularly in ‘untenured’ and de facto open access areas. The respondents differentiate illegal logging from timber poaching, with the former referring to cutting of trees in a large area at one time while the latter refers to cutting one or a few trees in small patches. Much of these activities have resulted into fragmented and mosaic forested areas in many parts of the country.
Anecdotal evidences and media reports abound on visual observations of actual illegal logging and timber poaching. For instance, Wallace (2001) describes the illegal logging operations of small-time tree cutters in Ilocos Norte, Northern Philippines, where legal logging ceased in the 1970s. The local logging teams consist of a chainsaw operator, an assistant operator, and two to three companions, who make several 3-5-day logging trips each year to cut down premium trees (narra (Peterocarpus indicus), tanguile (Shorea polysperma), apnit (Shorea contorta), guijo (Shorea guiso), yakal (Shorea astylosa), almaciga (Agathis philippinesis) and dao (Dracentomelon dao)) from the natural forest. The report estimates that some 687 hardwood trees were being lost annually from primary forests through illegal logging in their area. Similar reports have been heard along the Sierra Madre Mountain Ranges in Luzon.
For this study, respondents in the four sites reported that after the commercial logging companies pulled out, many displaced workers particularly those who have put down roots there, opted to remain in the area. Many of those who could not find local employment were forced to shift to illegal logging, timber poaching, and kaingin making for survival.

36 Analysis of Key Drivers of Deforestation and Forest Degradation in the Philippines
The logging roads previously constructed by the TLA holders provided access to the forests, attracting many landless and marginalized people to clear the logged areas for kaingins and depend on the forest for subsistence and livelihood. In earlier years, informal settlers were kept out of the logging concession areas because the logging companies had enough forest guards to patrol the area. However, once the logging companies pulled out, the forests became de facto open access areas since government did not have enough people and logistics to protect them. The FDC study (1986) on cancelled, suspended, and terminated TLAs showed that forest cover loss increased rapidly as the former TLA areas no longer had concession guards to protect them and government was ill-equipped to protect and manage the hundred thousands hectares of forests left by the concessionaires.
Lasco et al. (2001) assessed the amount of carbon stored in undisturbed forests in Mindanao compared with those in logged-over forests in various years after logging, and found that logging caused a 50 percent decline in carbon density when primary forests are converted into secondary forests. From a carbon density of 198 Mg, selective logging decreased it to 99 Mg. The loss of carbon due to logging, however, can be addressed through reforestation and tree plantations (in grasslands and brushlands) or assisted natural regeneration (in logged over secondary forests). Uncontrolled timber poaching and illegal logging could decrease more than 50 percent carbon density in natural forests and derail the required ‘permanence’ of the carbon stocked and sequestered in the forests under REDD-plus implementation.
Fuelwood Gathering and Charcoal making
Woodfuels, energy sources coming from biomass, refer to both fuelwood (unprocessed woody biomass) and charcoal (wood burned in low-oxygen environment). Woodfuels use contributes to forest degradation because they are and will continue to be the primary energy sources for rural households as well as some industrial users in developing countries (May-Tobin, 2011). In the Philippines, woodfuels continue to be used by households for cooking and by commercial establishments like bakeries, restaurants / eateries, barbecue / lechon vendors, and food processing industries. Woodfuels are affordable and readily available which make them the first choice of energy users over the more expensive alternatives such as liquefied petroleum gas (LPG), kerosene, electricity, etc.
Key informants of this study raised concerns on the threat to forestlands from the unsustainable and irresponsible collection of woodfuels for residential and commercial purposes. Perception by the key informants is that forests are vulnerable as sources of woodfuel for the increasing populace largely dependent on wood. While many residential fuelwood users get their supply from damaged trees, branches, tree tops, other logging wastes and agricultural residues, charcoal makers prefer to use green wood (freshly cut) of any available hardwood and mangrove species because of their wood-burning quality. Fuelwood and charcoal trading thrives because of local market demands.
Estimated total fuelwood consumption in the Philippines is in the range of 20-30 million metric tons (mt) per annum while estimated total charcoal consumption ranges from 2-4 million mt (wood equivalent of 12-24 million mt) per year (Remedio, 2009). Estimates of annual per capita woodfuel consumption based on various sources are listed in Table 13.

37Analysis of Key Drivers of Deforestation and Forest Degradation in the Philippines Analysis of Key Drivers of Deforestation and Forest Degradation in the Philippines
For fuelwood, the annual per capita consumption for rural areas ranges from 0.5 to 1.8 cu m (373 to 1,305 kg) and for urban areas, 0.19 to 0.93 cu m (143 to 677 kg). For charcoal, it ranges from 20.4 to 78.0 kg (wood equivalent) in rural areas and 42.6 to 114.0 kg in urban areas (Bensel and Remedio, 2002). In terms of number of trees, Wallace (1995) in a study in Ilocos Norte estimated the fuelwood consumption by respondents in four villages to be about 68 trees per person per year.
Table 13. estimates of annual per capita wood fuel consumption in the Philippines (various sources)
source PeriodFuelwood
Per capita consumptionCharcoal
Per capita consumptionremarks
DAP, 1992 1979-1989 Rural: 0.82 cum (615 kg)Urban: 0.55 cum (412 kg)
No data Figures are an average of 10 studies ranging in size of 98-808 respondents in different regions
Carandang, 2001
1999 Rural: 0.65 cum (487 kg)Urban: 0.19 cum (143 kg)
Rural: 0.55 cumUrban: 0.94 cum
From surveys of 1,211 households in 13 mainland municipalities in Palawan
Bensel and Remedio, 1993
1992 Urban: 303 kg Urban: 65 kg From survey of 603 urban households in Cebu City
Bareng and Acebedo, 2000
1996 Rural: 1.8 cum (1,305 kg)Urban: 0.93 cum (677 kg)
Rural: 3.4kg (20.4 kg wood equiv)Urban: 7.1kg (42.6 kg wood equiv)
From survey of 93 urban and 277 rural households in Ilocos Norte
UNDP / ESMAP, 1992
1989 Rural: 543 kgUrban: 394 kg
Rural: 78 kgUrban: 114 kg
Results of 1989 HECS of 5,082 households
DOE, undated 1995 Rural: 373 kgUrban: 245 kg
Rural: 33 kgUrban: 25 kg
Results of 1995 HECS of 6,500 households
Source: Bensal and Remedio, 2002
Total fuelwood consumption by commercial / industrial users is estimated at 7.82 million cu m and consumption by industry is shown in Table 14 (Bensel and Remedio, 2003). Bakeries (42%) and fish canning (25%) industries have the highest fuelwood consumption while the least consumption is by structural clay products (0.1%) and leather tanning (0.3%) industries.
Table 14. wood fuel consumption by industry, 1990 (in ‘000 cubic meters)
Industry Total Fuelwood Fuelwood substitutes
Qty % Qty % Qty %
Philippines 14,153.3 100.0 7,822.5 100.0 6,330.8 100.0
Bakery 3,925.7 27.7 3,268.3 41.8 657.3 10.4
Fish canning 1,960.1 13.9 1,957.7 25.0 2.4 0.0
Food manufacturing 987.7 6.0 840.8 10.8 146.9 2.3
Restaurants / eateries 1,069.5 4.3 611.4 7.8 458.1 7.2
Slaughterhouse 429.2 3.0 348.2 4.5 81.0 1.3
Pottery / china / earthenware 917.1 6.7 274.9 3.5 642.2 10.1
Sugar milling / refining 3,712.4 26.2 100.9 1.3 3,611.5 57.0
Vegetable / animal oil 122.7 0.9 113.5 1.5 9.3 0.2
Textiles 117.5 0.8 117.5 1.5 0.0 0.0
Wood / cork / cane products 92.1 5.1 76.7 1.0 15.4 0.2
Distilleries 71.6 1.5 71.6 0.9 0.0 0.0
Leather tanning 34.9 0.1 20.0 0.3 14.9 0.2
Structural clay products 685.6 3.3 8.4 0.1 677.2 10.7Source: Bensel and Remedio, 2003
Where there are no longer primary forests such as in Cebu, studies show that sources of wood fuels are mostly non-forest areas and smallholder woodlots or farm-based fuelwood plantations that are being sustainably managed for livelihood (Remedio, 2009; Bensel, 2008; Bensel and Remedio, 1993, 2003). The Cebu studies reveal that fuelwood comes from trees outside forests, where coppicing of trees are practiced, and that market-driven widespread tree planting and management practices occur in private lands and not just in government or NGO-supported tree planting intervention. Bensel and Remedio (2002) revealed that fuelwood and charcoal sold in Cebu come from tree and shrub fallows and that most of these are established by upland farmers on grass-dominated areas. Their study also shows that 15-25% of woodfuels

38 Analysis of Key Drivers of Deforestation and Forest Degradation in the Philippines
come from storm-felled fruit trees or uprooted during farming; other supplies are sourced from brushlands with indigenous trees species as well as logging residues from private tree plantations.
In areas where forest cover abounds, woodfuels are often gathered as a by-product of clearance for agricultural expansion. Cruz et al. (1991) found that in Laguna, woodfuels came from trees in forests that were cleared for kaingin or upland agriculture. Once the kaingins are established, fuelwood and charcoal are collected by farmers from storm-damaged fruit trees, trees and shrubs grown on agricultural lands, brushlands or forests. In mainland Palawan, a survey of the wood supply and demand found that although 71% of rural and 48% of urban households obtained fuelwood from their own farms, about 28% of rural and 25% of urban residents still collected them from public forest areas (Carandang et al., 1999).
A study by FMB in 1990 on timber trade flow shows that 52% of the respondents got their fuelwood supplies from within four kilometers while 99% of the respondents obtained adequate supplies from within their province. About 33% of their respondents reported using forest tree species such as red lauan (Shorea negrosensis) and tanguile (Shorea polysperma) while 66% reported using Gliricidia, Leucaena and other species in agricultural and brushland areas. Likewise, the fuelwood species used by the villages in Ilocos Norte are mostly fast growing species such as Leucaena leucocephala, Pithecellobium dulce and Gliricidia sepium grown in the area (Wallace, 1990). The Palawan study (Carandang et al., 1999) shows that charcoal used by some wood fuel using industries come from natural forest (6.18%), mangrove (1.69%), or plantation species (0.59%) while many businesses (90.45%) use a mix of species from the former three sources.
Charcoal trading is a common source of cash income for many subsistence farmers in many areas, and the forests continue to be vulnerable to forest degradation because of poverty and increasing market demand for wood fuels coupled with weak forest law enforcement and lax monitoring of the gathering, production and use of wood fuels.
Furthermore, charcoal production and burning emit high levels of greenhouse gases such as carbon dioxide (CO2), carbon monoxide (CO), methane (CH4), acetic acid (CH3COOH), methanol (CH3OH), formaldehyde (HCHO), ethene (C2H4), ammonia (NH3), among many others. A study by Bertschi (2003) in Zambia shows that ‘the combined emissions from charcoal production and charcoal burning are larger than the emissions from wood fires by factors of 3–10 per unit mass of fuel burned and ~2 per unit energy released’.
Apart from GHG emissions from charcoal making and burning are the concerns on the inefficiency of converting woody biomass into charcoal. Most traditional charcoal production systems use more wood [7-10 kg of wood is needed for one kg of charcoal (Reumermann, 2002)] than is necessary with more efficient technologies. In relation to this, some households in General Nakar and in Mount Malindang areas have been using charcoal cooking stoves which have the capacity to use less charcoal than traditional stoves. According to the respondents, as much as 50% of charcoal used per month is reduced with the use of the said stoves. Hence, improving efficiency of charcoal production (by using less wood to produce the same quantity of charcoal, using improved kilns) as well as more efficient charcoal stoves could help in reducing emissions from woody biomass as well as forest degradation.
For firewood, a study on fuelwood from Eucalyptus species in Australia shows that carbon dioxide emissions are greatest from wood collected from dead wood in woodlands (0.11 kg CO2 kWh−1) but much lower with wood from residues and dead wood in native forests (<0.03 kg CO2 kWh−1). The study also found that ‘there was a positive net sequestration of carbon per unit of energy produced from burning firewood harvested from plantations’ (Paul et al., 2006). Such information highlights the need to improve local knowledge on better sources of fuelwood (plantations versus natural forests) in terms of reducing carbon dioxide emissions and the immediacy of establishing fuelwood plantations for enhancement of forest carbon stocks in degraded forestlands.
Woodfuel consumption in rural areas and by industries is expected to continue due to the prohibitive costs of alternative energy sources. Unless there are adequate fuelwood plantation sources, people will continue to depend on forest trees especially for charcoal to sustain their livelihoods and incomes. The illegal wood harvesting for woodfuels will threaten the long-term viability of REDD-plus unless the driving concerns are given due attention.

39Analysis of Key Drivers of Deforestation and Forest Degradation in the Philippines Analysis of Key Drivers of Deforestation and Forest Degradation in the Philippines
non-Timber Forest Products Extraction
Non-timber forest products (NTFP) extraction continues to drive forest degradation in many forestlands of the Philippines. NTFP gathering and harvesting provide additional cash income for many rural households within and nearby forestlands in the Philippines. Various literature differentiate between subsistence (providing food, shelter, medicine, and cash income) and commercial (local and international trading) use of NTFPs. Belcher et al. (2005) identified five groups according to the role of NTFPs in the household economic strategy: (1) subsistence strategy; (2) supplementary strategy; (3) integrated strategy; (4) specialized natural strategy; and (5) specialized cultivated strategy. This grouping was used to analyze global patterns and trends of NTFP use and management in relation to livelihoods and conservation.
For the subsistence group, NTFP contributes little to total household income but it may be the main or only source of cash income, and those involved are located in remote areas where the product is often extracted from de facto open access lands. For the supplementary group, NTFPs contribute less than 50% of total household income with households well integrated into the cash economy, and NTFPs are collected from the wild, supplementing household income when other sources of income are low. The integrated group is similar to the supplementary group except that the NTFP is cultivated and integrated into a diverse set of income earning activities, produced predominantly on private lands and for local markets. The specialized natural extraction group harvests NTFP from the wild, often of high value and traded nationally or internationally, and the product contributes more than 50% of total household income. The specialized cultivation group has NTFP species intensively cultivated on private lands for international markets and contributes more than 50% to total household income (Kusters et al., 2006).
Belcher et al. (2005) describe subsistence NTFP gatherers as having lower incomes than local average and tend to use NTFPs as primary source of income, supporting the general idea that “wild-gathered NTFPs are resources of the poor”. Subsistence NTFP-using households generally have poor access to markets, insufficient human capital, insufficient productive capital, weak institutions, and generally weak bargaining power. The Belcher et al. study shows that uncontrolled competition for NTFPs in open access areas often leads to overexploitation of resources resulting to declining resource bases as well as negative impacts on biodiversity and the ecosystem.
This study’s key informants refer more to the subsistence and supplementary groups of NTFP gatherers extracting the products from public forestlands. The main NTFPs harvested and locally traded are rattan, bamboo, almaciga resin, and wild honey. Other NTFPs mentioned by this study’s respondents are vines, ferns, medicinal plants, and fauna (birds, wild boar) mainly for home consumption although some are traded in very small quantities for cash. The indigenous peoples in the Palawan and General Nakar sites mentioned receiving assistance in the marketing of wild honey through the NATRIPAL (Palawan PO) and by the Non-Timber Forest Products Task Force (NTFP-TF) in Quezon. Almaciga resin is collected mainly in Palawan by both IPs and local communities. Bamboos are collected in all of the sites both for home use and for local markets. Rattan cutting contracts were mentioned by IPs in the Quezon and Palawan sites.
National statistics for selected NTFPs (rattan, bamboo, almaciga resin and honey) show a general decline in production and exports which may indicate decreasing resources. The number of rattan cutting contracts (RCCs) reportedly peaked in 1998 with 121 contracts issued over 1.4 million ha while only 56 RCCs remained in 2008 covering a total area of 359,565 ha and an allowable cut of 21.94 million linear meters (lm). The reported production of unsplit rattan in 2008 shows only 5.15 million lm. Table 15 and 16 show decreasing production and export of selected NTFPs from 1980 to 2008.

40 Analysis of Key Drivers of Deforestation and Forest Degradation in the Philippines
Table 15. Production of selected non-timber forest products in the Philippines, 1980-2008
1980 1990 2000 2008
Unsplit Rattan (lm) 12,758,000 19,266,000 32,336,000 5,151,000
Split Rattan (k) 348,000 10,000 97,000 18,000
Bamboo (pc) 327,000 984,000 2,337,000 872,000
Almaciga resin (k) 506,000 943,000 518,000 248,000
Honey (l) 2,000 - - -Source: Philippine Forestry Statistics, 2008
Table 16. exports of selected non-timber forest products in the Philippines, 1980-2008
1980 1990 2000 2008
Rattan poles
Quantity (k) <1,000 <1,000 - 25,000
Value (US$, FOB) <1,000 1,000 - 13,000
Bamboo
Quantity (k) <1,000 16,000 19,000 47,000
Value (US$, FOB) 1,000 15,000 39,000 72,000
Almaciga resin
Quantity (k) 683,000 288,000 319,000 122,000
Value (US$, FOB) 377,000 211,000 242,000 172,000Source: Philippine Forestry Statistics, 2008
Various socio-economic and policy-institutional factors drive the uncontrolled and unsustainable harvesting and collection of NTFPs that will continue to threaten and degrade forest resources in the Philippines. The cash income from trading NTFPs to supplement household incomes, the ready market for NTFPs, the competition for NTFPs in unprotected and remote forestlands coupled with lack of government monitoring and weak forest law enforcement, are among the socio-economic-governance drivers of forest degradation due to NTFP harvesting. There are a few communities and IP groups who practice sustainable NTFP harvesting practices and have even penetrated the international market with the assistance of NGOs such as the NTFP-EP and donor agencies, but these are the exception while many other groups struggle to comply with government policies and lack of technical knowhow on sustainable practices.
Policy and institutional factors underlying the unsustainable harvesting of NTFPs include the lack of clarity in licensing / permitting policies as well as lengthy and costly process of availing of or renewing permits. Certain policies provide for the use of management and development plans as resource use permits for CBFMA or CADT holders but various DENR field offices have different interpretations resulting in higher transactions cost for the additional time to process the confusing and often unnecessary requirements. The required inventory of NTFPs prior to harvesting is too costly for communities and IPs to comply with. For Ordinary Minor license under which most NTFPs fall under, requirements (such as necessary business capital, performance bond, income tax returns, and financial statements for two years prior to application) are just too much for communities and IPs to comply with (Arquiza et al., 2010).
The high costs incurred in processing NTFP licenses or permits as well as transporting the products (with ‘unofficial payments’ in checkpoints) usually result in (1) bribing officers to facilitate the permitting system, (2) overharvesting to cover the additional expenses, or (3) shifting to illegal harvesting. The first one indicates weaknesses in government capacity to streamline the permitting system and enforce forestry laws while the second and third results directly underpin the increasing degradation of forestlands.
Unsustainable NTFP extraction leads to forest degradation especially when it involves cutting of rattan and bamboo poles in ways that the remaining poles and clusters are unable to regenerate, or when improper tapping techniques and over-harvesting of almaciga resin result in death of the trees. The fact that many IPs and local communities are harvesting NTFPs far inside the forests and in more remote areas indicates that NTFP resources in lower elevations or more accessible areas have been depleted and known habitats of honeybees and other wildlife are too degraded or lost altogether. Hence, forest degradation expected from these activities will affect the results of any REDD-plus approach.

41Analysis of Key Drivers of Deforestation and Forest Degradation in the Philippines Analysis of Key Drivers of Deforestation and Forest Degradation in the Philippines
b. AgrICuLTurAL eXPANsIoN
Deforestation driven by expansion of agricultural lands into forestlands was primarily through extensive slash-and-burn shifting cultivation which followed after logging concessions built access roads and operated in frontier forests during the 1950s to the late 1980s (Kummer, 1992). Expansion of settlements and resettlement programs in forestlands have also been reported in some areas of the country. In recent decades, agricultural expansion for oil palm, biofuels, and rubber plantations as well as highland vegetable farms are gaining ground in forestlands. Many of these plantations were established in more accessible forestlands converted earlier to grasslands or brushlands or areas adjacent to A&D lands. However, recent developments such as the scarcity of land for oil palm and rubber plantations in Malaysia and Indonesia have started the encroachment into forestlands in Palawan and Mindanao areas for these crops.
kaingin, Shifting Cultivation / Traditional Swidden
From the 1980s onwards, several programs on social forestry and community-based forest management were implemented to address forest occupancy and shifting cultivation. These programs provided some forms of tenure to forest occupants to encourage sedentary farming and prevent upland farm expansion through shifting cultivation. Lowland farming practices were brought to the uplands by migrants resulting in heavily degraded soils that became unproductive after two or three cropping seasons. Thus migrant farmers were forced to clear additional areas for kaingin, leaving the unproductive farms to fallow and return to the original kaingins after several years. This is very similar to indigenous people’s traditional swidden farming practices in some areas except that migrant farmers open up wider areas (more than a hectare per household) than indigenous peoples (a few hundred square meters to less than a hectare). Indigenous peoples cultivate small areas for rice or root crops and retain some trees in their farms and then shift to another area to leave the soil-depleted farm to fallow.
In the study sites, interviewees reported that traditional shifting cultivation was practiced mainly by indigenous peoples with smaller-sized farms (about 2000 to 5000 sq m per household) and fallow periods from 6 to 12 years (General Nakar) or 10 years (Palawan) or 15-20 years (Mount Malindang). The Agta-Dumagat-Remontado of General Nakar used to open their small kaingins near their clan settlements but in recent years were forced to shift farther up the mountains and nearer to the forest margins as lowland migrants began taking over their fallow kaingins. The Tagbanua and Cuyunin of Palawan used to practice

42 Analysis of Key Drivers of Deforestation and Forest Degradation in the Philippines
traditional fallow periods of ten years but the entry of ‘diwan’ or lowland migrants influenced them to shorten fallow period to three years until eventually they became sedentary farmers.
The Subanen in Mount Malindang also experienced the same as the influx of migrants pushed them upwards and along forest margins. The Agta-Dumagat / Remontado, Tagbanua / Cuyunin and Subanen plant root crops in cleared areas in between big trees that they are unable to cut down due to cultural beliefs or simply due to lack of proper cutting equipment. They use smaller trees for house construction / repair and fuelwood.
Non-IP and migrant upland farmers in General Nakar open new areas for kaingins and stay there permanently to plant agricultural crops, coconut, bananas, and other fruit trees. When the intensively cultivated soil is no longer fertile, they expand the clearing to nearby areas to have more room to plant annual crops. The non-IP
upland farmers start with bigger-sized kaingins from a half hectare per household in the first year and expand to about 3 to 5 hectares in several years and as their children and grandchildren grow in number. Once the children marry, they inherit a portion of the parents’ kaingin or they clear new areas of their own. The expanded farms could be nearby or in patches depending on the presence of other claimants in their neighbourhood. Even with the seemingly larger farm sizes, most of the farmer respondents say that their farm harvest is barely enough to sustain the household needs. The entry of land speculators in ‘open access’ areas has also compounded the problem in the General Nakar area. These speculators open up new kaingins as a way to stake their claims, planting agricultural crops including fruit trees, hoping that they would eventually be entitled to the forestland after several years.
Kaingin making in Southern Leyte appears to be influenced mainly by market forces. Key informants revealed that most upland areas in the province are planted to coconuts and abaca because these crops had good prices and markets. However, a pest that occurred in CY 2000 discouraged most upland farmers to continue planting abaca. This was further aggravated by falling prices of abaca fiber. The planting of coconuts and abaca is also one way of establishing claims within forestlands. These crops easily survive under shade and once established, require less maintenance. They are also intercropped with other annual crops and with other fruit trees.
In the four study sites, kaingin-making where new lands are cleared for subsistence farming has been declining in recent years mainly because most of the forestlands already have claimants. According to the respondents, clearing of new kaingins are done by new migrants but mostly in higher elevations or at the forested margins which have not yet been claimed. Upland or hillside farming has become sedentary mainly because the farmers have staked their claims on farms that have been cleared much earlier than the present. Claimants use physical boundaries such as ridges, creeks and rivers, big trees, tree fences, or other natural structures. Among the effects of kaingin making observed by the respondents are: loss of big trees and destruction of forests; grassland fires due to uncontrolled or accidental fires from slash and burn of kaingins; continuously degraded soil fertility due to burning, cultivation, leaching, and erosion; reduced water quantity and quality; and massive erosion and landslides.
Expansion of kaingin areas may be inevitable if people are driven to the forests by poverty and demographic factors coupled by weak regulatory capacities. Thus, any REDD-plus approach will have to address this driver and its underlying causes. Preventing the expansion of existing kaingins is possible but more problematic is preventing the entry of other migrant settlers, including land speculators, in search of land to cultivate in open access areas. Viable approaches therefore will have to include benefits that stabilize land use. Benefits from REDD-plus can serve as incentives for local people to forego the conversion of forestlands to agricultural lands, but only in combination with secure land tenure that minimizes open access areas and allows long-term investment into forest land.

43Analysis of Key Drivers of Deforestation and Forest Degradation in the Philippines Analysis of Key Drivers of Deforestation and Forest Degradation in the Philippines
Forestlands as Settlement / Resettlement Areas
Conversion of forestlands to settlement / resettlement is evident in Southern Leyte (1970s) and Palawan (1980s). Forestlands in said areas were cleared to make way for housing and farm lots of the beneficiaries. These led to the deforestation of thousands of hectares in these areas.
The first settlement project in Eastern Visayas known as the Southern Leyte Settlement Project was created on September 11, 1975 through Presidential Proclamation 1497. It allowed the cutting of timber in the forestland where the settlement was located. The settlement project under the Department of Agrarian Reform (DAR) aimed to provide a more vigorous land resettlement program; provide farmers with lands and technical guidance and assistance to make them independent, self-reliant and progressive farmers; preserve the watershed areas, and; uplift the economic status of the settlers / occupants. The settlement project covers a parcel of land within the municipalities of Hinunangan, San Juan, and Saint Bernard. The project site is adjacent to the municipality of Silago which is one of the sites under the GIZ-DENR REDD-plus pilot area.
However, illegal logging became pronounced in the guise of clearing the forestlands for settlement purposes. This led to the reversion of the area to timberland through Proclamation No. 106 in May 11, 1987. This affected the rights of individual settlers who have already introduced improvements to their lands. It also negated the developments and improvements introduced by the DAR. However, reports that DENR had curtailed illegal logging activities in the area led to revoking the 1987 proclamation by Proclamation No. 246 on April 18, 1988, this time reserving the area for settlement purposes but subject to forestry laws and regulation.
On September 16, 2010, a composite team from the DENR inspecting the remaining balance of land holding for distribution under the Settlement Project, reported that the aggregate area of 3,943 hectares of the remaining balance of the area for settlement is considered as critical watershed that serves as the head water of Das-ay River. They further reported that the area is classified as old growth and second growth forests with slope of more than 18% and not suitable for agricultural purposes. The map of the survey signed by the DENR Regional Executive Director exempts the said area for the issuance of CLOA and instead the beneficiaries will be organized by DAR into a PO and the DENR will issue CBFMA It was also classified as an environmentally critical area under Proclamation 2146 (December 14, 1981) and prone to landslides due to steep slopes and rugged terrain. The area is likewise located in a fault line, hence, not suitable for settlements.
The resettlement area in Narra, Palawan was originally a part of Aborlan and a civil reservation under Proclamation 190 signed by the late President Quirino in June 1950. It was then converted into Central Palawan Settlement by virtue of EO 355 in October 1950 which created the Land Settlement Development Corporation (LASEDECO). In 1954, RA 1160 (signed by the late President Magsaysay) enacted the National Rehabilitation and Resettlement Administration (NARRA) which took over the administration of the Central Palawan Settlement Project.
The early settlers were mainly rebel (“Huks”) returnees from Luzon and Visayas. It was in 1969 that RA 5642 (signed by the late President Marcos) created and declared Narra as a municipality of Palawan (home.comcast.net). Local respondents said that the resettlement area used to be forestland classified as civil reservation and the area extends from the lowland to the hilly uplands. Beneficiaries of the resettlement project were given 6-hectare lands per household to clear for agriculture and home lots. Key informants said that DAR, which eventually took over the resettlement project, still has target areas available for migrant settlers.
44 Analysis of Key Drivers of Deforestation and Forest Degradation in the Philippines
In both cases, forestlands were converted to settlements by government to provide lands for the landless. The increasing population and scarcity of land for agriculture and settlements in the lowlands pose a threat to the remaining forestlands of the country, which could be the target for further conversion. The congestion in urban areas is now being addressed through resettlement programs in the country sides. Ideally, government has to make sure that resettlements are located in areas that are suitable for farming and home lots and that forest ecosystems are not endangered further but realities show that this is often not the case. Expansion of settlement areas into the forestlands is a threat to the permanence of any REDD-plus approach implemented adjacent to such areas or could serve as leakage in areas outside the project boundary.
Conversion of Forestlands to oil Palm and Rubber Plantations
Conversion of lands for oil palm plantations is currently a threat to forestlands especially in territories of the indigenous peoples in Palawan and some areas of Mindanao. Oil palm production is dominated by Indonesia and Malaysia and their companies are expanding their operations (due to land shortages at home) in neighboring Philippines, particularly the province of Palawan and the island of Mindanao. Malaysian investors are reportedly partnering with Filipino investors to expand oil palm plantations in Palawan by ‘renting’ the lands of smallhold farmers and indigenous peoples. Oil palm plantations require large tracks of land (4,000-5,000 ha needed to sustain a mill) and many smallholder agricultural farms have already been converted including indigenous fallow lands within forestlands. Most oil palm plantations are found in the municipality of Espanola but they are expanding to other towns such as Brooke’s Point, Bataraza, and Quezon in the province of Palawan. Oil palms are now competing for space with coconut palms and rice fields in these areas (ALDAW Network, 2010).
Oil palm (Elaeis guineensis and Elaeis oleifera) grows in low-lying tropical forests with high rainfall which characterizes Palawan and most parts of Mindanao Island. Reports show that there were 6,000 ha of harvested oil palm areas in the country in 1980, which increased to 22,000 ha in 2008 (Dy, 2011) with production of 70,000 mt of palm oil in 2008 (USDA, 2008). Most oil palm plantations are established along roadsides due to the immediate need for fresh oil palm fruits to be transported within 48 hours to the mill so they do not loose quality (Colchester, 2011).
Fitzherbert et al. (2008) mention ways in which oil palm contributes to deforestation: “(i) as the primary motive for clearance of intact forests; (ii) by replacing forests previously degraded by logging or fire; (iii) as part of a combined economic enterprise, such as with timber, plywood or paper pulp profits used to offset the costs of plantation establishment; or (iv) indirectly, through generating improved road access to previously inaccessible forest or displacing other crops into forests.” Land may be converted for other purposes and subsequently planted to oil palm such as the case in Indonesia where forests degraded by fire and logging were later replaced by oil palm plantations. Conversion to oil palm is said to account for 16% of recent deforestation in Indonesia. Negative impacts of oil palm plantations include biodiversity losses, habitat fragmentation and pollution, including GHG emissions. The same consequences can be expected if oil palm plantations continue to expand at the expense of natural forest in the Philippines.
Global demand for edible oils and biofuels is driving the rapid expansion of oil palm plantations in Southeast Asia (Colchester, 2011). Increasing demand for vegetable oils and biofuels is increasing prices for oil palm and other edible oils and biofuel crops, further driving the expansion of plantation areas (Fitzherbert et al., 2008). Oil palm plantations have been expanding because (1) it is a profitable crop [10 times more profitable than soybean, sunflower or rapeseed (WWF, nd)]; (2) palm oil is used in many products; (3) there is currently insufficient demand for certified sustainable palm oil and not enough environmental clout to slow the rate of forest conversion; and (4) claims to have improved the lives of poor communities in Southeast Asia (Wilcove and Koh, 2010). Biofuels use is also gaining global importance because they should be carbon neutral as opposed to burning fossil fuels that release carbon into the atmosphere. However, oil palm plantations are likely to become net carbon sinks only if they are established on degraded grasslands with low carbon content (Fitzherbert et al., 2008).

45Analysis of Key Drivers of Deforestation and Forest Degradation in the Philippines Analysis of Key Drivers of Deforestation and Forest Degradation in the Philippines
In the Philippines, the Biofuels Act of 2006 (R.A. 9637) promotes the establishment of plantations for jatropha and oil palm as biodiesel feedstock in addition to sugarcane and coconut agrofuels. In 2007, government earmarked two million ha of unproductive and idle public lands nationwide for jatropha plantations (Padilla, 2007). In 2009, Malaysian oil palm developers (primarily Adani Wilmar Group Ltd.) planned to establish a 100,000-ha oil palm plantation and extraction facility in Mindanao, of which 92,000 ha of public lands are said to be available in Compostela Valley. However, there are no reports on how much of this has been realized. Other potential sites for palm oil are in the provinces of Sarangani, Misamis Occidental, North Cotabato and South Cotabato (mongabay.com). As of 2009, oil palm milling companies operating in CARAGA region include Filipinas Palm Oil Plantations Inc., Agusan Plantations, Inc., and Kenram Philippines, Inc. (palmoilhq.com).
In Southern Leyte, coconut plantations expanded in forestlands because of its use as biofuel and due to its various commercial uses. The reported nut production from 2002 to 2011 provides an indication of possible increase in coconut plantations which are likely to be expanding in forestlands. From 2002 to 2008 nut production increased from 156,566,889 to 183,408,826 nuts. While nut production slightly decreased to 173,608,407 nuts in 2010, it again increased to 174,754,222 nuts in 2011 (2011 Report of the Philippine Coconut Authority, Southern Leyte). Expansion of coconut plantations in the province could be triggered further with the recent agreement between the Philippine Coconut Authority (PCA) and the Provincial Government for the massive replanting program in 3,500 hectares of land to revive the coconut industry in Southern Leyte. Under this program, 1,500 hectares will be planted under the participatory coconut planting program and 2,000 hectares under the seedling dispersal program (www.sunstar.com.ph).
In Palawan, the provincial government is promoting agrofuels development (including oil palm) as key to achieve energy sufficiency while lowering greenhouse gas emissions as well as addressing poverty (ALDAW Network, 2010). Palm oil plantations were developed in Narra by cooperatives with funds from Land Bank and facilitated by AGROMIL, a Malaysian-Filipino company. AGROMIL provided seedlings and they buy the oil palm fruits / nuts which they then process in the milling plant in Brookes Point and the processed oil is exported to Malaysia. The plantation area is composed of lands owned (some are titled, some under tax declaration) by the members of the cooperatives (2-5ha / household). The plantation in Aramaywan has an area of 130 ha while that in Isogod has 40 ha.
Some respondents in Palawan claim that an increasing number of smallholder agricultural farmers and indigenous peoples are involved in oil palm plantations by renting out their farms and indigenous upland fallow areas to oil palm investors or participating in oil palm cooperatives. Interviewees said that several cooperatives were formed in Palawan with members pooling their land areas as collateral for loans with the Land Bank of the Philippines for oil palm establishment. Some cooperatives continue to operate while waiting for the oil palms to mature and be ready for harvest. However, there are cooperatives whose members have lost their lands to the bank because they were unable to repay the loan at the expected time of payment (after a grace period) since the plantations were not ready for harvesting.
The planting of rubber trees started in some areas of Mindanao in the 1950s and farmers found that the trees grow well in the island’s climatic and soil type, needing minimal care. Rubber plantation areas rose from 54,000 ha in 1980 to 123,000 ha in 2008 (Dy, 2011). Domestic demand for rubber is increasing and production is reported to have increased by 25% in Mindanao for the period 2005-2010 (Lacson, 2012). Rubber plantations are also found in Palawan in areas accessible to highways. One of these is a 300-ha rubber plantation established by the Dugan foundation in the early 1970s. The land was bought from IPs and is planted with rubber and cash crops while livestock are raised for additional livelihood.
The growing demand for rubber plantations has also extended to forest areas but mainly in open lands, grasslands and brushlands. There have been clamors from the industry for DENR to include rubber plantations under the ‘forest category’ so that they can avail of existing forestlands to expand their plantations.
Although oil palm plantations and rubber plantations are not yet a major driver of deforestation through extensive forestland conversion in Palawan, the key informants and FGD participants of this study raised concerns on the threats from oil palm and rubber plantations expanding into forestlands because of their profitability and continuing domestic and international demand. Contributing to these are government

46 Analysis of Key Drivers of Deforestation and Forest Degradation in the Philippines
policies encouraging foreign investments in biofuel and energy plantations, weak governance structures and lax enforcement and monitoring as well as economic markets fuelling high prices and increasing global and local demand. The conversion of forests into plantations through expansion could constrain any REDD-plus implementation particularly since oil palm plantations have clearly been excluded in the official forest definition used under the Philippine National REDD-plus Strategy based on MC 2005-005 and NSCB Resolution No. 12, S-2004. Rubber plantations are considered agricultural crops although these can be planted in small areas (not more than 10%) in industrial tree plantations within forestlands (Section 14.5, DAO No. 53, S-1999).
highland vegetable Farming
Vegetable farming is commonly practiced in the municipality of Don Victoriano, which is inside the Mount Malindang Range Natural Park. About 34 percent of the Natural Park or about 9, 677 ha of its land area is devoted to agriculture primarily highland vegetables, root crops, rice and corn. It is estimated that 85 percent of the population is engaged in agriculture along the hilly and steeply sloping areas of Mount Malindang. Most of these highland vegetable and agricultural farms used to be forested and commercially logged. After logging, much of the area was converted to kaingins and upland settlements. Eventually, the number of settlers increased so that the municipality of Don Victoriano was created in 1982. It has a total land area of 28,455 ha located inside the Natural Park.
Because of the hilly to steeply sloping terrain, cultivation of rice, corn, vegetables and root crops has become costly since the farmers need more inputs to improve soil productivity. Regular burning and soil erosion contribute to soil degradation and very few farmers practice soil conservation techniques. Hence, many of them are forced to expand their farms towards the forests in search of more fertile land for agriculture. The forests within the Natural Park will continue to be threatened because of the need to expand agriculture areas due to poverty, demographic and economic factors as well as weak regulatory enforcement.
C. INFrAsTruCTure eXPANsIoN
Transport: Road Construction
Road construction links logging / mining and deforestation by opening new access to forestlands which have potential for conversion to agriculture by immigrants driven by poverty and demographic factors. It is also facilitated by poor enforcement of regulatory policies and forest tenure (Kaimowitz et al., 1998). Mahar and Schneider (1994, cited in Contreras-Hermosilla, 2000) contend that road building is a strong driver of deforestation in Latin America where each kilometre of new road constructed into forests may lead to deforestation of 400 to 2,000 hectares. Roads can increase the values of land and the profitability of converting forestlands to agriculture making it more attractive to illegal occupants. In many other
areas, logging roads built within forest areas speed up deforestation and endangers biodiversity and climate stability (De Luca, 2007).
The effect of roads providing access to previously inaccessible forests and becoming a magnet for migrant farmers who slash and burn the remaining forests for croplands leading to massive deforestation has been evident in many areas of the country for the past decades. Liu et al. (1992) analyzed land use maps for 1934 and 1988, and a 1941 road map of the Philippines to determine the rates of deforestation as they relate to distance of forests to roads and forest fragmentation. They found that about 9.8 million hectares of forest was lost from 1934 to 1988. About 78% of 2.1 million ha of forest within 1.5 km of roads in 1934 was lost by 1988, which indicates that the nearer the forest was to roads, the higher the rate of deforestation. It was

47Analysis of Key Drivers of Deforestation and Forest Degradation in the Philippines Analysis of Key Drivers of Deforestation and Forest Degradation in the Philippines
also found that forests with large perimeter-to-area (P / A) ratio (indicating forest fragmentation) were characterized by small area and the presence of adjacent agricultural lands in 1934. The study shows that forests in such areas were readily cleared in 1988.
Roads are no longer being built for logging purposes in the Philippines since the phase out of large scale logging concessions and the current logging moratorium, but the recent increase in mining investments has triggered the construction of access roads in mining areas, most of which are found within forestlands. Other roads are also being built to improve farm-to-market transport or for tourism development purposes, at times cutting across forestlands or even protected areas. Newly constructed mining roads were observed in Narra, Palawan where trees in sloping areas were cleared for the right of way. Similarly, the tourism facilities in the buffer zone inside the Mount Malindang Range Natural Park also include the expansion and extension of the access roads.
The newly opened Marikina-Infanta Road was built in the middle of the protected area (PP 1636, National Park, Wildlife Sanctuary and Game Preserve) located in General Nakar, Infanta, Real in Quezon province and other towns in Rizal, Bulacan, and Laguna. The road was built to facilitate transport of products and people from the northern part of Quezon to Rizal and environs. According to the respondents, the same road has become a back door entry and exit of illegally harvested forest products as well as serving as attraction to land speculators, migrant kaingineros, and roadside businesses.
Respondents in Southern Leyte also mentioned an on-going construction of a provincial road cutting across the forestlands in the REDD-plus pilot site. They expect that the road building project will increase access to the forests and will attract migrants in search of land and livelihood.
The expansion of oil palm and rubber plantations into forestlands is expected to continue in Palawan and Mindanao which means that road construction possibilities are high in these areas in the future. The need to immediately transport the products from the plantation to the processing mills or markets will eventually raise the need to extend roads into the forest areas where the plantations have encroached.
Existing roads and building or extension of roads inside forestlands or protected areas requires serious consideration in implementing REDD-plus in the Philippines. Since roads facilitate access to forestlands, monitoring and protection of forests to ensure that forest cover is intact for the duration of a REDD-plus approach generating carbon credits will have to be improved. Access roads within forestlands not covered by strict monitoring under REDD-plus may result to leakage when deforestation and forest degradation activities shift to these areas.
markets (sawmills, furniture and processing plants)
PD 705 (section 2) provides that operators have to secure wood processing plant (WPP) permits from the DENR. Section 30 of the Forestry Code regulates and rationalizes the establishment and operation of WPPs, requiring new plants to ensure the availability of adequate raw materials on a sustainable basis. The Code (section 32) further decrees that all logs produced in the country should be processed locally and that “wood processors shall accept for processing only logs cut, or purchased from, licensees of good standing at the time of the cutting of logs.” Table 17 shows the officially registered number of wood processing plants such as sawmills, veneer and plywood plants in the country. The number of illegally operating sawmills, bandsaws, and chainsaws have yet to be documented which, based on local respondents’ accounts, are more than what is reported.
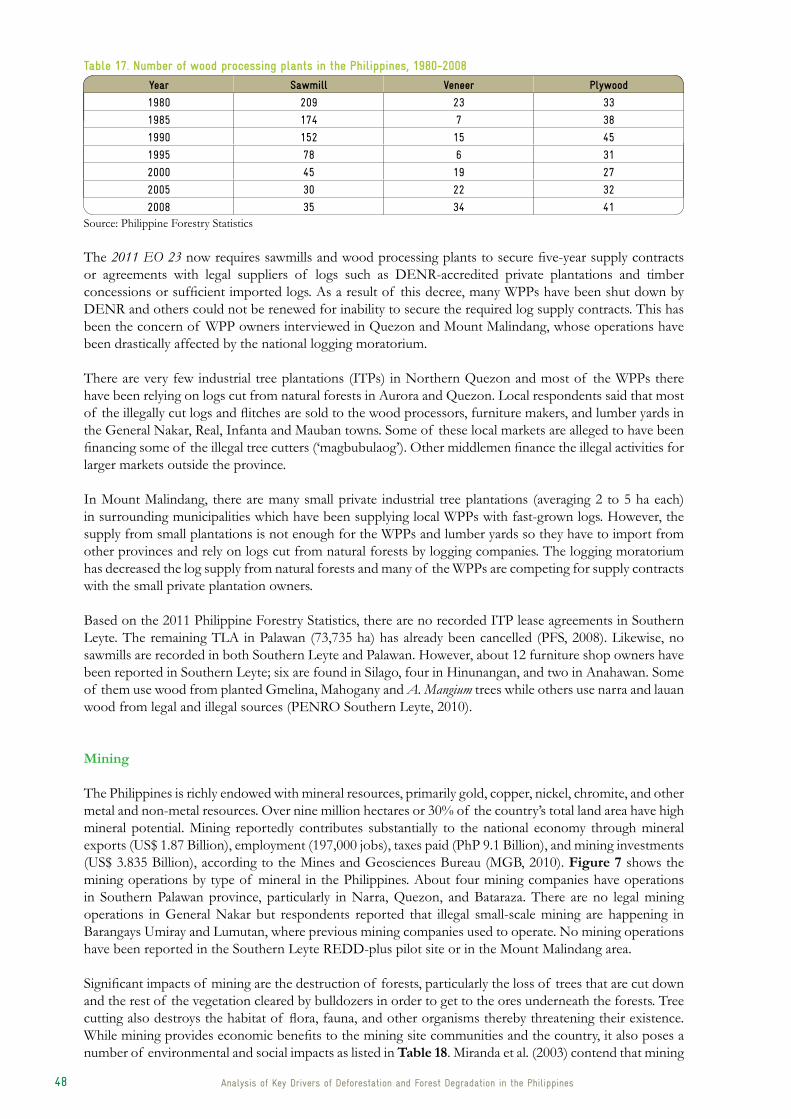
48 Analysis of Key Drivers of Deforestation and Forest Degradation in the Philippines
Table 17. Number of wood processing plants in the Philippines, 1980-2008
year sawmill veneer Plywood
1980 209 23 33
1985 174 7 38
1990 152 15 45
1995 78 6 31
2000 45 19 27
2005 30 22 32
2008 35 34 41Source: Philippine Forestry Statistics
The 2011 EO 23 now requires sawmills and wood processing plants to secure five-year supply contracts or agreements with legal suppliers of logs such as DENR-accredited private plantations and timber concessions or sufficient imported logs. As a result of this decree, many WPPs have been shut down by DENR and others could not be renewed for inability to secure the required log supply contracts. This has been the concern of WPP owners interviewed in Quezon and Mount Malindang, whose operations have been drastically affected by the national logging moratorium.
There are very few industrial tree plantations (ITPs) in Northern Quezon and most of the WPPs there have been relying on logs cut from natural forests in Aurora and Quezon. Local respondents said that most of the illegally cut logs and flitches are sold to the wood processors, furniture makers, and lumber yards in the General Nakar, Real, Infanta and Mauban towns. Some of these local markets are alleged to have been financing some of the illegal tree cutters (‘magbubulaog’). Other middlemen finance the illegal activities for larger markets outside the province.
In Mount Malindang, there are many small private industrial tree plantations (averaging 2 to 5 ha each) in surrounding municipalities which have been supplying local WPPs with fast-grown logs. However, the supply from small plantations is not enough for the WPPs and lumber yards so they have to import from other provinces and rely on logs cut from natural forests by logging companies. The logging moratorium has decreased the log supply from natural forests and many of the WPPs are competing for supply contracts with the small private plantation owners.
Based on the 2011 Philippine Forestry Statistics, there are no recorded ITP lease agreements in Southern Leyte. The remaining TLA in Palawan (73,735 ha) has already been cancelled (PFS, 2008). Likewise, no sawmills are recorded in both Southern Leyte and Palawan. However, about 12 furniture shop owners have been reported in Southern Leyte; six are found in Silago, four in Hinunangan, and two in Anahawan. Some of them use wood from planted Gmelina, Mahogany and A. Mangium trees while others use narra and lauan wood from legal and illegal sources (PENRO Southern Leyte, 2010).
mining
The Philippines is richly endowed with mineral resources, primarily gold, copper, nickel, chromite, and other metal and non-metal resources. Over nine million hectares or 30% of the country’s total land area have high mineral potential. Mining reportedly contributes substantially to the national economy through mineral exports (US$ 1.87 Billion), employment (197,000 jobs), taxes paid (PhP 9.1 Billion), and mining investments (US$ 3.835 Billion), according to the Mines and Geosciences Bureau (MGB, 2010). Figure 7 shows the mining operations by type of mineral in the Philippines. About four mining companies have operations in Southern Palawan province, particularly in Narra, Quezon, and Bataraza. There are no legal mining operations in General Nakar but respondents reported that illegal small-scale mining are happening in Barangays Umiray and Lumutan, where previous mining companies used to operate. No mining operations have been reported in the Southern Leyte REDD-plus pilot site or in the Mount Malindang area.
Significant impacts of mining are the destruction of forests, particularly the loss of trees that are cut down and the rest of the vegetation cleared by bulldozers in order to get to the ores underneath the forests. Tree cutting also destroys the habitat of flora, fauna, and other organisms thereby threatening their existence. While mining provides economic benefits to the mining site communities and the country, it also poses a number of environmental and social impacts as listed in Table 18. Miranda et al. (2003) contend that mining

49Analysis of Key Drivers of Deforestation and Forest Degradation in the Philippines Analysis of Key Drivers of Deforestation and Forest Degradation in the Philippines
oPerATINg MINes IN The PhILIPPINes
Figure 6. Location of operating mines in the Philippines
impacts may be site-specific (habitat loss / fragmentation, increased colonization from road development, species and habitat loss, etc.) but could also generate large-scale contamination and ecosystem degradation (disturbances, toxicities and contamination of water, soil, air). These impacts raise key challenges on waste management, natural resource access (land and water), and uneven creation and distribution of wealth, that responsible mining needs to address. Much of the said environmental and social impacts are already felt in many areas of the Philippines, particularly in abandoned mining sites.
Source: MGB-DENR

50 Analysis of Key Drivers of Deforestation and Forest Degradation in the Philippines
The Philippine Mining Act (RA 7942) enacted in 1995 is the policy that governs mining operations in the country. This Act supersedes the provisions of the older mining laws except RA 7076 or the People’s Small Scale Mining Act of 1991 which is still the basic policy when it comes to small scale mining activities. RA 7942 provides new system of incentives and more liberalized modes of entry such as the following:
Incorporation of Financial or Technical Assistance Agreement (FTAA) as one of the three modes of obtaining mining rights, the other two being the exploration permit and the mineral production agreement provisions;Inclusion of mining activities in the Investment Priorities Plan (IPP) of the Board of Investments;Provision of a 10-year Net Operating Loss Carry- Over (NOLCO) and accelerated depreciation, and; Provision of environment–related provisions such as Contingent Liability, Rehabilitation Fund and a trust fund to pay for damages caused by mine waste and tailings, and a Final Mine Rehabilitation and Decommissioning Plan.
It also explicitly addresses the issues of environmental protection, mine closure, indigenous peoples, and equitable sharing of the benefits of mining among the major stakeholders. Sections16 and 17 of the Act also provide for the solicitation of free and prior informed consent (FPIC) of the IPs before any mining exploration permit is granted. The reality, however, shows that the FPIC process is not always followed and IPs are often deprived of agreed benefits.
In view of the need to expedite the grant of mining tenements and revitalize the minerals industry without compromising the benefits of having thorough mineral exploration, DENR Administrative Order No. 2005-15 was issued amending certain sections of DAO No. 96-40, as amended or the implementing rules and regulations of the Philippine Mining Act of 1995. Sec 17 of the DAO states that exploration as the initial mode of entry in mineral exploration shall be initially undertaken through an exploration permit. The exploration permit applicant may enter into a memorandum of agreement to jointly undertake the study.
Table 18. Potential environmental and social impacts of mining on ecosystems and local communities
stage Activities Potential Impact
Exploration Geophysical / airborne surveyingDrilling / trenchingTrench blastingExploration camp developmentRoad construction
Habitat loss / fragmentationRunoff of sediments / increased suspended sediment load to
surface waterDisturbance to wildlife and local communitiesIncreased demand for local water resourcesSpills of fuels and other contaminantsIncreased colonization due to road developmentSpecies loss due to hunting
Site preparation / mineral extraction
Mine construction (vegetation removal, stripping of soils)
Mine infrastructure development (power lines, roads, etc.)
Construction of plants, offices, buildingsMine camp constructionCreation of waste rock pilesCreation of low- and high-grade ore
stockpilesBlasting to release oresTransport of ore to crushers for
processing
Habitat loss / fragmentationChemical contamination of surface and ground watersDeclining species populationsToxicity impacts to organisms (terrestrial and aquatic plants
and animals)Altered landscapesIncreased demand for water resourcesIncreased demand for electrical powerIncreased erosion and siltationAltered patterns of drainage and runoffDust / fumes from explosivesIncreased colonization due to road developmentSpecies loss due to hunting
Processing / smelting
Milling / grinding oreChemical leaching / concentration of oreSmelting / refining ore
Discharge of chemicals and other wastes to surface watersEmissions of sulphur dioxide and heavy metalsIncreased demand for electrical power
Transport to final markets
Packaging / loading of final productTransport of product
Noise disturbanceDust / fumes from stockpiles
Mine closure / post-operation
Reseeding / revegetationRe-countouring waste piles / pit wallsFencing dangerous areasMonitoring seepage
Persistent contaminants in surface and groundwatersExpensive, long-term water treatmentPersistent toxicity to organismsLoss of original vegetation / biodiversityAbandoned pits / shafts that pose hazards and health risks
to humansWindborne dust
Source: Miranda et al. (1998, 2003); Ashton et al. (2002)

51Analysis of Key Drivers of Deforestation and Forest Degradation in the Philippines Analysis of Key Drivers of Deforestation and Forest Degradation in the Philippines
RA 7076, an Act creating a People’s Small-Scale Mining Program of 1991 was declared to promote, develop, protect and rationalize viable small-scale mining activities in order to generate more employment opportunities and provide equitable sharing of the nation’s wealth and natural resources.
Under this law, a People’s Mining Program is established and implemented by the DENR Secretary through the Board which is authorized to declare and set aside people’s small-scale mining areas in sites onshore suitable for small-scale mining and giving priority to areas already occupied and actively mined by small scale miners before August 1, 1987.
Mining is one of the priority investments that the previous administration has promoted through such incentives as: five-year income tax holiday; tax and duty-free capital equipment imports; value-added tax exemptions; income tax deductions where operations are posting losses; accelerated depreciation; and guarantees of the right of repatriation of the entire profits of the investment as well as freedom from expropriation (RA 7942, Philippine Mining Act). The present government has reiterated the rights of mining companies by exempting them from the logging moratorium under EO 23 and allows them to cut trees for construction of roads and mining facilities as well as for strip and open mining activities.
Despite the recent policy reforms, government still has to address past mining legacies such as abandoned mines that continue to pose environmental and health hazards. Mining companies have to be compelled to take responsibility for cleaning up their environmental mess. Over the years and prior to the enactment of the Mining Act, government has had little success in the areas of environmental monitoring, mined site rehabilitation and getting pollution compensation from mining companies.
Among the examples of the adverse environmental impacts of mining is the Marcopper Mine in Marinduque Island where in 1996, acidic tailings were released to the Boac River when the plug at the bottom of the copper pit failed. The river was later declared by a UN team that investigated it as ‘biologically dead’. Another case reported was the 2005 cyanide spills from the Lafayette Mine in Rapu Rapu, Albay contaminating the coastal waters (Ingelson et al., 2009). As of 2003, at least 16 mine tailing dam failures were reported in the preceding 20 years and about 800 abandoned mine sites that have not been cleaned up (Asio, 2011). The DENR has identified the so-called “Dirty Seven” mining companies, one of which is the Bagacay Mines in Samar Island, which continue to pollute and cause severe environmental impacts since it stopped operating more than thirty years ago (Anda, 2011). In more recent years, various media sources reported that several landslides in the Compostela Valley have claimed the lives of miners buried under the mud and boulders washed down by heavy rains.
Habitat destruction, leading to the loss of biodiversity through the removal of vegetation (deforestation), is said to be one of the most adverse impacts of mining. Miranda et al. (2003) found that “in the Philippines, more than half (56 percent) of all exploration areas and mining leases overlap with areas of high ecological vulnerability. Six percent of mining leases overlap with protected areas, whereas, according to the NIPAS Act, there should be no mining in protected areas; more than one quarter of approved mining leases and 8 percent of exploration areas overlap with intact forests, covering an area of approximately 60,000 hectares.” The terms of mineral agreements provide that “protected areas and intact forests are excised from mineral contracts.” However, the “lack of clear definition of protected area boundaries and uncertainty regarding the definition of intact forests provided the opportunity for land use conflicts between mining and conservation uses.” The study also found that “8 percent of approved mining contracts and exploration areas overlap with proclaimed watersheds [encompass forests that are protected to maintain water quality and yield],” in which mining is supposedly prohibited.
Anda (2011) mentioned that Mount Mantalingahan in Palawan was declared as a National Park in 2009 and is classified as a “protected landscape” covering 120,457 hectares. However, records show that the mining companies of MacroAsia, Ipilan Nickel Mining, and Lebach Mining have applied for local permits to operate in the area which overlap with the protected area. Anda cites a review by the Palawan Council for Sustainable Development, which implements the Strategic Environmental Plan (SEP) Law (RA 7611), showing that the area (except for 91 hectares) leased to MacroAsia falls under the “core and restricted zones” protected under the SEP zoning system. The mining company says “its legal right to utilize the lease area under the Mining Act has precedence over local laws, including the proclamation of Mantalingahan as a protected area.”

52 Analysis of Key Drivers of Deforestation and Forest Degradation in the Philippines
Miranda et al. further cited that “mining poses significant challenges on small islands due to the lack of safe and acceptable waste disposal sites, as well as the inherent fragility of these unique terrestrial and aquatic systems.” Anda (2011) identified the islands of Dinagat, Rapurapu, Samar and Palawan as “examples of island ecosystems having a rich natural resource base and biodiversity” and thus are highly vulnerable to the impacts of mining and the resultant deforestation.
The Cordillera People’s Alliance (CPA, 2007) has documented the ill effects of commercial mining in Benguet Province. Among these are: land destruction (through excavations); water subsidence (due to underground block-caving operations); water loss (deep mining tunnels and drainage tunnels disrupting groundwater paths); felling of timber to shore up underground tunnels resulting to denuded watersheds and aggravating water loss; siltation of rivers leading to flooding downstream; pollution of water and soil by the release of toxic mine tailings from the tailings dams; acid mine drainage from abandoned mine sites; loss of biodiversity and food security (disruption and damage to ecosystems leading to breakdown in the food web); serious health problems; and dislocation of indigenous peoples from their ancestral lands and traditional livelihoods, which again will drive deforestation and forest degradation once these displaced people migrate to other forest areas, where they start clearing forest for shifting agriculture. Although the Philippine Mining Act of 1995 requires the establishment of a rehabilitation fund and a final mining rehabilitation plan, key informants and FGD participants in Palawan and Quezon said that they have not heard of any successful rehabilitation of mined sites in the country. This is exemplified by the 800 abandoned mine sites in the country that have not been cleaned up nor rehabilitated. According to some respondents, the compliance reforestation by most mining companies is often done in open and degraded forest areas within the lease area but not in mined sites where mortality is high for seedlings planted in soils stripped of nutrients by mining.
Mining will continue to be a major driver of deforestation and ecosystem degradation unless government addresses the issue of conflicts between natural resources conservation and mining; effective environmental monitoring; law enforcement with regard to environmental compliance and rehabilitation of mining areas; access to land and water resources; and equitable benefit sharing. The country also needs to map out the critical ecosystems that are highly vulnerable to the adverse impacts of mining and excise them from areas allocated for mining. There is also a need to address governance weaknesses to be able to regulate and implement responsible mining. The conflict remains regarding the feasibility of implementing REDD-plus projects in areas where mining is allowed or where illegal small-scale mining is occurring.
hydro-power dam construction
The impact of constructing dams is known globally and the Philippines has had much experience in the 1950s to the 1990s particularly with the Pantabangan, Ambuklao, Binga, San Roque and other hydro-power and irrigation dams. Globally, the construction of dams has caused the disappearance of many ecosystems and drastic modification of others with the loss of forests and important species of flora and fauna bound to forest habitats. Human populations were seriously affected with many of them resettled in other forests where they are forced to clear the land for agricultural crops, having lost their traditional livelihoods. Thus, not only the forests covered by the reservoirs are lost but also the “resettlement forests” that are converted to farms by the displaced communities. Road building associated with dam construction also contributed to deforestation. Apart from the environmental impacts on forests and biodiversity, dam construction has also wrought health hazards and human rights violations through “forced resettlement” of people and in dealing with resistant and opposing stakeholders (WRM, 2003).
Proponents claim that hydroelectric power generated by dams is cleaner (or emitting less greenhouse gases) than fossil fuel but some studies show otherwise, if there is a total accounting that includes the negative side effects of dam construction. Fearnside (cited in WRM, 2003) calculated the impact of flooding the forests in two dams in Brazil. He found that six years after the dams were filled, one reservoir (Tucurui) had emitted 9.45 million tons of CO2 and 90,000 tons of methane while the other reservoir (Balbina) had emitted 23.75 million tons of CO2 and 140,000 tons of methane. Fearnside concluded that the Tucurui dam had “60 percent as much impact on global warming as a coal-powered plant” generating similar amount of electiricty. The Balbina dam had “26 times more impact on global warming than that of an equivalent coal-fired power station” (WRM, 2003).
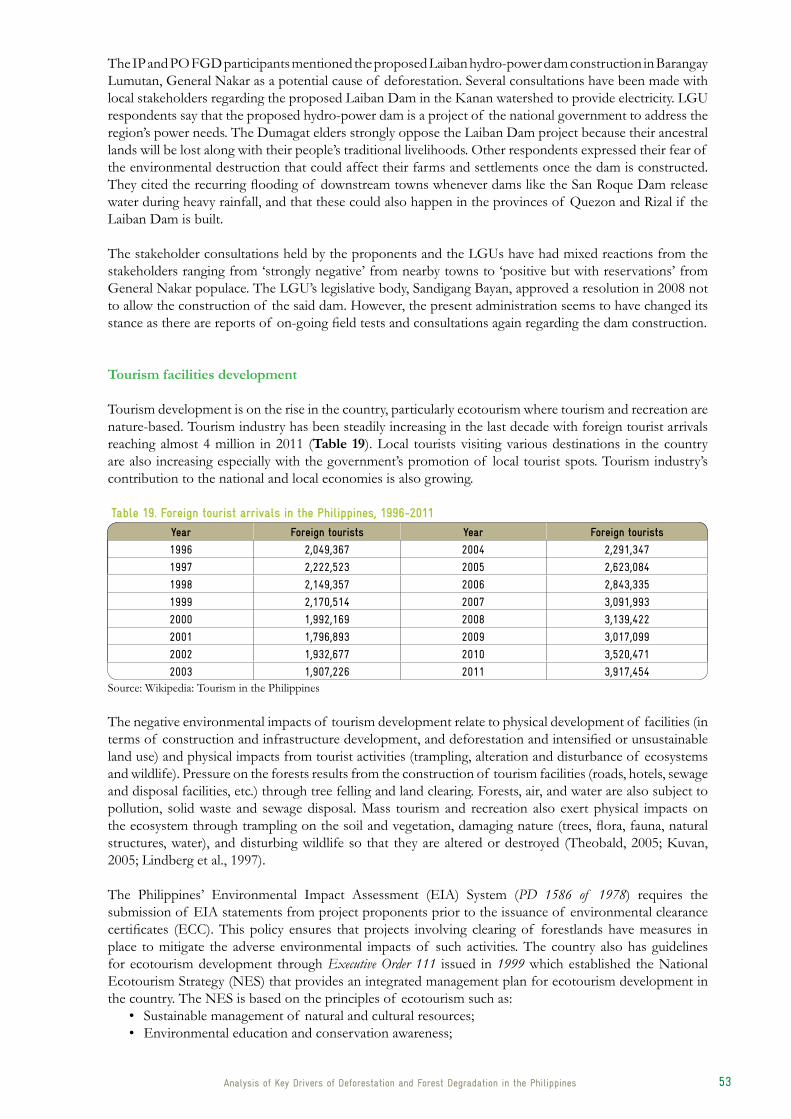
53Analysis of Key Drivers of Deforestation and Forest Degradation in the Philippines Analysis of Key Drivers of Deforestation and Forest Degradation in the Philippines
The IP and PO FGD participants mentioned the proposed Laiban hydro-power dam construction in Barangay Lumutan, General Nakar as a potential cause of deforestation. Several consultations have been made with local stakeholders regarding the proposed Laiban Dam in the Kanan watershed to provide electricity. LGU respondents say that the proposed hydro-power dam is a project of the national government to address the region’s power needs. The Dumagat elders strongly oppose the Laiban Dam project because their ancestral lands will be lost along with their people’s traditional livelihoods. Other respondents expressed their fear of the environmental destruction that could affect their farms and settlements once the dam is constructed. They cited the recurring flooding of downstream towns whenever dams like the San Roque Dam release water during heavy rainfall, and that these could also happen in the provinces of Quezon and Rizal if the Laiban Dam is built.
The stakeholder consultations held by the proponents and the LGUs have had mixed reactions from the stakeholders ranging from ‘strongly negative’ from nearby towns to ‘positive but with reservations’ from General Nakar populace. The LGU’s legislative body, Sandigang Bayan, approved a resolution in 2008 not to allow the construction of the said dam. However, the present administration seems to have changed its stance as there are reports of on-going field tests and consultations again regarding the dam construction.
Tourism facilities development
Tourism development is on the rise in the country, particularly ecotourism where tourism and recreation are nature-based. Tourism industry has been steadily increasing in the last decade with foreign tourist arrivals reaching almost 4 million in 2011 (Table 19). Local tourists visiting various destinations in the country are also increasing especially with the government’s promotion of local tourist spots. Tourism industry’s contribution to the national and local economies is also growing.
Table 19. Foreign tourist arrivals in the Philippines, 1996-2011
year Foreign tourists year Foreign tourists
1996 2,049,367 2004 2,291,347
1997 2,222,523 2005 2,623,084
1998 2,149,357 2006 2,843,335
1999 2,170,514 2007 3,091,993
2000 1,992,169 2008 3,139,422
2001 1,796,893 2009 3,017,099
2002 1,932,677 2010 3,520,471
2003 1,907,226 2011 3,917,454Source: Wikipedia: Tourism in the Philippines
The negative environmental impacts of tourism development relate to physical development of facilities (in terms of construction and infrastructure development, and deforestation and intensified or unsustainable land use) and physical impacts from tourist activities (trampling, alteration and disturbance of ecosystems and wildlife). Pressure on the forests results from the construction of tourism facilities (roads, hotels, sewage and disposal facilities, etc.) through tree felling and land clearing. Forests, air, and water are also subject to pollution, solid waste and sewage disposal. Mass tourism and recreation also exert physical impacts on the ecosystem through trampling on the soil and vegetation, damaging nature (trees, flora, fauna, natural structures, water), and disturbing wildlife so that they are altered or destroyed (Theobald, 2005; Kuvan, 2005; Lindberg et al., 1997).
The Philippines’ Environmental Impact Assessment (EIA) System (PD 1586 of 1978) requires the submission of EIA statements from project proponents prior to the issuance of environmental clearance certificates (ECC). This policy ensures that projects involving clearing of forestlands have measures in place to mitigate the adverse environmental impacts of such activities. The country also has guidelines for ecotourism development through Executive Order 111 issued in 1999 which established the National Ecotourism Strategy (NES) that provides an integrated management plan for ecotourism development in the country. The NES is based on the principles of ecotourism such as:
• Sustainable management of natural and cultural resources;• Environmental education and conservation awareness;

54 Analysis of Key Drivers of Deforestation and Forest Degradation in the Philippines
• Empowerment of local communities; • Development of products that will satisfy visitor needs; and• Position of the Philippines as a globally competitive ecotourism destination.
Tourism development, if properly planned and implemented, contributes to environmental conservation through financial contributions (park entrance fees, user fees, income taxes, taxes on sales or rental of recreational facilities, license fees for hunting and fishing), environmental awareness raising, improved environmental management and planning (use of cleaner production techniques, green building, energy-efficient and non-polluting materials, sewage systems and energy sources), and protection and preservation (www.grdc.org).
The number of tourism facilities such as ecotourism trails, ziplines, and other recreational facilities is increasing in many areas of the country, particularly in forest and protected areas. Several sectors are concerned that mass ecotourism development could have long term adverse environmental impacts especially if the number of tourists exceed the carrying capacity of the ecosystem.
The respondents in Mount Malindang expressed concern on a tourism development project in Tangub City, Misamis Occidental. The site is located on a sloping area within the buffer zone inside the Mount Malindang Range Natural Park. Tourism facilities being built during the time this study was conducted, include access road, parking area, restaurant and inn, view deck, and a zip line crossing a river in between two hillsides. The builders were able to get permits from the DENR, PAMB, and LGU for the construction phase. The key informants’ concerns lay with the location of the tourism project within the protected area and the environmental impacts on the forest ecosystem. The owners (with political connections) have asked the Protected Area Superintendent (PASU) to survey the area so that the lot can be excised from the protected area since it is within the buffer zone anyway.
Plans in Southern Leyte to expand tourism include caves exploration and construction of a zip line. However, the Southern-Leyte government aims at environmental friendly eco-tourism development that is compatible with forest conservation.
bIoPhysICAL FACTors
Natural causes such as typhoons, landslides, floods, drought and earthquakes as well as forest fires and climate change are predisposing factors to deforestation and forest degradation. The Philippines lies within the Pacific ring of fire and typhoon belt, hence the islands are vulnerable to earthquakes and typhoons. Figure 7 shows the climatic types and frequency of typhoon path for the different regions of the country. General Nakar in Quezon province has 16% frequency of typhoons, Southern Leyte is within the 19% typhoon frequency grid while the municipalities of Narra and Quezon in Palawan and the Mount Malindang area are within the less frequently visited grid (7%). Floods and landslides are recurring situations in the Quezon and Southern Leyte provinces.
The frequent typhoons accompanied by floods and landslides are recurring events in many areas of the country. Heavy rains trigger flashfloods and landslides that bring down logs and other vegetation along with houses, livestock and claim human lives as well. Respondents understand that natural causes such as typhoons and landslides can be destructive to forests and the whole ecosystem but they also agree that irresponsible harvesting of timber and non-timber forest products as well as land clearing for agriculture (specially in hilly and sloping areas) also exert pressure on the forests.
Regular burning of kaingins and accidental fires that spread through the forests, as experienced in Palawan and Southern Leyte, have deforested large tracts of forestlands especially during the drought years. Fire-damaged forests, however, can recover through time because of the tropical climate where rainy season aids in vegetation regrowth. However, the threat of widespread forest fires remains as long as people are able to access forests without proper control.

55Analysis of Key Drivers of Deforestation and Forest Degradation in the Philippines Analysis of Key Drivers of Deforestation and Forest Degradation in the Philippines
80
60
180
very
Fre
QueN
T25
%ve
ry F
reQu
eNT
32%
FreQ
ueNT
16%
FreQ
ueNT
19%
Less
Fre
QueN
T7%
rAre
1%
FreQ
ueNC
y oF
TyP
hooN
PAT
h
160
140
120
100
Climate Map of the Philippines based on the Modified Coronas Classification
Figure 7. Climate map of the Philippines showing the climatic types and percentage frequency of typhoons Source: PAG-ASA cited in General Nakar Socio-Economic Profile, 2009
Type I
Type II
Type III
Type Iv


5.0 Indirect drivers of deforestationand forest degradation

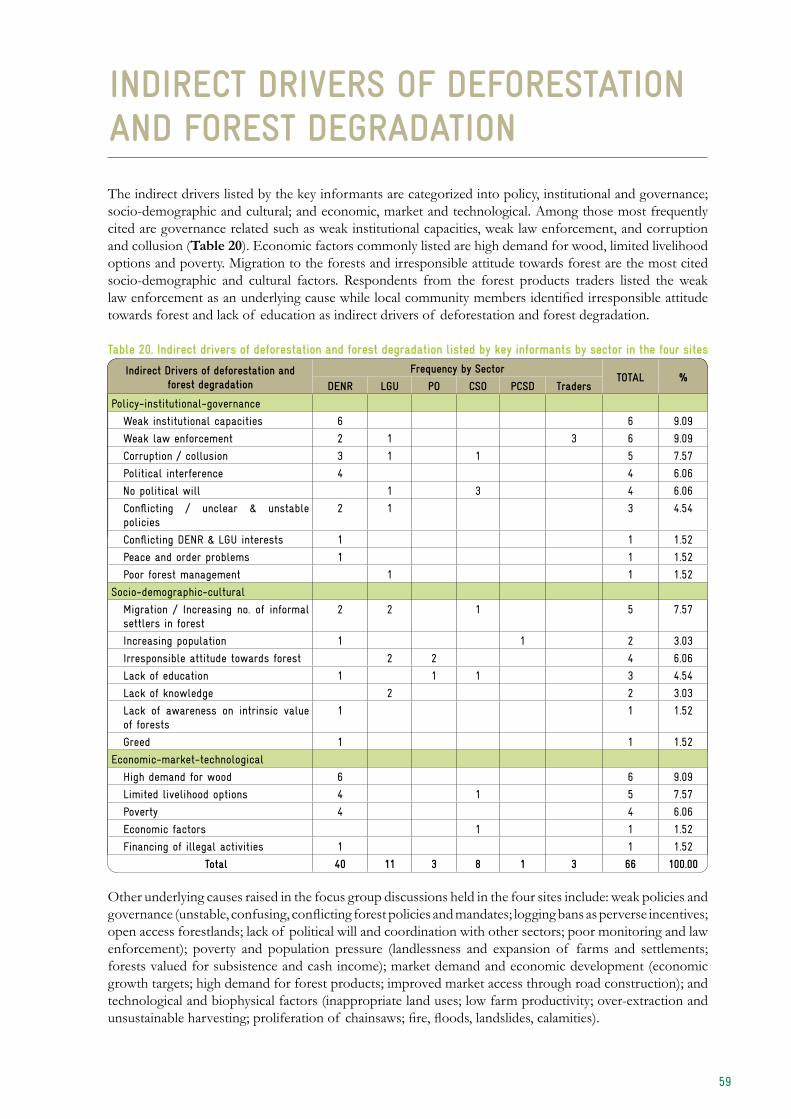
59
INdIreCT drIvers oF deForesTATIoNANd ForesT degrAdATIoN
The indirect drivers listed by the key informants are categorized into policy, institutional and governance; socio-demographic and cultural; and economic, market and technological. Among those most frequently cited are governance related such as weak institutional capacities, weak law enforcement, and corruption and collusion (Table 20). Economic factors commonly listed are high demand for wood, limited livelihood options and poverty. Migration to the forests and irresponsible attitude towards forest are the most cited socio-demographic and cultural factors. Respondents from the forest products traders listed the weak law enforcement as an underlying cause while local community members identified irresponsible attitude towards forest and lack of education as indirect drivers of deforestation and forest degradation.
Table 20. Indirect drivers of deforestation and forest degradation listed by key informants by sector in the four sites
Indirect drivers of deforestation and forest degradation
Frequency by sectorToTAL %
deNr Lgu Po Cso PCsd Traders
Policy-institutional-governance
Weak institutional capacities 6 6 9.09
Weak law enforcement 2 1 3 6 9.09
Corruption / collusion 3 1 1 5 7.57
Political interference 4 4 6.06
No political will 1 3 4 6.06
Conflicting / unclear & unstable policies
2 1 3 4.54
Conflicting DENR & LGU interests 1 1 1.52
Peace and order problems 1 1 1.52
Poor forest management 1 1 1.52
Socio-demographic-cultural
Migration / Increasing no. of informal settlers in forest
2 2 1 5 7.57
Increasing population 1 1 2 3.03
Irresponsible attitude towards forest 2 2 4 6.06
Lack of education 1 1 1 3 4.54
Lack of knowledge 2 2 3.03
Lack of awareness on intrinsic value of forests
1 1 1.52
Greed 1 1 1.52
Economic-market-technological
High demand for wood 6 6 9.09
Limited livelihood options 4 1 5 7.57
Poverty 4 4 6.06
Economic factors 1 1 1.52
Financing of illegal activities 1 1 1.52
Total 40 11 3 8 1 3 66 100.00
Other underlying causes raised in the focus group discussions held in the four sites include: weak policies and governance (unstable, confusing, conflicting forest policies and mandates; logging bans as perverse incentives; open access forestlands; lack of political will and coordination with other sectors; poor monitoring and law enforcement); poverty and population pressure (landlessness and expansion of farms and settlements; forests valued for subsistence and cash income); market demand and economic development (economic growth targets; high demand for forest products; improved market access through road construction); and technological and biophysical factors (inappropriate land uses; low farm productivity; over-extraction and unsustainable harvesting; proliferation of chainsaws; fire, floods, landslides, calamities).

60 Analysis of Key Drivers of Deforestation and Forest Degradation in the Philippines
PoLICy, INsTITuTIoNAL ANd goverNANCe FACTors
Forestry policies in the past were geared more towards centralized management, supporting corporate tenure holders. Because of this, other stakeholders rarely participated in forest protection, conservation and development activities. This also resulted to processes which are not transparent and as such, forestry staff did not feel a sense of accountability for their actions and decisions. This situation opened more opportunities for corruption and collusion among government personnel and forest law violators, such that even with strict provisions against illegal logging in existing laws (such as PD 705 as amended by PD 1559), rampant illegal cutting activities continued.
The 1987 constitution re-oriented natural resources management policies towards encouraging private sector participation in forest management by replacing the lease system of disposing forest lands with production sharing, co-production sharing and joint venture arrangements. In 1991, the Local Government Code was also passed which devolved certain forest management functions to LGUs. Subsequently, a number of major forestry policies were signed allowing other sectors to participate in forest protection, development and rehabilitation to ensure sustainable management of forest resources. In 1992 the NIPAS Act was signed establishing an integrated protected areas system in the country where different stakeholders particularly LGUs were given greater role in the management of protected areas through membership in the Protected Areas Management Board (PAMB). This was followed by the issuance of Executive Order 263 in 1995 which adopted community based forest management (CBFM) as the national strategy in the management of forest resources. In 1997, the indigenous peoples rights act (IPRA) was passed recognizing the rights of indigenous peoples to their ancestral lands. EO 318 was also signed in 2004 promoting sustainable forest management in the Philippines.
While the intention of these policies was all geared towards sustainable management of forest resources, in reality they have added to confusion in forest management. With unclear and uncoordinated provisions of their implementing rules and regulations, these policies have led to overlapping land uses / tenure instruments. For instance, forestlands which had been allocated to local communities under the CBFM program are sometimes proclaimed as protected areas, issued with certificate of ancestral domain title or covered with mining permits. This has negated the original intent of fostering multi-sectoral collaboration and instead created local conflicts which only hastened forest degradation and deforestation as different stakeholders try to outsmart one another in laying their stakes and harvesting whatever resources are left in the area.
In the Philippines, logging ban policies whether issued through local ordinances, enacted through Congress, or through an Executive Order, are most often a political response to natural calamities and disasters blamed on deforestation. The most recent issuance is the February 2011 Executive Order (EO) 23 declaring an indefinite logging moratorium on the cutting and harvesting of timber in the natural and residual forests of the entire country. It prohibits the DENR from issuing logging contracts / agreements, issuing / renewing tree cutting permits except for clearing of road right of way by DPWH, site preparation for tree plantations, silvicultural treatments and similar activities. The law also directs the DENR to close and not allow the operation of sawmills, veneer plants and other wood processing plants if they fail to present proof of sustainable sources of legally cut logs. EO 23 essentially allows only the harvesting of plantation-grown trees and NTFPs at the moment.
The impacts of EO 23 declaring a logging moratorium in all natural and residual forests is yet to be seen. But the government has to look back on the experiences in the past where closure of operations of timber license agreement holders had resulted to ‘de facto’ open access of forestlands which led to more migration into the forests and forestlands and their eventual degradation and deforestation. The numerous logging ban and moratorium issuance have become perverse incentives for illegal logging; they have failed to stop deforestation and forest degradation in the country.
An FAO study on the impact and effectiveness of logging bans in natural forests in Asia-Pacific (Durst et al., 2001; Guiang, 2001; Durst, 2008) found that logging restrictions, though intended to halt deforestation, more often led to negative impacts. The study mentions the Philippines’ total ban on logging in old-growth forests in the 1990s that resulted into intensified harvesting in secondary forests thus ‘diminishing the opportunities for these areas to rehabilitate and mature into high-quality stands’. Logging bans in many

61Analysis of Key Drivers of Deforestation and Forest Degradation in the Philippines Analysis of Key Drivers of Deforestation and Forest Degradation in the Philippines
areas ‘shifted logging into the illegal sector, so that logging activities often shift from poorly regulated to being totally unregulated’. Logging bans also failed to encourage plantation development; displaced a number of logging workers unable to find employment elsewhere; and exacerbated deforestation through slash-and-burn agriculture and expansion of permanent farms. The study concludes that logging bans can work only when these policies are able to address the adverse impacts (wood scarcity, loss of employment, etc.) through adequate support and resources, preparation for new policy implementation, and safety nets, among other conditions.
The creation of an anti-illegal logging task force under EO 23 has resulted in the seizure of illegally transported forest products. Some of the notorious areas include CARAGA region where P14.9M worth of illegal logs and flitches were seized by government operatives (Najarro for pia.gov.ph, March 22, 2012); Bicol Region (Arguelles for PDI, March 26, 2012); General Nakar in Quezon Province (Manio, 2011 for ABS-CBN News). Cebu province is reportedly the top destination of illegal logs from Mindanao with more than P13M worth of illegal forest products apprehended in 2011 (Mongaya for PDI, March 19, 2012). Reports from the DENR show that EO 23 was able to drastically reduce the number of hotspot Provinces from 51 down to 12 and from 197 hotspot Municipalities to only 31. Confiscated illegal forest products totalled 19.3 million bd.ft. from July 2010 to September 2012 and 546 cases filed with 72 convicted persons (DENR Report 2012).
Current efforts of the anti-illegal logging task force and of past similar bodies (multi-sectoral forest protection councils) exposes where the real problem lies: that of protecting the forests where illegal logging occurs. DENR employs about 4,000 forest guards (mostly aging between 45-60 years old) to protect the country’s 15 million ha forest lands, with each forest guard in charge of 2,500-4,000 ha while the ideal ratio is for 1:1,500-2,000 ha (Bugayong, 2006). Many DENR field offices do not have adequate resources (legally and technically trained staff, all-terrain vehicles, telecommunication and database systems, etc.) and capacity to patrol and defend large tracts of forestlands.
But controlling the resource is not the only solution. There has to be also a control of the demand side. That fact that most logs are transported for processing, e.g. in Cebu, shows, that there is a need to involve the downstream value chain in monitoring of forest product sourcing. DENR officials have already outlined the need to establish forest certification systems with a chain-of-custody approach, but so far there is no move to concretely implement these plans.
Institutional weaknesses (lack of human, technical, financial capacities) hamper most government regulatory bodies from effectively enforcing forestry laws (Mayo-Anda, 2011; Wallace, 2001). Corruption and collusion are rampant, allowing many illegal loggers and traders to transport their products (sometimes through ‘recycled permits’) to the market after paying bribe money to the government personnel issuing the permits and those manning the checkpoints. lack of political will to enforce forestry policies and to curb corruption has also been cited as governance weaknesses. The conflicting mandates of national and local government agencies as well as political alliances constrain the coordination and collaborative efforts among various agencies and sectors in addressing deforestation and forest degradation.
Checkpoints, colloquially termed ‘cashpoints’, are found along highways with several agencies manning more than one in every town. A key informant narrated how DENR field personnel used to patrol the forests during the height of the commercial logging operations alongside logging company foresters complete with vehicles, arms, and monitoring equipment. However, after the logging companies pulled out, most government forest guards seldom visited the forests especially when the leftists and informal settlers gained access to most forested areas for fear of their lives and the lack of forest protection equipment, vehicles and budget. Forest protection and monitoring was thus concentrated on the checkpoints along the roads. Through the years, the checkpoints were manned not only the DENR but by other agencies including the PNP, army, military, traffic enforcers, LGU-Bantay Gubat / Kalikasan, etc. The checkpoints have become notorious as ‘cashpoints’ where conveyances carrying all types of products passing through are expected to give cash (called ‘SOP’ or standard operating procedure) ostensibly for the snacks of the people manning the checkpoints. Nowadays, transportation of goods includes ‘SOP’ among the costs.

62 Analysis of Key Drivers of Deforestation and Forest Degradation in the Philippines
soCIo-deMogrAPhIC ANd CuLTurAL FACTors
The respondents claim that demographic factors such as increasing population and upland migration are among the key drivers of deforestation, particularly in the conversion of forestlands to agriculture. This may have been true in the Philippines during the early decades of the 1900s where logged secondary forests were converted to agriculture by upland migrants but recent literature shows a decline in said activities in many parts of the globe.
Cruz et al. (1988) cited the early migration patterns in the country where people from the Visayas regions moved to the frontier lands of Mindanao after the war up to 1960 and this was followed by the wave of migration towards the urban areas with sizeable movements from Metropolitan Manila to the upland areas of Southern Tagalog and Central Luzon in the 1970s. Cruz et al. (1986) show the net upland migration rates in the early decades (Table 21) increasing from 4.2% in 1960-1970 to 9.4% in the 1975-1980 and 14.5% during 1980-1985.
Table 21. Net upland migrant population in the Philippines, 1960-1985
year upland rural upland urban Total upland Migration rate (%)
1960-1970 384,225 83,402 467,627 4.2
1970-1975 275,293 152,101 427,394 3.4
1975-1980 788,513 575,039 1,363,552 9.4
1980-1985 1,760,280 785,330 2,545,610 14.5 Source: Cruz et al. (1992) cited by Omura (2006)
Cruz et al. (1988) noted that population density in 1948 was 39 persons per square kilometre (km2), increased to 74 persons per km2 in 1970 and rose sharply to 119 persons per km2 in 1988. Among the determinants of early upland migration were: availability of land in upland (areas with slopes 18 percent or higher) areas with low population density; presence of relatives and friends (with ethnic similarity) in destination areas; low agricultural productivity (income and employment) in the place of origin; and prospects of better life and good economic conditions at the place of destination.
Kummer (1992a) argues that “population pressure per se is not a major proximate cause of deforestation” but forest loss is the “result of commercial logging and the expansion of small-scale agriculture.” He emphasizes that upland migration and deforestation are caused by the “failure of macroeconomic policies to provide employment and eliminate poverty in the lowlands.” He claims that studies have not shown that population pressure (total population, population density, physiological density, percentage increase in population, and absolute increase in population) is a direct cause of deforestation, rather, “forces outside the area are causing people to migrate” to the uplands (Kummer and Sham, 1994).
The respondents in the four study sites who mentioned that population pressure and upland migration are still happening in forest areas, contend that the number of new migrants has declined substantially from the 1980s. The main reason stated is that there are fewer unclaimed areas in the forestlands that are accessible and so most of the more recently cleared new kaingins are located near the edges of remote forestlands. For the Quezon case study, new kaingins and settlers, however, have started to populate both sides of the Marikina-Infanta Road that was recently built inside a protected area, which reinforces the earlier observations that road building in previously inaccessible forests attract migrants who slash and burn patches of forests for agriculture and settlement. The poor enforcement of forestry laws and forest protection also facilitate access to forests and upland migration.
Other socio-cultural factors identified by the interviewees that indirectly cause deforestation and forest degradation include: irresponsible attitude towards forest; lack of education; lack of knowledge; lack of awareness on intrinsic value of forests; and greed. The lack of knowledge and awareness of the ecological benefits of protecting and sustainably managing forests is widespread among migrants who view the forests as inexhaustible and thus are there for them to utilize for subsistence or as supplementary sources of income. They generally do not give any thoughts to the next generations’ rights to the same benefits that forests provide because their immediate concern is to provide for their family’s daily needs. Others become

63Analysis of Key Drivers of Deforestation and Forest Degradation in the Philippines Analysis of Key Drivers of Deforestation and Forest Degradation in the Philippines
greedy for the income from illegal harvesting of forest products due to the continuing demand for these products and the low income from agricultural farming. Many upland migrants especially in remote areas have limited access to educational facilities and IEC programs on the importance of forests which further prevents them from properly sustainably using these resources.
There are indigenous traditional forest management practices handed down by generations of indigenous people that have sustained them through the years. But the influx of lowland migrants in many forest uplands pushed the IPs further back to the inland forests when their fallow kaingins have been taken over. IPs now compete with migrants for the forest resources in their ancestral lands forcing the IPs to move to the interior forests as their former traditional livelihoods are lost due to unsustainable practices of migrants.
eCoNoMIC, MArkeT ANd TeChNoLogICAL FACTors
Philippine forestry statistics show that log production (from logging concessions and tree plantations) in the country has been declining from the 1980s to the present with only 815,000 cu meters in 2008 (Figure 9). These data do not include the imported and illegally sourced wood that form part of national consumption. While fuelwood production (as reported in the PFS) has been steady throughout the years, charcoal production has been increasing from 2005 onwards. Using national estimates of fuelwood consumption of 20-30 milliom mt and charcoal wood equivalent of 12-24 million mt, these indicate a large gap between wood supply and demand at the national level, with varying degrees at the local levels.
The Master Plan for Forest Development (MPFD, 2003) estimates that the country needs about 600,000 hectares of tree plantations to sustain its annual demand for wood. About 50% of the country’s wood requirements come from logging concessions and tree plantations, another 25% is imported from other countries, and the remaining 25% is coming from so-called ‘informal’ sources.
Illegal logging and timber poaching (making up the informal sources of wood) are largely driven by market demand (Wallace, 2001), increasing scarcity of legal natural timber sources and the higher price of imported wood. It is not uncommon for traders and wood-using companies to finance the illegal activities of local tree cutters as reported by respondents in the Quezon, Southern Leyte, and Mount Malindang study sites. Financiers give advance payment (30 to 50%) to the local tree cutters for a certain volume of lumber with the remaining amount paid after delivery of the product. Many of the illegal tree cutters have had previous experience working in logging concessions that used to operate in the area. The scarcity or absence of local and related employment opportunities (where they can use their logging skills) and poverty forced many of them to engage in illicit lumber trade. Alternative work, e.g. plantation harvesting under CBFM, would provide employment opportunities where they could apply their skills, legally.
Markets such as sawmills and wood processors contribute to continued illegal logging and timber poaching. With the indefinite logging moratorium many mini-sawmill operators as well as sash factories and furniture makers, operating for many decades in General Nakar and its neighboring towns of Infanta and Real, are forced to buy illegally cut wood because of scarcity and high prices of both legally sourced and imported wood. One FGD participant reported that up until the logging moratorium in 2011, there were 56 mini-sawmills using bandsaws along the Agos River mainly to process the logs and flitches brought down from the forests to this area. It is a known exit point for logs and flitches from the forests and where sash, lumber and other wood products are collected and transported to the markets. The DENR however, said that all sawmills in General Nakar have been padlocked since the proclamation of EO 23 in 2011 and all legal sawmills have stopped operating. Other respondents, though, reported that at the time of the study, there are small bandsaw operators still operating usually at night time. It was also reported that some of these mini-sawmill owners are financing the illegal cutting of trees by the locals because they have orders of wood to fill and demand for premium wood is high.
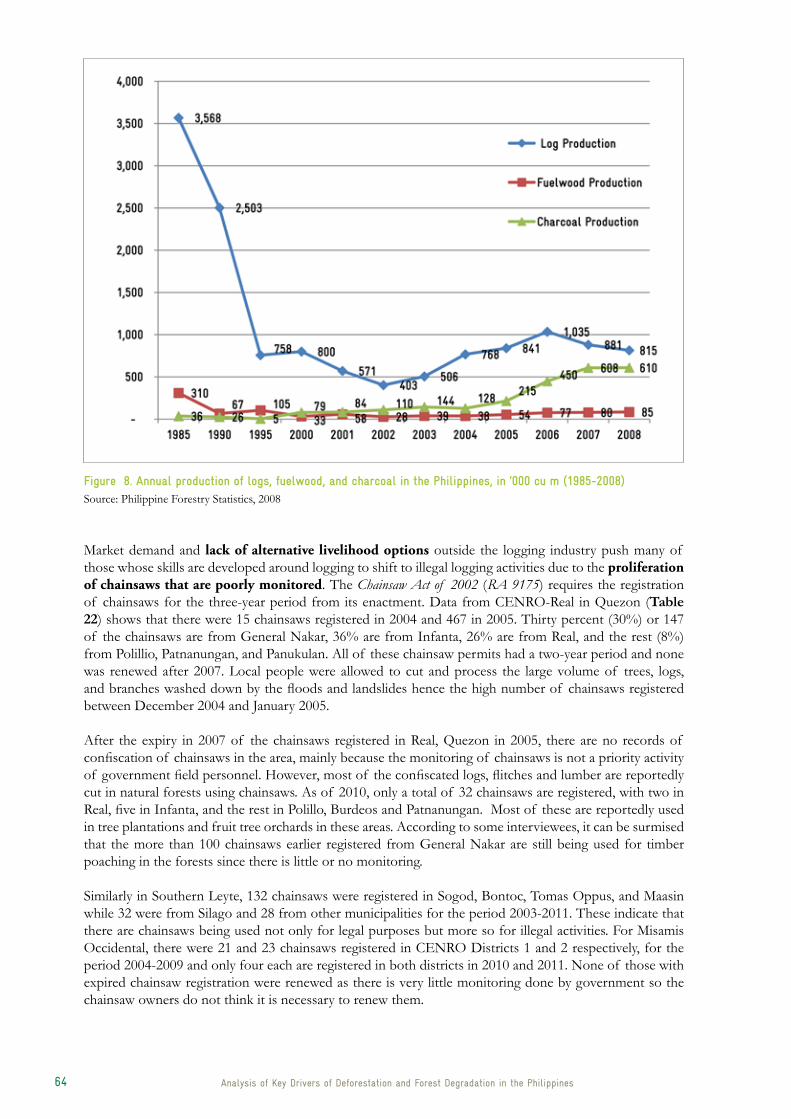
64 Analysis of Key Drivers of Deforestation and Forest Degradation in the Philippines
Figure 8. Annual production of logs, fuelwood, and charcoal in the Philippines, in ‘000 cu m (1985-2008) Source: Philippine Forestry Statistics, 2008
Market demand and lack of alternative livelihood options outside the logging industry push many of those whose skills are developed around logging to shift to illegal logging activities due to the proliferation of chainsaws that are poorly monitored. The Chainsaw Act of 2002 (RA 9175) requires the registration of chainsaws for the three-year period from its enactment. Data from CENRO-Real in Quezon (Table 22) shows that there were 15 chainsaws registered in 2004 and 467 in 2005. Thirty percent (30%) or 147 of the chainsaws are from General Nakar, 36% are from Infanta, 26% are from Real, and the rest (8%) from Polillio, Patnanungan, and Panukulan. All of these chainsaw permits had a two-year period and none was renewed after 2007. Local people were allowed to cut and process the large volume of trees, logs, and branches washed down by the floods and landslides hence the high number of chainsaws registered between December 2004 and January 2005.
After the expiry in 2007 of the chainsaws registered in Real, Quezon in 2005, there are no records of confiscation of chainsaws in the area, mainly because the monitoring of chainsaws is not a priority activity of government field personnel. However, most of the confiscated logs, flitches and lumber are reportedly cut in natural forests using chainsaws. As of 2010, only a total of 32 chainsaws are registered, with two in Real, five in Infanta, and the rest in Polillo, Burdeos and Patnanungan. Most of these are reportedly used in tree plantations and fruit tree orchards in these areas. According to some interviewees, it can be surmised that the more than 100 chainsaws earlier registered from General Nakar are still being used for timber poaching in the forests since there is little or no monitoring.
Similarly in Southern Leyte, 132 chainsaws were registered in Sogod, Bontoc, Tomas Oppus, and Maasin while 32 were from Silago and 28 from other municipalities for the period 2003-2011. These indicate that there are chainsaws being used not only for legal purposes but more so for illegal activities. For Misamis Occidental, there were 21 and 23 chainsaws registered in CENRO Districts 1 and 2 respectively, for the period 2004-2009 and only four each are registered in both districts in 2010 and 2011. None of those with expired chainsaw registration were renewed as there is very little monitoring done by government so the chainsaw owners do not think it is necessary to renew them.

65Analysis of Key Drivers of Deforestation and Forest Degradation in the Philippines Analysis of Key Drivers of Deforestation and Forest Degradation in the Philippines
Table 22. Number of registered chainsaws in real, Quezon, southern Leyte and Misamis occidental (2003-2011)
Place Number of registered chainsaws
CENRO Real, Quezon (2004-2005) (2010)
• Real 125 2
• Infanta 174 5
• General Nakar 145 -
• Polillo, Burdeos, Patnanungan 39 25
Misamis Occidental (2004-2009) (2010-2011)
• District 1 21 4
• District 2 23 4
Southern Leyte (2003-2011)
• Sogod, Bontoc, Tomas Oppus, Maasin 132
• Silago 32
• Other municipalities 28Source: DENR-CENRO Real, Quezon; DENR-CENRO San Juan and Silago, Southern Leyte; CENRO Oroquieta and Ozamis
The underlying causes of deforestation and forest degradation are inter-linked and often socio-demographic-cultural factors are enhanced by economic-market and technological forces as well as policy and governance weaknesses. Illegal logging, agricultural expansion, and other direct drivers of deforestation and forest degradation can not be eradicated if government is unable to address local community needs (alternative livelihood options, information and education, skills re-training), market demand (local wood consumption, wood-based industries), and policy / governance issues (institutional weaknesses, corruption, political interference, lack of political will and coordination, etc.).


6.0 relative importance of drivers of deforestation and forest degradation


69
reLATIve IMPorTANCe oF drIvers oF deForesTATIoN ANd ForesT degrAdATIoN
During the field visits, particularly in the conduct of KIIs and FGDs, the respondents were asked to give importance to the drivers of deforestation and forest degradation that they themselves identified in the form of a scale of 1 to 5 where 1 is the most important driver and 5 is the least important based on their local knowledge of what happened in their respective areas. In the analysis, the most important driver was given a weight of 5 while the least important was given a weight of 1 during the aggregation. Indicatively, the driver that got the most number of points was ranked as first, the next driver that got the second most number of points was ranked as second and so on. This procedure tried to capture the relative importance of each driver as perceived by the respondents themselves. Nevertheless, the study team treats this ranking as only indicative and serves as a guide in identifying priority interventions in terms of national policy reforms and some operational policy adjustments that can be adopted on each site.
rANkINg by key INForMANTs IN ALL sITes
Based on the results of KII in the four sites, kaingin-making was found to be the most important driver of deforestation as seen by the stakeholders (Table 23). The second most important driver is mining as greatly manifested in at least two sites: General Nakar and Palawan. This general perception is also reflective of people’s sentiment in these areas that is basically anti-mining. The third important driver is forest conversion into non-forest uses (i.e., road construction, settlement, conversion into built-up areas). For example, it has been observed in Southern Leyte that a portion of a CBFM project was proclaimed as resettlement area for landless community members from adjacent municipalities. This is seen as an important driver of deforestation whose underlying driver is a policy that was adopted by the government in 1975 (Presidential Proclamation 1497) that created the first settlement project in Eastern Visayas known as the Southern Leyte Settlement Project, that allowed clearing of some portions of the forestlands.
Table 23. kII ranking results of direct drivers of deforestation and forest degradation by stakeholder groups in the four sites
driversweighted Points
Total weighted score
Indicative rankg.Nakarn=60
s.Leyte n=88 Palawan n=39Mt. Malindang
n=22
deforestation
Kaingin making 136 51 152 83 422 1
Mining 56 7 77 0 140 2
Land use conversion 23 10 19 1 53 3
Settlement 0 0 19 0 19 4
Forest fire 0 8 7 0 15 5
Proposed dam 7 0 0 0 7
Oil palm expansion 0 0 15 0 15
Forest degradation
Logging (legal,illegal) 311 410 49 72 842 1
CC, calamities 30 200 0 6 236 2
Timber poaching 0 79 74 66 219 3
Charcoal making 122 6 56 6 190 4
Fuelwood gathering 11 43 0 6 60 5
NTFP gathering 20 0 0 0 20
Wildlife poaching 17 3 0 0 20
Infra / road construction 5 3 0 12 20
70 Analysis of Key Drivers of Deforestation and Forest Degradation in the Philippines
logging, whether legal or illegal, topped the list of important drivers of forest degradation as perceived in all sites. The general understanding of the participants that logging degrades the forests is a reflection of the prevailing practices of selective logging, and what they observe happens to the forests after logging. The second most important driver of degradation is natural calamities as aggravated by erratic climatic patterns (attributed to climate change). This observation is prominent in Southern Leyte and General Nakar. One can recall that these two sites suffered severe damages due to high rainfall intensity over a short period of time but preceding long rainfall periods in several occasions.
In 2004, the municipalities of Dingalan, Aurora, and Infanta and General Nakar in Quezon were cut off from the rest of Quezon due to severe flooding and landslides that toppled major bridges in these municipalities because of typhoons Unding and Violeta in 2004. In 2006, the municipality of St. Bernard of Southern Leyte particularly, Barangay Ginsaugon, lost around a thousand lives due to the collapse of half of the mountain and buried many people alive. These natural calamities are still fresh in people’s minds in these areas. The respondents claim that the heavy and prolonged rains and successive typhoons hitting these areas led to massive landslides and flash floods that carried down trees and logs on the way down to the villages, leaving patches of deforested areas in the uplands. . The water collected upstream was too heavy that it was able to uproot trees and plants in heavily forested areas and washed them downward. Local residents also claim that heavy landslides also occurred in areas that have been heavily logged over or converted from forest to other land uses. Hence, they say that flashfloods and landslides are not just caused naturally but are also due to anthropogenic activities, particularly kaingin making and illegal logging that continue to occur in their municipality’s forestlands. Flashfloods and landslides still occur in the area in recent years although the magnitude is less than the 2004 events in Quezon and the 2006 tragedy in Southern Leyte.
Timber poaching is the third most important driver of forest degradation in three sites (S. Leyte, Mt. Malindang and Palawan). As differentiated in this study, logging is large scale or commercial harvesting of timber from the natural forests covering large areas while timber poaching refers to cutting of timber on a per tree basis by teams or groups with the intention of utilizing the lumber for personal use or selling the product for livelihood.
Another prominent driver of degradation is charcoal making. This has been noted in all sites but is very prevalent in General Nakar and Palawan. This driver is also related to fuelwood gathering that ranked as number 5 in terms of importance. The difference between these two is that charcoal making is commercial in nature because the major intention is to sell the charcoal while fuelwood is consumed by the same households that gathered them.
rANkINg by Fgd PArTICIPANTs IN ALL sITes
Consultations with other groups of stakeholders through FGDs yielded almost the same results as those in the KII. The top three drivers of deforestation by relative importance are as follows: kaingin making, mining and land use conversion (Table 24). Kaingin making is top driver in all sites while mining is top 2 in General Nakar and Palawan, same sentiment as observed in KII.
With respect to forest degradation, logging, whether legal or illegal, also topped the ranking which is observed to be important in all sites. This time however, it is followed by charcoal making which is also prevalent in General Nakar and Palawan while timber poaching is third. Ranked fourth are fuelwood gathering (significant in Southern Leyte) and natural calamities (important in General Nakar). NTFP gathering is ranked sixth relatively important in General Nakar.

71Analysis of Key Drivers of Deforestation and Forest Degradation in the Philippines Analysis of Key Drivers of Deforestation and Forest Degradation in the Philippines
Table 24. Fgd ranking results of direct drivers of deforestation and forest degradation in the four sites
driversweighted Points
Total weighted
score
Indicative rank
g.Nakarn=10
s.Leyte n=4 Palawan n=4Mt. Malindang
n=4
deforestation
Kaingin making 17 20 16 16 69 1
Mining 12 0 13 0 25 2
Land use conversion 0 6 5 0 11 3
Forest degradation
Logging (legal, illegal) 45 15 4 20 84 1
Charcoal making 25 0 17 0 42 2
Timber poaching 0 4 3 6 13 3
Fuelwood gathering 0 5 0 0 5 4
CC, calamities 5 0 0 0 5 4
NTFP gathering 1 0 0 0 1 5

7.0 Local initiatives to addressdrivers of deforestationand forest degradation


75
LoCAL INITIATIves To Address drIvers oF deForesTATIoN ANd ForesT degrAdATIoN
Different initiatives had been undertaken both by DENR and the LGUs in collaboration with local communities and other sectors to ensure sustainable management of forest resources. These initiatives are designed to address the underlying causes of deforestation and forest degradation in the various sites.
Policy Initiatives
As early as 1982, DENR had tried to address deforestation and forest degradation in Southern Leyte by imposing a logging ban in the province. However, as logging companies withdrew, previous TLA areas had become open access such that more kaingin areas were opened by displaced logging employees and migrants, aggravating further the problem. Just very recently, Executive Order No 23 was issued by the Philippine President banning the cutting and harvesting of timber in natural and residual forests of the entire country, except for clearing road right of way by DPWH, site preparation for tree plantations, silvicultural treatments and similar activities. The study shows that also this EO as previous logging bans had resulted in increased illegal logging (e.g. in General Nakar). The impact of this policy in the future is yet to be seen.
At the local level, the Southern Leyte provincial government initiated formulation of its Environment Code which was approved on July 22, 2008. This Code aims to raise awareness on the updated environmental functions devolved to LGUs such as small scale mining regulations, ecological solid waste management, integrated social forestry (ISF), and others. It also aims to attain sustainable development and ensures that component local government units shall adopt all reasonable and practicable measures to protect, restore and enhance the quality of the environment as well as to promote the well-being and safety of their constituents. LGU stakeholders are recognized in the Code as vital partners of the provincial government and the DENR in the implementation of environmental programs since environmental problems usually emanates from the barangay and municipal levels. The Implementing Rules and Regulations of the Southern Leyte Environment Code were promulgated through Provincial Executive Order No. 6, dated July 1, 2009. It seeks to provide a sound policy framework for the protection and management of the environment and natural resources within the province.
Prior to the Southern Leyte Environment Code, different municipalities in the province had enacted their own ordinances to protect the environment and its natural resources. For instance, the municipality of Silago and Tomas Oppus adopted thru the issuance of various local ordinances the following:
1. Municipal Ordinance No. 2007-17, declaring the month of October as Tree Planting Month for the Municipality of Silago, Southern Leyte directing all barangay personnel and residents to participate in the activity. DepEd, all NGOs and other groups are enjoined to participate in the program where concerned parties can choose the specific date of the month to plant trees.
2. Municipal Ordinance No. 2007-16 prohibiting any person or group of persons from cutting poles in public lands without cutting permit issued by the DENR thru the Municipal Mayor. Violators shall be penalized with imprisonment or a fine of not less than P1,000 or both at the discretion of the Court.
3. Municipal Ordinance No. 2010-22. Regulating the cutting and gathering of minor forest products. The Ordinance prohibits the cutting and gathering of minor forest products such as palasan,

76 Analysis of Key Drivers of Deforestation and Forest Degradation in the Philippines
rattan, tambunga, elhi-on, hagnaya vines, and orchids without permit or license issued by DENR. Violators shall suffer the penalty of 3-6 months imprisonment or a fine of P 1,000.00 or both at the discretion of the court.
4. Resolution No. 28, s- 2009. Adopting RA 9003, the Ecological Solid Waste Management Act of 2000 in Tomas Oppus, Southern Leyte.
5. Executive Order No. 2011-03. An Order creating the Municipal Core Group or Municipal Technical Working Group of REDD-plus Project to be Implemented in the Municipality of Tomas Oppus, Province of Southern Leyte. February 12, 2011. The Municipal Core Group covers the seven barangays of the municipality i.e. Brgys. Hinapo, Hugpa, Hinagtikan, Rizal, Carnaga, Punong and Canlupao.
In General Nakar and province of Quezon, Presidential Proclamations of logging moratorium were issued in 1989 and 2004 to address the calamitous effects of landslides, floods, and loss of lives and property blamed on rampant deforestation. When it remained as a hotspot for illegal logging and forest products processing, the provincial government enacted a total logging ban through Provincial Ordinance 2009-8.
Another policy initiative of the municipal LGU was the adoption of General Nakar’s forest land use plan (FLUP) in 2010. The FLUP was formulated and approved to address the need for proper management of the forestlands through appropriate policies and programs. It includes closing access to the forests through provision of tenure to qualified managers as well as harnessing the participation of all stakeholders in protecting the forests.
SEP Law has provided the framework for management of the forests in Palawan. Its implementing rules and regulations (IRR) has been strengthened through various ordinances adopted by the PCSD and LGUs particularly on the zoning of production and protection zones and the allowed land uses in these areas.
MOUs were signed by and between the Province, 5 MLGUs, DENR and GIZ for the implementation of forest land use planning (FLUP), support to reforestation activities, forest resource assessment and capacity building of local stakeholders in support of REDD-plus measures. As a result of the Biodiversity Assessment, the Province passed SP Resolution 740 – S 2012 “Approving an Ordinance for the Declaration of Mt Nacolod Mountain Range as Protected Area”.
Improving Local Governance
Realizing the importance of good governance in forest management, the national government passed various laws and regulations designed to promote greater participation of stakeholders in managing forest resources, transparency in management operations and accountability among stakeholders in decision making. Thus, consistent with the local government code, DENR-DILG Joint Memorandum Circular No. 1998-01 and 2003-01 allowed co-management of forests and forestlands between the DENR and LGUs. The NIPAS Act of 1992 also afforded greater participation among wider stakeholders in managing protected areas by mandating the creation of multi-sector protected area management boards which oversee implementation of activities in each protected area. EO No. 263 (1995) and the IPRA of 1997, also allowed communities and IPs to directly manage forestlands under the CBFM Program and by titling ancestral domains of IPs, respectively.
These national policies have been guiding the provinces of Quezon, Southern Leyte, Misamis Occidental, and Palawan (including the SEP Law) in managing their forests and forestlands. CBFM agreements were signed with people’s organizations in Southern Leyte which includes the DENR-GIZ REDD-plus pilot area covered by this study. With these agreements people’s organizations are now partners of the DENR in forest protection by jointly monitoring and patrolling CBFM sites. Forest patrol groups called Bantay Lasang were created to patrol forested areas of CBFM areas while check points along the provincial roads have been established in collaboration with LGUs and the PNP to ensure strict enforcement of forest laws and regulations. A co-management agreement was also signed in Silago which effectively involved the
77Analysis of Key Drivers of Deforestation and Forest Degradation in the Philippines Analysis of Key Drivers of Deforestation and Forest Degradation in the Philippines
municipal government in roadside tree planting activities.
Forest land use plan formulation has also been started in the five towns covered by the DENR-GIZ REDD-plus pilot project in Southern Leyte (with assistance from GIZ) and in Narra and Quezon, Palawan (with assistance from NTFP-EP). Once completed, the FLUP can provide a comprehensive direction in crafting forest policies and programs of these municipalities. It will also serve as a tool for engaging different stakeholders in forest management, and in the process promote transparency and accountability. General Nakar already has a FLUP.
Recent deployment of Bantay Gubat teams by several barangays in General Nakar has increased awareness among local communities on the need to protect the forests from outsiders intent on degrading the forests through kaingin making and timber poaching. Also, the intensive information campaign by the current CENRO to stop illegal forestry activities among IPs and local communities has generated positive action. The CENRO’s patrol teams’ visibility along the known exit points for illegally cut logs and flitches has diminished in the past months. Assigning other DENR personnel, particularly women, to man the checkpoints has also reduced the transport of illegally sourced forest products along the highways because violators are now aware that the current CENRO is serious in enforcing forestry laws.
The PAMB of MMRNP has been activated as a venue for discussion of issues concerning the Park’s management and protection. It has also served to disseminate information about policies and programs related to the MMRNP to the LGUs and other sectors represented in the PAMB. The PAMB committees are active as collaborative mechanisms for implementing environmental policies and programs. The Bantay Lasang teams of the barangays and active CSOs in Mount Malindang have contributed a little in efforts to protect the forests. They serve as social fence around the Park, providing information on illegal activities to forest law enforcers.
Palawan Council for Sustainable Development (PCSD) played a major role in coordinating policy and program decision making particularly in implementing the SEP Law. CSOs continue to serve as environmental advocates as well as deputized citizens’ arresting officers and have helped reduce incidences of illegal forest activities in the province. They have also contributed in ensuring transparency, accountability and participatory decision making in local governance in Palawan.
Addressing Socio-Demographic and Economic Factors
The FLUP, in general, will be able to identify protection areas and production zones where private investors can invest in forestry. Hopefully, in conjunction with tenure instruments as part of co-management agreements (CMA) with LGUs, this can attract investors and provide employment opportunities to local communities, who could benefit from forest tenure / long-term user rights, e.g. under sub-agreements to CMAs. This has to go hand in hand with less cumbersome processes for granting resource use permits by DENR. This could likewise lead to additional tree planting for long-term production of wood and other forest products to fill the wide gap on demands vs. supply of forest goods and services. In the process, government can refocus its resources towards conserving protection areas and render forest protection activities more effective.
DENR is currently implementing forest rehabilitation projects such as reforestation, assisted natural regeneration and agroforestry with support from funding agencies. These projects complement LGU programs that provide alternative livelihood opportunities to upland communities while improving forest cover of the sites. Livelihood projects on vermiculture (Mount Malindang), harvesting and processing of NTFPs (General Nakar), agroforestry high conservation farming villages (General Nakar), and other projects were initiated with local communities in these sites. Establishment of nurseries for forest tree species and rattan by DENR and LGUs in some sites provide livelihood opportunities and planting materials for reforestation projects.
DENR and the LGUs also continue to conduct IEC to improve communities’ awareness and knowledge of the importance of forests. Billboards were installed in strategic locations in Southern Leyte, Palawan and

78 Analysis of Key Drivers of Deforestation and Forest Degradation in the Philippines
Mount Malindang and information campaigns were initiated using pamphlets and other printed materials enjoining stakeholders to help prevent illegal cutting and stop expansion of kaingin farms.
Mitigating Natural Factors
The various forest rehabilitation projects being implemented by DENR in partnership with LGUs, communities and other stakeholders are part of the measures to mitigate climate change and reduce their impacts on local communities. While these are small efforts compared to greenhouse gas emissions at the global level, they are nevertheless small contributions to global efforts. As part of these rehabilitation programs local communities with support from the DENR and the LGUs had established firebreaks and watch towers in strategic locations to control forest fires in Southern Leyte. These measures reduce deforestation and forest degradation due to forest fires as induced by long dry season or drought.
Strengthening partnerships among government, LGUs, IPs, POs, CSOs and other sectors through IEC and dialogues on disaster risk management and forest protection in most sites further contribute to the reduction of deforestation and forest degradation.

Analysis of Key Drivers of Deforestation and Forest Degradation in the Philippines
8.0 National initiatives to addressdrivers of deforestationand forest degradation


81
NATIoNAL INITIATIves To AddressdrIvers oF deForesTATIoNANd ForesT degrAdATIoN
There have been many initiatives from government and various sectors to address the various drivers of deforestation and forest degradation. This section highlights three major initiatives that have covered several decades of implementation and contributed both positive and negative impacts on the drivers of deforestation and forest degradation.
CoMMuNITy-bAsed ForesT MANAgeMeNT ProgrAMs
In 1995, government recognized the important role of communities as immediate stakeholders of forestland resources particularly in the management, rehabilitation, protection and utilization of forest resources. EO 263 was issued “Adopting Community-Based Forest Management as the National Strategy to Ensure the Sustainable Development of the Country’s Forestlands Resources and Providing Mechanisms for its Implementation.” In a way, this policy was issued not only to promote social justice and improve the well-being of forest occupants and nearby communities dependent on forest resources but also to address the persistent deforestation and forest degradation in many areas of the country as well as the lack of effective management of forests.
The CBFM strategy has since been implemented through DENR DAO no. 96-29 which has been revised in 2004 and following several workshop reviews, there followed a CBFM Strategic Action Plan for the period 1997-2020 and then revised as Philippine CBFM Strategic Plan for the period 2008-2017. CBFM evolved from the implementation of previous people-oriented programs such as the Integrated Social Forestry Program (ISFP), National Forestation Program (NFP), Community Forestry Program (CFP), Coastal Environmental Program (CEP) and the recognition of Ancestral Domain Claims.
The CBFM Program provides long-term security of tenure to organized local communities through the issuance of the Community-Based Forest Management Agreement (CBFMA) and other land tenure instruments under the various people-oriented forestry programs that were implemented in the past. This gives them the right to possess and develop forestlands (Bacalla, n.d.). As of 2008, a total of 1,783 CBFM agreements over 1.62 million hectares have been issued to 1,783 Pos with 321,638 household beneficiaries (PFS, 2008). Aside from CBFMAs, tenure instruments have also been issued such as more than 50 Protected Area Community-Based Resource Management Agreements (PACBRMA) covering over 22,000 ha; about 180-plus Certificates of Ancestral Domain Claims (CADC) in 2.5 million ha; other tenure covering 1.8 million ha (CBFM Strategic Plan, 2008-2017).

82 Analysis of Key Drivers of Deforestation and Forest Degradation in the Philippines
Table 25. Number and area (in ha) of CbFM agreements by region, 2008
region No. issued Tenured Area No. of hhs No. of Pos
CAR 87 56,625 13,762 87
1 127 40,272 15,514 127
2 103 269,879 92,391 103
3 131 79,517 12,502 131
4-A 47 18,401 3,098 47
4-B 78 92,615 10,229 78
5 83 47,926 12,329 83
6 104 40,715 17,142 104
7 208 57,609 16,056 208
8 130 115,542 14,143 130
9 131 79,207 12,886 131
10 296 212,677 33,673 296
11 93 207,264 26,114 93
12 53 95,739 10,607 53
13 112 208,416 31,193 112
Philippines 1,783 1,622,404 321,638 1,783Source: Philippine Forestry Statistics (2008)
While CBFM has gained positive grounds in the past decade, there are still issues that hinder its full realization of the goals and objectives. Among these are: unstable policies on tenure and resource use (suspension of resource utilization due to logging ban policies); bureaucratic procedures and limited technical assistance; weak technical capabilities of CBFM implementers; inadequate investments from various sources to develop CBFM areas; threats from illegal loggers and incoming migrants and kaingineros in CBFM areas; and other institutional (government) and organizational (POs) issues (CBFM Strategic Plan, 2008-2017).
LoggINg bAN PoLICIes
Logging ban and moratorium policies in the form of executive orders, letters of instructions (LOI), memorandum orders / circulars, or administrative orders, have been issued by government officials (President, Department Secretaries, Bureau Directors) since the 1970s to the most recent in 2011 to address deforestation in the country.
In 1991, DENR Administrative Order (DAO) No. 24 was issued to shift logging from the old growth forests to the second growth or residual forests. This national logging ban no longer allows timber extraction in old growth forests and in critical areas such as those on steep slopes (50%+), above 1000m elevation, stream banks (20m sides), and wilderness areas primarily for conservation of biodiversity and gene pools. This Order allowed commercial logging only in secondary forests and in plantations. In December 2004 following the destructive typhoons that hit the provinces of Aurora and Quezon causing much damage to lives and property, Philippine President Arroyo ordered the cancellation of logging permits in Quezon province and suspension of all permits in the rest of the country. Later in March 2005, then DENR Secretary Michael Defensor lifted the suspension of timber harvesting in Regions 9 (Zamboanga Peninsula), 11 (Davao) and CARAGA (Agusan provinces) to address local demands for wood, which he said is still available in the two regions. Again, the widespread flooding and landslides in Mindanao, Eastern Visayas and Bicol in 2011 prompted President Benigno Aquino, Jr. to issue EO No. 23, “Declaring a moratorium on the cutting and harvesting of timber in the national and residual forests and creating the Anti-Illegal Logging Task Force”.
There are over 20 policy issuances on logging ban and moratorium imposed in selected municipalities, provinces, regions, or nationwide over the last four decades (Table 25). Some reasons cited for imposing the various logging ban or moratorium policy issuances include reports of unabated / unchecked logging activities; strong clamor from local officials and representative sectors; calamities wrought by heavy rains resulting to floods, landslides, and adverse economic effects particularly on agricultural production; conservation / preservation of remaining forest resources; and continued violation of forestry laws. The violations resulted mostly from poor implementation and monitoring of existing forestry laws but the catalysts are the calamities brought about by strong rains and typhoons in the Samar, Leyte, Quezon, and

83Analysis of Key Drivers of Deforestation and Forest Degradation in the Philippines Analysis of Key Drivers of Deforestation and Forest Degradation in the Philippines
Aurora provinces where excessive logging was blamed for the landslides and floods that killed many people in these areas (Bugayong, 2006).
Table 26. Logging ban / moratorium policy issuances in the Philippines, 1976-2011
region Province (Policy Issuance, year) reason
1- NE Luzon • Ilocos Norte, Ilocos Sur, Abra, La Union, Baguio City (Presidential instructions to Minister of Natural Resources Jose Leido Jr. 1975)
• Pangasinan (LOI 409, 1976)
• Ilocos Norte & Sur, La Union (Presidential directive, 1983)
• Stop all timber cutting & logging
• Protect Sierra Madre, Caraballo, Cordillera & Zambales mountains
• National logging ban except in 9 areas
CAR – N Luzon • Abra, Mt. Province (Presidential directive, 1983)• Abra, Benguet, Ifugao (Min. Order No. 4, 1986)
• National logging ban except in 9 areas
2 - NW Luzon • Cagayan, Isabela, Nueva Vizcaya(MNR Order, 1982)• Batanes (Presidential directive, 1983)• Nueva Ecija, N. Vizcaya, Quirino, Ifugao (MNR Order No.
2, 1986)• Cagayan – Gattaran & Baggao town (DENR Regional
Moratorium Order, 1989)• Nueva Vizcaya (DENR MO No. 2, 1990)
• Isabela - San Mariano & Ilagan towns (DENR Regional Moratorium Order, 1992)
• Quirino (DENR Administrative Order, 1993)
• National logging ban except in 9 areas
• Forest degradation & violations
• Rampant illegal logging
• Local reports of unchecked illegal logging
• Rampant illegal logging
• Local government reported rampant illegal logging
3 – C Luzon Bulacan, Pampanga, Tarlac, Zambales, Aurora (LOI 409, 1876; Presidential directive, 1983)
• Protect Sierra Madre, Caraballo, Cordillera & Zambales mountains
• National logging ban except in 9 areas
4a -S Luzon • Batangas, Cavite, Laguna, Quezon, Rizal (LOI 409, 1976)• Quezon – Real & Mauban towns (BFD Circular 4, 1982)• Quezon – Infanta & vicinities (DENR Moratorium Order,
1992)• Quezon, Aurora (DENR Memorandum, 1994)
• Protect Sierra Madre, Caraballo, Cordillera & Zambales mountains
• Hot spots for illegal logging & transport of illegally cut logs
• Illegal logging hotspots
4b -SW Luzon islands
• Marinduque, Mindoro Occidental & Oriental, Romblon (Presidential directive, 1983)
• Palawan (DENR Administrative Order No. 45, 1992)
• National logging ban except in 9 areas• RA 7611 – Strategic Environmental
Plan for Palawan Act provides for total commercial logging ban
5 – SE Luzon Albay, Camarines Norte & Sur, Masbate (Presidential directive, 1983)
National logging ban except in 9 areas
6 - W Visayas • Aklan, Antique, Capiz, Iloilo, Guimaras (Presidential directive, 1983)
• Negros Occidental (Presidential Instructions, 1984)
National logging ban except in 9 areas
7 – C Visayas • Negros Oriental (MNR Order, 1974)• Bohol, Cebu, Siquijor (Presidential directive, 1983) National logging ban except in 9 areas
8 -E Visayas • Leyte, Southern Leyte (MNR Administrative Order No. 31, 1982)
• Eastern, Northern & Western Samar (DENR Moratorium Order, 1989)
• Conserve remaining natural forests
• Need to assess existing resources; environmental disasters
9 – W Mindanao
Basilan (DENR Moratorium Order, 1989) Strong local advocates against indiscriminate logging
10 – NE Mindanao
• Camiguin (Presidential directive, 1983)• Misamis Occidental (Ministry Order No. 4, 1986)• Bukidnon (DENR Moratorium Order, 1990)
• National logging ban except in 9 areas• Endorsed by local officials & sectors
11 – C Mindanao
• Davao del Sur (Presidential directive, 1983)• South Cotabato (MNR Order No. 3, 1986)• Saranggani (DENR Moratorium Order No. 25, 1994)
• National logging ban except in 9 areas • Vulnerability to flashfloods & calamities
due to excessive logging
12 – S Mindanao
Surigao del Norte (Presidential directive, 1983) National logging ban except in 9 areas
ARMM • Sulu, Tawi-tawi (Presidential directive, 1983)• Lanao del Sur (Memorandum Order No. 30, 1992)
• National logging ban except in 9 areas • Protect Lake Lanao watershed
Source: Bugayong (2006)
One of the landmark policies enacted to preserve the remaining forests in an island is DENR Administrative Order No. 45 which bans logging in the whole of Palawan. The strong advocacies from various sectors for

84 Analysis of Key Drivers of Deforestation and Forest Degradation in the Philippines
conservation of the island’s resources led to the enactment of Republic Act 7611 or the Strategic Environmental Plan for Palawan Act, which includes the provision for preserving the biodiversity and gene pools in the island.
A content analysis (Bugayong and Peralta, 2006) of the 20 policy issuances on logging ban / moratorium shows that most of these relate to forest law enforcement. These include the immediate suspension or prohibition of logging operations and cutting of trees in the areas covered by the moratorium or ban; the prohibition of occupancy or resource use in the concerned areas; the investigation or verification of non-compliance with forestry laws, rules and regulations; cancellation of permits and licenses; confiscation of illegally cut timber and logging equipment; and padlocking of sawmills. Implicit in the policy issuances is DENR’s mandate as primary enforcer of the logging moratorium and ban using its regular budget, personnel and other resources. In some instances though, the DENR has coordinated with the police or military and local government units for their cooperation in enforcing the ban within their local jurisdictions.
In spite of the many logging ban and moratorium issuances in the last four decades, illegal logging and deforestation / forest degradation still persist in many areas of the country. The main problem lies in the inability to stop the activity in the forests which are mostly located in remote areas and where government forest guards can barely protect given their limited resources such as equipment, all terrain vehicles, communication systems, and personnel support. Most of these policy issuances also do not contain provisions to address the resulting scarcity of wood from natural grown trees through alternative legitimate sources. These are instead, provided in corollary or separate policy issuances such as EO 26 (national greening program) and AOs on reforestation / rehabilitation or industrial tree plantation development.
Logging ban and moratorium policies to be effective need to be crafted in a holistic manner, addressing the various issues and concerns through long-term and sustainable strategies. DENR and other government agencies alone are unable to protect the forests and enforce logging ban. The stakeholders within or near the forests should be capacitated, empowered, and given incentives to protect and manage these resources sustainably.
NATIoNAL greeNINg ANd reForesTATIoN ProgrAMs
Following the issuance of EO 23 on the logging moratorium in natural forests is EO 26 “Declaring an Interdepartmental Convergence Initiative for a national Greening Program”. It seeks to “consolidate and harmonize all greening efforts such as Upland Development Program, Luntiang Pilipinas and similar initiatives of the government, civil society and private sector under a National Greening Program [NGP].” The program aims to plant “1.5 Billion trees covering about 1.5 Million hectares for a period of six (6) years from 2011 to 2016” in forestlands, mangrove and protected areas, ancestral domains, civil and military reservations, urban areas, inactive and abandoned mine sites, and other suitable lands.
Before the NGP, there were various tree planting and greening programs previously implemented to address the problems of increasing deforestation and scarcity of timber for industrial and home consumption. International funding agencies such as the World Bank and JICA / JBIC supported various nationwide contract reforestation programs in the 1980s and 1990s. However, very few projects have been successfully sustained after the three-year duration of funding support. Area reforested by government and non-government sectors has been fluctuating in various years (Table 26) as reflected in the official statistics. Areas planted by government sector include those under programs on urban forestry, contract reforestation, agroforestry, watershed rehabilitation, mangrove, and protected areas rehabilitation. Private (non-government) sector tree planting are through the tenure instruments (i.e., IFMA, SIFMA, TFLA / AFFLA, TLA), citizenry, and private lands.
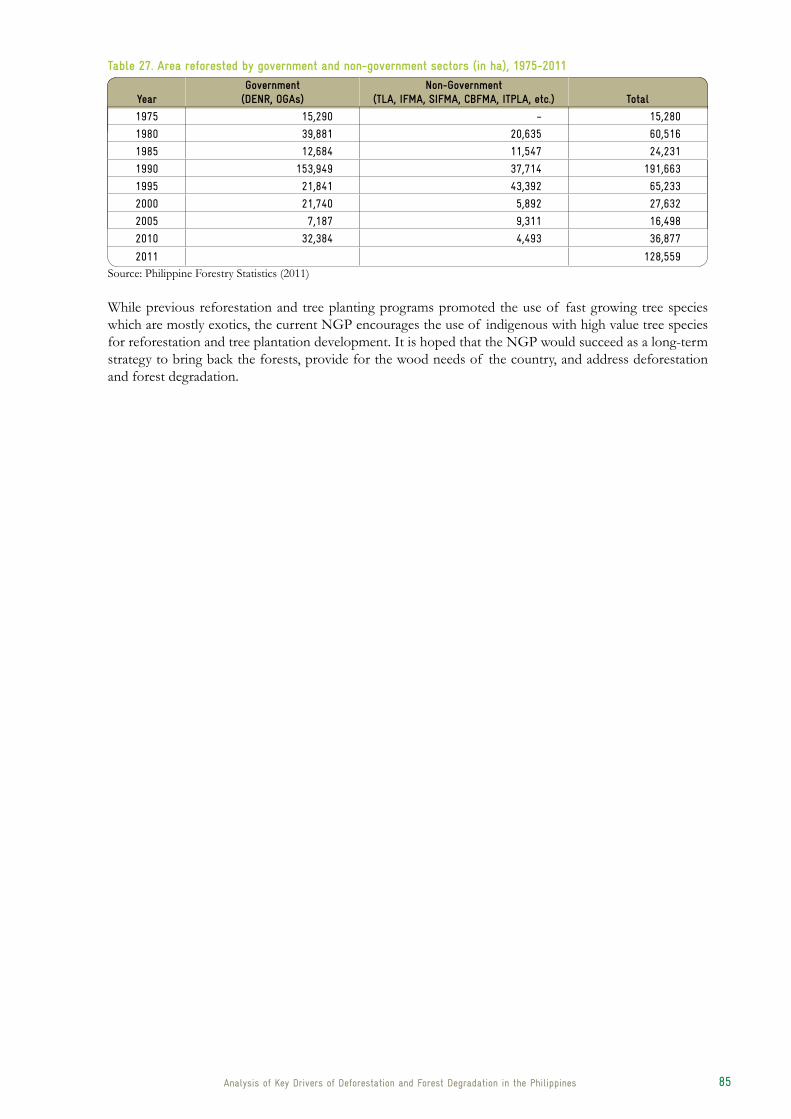
85Analysis of Key Drivers of Deforestation and Forest Degradation in the Philippines Analysis of Key Drivers of Deforestation and Forest Degradation in the Philippines
Table 27. Area reforested by government and non-government sectors (in ha), 1975-2011
yeargovernment
(deNr, ogAs)Non-government
(TLA, IFMA, sIFMA, CbFMA, ITPLA, etc.) Total
1975 15,290 - 15,280
1980 39,881 20,635 60,516
1985 12,684 11,547 24,231
1990 153,949 37,714 191,663
1995 21,841 43,392 65,233
2000 21,740 5,892 27,632
2005 7,187 9,311 16,498
2010 32,384 4,493 36,877
2011 128,559Source: Philippine Forestry Statistics (2011)
While previous reforestation and tree planting programs promoted the use of fast growing tree species which are mostly exotics, the current NGP encourages the use of indigenous with high value tree species for reforestation and tree plantation development. It is hoped that the NGP would succeed as a long-term strategy to bring back the forests, provide for the wood needs of the country, and address deforestation and forest degradation.


9.0 Policies and programs thatserved as perverse incentivesleading to deforestation


89
PoLICIes ANd ProgrAMs ThAT served As Perverse INCeNTIves LeAdINg To deForesTATIoNA perverse policy incentive is an incentive that produces unintended and undesirable result which is contrary to the intentions of the framers of policy. Likewise, a perverse program generates results that are contrary to the intentions of the program. The complexity of forest management in the Philippines from licensing, management, harvest, sale and renewal, entailed different sets of policies and guidelines, some of which are considered perverse that contributed more to deforestation and forest degradation than to conservation of forests.
Among the perverse policies and programs identified in this study are as follows:
Issuances of timber licenses and permits (PD 705 and previous forest licensing laws)
Since the American colonial period, the government gave privilege to the private sector to operate logging concessions primarily for the country to benefit from the vast potentials of forest resources and to manage the resources judiciously. This has also been the focus of PD 705, as amended by PD 1559 (Revised Forestry Code of the Philippines). This is the basic law that governs the management of the entire forests and forestlands of the country. The Code was promulgated in response to the need for a judicious exploitation, conservation and management of the entire forest resources. Giving of forests to concessions entailed peripheral operations that became underlying causes of deforestation. For example, allowing the TLA holders to build roads, establish camps, employ a lot of people and allow them to go up and live in the forests with programs on food production attracted a lot of people. The settlements they built became permanent with TLA holders providing goodwill programs like building of schoolhouses and hospitals made people content and feel secure. When the time came for the TLA holder to leave the area, the very people that helped protect the forests became the most destructive agents. In search of livelihood, they turn to forest for farming and gathering of whatever products that are of use to them.
Phase out of TlAs
Many TLAs were granted to private corporations during the 1970s until the later part of the 1980s. The 1987 Constitution, however, no longer allows the granting of any timber license agreements and permits. The provision in the Constitution on the three modes of agreement (production sharing, joint venture and co-production) phased out the TLAs and many logging companies stopped operations. The gradual phase out of TLAs became a disincentive rather than an incentive for forest protection. In most of the areas where TLA holders have ceased operations, abandoned TLA areas became open access. Logging roads constructed by logging companies made logged-over areas accessible to migrants who settled in the area along with some TLA employees who preferred to stay behind. Former log cabins became permanent settlements. The presence of these communities paved the way for more extraction of forest resources and expansion of forest land converted to settlements. Abandoned logging / mining roads provided access to illegal tree cutters and timber poachers to haul and transport timber and other forest products.

90 Analysis of Key Drivers of Deforestation and Forest Degradation in the Philippines
Strict policies concerning transport of logs harvested from private lands
One of the reasons that is keeping out serious investment in the forestry sector is corruption. It probably ranks the highest among the constraints to investments in the sector. The most pervasive is what is being done at check points along the highways. Check points were installed to ferret out illegal logs, however, it has become an instrument for extortion (Tesoro and Angeles, 2008). Usually check posts are manned by composite teams (DENR personnel, the police, the military and sometimes from the Customs Office). Even if the logs and other forest products are properly documented and legal, personnel manning the check points still demand payment. Small-hold farmers transporting their plantation logs attest to the presence of corruption at check points. Likewise, the difficulty of getting permits to transport forest products complicates the problems. Thus, recycling of permits to transport often happens with the connivance of those who are regulating the movement of logs and other forest products.
Rewards to informers of forest violations
Although PD 705 is still the basic governing law on forest management, many of its provisions are no longer attuned to the present situations and realities particularly under sections 68-70. In order to address these inadequacies, Executive Order No. 227 was issued in July 25, 1987 amending section 68 of PD 705 which states that the mere possession of timber or other forest products without legal documents is illegal and considered as a criminal act punishable under Articles 309 and 310 of the Revised Penal Code. The said EO also authorizes the Court or the DENR Secretary or his duly authorized representative (as the case may be) to order the confiscation of the timber or any forest products cut, gathered, collected, removed, or possessed as well as the machinery, equipment (including conveyances), implements and tools illegally used in the area where the timber or forest products are found. The EO grants rewards to informers who report violations, leading to the apprehension and conviction of any offender or confiscation of forest products. The reward is equivalent to 20% of the proceeds of forest products confiscated. This is viewed as a perverse incentive because instead of preventing the violations, forest protection officers allow violations to occur first before reporting them so that their accomplishments would be bigger as well as their percentage reward.
logging moratorium / total logging ban policies
In order to curb the rampant illegal logging, EO 23 was issued on February 1, 2011. The EO declares a moratorium on the cutting and harvesting of timber in the natural and residual forests of the entire country prohibiting the DENR from issuing logging contracts / agreements, issue / renew tree cutting permits except for clearing of road right of way by DPWH, site preparation for tree plantations, silvicultural treatments and similar activities. The law also directed the DENR to close and not allow the operation of sawmills, veneer plants and other wood processing plants for failure to present proof of sustainable sources of legally cut logs.
Existing IFMAs, SIFMAs, CBFMAs and other agreements and contracts are also ordered under EO 23 to be reviewed and evaluated by the DENR and immediately terminate contracts and agreements of those who violated twice the terms and conditions of their contracts / agreements and existing forest laws, rules and regulations, and if the holders of these contracts / agreements engage in logging activities in any natural or residual forest.
According to the EO, the DENR shall strictly implement a forest certification system in accordance with international standards and guidelines so as to ascertain the sustainability of legal sources and chain of custody of timber and wood products nationwide.
The DENR shall close and not allow the sawmills, veneer plants and other wood processing plants to operate if they fail to present proof of sustainable sources of legally cut logs for a period of at least five years within one month once the EO on illegal logging takes effect.

91Analysis of Key Drivers of Deforestation and Forest Degradation in the Philippines Analysis of Key Drivers of Deforestation and Forest Degradation in the Philippines
EO 23 also paved the way for the creation of the Anti-illegal Logging Task Force to enforce the moratorium and lead the anti-illegal logging campaign under the supervision of the DENR. For this reason, DENR Resolution 2011-003 was adopted calling for the creation of local anti-illegal logging task forces in every region, except the National Capital Region to give more teeth to the EO. The Resolution provides that LGUs, in coordination with the National Anti-Illegal Logging Task Force (NAILTF) should “ensure that no illegal logging, kaingin and other forms of forest destruction” take place within their jurisdictions. The regional task forces are chaired by DENR regional executive directors, vice-chaired by the DILG regional directors and PNP regional director and brigade commander of the military as members. The regional task forces are responsible for the over-all implementation of EO 23 in their respective areas. EO 23 did not deter illegal logging as evidenced by the large scale smuggling that occurred in 2012 which resulted in the confiscation of illegally sourced lumber and the relief of key DENR officials in Region 11 and CARAGA.
The logging moratorium under EO 23 covers the whole nation. However, even before its promulgation, the study sites were already under a national law or ordinance on logging ban. Quezon province has been under several logging ban proclamations but the most recent is Provincial Ordinance No. 2008-09, An Ordinance Adopting a Total Log Ban Policy in the Province of Quezon. It prohibits the “cutting, gathering, removal, possession and / or transport of natural stands and planted tree species or any forest products are strictly prohibited within the territorial jurisdiction of the province”. Exempted from the coverage of the ban are “planted trees harvested outside of the REINA area from duly registered and licensed industrial tree plantation, tree farm and / or agro-forest farms, in accordance with the relevant services of the DENR”. In spite of the provincial logging ban ordinance, the DENR reports several confiscation of illegally cut logs from natural forests and their conveyances (see report on Key Drivers of deforestation and forest degradation in General Nakar, Quezon). Even with the strict enforcement of EO 23 in the province, there are still local sightings and alleged reports of illegally cut wood and charcoal being transported inside or under the floor of closed vans and buses. Among the major reasons for the persistence of these activities are socio-economic factors such as limited livelihood options and the perception that natural trees are a source of easy money as well as the lack of capacity to protect forests by the concerned agencies. Without addressing these issues, the logging ban policy has become a perverse incentive for forest degradation.
Likewise, Southern Leyte has been under total logging ban since 1982 through the issuance of Administrative Order No. 31, dated July 20, 1982 by the then Ministry of Natural Resources and R.A. No. 9772 issued on November 13, 2009. Under RA 9772, harvesting of planted species within tree plantations and the tree cutting activities for projects approved by the government and only for basic services such as, but not limited to, public works, energy development or water utilities are exempted from this Act, provided that any harvesting or cutting of tree species shall comply with all pertinent environmental and forestry laws, rules and regulations.
The province of Palawan has been under total logging ban through the enactment of the SEP Law (RA 7611) in 1992. The Strategic Environmental Plan for Palawan serves as the framework to guide government agencies in formulating and implementing plans, programs and projects affecting the environment and natural resources of the province. The SEP also established the Environmentally Critical Areas Network (ECAN) as a graded system of protection and development control over the province’s tribal lands, forest, mines, agricultural areas, settlement areas, small islands, mangroves, etc.
Even the declaration of mt. malindang as a national Park and as a protected area did not help abate illegal logging and timber poaching in the area. The influx of migrant settlers increased the population in MMRNP creating a boom in the construction industry resulting to high demand for wood. Thus, illegal logging and timber poaching became rampant. Former logging roads are used by illegal loggers and land speculators.
The impacts of EO 23 declaring a logging moratorium in all natural and residual forests can be gleaned from past experiences. The closure of operations of timber license agreement holders had resulted to “de facto” open access of forestlands which led to more migration into the forests and forestlands and their eventual degradation and deforestation. Road construction such as the opening of the Silago-Abuyog Road in Southern Leyte and Marikina-Infanta Road in Quezon province make the forests and the resources therein more vulnerable to illegal timber cutting and poaching for fuelwood, charcoal, furniture and for construction use by local and outside buyers. This was also observed in Mt. Malindang study site where the presence of an LGU inside the protected area increased the population that resulted in the boom of

92 Analysis of Key Drivers of Deforestation and Forest Degradation in the Philippines
construction industry resulting to high demand for wood.
In the study sites, logging ban policies including EO 23, are not effective in curbing illegal logging activities because it has not addressed the fundamental need of the people for livelihood and the high demand for wood and fuelwood. The forests have not been adequately protected due to the lack of institutional capacities and political will to enforce the logging ban policies.
Reforestation programs
PD 705 mandated the government to conduct reforestation activities. Section 33 provides that the government shall reforest bare or grass-covered tracts of forest lands, brushlands, open tracts of forest lands and other areas needing reforestation. Thus, several regular reforestation projects were established with the secondary aim of providing employment to upland people. However, during the reforestation audit in 1987 by the UPLB College of Forestry and Natural Resources, findings showed that the reported reforested areas in some projects were usually bloated as replanting often happened several times in areas already reforested. Further investigations showed that as reforestation progresses and planted areas expand and are almost completed the same project workers burn the areas already planted so that their employment would continue because of replanting. The contract reforestation program of government in the 1990s has had little success because there was no ownership by the communities where the projects were implemented for them to maintain and protect the reforested areas. The lack of proper monitoring and corruption also spelled failure in many areas.
Devolution of DEnR functions to lGUs
With regard to implementation of the Local Government Code (RA 7160), the devolution of DENR functions is limited to selected ones. The LGU has no authority to apprehend the violators of forest laws. This was given only to the Philippine National Police (PNP) as there was no clear instruction for LGU to apprehend (Section 28). This is seen as a perverse policy. In the study sites, the respondents observed that some LGUs are not serious in law enforcement and some are even involved in illegal activities such as timber poaching and illegal cutting as well as transport of timber. Debt of gratitude, friendship and shape up of politicians’ image with their constituents coupled with collusion and political interference in terms of applying the law to violators prevail over the political will to enforce forest law enforcement. The lack of political will weighed heavily against effective forest protection and law enforcement.
Under Section 7 of the Local Government Code, the creation of a local government unit or its conversion from one level to another level (for instance, from Sitio to Barangay) shall be based on verifiable indicators of viability and projected capacity to provide services, e.g., income, population, and land area. Even forest areas can be subject to conversion provided that subject LGU complies with requirements of the above indicators. This policy becomes perverse as a prospective barangay to be created must have enough area and population to qualify. This has happened in many areas in the country, e.g., the UP Land Grant in Real Quezon where the few occupant families swelled from just a few in the 1980s to over 100 (based on records) in recent years to qualify as a Barangay.
land conversion / settlements
Proclamation No. 196, S-1990 declared certain areas in Quezon province as production forests and are subject to the coverage of CARP (Comprehensive Agrarian Reform Program) despite its declaration as a national park in 1977. The law provides for the segregation of about 11,000 hectares from the national park and awarded to the DAR for issuance of CLOA as resettlements area. The issuance of this proclamation contributed to the fast denudation of the forests as communities cut trees not only in the resettlement area but also in protected areas for charcoal and other wood uses.
Settlements of indigenous peoples near forestland areas where they conduct their kaingin activities also resulted to land conversion. The settlements are mostly located near rivers or coastal areas. In- migration also contributed to lands being converted into settlements. After logging operations ceased, displaced

93Analysis of Key Drivers of Deforestation and Forest Degradation in the Philippines Analysis of Key Drivers of Deforestation and Forest Degradation in the Philippines
logging workers and people from nearby provinces lured by livelihood opportunities from timber, charcoal and land speculation settled in the area. The opening of the Marikina-Infanta road aggravated the situation because migrants that settled in the area keep on increasing that put a heavy toll on the forests and its resources. The people planted coconuts, rice and other crops in the once forested areas and illegal forest activities flourished.
The municipality of Narra in Palawan was originally a resettlement area for the landless people from Luzon created through Proclamation 190, signed by then President Elpidio Quirino on June 29, 1950. On October 23, 1950, Executive Order 355 created the Land Settlement Development Corporation (LASEDECO) and converted the Civil Reservation into Central Palawan Settlement Project. Since then, settlers from all over the country were moved into this settlement site. Large-scale migration of people from various regions arose. On June 18, 1954 Republic Act 1160 was signed by President Ramon Magsaysay enacting the National Resettlement and Rehabilitation Administration (NARRA), which took over the administration of Central Palawan Settlement Project. NARRA became the municipality of Narra on June 20, 1970, by virtue of RA 5642.
Migrant people in Narra cleared the former forestlands and planted them with agricultural crops, mostly rice. With its migrant population focused on rice farming, the municipality of Narra grew from a sitio into a municipality. Today, the municipality has since been known as the rice granary of Palawan. However, many forested areas were lost due to settlement and forest conversion to farming.
mining
RA 7076, an Act creating a People’s Small-Scale Mining Program of 1991 was declared to promote, develop, protect and rationalize viable small-scale mining activities in order to generate more employment opportunities and provide equitable sharing of the nation’s wealth and natural resources. Under RA 7076, a People’s Mining Program is established and implemented by the DENR Secretary through the Board which was authorized to declare and set aside people’s small-scale mining areas in sites onshore suitable for small-scale mining and giving priority to areas already occupied and actively mined by small scale miners before August 1, 1987. The small scale mining contracts are under the jurisdiction of the LGU. However, due to the difficulties in the monitoring and proper regulation of small scale mining areas, such activities proliferated. Many small scale mining activities are more destructive causing massive deforestation in affected areas as well as endangering the lives of the small-scale miners themselves due to attendant health hazards accompanying it.
Likewise, because of the livelihood opportunities brought about by mining operations, influx of migrants to mining areas is one of the issues the government has to contend with. This is a common occurrence during mine operations. Hence the need for regular census / monitoring of occupants in mining areas, the company must regulate / limit entry of people, give priorities to the locals in terms of employment.

10.0 Policy agenda and operationalrecommendations


97
PoLICy AgeNdA ANd oPerATIoNAL reCoMMeNdATIoNs
PoLICy AgeNdA
This study is just one of the many efforts in the country analyzing forestry and relevant sector’s policy situation towards the crafting of a national policy framework for pursuing REDD-plus in the country. A parallel study on the “Review and Analysis of Forest Policy relating to REDD-Plus Implementation in the Philippines (led by Atty. Gerthie Mayo Anda) has also been completed. The study focused on two key areas, the legal / policy environment and the institutional / governance mechanisms in implementing the existing laws and policies. The study suggested that the overarching legal and policy framework in the Philippines needs to be streamlined, clearly delineated and effectively implemented to augur for an effective REDD-Plus implementation. There was a mention of the conflicting government policies vis-à-vis forest management and utilization that may potentially hinder REDD-plus implementation as they spawn confusion among various implementing agencies. But despite the absence of a national legislation specifically devoted to REDD-plus, the Philippine government has recognized REDD-plus as a mechanism or an approach to address climate change and achieve sustainable forest management through EO No. 881. Apparently, while the international framework is being crafted, the country should take a look at its own policies on forests and other relevant sectors, and come up with policy actions that can effectively enable the potential REDD-plus participants within national legal framework, recognizing the already formulated Philippine National REDD-plus Strategy (PNRPS).
This study highlights the need to harmonize major forestry policies such as PD 705, EO 318, local government code, NIPAS Act, Mining Act, IPRA Law, RA 7076 and EO 263, including their implementing rules and regulations. To do this, it is advisable to organize a policy summit in each of the provinces (Quezon, Southern Leyte, Palawan, Misamis Occidental) to be attended by decision makers representing particular sectors and subsectors. The main purpose of the summit would be to thresh out steps at harmonizing various conflicting and overlapping policies affecting the forestry and relevant sectors. A complementary summit at the national level is also needed so that national policies affecting field implementation could be reviewed and harmonized. The summit could also be the venue for presentation of existing policy studies related to the harmonization of major forestry policies as backdrop for the discussions leading to the clarification of jurisdiction of DENR, DA, DAR, NCIP, PCSD, and the LGUs.
A comprehensive review of EO 23 and its impacts on forest protection and conservation is also needed. Past experiences in the Philippines and throughout the region show that logging moratoriums have not yielded significant positive results. Considering current political realities, the review can focus on identifying necessary safeguards and measures to effectively implement this national policy and promote protection and conservation of natural forests. Among the primary concerns that need to be addressed relate to the supply of wood, woodfuel, and other forest products that have become scarce because of the logging ban and is triggering illegal harvesting in the unprotected forests leading to deforestation and forest degradation. Policy reforms should incorporate strategies to strengthen the protection of forests and enhance capacities for law enforcement.
FLUPs should be elaborated for each municipality / city and integrated into the comprehensive land use plan (CLUP) of the LGU. Integrated FLUPs have to be followed by co-management agreements between DENR and the LGU and related sub-agreements with granting of tenure to local communities / households and potential investors. Based on the FLUP, an integrated resource management plan (IRMP) would then be the operational framework for investment and forest management. This way, government resources are focused on the protection of strict protection areas mainly for generation of public goods while development of production areas can be offered to private investors for production of wood, NTFP and other forest products to meet increasing demand for these resources. Areas for REDD-plus implementation can also be identified through the FLUP process. The current initiatives therefore of the municipalities of General

98 Analysis of Key Drivers of Deforestation and Forest Degradation in the Philippines
Nakar in Quezon, the REDD-plus pilot municipalities Silago, Sogod, Tomas Oppus, Bontoc and the City of Maasin in Southern Leyte, and Narra and Quezon in Palawan in formulating / implementing their FLUP is in the right direction and should be undertaken for the other municipalities of Southern Leyte, Palawan, Quezon, and Misamis Occidental so that provincial physical framework and development plans (PDPFP) could be developed and provide direction in crafting land use policies of these provinces.
To implement the FLUP at the municipal and provincial levels, a national policy on co-management is required to clarify mechanisms for collaboration and engagement of parties, particularly the provision and monitoring of tenurial instruments over forestlands to be co-managed. Current policy issuances and guidelines on co-management are limited and unclear on issues of jurisdiction, tenure, and partnership modes.
The enactment of a sustainable management of forests law is long overdue. Most provisions of the forestry reformed code of the Philippines under PD 705 are no longer in tune with the 1987 Constitution as well as current realities and conditions. In particular, climate change mitigation and adaptation strategies, including REDD-plus, have to be incorporated into the new forestry law. The need for certification of wood and other forest products to ensure that they come from sustainably managed forests has to be legislated. The new forestry law should ensure a stable policy environment which is free from being arbitrarily changed at the whim of administrators. It should safeguard the security of the rights and investments of the private sector, communities, and indigenous people over their tenured areas.
oPerATIoNAL reCoMMeNdATIoNs
While policy initiatives had been undertaken to involve other sectors in forest management, it is crucial to decentralize forest management functions at the local level. Considering that LGUs have their political units down to the barangay level, it is strategic that they be given the responsibility, authority and accountability in managing the forests under their jurisdiction. A more substantive co-management / collaborative arrangement is therefore required in the four provinces in this study and in other areas, which will go beyond mere road planting activities. This should enable the provision of tenure instruments, e.g. by sub-agreements under co-management agreements recognized by DENR, thus decentralize to LGUs the responsibility and authority on forest protection and law enforcement, rehabilitation and even developing sustainable financing systems to support forest management operations. It must also allow LGUs, DENR, POs and other stakeholders to jointly develop and implement forest protection schemes for effective law enforcement to prevent expansion of new kaingin as well as illegal cutting of existing forests.
To facilitate the implementation and monitoring of FLUPs at the municipality, each LGU has to invest in regular updating of its forest cover and land use data and implement a national database system. It will guide the establishment of reference emission levels / reference levels and monitoring of REDD-plus particularly in measuring, reporting and verification of reduced emissions from deforestation and forest degradation.
FlUPs developed should support priority development and livelihood programs of LGUs as identified in their comprehensive land use and development plans. Private investors may be encouraged to develop sources of raw materials in the production zones as identified in the FLUP to support existing and priority industries in urban centers. LGUs can support these initiatives and provide incentives to investors if they can realign / relocate their infrastructure development projects, such as roads, towards identified production forestlands. These measures can lead to development of downstream industries and other value added processing which can provide employment and alternative livelihood and reduce pressure on existing natural forests.
The measures identified above should be complemented with a massive information and education campaign to raise awareness of local communities on the importance of forests in terms of sustaining local livelihood and water sources as well as in mitigating adverse impacts of climate change (including REDD-plus mechanisms). Along with this, a comprehensive capability enhancement training program for DENR, LGUs and other stakeholders is necessary to improve multi- sector collaboration,
99Analysis of Key Drivers of Deforestation and Forest Degradation in the Philippines Analysis of Key Drivers of Deforestation and Forest Degradation in the Philippines
and enhance knowledge and skills in forest law enforcement, forest rehabilitation (such as rainforestation and agroforestry) and implementation of appropriate farming systems in the uplands. LGUs will also need training on developing sustainable sources of financing for forest protection, conservation and rehabilitation activities. This can include designing a scheme on benefit-sharing mechanisms under REDD-plus, or public-private partnership in forest management and development.
While promoting partnerships and multi-sector collaboration, stakeholders should also be held accountable for their actions and decisions. This requires appropriate monitoring and evaluation systems to track progress on commitments of different stakeholders in the collaborative partnership. As such, appropriate and acceptable criteria and indicators have to be developed which will measure progress towards agreed actions and commitments of various stakeholders.
The country’s participation in anti-corruption efforts such as those under the United Nations Convention against Corruption (UNCAC), the global Forest Law Enforcement, Governance and Trade (FLEGT) initiative, the UN-REDD programme, Transparency International through its Forestry Integrity Programme, and related efforts presently undertaken by bilaterals, including Germany through GIZ, should be mainstreamed at all concerned government agencies at the national and local levels. It could include improving criminal justice to combat illegal logging among many efforts to promote transparency, participation, and accountability in all decision-making levels from forest allocation to monitoring and enforcement.


references


103
reFereNCes
Abate, T., 1992: Into the northern Philippines rainforest. BioScience, 42:246-251
Acosta, R.T. 2008: Deforestation in the Philippines. A reaction paper presented during the Country Environmental Analysis Workshop. Discovery Suite, Ortigas Center. June 16, 2008
AGS Southern Leyte Profile.nd.: www.dongsaludo.com / southern_leyte_profile2.htm
ALDAW Network (Ancestral Land / Domain Watch). 2010: Oil palm expansion: A new threat to Palawan UNESCO Man and Biosphere Reserve. http://indigenouspeoplesissues.com / index.php?option=com_content&view=article&id=7591:philippines-oil-palm-expansion-a-new-threat-to-unesco-qman-and-biosphere-reserveq-and-indigenous-peoples&catid=32:southeast-asia-indigenous-peoples&Itemid=65 (Published on Wednesday, 17 November 2010)
Amorsolo, V.B. et al. 2002: Participatory Inventory and Assessment of Plants In Malindang Range Natural Park, Mindanao Island, Philippines. Biodiversity Research Programme for Development in Mindanao: Focus on Mt. Malindang. Draft Final Report. Netherlands Development Assistance Research Council and SEAMEO Regional Center for Graduate Study and Research in Agriculture, Los Baños, Laguna, Philippines
Anahao Multi-purpose Cooperative (AMPCO), Bontoc, Southern Leyte Community Resource Management Framework
Anda, R.D. and J.G. Tabangay-Baldera (eds). 2004: Surublien: Strategies to conserve Palawan’s biodiversity. Provincial Government of Palawan, Palawan Council for Sustainable Development Staff, Department of Environment and Natural Resources-MIMAROPA Region IV, Palawan NGO Network, Inc., and Conservation International Philippines, Puerto Princesa City, Philippines. 124pp.
Anda, G.M. 2011: Should mining be allowed in island ecosystems: A look into Palawan. Part of the Study of the Ateneo School of Government on the Future of Mining in the Philippines.
Arances, J.B., V.B. Amorsolo, et al. 2002: Development of Participatory Methodology for Inventory and Assessment of floral resources and their characterization in the montane forests of Mt. Malindang. Draft final report. Biodiversity Research Programme for Development in Mindanao: Focus on Mt. Malindang. Netherlands Development Assistance Research Council and SEAMEO Regional Center for Graduate Study and Research in Agriculture, Los Baños, Laguna, Philippines
Arguelles, M.S. March 26, 2012: ‘In Bicol, execs point to seized logs as trophies’. Inquier News. http://newsinfo.inquirer.net / 167205 / in-bicol-execs-point-to-seized-logs-as-trophies
Arquiza, Y.D., M.C.S. Guerrero, A.B. Gatmaytan, and A.C. Aquino. 2010: From barter trade to Brad Pitt’s Bed: NTFPs and Ancestral Domains in the Philippines. In Wild Product Governance: Finding policies that work for non-timber forest products. S.A. Laird, R.J. McLain and R.P. Wynberg (Eds.). Earthscan, London, Washington, DC
ADB. 1994. The Philippine Mineral Sector to 2010: Policy and recommendations. Asian Development Bank Mineral Sector Study
Asio, V. 2011: The impacts of mining in the Philippines. Soil and environment blog. http://soil-environment.blogspot.com / 2011 / 09 / impacts-of-mining-in-philippines.html
Bacalla, T.T. Undated: Promoting Equity: A Challenge in the Implementation of Community-Based Forest Management Strategy in the Philippines. https://www.eastwestcenter.org / fileadmin / stored / misc / HangingInBalance11Philippines.pdf

104 Analysis of Key Drivers of Deforestation and Forest Degradation in the Philippines
BAPPENAS. 2010: Draft National Strategy REDD+. http://forestclimatecenter.org / files / 2010-09-03%20National%20Strategy%20REDD+%20DRAFT%201.pdf
Belcher, B., M. Ruiz-Perez, and R. Achdiawan. 2005: Global patterns and trends in the management of commercial NTFPs: Implications for livelihoods and conservation. World Development 33(9): 1435-1452
Bensel, T.G. and E. M. Remedio. 1993: Patterns of commercial woodfuel supply, distribution and use in the city and province of Cebu Philippines. Bangkok: Food and Agriculture Organization of the United Nations –Regional Wood Energy Development Programme in Asia, Field Document No. 42.
Bensel, T.G. and D.M. Kummer. 1996: Fuelwood consumption and deforestation in the Philippines. Human Organization 55(4). Society for Applied Anthropology, USA
Bensel, T.G. and E.M. Remedio. 2002: Woodfuel consumption and production in the Philippines: a desk study. FAO Bangkok, unpublished report.
Bertschi, T.T., R.J. Yokelson, D.E. Ward, T.J. Christian, and W.M. Hao. 2003: Trace gas emissions from the production and use of domestic biofuels in Zambia measured by open-path Fourier transform infrared spectroscopy. J. Geophys. Res., 108(D13) http://www.agu.org / pubs / crossref / 2003 / 2002JD002158.shtml
BIP. 2012: Biodiversity Indicators Partnership. http://www.bipindicators.net / forestdegradation
Biodiversity Research Programme. 2000: Philippine-Netherlands Biodiversity Research Programme for Development in Mindanao: Focus on Mt. Malindang. Netherlands Development Assistance Research Council and SEAMEO Regional Center for Graduate Study and Research in Agriculture, Los Baños, Laguna, Philippines
Bontoc, 2000: Municipal Development Plan (1999-2010), Bontoc, Southern Leyte
Boucher, D., P. Elias, K. Lininger, C. May-Tobin, S. Roquemore, and E. Saxon. 2011: The Roots of the Problem: What’s Driving Tropical Deforestation Today? The Union of Concerned Scientists. www.ucsusa.org / whatsdrivingdeforestation
Bugayong, L.A. 2006: Effectiveness of logging ban policies in protecting the remaining natural forests of the Philippines. Paper presented at the 2006 Berlin Conference on Human Dimensions of Global Environmental Change – Resource Policies: Effectiveness, Efficiency, and Equity, held at Freie University, Berlin, Germany, on 17-18 November 2006
Cali, C., J.B. Arances, E.G. Tobias, E.M. Sabado, A.A. Alicante, L.B. Ledres, O.M. Nuñeza and D. Ramirez. 1999: Participatory rural appraisal: A Tool for biodiversity research programme identification in the upland ecosystem of Mt. Malindang in Misamis Occidental, Mindanao islands, Philippines. Biodiversity Research Program for Development in Mindanao: Focus on Mt. Malindang, SEAMEO Regional Center for Graduate Study and Research in Agriculture, Los Baños, Laguna, Philippines
Carandang, A.P. et al. 1999: Wood Supply and Demand Study / Wood Balance Model: Mainland Palawan. Forestry Development Center, UPLB-CFNR through UPLBFI and Palawan Tropical Forestry Protection Program
Carandang, A.P. 2001: Fuelwood supply and demand study: Mainland Palawan. In Woodfuel Production, Trade and Education in the Philippines. RWEDP Report No. 60. Regional Wood Energy Development Programme in Asia. Bangkok: Food and Agriculture Organization of the United Nations
Carandang, A. P. 2008: The Forestry Sector: Costs of Environmental Damage and Net Benefits of Priority Interventions. A contribution to the Philippines Country Environmental Analysis, World Bank Philippines

105Analysis of Key Drivers of Deforestation and Forest Degradation in the Philippines Analysis of Key Drivers of Deforestation and Forest Degradation in the Philippines
City of Maasin , Southern Leyte. 2009: Ecological Profile
Colchester, M. 2011: Palm oil and indigenous people in Southeast Asia. The International Land Coalition http://www.forestpeoples.org / sites / fpp / files / publication / 2010 / 08 / palmoilindigenouspeoplesoutheastasiafinalmceng_0.pdf
Cordillera People’s Alliance. 2007: Case study on the impacts of mining and dams on the environment and indigenous peoples in Benguet, Cordillera, Philippines. In International Expert Group Meeting on Indigenous Peoples and Protection of the Environment, UN-UNIES Department of Economic and Social Affairs.
Cruz, M.C.J., I. Zosa-Ferranil, and C. L. Goce. 1998: Population pressure and migration: Implications for upland development in the Philippines. Journal of Philippine Development No. 26, Vol. XV (1)
Cruz, M.C.J., I. Zosa-Ferranil, and C. L. Goce. 1986: Population pressure and migration: Implications for upland development in the Philippines. Philippine Institute for Development Studies and Center for Policy Development Studies Working Papaer 86-06.
DENR, 1990: DAO No. 5, 1990. Amendment to DENR Order No. 19, Series of 1989 on Lumber Export Ban
DENR, 2000: Mt. Malindang Natural Park Management General Management Plan. August 2000. Description Analysis and Prescriptions. Volume 1. NIPAP. A special project of the DENR supported with a grant from EU (B7-504 1 / 93 / 20).
DENR, 2000: Mt. Malindang Natural Park Management Manual incorporating the Park Management Plan 2001- 2003, Department of Environment and Natural Resources , Oroquieta City, July 2000
DENR, Region VIII, Office of the Regional Executive Director, Tacloban City. 2010: Narrative Report on the Field Inspection Relative to DENR Regional Special Order No. 181, S- 2010 Pursuant to Joint DAR-DENR MC No. 9, S- 1995. September 16, 2010
DENR-MGB, 2010: The Philippine Minerals Industry at a glance. MGB-DENR http://www.mgb.gov.ph / Files / ItemLinks / ThePhilippineMineralsIndustryAtAGlance.jpg
DENR-NIPAS Programme. 2000a: Management Strategy for Mt. Malindang. 22 pp.
DENR-NIPAS Programme. 2000b: Summary: General Management Plan, Mt. Malindang Natural Park (2000-2003). Misamis Occidental, Northwestern Mindanao, Philippines.
DENR-NAMPRIA. 1989: Mt. Malindang topographic map. Sheet 3744 IV. Reprint of 1956 compilation. DENR NAMPRIA, Fort Bonifacio, Makati, Metro Manila
DENR, various dates: Philippine Forestry Statistics. 1980, 2003, 2006, 2008, 2011. Forest Management Bureau, Department of Environment and Natural Resources, Quezon City, Philippines.
Dingal, Rolando and Joji Balcita. October 2000-January 2001: Mt. Malindang Natural Park. Suhay. Pp. 30-31
Dy, R.T. 2011: Palm oil: The much ignored poverty reduction strategy. Deforestationwatch.org http://deforestationwatch.org / index.php / Key-Papers / Palm-Oil-The-Much-Ignored-Poverty-Reduction-Strategy.html
Esteban. nd.: ‘Narra town, Palawan province, MIMAROPA Region (4), Luzon, Philippines: Brief History.’ http://home.comcast.net / ~maesteban / island_groups / luzon / region4b / palawan / towns / narraprofile.htm
Ewers, R. 2006: Interaction between economic development and forest cover determine deforestation rates. Global Environmental Change 16:161-196

106 Analysis of Key Drivers of Deforestation and Forest Degradation in the Philippines
Fitzherbert, E.B., M.J. Struebig, A. Morel, F. Danielsen, C.A. Bru, P.F. Donald and B. Phalan. 2008: How will palm oil expansion affect biodiversity? Trends in ecology and evolution 23 (10)
Food and Agricultural Organization (FAO) of the United Nations. 2005 and 2010: Global Forest Resources Assessment.
Forest Management Bureau. 2011: List and status of timber license agreements (TLAs), integrated forest management agreements (IFMAs), socialized industrial forest management agreements (SIFMAs), community-based forest management agreements (CBFMAs) in the Philippines. DENR, Quezon City.
Forestry Development Center. 1986: Assessment of Cancelled / Suspended / Terminated Timber License Agreement (TLA) Areas in the Philippines. FDC-UPLB-CFNR, College, Laguna
Garrity, D.P., Kummer, D.M. and Guiang, E.S. 1992: The upland ecosystem in the Philippines: alternatives for sustainable farming and forestry. A study commissioned by the National Research Council Project on Agricultural Sustainability and the Environment in the Humid Tropics. National Academy Press, Washington, DC
Geist, H. and E. Lambin. 2001: What drives tropical deforestation? A meta-analysis of proximate and underlying causes of deforestation based on subnational case study evidence. LUCC (Land Use and Land Use Cover Change) report series No. 4, Louvain.
General Nakar, 2009: Municipal Socio-Economic Profile (MSEP) of General Nakar, Quezon
Global Forest Coalition. 2010: Getting to the Roots: Underlying causes of deforestation and forest degradation, drivers of forest restoration. www.globalforestcoalition.org
Grainger, A. 1993: Controlling Tropical Deforestation. Earthscan, London
Groetschel, Andreas, R. R. Aquino, I. Buchholz, T.G. Eufracio-Mazo, A.Ibkendanz, N. A. Sales J. Seven and K. C. Vicentuan. 2001: Natural Resource Management Strategies on Leyte Island, Philippines. Berlin, November 2001
Gupta, J. Undated: REDD WP4: Comparative analysis of cast studies. IVM Institute for Environmental Studies, Amsterdam. http://www.gildedeu.org / sites / www.redd-alert.eu / files / closedaccess / 7.Comparative%20analysis%20O%20Kuik.pdf
Hansel, C.G., T.O. Poblete, V. T. Quimpang, R.A.C. Lumactud, D. Ganob, E. Lumimas, L. Pacut, and R. Panchito.2004: Participatory Biodiversity Inventory and Assessment of Lake Duminagat, Mt. Malindang Natural Park, Misamis Occicental. ISBN 971-560-113-8. Phil. Biodiversity Research Programme (BRP) for Development in Mindanao: Focus on Mt. Malindang and Environs. SEAMEO SEARCA, College, Laguna.
Ingelson,A., W. Holden, and M. Bravante. 2009:. Philippine Environmental Impact Assessment, Mining and Genuine Development. 5 / 1 Law, Environment and Development Journal http://www.lead-journal.org / content / 09001.pdf
IPCC, 2000: Land Use, Land-Use Change and Forestry. Robert T. Watson, Ian R. Noble, Bert Bolin, N. H. Ravindranath, David J. Verardo and David J. Dokken (Eds.). Cambridge University Press, UK. pp 375
Kahupian Upland Farmers Association, Inc. (KUFAI), Brgy. Katipunan, Silago, Southern Leyte Community Resource Management Framework
Kaimowitz, D. and A. Angelsen. 1999: The World Bank and Non-Forest Sector Policies that Affect Forests. Centre for International Forestry Research, Indonesia.

107Analysis of Key Drivers of Deforestation and Forest Degradation in the Philippines Analysis of Key Drivers of Deforestation and Forest Degradation in the Philippines
Kaimowitz, D., Byron, N. and Sunderlin, W. 1998: Public policies to reduce inappropriate deforestation. In: Lutz, E. (ed.) Agriculture and the environment: Perspectives on sustainable rural development, World Bank, Washington D.C. p 303-322.
Kanninen, M., D. Murdiyarso, F. Seymour, A. Angelsen, S. Wunder, and L. German. 2007: Do trees grow on money? The implications of deforestation research for policies to promote REDD. Center for International Forestry Research (CIFOR), Bogor, Indonesia
Katipunan, Imelda, Catmon Community Forestry Association, Inc. (KICCFA), Southern Leyte Community Resource Management Framework.
Kummer, D. and Sham, C.H. 1994: The causes of tropical deforestation: a quantitative analysis and case study from the Philippines. In The causes of tropical deforestation, K. Brown and D.W. Pearce (eds.). UCL Press Ltd., London
Kummer, D.M., 1992a: Deforestation in the post-war Philippines. University of Chicago Press, Chicago, IL
Kummer, D M. 1992b: ‘Upland agriculture, the land frontier and forest decline in the Philippines’, Agroforestry Systems 18:31-46
Kusters, K., R. Achdiawan, B. Belcher, and M. Ruiz-Perez. 2006: Balancing development and conservation? An assessment of livelihood and environmental outcomes of nontimber forest product trade in Asia, Africa, and Latin America. Ecology and Society 11(2):20. http://www.ecologyandsociety.org / vol11 / iss2 / art20 /
Kuvan, Y. 2005: The use of forests for the purpose of tourism: the case of Belek Tourism Center in Turkey. Journal of Environmental Management 75 (2005) 263-274
Lacson, N.E. 2012: ‘Philippines: Rubber tree propagation gains popularity’. The Manila Bulletin. http://pakagri.blogspot.com / 2012 / 04 / philippines-rubber-tree-propagation.html
Lanly, J.P. 2003: Deforestation and Forest Degradation Factors. Paper Presented at the XII World Forestry Congress, Quebec City
Lanuzo, Marilanie A. and Alaric Francis T. Santiaguel. 2002: A report on “The Mount Malindang Biodiversity Project” from SEAMEO Horizon 2001. ISSN 1513-1165. Vol. 2 No. 1. SEAMEO in the 21st Century. 18 October
Lasco, R.D. 1998: Management of tropical forests in the Philippines: Implications to global warming. World Resource Review. 10(3): 410-418
Lasco, R.D. and F.B. Pulhin. 2009: Carbon budgets for forest ecosystems in the Philippines. Journal of Environmental Science and Management 12 (1):1-13
Lasco, R.D. and F.B. Pulhin. 2003: Philippine forest ecosystems and climate change: Carbon stocks, rate of sequestration and the Kyoto Protocol. Annals of Tropical Research 25(2): 37-51
Lasco, R.D. and F.B. Pulhin. 2001: Climate change mitigation activities in the Philippine forestry sector: Application of the COMAP Model. Mitigation and Adaptation Strategies for Global Change 6:313-334, Kluwer Academic Publishers, Netherlands
Lawrence, A. 1997: Kaingin in the Philippines: is it the end of the forest? Rural Development Network Paper 21f. http://www.odi.org.uk / resources / docs / 1158.pdf
Lindberg, K., B. Furze, M. Staff, and R. Black. 1997: Ecotourism and other services derived from forests in the Asia-Pacific Region: Outlook to 2010. Working Paper No.: APFSOS / WP / 24, FAO, USDA

108 Analysis of Key Drivers of Deforestation and Forest Degradation in the Philippines
Liu, D.S., Iverson, L.R. and Brown, S., 1993: Rates and patterns of deforestation in the Philippines: application of geographic information system analysis. For. Ecol. Manage., 57: 1-16.
Mongabay.com, 2009: ‘Malaysian palm oil firms seek 100,000 ha in the Philippines’. June 08, 2009. http://news.mongabay.com / 2009 / 0608-mindanao_palm_oil.html
Manio, E. 2011: ‘P2.5M illegal logs seized in Quezon’. ABS-CBN News. http://www.neilauza.com / 2011 / 09 / p25m-illegal-logs-seized-in-quezon.html
Marata, Mars S. 2004: Indigenous People’s Watch “What Future Will We Give Our Children’. Subanen tribes endangered. Aug. 15-21, 2004. Bulatlat, Vol. IV. No. 28. Quezon City Philippines
Miranda, M., P. Burris, J.F. Bingcang, P. Shearman, J.O. Briones, A. La Vina, and S. Menard. 2003: Mining and critical ecosystems: Mapping the risks. World Resources Institute.
Molina, A. 1961: The Philippines: Through the centuries. Manila: University of Sto. Tomas Cooperative
Mongaya, C.R. March 19, 2012: ‘Cebu tops illegal logs destination in Region 7’. Inquirer News. http://newsinfo.inquirer.net / 163865 / cebu-tops-illegal-logs-destination-in-region-7
Municipality of Maasin, Southern Leyte. 1995-2004: Comprehensive Development Plan
Municipality of Silago, Southern Leyte. 2010: Comprehensive Development Plan
Municipality of Sogod, Southern Leyte. 2010: Ecological Profile
Municipality of Tomas Oppus, Southern Leyte. 2002: Comprehensive Land Use Plan, 2002-2011
Murdiyarso, D., M. Skutsch, M. Guariguata, M. Kanninen, C. Luttrell, P. Verweij and O. Stella. 2008: Measuring and monitoring forest degradation for REDD. Infobrief No. 16. CIFOR. http://unfccc.int / files / methods_science / redd / application / pdf / measuring_and_monitoring_forest_degradation_for_redd.pdf
Nabuurs, G.J., O. Masera, K. Andrasko, P. Benitez-Ponce, R. Boer, M. Dutschke, E. Elsiddig, J. Ford-Robertson, P. Frumhoff, T.Karjalainen, O. Krankina, W.A. Kurz, M. Matsumoto, W. Oyhantcabal, N.H. Ravindranath, M.J. Sanz Sanchez, X. Zhang, 2007: Forestry. In Climate Change 2007: Mitigation. Contribution of Working Group III to the Fourth Assessment Report of the Intergovernmental Panel on Climate Change [B. Metz, O.R. Davidson, P.R. Bosch, R. Dave, L.A. Meyer (eds)], Cambridge University Press, Cambridge, United Kingdom and New York, NY, USA.
Najaro, N.B. March 22, 2012: ‘P14.9M worth of illegal logs seized on joint gov’t operations’. Philippine Information Agency. http://www.pia.gov.ph / news / index.php?article=1701332388508
Omura, M. 2006: The breakdown of cooperation and environmental degradation: An analytical framework. Kobe University Economic Review 53: 63-78
Pamintuan, M. 2011: Philippine forests. Philippine Daily Inquirer June 5th, 2011
Paul, K.I., T.H. Booth, A. Elliott, M.U.F. Kirshbaum, T. Jovanovic, and T.J. Polglase. 2006: Net carbon dioxide emissions from alternative firewood production systems in Australia. Biomass and Bioenergy, 30(7): 638-647
Palawan Council for Sustainable Development (PCSD). 2010: State of the Environment 2009 Updates, Province of Palawan, Philippines. Palawan Council for Sustainable Development, Puerto Princesa City
Pereira, R.A., J. Epting, D. Juhn, O. Coroza, L. Miller, and F. Maon. 2006: Forest clearance and fragmentation in Palawan and Eastern Mindanao Biodiversity Corridors (1990-2000): A time sequence analysis of LANDSAT Imagery. Banwa 3(1&2): 130-147
109Analysis of Key Drivers of Deforestation and Forest Degradation in the Philippines Analysis of Key Drivers of Deforestation and Forest Degradation in the Philippines
PalmOilHq, 2009: ‘Philippines eyes foreign investors for palm oil industry”. June 17, 2009. PalmOilHq http://www.palmoilhq.com / PalmOilNews / philippines-eyes-foreign-investors-for-palm-oil-industry /
Philippine National REDD-plus Strategy (PNRPS). 2010.
Poffenberger, M. 2009: Forests and climate change: Mitigating drivers of deforestation. www.communityforestryinternational.org
Pulhin, J, U. Chokkalingam, R. Peras, R. Acosta, A. Carandang, M. Natividad, R. Lasco and R. Razal. 2006: Chapter II- Historical overview. In Review of Forest Rehabilitation: Lessons from the Past, CIFOR, Bogor?
Puntana Livelihood Project and Environment Association, Inc. (PLPEA), Brgy. Puntana, Silago, Southern Leyte. Undated: Community Resource Management Framework
Remedio, E.M. 2009: An analysis of sustainable fuelwood and charcoal production systems in the Philippines: A case study. In Criteria and indicators for sustainable woodfuels: Case studies from Brazil, Guyana, Nepal, Philippines and Tanzania. S. Rose, E. Remedio, M. Trossero (Eds.). FAO-UN, Rome, Italy
Repetto, G. and M. Gillis. 1988: Public policies and the misuse of forest resources. Cambridge University press, Cambridge
Reumerman, P.J. and B. Frederiks. 2002: Charcoal production with reduced emissions. In European Conference on Biomass for Energy, Industry and Climate Protection, Amsterdam http://www.cleanfuels.nl / Projects%20&%20publications / Charcoal%20Production%20with%20Reduced%20Emissions%20(paper).pdf
Sanz, M.J. 2007: Reducing emissions from deforestation in developing countries (REDD). COM+ Media Training, Vienna, 29 August 2007
Schoene, D., W. Killmann, H.V. Lupke, and M. LoycheWilkie. 2007: Definitional issues related to reducing emissions from deforestation in developing countries. Forests and Climate Change Working Paper 6. Food and Agriculture Organization of the United Nations
Sogod, 2001-2010: Municipal Development Plan, Sogod, Southern Leyte
Southern Leyte. 2010-2015: Provincial Development and Physical Framework Plan ( PDPFP)
Southern Leyte. 2011: Provincial Environment and Natural Resources Office (PENRMO)
The Provincial Profile of Southern Leyte. Nd.: http://www.oocities.com / ppsec / pp / sleyte.htm
Theobald, W.F. (ed.). 2005: Global Tourism. Elsevier Inc. USA
Tomas Oppus, 2008: Municipal Profile , Tomas Oppus, Southern Leyte
Tomas Oppus Forest Developers Association, Inc. (TOFDA), Brgy. Hinapo, Tomas Oppus, Southern Leyte. Undated: Community Resource Management Framework
UNFCCC, 2006: Background paper for the Workshop on reducing emissions from deforestation and forest degradation. Working paper No. 1 (b). Rome, Italy.
UN-REDD Programme Indonesia. Undated: Central Sulawesi’s Readiness to Implement REDD+ after 2012. UNDP-FAO-UNEP, Jakarta, Indonesia http://un-redd.or.id / download / publications / Central%20Sulawesi%20Readiness%20to%20Implement%20REDD%20%202012%20-%201.pdf

110 Analysis of Key Drivers of Deforestation and Forest Degradation in the Philippines
Urriza, Rolly C., Michael J. Edrial and Arnel Almazan. 2007: Preliminary Survey of the Biodiversity Assemblage within a Secondary Growth Medium Altitude Dipterocarp Forest on Mts. Irid-Angelo, General Nakar, Quezon.
Van Noordwijk, M. and Minang, P.A. 2009: “If we cannot define it, we cannot save it” ASB PolicyBrief No. 15. ASB Partnership for the Tropical Forest Margins, Nairobi, Kenya. Available at: www.asb.cgiar.org
Varghese, P. 2009: An overview of REDD, REDD plus and REDD readiness. Presentation at the International Conference on Community Rights, Forests and Climate Change. New Delhi, India, 17-19 August 2009. http://www.rightsandresources.org / documents / files / doc_1220.pdf (Retrieved 1 February 2012)
Verolme, Hans J.H. and Moussa, Juliette. 1999: Addressing the Underlying Causes of Deforestation and Forest Degradation - Case Studies, Analysis and Policy Recommendations. Biodiversity Action Network, Washington, DC, USA. x + 141 pp.
Vitug, M.D. 1993: The Politics of Logging: Power from the Forest. Philippine Center for Investigative Journalism, Philippines
Wallace, B.J. 2001. Small-time operations – big time loss: Illegal logging in the northern Philippines. In Agroforestry Today 13 (1-2): 16-18
Wertz-Kanounnikoff and Kongphan-Apirak. 2008: Reducing forest emissions in Southeast Asia: A review of drivers of land-use change and how payments for environmental services (PES) schemes can affect them. CIFOR.
Wilcove, D.S. and L.P. Koh. 2010: Addressing the threats to biodiversity from oil-palm agriculture. Springer Science+Business Media B.V. http://www.ecology.ethz.ch / publications / 2010 / 2010 / Wilcove_2010_BiodiversityConservation.pdf
World Rainforest Movement. 2003: Dams: Struggles against the modern dinosaurs. NOVIB, Swedish Society for Nature Conservationa, and Rainforest Programme of the Netherlands Committee for IUCN.
WWF, n.d: ‘Palm oil and deforestation”. http://www.wwf.org.au / our_work / saving_the_natural_world / forests / palm_oil / palm_oil_and_deforestation /
Yakap Kalikasan Tungo sa Kaunlaran ang Pilipinas, Inc. (YKKPI). 2005: Profile of the Southern Sierra Madre Conservation Area: Provinces of Bulacan, Rizal, and Quezon.
Young Innovators for Social and Environment Development Association, Inc (YISEDA), Sitio Canlugok, Brgy. Lunas, Maasin City. Undated: Community Resource Management Framework

Analysis of Key Drivers of Deforestation and Forest Degradation in the Philippines

Deutsche Gesellschaft fürInternationale Zusammenarbeit (GIZ) GmbH
Registered officesBonn and Eschborn, Germany
Department of Environmentand Natural ResourcesClimate Change Office2nd Floor, FASPO BuildingVisayas Avenue, Quezon City, 1101Philippines
ContactDr. Bernd-Markus LissPrincipal AdvisorClimate-relevant Modernization ofForest Policy and Piloting of REDD
Tel. +63 2 929 6626 loc 207Fax +62 2 892 3374Email: [email protected]