An Phromh-Oifig Staidrimh Central Statistics Office
79
An Phríomh-Oifig Staidrimh Central Statistics Office Published by the Stationery Office, Dublin, Ireland. To be purchased from the: Central Statistics Office, Information Section, Skehard Road, Cork, Government Publications Sales Office, Sun Alliance House, Molesworth Street, Dublin 2, or through any bookseller. Prn A11/1239 Price €15 July 2011
Transcript of An Phromh-Oifig Staidrimh Central Statistics Office

An Phríomh-Oifig Staidrimh
Central Statistics Office
Published by the Stationery Office, Dublin, Ireland.
To be purchased from the:
Central Statistics Office, Information Section, Skehard Road, Cork,
Government Publications Sales Office, Sun Alliance House,Molesworth Street, Dublin 2,
or through any bookseller.
Prn A11/1239 Price €15 July 2011

© Government of Ireland 2011
Material compiled and presented byCentral Statistics Office.
Reproduction is authorised, except for commercialpurposes, provided the source is acknowledged.
ISSN 2009-4167
ISBN 978-1-4064-2552-9
Contents
Page
Chapter 1 Background to the Pilot National Travel Survey (NTS) 2009 5
Chapter 2 Key Findings 7
2.1 Personal travel 7
2.2 Gender differences 12
2.3 Public transport 13
2.4 Vehicle ownership and usage 13
Chapter 3 Weekly Travel Patterns 15
Chapter 4 Why People Travel 17
Chapter 5 How People Travel 19
Chapter 6 Distance Travelled 23
Chapter 7 Duration of Journeys 27
Chapter 8 When & How Fast People Travel 31
Chapter 9 Variations in Travel by Distance 35
Chapter 10 Travel by ILO Status 39
Chapter 11 Public Transport, Vehicle Ownership/Usage & Driving Licences 43
11.1 Availability and use of local public transport 43
11.2 Driving licences 46
11.3 Vehicle ownership, usage and parking 47
Chapter 12 Travel and Age 51
Appendix A Background Notes 57
Appendix B National Travel Survey 2009 – Questionnaire 63
Appendix C National Travel Survey 2009 – Sample Characteristics 69
List of Tables 75
List of Figures 77
3


Chapter 1
Background to the Pilot NationalTravel Survey (NTS) 2009
The Quarterly National Household Survey (QNHS)1 is a comprehensive nationwide survey of households designed toprimarily produce quarterly labour force estimates. It also covers topics of specific social interest in additionalmodules each quarter. The module conducted in the fourth quarter of the 2009 QNHS was the pilot National TravelSurvey (NTS), which was commissioned and part funded by the Department of Transport, Tourism and Sport.
It is internationally accepted that the most comprehensive method to collect data on transport modal splits2 is to haverespondents complete a seven day travel diary. However, to reduce respondent burden and increase response rates,many countries have adopted an alternative of a 24 hour diary. This latter methodology was used for the collection ofthe NTS 2009 data. To ensure that data was collected for all seven days of the week, each person participating in theNTS was assigned a randomly selected ‘travel reference day’. This 24 hour reference period commenced at 4 am onthe nominated day and finished at 3.59 am the following morning.
The NTS surveyed one randomly selected person, aged 18 years and over, from each household across waves3
three and five of the QNHS sample. Prior to their travel reference day, each selected person was issued with a traveldiary to record their travel details. After the travel reference day, these individuals were contacted by QNHSinterviewers and either interviewed in person or by telephone to complete the survey questionnaire. Respondentsused their ‘travel diary’ to aid recall of their travel details. In the event that the selected persons failed to record therequired information in their travel diaries, details of their travel for the 24 hour period ending at 3.59 am on the day ofthe interview were collected instead.
The NTS is one of the most comprehensive household studies of travel patterns and transport demand ever to beconducted within the state. Information on access to and use of public transport, cars and other vehicles was collectedfrom 7,245 households nationwide. Detailed information on travel was then collected from one randomly selectedindividual from each of these households. In total, 7,2214 adults provided information on travel. The informationcollected included the following:
• number of journeys made• reason for making each journey• mode(s) of transport used• the time each journey commenced and ended• the duration of each journey• distance travelled
1 For further details on the QNHS, see: http://www.cso.ie/qnhs/about_qnhs.htm
2 Modal split refes to the different types and combination of transport options that people use, eg, train, car
3 Each household selected for the QNHS survey is surveyed for five consecutive quarters. The first quarter that a household is surveyed is referred to as wave one,the second wave two, etc
4 See Appendix C: National Travel Survey 2009 - Sample Characteristics for detailed information on the sampled households and individuals
5

The NTS 2009 results are based on the information collected from a sample of individuals aged 18 and over5. Onlytravel within the island of Ireland, made by residents of the state, was included in the survey. While the NTS collectedinformation on work related travel for most occupations, it excluded the business related travel of professional drivers(e.g. bus and taxi drivers) and other occupations where travel is integral to the role (e.g. postal delivery workers). It isimportant when interpreting the figures and comparing them to other data sources to note that the NTS journeypurpose of 'work' includes both commuter and business travel.
All results on individual travel contained in this publication are grossed at the level of gender, age group and region toindependently determined estimates of the population aged 18 and over for the fourth quarter of 2009. All householdresults are also grossed to independently determined estimates of the number of households at regional level for thesame period.
As all estimates from sample surveys are subject to a margin of error, the 2006 Census of Population travel to work,school and college dataset (Place Of Work Census of Anonymised Records - POWCAR) should be used as thedefinitive source of data on travel to work, school and college. It is also worth noting that the results contained in thispublication are based on travel patterns for a particular quarter, which may not be representative of the year as awhole. Therefore, particular care should be taken when interpreting the results, especially if extrapolating them toannualised results. For further guidelines on using the NTS data, please refer to Appendix A: Background Notes.
5 Additional information on the sampling methodology can be found in Appendix A: Background Notes
6

Chapter 2
Key Findings
2.1 Personal travel
The average journey was 13 kilometres and took 24 minutes to complete.
Respondents travelled 2.4 journeys on average per day with little or no difference in the number of journeys made byurban and rural respondents.
The sampled population6 made an average of 17 journeys, travelled a distance of 221 kilometres and spent 403minutes travelling per week.
Eighteen percent of respondents stated that they did not make any relevant journey7 on the travel reference day.
Rural respondents made fewer journeys but travelled further than urban respondents. The average journey made byrural respondents was 80% longer in distance than the average journey undertaken by urban respondents. Despitethis, there was little or no difference in the average duration of journeys undertaken by urban and rural respondents.
6 Population refers to the estimated population aged 18 and over for quarter 4 2009
7 Relevant journeys refer to journeys within the island of Ireland
7
Table 1: Average Weekly Travel Profile by Urban/Rural Residency
Urban/Rural Journeys Distance Travel Time
number kilometres minutes
Urban 18 180 414
Rural 16 286 387
State 17 221 403
Table 2: Average Journey Profile by Urban/Rural Residency
Urban/Rural Distance Duration
kilometres minutes
Urban 10 23
Rural 18 24
State 13 24

25%
3%
23%9%
17%
9%
4%
10%
Figure 1: Percentage Distribution of Journeys by JourneyPurpose
Work
Education
Shopping/Food/Drink
Personal Business
Visit Family/Friends & Social/Entertainment
Companion Journey to/from Education
Other Companion Journey
Other
The two most common reasons for making a journey were work related8 (25%), followed by shopping/food/drink(23%). Visit Family/Friends & Social/Entertainment accounted for a further 17% of all journeys.
Private cars were the most frequently used method of travel, with 73% of all journeys made by private car, 64% bydrivers and a further nine percent by passengers.
Four percent of all journeys were made by bus. There was a significant difference in the mode share of busesbetween urban and rural respondents at six percent and one percent respectively (See Table 17).
The average journey made by drivers of private cars was 14 kilometres and took 23 minutes to complete.
Walking was the second most popular mode of travel, with 16% of all journeys made by walkers.
The average walk was two kilometres and took 17 minutes to complete.
8 Work related travel includes both commuter and business travel and is referred to in all further tables and figures as 'work'
8
64%9%
4%
16%
4% 1% 1%
Figure 2: Percentage Distribution of Journeys by Mode ofTravel
Private Car - Driver
Private Car - Passenger
Van/Lorry and Other
Walk
Bus
Rail/Dart/Luas
Cycle
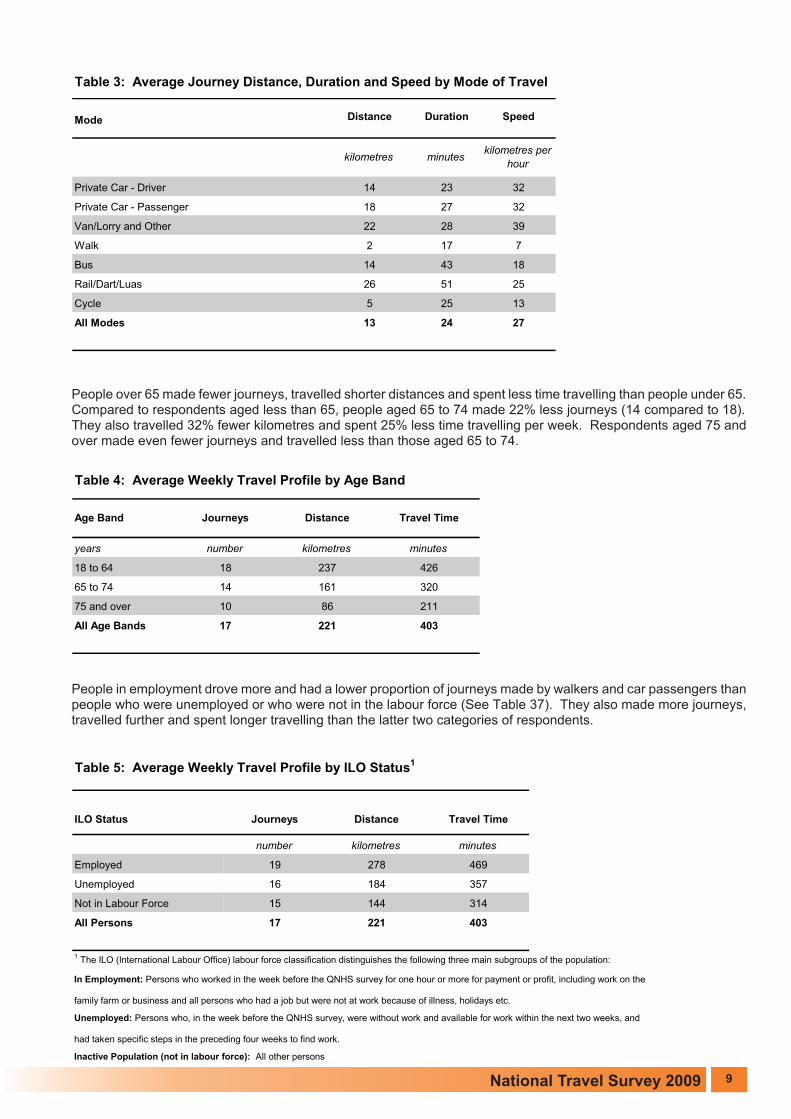
Table 5: Average Weekly Travel Profile by ILO Status1
number kilometres minutes
Employed 19 278 469
Unemployed 16 184 357
Not in Labour Force 15 144 314
All Persons 17 221 403
1 The ILO (International Labour Office) labour force classification distinguishes the following three main subgroups of the population:
In Employment: Persons who worked in the week before the QNHS survey for one hour or more for payment or profit, including work on the
family farm or business and all persons who had a job but were not at work because of illness, holidays etc.
Unemployed: Persons who, in the week before the QNHS survey, were without work and available for work within the next two weeks, and
had taken specific steps in the preceding four weeks to find work.
Inactive Population (not in labour force): All other persons
ILO Status Journeys Distance Travel Time
Table 4: Average Weekly Travel Profile by Age Band
years number kilometres minutes
18 to 64 18 237 426
65 to 74 14 161 320
75 and over 10 86 211
All Age Bands 17 221 403
Age Band Journeys Distance Travel Time
People over 65 made fewer journeys, travelled shorter distances and spent less time travelling than people under 65.Compared to respondents aged less than 65, people aged 65 to 74 made 22% less journeys (14 compared to 18).They also travelled 32% fewer kilometres and spent 25% less time travelling per week. Respondents aged 75 andover made even fewer journeys and travelled less than those aged 65 to 74.
People in employment drove more and had a lower proportion of journeys made by walkers and car passengers thanpeople who were unemployed or who were not in the labour force (See Table 37). They also made more journeys,travelled further and spent longer travelling than the latter two categories of respondents.
9
Table 3: Average Journey Distance, Duration and Speed by Mode of Travel
Mode Distance Duration Speed
Private Car - Driver 14 23 32
Private Car - Passenger 18 27 32
Van/Lorry and Other 22 28 39
Walk 2 17 7
Bus 14 43 18
Rail/Dart/Luas 26 51 25
Cycle 5 25 13
All Modes 13 24 27
kilometres per
hourminuteskilometres

Table 6: Average Journey Distance, Duration and Speed by Journey Purpose
Purpose Distance Duration Speed
Work 18 30 32
Education 16 36 25
Shopping/Food/Drink 8 17 24
Personal Business 12 20 28
Visit Family/Friends & Social/Entertainment 17 26 30
Companion Journey to/from Education 5 13 22
Other Companion Journey 12 21 30
Other 14 32 24
All Purposes 13 24 27
kilometres minutes kilometres
per hour
Seventy percent of all journeys took less than 30 minutes to complete. Thirty nine percent of journeys took less than15 minutes. Just eight percent of journeys lasted an hour or more.
The average work related journey was 18 kilometres, took 30 minutes to complete and had a speed9 of 32 kilometresper hour.
The average journey for shopping/food/drink was eight kilometres, took 17 minutes to complete and had a speed of24 kilometres per hour.
Forty one percent of all journeys were less than four kilometres. In total, 59%10 of all journeys were less than eightkilometres in length.
9 The speed of a journey is determined by the door to door travel time
10 The quoted percentage differs from the sum of the constituent parts in Figure 4 due to the rounding of numbers contained in the Figure
10
39%
31%
17%
5%
8%
Figure 3: Percentage Distribution of Journeys by Duration
Less than 15 Minutes
15 to 30 Minutes
30 to 45 minutes
45 - 60 Minutes
60 Minutes andOver

22%
19%
11%6%
41%
Figure 4: Percentage Distribution of Journeys by Distance
Less than 2 Kms
2 to 4 Kms
4 to 6 Kms
6 to 8 Kms
8 Kms and Over
One third of all journeys made by drivers of private cars and 92% of journeys made by walkers were less than fourkilometres. Just 47% of journeys made by car drivers and 51% of journeys made by car passengers were for adistance of eight kilometres or more.
During the rush hour periods of 8 am to 9 am and 5 pm to 6 pm, there was a difference of approximately 90% in thespeed at which urban and rural respondents travelled. For the period 8 am to 9 am, urban respondents travelled at aspeed of 20 kilometres per hour compared to 38 kilometres per hour for rural respondents. The correspondingspeeds for the period 5 pm to 6 pm were 22 and 42 kilometres per hour respectively (See Table 31).
Respondents from the Dublin region travelled shorter distances in comparison to respondents from regions outside ofDublin. Dublin respondents travelled an average of 151 kilometres per week compared to an average of 248kilometres per week for all other respondents (See Table 12).
Respondents living in the Dublin region reported a lower share of journeys by car drivers (54%) and a higher share ofjourneys by walkers (21%) compared to other respondents. Sixty eight percent of the journeys made by respondentsfrom outside the Dublin region were made by private car drivers with a further 15% made by walkers.
11
Table 7 : Percentage Distribution of Journeys by Distance and Mode of Travel
Less than 2 14 12 8 71 (5) 0 25 22
2 to 4 19 19 15 21 17 * 133 19
4 to 6 13 11 9 6 17 * (19)211
6 to 8 7 7 8 2 10 * * 6
8 and Over 47 51 60 (1) 52 82 (20) 41
All Distances 100 100 100 100 100 100 100 100
1 Figures based on an unweighted sample of less than 30 have been replaced by an "*"
2 Figures in parentheses ( ) indicate percentages are based on a small unweighted sample (between 30 and 50) and are therefore subject to a large margin of error.
percentage
All Modes
Mode
Walk Bus Rail/Dart/
Luas
CycleDistance
(kilometres)
Private Car
Driver
Private Car
Passenger
Van/Lorry
Driver and
Other

Table 8: Percentage Distribution of Journeys by Mode of Travel and Region
Mode
percentage
Private Car - Driver 54 68 64
Private Car - Passenger 7 9 9
Van/Lorry and Other 4 5 4
Walk 21 15 16
Bus 9 2 4
Rail/Dart/Luas 4 1 1
Cycle 2 1 1
All Modes 100 100 100
Dublin All Regions
excluding
Dublin
State
2.2 Gender differences
The average journey undertaken by males was 36% longer than the average female journey at 15 and 11 kilometresrespectively (See Table 19).
Men travelled an average of 71 kilometres more per week than women (257 kilometres versus 186 kilometres) andspent 62 minutes longer travelling each week than females (435 minutes compared to 373 minutes).
The most frequently cited reason for male travel was work. For females, the most frequent reason for undertaking ajourney was for shopping/food/drink (See Table 14).
A higher proportion of the journeys made by females were made as car passengers compared to males, at 12% andfive percent respectively (See Table 15).
Seventy nine percent of male respondents stated that they either owned or had regular use of a vehicle compared to70% for females (See Table 42).
Eighty six percent of males held a driving licence compared to 73% for females (See Table 41). This trend is alsoreflected in the percentage holding a full car or motorcycle driving licence with 78% of males stating that they held onecompared to 64% for females (See Figure 22).
12
Table 9: Average Weekly Travel Profile by Gender
Gender Journeys Distance Travel Time
number kilometres minutes
Male 17 257 435
Female 17 186 373
All Persons 17 221 403
2.3 Public transport
While 77% of respondent households stated that they had access to a local11 public transport service, there wereconsiderable differences in the availability of public transport between urban and rural areas. Ninety five percent ofurban households reported that they had access to a local public transport service compared to just 51% for ruralhouseholds (See Figure 16). There was also a very clear difference in the availability of a local public transportservice between Dublin households and all other households. Ninety eight percent of households in the Dublin regionreported having access to a local public transport service compared to just 69% for households outside the Dublinregion (See Figure 18).
A local bus service was the most common form of local public transport available to households. Seventy one percentof households stated that they had a local bus service compared to 30% with a local mainline train service and 12%with a local Luas/Dart service (See Figure 17).
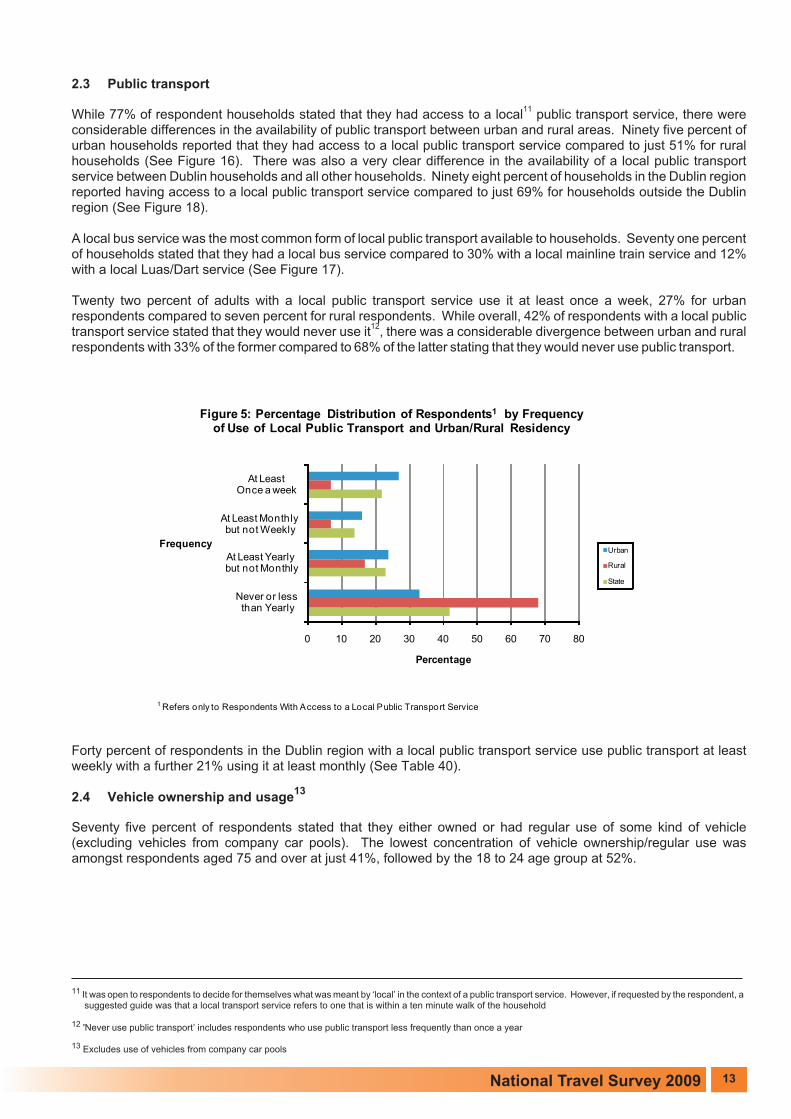
Twenty two percent of adults with a local public transport service use it at least once a week, 27% for urbanrespondents compared to seven percent for rural respondents. While overall, 42% of respondents with a local publictransport service stated that they would never use it12, there was a considerable divergence between urban and ruralrespondents with 33% of the former compared to 68% of the latter stating that they would never use public transport.
Forty percent of respondents in the Dublin region with a local public transport service use public transport at leastweekly with a further 21% using it at least monthly (See Table 40).
2.4 Vehicle ownership and usage13
Seventy five percent of respondents stated that they either owned or had regular use of some kind of vehicle(excluding vehicles from company car pools). The lowest concentration of vehicle ownership/regular use wasamongst respondents aged 75 and over at just 41%, followed by the 18 to 24 age group at 52%.
11 It was open to respondents to decide for themselves what was meant by ‘local’ in the context of a public transport service. However, if requested by the respondent, asuggested guide was that a local transport service refers to one that is within a ten minute walk of the household
12 'Never use public transport’ includes respondents who use public transport less frequently than once a year
13 Excludes use of vehicles from company car pools
13
0 10 20 30 40 50 60 70 80
Never or lessthan Yearly
At Least Yearlybut not Monthly
At Least Monthlybut not Weekly
At LeastOnce a week
Percentage
Frequency
Figure 5: Percentage Distribution of Respondents1 by Frequencyof Use of Local Public Transport and Urban/Rural Residency
Urban
Rural
State
1 Refers only to Respondents With Access to a Local Public Transport Service

0 20 40 60 80 100
Percentage
Age Band
Figure 6: Percentage of Respondents who Own/Have RegularUse of a Vehicle by Age Band
18 to 24
25 to 34
35 to 44
45 to 54
55 to 64
65 to 74
75 and Over
All Age Bands
14
Of the people who owned or had regular use of a vehicle and who were in employment, 83% used the vehicle to driveto work14. This figure was significantly lower for respondents from the Dublin region, where just 77% of respondentswho were employed and who owned or had regular use of a vehicle stated that they used the vehicle to drive to workcompared to 85% for similar respondents living outside the Dublin region (See Figure 25).
Seventy percent of adults who used a vehicle to travel to work and who responded to the question stated that theyusually parked their vehicles during working hours in either a private car park or in their employer’s car park. Sixteenpercent stated that they parked in a non-payment area during working hours while a further 13% parked in a public carpark or used metered on street parking (See Table 44).
14 Respondents were advised to report that they used the vehicle to drive to work if they drove the vehicle for any part of the journey to/from work

Table 10: Average Weekly Travel Profile by Urban/Rural
Residency and Gender
number minutes kilometres
Urban Male 17 451 217
Female 18 380 146
All Persons 18 414 180
Rural Male 16 412 314
Female 17 359 255
All Persons 16 387 286
State Male 17 435 257
Female 17 373 186
All Persons 17 403 221
Urban/Rural Journeys Travel Time DistanceGender
Chapter 3
Weekly Travel Patterns
Both males and females made an average of 17 journeys per week.
Table 10 below shows that on average, respondents spent 403 minutes travelling 221 kilometres per week.
Urban respondents made more journeys per week than rural respondents at 18 and 16 respectively. Despite makingfewer journeys, rural respondents travelled an average of 106 kilometres more per week than respondents fromurban areas (286 kilometres versus 180 kilometres respectively).
Men travelled further than women (257 kilometres compared to 186 kilometres) and spent just over an hour longertravelling each week (435 minutes compared to 373 minutes).
Respondents aged 35 to 44 made an average of 20 journeys, travelled 277 kilometres and spent 459 minutestravelling per week. Respondents aged 65 and over made the least number of journeys (12 per week) and spent 273minutes travelling 128 kilometres per week.
15

Table 11: Average Weekly Travel Profile by Age Band
Age Band Journeys Travel Time Distance
(years)
number minutes kilometres
18 to 24 16 406 192
25 to 34 18 428 235
35 to 44 20 459 277
45 to 54 19 448 254
55 to 64 16 366 203
65 and over 12 273 128
All Age Bands 17 403 221
16
Table 12: Average Weekly Travel Profile by Region and Gender
Region Gender Journeys Travel Time Distance
number minutes kilometres
All Regions Excluding Dublin Male 17 416 284
Female 17 358 213
All Persons 17 387 248
Dublin Male 17 485 183
Female 18 410 120
All Persons 18 446 151
State Male 17 435 257
Female 17 373 186
All Persons 17 403 221
Respondents living outside the Dublin region travelled 64% further each week than Dublin respondents but spent13% less time travelling. Dublin respondents travelled an average of 151 kilometres and spent 446 minutes travellingper week. Respondents living outside the Dublin region spent an average of 387 minutes travelling 248 kilometresper week.

0 10 20 30 40
Other
Other Companion Journey
Companion Journeyto/from Education
Visit Family/Friends&Social/ Entertainment
Personal Business
Shopping/Food/Drink
Education
Work
Percentage
Purpose
Figure 7: Percentage Distribution of Journeys by JourneyPurpose and Gender
Male
Female
All Persons
Chapter 4
Why People Travel
Work related travel accounted for 25% of all journeys, representing 30% for males and 21% for females.Shopping/food/drink accounted for a further 23% of journeys, representing 25% for females compared to 21% formales.
Thirty one percent of all work related journeys were made by people aged 25 to 34. Respondents in the 18 to 24 agegroup accounted for just nine percent of all work related journeys.
Visiting family/friends and social/entertainment accounted for 17% of all journeys for both males and females, withpeople in the 25 to 34 age group making 25% of these journey types.
While overall just three percent of journeys were for the purpose of education, 80% of these journeys were made byrespondents aged 18 to 34, with those aged 18 to 24 making 62% of them.
Companion journeys to/from educational facilities constituted nine percent of all journeys, with 42% of these journeysmade by respondents aged 35 to 44. These journeys represented 13% of all female journeys compared to fivepercent of male journeys.
17

Work 30 21 25 30 21 25 30 21 25
Education 4 3 3 (2)13 2 3 3 3
Shopping/Food/Drink 21 25 23 23 25 24 21 25 23
Personal Business 9 8 8 12 9 11 10 8 9
Other Companion Journey 4 4 4 4 5 4 4 4 4
Other 11 9 10 8 9 9 10 9 10
All Purposes 100 100 100 100 100 100 100 100 100
1 Figures in parentheses ( ) indicate percentages are based on a small unweighted sample (between 30 and 50) and are therefore subject to a large margin of error.
Table 14: Percentage Distribution of Journeys by Journey Purpose, Urban/Rural Residency
and Gender
Purpose
1718 16 16
State
Male Female
All
Persons Male
All
Persons
Urban Rural
All
Persons Male
Visit Family/Friends &Social/Entertainment
Companion Journey to/fromEducation
17 18
5 12
Female
15
14
Female
9
17 17
55
percentage
99 13
Table 13: Percentage Distribution of Journeys by Age Band and Journey Purpose
18 to 24 9 62 9 (6) 18 (4) * 11 11
25 to 34 31 18 20 13 25 30 22 19 24
35 to 44 25 (9)119 19 18 42 26 22 23
45 to 54 22 (8) 18 20 16 20 24 19 19
55 to 64 11 * 217 19 12 3 10 12 12
65 and over 3 * 17 23 12 * 10 17 11
All Age Bands 100 100 100 100 100 100 100 100 100
1 Figures in parentheses ( ) indicate percentages are based on a small unweighted sample (between 30 and 50) and are therefore subject to a large margin of error.
2 Figures based on an unweighted sample of less than 30 have been replaced by an "*"
Age Band
(years)
Journey Purpose
Other
Companion
Journey Other
All
PurposesWork Education
Shopping/
Food/ Drink
percentage
Personal
Business
Visit Family/
Friends &
Social/
Entertainment
Companion
Journey
to/from
Education
18
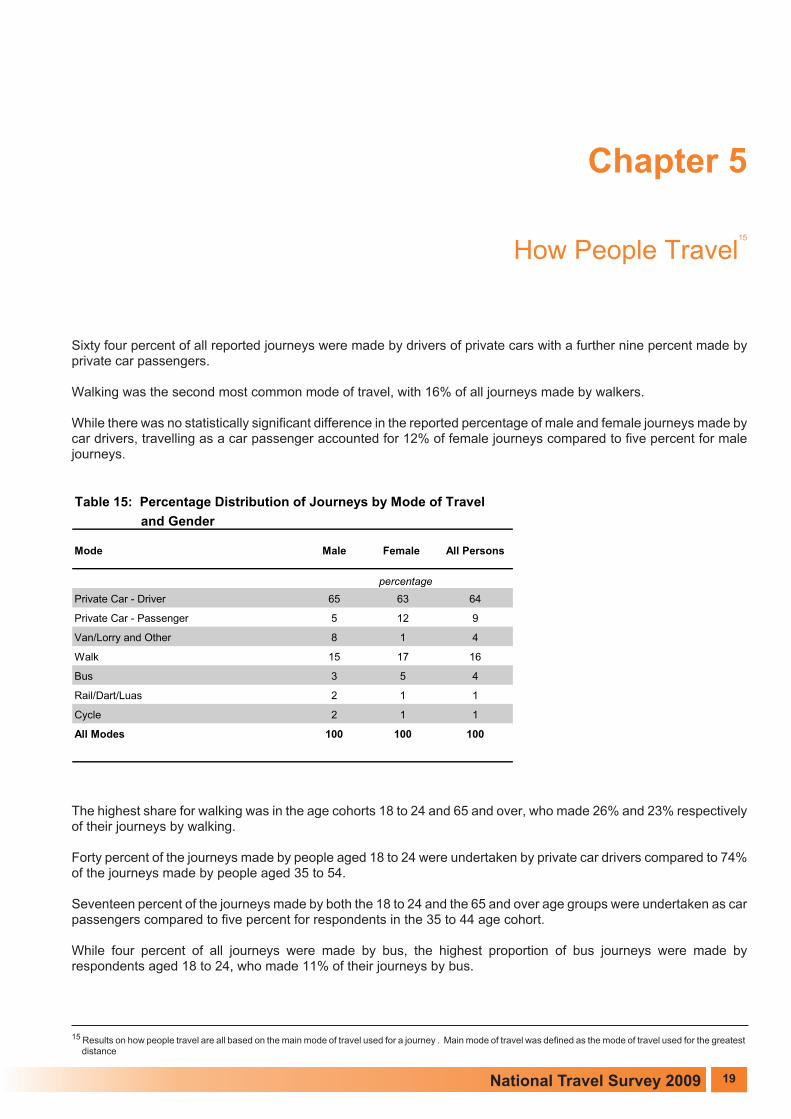
Mode Male Female All Persons
Private Car - Driver 65 63 64
Private Car - Passenger 5 12 9
Van/Lorry and Other 8 1 4
Walk 15 17 16
Bus 3 5 4
Rail/Dart/Luas 2 1 1
Cycle 2 1 1
All Modes 100 100 100
and Gender
Table 15: Percentage Distribution of Journeys by Mode of Travel
percentage
Chapter 5
How People Travel15
Sixty four percent of all reported journeys were made by drivers of private cars with a further nine percent made byprivate car passengers.
Walking was the second most common mode of travel, with 16% of all journeys made by walkers.
While there was no statistically significant difference in the reported percentage of male and female journeys made bycar drivers, travelling as a car passenger accounted for 12% of female journeys compared to five percent for malejourneys.
The highest share for walking was in the age cohorts 18 to 24 and 65 and over, who made 26% and 23% respectivelyof their journeys by walking.
Forty percent of the journeys made by people aged 18 to 24 were undertaken by private car drivers compared to 74%of the journeys made by people aged 35 to 54.
Seventeen percent of the journeys made by both the 18 to 24 and the 65 and over age groups were undertaken as carpassengers compared to five percent for respondents in the 35 to 44 age cohort.
While four percent of all journeys were made by bus, the highest proportion of bus journeys were made byrespondents aged 18 to 24, who made 11% of their journeys by bus.
15 Results on how people travel are all based on the main mode of travel used for a journey . Main mode of travel was defined as the mode of travel used for the greatestdistance
19

Table 17: Percentage Distribution of Journeys by Mode of Travel
and Urban/Rural Residency
Mode Urban Rural State
Private Car - Driver 57 75 64
Private Car - Passenger 8 11 9
Van/Lorry and Other 4 5 4
Walk 22 7 16
Bus 6 1 4
Rail/Dart/Luas 2 0 1
Cycle 1 (1)11
All Modes 100 100 100
1 Figures in parentheses ( ) indicate percentages are based on a small unweighted sample (between 30
and 50) and are therefore subject to a large margin of error.
percentage
Table 16: Percentage Distribution of Journeys by Mode of Travel and Age Band
Mode 18 to 24 25 to 34 35 to 44 45 to 54 55 to 64 65 and over All Age Bands
Private Car - Driver 40 63 74 74 65 51 64
Private Car - Passenger 17 6 5 6 9 17 9
Van/Lorry and Other * 17 5 4 3 2 4
Walk 26 16 12 12 17 23 16
Bus 11 5 2 2 3 4 4
Rail/Dart/Luas * 2 (1) (1) * * 1
Cycle * (1)2(1) (1) (2) * 1
All Modes 100 100 100 100 100 100 100
1 Figures based on an unweighted sample of less than 30 have been replaced by an "*"
2 Figures in parentheses ( ) indicate percentages are based on a small unweighted sample (between 30 and 50) and are therefore subject to a large margin of error.
Age Band (Years)
percentage
20
Seventy five percent of the journeys undertaken by rural residents were made by private car drivers compared to 57%for journeys made by urban residents.
The share of journeys made by walkers was significantly different between urban and rural areas. Twenty twopercent of the journeys made by urban respondents were made by walkers compared to seven percent for ruralrespondents.
There was also a notable urban/rural divide in the mode share of bus journeys. Just one percent of the journeysundertaken by rural respondents were made by bus compared to six percent for journeys made by urbanrespondents.

Mode
Private Car - Driver 68 54 64
Private Car - Passenger 9 7 9
Van/Lorry and Other 5 4 4
Walk 15 21 16
Bus 2 9 4
Rail/Dart/Luas 1 4 1
Cycle 1 2 1
All Modes 100 100 100
percentage
and Region
Table 18: Percentage Distribution of Journeys by Mode of Travel
Region
All Regions
Excluding Dublin
Dublin State
Respondents from the Dublin region had a significantly lower proportion of journeys made by car. Fifty four percent ofthe journeys made by respondents from the Dublin region were made by car drivers compared to 68% for all otherregions. Dublin also had a significantly higher proportion of journeys made by walkers. Twenty one percent of thejourneys reported by Dublin respondents were made by walkers compared to 15% for respondents from all otherregions.
21

0 5 10 15 20 25
All Persons
Female
Male
Kilometres
Gender
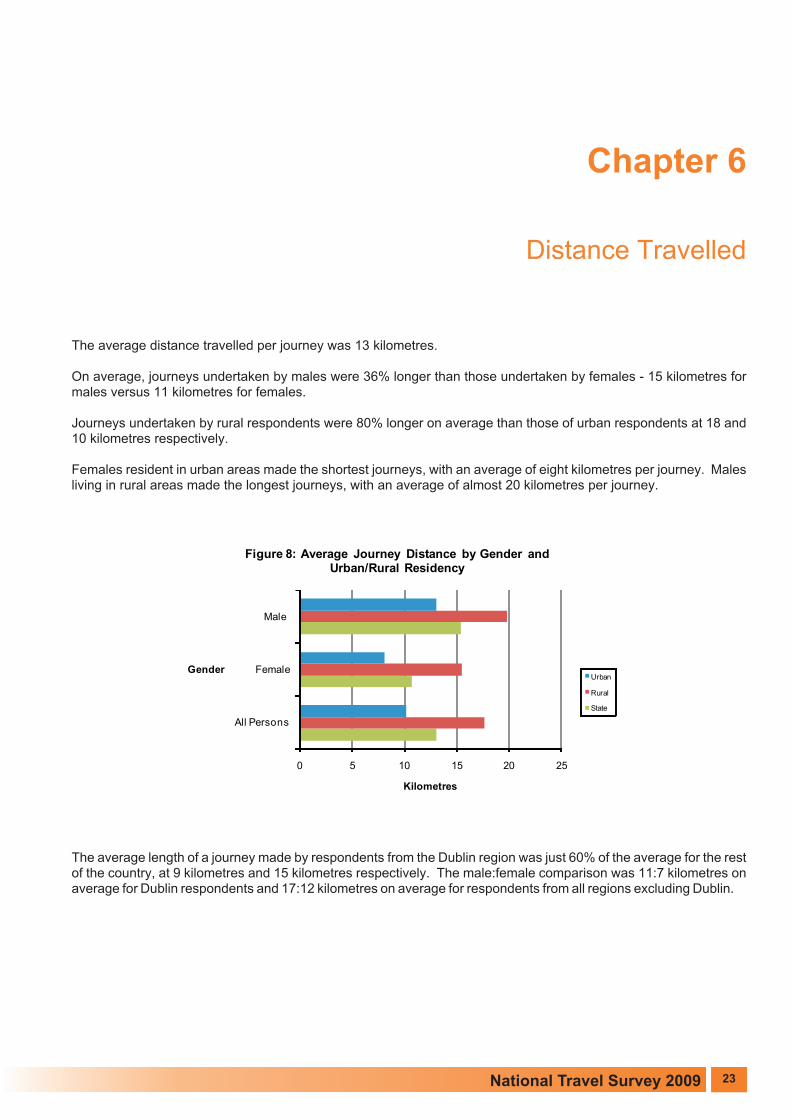
Figure 8: Average Journey Distance by Gender andUrban/Rural Residency
Urban
Rural
State
Chapter 6
Distance Travelled
The average distance travelled per journey was 13 kilometres.
On average, journeys undertaken by males were 36% longer than those undertaken by females - 15 kilometres formales versus 11 kilometres for females.
Journeys undertaken by rural respondents were 80% longer on average than those of urban respondents at 18 and10 kilometres respectively.
Females resident in urban areas made the shortest journeys, with an average of eight kilometres per journey. Malesliving in rural areas made the longest journeys, with an average of almost 20 kilometres per journey.
The average length of a journey made by respondents from the Dublin region was just 60% of the average for the restof the country, at 9 kilometres and 15 kilometres respectively. The male:female comparison was 11:7 kilometres onaverage for Dublin respondents and 17:12 kilometres on average for respondents from all regions excluding Dublin.
23

Table 19: Average Journey Distance by Region and Gender
Region Male Female All Persons
All Regions Excluding Dublin 17 12 15
Dublin 11 7 9
State 15 11 13
kilometres
24
Table 20: Average Journey Distance by Journey Purpose
Purpose Distance
kilometres
Work 18
Education 16
Shopping/Food/Drink 8
Personal Business 12
Visit Family/Friends & Social/Entertainment 17
Companion Journey to/from Education 5
Other Companion Journey 12
Other 14
All Purposes 13
The shortest journeys were made to accompany others to an educational facility16, which had an average distance offive kilometres. Journeys made as companions for other reasons had an average distance of 12 kilometres.
The average length of work related journeys was 18 kilometres while journeys for shopping/food/drink were 10kilometres shorter.
The shortest journeys were made by walkers, which averaged just two kilometres.
The average length of journeys made by car passengers was 18 kilometres compared to 5 kilometres for journeysmade by cyclists.
16 Companion journeys to/from educational facilities are journeys made to bring/accompany another person to a school/educational facility that they themselves do notattend eg a parent making a journey to drop children to school

Table 21: Average Journey Distance by Mode of Travel
Mode Distance
kilometres
Private Car - Driver 14
Private Car - Passenger 18
Van/Lorry and Other 22
Walk 2
Bus 14
Rail/Dart/Luas 26
Cycle 5
All Modes 13
25


0 5 10 15 20 25 30
All Persons
Female
Male
Minutes
Gender
Figure 9: Average Journey Duration by Gender and Urban/RuralResidency
Urban
Rural
State
Chapter 7
Duration of Journeys
The average journey took 24 minutes to complete. While rural residents’ journeys were, on average, 80% longer indistance (see Figure 8), there was no significant difference in the average duration of journeys between urban andrural residents at 23 and 24 minutes respectively.
Reflecting the longer average distances travelled by them (see Figure 8), male journeys took an average of 24%longer to complete than female journeys - 26 minutes compared to 21 minutes for females.
Journeys made by car drivers took an average of 23 minutes to complete while those made by car passengers took 27minutes. There was a significant difference in the speed of journeys made by car drivers from the Dublin regioncompared to other regions. The hourly rate of travel for journeys made by car drivers from the Dublin region was 42%slower at 21 kilometres per hour compared to 36 kilometres per hour for all other regions.
The journeys with the longest duration were those made by Rail/Dart/Luas, followed by bus journeys, which averaged51 and 43 minutes respectively.
The average walk lasted 17 minutes and was travelled at a speed of seven kilometres per hour.
27

Table 23: Average Journey Speed by Mode of Travel and Region
Mode
Private Car - Driver 36 21 32
Private Car - Passenger 36 22 32
Van/Lorry and Other 43 26 39
Walk 7 6 7
Bus 27 13 18
Rail/Dart/Luas 35 22 25
Cycle 13 13 13
All Modes 31 17 27
kilometres per hour
Region
All Regions
Excluding Dublin
Dublin State
28
Table 22: Average Journey Duration by Mode of Travel
Mode Duration
minutes
Private Car - Driver 23
Private Car - Passenger 27
Van/Lorry and Other 28
Walk 17
Bus 43
Rail\Dart\Luas 51
Cycle 25
All Modes 24
There was a significant difference in the speed at which urban and rural respondents travelled in motorised vehicles.Journeys by car drivers were 54% faster for rural respondents compared to urban respondents. Similarly, busjourneys made by rural respondents were 138% faster than bus journeys made by urban respondents.
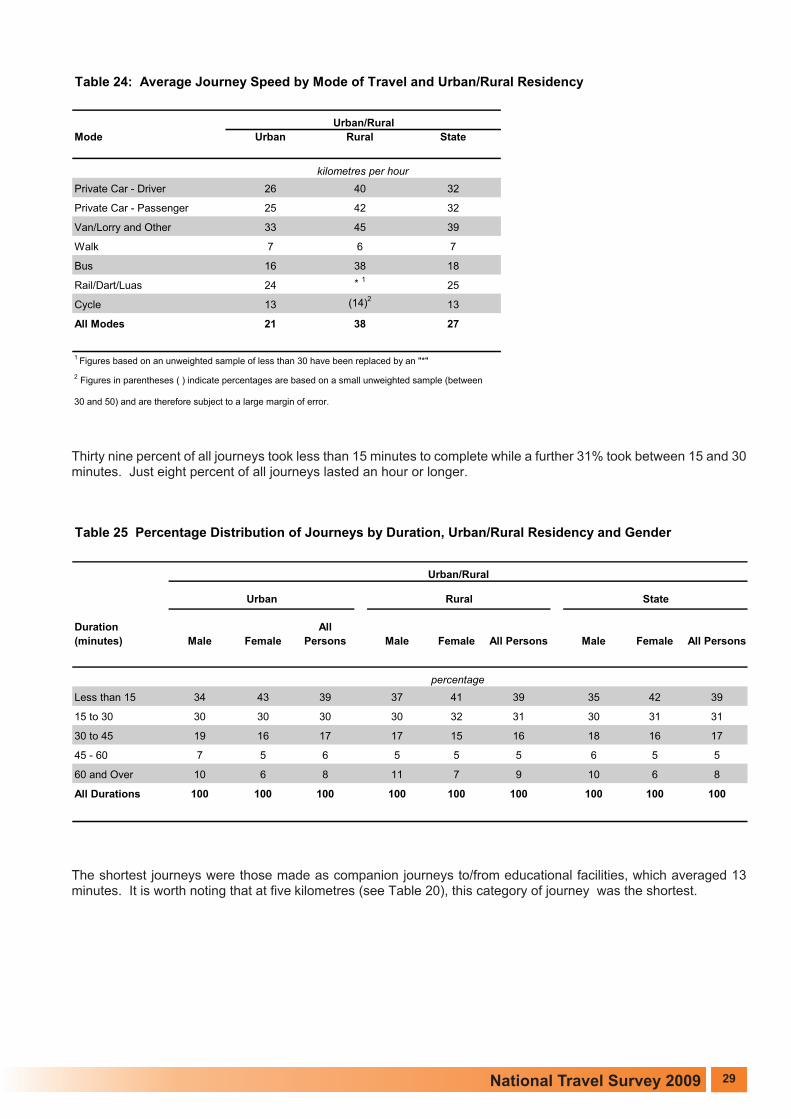
Table 25 Percentage Distribution of Journeys by Duration, Urban/Rural Residency and Gender
Less than 15 34 43 39 37 41 39 35 42 39
15 to 30 30 30 30 30 32 31 30 31 31
30 to 45 19 16 17 17 15 16 18 16 17
45 - 60 7 5 6 5 5 5 6 5 5
60 and Over 10 6 8 11 7 9 10 6 8
All Durations 100 100 100 100 100 100 100 100 100
State
percentage
Duration
(minutes) Male Female
Urban/Rural
Male Female
All
Persons All Persons All Persons
Urban Rural
Male Female
Table 24: Average Journey Speed by Mode of Travel and Urban/Rural Residency
Mode
Private Car - Driver 26 40 32
Private Car - Passenger 25 42 32
Van/Lorry and Other 33 45 39
Walk 7 6 7
Bus 16 38 18
Rail/Dart/Luas 24 * 125
Cycle 13 (14)213
All Modes 21 38 27
1 Figures based on an unweighted sample of less than 30 have been replaced by an "*"
2 Figures in parentheses ( ) indicate percentages are based on a small unweighted sample (between
30 and 50) and are therefore subject to a large margin of error.
kilometres per hour
Urban/Rural
Urban Rural State
Thirty nine percent of all journeys took less than 15 minutes to complete while a further 31% took between 15 and 30minutes. Just eight percent of all journeys lasted an hour or longer.
The shortest journeys were those made as companion journeys to/from educational facilities, which averaged 13minutes. It is worth noting that at five kilometres (see Table 20), this category of journey was the shortest.
29
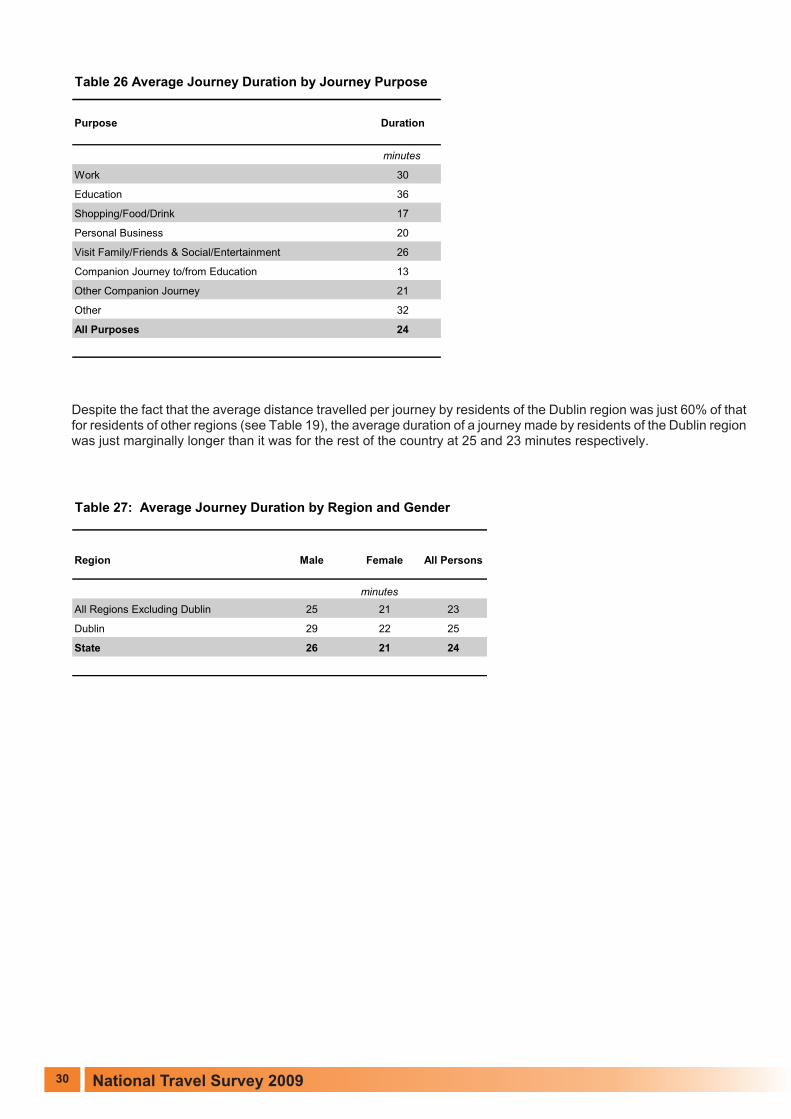
Region Male Female All Persons
All Regions Excluding Dublin 25 21 23
Dublin 29 22 25
State 26 21 24
Table 27: Average Journey Duration by Region and Gender
minutes
30
Table 26 Average Journey Duration by Journey Purpose
Purpose Duration
minutes
Work 30
Education 36
Shopping/Food/Drink 17
Personal Business 20
Visit Family/Friends & Social/Entertainment 26
Companion Journey to/from Education 13
Other Companion Journey 21
Other 32
All Purposes 24
Despite the fact that the average distance travelled per journey by residents of the Dublin region was just 60% of thatfor residents of other regions (see Table 19), the average duration of a journey made by residents of the Dublin regionwas just marginally longer than it was for the rest of the country at 25 and 23 minutes respectively.

and Urban/Rural Residency
00:00 - 05:59 2 2 2
06:00 - 06:59 1 1 1
07:00 - 07:59 4 4 4
08:00 - 08:59 9 8 9
09:00 - 09:59 6 8 7
10:00 - 10:59 6 6 6
11:00 - 11:59 6 7 6
12:00 - 12:59 7 8 7
13:00 - 13:59 8 7 8
14:00 - 14:59 8 8 8
15:00 - 15:59 7 7 7
16:00 - 16:59 7 7 7
17:00 - 17:59 8 8 8
18:00 - 18:59 6 6 6
19:00 - 19:59 4 4 4
20:00 - 23:59 9 8 8
All Times 100 100 100
percentage
Urban/Rural
Table 28: Percentage Distribution of Journeys by Start Time
Urban Rural StateStart Time
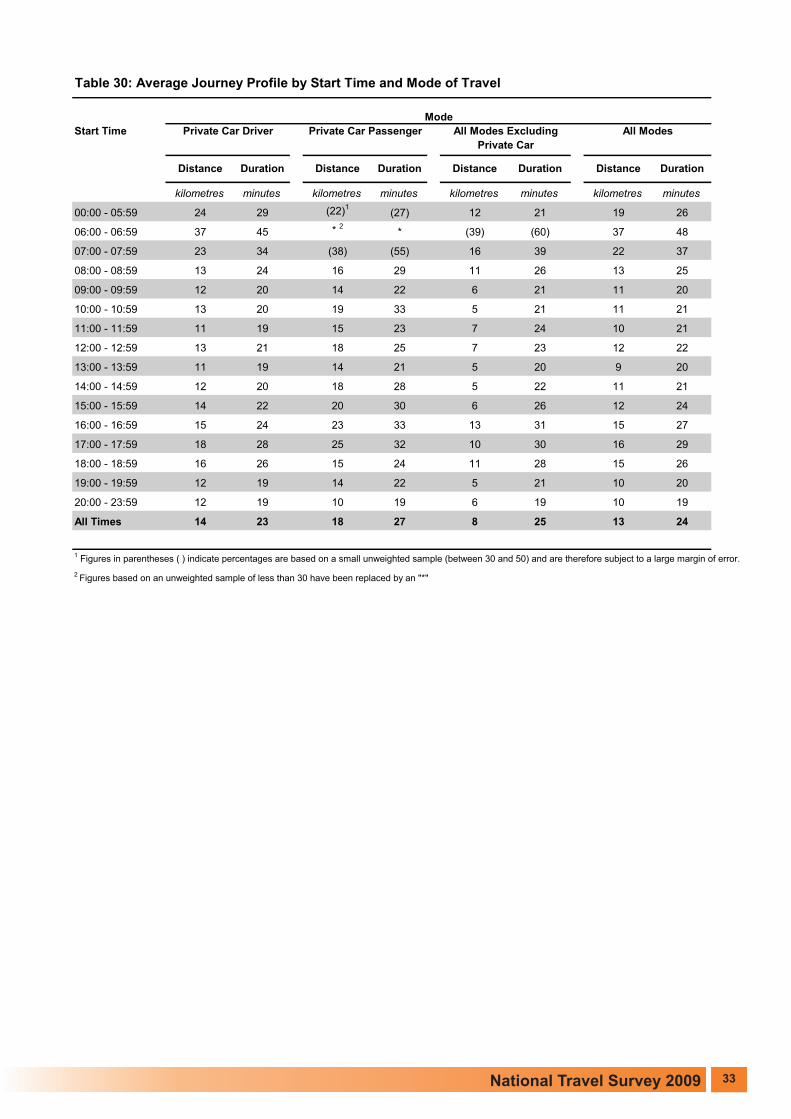
Just 15% of all journeys commenced during the 12 hour period 8 pm to 8 am compared to a peak of nine percentduring the 8 am to 9 am rush hour.
Twenty one percent of all journeys made by private car drivers commenced during the three hour period 7 am to 10am while 11% of all walks commenced during the lunch time period of 1 pm to 2 pm.
Chapter 8
When & How Fast People Travel
31

00:00 - 05:59 2 (3) 3 2
06:00 - 06:59 1 * 10 1
07:00 - 07:59 4 (2)2(2) 4
08:00 - 08:59 9 5 6 8
09:00 - 09:59 8 5 6 7
10:00 - 10:59 5 5 8 6
11:00 - 11:59 6 7 9 7
12:00 - 12:59 7 8 9 8
13:00 - 13:59 7 8 11 8
14:00 - 14:59 8 8 9 9
15:00 - 15:59 7 8 8 7
16:00 - 16:59 7 8 6 7
17:00 - 17:59 8 9 6 8
18:00 - 18:59 6 6 5 6
19:00 - 19:59 4 6 4 5
20:00 - 23:59 8 11 9 9
All Times 100 100 100 100
1 Figures based on an unweighted sample of less than 30 have been replaced by an "*"
2 Figures in parentheses ( ) indicate percentages are based on a small unweighted sample (between 30 and 50)
and are therefore subject to a large margin of error.
percentage
Table 29: Percentage Distribution of Journeys by Start Time and Mode
of Travel
Private Car
Driver
Start Time Private Car
Passenger
Walk All Modes
Mode
The longest journeys commenced between 6 am and 7 am, were 37 kilometres long and took 48 minutes to complete.The distance travelled fell to 22 kilometres for journeys commenced during the period 7 am to 8 am, falling further to13 kilometres with a travel time of 25 minutes for journeys commenced between 8 am and 9 am.
32
kilometres minutes kilometres minutes kilometres minutes kilometres minutes
00:00 - 05:59 24 29 (22)1(27) 12 21 19 26
06:00 - 06:59 37 45 * 2* (39) (60) 37 48
07:00 - 07:59 23 34 (38) (55) 16 39 22 37
08:00 - 08:59 13 24 16 29 11 26 13 25
09:00 - 09:59 12 20 14 22 6 21 11 20
10:00 - 10:59 13 20 19 33 5 21 11 21
11:00 - 11:59 11 19 15 23 7 24 10 21
12:00 - 12:59 13 21 18 25 7 23 12 22
13:00 - 13:59 11 19 14 21 5 20 9 20
14:00 - 14:59 12 20 18 28 5 22 11 21
15:00 - 15:59 14 22 20 30 6 26 12 24
16:00 - 16:59 15 24 23 33 13 31 15 27
17:00 - 17:59 18 28 25 32 10 30 16 29
18:00 - 18:59 16 26 15 24 11 28 15 26
19:00 - 19:59 12 19 14 22 5 21 10 20
20:00 - 23:59 12 19 10 19 6 19 10 19
All Times 14 23 18 27 8 25 13 24
1 Figures in parentheses ( ) indicate percentages are based on a small unweighted sample (between 30 and 50) and are therefore subject to a large margin of error.
2 Figures based on an unweighted sample of less than 30 have been replaced by an "*"
Table 30: Average Journey Profile by Start Time and Mode of Travel
Duration Distance Duration
Start Time
Mode
All Modes Excluding
Private Car
Private Car Driver
Distance
Private Car Passenger All Modes
Distance Duration Distance Duration
33

Urban/Rural Residency
00:00 - 05:59 28 43 33
06:00 - 06:59 33 51 40
07:00 - 07:59 26 48 34
08:00 - 08:59 20 38 26
09:00 - 09:59 20 35 27
10:00 - 10:59 19 34 25
11:00 - 11:59 19 36 26
12:00 - 12:59 20 37 27
13:00 - 13:59 19 33 24
14:00 - 14:59 21 36 26
15:00 - 15:59 22 38 28
16:00 - 16:59 22 39 28
17:00 - 17:59 22 42 29
18:00 - 18:59 24 39 30
19:00 - 19:59 22 38 28
20:00 - 23:59 22 38 28
All Times 21 38 27
kilometres per hour
Urban/Rural
Table 31: Average Journey Speed by Start Time and
Start Time Urban Rural State
34

14%
14%
9%
6%
57%
Figure 11: Percentage Distribution of Rural Journeys byDistance
Less than 2 Kms
2 to 4 Kms
4 to 6 Kms
6 to 8 Kms
8 Kms and Over
27%
22%
13%
6%
32%
Figure 10: Percentage Distribution of Urban Journeys byDistance
Less than 2 Kms
2 to 4 Kms
4 to 6 Kms
6 to 8 Kms
8 Kms and Over
Chapter 9
Variations in Travel by Distance
Fifty nine percent17 of all journeys (see Figure 4) were less than eight kilometres (five miles), 68% for journeysreported by urban respondents compared to 43% for rural respondents.
17 The quoted percentage differs from the sum of the constituent parts in Figure 4 due to the rounding of numbers contained in the Figure
35

Females had a higher proportion of short journeys than males. Sixty four percent of journeys made by females wereless than eight kilometres compared to 54% for males.
At a regional level, respondents living in the Dublin region reported a higher proportion of short journeys of less thaneight kilometres (69%) compared to the other regions (55%).
Fifty one percent of journeys under two kilometres and a further 18% of journeys between two and four kilometreswere made by walkers. The corresponding figures for car drivers were 40% and 64% respectively.
36
Table 32: Percentage Distribution of Journeys
by Distance and Region
Less than 2 22 23 22
2 to 4 17 23 19
4 to 6 10 15 11
6 to 8 6 8 6
8 and Over 45 31 41
All Distances 100 100 100
percentage
Distance
(kilometres)
State
Region
All Regions
Excluding Dublin
Dublin
0
10
20
30
40
50
Less than 2 2 to < 4 4 to < 6 6 to < 8 8 and Over
Percentage
Distance Travelled (kilometres)
Figure 12: Percentage Distribution of Journeys by Distance andGender
Male
Female
All Person

In total, 52% of all journeys were less than six kilometres. Thirty five percent of work related journeys, 64% of journeysfor shopping/food/drink and 80% of companion journeys to/from educational facilities were all under six kilometres.
Thirty seven percent of all journeys of eight kilometres or more were work related journeys with a further 17%undertaken for the purpose of shopping/food/drink.
37
Less than 2 11 16 31 26 22 36 18 20 22
2 to 4 13 (11)122 21 17 29 23 22 19
4 to 6 11 (9) 11 10 10 15 11 14 11
6 to 8 6 * 26 6 7 5 8 6 6
8 and Over 59 58 30 36 44 15 39 38 41
All Distances 100 100 100 100 100 100 100 100 100
1 Figures in parentheses ( ) indicate percentages are based on a small unweighted sample (between 30 and 50) and are therefore subject to a large margin of error.
2 Figures based on an unweighted sample of less than 30 have been replaced by an "*"
Table 34: Percentage Distribution of Journeys by Distance and Journey Purpose
OtherCompanion
Journey
to/from
Education
Purpose
Other
Companion
Journey
All
Purposes
Visit
Family/Friends &
Social/
Entertainment
Distance
(kilometres)
Work Education Shopping/
Food/Drink
Personal
Business
percentage
Mode Less than 2 2 to 4 4 to 6 6 to 8 8 and Over All Distances
Private Car - Driver 40 64 71 71 74 64
Private Car - Passenger 5 9 9 10 11 9
Van/Lorry & Other 2 4 3 6 7 4
Walk 51 18 8 4 (0) 16
Bus (1)14 6 6 5 4
Rail & Dart/Luas 0 0 * 2* 3 1
Cycle 1 2 (2) 0 (1) 1
All Modes 100 100 100 100 100 100
1 Figures in parentheses ( ) indicate percentages are based on a small unweighted sample (between 30 and 50) and are therefore subject
to a large margin of error.2 Figures based on an unweighted sample of less than 30 have been replaced by an "*"
Distance (Kilometres)
Table 33 Percentage Distribution of Journeys by Mode of Travel and Distance
percentage

Table 35: Percentage Distribution of Journeys by Journey Purpose and Distance
Purpose Less than 2 2 to 4 4 to 6 6 to 8 8 and Over All
Distances
Work 13 17 23 24 37 25
Education 2 (2)1(2) *2
4 3
Shopping/Food/Drink 32 27 23 22 17 23
Personal Business 10 10 8 9 8 9
Other Companion Journey 3 5 4 5 4 4
Other 8 11 12 10 9 10
All Purposes 100 100 100 100 100 100
1 Figures in parentheses ( ) indicate percentages are based on a small unweighted sample (between 30 and 50) and
are therefore subject to a large margin of error.2 Figures based on an unweighted sample of less than 30 have been replaced by an "*"
9Companion Journey to/fromEducation
14 14 11 8 3
Visit Family/Friends &Social/Entertainment
17 15
percentage
1815 19
Distance (kilometres)
17
38

0
5
10
15
20
Number ofJourneys
ILO Status
Figure 13: Average Weekly Number of Journeys by ILOStatus
Employed
Unemployed
Not in Labour Force
All Persons
Chapter 10
Travel by ILO Status18
On average, employed people made more journeys compared to people who were unemployed or not in the labourforce. Respondents in employment made an average of 19 journeys per week compared to 16 and 15 journeys perweek respectively for unemployed respondents and respondents who were not in the labour force. Respondents inemployment also had a lower proportion of journeys less than eight kilometres compared to respondents who wereunemployed or those who were not in the labour force. Fifty three percent19 of journeys made by employedrespondents were less than eight kilometres in length compared to 66% and over for unemployed respondents andrespondents who were not in the labour force.
18 The ILO (International Labour Office) labour force classification distinguishes the following three main subgroups of the population:In Employment: Persons who worked in the week before the QNHS survey for one hour or more for payment or profit, including work on the family farm or businessand all persons who had a job but were not at work because of illness, holidays, etcUnemployed: Persons who, in the week before the QNHS survey, were without work and available for work within the next two weeks, and had taken specific steps,In the preceding four weeks, to find workInactive Population (not in labour force): All other persons
19 The quoted percentage differs from the sum of the constituent parts in Table 36 due to the rounding of numbers contained in the Table
39

0
50
100
150
200
250
300
Kilometres
ILO Status
Figure 14: Average Weekly Distance Travelled by ILOStatus
Employed
Unemployed
Not in Labour Force
All Persons
In addition to reporting that they made more journeys per week (see Figure 13), people in employment also travelledfurther and for longer each week when compared to unemployed respondents or respondents who were not in thelabour force. Employed respondents spent an average of 469 minutes per week travelling 278 kilometres comparedto 357 minutes travelling 184 kilometres for unemployed respondents and 314 minutes travelling 144 kilometres forrespondents who were not in the labour force.
40
Distance
(kilometres)
Employed Unemployed Not in Labour
Force
All Persons
Less than 2 18 28 29 22
2 to 4 17 22 22 19
4 to 6 11 12 11 11
6 to 8 6 (4)16 6
8 and Over 47 34 31 41
All Distances 100 100 100 100
1 Figures in parentheses ( ) indicate percentages are based on a small unweighted sample (between 30 and 50)
and are therefore subject to a large margin of error.
ILO Status
Table 36: Percentage Distribution of Journeys by Distance
and ILO Status
percentage
0
100
200
300
400
500
Minutes
ILO Status
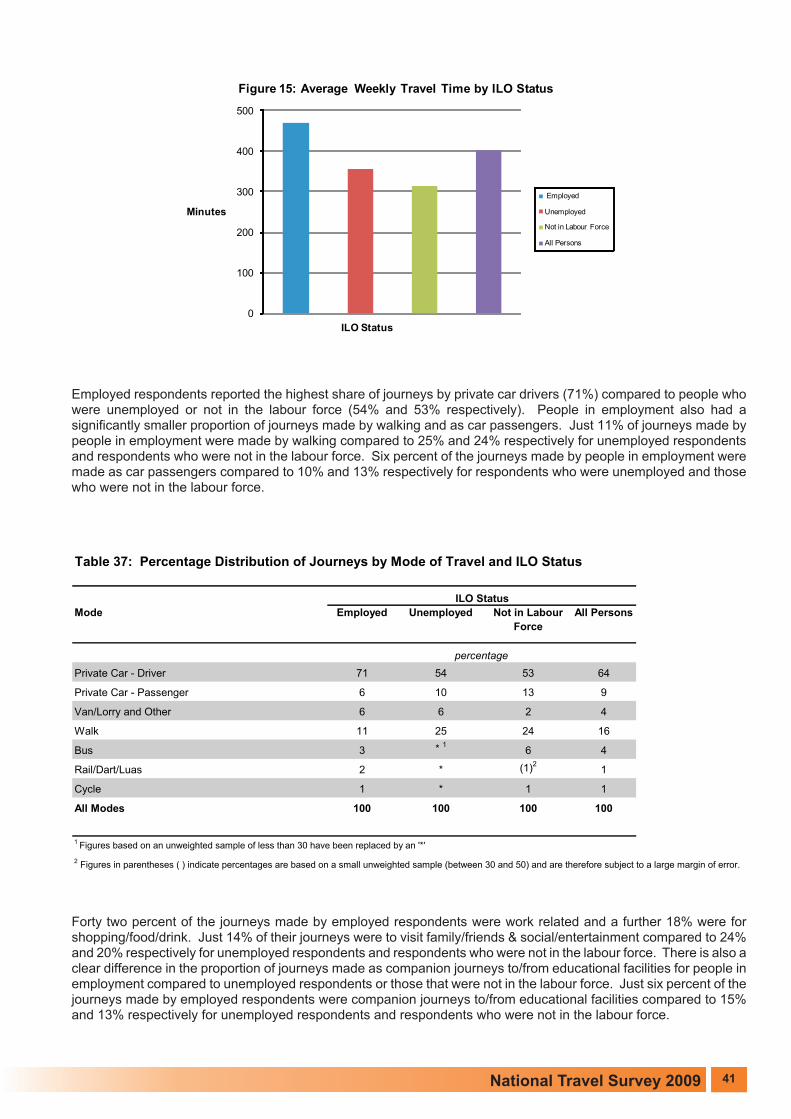
Figure 15: Average Weekly Travel Time by ILO Status
Employed
Unemployed
Not in Labour Force
All Persons
Employed respondents reported the highest share of journeys by private car drivers (71%) compared to people whowere unemployed or not in the labour force (54% and 53% respectively). People in employment also had asignificantly smaller proportion of journeys made by walking and as car passengers. Just 11% of journeys made bypeople in employment were made by walking compared to 25% and 24% respectively for unemployed respondentsand respondents who were not in the labour force. Six percent of the journeys made by people in employment weremade as car passengers compared to 10% and 13% respectively for respondents who were unemployed and thosewho were not in the labour force.
Forty two percent of the journeys made by employed respondents were work related and a further 18% were forshopping/food/drink. Just 14% of their journeys were to visit family/friends & social/entertainment compared to 24%and 20% respectively for unemployed respondents and respondents who were not in the labour force. There is also aclear difference in the proportion of journeys made as companion journeys to/from educational facilities for people inemployment compared to unemployed respondents or those that were not in the labour force. Just six percent of thejourneys made by employed respondents were companion journeys to/from educational facilities compared to 15%and 13% respectively for unemployed respondents and respondents who were not in the labour force.
41
Private Car - Driver 71 54 53 64
Private Car - Passenger 6 10 13 9
Van/Lorry and Other 6 6 2 4
Walk 11 25 24 16
Bus 3 * 16 4
Rail/Dart/Luas 2 * (1)21
Cycle 1 * 1 1
All Modes 100 100 100 100
1 Figures based on an unweighted sample of less than 30 have been replaced by an '*'
2 Figures in parentheses ( ) indicate percentages are based on a small unweighted sample (between 30 and 50) and are therefore subject to a large margin of error.
percentage
Table 37: Percentage Distribution of Journeys by Mode of Travel and ILO Status
Employed Unemployed Not in Labour
Force
Mode All Persons
ILO Status

People in employment had a lower share of journeys of less than 30 minutes duration compared to people who wereunemployed or not in the labour force. Sixty six percent of the journeys made by employed respondents took lessthan 30 minutes to complete compared to 73% and 74% respectively for unemployed respondents and those whowere not in the labour force.
42
Less than 15 36 42 43 39
15 to 30 30 31 31 31
30 to 45 18 16 15 17
45 - 60 6 (4)14 5
60 and Over 9 7 7 8
All Durations 100 100 100 100
1 Figures in parentheses ( ) indicate percentages are based on a small unweighted sample
(between 30 and 50) and are therefore subject to a large margin of error.
percentage
Table 39: Percentage Distribution of Journeys by Duration
and ILO Status
ILO Status
Not in Labour
Force
UnemployedEmployed All PersonsDuration
(minutes)
Table 38: Percentage Distribution of Journeys by Journey Purpose and ILO Status
Work 42 0 0 25
Education 1 * 16 3
Shopping/Food/Drink 18 29 32 23
Personal Business 7 13 12 9
Visit Family/Friends & Social/Entertainment 14 24 20 17
Companion Journey to/from Education 6 15 13 9
Other Companion Journey 4 5 4 4
Other 7 11 13 10
All Purposes 100 100 100 100
1 Figures based on an unweighted sample of less than 30 have been replaced by an "*"
percentage
All Persons
ILO Status
Purpose Employed Unemployed Not in Labour
Force

0
10
20
30
40
50
60
70
80
90
100
Percentage
Urban/Rural Residency
Figure 16: Percentage of Households with a Local PublicTransport Service by Urban/Rural Residency
Urban
Rural
State
Chapter 11
Public Transport, Vehicle Ownership/Usage & Driving Licences
11.1 Availability and use of local public transport
Seventy seven percent of households reported that they had access to a local public transport service with 95% ofurban households having such a service compared to 51% for rural households.
The most common form of public transport available to households was a local bus service, with 71% of householdsreporting that they had access to such a service. There was a significant difference in access to local public transportservices between urban and rural respondents across all types of public transport.
43
0
20
40
60
80
100
120
Percentage
Region
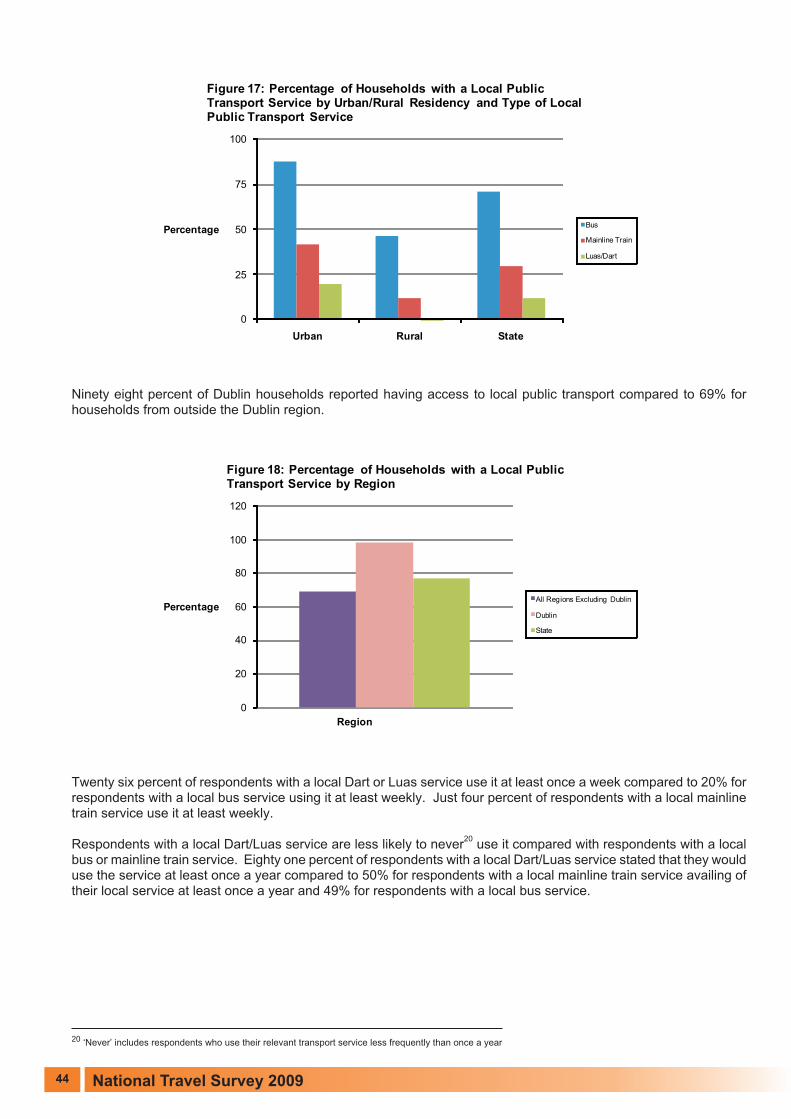
Figure 18: Percentage of Households with a Local PublicTransport Service by Region
All Regions Excluding Dublin
Dublin
State
0
25
50
75
100
Urban Rural State
Percentage
Figure 17: Percentage of Households with a Local PublicTransport Service by Urban/Rural Residency and Type of LocalPublic Transport Service
Bus
Mainline Train
Luas/Dart
Ninety eight percent of Dublin households reported having access to local public transport compared to 69% forhouseholds from outside the Dublin region.
Twenty six percent of respondents with a local Dart or Luas service use it at least once a week compared to 20% forrespondents with a local bus service using it at least weekly. Just four percent of respondents with a local mainlinetrain service use it at least weekly.
Respondents with a local Dart/Luas service are less likely to never20 use it compared with respondents with a localbus or mainline train service. Eighty one percent of respondents with a local Dart/Luas service stated that they woulduse the service at least once a year compared to 50% for respondents with a local mainline train service availing oftheir local service at least once a year and 49% for respondents with a local bus service.
20 ‘Never’ includes respondents who use their relevant transport service less frequently than once a year
44

1 Only refers to respondents with access to a local public transport service
0 20 40 60 80
Never or lessthan Yearly
At Least Yearlybut not Monthly
At Least Monthlybut not Weekly
At Least Oncea week
Percentage
Frequency
Figure 20: Percentage Distribution of Respondents byFrequency of Use of Local Public Transport andUrban/Rural Residency1
Urban
Rural
State
0 20 40 60
Dart/Luas
Mainline Train
Bus Service
Percentage
Type of PublicTransport Service
Figure 19: Percentage Distribution of Respondents1 by Type ofLocal Public Transport Service and Frequency of Use of Service
At Least Once a week
At Least Monthly but not Weekly
At Least Yearly but not Monthly
Never or less than Yearly
There is a notable difference in the use of public transport between urban and rural respondents. Sixty eight percentof rural respondents with a local public transport service stated that they would never use public transport comparedto just 33% for urban respondents.
Forty percent of respondents from the Dublin region with a local public transport service use public transport at leastweekly with a further 21% using it at least monthly.
At the same time, 18% of Dublin respondents with a local public transport service stated that they would never oralmost never use the service compared to 54% for respondents from all regions excluding Dublin.
45
1 Refers only to respondents with access to a local public transport service

Gender Urban Rural State
Male 82 92 86
Female 69 80 73
All Persons 75 86 79
Urban/Rural
by Gender and Urban/Rural Residency
Table 41: Percentage of Respondents with a Driving Licence
percentage
Table 40: Percentage Distribution of Respondents1
by Frequency of Use
At Least Once a Week 12 40 22
At Least Monthly but not Weekly 10 21 14
At Least Yearly but not Monthly 23 21 23
Never or Less than Yearly 54 18 42
All Frequencies 100 100 100
1 Refers only to respondents who have a local public transport service
percentage
Region
of Local Public Transport and Region
All Regions Excluding
Dublin
Dublin StateFrequency
0 20 40 60 80 100
Percentage
Region
Figure 21: Percentage of Respondents with a Driving Licence byRegion
All Regions Excluding Dublin
Dublin
State
11.2 Driving licences
Seventy nine percent of respondents stated that they held some type of driving licence. A higher proportion of malesreported that they held a driving licence than females at 86% and 73% respectively.
Seventy eight percent of males held a full car or motorcycle driving licence compared to 64% of females.
A smaller proportion of respondents living in the Dublin region (76%) were driving licence holders compared torespondents from the other regions (81%).
46

Urban/Rural Male Female All Persons
Urban 73 65 69
Rural 88 79 83
State 79 70 75
Gender
of a Vehicle by Urban/Rural Residency and Gender
percentage
Table 42: Percentage of Respondents who Own/Have Regular Use
0 20 40 60 80 100
All Ages
65 and Over
55 to 64
45 to 54
35 to 44
25 to 34
18 to 24
Percentage
AgeBand
Figure 22: Percentage of Respondents with a Full Car orMotorcycle Driving Licence by Age Band and Gender
Male
Female
All Persons
The age group with the lowest proportion of respondents holding a full car and/or motorcycle driving licence(s) wasthe 18 to 24 age group, followed by the 65 and over age group. Just 43% of respondents aged 18 to 24 and 56% ofrespondents aged 65 and over held a full car and/or motorcycle driving licence(s).
11.3 Vehicle ownership, usage and parking
Seventy five percent of respondents stated that they either owned or had regular use of a vehicle (excluding cars fromcompany car pools). A higher proportion of rural respondents owned or had regular access to a vehicle compared tourban respondents, at 83% and 69% respectively. Males were also more likely to have owned/had regular use of avehicle than females, with 79% of male respondents compared to 70% of female respondents reporting that theyeither owned or had regular use of a vehicle.
Just 52% of respondents aged 18 to 24 either owned or had regular access to a vehicle compared to 87% forrespondents aged 35 to 44.
47

Parking Place When Vehicle is Not in Use
percentage
Driveway/garage of private house 90
Public road 8
Public or Private car park 2
1 Refers only to respondents who own or have regular use of a vehicle
Table 43: Percentage Distribution of Respondents1
by Parking
Place when Vehicle is not in Use
0 20 40 60 80 100
State
Dublin
All RegionsExcluding Dublin
Percentage
Region
Figure 24: Percentage of Respondents who Own/Have RegularUse of a Vehicle by Region and Gender
Male
Female
All Persons
0 20 40 60 80 100
All Age Bands
65 and Over
55 to 64
45 to 54
35 to 44
25 to 34
18 to 24
Percentage
AgeBand
Figure 23: Percentage of Respondents who Own/Have RegularUse of a Vehicle by Age Band and Gender
Male
Female
All Persons
Dublin respondents were less likely to own/have regular use of a vehicle than respondents living outside the Dublinregion. Seventy percent of Dublin respondents stated that they either owned or had regular use of a vehiclecompared to 77% for all other respondents.
Of those who stated that they either owned or had regular use of a vehicle, 90% parked the vehicle in the driveway orgarage of a private house and a further eight percent parked on a public road when the vehicle was not in use.
48

0
10
20
30
40
50
60
70
80
90
Percentage
Age Band
Figure 26: Percentage of Respondents1 in Employmentwho Use their Vehicle to Drive to Work by Age Band
18 to 24
25 to 34
35 to 44
45 to 54
55 to 64
65 plus
All Age Bands
1 Only refers to respondents who own or have regular use of a vehicle
72
74
76
78
80
82
84
86
Percentage
Region
Figure 25: Percentage of Respondents1 in Employmentwho Use their Vehicle to Drive to Work by Region
All Regions Excluding Dublin
Dublin
State
Eighty three percent of employed respondents who either owned or had regular use of a vehicle stated that they usedthe vehicle to drive to work. Seventy seven percent of Dublin respondents who were employed and either owned orhad regular use of a vehicle stated that they used the vehicle to drive to work compared to 85% for respondents livingoutside the Dublin region.
People aged 65 and over who were employed and either owned or had regular use of a vehicle were less likely to usethe vehicle to drive to work when compared with other age groups. Sixty one percent of respondents aged 65 andover who were in employment and had access to a vehicle used the vehicle to drive to work compared to 82% andover for the other age groups.
When using the vehicle to drive to work, 70% of respondents stated that they parked in a private car park or used theiremployer’s car park, 16% parked in a non payment area and a further 13% parked in a public car park or usedmetered on street parking.
49
1 Only refers to respondents who own or have regular use of a vehicle

Percentage 13 70 16 * 2100
1 Refers only to respondents who are employed, who own or have regular use of a vehicle and who use the vehicle to drive to work
2 Figures based on an unweighted sample of less than 30 have been replaced by an '*'
percentage
Table 44: Percentage Distribution of Respondents1
by Place of Parking
Private or
Company
Car Park
Non
Payment
Area
Other/ Not
Stated
All Parking
Areas
Public Car Park or
Metered on street
Parking
During Work Hours
50

0
50
100
150
200
250
300
18 to 64 65 to 74 75 and over All Age Bands
Kilometres
Age Band
Figure 28: Average Weekly Distance Travelled by AgeBand and Gender
Male
Female
All Persons
Chapter 12
Travel and Age
Respondents aged 65 and over displayed a significantly different travel pattern to those aged 18 to 64. Respondentsaged 65 and over made fewer journeys, travelled shorter distances and spent less time travelling. People aged 18 to64 made an average of 18 journeys a week, travelled 237 kilometres and spent 426 minutes travelling. For thoseaged 65 to 74, the average number of journeys fell to 14 per week and it took them 320 minutes to travel an average of161 kilometres per week. Looking at the corresponding data for respondents aged 75 and over, the average numberof journeys, distance travelled and travel time per week were 10 journeys, 86 kilometres and 211 minutesrespectively.
51
02468
101214161820
18 to 64 65 to 74 75 and over All Age Bands
Number ofJourneys
Age Band
Figure 27: Average Weekly Number of Journeys by AgeBand and Gender
Male
Female
All Persons

0
50
100
150
200
250
300
350
400
450
500
18 to 64 65 to 74 75 and over All Age Bands
Minutes
Age Band
Figure 29: Average Weekly Travel Time by Age Band and Gender
Male
Female
All Persons
52
Looking at the various modes of travel used by respondents, the private car was the most common method of travelfor all age groups. For the under 65’s, journeys by private car accounted for 73% of all journeys, 65% by drivers andeight percent by passengers. The lowest share of journeys by drivers and the highest share of journeys bypassengers were in the age cohort 75 and over, with just 42% of the journeys made by this age group made by cardrivers and a further 22% by car passengers. There was also a notable difference between respondents aged under65 and those aged 65 and over in the mode share for walking. Sixteen percent of journeys made by respondents aged18 to 64 were made by walking compared to 21% and 26% respectively for respondents aged 65 to 74 and those aged75 and over.
Respondents aged 18 to 64 had the lowest proportion of short journeys when compared with people aged 65 to 74and 75 and over. Twenty two percent of the journeys reported by respondents aged 18 to 64 were less than twokilometres. The corresponding figure for people in the age cohort 65 to 74 was 26%. Respondents aged 75 and overreported the highest share of short journeys with 34% of their journeys covering a distance of less than two kilometres.
Respondents aged 18 to 64 had the highest proportion of long journeys (eight kilometres and over), at 42% comparedto 35% and 27% for the 65 to 74 and the 75 and over age groups respectively.

53
1F
igur
esin
pare
nthe
ses
()
indi
cate
perc
enta
ges
are
base
don
asm
allu
nwei
ghte
dsa
mpl
e(b
etw
een
30an
d50
)an
dar
eth
eref
ore
subj
ectt
oa
larg
em
argi
nof
erro
r.
2F
igur
esba
sed
onan
unw
eigh
ted
sam
ple
ofle
ssth
an30
have
been
repl
aced
byan
"*"
Tab
le45:
Perc
en
tag
eD
istr
ibu
tio
no
fJo
urn
eys
by
Mo
de
of
Tra
vel,
Ag
eB
an
dan
dG
en
der
Mo
de
Ag
eB
an
d(y
ears
)
18
to64
65
to74
75
an
do
ver
Fe
male
All
Pers
on
s
Male
Priv
ate
Car
-D
river
6566
65
Male
Fe
male
All
Pers
on
s
All
Pers
on
s
Fe
male
All
Pers
on
s
Male
54
All
Ag
eB
an
ds
6944
5764
Priv
ate
Car
-P
asse
nger
510
8(3
)
31
2212
14
Fe
male
6563
42
Male
perc
enta
ge
2613
315
17
9
Wal
k15
1616
1924
16
Bus
34
4
2124
28
1001
100
100
1R
ail/D
art/
Luas
21
4
*6
1 1*
1*
0*
Cyc
le2
3
All
Mo
des
100
100
100
100
(1)1
**
15
*(4
)
*
100
2*
100
26
*
2**
9 *
100
100
3
100
**
81 15
4*
2*
(2)
*V
an/L
orry
&O
ther
81
5

54
Less
than
218
2522
2427
2631
3634
1926
22
2to
418
2019
2026
2324
1821
1820
19
4to
611
1211
1010
1013
1213
1112
11
6to
86
66
77
7*
1(5
)25
66
6
8an
dO
ver
4836
4239
3035
2728
2746
3641
All
Dis
tan
ces
100
100
100
100
100
100
100
100
100
100
100
100
1F
igur
esba
sed
onan
unw
eigh
ted
sam
ple
ofle
ssth
an30
have
been
repl
aced
byan
"*"
2F
igur
esin
pare
nthe
ses
()
indi
cate
perc
enta
ges
are
base
don
asm
allu
nwei
ghte
dsa
mpl
e(b
etw
een
30an
d50
)an
dar
eth
eref
ore
subj
ectt
oa
larg
em
argi
nof
erro
r.
Male
Fem
ale
Ag
eB
an
d(y
ears
)
18
to64
65
to74
75
an
do
ver
All
Ag
eB
an
ds
All
Pe
rso
ns
Male
Fe
male
perc
enta
ge
Tab
le46:
Perc
en
tag
eD
istr
ibu
tio
no
fJo
urn
eys
by
Dis
tan
ce,A
ge
Ban
dan
dG
en
der
All
Pers
on
sA
llP
ers
on
sM
ale
Fe
male
All
Pers
on
sM
ale
Fem
ale
Dis
tan
ce
(kil
om
etr
es)

0
10
20
30
40
50
60
70
80
90
18 to 64 65 to 74 75 and over All Age Bands
Percentage
Age Band
Figure 32: Percentage of Respondents with a Full Car orMotorcycle Driving Licence by Age Band and Gender
Male
Female
All Persons
0
10
20
30
40
50
60
70
80
90
100
18 to 64 65 to 74 75 and over All Age Bands
Percentage
Age Band
Figure 31: Percentage of Respondents with a DrivingLicence by Age Band and Gender
Male
Female
All Persons
0
10
20
30
40
50
60
70
80
90
18 to 64 65 to 74 75 and over All Age Bands
Percentage
Age Band
Figure 30: Percentage of Respondents who Own/HaveRegular Use of a Vehicle by Age Band and Gender
Male
Female
All Persons
Ownership or regular use of a vehicle differs considerably for respondents aged 65 and over compared to those agedless than 65. Seventy eight percent of respondents in the 18 to 64 age cohort reported that they either owned or hadregular use of a vehicle. This fell to 68% for respondents aged 65 to 74, falling sharply to 41% for those aged 75 andover. This trend is also reflected in the percentage of respondents with a driving licence. Eighty three percent ofrespondents aged 18 to 64 stated that they held a driving licence. Seventy four percent of this age cohort held either afull car or motorcycle driving licence. For the age group 65 to 74, 69% were driving licence holders. This figure fell to45% for respondents aged 75 and over.
55

Appendix A
Background Notes
Guide to using the NTS results
Care should be taken when interpreting the NTS 2009 results or when comparing them with the POWCAR and otherdata sources. When comparing the NTS to POWCAR data, it should be noted that the NTS journey purpose of ‘work’includes both commuter and business travel while the POWCAR data includes commuter travel only; the NTScollected travel data for a specific day while the Census collected travel data for the ‘usual’ journey to work, school orcollege. Similarly, when examining issues such as the mode share for travel to school/education, it is important tonote that the NTS doesn’t accurately reflect the mode share for the whole student population as the NTS only sampledpersons aged 18 and over.
Data from other jurisdictions indicates that there can be significant seasonal variations in travel patterns. The NTStravel reference days covered the period October 2009 to January 201021, spanning the Christmas and New Yearholiday period when travel patterns may be atypical. This period also encompasses the shortest days and some ofthe coldest and wettest weather of the year. It is worth noting that Met Éireann’s records for this period showed rainfalltotals for November 2009 ‘were the highest on record at most stations, including the long-term stations at Malin Headand Valentia Observatory, where records extend back over 100 years’22. There were also heavy snowfalls in earlyJanuary 2010, leading to school closures and traffic disruption. Such extreme weather conditions invariably affecttravel patterns.
Reference period
The 2009 pilot National Travel Survey constituted a module in the 4th quarter of the 2009 Quarterly NationalHousehold Survey (QNHS)23. The travel reference days, i.e. the days for which travel data was collected, covered theperiod October 2009 to mid January 2010. Figure A1 shows the distribution of the travel reference days over thisperiod by month while Figures A2 and A3 shows the dispersal of the travel reference days by the day of the week andwhether the respondent travelled or not on that day.
21 For further information on the period covered by the survey, see Figure A1
22 Met Éireann. Monthly Weather Summary The Weather of November 2009
23 For a copy of the QNHS - Quarter 4, 2009 main results go to: http://www.cso.ie/releasespublications/pr_labforarchive.htm
57

14%
12%
12%
11%11%
17%
23%
Figure A3: Percentage Distribution of Travel ReferenceDays by Day of Week for Respondents who did not Travel
Monday
Tuesday
Wednesday
Thursday
Friday
Saturday
Sunday
16%
15%
15%
13%
14%
13%
14%
Figure A2: Percentage Distribution of Travel ReferenceDays by Day of Week for Respondents who Travelled
Monday
Tuesday
Wednesday
Thursday
Friday
Saturday
Sunday
7%
50%
12%
30%
Figure A1: Percentage Distribution of Travel ReferenceDays by Month
January
October
November
December
58

Key definitions
Population: Refers to adults, aged 18 and over, resident in the Republic of Ireland.
Travel: Is restricted to travel within the island of Ireland (i.e. includes travel within Northern Ireland).
Journey: A journey is defined as a one-way course of travel with a single main purpose. For example, a persontravelling from home to the shop and back has made two journeys, the first journey is from home to the shop andthe second journey is from the shop to home.
Journey purpose: The purpose of a journey is governed by what action was taken at the end of the journey.However, for homeward bound journeys, the purpose is governed by what action was taken at the end of thecorresponding outward journey (e.g. the purpose of a journey from the shops to home is ‘shopping’).
Return Journeys from work to home and home to work at lunch time were, where necessary, reclassified to apurpose of ‘shopping/food/drink’.
Main mode of travel: Journeys may consist of more than one mode of travel and each mode of travel is recordedas a separate stage within the journey. The main mode of travel is determined by the mode of travel used for thegreatest distance where there is more than one mode of travel used on a journey. In the event of there being morethan one main mode of travel (i.e. when two or more modes are of equal distance), then the main mode of travel isdetermined by the mode of travel used for the earliest stage of the journey.
Mode of travel ‘Other’: Within this category, the category ‘Other’ includes air, boat/ship and other modes oftransport. It also includes journeys by car, motorcycle and van/lorries where these weren’t identified as eitherdriver or passenger journeys.
Commuter travel: Refers to travel to and from work.
The duration of a journey and weekly travel times: These are calculated as the sum of time spent on eachstage of the journey and not the difference between the start and end time of a journey.
Data collection
The NTS data was collected on laptop computers using Computer Assisted Personal Interview (CAPI).
Symbols and conventions
All figures are rounded to the nearest whole digit. This may lead to a discrepancy between the sum of the constituentvalues and the totals shown in the tables and figures.
Conversion rate of miles to kilometres: 1 kilometre = 0.6213 mile (1 mile = 1.6095 kilometres).
The following symbols have been used throughout the report:
* = Small sample size. Results based on an unweighted sample of less than 30 have been replaced with anasterisk.
( ) = Figures in parentheses indicates that results are based on a small unweighted sample of between 30 and 50and are therefore subject to a large margin of error.
Sample design
A three-stage sample design was used to generate the NTS sample. The three sampling stages were as follows:
Stage1:
A total of 2,600 blocks (or small areas) were selected at county level to proportionally represent eight stratareflecting population density. Each block was selected to contain, on average, 75 dwellings and this sample ofblocks is fixed for a period of about five years.
59

Stage 2:
Approximately 15 households were surveyed from each block of wave three and wave five households (i.e. 757blocks) for the NTS survey sample24.
Stage 3:
From each of these 15 households, one individual, aged 18 or over, was randomly selected to participate in theNTS module and assigned a randomly selected ‘travel reference’ day.
From this original sample of 11,353 households and individuals, a total of 7,245 respondent households and 7,221respondent individuals formed the basis of the results in this publication25.
The NTS survey results were aggregated to agree with population estimates stratified by age, gender and region.
For detailed information on both sample design and weighting for the QNHS, which covers the first two stages of theNTS sample design, see the CSO website (www.cso.ie).
Grossing
The QNHS grossing procedure aligns the distribution of persons covered in the survey with independentlydetermined population estimates at the level of sex, age group and region. Given that the NTS questions were askedto a sub-sample (persons aged 18 and over) of the overall QNHS sample, the grossing factors applied in thederivation of the NTS module differs from those that were used in the preparation of the main QNHS estimates.
Respondents to the survey
Only direct respondents were included in the NTS survey (i.e. no third party responses were permitted for the NTSmodule).
ILO Labour Force Classification
The primary classification used for the QNHS results is the ILO (International Labour Office) labour forceclassification. The ILO classification distinguishes three distinct categories as follows:
1. In Employment: Persons who worked in the week before the main QNHS survey for one hour or more forpayment or profit, including work on the family farm or business and all persons who had a job but were not at workbecause of illness, holidays etc.
2. Unemployed: Persons who, in the week before the survey, were without work and available for work within thenext two weeks, and had taken specific steps, in the preceding four weeks, to find work.
3. Inactive Population (not in labour force): All other persons.
The labour force comprises persons employed plus unemployed (i.e. categories 1 and 2 above).
Statistical significance: All estimates based on sample surveys are subject to error, some of which is measurable.Where an estimate is statistically significantly different from another estimate it means that we can be 95% confidentthat differences between those two estimates are not due to sampling error. Unless otherwise stated, differencesmentioned in the text have been found to be statistically significant at the 95% confidence level.
24Each household selected for the QNHS survey is surveyed for five consecutive quarters. The first quarter that a household is surveyed is referred to as wave one, thesecond wave two, etc
25See Appendix C: National Travel Survey 2009 - Sample characteristics for further details on the NTS sample
60
Urban or rural location: The country is divided up into eight strata based on population density. These areas arefurther classified into urban and rural areas as follows:
Urban
• Cities• Suburbs of cities• Mixed urban or rural areas bordering on the suburbs of cities• Towns and their environs with populations of 5,000 or over (large urban)• Mixed urban or rural areas bordering on the environs of larger towns• Towns and their environs with a population of 1,000 to 5,000 (other urban)
Rural
• Mixed urban or rural areas• Rural areas
Region
The regional classifications correspond to the regional authorities established under the Local Government Act, 1991(Regional Authorities) (Establishment) Order, 1993, which came into operation on 1 January 1994.
• Dublin Dublin
Dún Laoghaire
Fingal
South Dublin
• All other regions All regions excluding Dublin
61


Appendix B
National Travel Survey 2009 -Questionnaire
Q1. Excluding school buses, is there a bus service provided locally?
1. Yes
2. No
Q2. How often do you use the local bus service?
1. Three or more times a week
2. Once or twice a week
3. Less than weekly but more than twice a month
4. Once or twice a month
5. Less than monthly but more than twice a year
6. Once or twice a year
7. Less than yearly or never
Q3. Is there a mainline train service provided locally?
1. Yes
2. No
Q4. How often do you use the local mainline train service?
1. Three or more times a week
2. Once or twice a week
3. Less than weekly but more than twice a month
4. Once or twice a month
5. Less than monthly but more than twice a year
6. Once or twice a year
7. Less than yearly or never
Q5. Is there a Dart or Luas service provided locally?
1. Yes
2. No
Q6. How often do you use the local Dart or Luas service?
1. Three or more times a week
2. Once or twice a week
3. Less than weekly but more than twice a month
4. Once or twice a month
5. Less than monthly but more than twice a year
6. Once or twice a year
7. Less than yearly or never
Q7. How many bicycles does your household have that are used by adults or children aged 6 or over?
63

Q8. How often do you use a bicycle?
1. Three or more times a week
2. Once or twice a week
3. Less than weekly but more than twice a month
4. Once or twice a month
5. Less than monthly but more than twice a year
6. Once or twice a year
7. Less than yearly or never
Q9. Do you own OR have regular use of a vehicle of any kind? Exclude company car pools - i.e. cars sharedwith work colleagues.
1. Yes
2. No
Q10. What is the registration number of this vehicle? Note: If more than one, the vehicle used most often by therespondent should be selected.
Q11. Where is this vehicle usually parked when it is not in use? This is where the vehicle is usually kept at night.
1. Driveway/garage of private house
2. Public road
3. Public car park
4. Private car park
Q12. Do you use this vehicle to drive any part of your journey to work?
1. Yes
2. No
Q13. Where is the vehicle usually parked during working hours?
1. Public car park
2. Private or firm’s car park
3. Park ‘n’ ride scheme
4. Metered on street parking
5. In a non-payment area
Q14. Do you hold any of the following driving licences that are valid in this country? Code disqualified drivers andinternational permits/other licenses valid in the Republic of Ireland as ‘2’
1. Provisional driving licence (CAR)
2. Full driving licence (CAR)
3. Provisional driving licence (MOTORCYCLE)
4. Full driving licence (MOTORCYCLE)
5. Passenger services vehicle licence (PSV)
6. Heavy goods vehicle licence (HGV)
7. No licence held
Q15. Please confirm the day of the week that the travel data refers to.
1. Monday
2. Tuesday
3. Wednesday
4. Thursday
5. Friday
6. Saturday
7. Sunday
Q16. Please confirm the date of the travel reference day
64
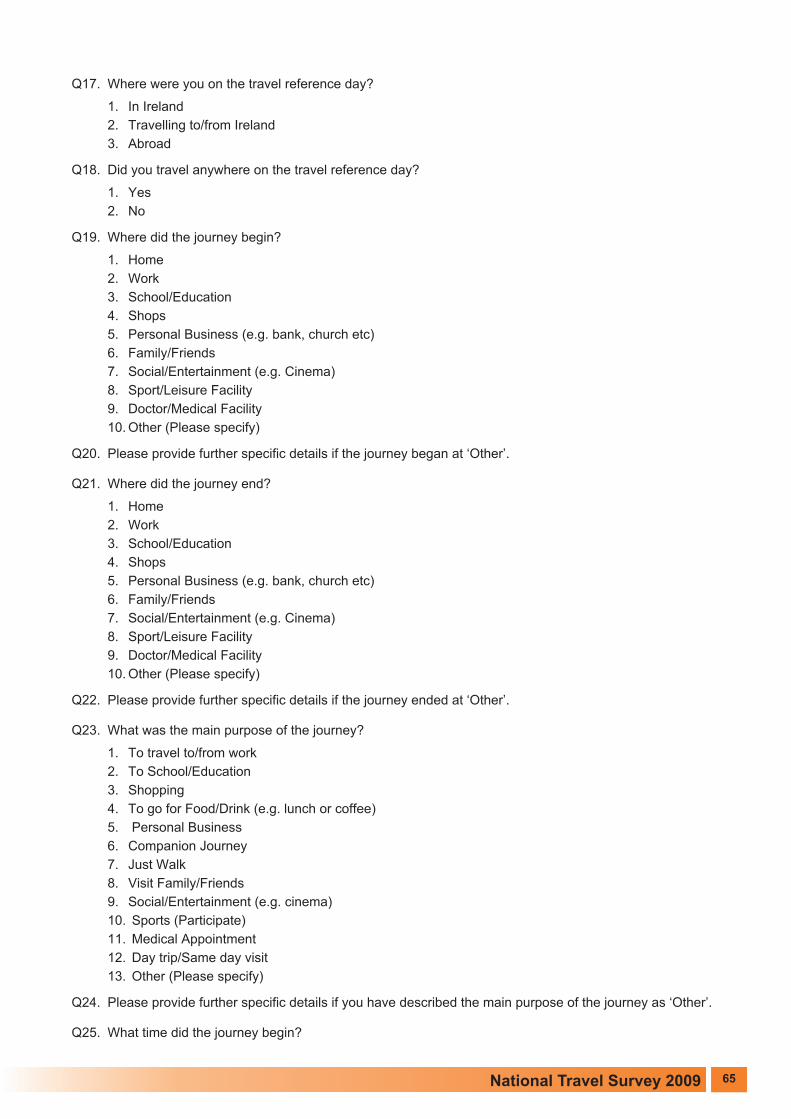
Q17. Where were you on the travel reference day?
1. In Ireland
2. Travelling to/from Ireland
3. Abroad
Q18. Did you travel anywhere on the travel reference day?
1. Yes
2. No
Q19. Where did the journey begin?
1. Home
2. Work
3. School/Education
4. Shops
5. Personal Business (e.g. bank, church etc)
6. Family/Friends
7. Social/Entertainment (e.g. Cinema)
8. Sport/Leisure Facility
9. Doctor/Medical Facility
10. Other (Please specify)
Q20. Please provide further specific details if the journey began at ‘Other’.
Q21. Where did the journey end?
1. Home
2. Work
3. School/Education
4. Shops
5. Personal Business (e.g. bank, church etc)
6. Family/Friends
7. Social/Entertainment (e.g. Cinema)
8. Sport/Leisure Facility
9. Doctor/Medical Facility
10. Other (Please specify)
Q22. Please provide further specific details if the journey ended at ‘Other’.
Q23. What was the main purpose of the journey?
1. To travel to/from work
2. To School/Education
3. Shopping
4. To go for Food/Drink (e.g. lunch or coffee)
5. Personal Business
6. Companion Journey
7. Just Walk
8. Visit Family/Friends
9. Social/Entertainment (e.g. cinema)
10. Sports (Participate)
11. Medical Appointment
12. Day trip/Same day visit
13. Other (Please specify)
Q24. Please provide further specific details if you have described the main purpose of the journey as ‘Other’.
Q25. What time did the journey begin?
65

Q26. What time did you arrive at your location?
Q27. How many modes of travel were used on the journey or how many stages were there to the journey? Ifmore than one mode of travel was used in the journey, each mode of travel is recorded as a separate stage.
Q28. What method of travel did you use for stage 1 of the journey?
1. Private Car - Driver
2. Private Car - Passenger
3. Motorcycle - Driver
4. Motorcycle - Passenger
5. Van/Lorry - Driver
6. Van/Lorry - Passenger
7. Walk
8. Bus - CIE/Dublin Bus
9. Bus - Private Operator
10. Rail
11. Dart/Luas
12. Cycle
13. Taxi/Hackney
14. Air
15. Boat/Ship
16. Other (Please specify)
Q29. If method of travel is ‘Other’, please specify the method.
Q30. Is this the same vehicle that you mentioned earlier i.e. in response to question 10 above? Note: Thisquestion is only asked if the mode of travel is either as a driver or passenger of a car or motorcycle orvan/lorry.
1. Yes
2. No
Q31. How many other people travelled in the vehicle? Note: This question is only asked if the mode of travel iseither as a driver or passenger of a car or motorcycle or van/lorry.
Q32. How many of the other occupants were aged 16 years of age and over? Note: This question is only asked ifthe answer to question 31 above is 1 or more.
Q33. How many of the other occupants were aged under 16 years of age? Note: This question is only asked ifthe answer to question 31 above is 1 or more.
Q34. How far did you travel using this method of travel? Note: Distances of less than one mile or one kilometrewere coded as ‘0’.
Q35. Is this distance in miles or kilometres?
1. Kilometres
2. Miles
Q36. How long, in minutes, did you spend travelling on this stage of the journey?
Note: Questions 28 to 36 are repeated for each stage of the journey
Q37. Was this journey part of your normal travel routine? (Note: This question was only asked in relation to
journeys that were described as ‘one-day visits’ OR if the total distance travelled was more than 30
kilometres OR the duration of the entire journey was more than 3 hours) .
1. Yes
2. No
3. No but expenditure already captured above
66

Q38. Please provide further details of the purpose of this journey. Note: This question was only asked if theanswer to question 37 above was 'No'.
Q39. What is the estimated expenditure, in Euros, spent in total by all occupants in your group for each of thefollowing categories? (Note: This question was only asked if Q37 above was asked and the answer was ‘2’i.e. the journey was not part of the respondent’s normal routine):
a) Meals
b) Fuel (private expenditure only)
c) Transport costs (excluding fuel)
d) Entertainment
e) Shopping
f) Other expenses
Q40. Did you make another journey on this day?
1. Yes
2. No
Note: Questions 19 to 40 are repeated for each journey
67


Urban/Rural Households
Number
Urban 4,299
Rural 2,946
State 7,245
Table C2: Unweighted Sample of Respondent
Households by Urban/Rural Residency
Households by Region
Region Households
Number
All Regions Excluding Dublin 5,558
Dublin 1,687
State 7,245
Table C1: Unweighted Sample of Respondent
Appendix C
National Travel Survey 2009 -Sample Characteristics
69

Age Band Gender Urban Rural State
18 to 24 Male 129 82 211
Female 159 76 235
All Persons 288 158 446
25 to 34 Male 341 184 525
Female 474 247 721
All Persons 815 431 1,246
35 to 44 Male 411 330 741
Female 506 365 871
All Persons 917 695 1,612
45 to 54 Male 318 267 585
Female 404 253 657
All Persons 722 520 1,242
55 to 64 Male 278 223 501
Female 324 237 561
All Persons 602 460 1,062
65 to 74 Male 228 187 415
Female 281 182 463
All Persons 509 369 878
75 and Over Male 136 104 240
Female 296 199 495
All Persons 432 303 735
All Age Bands Male 1,841 1,377 3,218
Female 2,444 1,559 4,003
All Persons 4,285 2,936 7,221
Urban/Rural
and Urban/Rural Residency
Table C3: Unweighted Sample of Respondents by Age Band, Gender
number
70
`
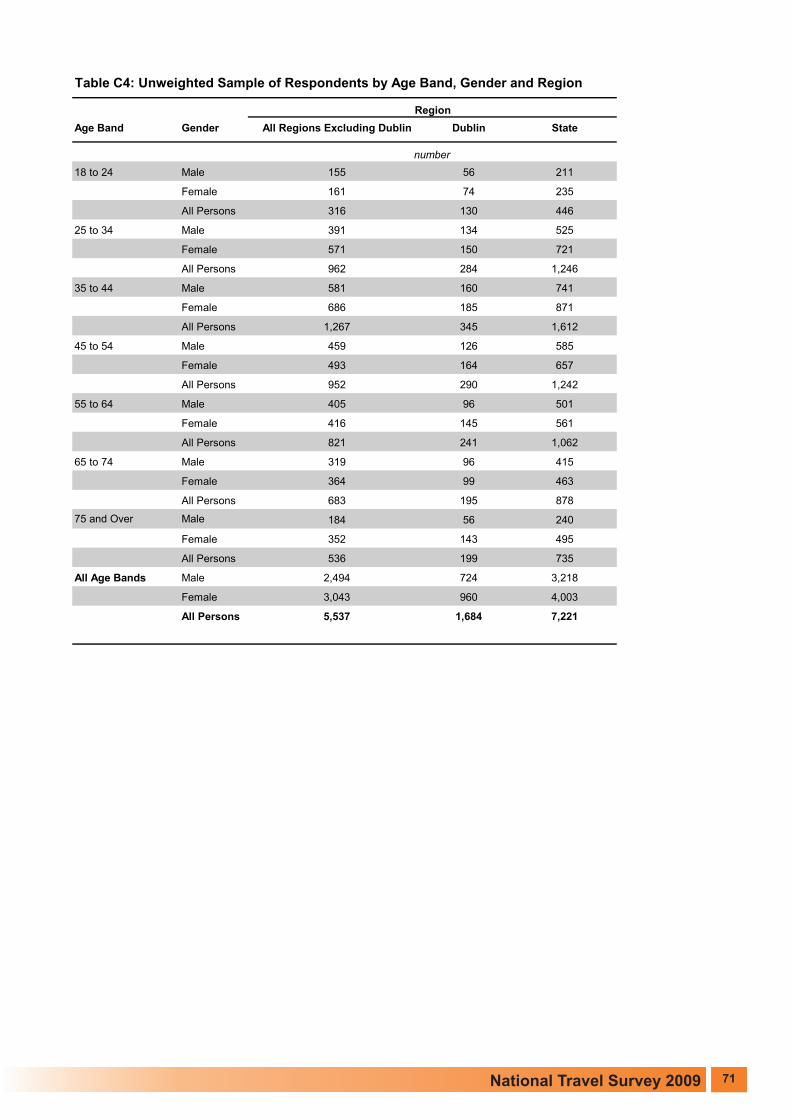
Age Band Gender All Regions Excluding Dublin Dublin State
18 to 24 Male 155 56 211
Female 161 74 235
All Persons 316 130 446
25 to 34 Male 391 134 525
Female 571 150 721
All Persons 962 284 1,246
35 to 44 Male 581 160 741
Female 686 185 871
All Persons 1,267 345 1,612
45 to 54 Male 459 126 585
Female 493 164 657
All Persons 952 290 1,242
55 to 64 Male 405 96 501
Female 416 145 561
All Persons 821 241 1,062
65 to 74 Male 319 96 415
Female 364 99 463
All Persons 683 195 878
75 and Over Male 184 56 240
Female 352 143 495
All Persons 536 199 735
All Age Bands Male 2,494 724 3,218
Female 3,043 960 4,003
All Persons 5,537 1,684 7,221
Region
Table C4: Unweighted Sample of Respondents by Age Band, Gender and Region
number
71
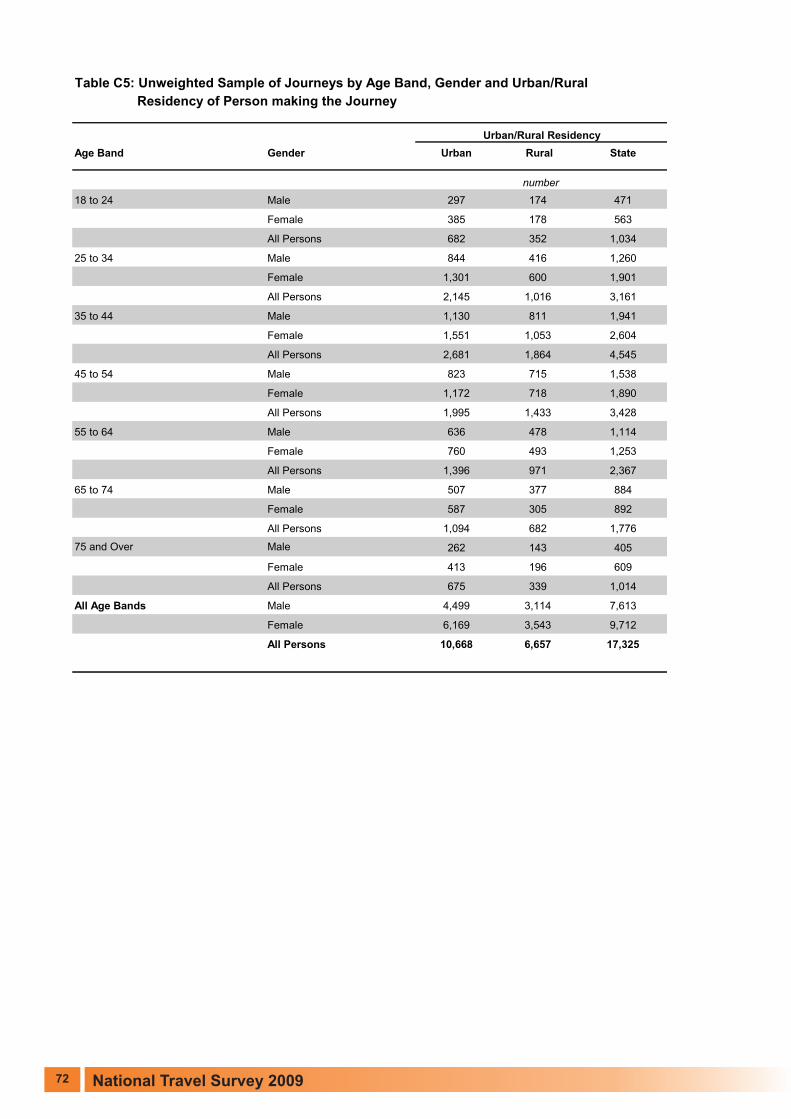
Residency of Person making the Journey
Age Band Gender Urban Rural State
18 to 24 Male 297 174 471
Female 385 178 563
All Persons 682 352 1,034
25 to 34 Male 844 416 1,260
Female 1,301 600 1,901
All Persons 2,145 1,016 3,161
35 to 44 Male 1,130 811 1,941
Female 1,551 1,053 2,604
All Persons 2,681 1,864 4,545
45 to 54 Male 823 715 1,538
Female 1,172 718 1,890
All Persons 1,995 1,433 3,428
55 to 64 Male 636 478 1,114
Female 760 493 1,253
All Persons 1,396 971 2,367
65 to 74 Male 507 377 884
Female 587 305 892
All Persons 1,094 682 1,776
75 and Over Male 262 143 405
Female 413 196 609
All Persons 675 339 1,014
All Age Bands Male 4,499 3,114 7,613
Female 6,169 3,543 9,712
All Persons 10,668 6,657 17,325
Urban/Rural Residency
Table C5: Unweighted Sample of Journeys by Age Band, Gender and Urban/Rural
number
72

Age Band Gender All Regions Excluding Dublin Dublin State
18 to 24 Male 343 128 471
Female 367 196 563
All Persons 710 324 1,034
25 to 34 Male 935 325 1,260
Female 1,503 398 1,901
All Persons 2,438 723 3,161
35 to 44 Male 1,519 422 1,941
Female 1,992 612 2,604
All Persons 3,511 1,034 4,545
45 to 54 Male 1,228 310 1,538
Female 1,434 456 1,890
All Persons 2,662 766 3,428
55 to 64 Male 914 200 1,114
Female 923 330 1,253
All Persons 1,837 530 2,367
65 to 74 Male 647 237 884
Female 651 241 892
All Persons 1,298 478 1,776
75 and Over Male 284 121 405
Female 402 207 609
All Persons 686 328 1,014
All Age Bands Male 5,870 1,743 7,613
Female 7,272 2,440 9,712
All Persons 13,142 4,183 17,325
Region
Table C6: Unweighted Sample of Journeys by Age Band, Gender and Region
of Person making the Journey
number
73


List of Tables
Page
Table 1 Average Weekly Travel Profile by Urban/Rural Residency 7
Table 2 Average Journey Profile by Urban/Rural Residency 7
Table 3 Average Journey Distance, Duration and Speed by Mode of Travel 9
Table 4 Average Weekly Travel Profile by Age Band (Under and Over 65) 9
Table 5 Average Weekly Travel Profile by ILO Status 9
Table 6 Average Journey Distance, Duration and Speed by Journey Purpose 10
Table 7 Percentage Distribution of Journeys by Distance and Mode of Travel 11
Table 8 Percentage Distribution of Journeys by Mode of Travel and Region 12
Table 9 Average Weekly Travel Profile by Gender 12
Table 10 Average Weekly Travel Profile by Urban/Rural Residency and Gender 15
Table 11 Average Weekly Travel Profile by Age Band 16
Table 12 Average Weekly Travel Profile by Region and Gender 16
Table 13 Percentage Distribution of Journeys by Age Band and Journey Purpose 18
Table 14 Percentage Distribution of Journeys by Journey Purpose, Urban/Rural Residency andGender 18
Table 15 Percentage Distribution of Journeys by Mode of Travel and Gender 19
Table 16 Percentage Distribution of Journeys by Mode of Travel and Age Band 20
Table 17 Percentage Distribution of Journeys by Mode of Travel and Urban/Rural Residency 20
Table 18 Percentage Distribution of Journeys by Mode of Travel and Region 21
Table 19 Average Journey Distance by Region and Gender 24
Table 20 Average Journey Distance by Journey Purpose 24
Table 21 Average Journey Distance by Mode of Travel 25
Table 22 Average Journey Duration by Mode of Travel 28
Table 23 Average Journey Speed by Mode of Travel and Region 28
Table 24 Average Journey Speed by Mode of Travel and Urban/Rural Residency 29
Table 25 Percentage Distribution of Journeys by Duration, Urban/Rural Residency and Gender 29
Table 26 Average Journey Duration by Journey Purpose 30
Table 27 Average Journey Duration by Region and Gender 30
75

Table 28 Percentage Distribution of Journeys by Start Time and Urban/Rural Residency 31
Table 29 Percentage Distribution of Journeys by Start Time and Mode of Travel 32
Table 30 Average Journey Profile by Start Time and Mode of Travel 33
Table 31 Average Journey Speed by Start Time and Urban/Rural Residency 34
Table 32 Percentage Distribution of Journeys by Distance and Region 36
Table 33 Percentage Distribution of Journeys by Mode of Travel and Distance 37
Table 34 Percentage Distribution of Journeys by Distance and Journey Purpose 37
Table 35 Percentage Distribution of Journeys by Journey Purpose and Distance 38
Table 36 Percentage Distribution of Journeys by Distance and ILO Status 40
Table 37 Percentage Distribution of Journeys by Mode of Travel and ILO Status 41
Table 38 Percentage Distribution of Journeys by Journey Purpose and ILO Status 42
Table 39 Percentage Distribution of Journeys by Duration and ILO Status 42
Table 40 Percentage Distribution of Respondents by Frequency of Use of Local Public Transportand Region 46
Table 41 Percentage of Respondents with a Driving Licence by Gender and Urban/RuralResidency 46
Table 42 Percentage of Respondents who Own/Have Regular Use of a Vehicle by Urban/RuralResidency and Gender 47
Table 43 Percentage Distribution of Respondents by Parking Place when Vehicle is not in use 48
Table 44 Percentage Distribution of Respondents by Place of Parking During Work Hours 50
Table 45 Percentage Distribution of Journeys by Mode of Travel, Age Band and Gender(Under and Over 65) 53
Table 46 Percentage Distribution of Journeys by Distance, Age Band and Gender(Under and Over 65) 54
Table C1 Unweighted Sample of Respondent Households by Region 69
Table C2 Unweighted Sample of Respondent Households by Urban/Rural Residency 69
Table C3 Unweighted Sample of Respondents by Age Band, Gender and Urban/RuralResidency 70
Table C4 Unweighted Sample of Respondents by Age Band, Gender and Region 71
Table C5 Unweighted Sample of Journeys by Age Band, Gender and Urban/Rural Residencyof Person making the Journey 72
Table C6 Unweighted Sample of Journeys by Age Band, Gender and Region of Person makingthe Journey 73
76

List of Figures
Page
Figure 1 Percentage Distribution of Journeys by Journey Purpose 8
Figure 2 Percentage Distribution of Journeys by Mode of Travel 8
Figure 3 Percentage Distribution of Journeys by Duration 10
Figure 4 Percentage Distribution of Journeys by Distance 11
Figure 5 Percentage Distribution of Respondents by Frequency of Use of Local Public Transportand Urban/Rural Residency 13
Figure 6 Percentage of Respondents who Own/Have Regular Use of a Vehicle by Age Band 14
Figure 7 Percentage Distribution of Journeys by Journey Purpose and Gender 17
Figure 8 Average Journey Distance by Gender and Urban/Rural Residency 23
Figure 9 Average Journey Duration by Gender and Urban/Rural Residency 27
Figure 10 Percentage Distribution of Urban Journeys by Distance 35
Figure 11 Percentage Distribution of Rural Journeys by Distance 35
Figure 12 Percentage Distribution of Journeys by Distance and Gender 36
Figure 13 Average Weekly Number of Journeys by ILO Status 39
Figure 14 Average Weekly Distance Travelled by ILO Status 40
Figure 15 Average Weekly Travel Time by ILO Status 41
Figure 16 Percentage of Households with a Local Public Transport Service by Urban/RuralResidency 43
Figure 17 Percentage of Households with a Local Public Transport Service by Urban/RuralResidency and Type of Local Public Transport Service 44
Figure 18 Percentage of Households with a Local Public Transport Service by Region 44
Figure 19 Percentage Distribution of Respondents by Type of Local Public Transport Service andFrequency of Use of Service 45
Figure 20 Percentage Distribution of Respondents by Frequency of Use of Local Public Transportand Urban/Rural Residency 45
Figure 21 Percentage of Respondents with a Driving Licence by Region 46
Figure 22 Percentage of Respondents with a Full Car or Motorcycle Driving Licence by Age Bandand Gender 47
Figure 23 Percentage of Respondents who Own/Have Regular Use of a Vehicle by Age Band andGender 48
77
Figure 24 Percentage of Respondents who Own/Have Regular Use of a Vehicle by Region andGender 48
Figure 25 Percentage of Respondents in Employment who Use their Vehicle to Drive to Work byRegion 49
Figure 26 Percentage of Respondents in Employment who Use their Vehicle to Drive to Work byAge Band 49
Figure 27 Average Weekly Number of Journeys by Age Band (Under and Over 65) and Gender 51
Figure 28 Average Weekly Distance Travelled by Age Band (Under and Over 65) and Gender 51
Figure 29 Average Weekly Travel Time by Age Band (Under and Over 65) and Gender 52
Figure 30 Percentage of Respondents who Own/Have Regular Use of a Vehicle by Age Band(Under and Over 65) and Gender 55
Figure 31 Percentage of Respondents with a Driving Licence by Age Band (Under and Over 65)and Gender 55
Figure 32 Percentage of Respondents with a Full Car or Motorcycle Driving Licence by Age Band(Under and Over 65) and Gender 55
Figure A1 Percentage Distribution of Travel Reference Days by Month 58
Figure A2 Percentage Distribution of Travel Reference Days by Day of Week for Respondentswho Travelled 58
Figure A3 Percentage Distribution of Travel Reference Days by Day of Week for Respondentswho did not Travel 58
78