An indicator-based assessment framework to identify ...
63
Transcript of An indicator-based assessment framework to identify ...
EUROPEAN COMMISSION
An indicator-based assessment framework to identify country-specific challenges
towards greener growth
Joan Canton, Ariane Labat and Anton Roodhuijzen
Economic Papers 401 | February 2010
EUROPEAN ECONOMY

Economic Papers are written by the Staff of the Directorate-General for Economic and Financial Affairs, or by experts working in association with them. The Papers are intended to increase awareness of the technical work being done by staff and to seek comments and suggestions for further analysis. The views expressed are the author’s alone and do not necessarily correspond to those of the European Commission. Comments and enquiries should be addressed to: European Commission Directorate-General for Economic and Financial Affairs Publications B-1049 Brussels Belgium E-mail: [email protected] This paper exists in English only and can be downloaded from the website ec.europa.eu/economy_finance/publications A great deal of additional information is available on the Internet. It can be accessed through the Europa server (ec.europa.eu) KC-AI-10-401-EN-N ISSN 1725-3187 ISBN 978-92-79-14887-3 DOI 10.2765/39167 © European Communities, 2010

An indicator-based assessment framework to identify country-specific challenges towards greener growth
By Joan Canton, Ariane Labat and Anton Roodhuijzen
European Economy Economic paper n° 401

2
ACKNOWLEDGEMENTS
The authors are grateful to the Chairman Lorenzo Codogno and the members of the Lisbon Methodology Working Group (LIME) attached to the Economic Policy Committee (EPC) for having provided very useful comments and suggestions. We would especially like to thank Nathalie Darnaut, Mark Hayden, Gilles Mourre, Declan Costello and Gert-Jan Koopman for guidance and comments provided. Contributions, suggestions and support by other colleagues of the Commission, in particular by colleagues in DG ECFIN Directorate B and in DG EMPL and ENV are gratefully acknowledged. Nonetheless, the views expressed in this paper are those of the authors and should not be attributed to the European Commission or Member States.
ABSTRACT
The paper sets the basis for an indicator-based analytical framework to assess Member States' policies to promote "green growth". An illustrative application of this new analytical framework reveals that it can be used to provide a nuanced economic assessment of Member States' environmental performance. This framework can serve to highlight country-specific strengths in addressing environmental challenges in a way that best fosters growth and jobs. To prepare for future economic policy monitoring at the EU level, a test was also run to analyse performance in various dimensions of environmental policy in combination with information about macroeconomic performance. Overall, this framework can contribute to identify country-specific challenges to create new sources of green growth; it may therefore serve to encourage relevant structural reforms bringing about a competitive greener economy.

CONTENTS
Executive Summary…...................................................................................................... 8
1 INTRODUCTION ....................................................................................................... 13
2 INTRODUCING GREEN GROWTH ISSUES IN AN INDICATOR-BASED ASSESSMENT ............................................................................................................ 14
2.1 Methodology ................................................................................................. 14
Step 1: Determinants of “green growth”- four policy areas identified.......... 14
Step 2: Selecting the most relevant best-available indicators ....................... 15
Step 3: Computing individual scores............................................................. 22
Step 4: Aggregating and interpreting scores ................................................. 22
Step 5: Interpreting performance................................................................... 22
2.2 Testing the assessment framework in an environmental policy context ........................................................................................................... 23
3 TENTATIVE EXPLORATION OF POSSIBLE LINKS BETWEEN ENVIRONMENTAL AND MACRO-ECONOMIC CHALLENGES ................................... 26
3.1 Introduction ................................................................................................... 26
Identifying relevant macro-economic dimensions ........................................ 26
Confronting green and macro-economic areas.............................................. 26
3.2 Testing the assessment framework on structural reforms ............................. 29
Grouping countries by macroeconomic challenges to assess environmental policies .................................................................................. 29
Finding common occurrences of over/underperformance along key macro-economic dimensions and “green growth” issues.............................. 29
Analysing country-specific relations between macro-economic and environmental concerns................................................................................. 30
4 ANNEXES ................................................................................................................. 32
Details of Step 2.a: Collecting and selecting relevant indicators ............................. 32
1. Tracking reliance on cost-efficient environmental policies ........... 32
2. Tracking sound use of public finances........................................... 33
3. Tracking efforts to improve market functioning and foster competitiveness.............................................................................. 35
4. Tracking the “green” boost to long term productivity ................... 38
Details of Step 2.b: Narrowing and consolidating the list of indicators................... 41

European Commission Economic paper no 401
1. Minimum statistical standards ........................................................41
2. Correlation between indicators .......................................................43
3. Recommendations for a narrow list of indicators........................................44
4. Robustness checks and sensitivity analyses ................................................48
List of indicators not included in the analysis .......................................................................50
Examples of outputs of the hands-on tools, used for exploring possible links between environmental and macro-economic challenges............................................57
References .............................................................................................................................60
LIST OF TABLES AND FIGURES Table 1: Summary of areas, domains and relevant best-available indicators.............................. 16
Table 2: Summary of consolidation of the set of indicators........................................................ 17
Table 3: Levels of green concerns by environmental area .......................................................... 25
Table 4: Level of macro-economic concern (from LAF) ............................................................ 26
Table 5: Potential interactions between green and macro-economic performances.................... 28
Table 6: Correlation scores for Indicators in area I ..................................................................... 45
Table 7: Correlation scores for indicators in area II.................................................................... 45
Table 8: Correlation scores for indicators in area III .................................................................. 46
Table 9: Correlation scores for indicators in area IV .................................................................. 47
Table 10: Weights applied in area I. Cost-efficiency .................................................................. 48
Table 11: Weights applied in area II. Sound use of public finances ........................................... 48
Table 12: Weights applied in area III. Strong markets................................................................ 48
Table 13: Weights applied in area VI. Long-term productivity .................................................. 49
Table 14: Available environmental indicators not included........................................................ 50
Figure 1: Breakdown of “green growth” issue into policy areas and domains ............................. 8
Figure 2: Approach to assess Member States' performance in green growth dimension .............. 8
Figure 3: Member States' scores per environmental area .............................................................. 9
Figure 4: Interactions between green and macro performances .................................................. 10
Figure 5: Framework to assess performance and identify greener growth challenges................ 12
Figure 6: Summary of the approach from Step 1 to 5 ................................................................. 23
Figure 7: Member States' scores per environmental area ............................................................ 24
Figure 8: “Green” performances for countries with low unemployment concern....................... 57
Figure 9: “Green” performances for countries with medium unemployment concern ............... 58
Figure 10: “Green” performances for countries with high unemployment concern ....................................................................................................................59
5

Towards a Green Growth Assessment Framework
LIST OF ABBREVIATIONS AT Austria BE Belgium BG Bulgaria CY Cyprus CZ Czech Republic DE Germany DG Directorate-General DK Denmark EE Estonia EEA European Environmental Agency EIB European Investment Bank EMCO Employment Committee EMPL Employment ENTR Enterprises and Industry ENV Environment EPR Environmental Policy Review ES Spain ETR Environmental Tax Reform ETS Emissions Trading Scheme EU European Union EUR Euro FI Finland FR France GBAORD Government budget appropriations or outlays on R&D GDP Gross Domestic Product GHG Greenhouse Gas GR Greece HU Hungary IE Ireland IT Italy LAF LIME Assessment Framework LIME Lisbon Methodology Working Group LT Lithuania LU Luxembourg LV Latvia MBI Market Based Instruments MS Member State MT Malta NL Netherlands OECD Organisation for Economic Cooperation and Development PL Poland PM Particulate Matter PT Portugal R&D Research and Development RO Romania SCP Sustainable Consumption and Production SE Sweden SI Slovenia SK Slovakia SME Small and Medium-sized Enterprises TAXUD Taxation and Customs Union TFP Total Factor Productivity TREN Transport and Energy UK United Kingdom
6

European Commission Economic paper no 401
EXECUTIVE SUMMARY The EU aims to lead, compete and prosper as a greener, knowledge-based economy, growing fast and sustainably and creating high levels of employment. To mobilise new sources of green growth, social, economic and environmental policies need to be brought more closely together. Accordingly, tools to identify and monitor policies which can achieve a faster transition to a greener economy are needed.
This note explores the possibility of developing an analytical framework to assess Member States' policies to achieve their climate change goals from an economic perspective and notably to promote “green growth”. In particular, it outlines some tentative ideas for an indicator-based assessment of Member States policies in a number of important economic dimensions of what could be their “green growth” strategies. This paper remains a test run, which is certainly not meant to draw firm policy conclusions. While in the future, this indicator-based assessment framework could become an analytical tool – amongst others – to help design policies in the environmental area, it will by no means become a “mechanical rule” for policymaking.
The framework developed by the Lisbon methodology working group (LIME) to assess growth-enhancing policy areas – the LIME Assessment Framework (LAF) – which combined an indicator-based assessment with a consideration of country-specific evidence, has been a useful tool to support coordination of economic and employment policies under the Lisbon Strategy. However, it did not include the environmental determinants of growth. Besides, environmental policy monitoring has so far been centred on progress towards climate change and energy targets, and hence could not properly address inter-linkages between growth and policies supporting environmental objectives.
Therefore, we propose an indicator-based assessment framework to track how structural reforms may encourage a competitive, greener economy. This tool combines best available indicators into aggregated performance scores that measure the distance to the EU27 average and improvements over time. The tool is flexible to incorporate new, relevant indicators, as they become available. As the economic literature confirms the existence of tangible links between these indicators and growth, and as the set of indicators was streamlined using correlation and sensitivity tests, aggregated scores give a meaningful snapshot of Member States' strengths and weaknesses in relation to their transition to a greener economy.
The proposed indicator-based assessment framework detects progress in the shift to a competitive greener economy by evaluating Member States' performance in the following four areas, each reflecting a key link from environmental policies to economic growth and employment: (i) reliance on cost-efficient environmental policy instruments; (ii) sound use of public finances for environmental purposes; (iii) reinforced markets providing “green” goods and services; and (iv) increased total factor productivity resulting from measures aiming at environmental improvements. Fully capturing employment opportunities from the transition to a greener economy and adapting infrastructure accordingly are other key areas for designing optimal policies, but deeper analysis of these issues is taking place in other contexts and our tool is incomplete in this regard. By design, the framework we propose could be used for the surveillance of structural reforms, as performance improves in the four areas mentioned above when best practices are implemented in the nine domains of policy intervention identified in figure 1.
7

Towards a Green Growth Assessment Framework
Figure 1: Breakdown of “green growth” issues into policy areas and domains
Areas Domains
Minimising costs I. Cost-efficiency
Creating price signals
Minimising distortions II. Sound use of public finances Maximising benefits of public spending
Reinforcing energy markets III. Strong markets
Eco-efficient markets for products and services
Protecting health
Building green human capital
Green Growth
IV. Long-term productivity
Boosting green technological progress
Figure 2 below summarises the approach taken to make a nuanced assessment of Member States' performances towards green growth.
Figure 2: Approach to assess Member States performance in the green growth dimension
Areas Scoring Indicator based assessment Qualification
I. Cost-efficiency
II. Sound use of public finances
III. Strong markets
IV. Long-term productivity
Computing aggregated scores from changes to levels of most relevant best-available indicators
Interpreting the 4 aggregated scores as High, Medium or Low levels of concerns, in relation to a benchmark
Drawing tentative conclusions: - High levels of concern in one area => it may be a "green growth" challenge. - Medium/Low levels of concern in one area => either this challenge is solved, or opposing trends in domains conceal a challenge
We also present results from a preliminary “mechanical application” of the approach, for illustrative purposes only: the usual caveats apply to this type of indicator-based assessment, which in line with earlier LIME work would need to be accompanied by additional qualitative and country-specific information before any policy conclusions should be drawn.
8

European Commission Economic paper no 401
Figure 3: Member States' scores per environmental area
Nonetheless, this preliminary application revealed that it was possible to draw policy findings by analysing the performance scores yielded by the tool independently and combined with macro-economic information. Indeed, we found that the tool is useful to provide a nuanced assessment of Member States' environmental performance, and contributes to identifying country-specific challenges to move to green growth, based on Figure 3:
− The indicator-based assessment framework facilitates assessment in areas otherwise difficult to capture with targets or indicators that measure the distance to these targets, making it a useful tool to monitor environmental policy. This assessment allows Member States' “green” performance to be screened based on aggregate scores, and can provide information on their performance as such, without necessarily requiring a reference to individual indicators.
− In many cases, Member States show contrasting levels of performance depending on the environmental area considered. This analysis would reveal scope for a further exchange of best practices, potentially raising the level of environmental performance across the EU.
− It can also be worth investigating performance within each of these areas, at the more disaggregated level of domains. This gives an opportunity to investigate further the consequences for a country of experiencing relative under-performance in one domain balanced by over-performance in another domain. This confirms that country-specific analysis must be performed at domain level.
Overall, an indicator-based analysis of Member States' environmental performance can bring additional insight to identify the most appropriate structural reforms to tap new sources of growth and create new jobs, while addressing environmental challenges.
To prepare for future work, a test was run to explore the interactions between macroeconomic and environmental challenges at Member State level, comparing performance in various dimensions of environmental policy with relevant aspects of macroeconomic performance. Macroeconomic
Close to benchmark
Over performance
Under performance
Area I. Cost-efficiency
Area II. Sound use of public
finances
Area III. Strong markets
Area IV. Long-term
productivity
-20 -12 -4 4 12
BEBGCZDKDEEEIEG
ESFRIT
CYLVLTLU
HMTNLATPLPTRSI
SKFI
SEUK
-12 -4 4 12 20 28 -20 -12 -4 4 12 -12 -4 4 12
RSISKFISEUK
20
BEBGCZDKDEEEIEGESFRITCYLVLTLUHMTNLATPLPT
9
Towards a Green Growth Assessment Framework
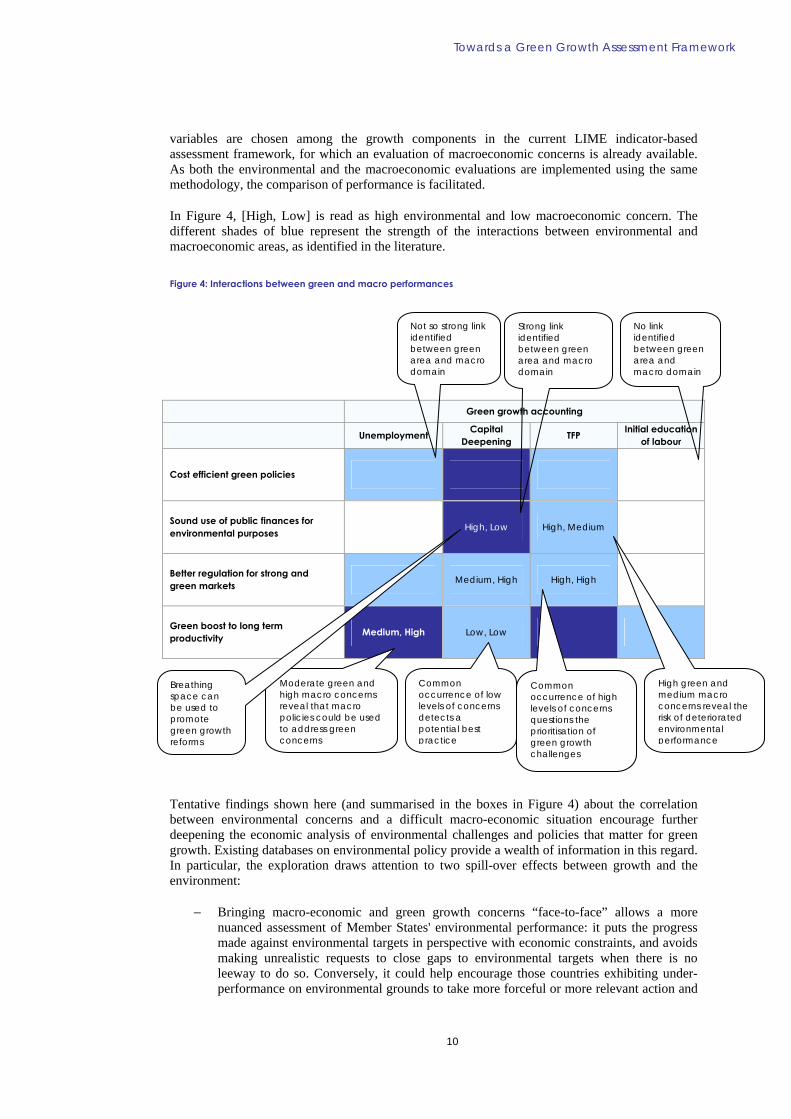
variables are chosen among the growth components in the current LIME indicator-based assessment framework, for which an evaluation of macroeconomic concerns is already available. As both the environmental and the macroeconomic evaluations are implemented using the same methodology, the comparison of performance is facilitated.
In Figure 4, [High, Low] is read as high environmental and low macroeconomic concern. The different shades of blue represent the strength of the interactions between environmental and macroeconomic areas, as identified in the literature.
Figure 4: Interactions between green and macro performances
Green growth accounting
Unemployment Capital Deepening TFP Initial education
of labour
Cost efficient green policies
Sound use of public finances for environmental purposes High, Low High, Medium
Better regulation for strong and green markets Medium, High High, High
Green boost to long term productivity Medium, High Low, Low
Not so strong link identified between green area and macro domain
No link identified between green area and macro domain
Strong link identified between green area and macro domain
Common occurrence of low levels of concerns detects a potential best practice
Common occurrence of high levels of concerns questions the prioritisation of green growth challenges
High green and medium macro concerns reveal the risk of deteriorated environmental performance
Moderate green and high macro concerns reveal that macro policies could be used to address green concerns
Breathing space can be used to promote green growth reforms
Tentative findings shown here (and summarised in the boxes in Figure 4) about the correlation between environmental concerns and a difficult macro-economic situation encourage further deepening the economic analysis of environmental challenges and policies that matter for green growth. Existing databases on environmental policy provide a wealth of information in this regard. In particular, the exploration draws attention to two spill-over effects between growth and the environment:
− Bringing macro-economic and green growth concerns “face-to-face” allows a more nuanced assessment of Member States' environmental performance: it puts the progress made against environmental targets in perspective with economic constraints, and avoids making unrealistic requests to close gaps to environmental targets when there is no leeway to do so. Conversely, it could help encourage those countries exhibiting under-performance on environmental grounds to take more forceful or more relevant action and
10

European Commission Economic paper no 401
catch up with countries that have similar macroeconomic constraints but are contributing better to achieving EU environmental goals.
− It helps to identify growth-enhancing policy interventions designed for environmental purposes, or at least situations where a country manages to address macro-economic weaknesses without losing sight of its environmental commitments. It can help analyse spill-over effects from lack of progress towards environmental goals on growth components, for countries where a divergence of environmental and economic performance is observed. Conversely, it can reveal the potential for improving economic performance by better addressing environmental challenges. Other tools for environmental policy monitoring cannot systematically detect this opportunity.
Figure 5 below provides a synthetic overview of the approach proposed for economic surveillance of structural reforms for green growth.
11

Towards a Green Growth Assessment Framework
ACTION OUTCOME
1
4
STEP
Approach to assessing Member States' performance in green growth dimension
Approach to tentatively investigating the impact of green growth dimension on macro performance
2
Identifying determinants of green growth
Where to focus economic analysis of "green growth": On four policy areas: cost-efficiency, sound use of public finances, strong markets, long-term productivity, and domains where policy responses drive performance in these areas
Collecting and selecting relevant indicators under each domain
Around 30 indicators (available EU-wide) selected in the narrow list
Statistical analysis (scoring) for each indicator
Compute a LAF-based score for each indicator
Establish environmental performance per Member State across the four policy areas
Computed aggregate scores over the narrow list
Tentative policy conclusions based on aggregate scores per policy area
Based on aggregate indicator-based results at the level of a policy area (nuanced by consideration of scores for each domain), a tentative assessment of performance is made, that is low, medium or high "green" concern
5
Screening performance along main growth components and other macro issues
Identifying and exploring common occurrences of issues in green policy areas and macro domains
Assessment of macro performance covering domains like Unemployment; Capital deepening; Total Factor Productivity; Initial education of labour
A tentative exploratory assessment of inter-linkages between green and macro performances calling for establishing the nature and strengths of these links on further empirical and theoretical evidence
3
App
roac
h to
ass
essin
g M
embe
r Sta
tes'
'gre
en g
row
th' p
erfo
rman
ce
Tent
ativ
e ex
plor
atio
n of
pos
sible
en
viro
nmen
t-ec
onom
y lin
ks
Approach to identifying the determinants of the green growth dimension
Figure 5: Framework to assess performance and identify greener growth challenges
12
European Commission Economic paper no 401
1 INTRODUCTION
The EU has legally binding commitments in the area of climate change, namely to achieve by 2020 a reduction of at least 20% in GHG and a 20% share of renewable energies in EU energy consumption: the commitment could become more ambitious depending on the ultimate outcome of the Copenhagen climate change summit. A number of important Community instruments have already been put in place, including an EU emissions trading scheme: these EU level instruments are expected to make a significant contribution (up to 50%) to achieving the 20:20:20 objectives1. The remainder will have to be accomplished through policy measures at Member State level, which given their potential scale could have macroeconomic effects in terms of growth, jobs and public finances.
This note explores the possibility of developing an analytical framework to assess Member States' policies to achieve their climate change goals from an economic perspective and notably to promote “green growth”. In particular, it outlines some tentative ideas for an indicator-based assessment of Member States' policies in a number of important economic dimensions of what could be their “green growth” strategies. It also explores the interactions between macroeconomic and environmental challenges at Member State level, comparing performance in various dimensions of environmental policy with relevant aspects of macroeconomic performance. Compared with existing analytical approaches within the Commission on how to spur green growth country-by-country, which tended to focus on specific instruments, targets or fields of intervention, this note aims to develop a more integrated economic analysis of measures playing a role in supporting “green growth” by combining the assessment of climate change policies, the regulatory framework governing markets for energy-related goods and services, policies greening the labour markets, economic, financial and fiscal incentives designed to internalise environmental externalities, etc. The note therefore draws heavily on analytical frameworks developed already by LIME and other analytical work of the Commission services2.
This note is motivated by two additional considerations:
− Climate change and energy policies are likely to be a very important dimension of the post-2010 Lisbon strategy, referred to as EU20203, on which a consultation exercise is now underway. This was acknowledged in the conclusions of the ECOFIN Council of 3 December, which called for new elements to be integrated in an economically sound manner, and that new policies should be designed cost effectively and assessed according to their implications for growth and jobs;
− against the background of developing exit strategies from the crisis that return EU economies to sustainable growth and public finance trajectories, there will be a large premium in pursuing win-win reform strategies which can positively contribute to both growth/jobs and sound public finances. Policies to promote “green growth” offer such potential, and therefore could usefully be considered in debates on national exit strategies.
1 E.g. Progress towards achieving the Kyoto objectives - COM(2009)630; The renewable Energy progress report -
COM(2009) 192; 2008 Environment Policy Review - SEC(2009)842, 2009 Review of the European Union Strategy for Sustainable Development - COM(2009)400, Assessment of 27 National Energy Efficiency Action Plans SEC(2009) 889, The CO2 emissions from cars in the EU: data for the years 2005, 2006 and 2007" COM(2009) 9, etc.
2 DG ECFIN "The EU's response to support the real economy during the economic crisis: an overview of Member States' recovery measures", DG TAXUD "Taxation trends in the European Union 2009" and DG TREN "Renewable energy progress report 2009" contain an economic analysis of national measures addressing climate and energy challenges, discussing their relative cost-effectiveness, however determining their wider macro-economic impacts is not in the scope of these reports.
3 Consultation on the future "EU 2020" Strategy, COM(2009) 647/3
13

Towards a Green Growth Assessment Framework
The remainder of this note is organised as follows. Section 2 outlines an indicator-based assessment framework to assess s' performance in four policy dimensions relevant for national “green growth”. It also presents results from a preliminary “mechanical application” of the approach, for illustrative purposes only. The usual caveats apply to this type of indicator-based assessment, which in line with earlier LIME work, would need to be accompanied by additional qualitative and country-specific information before any policy conclusions should be drawn. Section 3 outlines an approach to compare performance in various dimensions of environmental policy with relevant aspects of macroeconomic performance. Annexes contain a detailed description of the analysis carried out to select preliminary indicators for this note; in particular, they provide more detailed explanations of the criteria/properties used to select statistical indicators as well as information on their statistical quality. A list of references is also included.
2 INTRODUCING GREEN GROWTH ISSUES IN AN INDICATOR-BASED ASSESSMENT
Methodology Step 1: Determinants of “green growth”- four policy areas identified
Design and implementation of “green growth” enhancing structural reforms could be part of economic surveillance with the aim to identify sources of “green growth” and relevant policy intervention to lift barriers to “green growth”. The analysis could focus on the following four types of key links from environmental policy to growth and jobs potential:
(a) Reducing negative environmental externalities; relying on cost-efficient environmental policies to internalise environmental externalities.
(b) Ensuring environmental policy interventions contribute to sound use of public finances and to fiscal consolidation.
(c) Improving the functioning of markets to deliver sustainable consumption and production.
(d) Increasing total factor productivity from aiming for environmental improvements (capital deepening, developing knowledge assets and human capital).
A body of literature supports the choice of these areas. Ricci (2009) presents the main impacts of environmental policy on economic growth. Among others, Hope (2009) discusses the need to minimise costs of environmental policy over a long-term growth path and Baumol and Oates (1975) give fundamental justifications about the role of environmental policy instruments creating price signals. Bovenberg and Goulder (1995) discuss environmental tax reforms and EIB (2007) explains how public investment in infrastructure can be designed to maximise the overall economic benefits of such types of intervention. Numerous arguments have been provided by the literature, for example by Stavins (2003) on designing intervention on markets to yield optimal competitiveness benefits from enabling efficient use of natural resources. A DG EMPL note4 discusses how environmental challenges affect the quality and the productivity of labour.
4 INDIC/29/220909/EN Note for EMCO Indicators Group meeting on 22-23 September 2009 ‘Agenda item: Impact of
climate change on employment’
14

European Commission Economic paper no 401
Acemoglu et al. (2009) and Fisher (2008) describe the effects on growth of R&D and innovation dedicated to respond to environmental challenges.
As discussed in Section 3, economic policy would usefully address these four fields, as they are significantly linked to productivity gains and improvements in growth potential.
Step 2: Selecting the most relevant best-available indicators
Step 2.a: Identifying relevant best-available indicators
To evaluate performance in these four fields, this note presents below a non-exhaustive list of relevant indicators justified by the literature findings.
These indicators are presented in two lists:
− Readily available indicators (“list A”) to test the feasibility of extending the LIME assessment framework to discuss “green growth” issues.
− Indicators to consider to consolidate the extension of the LIME assessment framework
(“list B”).
Table 1 below summarises the set of indicators selected; the annex presents in detail the theoretical and empirical justifications behind the choice of these indicators among a long list of available indicators describing the state of the environment and indicators capturing the economic, social and environmental effects of policies addressing environmental challenges. In particular, the annex explains the link to growth these indicators reveal and how the level of these indicators can be affected by s' policy interventions. There is a theoretical difference between performance and policy indicators, the latter being directly influenced by policy interventions. However, an eclectic approach is favoured here as a consensus would be difficult to reach on where to draw the line between the two types of indicators.
15

Towards a Green Growth Assessment Framework
16
Table 1: Summary of areas, domains and relevant best-available indicators
Environmental areas Domains covered Indicators
Trend in GHG emissions
Trend in primary energy consumption Minimising costs
CO2 intensity
Environmental tax revenues in % of GDP
Cost-efficiency of environmental
policies
Creating price signals Share of GHG emissions covered by ETS
Minimising distortions Environmental taxes as % of total taxation
Environmental protection expenditures
Share of EU structural funds to climate change
Share of EU structural funds to energy
Sound use of public finances Maximising benefits of public spending
Loans provided by the EIB to s for energy projects
Electricity produced from renewable energy sources
Share of biofuels Market resilient to external shocks
Diversification of energy source
Implicit tax rates on energy, deflated
Energy markets
Transparent and open markets Market share of largest electricity generator
Energy intensity
Electricity prices: industrial users
Municipal waste generated
Recycling industry: turnover per capita
Degree of penetration of energy-efficient boilers
Market functioning and competitiveness
Markets for products and services
Resource productivity
Population exposure to particulate matter air pollution
Population exposure to air pollution by ozone Protecting health
Hazardous waste
Share of environment related employment in Member States Green human capital
Share of RES employment in total employment
Strength of innovation R&D in production, distribution and rational use of energy
Direction of innovation Innovation effects on material and energy efficiency
Wind energy installed: total capacity
Total Factor Productivity
Green technological
progress Diffusion of innovation gains
Change in CO2 emissions of new passenger cars sold
Step 2.b: Narrowing and consolidating the set of indicators
Following the methodology applied in the LIME assessment framework, a screening procedure is implemented to select a narrow list of indicators. Firstly, an evaluation of minimum statistical standards is performed. Criteria include (i) economic rationale, (ii) comparability and statistical reliability, (iii) time coverage, and (iv) geographical coverage. Secondly, a correlation analysis is used to remove the redundant indicators. Finally, some robustness checks and sensitivity analyses are performed. Table 2 below summarises the results, which are discussed in detailed in the annexes

Table 2: Summary of consolidation of the set of indicators
Confirming the statistical quality of indicators Removing redundant or
unclear indicators Consolidating the set of best available
indicators
Area Ref Indicators Type[1] Economic rationale
Compara-bility
Time coverage
Geog. cover-
age
Statistical correlation/ overlaps?
Narrow List Weights
Member States' scores
affected if
indicator removed
Recommended action:
Replace by/Add
indicator B.xx
I A.1
Trend in GHG emissions (source: Env. Pol. Review) Pressure ++ ++ ++ ++ In 0.17 9 + B.1
I A.2
Trend in primary energy consumption (source: Eurostat) Pressure ++ ++ ++ ++ In 0.17 9 + B.1
I A.3
CO2 intensity (source: Eurostat) Efficiency ++ ++ ++ ++ In 0.17 12 + B.1
I A.4
Environmental tax revenues as % of GDP (source: TAXUD) Response ++ + ++ ++ In 0.25 9
I A.5
Share of GHG emissions covered by ETS (Source: own calculations)
Driving force ++ ++ -- ++ In 0.25 9
II A.6
Environmental taxes as % of total taxation Response ++ ++ ++ ++ In 0.50 7 + B.2

Towards a Green Growth Assessment Framework
Confirming the statistical quality of indicators Removing redundant or
unclear indicators Consolidating the set of best available
indicators
Member States'
Area Ref Indicators Type[1] Economic rationale
Compara-bility
Time coverage
Geog. cover-
age
Statistical correlation/ overlaps?
Narrow List Weights
scores Recommended affected action:
if Replace indicator by/Add removed indicator B.xx
II A.7
Environmental protection expenditures by public sector (source: Eurostat) Response ++ + + -- A.7/A.9 In 0.17 8
II A.8
Share of EU structural funds to climate change (source: DG REGIO) Response ++ + -- ++ A.8/A.9 ½ 0.08 6
II A.9
Share of EU structural funds to energy (source: DG REGIO) Response ++ + -- ++
A.9/A.8; A.9/A.7 1-févr 0.08 6
II A.10
EIB Loans for energy projects (source: EIB) Response + ++ -- ++ In 0.17 6
III A.11
Electricity produced from RES (source: Eurostat) Response + ++ ++ - A.11/A.13 In 0.08 11
III A.12
Share of biofuels (source: Eurostat) Response + + ++ + In 0.08 10
III A.13
Diversification of energy sources (source: own calculations)
Driving force ++ + -- +
A.13/A.11; A.13/A.19; A.13/A.15 In 0.08 8
III A.14
Implicit tax rates on energy, deflated (source: TAXUD) Response ++ + ++ ++
A.14/A.20; A.14/A.16 In 0.13 10 + B.3/B.4
18

European Commission Economic paper no 401
Confirming the statistical quality of indicators Removing redundant or
unclear indicators Consolidating the set of best available
indicators
Member States'
Area Ref Indicators Type[1] Economic rationale
Compara-bility
Time coverage
Geog. cover-
age
Statistical correlation/ overlaps?
Narrow List Weights
scores Recommended affected action:
if Replace indicator by/Add removed indicator B.xx
III A.15
Market share of the largest electricity generator (source: LAF) Efficiency ++ ++ ++ -- A.15/A.13 In 0.13 10 + B.3/B.4
III A.16
Energy intensity (source: Env. Pol. Review) Efficiency ++ ++ ++ ++
A.16/A.14; A.16A.20 In 0.13 11
III A.17
Electricity prices: industrial users (source: LAF)
Driving force ++ - ++ ++ Out 0.00
III A.18
Degree of penetration of energy-efficient boilers (Source: Energy Star Market Penetration Report) Efficiency ++ ++ -- ++ In 0.13 6
III A.19
Municipal waste generated (source: Env. Policy Pressure ++ + ++ ++ A.19/A.13 In 0.13 7
III A.20
Resource productivity (source: Eurostat) Pressure ++ + + -
A.20/A.14; A.20/A.16 Out 0.00
III A.21
Recycling industry: turnover per capita (source: Eurostat) Pressure ++ + ++ - In 0.13 9
A.21 >> B.5/B.6/B/7
19

Towards a Green Growth Assessment Framework
Confirming the statistical quality of indicators Removing redundant or
unclear indicators Consolidating the set of best available
indicators
Member States'
Area Ref Indicators Type[1] Economic rationale
Compara-bility
Time coverage
Geog. cover-
age
Statistical correlation/ overlaps?
Narrow List Weights
scores Recommended affected action:
if Replace indicator by/Add removed indicator B.xx
IV A.22
Urban population exposure to air pollution by PM (source: Eurostat) State + ++ ++ - A.22/A.23 In 0.11 6 + B.8
IV A.23
Urban population exposure to air pollution by ozone(source: Eurostat) State + ++ ++ - A.23/A.22 In 0.11 9 + B.8
IV A.24
Hazardous waste (source: Eurostat) State + ++ + ++ In 0.11 8 + B.8
IV A.25
Share of environmentally-related employment in Member States (source: DG EMPL) Response ++ + -- ++ In 0.17 6
A.25 >> B.9/B.10/B.11
IV A.26
Share of RES employment in total employment (Source: DG EMPL) Response ++ + -- ++ In 0.17 6
A.26 >> B.9/B.10/B.11
IV A.27
R&D In production, distribution, and rational use of energy (source: Eurostat) Response - ++ ++ -- In 0.11 10 A.27 >> B.12
20

European Commission Economic paper no 401
21
Confirming the statistical quality of indicators Removing redundant or
unclear indicators Consolidating the set of best available
indicators
Area Ref Indicators Type[1] Economic rationale
Compara-bility
Time coverage
Geog. cover-
age
Statistical correlation/ overlaps?
Narrow List Weights
Member States' scores
affected if
indicator removed
Recommended action:
Replace by/Add
indicator B.xx
IV A.28
Innovation on material/energy efficiency (source: Eurostat) Response ++ ++ - + In 0.11 10
IV A.29
Wind energy installed: total capacity (source: energy.eu)
Driving force - ++ -- ++ In 0.06 10
IV A.30
Change in CO2 emissions for new passenger cars (source: Env. Pol. Review)
Driving force + ++ ++ - In 0.06 8
1 The typology is based on that used by the European Environment Agency. See EEA (2003) for more details.

Towards a Green Growth Assessment Framework
Step 3: Computing individual scores
Individual scores are determined following the LIME assessment framework methodology. To avoid giving too much weight to outliers, the score for each indicator is capped at three standard deviations. Thus scores range from +30 to -30. A score of 0 implies the indicator in question is the same as the EU27 weighted average, whereas a score of -10 implies the indicator is 1 standard deviation below the EU27 average. The EU average is weighted according to the relative share of each country in the EU's GDP.5
Step 4: Aggregating and interpreting scores
Assessment based on gaps to targets brings to the forefront topics easily measurable by quantitative targets. However, there are some issues difficult to capture by a target, for example the ability of Member States to design climate and energy policies to boost long-term productivity. This is typically the kind of information that an indicator-based assessment framework conveys, which makes it a necessary complement to traditional environmental policy assessment. Hence, we suggest concentrating on aggregate scores that reflect the economic implications of environmental policies and structural reforms.
In this paper, we analyse performance based on four scores revealing the distance to the EU-27 average. That is, for each of the four areas of relevance for “green growth” that we pre-selected for economic analysis, we consider the set of indicators and the score obtained by Member States in relation to the EU average value of this indicator.
For instance, as regards “total costs of environmental policies”, we aggregate the score obtained by each Member State for indicators A.1 to A.5, to identify which Member States are over-performing or under-performing as regards the cost-efficiency of environmental policies. Indicators have been calculated in levels and changes. The analysis is mainly based on the indicators in levels. However, when needed, the analysis of countries' performances can be refined by looking at the indicators in changes, for instance to detect a trend in a country's performance.
Standardised thresholds have been used to determine categories of performance. Any score below – 4 is a priori considered to represent underperformance; any score between +3 and -3 is a priori considered to represent a neutral performance; any score above +4 is a priori considered to represent over-performance. These thresholds have been chosen because, assuming a normal distribution of results, one third of outcomes should be found in each of the categories.
Step 5: Interpreting performance
Figure 6 below summarises the approach and how qualified conclusions can be drawn based on aggregate indicator-based results.
5 Note that if so far, we have concentrated on determining scores with respect to the EU27 average, scores could also
be determined vis-à-vis other reference points, such as, for instance, the US or Japan. An effort would then have to be made to include similar indicators in the assessment framework.
European Commission Economic paper no 401
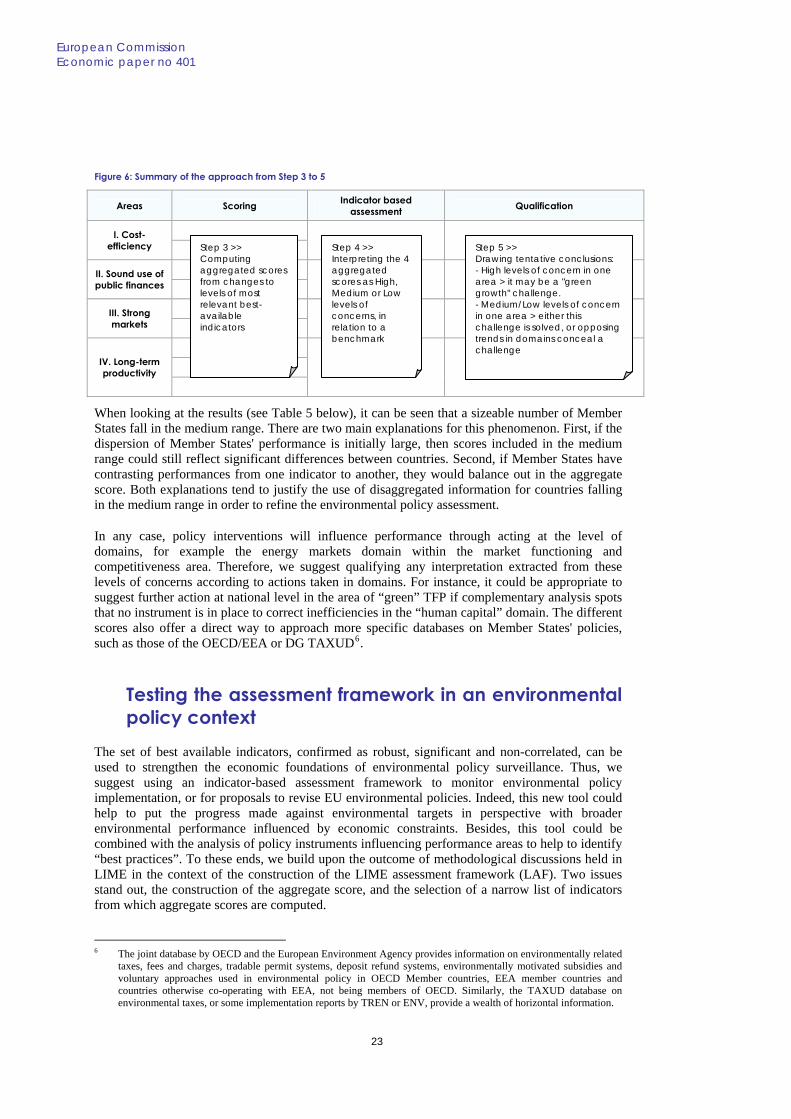
Figure 6: Summary of the approach from Step 3 to 5
Areas Scoring Indicator based assessment Qualification
I. Cost-efficiency
II. Sound use of public finances
III. Strong markets
IV. Long-term productivity
Step 3 >> Computing aggregated scores from changes to levels of most relevant best-available indicators
Step 4 >> Interpreting the 4 aggregated scores as High, Medium or Low levels of concerns, in relation to a benchmark
Step 5 >> Drawing tentative conclusions: - High levels of concern in one area > it may be a "green growth" challenge. - Medium/Low levels of concern in one area > either this challenge is solved, or opposing trends in domains conceal a challenge
When looking at the results (see Table 5 below), it can be seen that a sizeable number of Member States fall in the medium range. There are two main explanations for this phenomenon. First, if the dispersion of Member States' performance is initially large, then scores included in the medium range could still reflect significant differences between countries. Second, if Member States have contrasting performances from one indicator to another, they would balance out in the aggregate score. Both explanations tend to justify the use of disaggregated information for countries falling in the medium range in order to refine the environmental policy assessment.
In any case, policy interventions will influence performance through acting at the level of domains, for example the energy markets domain within the market functioning and competitiveness area. Therefore, we suggest qualifying any interpretation extracted from these levels of concerns according to actions taken in domains. For instance, it could be appropriate to suggest further action at national level in the area of “green” TFP if complementary analysis spots that no instrument is in place to correct inefficiencies in the “human capital” domain. The different scores also offer a direct way to approach more specific databases on Member States' policies, such as those of the OECD/EEA or DG TAXUD6.
Testing the assessment framework in an environmental policy context
The set of best available indicators, confirmed as robust, significant and non-correlated, can be used to strengthen the economic foundations of environmental policy surveillance. Thus, we suggest using an indicator-based assessment framework to monitor environmental policy implementation, or for proposals to revise EU environmental policies. Indeed, this new tool could help to put the progress made against environmental targets in perspective with broader environmental performance influenced by economic constraints. Besides, this tool could be combined with the analysis of policy instruments influencing performance areas to help to identify “best practices”. To these ends, we build upon the outcome of methodological discussions held in LIME in the context of the construction of the LIME assessment framework (LAF). Two issues stand out, the construction of the aggregate score, and the selection of a narrow list of indicators from which aggregate scores are computed.
6 The joint database by OECD and the European Environment Agency provides information on environmentally related
taxes, fees and charges, tradable permit systems, deposit refund systems, environmentally motivated subsidies and voluntary approaches used in environmental policy in OECD Member countries, EEA member countries and countries otherwise co-operating with EEA, not being members of OECD. Similarly, the TAXUD database on environmental taxes, or some implementation reports by TREN or ENV, provide a wealth of horizontal information.
23
Towards a Green Growth Assessment Framework
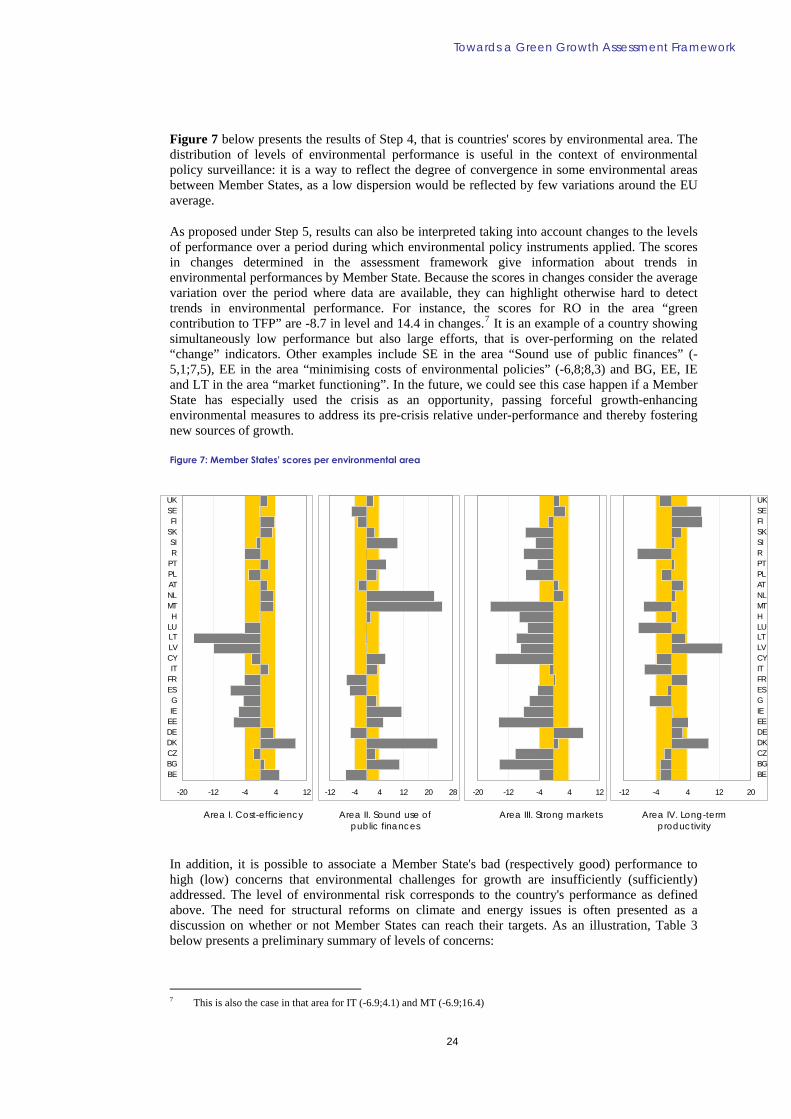
Figure 7 below presents the results of Step 4, that is countries' scores by environmental area. The distribution of levels of environmental performance is useful in the context of environmental policy surveillance: it is a way to reflect the degree of convergence in some environmental areas between Member States, as a low dispersion would be reflected by few variations around the EU average.
As proposed under Step 5, results can also be interpreted taking into account changes to the levels of performance over a period during which environmental policy instruments applied. The scores in changes determined in the assessment framework give information about trends in environmental performances by Member State. Because the scores in changes consider the average variation over the period where data are available, they can highlight otherwise hard to detect trends in environmental performance. For instance, the scores for RO in the area “green contribution to TFP” are -8.7 in level and 14.4 in changes.7 It is an example of a country showing simultaneously low performance but also large efforts, that is over-performing on the related “change” indicators. Other examples include SE in the area “Sound use of public finances” (-5,1;7,5), EE in the area “minimising costs of environmental policies” (-6,8;8,3) and BG, EE, IE and LT in the area “market functioning”. In the future, we could see this case happen if a Member State has especially used the crisis as an opportunity, passing forceful growth-enhancing environmental measures to address its pre-crisis relative under-performance and thereby fostering new sources of growth.
Figure 7: Member States' scores per environmental area
-20 -12 -4 4 12
BEBGCZDKDEEEIEG
ESFRIT
CYLVLTLUH
MTNLATPLPTRSI
SKFI
SEUK
-12 -4 4 12 20 28 -20 -12 -4 4 12 -12 -4 4 12 20
BEBGCZDKDEEEIEGESFRITCYLVLTLUHMTNLATPLPTRSISKFISEUK
Area II. Sound use of public finances
Area III. Strong markets Area IV. Long-term productivity
Area I. Cost-efficiency
In addition, it is possible to associate a Member State's bad (respectively good) performance to high (low) concerns that environmental challenges for growth are insufficiently (sufficiently) addressed. The level of environmental risk corresponds to the country's performance as defined above. The need for structural reforms on climate and energy issues is often presented as a discussion on whether or not Member States can reach their targets. As an illustration, Table 3 below presents a preliminary summary of levels of concerns:
7 This is also the case in that area for IT (-6.9;4.1) and MT (-6.9;16.4)
24

European Commission Economic paper no 401
Table 3: Levels of green concerns by environmental area
Level of “green” concerns (based on indicators in levels)
Low Medium High
Cost-efficiency BE, DK, BG, CZ, DE, IT, CY, LU, HU, MT, NL, AT, PL, PT, RO, SI, SK, FI, SE, UK,
EE, IE, GR, ES, FR, LV, LT,
Sound use of public finances
BG, DK, EE, IE, CY, MT, NL, PT, SI,
CZ, GR, IT, LV, LT, LU, HU, AT, PL, RO, SK, FI, UK, BE, DE, ES, FR, SE,
Better market functioning and competitiveness DE, BE, DK, FR, IT, NL, AT, FI, SE,
UK
BG, CZ, EE, IE, GR, ES, CY, LV, LT, LU, HU, MT, PL, PT, RO, SI, SK
Long-term productivity DK, EE, LV, FI, SE, BE, BG, CZ, DE, IE, ES, FR, CY, LT, HU, NL, AT, PL, PT, SI, SK, UK,
GR, IT, LU, MT, RO,
As shown in previous sections, the method used to build the indicator-based assessment framework is robust. Hence, these levels of concerns allow a screening of Member States and could provide information on their performance, without necessarily requiring a reference to individual indicators.
A preliminary interpretation of the results in Table 3 first shows common patterns of concerns in different national situations: there is a cluster of Member States in the medium range performance for the “cost-efficiency” area. A tentative explanation could be that the internal market ensures no large discrepancy in Member States' performance. The degree of convergence between Member States in this environmental area would in this case be reflected by few countries outside the medium level of green concern. This shows how an indicator-based assessment framework gives additional evidence to identify the need for further co-ordination or better targeted policy intervention at EU level. For instance, there is also a cluster of concerns about strong market functioning or long-term productivity (especially in relation to a limited spread of good performance in the energy markets and the innovation domains), whereas there is overall a lesser level of concerns about the use of cost-efficient environmental policy instruments. It could indicate that there is a strong economic case for promoting better environmental regulation especially to develop a stronger internal market and foster long-term productivity.
On the other hand, Figure 7 draws the attention to some country-specific evidence worth further analysis. For instance, DK presents low green concerns as regards minimising climate and energy costs, the use of public finances for environmental purposes and the green contribution to long-term productivity. Results are more nuanced as regards market functioning, where DK's performance falls in the middle range. Then it may be worthwhile investigating performance within each of these areas, at the more disaggregated level of domains covered by the tool. For instance, it would be relevant to examine further the consequences for DK of experiencing a relative under-performance in the “markets for goods and services” domain, balanced by an over-performance as regards the “energy markets” domain. This example highlights the importance of the intermediate level of environmental performance and confirms that country-specific analysis must be performed at an intermediate (semi-aggregated) level. In many cases, Member States show different levels of performance depending on the environmental area considered. For instance, BE over-performs as regards minimising climate and energy costs and price risks, but under-performs as regards the use of public finances. A global indicator would conceal these differences, whereas individual indicators focusing on targets would make economic analysis and interpretation more difficult.
25
Towards a Green Growth Assessment Framework
3 TENTATIVE EXPLORATION OF POSSIBLE LINKS BETWEEN ENVIRONMENTAL AND MACRO-ECONOMIC CHALLENGES
Introduction Identifying relevant macro-economic dimensions
Mixing the environmental and macro-economic approaches is a way to improve the quality of economic analysis by highlighting previously undetected under/over performances by Member States. The LIME indicator-based assessment framework extended to “green growth” and structural reforms issues allows discussing in combination the macro-economic and environmental performance of a Member State, and whether the same level of concerns is observed in both areas.
We focus on a short-list of country-specific macro-economic challenges. We consider the growth components (as defined by the indicator-based assessment framework currently used for Lisbon strategy monitoring) that have the potential to influence and/or to be influenced by Member States' performance in the environmental areas identified above. The main advantage of using the current assessment approach is that the methodology is the same, and so results are easily comparable.
The analysis proceeds by identifying in parallel what constitutes Low / Medium / High levels of concerns in terms of macro-economic performance and to address “green growth” challenges. Findings from this trial assessment of performance remain very tentative and should be grounded further by solid macro-economic analysis.
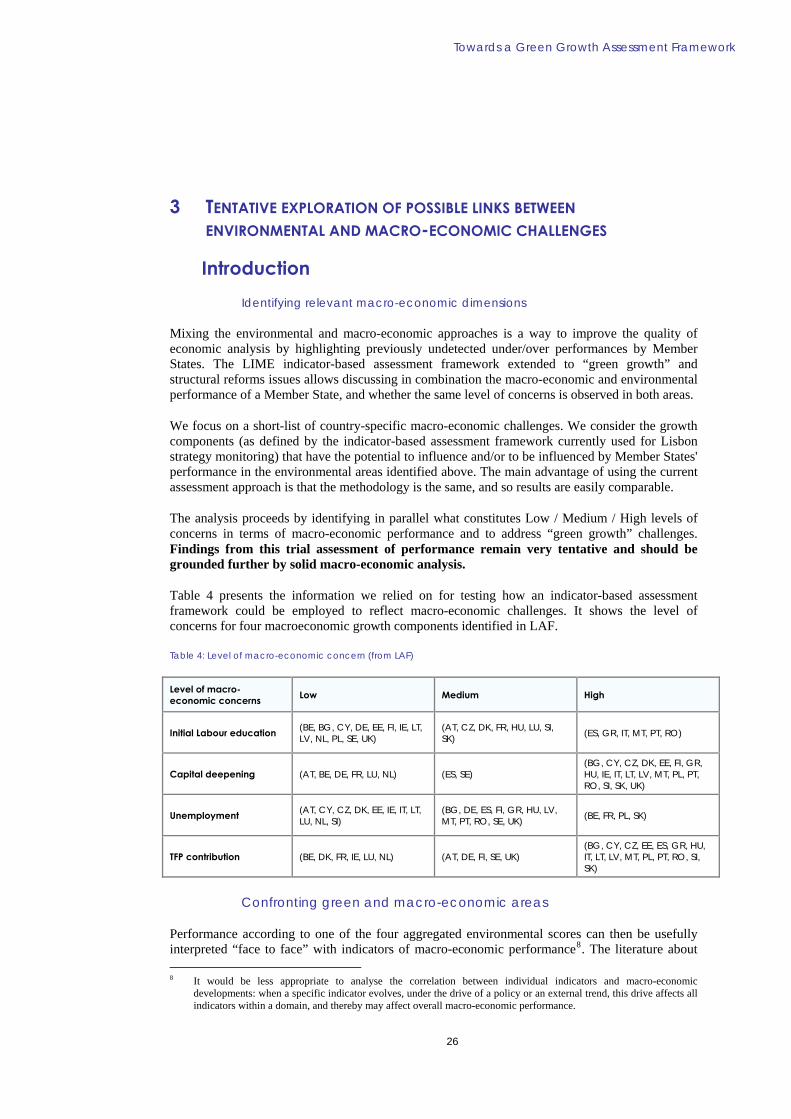
Table 4 presents the information we relied on for testing how an indicator-based assessment framework could be employed to reflect macro-economic challenges. It shows the level of concerns for four macroeconomic growth components identified in LAF.
Table 4: Level of macro-economic concern (from LAF)
Level of macro-economic concerns Low Medium High
Initial Labour education (BE, BG, CY, DE, EE, FI, IE, LT, LV, NL, PL, SE, UK)
(AT, CZ, DK, FR, HU, LU, SI, SK) (ES, GR, IT, MT, PT, RO)
Capital deepening (AT, BE, DE, FR, LU, NL) (ES, SE) (BG, CY, CZ, DK, EE, FI, GR, HU, IE, IT, LT, LV, MT, PL, PT, RO, SI, SK, UK)
Unemployment (AT, CY, CZ, DK, EE, IE, IT, LT, LU, NL, SI)
(BG, DE, ES, FI, GR, HU, LV, MT, PT, RO, SE, UK) (BE, FR, PL, SK)
TFP contribution (BE, DK, FR, IE, LU, NL) (AT, DE, FI, SE, UK) (BG, CY, CZ, EE, ES, GR, HU, IT, LT, LV, MT, PL, PT, RO, SI, SK)
Confronting green and macro-economic areas
Performance according to one of the four aggregated environmental scores can then be usefully interpreted “face to face” with indicators of macro-economic performance8. The literature about 8 It would be less appropriate to analyse the correlation between individual indicators and macro-economic
developments: when a specific indicator evolves, under the drive of a policy or an external trend, this drive affects all indicators within a domain, and thereby may affect overall macro-economic performance.
26

European Commission Economic paper no 401
the causal relationship between environmental improvements and growth is controversial. Yet, it is not disputed that there are effects of environmental policies channelled to growth, for instance along the following links:
- Designing and applying cost-efficient environmental policies contributes to mitigating the negative impacts on growth from long-term rising real energy prices and climate change damages. The risk premium to cover volatility in energy and critical raw material prices and exposure to large-scale climate-related disruptive events is not negligible for economic agents. Climate and energy challenges enter into the composition of current and expected price levels. Opportunity costs to mitigate or adapt to climate change, expected benefits from reduced exposure to climate and energy risks intervene in decisions to allocate disposable income for equipment/construction investment and for savings9. Thereby, environmental policy has effects on long-term GDP levels, aggregate levels of consumption, imports and savings rates.
- A sound use of public finances guarantees that budgetary resources are allocated to expenditures providing environmental public goods to the right extent compared to other needs. It also ensures that environmental taxes and charges are collected in a least distortive way, enabling an efficient allocation of production factors and of time between labour/leisure. Public support must also be targeted to maximise the leverage of public funding. Environmental policy thereby has an effect on aggregate levels of labour income, total labour costs and production costs, household and government consumption as well as capacity utilisation.
- Better functioning markets will employ energy-related, labour and capital inputs more efficiently within sectors, and will re-allocate resources more efficiently across activities, maximising total value added. Environmental regulations influence industrial production levels and employment prospects. Activity enabled or encouraged by environmental policies may contribute to the overall balance of trade, and to increasing domestic demand and investment. Better adjustment of the workforce to the demand for “green” goods and services may contribute to lowering structural unemployment.
- Public interventions to improve the human capital and knowledge stock will counteract private under-allocation of labour and capital to R&D and innovation due to market failures. Directing R&D and innovation activity towards green technologies, for example lowering barriers to the diffusion of eco-innovation, may encourage capital formation, lead to capital deepening and to higher labour productivity, while creating future export potential.
Overall, the literature has discussed constraints or opportunities for growth from improving environmental quality and these interactions are shown as shaded areas in Table 5 below. As climate and energy issues are only one aspect influencing macroeconomic variables, the link between the two aspects will sometimes be weak, which does not prevent it from being significant. We attributed a lighter shade when the literature is less consensual, if there is less strength in the interactions, and/or if the link diffuses across a subset of economic sectors instead of the whole economy.
9 Smulders (2009) explains how the optimum level of environmental protection is modified by a crisis: a demand-
induced recession reduces the productivity of inputs, so that the opportunity cost of reducing pollution is lower, and yields a lower return to alternative investment (for example private capital and stock market), so that the net present value of future environmental benefits may appear higher.
27

Towards a Green Growth Assessment Framework
Table 5: Potential interactions between green and macro-economic performances
Green growth accounting
Unemployment Capital Deepening TFP Initial education of labour
I. Cost efficient “green” policies
Change in relative prices could affect competitiveness and thereby indirectly labour utilisation
Change in opportunity costs, modifying savings and investments
Change in relative prices, valuation of environmental benefits, modifying savings, investments and thus long-term growth
Environmental tax reform may increase expected benefits from new skills, thus encouraging human capital accumulation, but the existence of this interaction depends on the design of the environmental policy
II. Sound use of public finances for environmental purposes
Temporary effect absorbing idle labour resources, but further policies needed to reduce structural unemployment
Sound use of public finance minimise crowding out and in contrast leverage private investment
Taxes and revenues aiming to provide environmental public goods at the socially optimal level may direct public-private investment where it can boost productivity (cf. earmarking cohesion support to Lisbon strategy priorities)
Public finances could have an impact on education decisions, but it is unlikely to be specific to the "green growth" context
III. "green" regulation for strong markets
Better functioning of energy-related markets will improve resource allocation along entire value chains if they constituted the "weakest link", otherwise other inefficiencies limit improvements
Competitive and frictionless markets to access energy inputs and to energy-using goods/services facilitate investment, as (KL) bundle and capital accumulation may substitute energy inputs in all sectors
Better regulation matters especially in energy-related markets with long-lived capital, as it lets new entrants in (benefitting from innovation benefits) and avoids lock-in (enables shift to more productive new vintages of capital where economically relevant)
Better regulation and labour quality are necessary to facilitate the transition to greener growth, but direct interactions are likely to be weak.
IV. "Green" support to long term productivity
New preferences or demand for new environmentally-benign goods and services translate into demand for new skills and jobs, with possible multiplier effects in other sectors; net employment effects relate to environmental inputs being substitutes or complements to other products
Technological change driven by the need to take environmental damages into account has knowledge spill-over effects that all sectors may capture
Directed technical change creates new varieties of "clean" goods complementing or substituting "dirty" goods, however "picking winners" policy may risk constraining autonomous technical change, and may crowd out the use of high-skilled labour for other R&D
New environmental goods and services translate into demand for new skills and jobs, with impacts on the stock and composition of human capital. Only well-targeted policies will translate green support to TFP into a change in the average productivity per person employed
We suggest that the subsequent analysis of country-specific performances would proceed only where literature gives evidence of possible interactions between environmental quality and economic performance drivers. Country-specific analysis would then consist of finding out why correlations between environmental and economic concerns have occurred. Nonetheless, conversely, if the tool brings to light relationships between environmental and economic aspects for a number of Member States where a priori we noticed no strong link, it will be necessary to go
28

European Commission Economic paper no 401
back to the literature or to deepen the empirical analysis of inter-linkages between challenges that matter for “green growth”10.
Testing the assessment framework on structural reforms
Grouping countries by macroeconomic challenges to assess environmental policies
The first advantage of bringing macro-economic and green growth concerns face to face is that it allows a more nuanced assessment of Member States' environmental performance. For instance, Figure 8 to Figure 10 regroup Member States' environmental performance according to the level of concerns related to the growth component “unemployment”. This helps to identify country-specific green growth challenges within a group of countries with otherwise similar macroeconomic characteristics. When interactions between green and macroeconomic performances have been identified, it makes sense to qualify the opinion on a country's performance based on the macro-economic constraints that the country is currently facing.
As an illustration, in the category “low unemployment concern” NL seems to over-perform compared with other countries in the same macro-economic situation. The latter Member States could then possibly benefit from an exchange of potential “best practices” implemented in the NL context. From another perspective, it is also relevant to refine the analysis for countries with similar environmental characteristics but different macro-economic constraints. For instance, the environmental performance of HU and CZ, relatively similar in absolute terms, may be appreciated differently when looking at the macro-economic conditions in each country and the relative more tense unemployment situation in HU.
Finding common occurrences of over/underperformance along key macro-economic dimensions and “green growth” issues
Common occurrences of over/underperformance along key macro-economic variables and along “green growth” issues help select fields where a deeper macro-economic analysis of “green growth” issues is needed and where it is necessary to find out more about macro-economic and environmental spill-over effects of policies, both in the realm of environmental policy and economic surveillance. Common occurrences are only considered in the areas where interactions between environmental and macroeconomic areas have been identified (see Table 5). The exploratory analysis encourages developing further the foundations of the approach as the test-run confirms it is worth looking further at specific combinations of concerns. Indeed, some combinations of “green growth” and macro-economic concerns appeared more telling than others, namely [Low “green”, Low “macro”], [High “green”, High “macro”], [Medium “green”, High “macro”], [High “green”, Medium “macro”] and [High “green”, Low “macro”], for the following reasons:
- The test run provides an analysis of the group of Member States where the results of the dual screening are [Low macro-economic concerns; Low “Green growth” concerns]. Indeed, this common occurrence might signal that a Member State has established a genuinely “growth enhancing” environmental policy, or has managed to address growth underperformance without losing sight of its environmental commitments. A number of these positive spill-over effects across the economic and environmental policy realms may not have been captured under the current environmental policy analysis and core macro-economic surveillance.
10 As a complement to this, future work is also needed to treat environment (natural capital and/or pollution stock) as an
input entering the production function, in order to analyse/quantify the effects of improvement of natural resource productivity and the state of the environment on growth. This would also be a way to measure the "flexibility" of the economy to make a transition to a low carbon economy, for example by looking at the elasticities of substitution across sectors. Economic modelling, such as computable general equilibrium models, could be used in this context.
29

Towards a Green Growth Assessment Framework
- The test run reveals diverging general macro-economic performance and performance in addressing “green growth” issues. The next step would be to analyse better spill-over effects between growth components where there is this divergence of performance. Moreover, it would be useful to deepen the analysis because some Member States may want to use the opportunities created by macro-economic over-performance to improve their environmental performance. These opportunities are likely to be overlooked under current environmental policy analysis.
- The test run reveals that concerns about productivity drivers of growth (capital deepening and TFP) tend to occur together with sub-optimal environmental policies for a significant number of Member States. Together with literature evidence, this reinforces the case to push for better functioning “green markets”, to support “green” TFP drivers and to develop further the use of cost-efficient environmental instruments.
- The test run highlights situations where there is a risk to evolve from [Medium macro-economic concerns; High “green” concerns] to [High macro-economic concerns; High “green” concerns]. This risk is likely to be overlooked under current environmental policy analysis as well as under current macro-economic policy monitoring. This risk is likely to be the highest where strong correlation is expected between environmental and macro-economic performance.
Analysing country-specific relations between macro-economic and environmental concerns
At this exploratory phase, correlation between across-the-board high macro-economic and environmental concerns, for example for ES, IE, LT, LV, EE, encourages looking more closely into issues such as costly environmental policies, high structural unemployment and labour market rigidities, barriers to competition and an insufficient internal energy market, and the long-term productivity base. Correlation between high macro-economic concerns for specific issues and high environmental concerns, for example for BE, ES, FR, would need to be taken into account to analyse the spill-over effects in these Member States of possible new carbon taxes. Correlation between high green concerns and so far limited macro-economic concerns for SE, DK and DE could indicate scope for replicating promising practices.
Beyond this exploratory stage, deriving country-specific findings requires putting together in-depth understanding of national economies with information about environmental policies. The test run serves just as examples of correlations identified for further joint economic and environmental analysis for some Member States.
- For FR, the indicator-based assessment seems to suggest that the breathing space due to relatively sound macroeconomic performance is not necessarily used to promote cost-efficient environmental policy as well as a sound use of public finances for environmental purposes. The risk is that inadequate environmental reforms would then spill over to insufficient macroeconomic performance.
- For PL, the tool reinforces concerns that productivity drivers of growth (capital deepening and TFP) could negatively affect environmental performance. This reinforces the case to push for better “green” market functioning, to support “green” TFP drivers and to develop further the use of cost-efficient environmental instruments. This can improve environmental performance as well as offering new channels to improve the overall macroeconomic performance.
- For the UK, the preliminary analysis seems to suggest that the important fiscal stimulus could have been made even greener11 to improve a somewhat medium-range
11 As already suggested in the preliminary assessment of national recovery measures in support of investment: The EU's
response to support the real economy during the economic crisis: an overview of Member States' recovery measures. European Economy Occasional Paper n°51, July 2009.
30

European Commission Economic paper no 401
environmental performance. Improved environmental performance could then spill over to other macro-economic variables, such as capital deepening.
31

Towards a Green Growth Assessment Framework
4 ANNEXES
Details of Step 2.a: Collecting and selecting relevant indicators
Indicators about the state of the environment or the economic, environmental and social impacts of policies addressing environmental challenges are numerous. Among such indicators with which we were familiar we selected the indicators below, where the literature confirms their relevance for our purposes. So far, we left out other available indicators when their coverage was less good or their relationship to green growth determinants was less straightforward, as explained in detail in Table 14 below.
1. Tracking reliance on cost-efficient environmental policies
This first area considers Member States' performance in reducing climate change and energy externalities in a cost efficient way. It is subdivided into two domains: first, to measure how much countries are anticipating structural changes in their economy and, second, whether countries have the opportunity to use market-based instruments for environmental policy-making.
1.1. Minimising costs
In choosing the following indicators, the objective is to consider low cost potential first, acknowledging mitigation costs and the necessary adaptation to more stringent policies in the future. In other words, it is the ability of a country to shift towards a low-carbon economy that is considered here. Consequently, the following readily available indicators have been used to test the approach:
A.(1) Trend in GHG emissions (% change compared to a three-year moving average)
This focuses on Member States' actual reductions of GHG emissions from one year to another. It shows the intensity of Member States' efforts to make a structural shift to a low carbon sustainable economy and the extent to which the country can take on stricter commitments at reasonable cost. A 3-year moving average of GHG emissions is considered a better proxy to measure Member States' efforts to make structural change than the percentage change compared to a base year. A potential limitation of this approach is that it does not account of the use of possibilities such as the Clean Development Mechanism. This should be included in a future version of this work.
A.(2) Mtoe saved in yearly primary energy consumption compared to total primary energy consumption This indicator is a good proxy to measure progress towards energy efficiency. Energy efficiency is seen as a low cost option for GHG reduction (Smulders and de Nooij, 2003). Countries reducing their primary energy consumption would increase their environmental performance. The speed in reducing the level of this indicator also indicates efforts beyond BAU.
A.(3) CO2 intensity (tons of CO2/GDP) This indicator can be decomposed into two sub-indicators: CO2/toe*toe/GDP. The second indicator measures the energy intensity of the economy and the first one the reliance on fossil fuels. Considering a global indicator allows focusing on the structure of the economy as a whole to reflect on the degree of specialisation in sectors with high carbon
32

European Commission Economic paper no 401
content. This will eventually determine the magnitude of mitigation and adjustment costs (Alcantara and Padilla, 2009).
Further data are needed to refine and complement this analysis, such as:
B.(1) Share of value of capital and human assets exposed and vulnerable to climate change damage that is insured.
Countries need to be prepared to face adaptation costs, as a consequence of climate change damages. A good proxy of countries' readiness to face those changes is to look at how capital and human assets are being insured against these new risks.
1.2. Creating price signals internalising externalities
Environmental regulations impose constraints on the production possibilities set and are therefore potentially harmful to economic growth. Economists tend to favour environmental policies that achieve their objective at the lowest possible cost. In that context, the “Green Paper on market-based instruments for environment and related policy purposes” underlines that the EU has increasingly favoured economic or market-based instruments (“MBI”) – such as indirect taxation, targeted subsidies or tradable emission rights – for such policy purposes because they provide a flexible and cost-effective means of reaching given policy objectives.
A.(4) Environmental tax revenues in % of GDP This indicator provides a good estimate of the strength of the price signal to internalise externalities in the economy. It can be complemented by the next indicator.
A.(5) Share of country emissions in the scope of the Emissions Trading Scheme This indicator is specifically dedicated to measure the weight of the sectors in the economy covered by the EU Emissions Trading Scheme. The fact that by 2027, 100% of EU allowances will be auctioned reinforces the dynamic efficiency of the ETS and thereby the cost-efficiency of environmental regulation12.
2. Tracking sound use of public finances
The purpose of comparing performance in this area is to test if the national fiscal and financial frameworks are being made consistent with and supportive of climate and energy objectives. It is broken down into two domains.
2.1. Minimising distortions
This domain considers whether Member States' response to the climate and energy challenge minimises the budgetary burden and maximises the economic benefits of the use of fiscal resources. These indicators are especially relevant in the current context, where exit strategies should be implemented while avoiding deteriorating fiscal imbalances.
A.(6) Environmental taxes as % of total taxation
12 When using tradable permits, a liquid secondary market can allow for an efficient outcome irrespective of the initial
allocation of allowances, but scarcity rents linked to the initial allocation weaken incentives to search for dynamic efficiency. In fact, innovation reduces abatement costs but innovation also reduces scarcity rents by lowering permit prices. Hence, concerns that the number of allowances received in future will be related to current levels of emissions may discourage firms from undertaking some abatement
33
Towards a Green Growth Assessment Framework
To measure the influence of the policy intervention in this domain, this indicator is related to the promotion of efficient environmental tax reforms. An environmental tax reform (ETR) shifting the tax burden from welfare-negative taxes, (for example on labour), to welfare-positive taxes, (for example on environmentally damaging activities, such as resource use or pollution) can be a win-win option to address both environmental and employment issues by reducing distortions and deadweight losses in the overall tax system. Note that a clear interaction exists with labour taxation in case green taxes are used to reduce labour taxation.
In September 2009, the Council invited the Commission to present, as a matter of urgency, a roadmap for the reform, sector by sector, of subsidies that have considerable negative effects on the environment and are incompatible with sustainable development, with a view to gradually eliminating them, as called for in the renewed Sustainable Development Strategy. In this regard, subsidy removal would free up budgetary resources that could be used, in turn, to target more directly the social objectives that might have been supported via the subsidies. In the medium run, the following indicator would be needed. Some robust quantification of this indicator is currently being tested by SE.
B.(2) Volume of subsidies having considerable negative impacts on the environment and being incompatible with sustainable development
2.2. Maximising benefits of public spending
A good proxy of Member States' performance in shifting to Sustainable Consumption and Production would be to consider the share of Green Public Procurement in total public procurement, as GPP opens the way for better levels of public services with fewer natural resources. Under the SCP Action Plan, Member States are recommended to ensure that public authorities do not purchase products below the highest level of environmental performance which ensures an adequate level of competition and guarantees that the burden on public finances is not higher than under current procurement rules. So far, data exist only for 7 Member States. Until 2010 when full datasets will become available, we suggest the following indicator as a proxy of governmental intervention in the environmental sector:
A.(7) Environmental protection expenditures by the public sector, as a % of GDP The development of environmental protection expenditures by public sector contributes to the optimal provision of public goods. This indicator includes payments to keep environmental departments running, staff costs and other costs for managing environmental public goods. This indicator may be subject to some instability as environmental protection expenditures tend to vary closely with environmental commitments. However, this is probably less the case for the public sector than the private sector.
To refine the argument, the volume of environmental expenditures would have to be related to the initial state of the environment. If it is already much degraded, a lot of expenditures have to be mobilised to reverse unsustainable trends. Furthermore, this indicator does not include local level environmental protection expenditures, whereas local taxes and subsidies have an important role to create incentives and “get prices right”.
The minimal distortions / maximal added value (for example directing public revenues to provide public goods at the optimal level) should also be tested when Member States use new sources of income or commit some of their budget to global climate change mitigation. Soon, Member States will have to decide how to use ETS auctioning revenues and how to contribute to global climate change mitigation. How auctioning revenues are used, or how much a country decides to contribute to this global financial effort should refine the analysis of Member States' performance as regards financing public goods at the right level.
34

European Commission Economic paper no 401
Government intervention can also take a different form. One of the objectives can be to ensure a steady flow of credit to the economy undertaking the low carbon transition, especially helping to cover the particular risks of decarbonising investments. Two readily available indicators can be used to test government intervention in this domain:
A.(8) Share of EU structural funds targeted to support Climate Change objectives A.(9) Share of EU structural funds targeted to support Energy objectives These two indicators enable the share of structural funds that is dedicated to climate change mitigation and energy policies to be identified. Besides, part of this support is also contributing to Lisbon objectives, like providing favourable conditions and appropriate access to finance for SMEs13. This is also linked with the initial LIME assessment framework policy area: “competition policy framework”.
More indicators would be needed to estimate the volume of public support in the form of participation in private equity, venture capital investment or risk sharing facilities. High participation levels would be a way to maximise the leverage of public funding for these activities. This domain is also related to the policy area of the original LIME assessment framework: “financial market and access to finance”. For now, a good proxy is the European Investment Bank's (EIB) contribution to Member States for climate and energy.
A.(10) Loans provided by the EIB to Member States for energy projects of EU interest
3. Tracking efforts to improve market functioning and foster competitiveness
The objective is here to look at progress made to improve the functioning of markets, and to reduce price and tax distortions in order to enable an optimal allocation of resources. This also requires considering smooth market functioning. Action in this area helps to deliver energy security and resource decoupling goals; it consists of intervening in two domains: developing competitive and dynamic energy markets, and enabling product and service markets to reap resource efficiency benefits.
3.1. Building competitive and dynamic energy markets
EU energy policy is driven by three objectives: achieving a sustainable energy system, improving energy security and maintaining the international competitiveness of the EU, with respect to both energy prices and investment in energy technology and infrastructure. Achieving the first two objectives will improve market resilience to external shocks. The last one presupposes transparent and open energy markets.
Measuring market resilience to external shocks
The objective is to measure to what extent Member States' energy markets can be resilient to external shocks. This requires maintaining energy security, notably ensured by a diversified energy mix.
A.(11) Electricity produced from renewable energy sources (% gross electricity consumption)
13 Guideline 11 recommends "paying particular attention to SMEs". Indicators concerning specifically SMEs are not
available. This indicator is a proxy to measure progress made by Member States to reinforce SMEs' competitiveness while implementing GHG emissions mitigation or energy policies.
35

Towards a Green Growth Assessment Framework
This first indicator offers, to some extent, a good proxy of the level of competition in electricity generation and in energy transmission activities, and of the degree of openness to new entrants.
A.(12) Share of biofuels in fuel consumption of transport The share of biofuels in fuel consumption could reinforce energy security: it diversifies energy sources and thus reduces exposure to oil price volatility and the related costs to cover this risk. In addition, part of the literature estimates that this sector could have a potentially high direct impact on employment in some sectors (net impact on job creation is unclear…)14. We see two caveats in the choice of this indicator that would have to be addressed. First, it is an indicator of consumption, and not of production. Second, it would make more sense to follow data on the share of renewable fuels and not only on biofuels.
A.(13) Diversification of energy sources This indicator measures how diversified energy sources are in gross inland consumption of energy. This index, computed as a Herfindahl index15, indicates how concentrated energy consumption is. The lower the index, the more diversified energy sources are. For the time being, this indicator is only available for one year. Moreover, more sophisticated indicators have been developed in the literature that could offer in the near future a better proxy of diversification in energy sources (see for instance Le Coq and Paltseva (2009))
Transparent and open energy markets16:
Smooth market functioning, especially for energy, is a necessary condition to maintain competition and ensure the presence of new entrants. It is also a way to promote technology changes that allow a low carbon economy to develop.
A.(14) Implicit tax rates on energy, deflated This indicator is an appropriate measure of the policy stance in terms of energy taxation. Properly defined, it is not affected by the erosion in the base due to the disincentive effect of the tax. Note that the implicit tax rate on energy treats all kinds of energy consumption equally, regardless of their environmental impact, and paradoxically, a country with a large share of renewable energy will have a lower implicit tax rate on energy.
A.(15) Market share of the largest generator in the electricity market (as % of total generation) Effective competition in the electricity market will be reflected by a low market share for the largest generator.
In the future, the following indicators would be needed:
B.(3) Turnover from energy services activities This indicator would reflect the state of diversification of activities in the energy sector and would capture to what extent energy efficiency has been turned into profitable businesses.
B.(4) Volume of sustainable energy investments (private equity, venture capital, debt based)
14 See for instance JRC (2008) or Neuwahl et al. (2008)
15 Used in industrial organisation, the Herfindahl index is a measure of the size of firms in relation to the industry and an indicator of the amount of competition among them. It is defined as the sum of the squares of the markets shares of the 50 largest firms (or summed over all the firms if there are fewer than 50) within the industry, where the market shares are expressed as fractions.
16 Note that the "energy market" domain is interesting for green growth purposes as well as energy security objectives.
36

European Commission Economic paper no 401
This indicator may be built based on data provided by the Sustainable Energy Finance Initiative (SEFI). The objective with this indicator would be to measure access to finance of a sector that is highly capital-intensive and is associated with risks that are difficult to handle.
3.2. Reinforcing markets for products and services through eco-efficiency
This sub-section broadens the scope of market functioning and competition by considering sectors using energy as an input, as well as the more specific environmental goods and services sector. The objective is to measure the efficiency of consumption of energy and resources and some structural change, for example substitution towards low carbon activities.
A.(16) Energy intensity (toe/GDP)
This first indicator is a measure of a country's energy efficiency. High energy intensities indicate a high cost of converting energy into GDP. In addition, the U.S. Department of Energy's Office of Energy Efficiency and Renewable Energy (EERE) analysed the macroeconomic impacts of programs designed to increase the energy efficiency of the U.S. residential and commercial building stock. They expect positive impacts on employment, wage income and net capital savings available to increase growth17.
A.(17) Electricity prices: industrial users This indicator is used as a proxy for energy-related costs in for industries' budgets. This will determine production choices and therefore will influence any attempt to improve sustainable production patterns.
A.(18) Degree of penetration of energy-efficient boilers This indicator provides a good proxy for the degree of penetration of energy-efficient appliances, while avoiding giving too much weight to structural differences related to GDP per capita, as would for instance be the case for more sophisticated appliances such as dishwashers.
We consider here municipal waste generated and resource productivity as good proxies for decoupling (reducing waste, increasing recycling as an option to make more productive use of energy inputs):
A.(19) Municipal waste generated (kg per capita, land filled and incinerated) Municipal waste consists of waste collected by or on behalf of municipal authorities. The bulk of this waste stream is from households, though similar waste from sources such as business, offices and public institutions is also included. Municipal waste landfilled and incinerated are aggregated as it is not so much the environmental impacts of waste that are considered in this approach but rather the recycling rates of consumers and producers, and thus the productive use of resources.
A.(20) Resource productivity (EUR per kg) Resource productivity is a more direct measure of the state of decoupling in an economy. One potential caveat, which needs to be further addressed, is that such a weight measure may be too much influenced by the level of activity in the construction sector, and in particular by the quantity of sand used to produce cement18.
17 It remains of course to be seen if these results apply to the European situation.
18 An "Environmentally weighted Material Consumption" indicator such as the one developed in the Policy Review on Decoupling (2005) study may be used to refine the analysis.
37

Towards a Green Growth Assessment Framework
Some attempts have been made to better understand the size of the EU eco-industry19, but no comprehensive database for this specific sector can be used so far. In the medium run, the share of the green sector in each Member State's economy will have to be included in this exercise. This will include indicators on the size and competitiveness of the eco-industry (turnover, employment or trade balance for environmental goods and services). For now, we use the following indicator:
A.(21) Turnover per capita in the recycling industry This indicator offers an indication of the size of the environmental sector in one of the core activities of eco-industries.
Furthermore, more indicators are needed to refine the analysis of the competitiveness of energy and environmental sectors20. One option would be to obtain disaggregated information on the following indicators, already included in the LIME assessment framework (policy area: “Business environment”, “Business dynamics, start-up conditions” and “Macroeconomic background information”).
B.(5) Business demography – Enterprise survival rate B.(6) Real enterprise births, divided by the population of active enterprises B.(7) Business investment
4. Tracking the “green” boost to long term productivity
The area covering the contribution of green activities to total factor productivity has been regrouped in three domains.
4.1. Protecting health
We include environmental indicators describing the potential negative impacts of health related environmental externalities as these in turn, have an impact on education and labour productivity and thereby on growth.
Environmental improvements can increase total factor productivity levels by reducing workers' sickness, reducing wear and tear of machines and buildings, or improving soil fertility, for example. By extending production function models of economic growth to account for health, it is possible to show that good health has a positive, sizeable, and statistically significant effect on aggregate output. By mixing this analysis with an approach looking at the health effects of environmental pollution, economic benefits are expected from improving the environment. Besides, there is also evidence of considerable pollution-related damage on children’s health (Ostro et al. (1998), Chay and Greenstone (2003)) which could support the claim of improved efficiency through improving human capital.
A.(22) Population exposure to air pollution by particulate matter A.(23) Population exposure to air pollution by ozone A.(24) Hazardous waste (kg per capita) We choose to include three health indicators as they do not cover the same areas of economic activity. The first is associated with transport, the second with industrial activities and the third is linked to environmental protection at work.
If a more general approach were to be chosen, a future indicator would have to include elements of transportation, as more sustainable mobility has positive impacts on health, through improvements in road safety and reductions in stress levels.
19 Cf. 2009 Study by Ecorys managed by DG ENTR on "the competitiveness of the EU eco-industry"
20 ESTAT was due to receive in end-December 2009 a first set of data to develop these indicators.
38

European Commission Economic paper no 401
B.(8) Sustainable Mobility indicator
4.2. Developing “green” human capital
Progress towards a “green” economy also requires implementing measures and following changes on the labour market. A series of issues should be considered and monitored, such as supporting labour market attachment during structural adjustment to new sectors and activities, increasing overall participation rates (“net job creation”) or developing human capital. We refer to an analysis of the impact of climate change mitigation policies on employment in “Employment in Europe 2009”21, published by DG EMPL.
Meanwhile, the following readily available indicators are suggested:
A.(25) Share of environment related employment in Member States A.(26) Share of RES employment in total employment
The two indicators can offer a first indication of the interactions between climate and energy issues and labour markets. They mainly focus on volumes without specifying the qualifications associated with these jobs. This is one reason to insist on developing better indicators such as:
B.(9) “Green” jobs openings / unmet labour demand This could indicate the contribution of green reforms to labour resource utilisation and to matching on labour markets. This will be built and followed by DG EMPL22.
B.(10) Investment in “green skills” training; graduates in “green tech” or number of researchers active in “green sectors” This indicator would be used as a proxy for how green reforms can lead to labour productivity improvements. Again, this indicator will be built and followed by DG EMPL.
B.(11) Wage levels in “green sectors” This indicator would allow the qualitative nature of jobs created in this sector to be analysed. Assuming that real wages equal marginal labour productivity, this indicator would also be a good measure of labour productivity in the sector.
4.3. Embodying “green” technological progress, pushing the production frontier
Strength of innovation / increasing the knowledge stock:
Information on eco-innovation, and on R&D for abatement technologies, would be relevant to measure the strength of innovation directly targeted at green industry. If it were possible to obtain disaggregated data, links could clearly be made with the policy area on innovation. However, no database is disaggregated enough to provide specific data on green innovation. Hence, we have chosen an indicator testing the role of governments:
A.(27) Public R&D in production, distribution and rational use of energy (GBAORD spending as % GDP current prices) Government budget appropriations or outlays on R&D (GBAORD) show the government’s intentions with regard to spending on R&D. In our context, it would be
21 Employment in Europe 2009, Chapter 3: Climate change and labour market outcomes.
22 Note by DG EMPL (INDIC/29/220909/EN) for EMCO Indicators Group meeting on 22-23 September 2009 Agenda item: Impact of climate change on employment Discussion about concepts and definitions
39

Towards a Green Growth Assessment Framework
used as a proxy for government's intentions as regards energy issues. It includes not just scientific research and development but also research in arts and humanities.
A statistic on green technology patents would indicate more precisely the rate of success of environmental innovation.
B.(12) “Green technologies” patent applications23
Direction of innovation:
On the physical capital side, an indicator is currently available to measure progress made by countries in terms of eco-innovation:
A.(28) Effects of innovation on material and energy efficiency This indicator measures the share of enterprises whose innovations have high effects in reducing materials and energy per unit of output as a percentage of innovative enterprises. This kind of innovation is driven by expectations about more stringent environmental regulation and higher resource prices.
It has been conjectured that environmental regulations can stimulate innovation because R&D is a relatively clean activity and because the market share of clean innovations increases (see for instance Verdier (1995), Hart (2004) and Ricci (2002)).
Diffusion of innovation gains:
Environmental regulation promotes pollution abatement activity and can lead to the exploitation of increasing returns to scale in abatement. For instance, Andreoni and Levinson (2001) provide evidence of increasing returns to scale in abatement activity, using US industry data relating to the period 1974-1994. If policy is lax, few firms enter and are forced to charge a high mark-up in order to cover development costs. On the other hand, a stringent environmental policy – like the CO2 and cars regulation - induces higher demand and allows a lower mark-up. So, the environmental goods and services industry (which produces clean factors of production) benefits from an early and strong environmental policy. This is especially likely if the costs of production are decreasing over time due to learning curve effects.
Currently, few specific indicators exist on the relative development of environmental technologies in Member States. However, we know that various forms of economic support schemes are applied at national level to support the market introduction of renewable electricity technologies. The objective is to create economies of scale and allow for further technological development, which will reduce the costs of these technologies over time and render them competitive in the longer run. Thus, we choose to use the installation of wind turbines as a proxy of the level of development of environmental technologies.
A.(29) Wind energy installed: total capacity Knowledge accumulates and so an indicator of stocks is necessary to test the relative performance of a country at a specific time. We acknowledge that this indicator may reflect country-specific characteristics. A more general indicator of the state of development of environmental technologies may then be needed.
Finally, we would need to measure the degree of adoption and diffusion of green innovation in the economy. The following readily available indicator is used:
A.(30) Variation in average CO2 emissions from new passenger cars sold This indicator, taken in variation, is considered as a good proxy of the diffusion of green innovation in the transportation sector. Average CO2 emissions, taken as an absolute
23 IEA 2009 data on R&D budgets disaggregated by energy technologies could also be used. Kanerva et al. (2009)
suggest further indicators to detect evolutions in eco-innovation such as exports in EU eco-industry products to large developing economies.
40
European Commission Economic paper no 401
value, would more likely refer to structural characteristics of cars markets in Member States, such as the level of taxation of fuels or of company cars, which directly influence the size and composition of the vehicle fleet. For the same reasons as for to the previous indicator, it could be considered as too limited.
More generally, a recent contribution (Vouvaki and Xepapadeas, 2009) has identified that when a factor of production such as energy generates an environmental externality, then Total Factor Productivity Growth estimates could be biased. This is because the contribution of the environment as a factor of production is not accounted for in the growth accounting framework. Empirical estimates confirm this hypothesis and suggest that part of what is regarded as technology's contribution to growth could be attributed to the use of the environment to produce output. The more general issue is how this current approach could be integrated into the green growth accounting literature.
Details of Step 2.b: Narrowing and consolidating the list of indicators
Some refinements in the selection of indicators need to be performed. Following the methodology applied in the LIME assessment framework, the following screening procedure is implemented to select a narrow list of indicators:
- Minimum statistical standards: criteria include (i) economic rationale, (ii) comparability and statistical reliability, (iii) time coverage, and (iv) geographical coverage.
- Redundancy criteria: correlation analysis is used to remove the redundant indicators. A specific weight could, however, be given to some specific indicators if the policy area has clearly two (or more) dimensions (as weighting allows for assigning an equal importance to each dimension covered by an uneven number of indicators).
- Robustness checks and sensitivity analysis
1. Minimum statistical standards
1.1. Economic rationale
The first dimension of statistical standards concerns the economic rationale of the indicators. In this context, the main question is whether the indicator is a good proxy for the economic phenomenon it is supposed to capture. Because this note is based on the use of readily available indicators, the overall evaluation can seem cautious as regards the quality of the proxies. However, this only reinforces the surge to develop new indicators so as to improve the quality of the proxies used to measure progress towards green growth. The following discussions are provided for the indicators revealing a potential lack of economic rationale:
- Urban population exposure to air pollution by particulate matter, by ozone and hazardous waste: the risk with these indicators is that they only offer an indirect link between polluting emissions and health. For instance, they do not consider household environmental protection expenditures, which can mitigate the impact of polluting emissions on human health.
- Year to year change in average CO2 emissions from new passenger cars sold/wind energy: these indicators are supposed to capture the degree of diffusion of environmental innovation. Clearly, green innovation diffusion is not concentrated only in the car industry, and the level of development of environmental technologies is about more than wind turbines.
41

Towards a Green Growth Assessment Framework
- Electricity produced from renewable sources/share of biofuels: These indicators are used as a proxy of the level of competition in electricity generation and in energy transmission activities, and of the degree of openness to new entrants. The first one makes the implicit assumption that renewable energy sources are produced by new entrants, which may not necessarily be the case, and the second one is an indicator of consumption rather than production.
- % of EIB loans dedicated to energy: this indicator needs to be complemented with information on venture capital from public sources and other sources of leverage for public funding.
- R&D investments in the field of production, distribution and rational use of energy: the objective is to provide an indicator of green innovation. As mentioned above, an indicator on green technology patent applications would be more appropriate.
1.2. Comparability/reliability
Comparability/reliability refers to the quality of the data collected and to the ease with which the scores can be interpreted. In most cases, the interpretation of indicators is straightforward. However, interpreting the level of some indicators as obvious signs of good/bad performance could be controversial. Therefore we used these indicators taking the following concerns into account:
- Cohesion policy support to energy and to climate change: the problem is that the level of cohesion policy funds differs significantly from one country to another. Therefore, the risk is that the indicator is more a proxy for the degree of cohesion policy funds received than a true choice made by Member States in terms of policy intervention.
- Share of bio-fuels: this indicator should be more widely defined to cover all sorts of renewable fuels.
- Index of energy diversification: the objective with this indicator is to measure the energy security risk faced by Member States, by looking at the degree of diversification of energy sources. When discussing diversity, the presence of various energy sources is not sufficient. The relative share of each source also matters. Disparity is also relevant because some sources present similar characteristics and face the same challenges, for example oil and gas. It results from this analysis that no simple criterion can be used to measure the reduction in energy security risk due to the introduction of renewable energy sources. Most of the literature seems to follow an approach that entails building indices that measure the degree of diversity in energy sources. These indices try to include as many dimensions as possible but often fail to be consistent across dimensions.
- Implicit tax rate on energy, deflated: this indicator does not differentiate by type of energy source. Paradoxically, an increase in the share of renewable energy production will reduce the value of this indicator.
- Environmental tax revenues as % of GDP: As environmental taxes are intended by design to erode their tax base, a low level for this indicator may actually correspond either to genuine “bad performance” (as sub-optimal reliance on environmental taxes) or to efficient environmental taxation. In the latter case, it would be wrong to attribute “bad performance” status.
- Environmental tax revenues as % of total taxation: the denominator of this indicator would have to be assessed carefully as sizeable variations could occur from country to country.
42
European Commission Economic paper no 401
- Resource productivity: Such a weight-based measure may be influenced too much by the level of activity in the construction sector, and in particular by the quantity of sand used to produce cement. Structural indicators capturing the use of energy and material inputs, as well as polluting emissions, should be used as soon as available to reinforce the quality of the assessment. Some Member States (AT, SE) pioneer such statistical developments and monitor their joint environmental / economic performance based on their “green national accounts”. As soon as data become available for other Member States, they should be used.
- Electricity prices: in theory, a high level of performance could be associated with transparency in prices, that is “getting the prices right”. The pursuit of cost-reflective prices would lead to greater efficiency in the long run. However, it may also reflect a lack of competition in the electricity sector, which complicates the determination of signs of good performance. Hence, it would be more accurate to consider an indicator reflecting the degree of pass-through between wholesale and retail prices in the electricity sector.
- Environmental protection expenditures: This indicator includes payments to keep environmental departments running, staff costs and other costs for managing environmental public goods. If it is a reliable indicator of the size of environmental affairs in the public sector, it does not inform about the efficiency of the public sector in dealing with these issues. Indicators looking at the cost-efficiency of these expenditures may therefore be needed, at least to complement the indicator currently used. Furthermore, it may be quite volatile from one year to another depending on the regulations that need to be complied with.
1.3. Time and geographical coverage
The time and geographical coverage refer to the quality of the data per se. As regards time coverage, a (- -) sign (see Table 2) is assigned to indicators for which only one year is available. In general the best available indicators used here are up-to-date: most inform about 2007 status, which is in phase with environmental policy developments of interest for the analysis. As regards geographical coverage, all indicators include at least 20 countries and so a negative sign does not necessarily signify that the indicator should be excluded based only on this criterion.
2. Correlation between indicators
A correlation analysis is used to refine the selection of indicators and avoid overweighting. This analysis should allow us to detect and potentially remove redundant indicators, that is an indicator displaying both a tight theoretical relationship and a high degree of statistical correlation with another one. A specific weight could also be given to some specific indicators if the policy area has clearly two (or more) dimensions (as weighting allows equal importance to be assigned to all dimensions, even if they are covered by a different number of indicators). This correlation analysis follows four steps: (i) determination of statistical correlation coefficients; (ii) correlation plots to visualise potential linear relations between variables; (iii) discussion of theoretical relationships between indicators suspected to be correlated; (iv) suggested recommendations: dropping one indicator, changing weights or status quo.
2.1. Statistical correlation coefficients
It is difficult to decide from which threshold a high statistical correlation between indicators is considered. Initially, the following pairs of indicators had been identified for which it was not possible to exclude a potential statistical correlation:
- Environmental protection expenditures/cohesion policy support to energy
43

Towards a Green Growth Assessment Framework
- Cohesion policy support to energy/cohesion policy support to climate change - Index of energy diversification/electricity produced from renewable sources - Municipal waste generated/energy diversification - Resource productivity/implicit tax rates on energy - Market share of largest generator/energy diversification - Energy intensity/implicit tax rate - Energy intensity/resource productivity - Urban population exposure to air pollution by particles/by ozone
2.2. Correlation plots
The correlation coefficient indicates the strength of a linear relationship between two variables. It measures to which extent that relationship can be approximated by a linear relationship. However, high coefficients can be detected for relations that are not linear. Therefore, the correlation coefficient, as a summary statistic, cannot replace the individual examination of the data. Correlation plots were derived for all the pairs of indicators identified above. Among them, the following pairs of indicators show a potential linear relationship between the two variables:
- Cohesion policy support to energy/cohesion policy support to climate change - Resource productivity/implicit tax rates on energy - Implicit tax rates on energy/energy intensity - Energy intensity/resource productivity
2.3. Theoretical relationships
Cohesion policy support to energy/cohesion policy support to climate change Member States have to draw up operational programmes before receiving any EU funding. These operational programmes list the Member States' priorities in relation to the Commission's recommendations. One can suspect that Member States that give high priority climate change to also give high priority to energy. In that sense, it is not surprising to find a statistically significant positive correlation between the two variables.
Resource productivity/implicit tax rates on energy/energy intensity These three indicators have statistically significant correlation coefficients, when they are considered two by two. In addition, it makes economic sense to consider them as correlated as the implicit tax rate on energy should influence production and consumption choice and thereby influence the energy intensity of an economy and its resource productivity.
3. Recommendations for a narrow list of indicators
Based on the previous analysis, we would recommend the following treatments in the choice of indicators:
- Because electricity prices are difficult to interpret, we remove this indicator from the list.
- Because there are some concerns about the statistical quality of the indicator “resource productivity” and because it is correlated with implicit tax rates on energy and energy intensity, we remove this indicator from the list.
- Because the statistical quality of the cohesion policy support indicators is good, we recommend keeping the two indicators, while decreasing their weights by half to avoid overweighting.
44

European Commission Economic paper no 401
45
Table 6: Correlation scores for Indicators in area I
Trend in GHG emissions
Gross inland consumption
of primary energy
GHG emissions per GDP
Environmental tax revenues in % of GDP
Share of GHG emissions
covered by ETS
Trend in GHG emissions 100%
Gross inland consumption of primary energy 28% 100%
GHG emissions per GDP -15% 7% 100%
Environmental tax revenues in % of GDP -11% -4% -20% 100%
Share of GHG emissions covered by ETS -9% 4% 50% 4% 100%
Table 7: Correlation scores for indicators in area II
Environmental taxes as % of total taxation
Environmental Protection
expenditure
Cohesion policy support
to climate change
Cohesion policy support
to energy
% of EIB loans dedicated to
energy
Environmental taxes as % of total taxation 100%
Environmental Protection expenditure 24% 100%
Cohesion policy support to climate change 3% 13% 100%
Cohesion policy support to energy 12% -38% 30% 100%
% of EIB loans dedicated to energy n.a. n.a. n.a. n.a. 100%

Towards a Green Growth Assessment Framework
Table 8: Correlation scores for indicators in area III
Electricity from
renewable sources
Share of biofuels Index of energy diversification
Implicit tax rates on energy, deflated
Market share of the largest electricity generator
Energy intensity of the economy
Municipal waste generated
Turnover per capita in
recycling industry
Penetration of energy-efficient
boilers
Electricity from renewable sources 100%
Share of biofuels 8% 100%
Index of energy diversification -39% -22% 100%
Implicit tax rates on energy, deflated 10% 11% 4% 100%
Market share of the largest electricity generator -22% -1% 46% -38% 100%
Energy intensity of the economy -13% -8% -21% -70% 17% 100%
Municipal waste generated -33% -28% 65% 19% 17% -20% 100%
Turnover per capita in recycling industry -14% 40% -14% 48% -16% -33% -6% 100%
Penetration of energy-efficient boilers 13% 42% n.a. n.a. n.a. -31% -26% 19% 100%
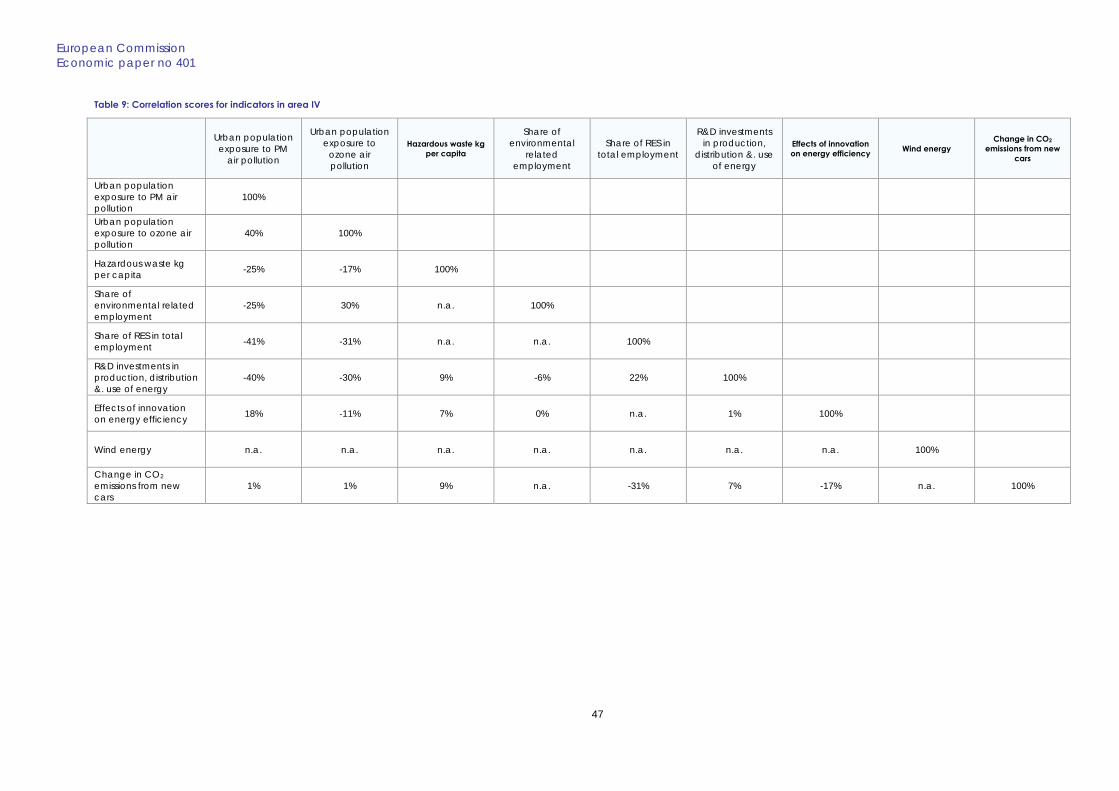
European Commission Economic paper no 401
47
Table 9: Correlation scores for indicators in area IV
Urban population exposure to PM
air pollution
Urban population exposure to
ozone air pollution
Hazardous waste kg per capita
Share of environmental
related employment
Share of RES in total employment
R&D investments in production,
distribution &. use of energy
Effects of innovation on energy efficiency Wind energy
Change in CO2 emissions from new
cars
Urban population exposure to PM air pollution
100%
Urban population exposure to ozone air pollution
40% 100%
Hazardous waste kg per capita -25% -17% 100%
Share of environmental related employment
-25% 30% n.a. 100%
Share of RES in total employment -41% -31% n.a. n.a. 100%
R&D investments in production, distribution &. use of energy
-40% -30% 9% -6% 22% 100%
Effects of innovation on energy efficiency 18% -11% 7% 0% n.a. 1% 100%
Wind energy n.a. n.a. n.a. n.a. n.a. n.a. n.a. 100%
Change in CO2 emissions from new cars
1% 1% 9% n.a. -31% 7% -17% n.a. 100%

Towards a Green Growth Assessment Framework
4. Robustness checks and sensitivity analyses
As regards the reliability of the aggregate score per policy area, various robustness checks and sensitivity analyses are carried out to assess the impact of different choices of indicator sets and weights. Based on these calculations, the sensitivity analysis would have to identify some key indicators, where the quality of data could for instance have a significant impact on countries' scores, and thereby on the recommendations.
As regards weight, we consider in this approach that the various domains identified in the different environmental policy areas are of equal importance. Therefore, we make sure that the weight of each indicator is such that each domain has the same weight in the overall score.
In sum, Table 10 to Table 13 recapitulate the different environmental areas and domains covered by this analysis, the list of indicators in each domain, and the weights applied to determine Member States' aggregate scores by environmental area.
Table 10: Weights applied in area I. Cost-efficiency
Domains covered Indicators Weight
Trend in GHG emissions 0.17
Trend in primary energy consumption 0.17 Minimising costs
CO2 intensity 0.17
Environmental tax revenues in % of GDP 0.25 Creating price signals
Share of GHG emissions covered by ETS 0.25
Table 11: Weights applied in area II. Sound use of public finances
Domains covered Indicators Weight
Minimising distortions Environmental taxes as % of total taxation 0.50
Environmental protection expenditures 0.17
Share of EU structural funds to climate change 0.08
Share of EU structural funds to energy 0.08 Maximising benefits of public
spending
Loans provided by the EIB to Member States for energy projects 0.17
Table 12: Weights applied in area III. Strong markets
Domains covered Indicators Weight
Electricity produced from renewable energy 0.08
Share of biofuels 0.08 Markets resilient to external shocks
Diversification of energy sources 0.08
Implicit tax rates on energy, deflated 0.13
Energy markets
Transparent open markets Market share of the largest electricity generator 0.13
Energy intensity 0.13
Electricity prices: industrial users 0.00
Municipal waste generated 0.13
Recycling industry: turnover per capita 0.13
Boilers: energy efficiency 0.13
Markets for products and services
Resource productivity 0.00
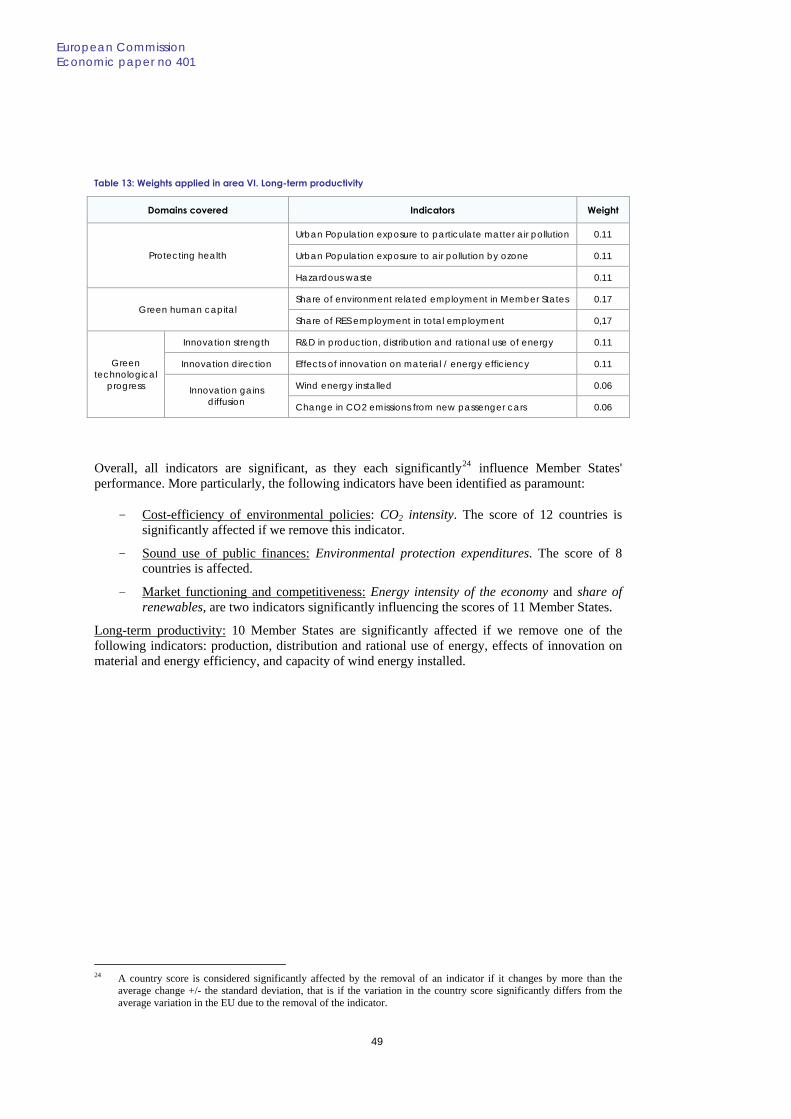
European Commission Economic paper no 401
49
Table 13: Weights applied in area VI. Long-term productivity
Domains covered Indicators Weight
Urban Population exposure to particulate matter air pollution 0.11
Urban Population exposure to air pollution by ozone 0.11 Protecting health
Hazardous waste 0.11
Share of environment related employment in Member States 0.17 Green human capital
Share of RES employment in total employment 0,17
Innovation strength R&D in production, distribution and rational use of energy 0.11
Innovation direction Effects of innovation on material / energy efficiency 0.11
Wind energy installed 0.06
Green technological
progress Innovation gains diffusion Change in CO2 emissions from new passenger cars 0.06
Overall, all indicators are significant, as they each significantly24 influence Member States' performance. More particularly, the following indicators have been identified as paramount:
- Cost-efficiency of environmental policies: CO2 intensity. The score of 12 countries is significantly affected if we remove this indicator.
- Sound use of public finances: Environmental protection expenditures. The score of 8 countries is affected.
- Market functioning and competitiveness: Energy intensity of the economy and share of renewables, are two indicators significantly influencing the scores of 11 Member States.
Long-term productivity: 10 Member States are significantly affected if we remove one of the following indicators: production, distribution and rational use of energy, effects of innovation on material and energy efficiency, and capacity of wind energy installed.
24 A country score is considered significantly affected by the removal of an indicator if it changes by more than the
average change +/- the standard deviation, that is if the variation in the country score significantly differs from the average variation in the EU due to the removal of the indicator.
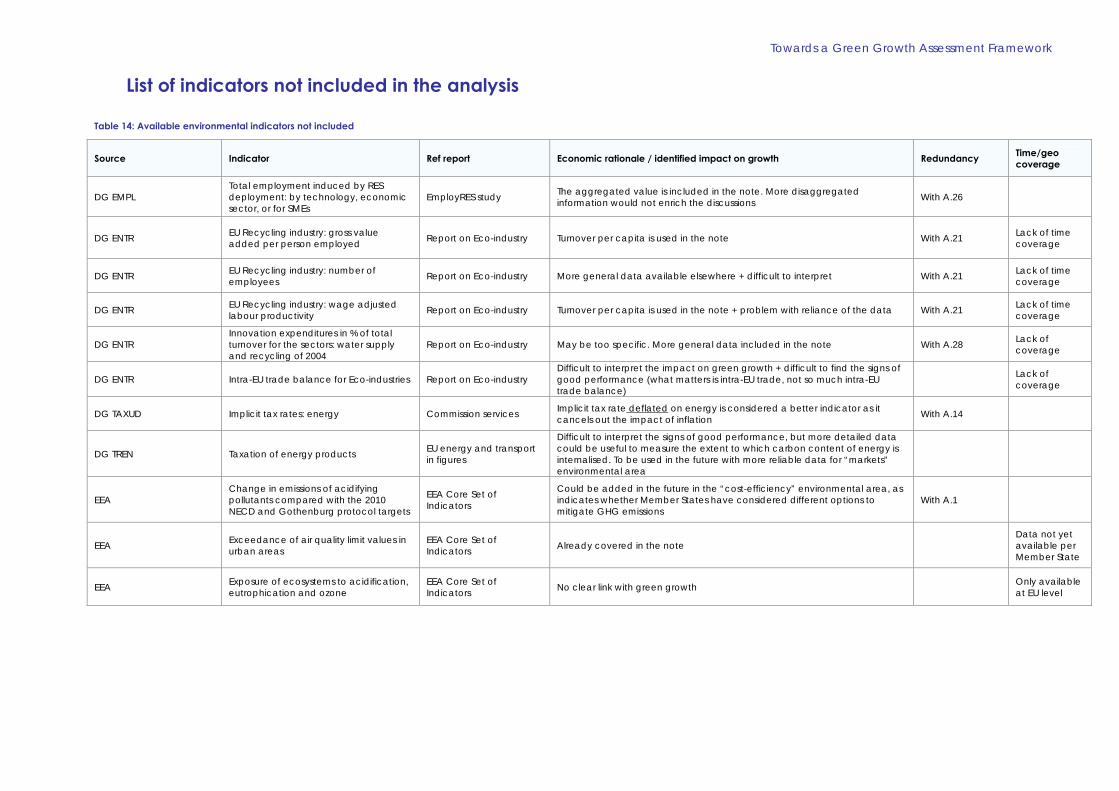
Towards a Green Growth Assessment Framework
List of indicators not included in the analysis
Table 14: Available environmental indicators not included
Source Indicator Ref report Economic rationale / identified impact on growth Redundancy Time/geo coverage
DG EMPL Total employment induced by RES deployment: by technology, economic sector, or for SMEs
EmployRES study The aggregated value is included in the note. More disaggregated information would not enrich the discussions With A.26
DG ENTR EU Recycling industry: gross value added per person employed Report on Eco-industry Turnover per capita is used in the note With A.21 Lack of time
coverage
DG ENTR EU Recycling industry: number of employees Report on Eco-industry More general data available elsewhere + difficult to interpret With A.21 Lack of time
coverage
DG ENTR EU Recycling industry: wage adjusted labour productivity Report on Eco-industry Turnover per capita is used in the note + problem with reliance of the data With A.21 Lack of time
coverage
DG ENTR Innovation expenditures in % of total turnover for the sectors: water supply and recycling of 2004
Report on Eco-industry May be too specific. More general data included in the note With A.28 Lack of coverage
DG ENTR Intra-EU trade balance for Eco-industries Report on Eco-industry Difficult to interpret the impact on green growth + difficult to find the signs of good performance (what matters is intra-EU trade, not so much intra-EU trade balance)
Lack of coverage
DG TAXUD Implicit tax rates: energy Commission services Implicit tax rate deflated on energy is considered a better indicator as it cancels out the impact of inflation With A.14
DG TREN Taxation of energy products EU energy and transport in figures
Difficult to interpret the signs of good performance, but more detailed data could be useful to measure the extent to which carbon content of energy is internalised. To be used in the future with more reliable data for “markets” environmental area
EEA Change in emissions of acidifying pollutants compared with the 2010 NECD and Gothenburg protocol targets
EEA Core Set of Indicators
Could be added in the future in the “cost-efficiency” environmental area, as indicates whether Member States have considered different options to mitigate GHG emissions
With A.1
EEA Exceedance of air quality limit values in urban areas
EEA Core Set of Indicators Already covered in the note
Data not yet available per Member State
EEA Exposure of ecosystems to acidification, eutrophication and ozone
EEA Core Set of Indicators No clear link with green growth Only available
at EU level

European Commission Economic paper no 401
EEA Low and zero-sulphur fuel use EEA Core Set of Indicators Transport not included in the current green growth analysis
EEA Recycling of packaging waste EEA Core Set of Indicators More narrowly defined than indicator A.21 With A.21
EEA Efficiency (electricity and heat) production from public conventional thermal plants
Energy and environment report Included in the following indicator
EEA Energy used and energy lost in 2005 (% of primary energy consumption)
Energy and environment report
The note currently considers the first part of this indicator. Energy lost could be included in “markets” area, under “markets for goods and services”.
EEA Grassland butterflies Energy and environment report Impact on growth cycles?
EEA Gap (%) between current renewables energy level and 2010 targets EU GHG emissions trend Focused on targets and would not facilitate cross-country comparisons With A.11
EEA Gap (in %) between GHG projections and all measures and 2010 Kyoto targets EU GHG emissions trend Focused on targets and would not facilitate cross-country comparisons With A.1
EEA Gap (in %) between GHG projections and existing and additional measures and 2010 Kyoto targets
EU GHG emissions trend Focused on targets and would not facilitate cross-country comparisons With A.1
EEA Gap between current share of biofuels in all fuels) and the 2010 biofuel target of 5,75%
EU GHG emissions trend Focused on targets and would not facilitate cross-country comparisons With A.12
Energy.eu Biodiesel/ethanol Consumption Europe's energy portal Difficult to interpret as does not inform about production levels With A.12
Energy.eu Energy Dependency: all products or by type of fuel Europe's energy portal According to the literature, an indicator on diversification of energy sources
makes more economic sense to consider energy security issues With A.13
51

Towards a Green Growth Assessment Framework
Energy.eu GHG emissions Europe's energy portal Trend in emission reductions would be a better indicator to avoid taking account of structural differences per Member State With A.1
Energy.eu Hydro energy total capacity Europe's energy portal Influenced by country-specific characteristics + mature technologies, which limits learning spillovers for other green industries
Energy.eu Photovoltaic installed/total capacity Europe's energy portal Could be used in the future as an indicator of diffusion of innovation, especially when used for new buildings With A.29
Energy.eu Renewable Energy in Primary Energy Consumption Europe's energy portal With A.11
Energy.eu / EUROSTAT Industrial prices: electricity and gas (with and without taxes)
Europe's energy portal / Eurostat
Not included in the short list, as difficult to interpret the signs of good performance
Environmental Policy Review Area occupied by organic farming EEA Unclear links with health and thus no clear link with green growth
Environmental Policy Review
Cumulative spent fuel from nuclear power plants EEA No clear link with green growth + influenced by country-specific
characteristics
Environmental Policy Review Energy per capita (kgoe/cap) EEA Influenced by country-specific characteristics + better indicators to measure
energy security issues With A .3 and A.13
Environmental Policy Review
Infringements of EU environmental legislation by Member State and by sector
EEA Could be included in the “markets” area, under markets for goods and services, so as to consider better regulation With A.7-A.10
Environmental Policy Review Municipal waste: % incinerated EEA We consider more important to focus on the share of recycled resources, as
an indicator of resource efficiency
Environmental Policy Review Municipal waste: % landfilled EEA We consider more important to focus on the share of recycled resources, as
an indicator of resource efficiency With A.19
Environmental Policy Review Natura 2000 area as % of terrestrial area EEA
Green infrastructure could help reduce Climate change adaptation costs and could therefore be included in the future in the cost-efficiency area, under “minimising costs”
Environmental Policy Review Pesticides residue in food EEA Unclear links with health, and thus with green growth With A.22, A.23
and A.24 Lack of coverage
52

European Commission Economic paper no 401
Environmental Policy Review Total Kyoto GHG emissions per capita EEA Trend in GHG emissions is used in the note With A.1
Environmental Policy Review
Trend (% change compared to base year) EEA Included, as a moving average With A.1
EUROSTAT Car share of inland passenger transport Structural indicators Transport not included in the current green growth analysis
EUROSTAT Gross inland consumption of primary energy Structural indicators Included, in variation, so as to limit the effects of country-specific
characteristics With A.2
EUROSTAT Healthy life years at birth by gender Structural indicators Link with environmental policy-making difficult to establish
EUROSTAT Road share of inland freight transport Structural indicators Transport not included in the current green growth analysis
EUROSTAT Volume of freight transport relative to GDP Structural indicators Transport not included in the current green growth analysis
EUROSTAT Area under agri-environmental commitment
Sustainable development indicators
Could be seen as having indirect links with green growth, through the “sound use of public finances area”(domain “maximising benefits of public spending”)
EUROSTAT Biochemical oxygen demand in rivers Sustainable development indicators No clear link with green growth
EUROSTAT Build-up areas Sustainable development indicators
Could be indirectly linked with climate change adaptation, as would indicate land vulnerability. Links are tenuous though
EUROSTAT Combined Heat and Power Generation Sustainable development indicators Country-specific characteristics + covered by other indicators
EUROSTAT Common Bird Index Sustainable development indicators No clear link with green growth
EUROSTAT Consumption of certain foodstuffs per inhabitant
Sustainable development indicators
Difficult to interpret what a good performance is + No clear link with green growth
Lack of time/geo coverage
53

Towards a Green Growth Assessment Framework
EUROSTAT Eco-label awards Sustainable development indicators
Originally focused on a sub-group of products too focused on country-specific characteristics but could be included in the future as an indicator of changes in markets for goods and services, in the “markets area”
EUROSTAT Effects of innovation on reduced environmental impacts or improved health and safety
Sustainable development indicators Only indirectly linked with green growth With A.28
EUROSTAT Fish catches taken from stocks outside safe biological limits
Sustainable development indicators
Could be relevant at regional level, but also focused on country-specific characteristics
EUROSTAT Forest increment and fellings Sustainable development indicators
Climate change mitigation through carbon sinks but other drivers than green growth
EUROSTAT Forest trees damaged by defoliation Sustainable development indicators No clear link with green growth
EUROSTAT Greenhouse gas emissions by sector (including sinks)
Sustainable development indicators Difficult to determine and interpret aggregate scores With A.1
EUROSTAT Investment in transport infrastructure by mode
Sustainable development indicators Transport not included in the current green growth analysis Data not yet
available
EUROSTAT Land at risk of soil erosion Sustainable development indicators Focused on country-specific characteristics Data not yet
available
EUROSTAT Livestock density index Sustainable development indicators No clear link with green growth
EUROSTAT Motorisation rate Sustainable development indicators Transport not included in the current green growth analysis
EUROSTAT Population connected to urban waste-water treatment with at least secondary treatment
Sustainable development indicators
Indirect link with health + far from low-carbon resource efficient approach in the note
EUROSTAT Size of fishing fleet Sustainable development indicators No clear link with green growth
EUROSTAT Sufficiency of sites designated under the EU Habitats directive
Sustainable development indicators
Green infrastructure could help reduce Climate change adaptation costs and could therefore be included in the future in the cost-efficiency area, under “minimising costs”. Probably better indicator than Natura 2000
54
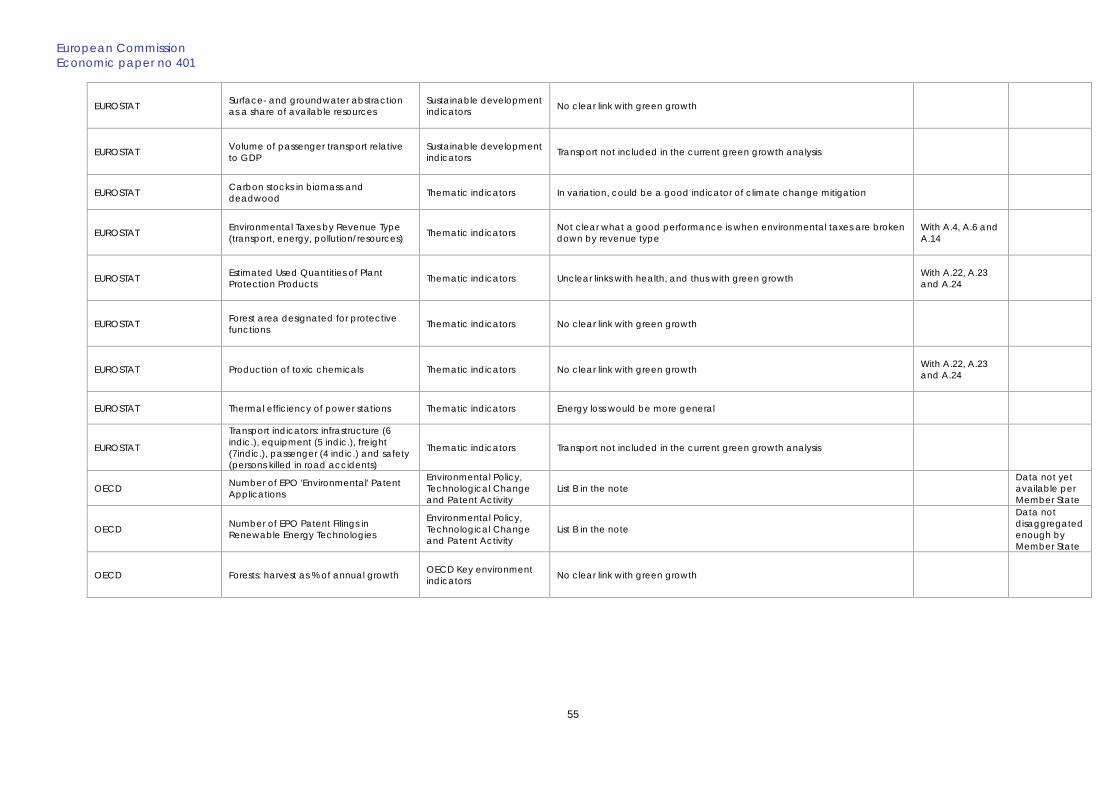
European Commission Economic paper no 401
EUROSTAT Surface- and groundwater abstraction as a share of available resources
Sustainable development indicators No clear link with green growth
EUROSTAT Volume of passenger transport relative to GDP
Sustainable development indicators Transport not included in the current green growth analysis
EUROSTAT Carbon stocks in biomass and deadwood Thematic indicators In variation, could be a good indicator of climate change mitigation
EUROSTAT Environmental Taxes by Revenue Type (transport, energy, pollution/resources) Thematic indicators Not clear what a good performance is when environmental taxes are broken
down by revenue type With A.4, A.6 and A.14
EUROSTAT Estimated Used Quantities of Plant Protection Products Thematic indicators Unclear links with health, and thus with green growth With A.22, A.23
and A.24
EUROSTAT Forest area designated for protective functions Thematic indicators No clear link with green growth
EUROSTAT Production of toxic chemicals Thematic indicators No clear link with green growth With A.22, A.23 and A.24
EUROSTAT Thermal efficiency of power stations Thematic indicators Energy loss would be more general
EUROSTAT
Transport indicators: infrastructure (6 indic.), equipment (5 indic.), freight (7indic.), passenger (4 indic.) and safety (persons killed in road accidents)
Thematic indicators Transport not included in the current green growth analysis
OECD Number of EPO 'Environmental' Patent Applications
Environmental Policy, Technological Change and Patent Activity
List B in the note Data not yet available per Member State
OECD Number of EPO Patent Filings in Renewable Energy Technologies
Environmental Policy, Technological Change and Patent Activity
List B in the note
Data not disaggregated enough by Member State
OECD Forests: harvest as % of annual growth OECD Key environment indicators No clear link with green growth
55

Towards a Green Growth Assessment Framework
56
OECD GHG emissions per unit of GDP/ per capita
OECD Key environment indicators Similar indicator used in the note With A.3 Lack of geo.
coverage
OECD Index of acidifying substances OECD Key environment indicators
Could be added in the future in the “cost-efficiency” environmental area, as indicates whether Member States have considered different options to mitigate GHG emissions
With A.22 and A.23
OECD Index of apparent consumption of ozone depleting substances (ODS)
OECD Key environment indicators
Could be added in the future in the “cost-efficiency” environmental area, as indicates whether Member States have considered different options to mitigate GHG emissions
With A.22 and A.23
OECD Intensity of use of water resources OECD Key environment indicators No clear link with green growth
The European Pollutant Emission Register (EPER) and the European Pollutant Release and Transfer Register (E-PRTR)
Reporting on emissions EPER: Member States produce a triennial report, covering emissions of 50 pollutants. >> EPRTR: more facilities and substances included, additional coverage (land, waste and diffuse sources), public participation, annual reporting.
EPER report A specific analysis of the relevance of each indicator remain to be done Data not yet available

Towards a Green Growth Assessment Framework
Examples of outputs of the hands-on tools, used for exploring possible links between environmental and macro-economic challenges
CZ
CZ
CZ
CZ
DK
DK
DK
DK
EE
EE
EE
EE
IE
IE
IE
IE
IT
IT
IT
IT
CY
CY
CY
LT
LT
LU
LU
LU
LU
NL
NL
NL
NL
AT
AT
SI
SI
SI
CY
LT
LT
ATATSI
-20
-15
-10
-5
0
5
10
15
20
25
I II III IV
Figure 8: “Green” performances for countries with low unemployment concern

Towards a Green Growth Assessment Framework
58
BG
BG
BG
BG
DE
DE
DE
GR
GR
GRGR
ES
ES
ES
LV
LV
LV
LV
HU
MT
MT
MT
PT
PT
PT
RORO
FIFI
FI
SEUK
UK
DE
ES
HU
HU
HU
MT
PT
RO
RO
FI
SE
SE
SE
UK
UK
-20
-15
-10
-5
0
5
10
15
20
25
30
I II III IV
Figure 9: “Green” performances for countries with medium unemployment concern

European Commission Economic paper no 401
59
BE
BE
BE
BE
FR
FR
FR
PL
PL
PL
SK
SK
SK
SK
FR
PL
-10
-8
-6
-4
-2
0
2
4
6
I II III IV
Figure 10: “Green” performances for countries with high unemployment concern

Towards a Green Growth Assessment Framework
References Acemoglu D., 2007 Equilibrium Bias of Technology. Econometrica 75(5), pp. 1371-1409
Acemoglu, D., Aghion P., Bursztyn L., Hemous, D. (2009) The Environment and Directed technical change. NBER Working paper 15451 October 2009
Alcantara, V., Padilla, E. (2009) Input–output subsystems and pollution: An application to the service sector and CO2 emissions in Spain. Ecological Economics Volume 68, Issue 3, 15 January 2009, pp. 905-914
Andreoni, J., Levinson, A. (2001) The Simple Analytics of the Environmental Kuznets Curve. Journal of Public Economics 80 (2), pp. 269-286
Baumol W.J., Oates, W.E. (1975) The Theory of Environmental Policy. Cambridge University press
Bovenberg, A.L., Goulder, L.H. (1995) Costs of Environmentally Motivated Taxes in the Presence of Other Taxes:General Equilibrium Analyses. NBER Working Papers 5117
Bovenberg, A.L., Smulders, S. (1995) Environmental Quality and Pollution-Augmenting Technological Change in a Two-Sector Endogenous Growth Model. Journal of Public Economics 57(3), pp. 369-391
Chay, K. Y. and Greenstone, M. (2003) Air Quality, Infant Mortality, and the Clean Air Act of 1970. NBER Working Papers 10053
CML (2005) Policy Review on Decoupling: Development of indicators to assess decoupling of economic development and environmental pressure in the EU-25 and AC-3 countries. Report 166
Dell, M., Jones B. F., Olken, B. A. (2008) Climate Shocks and Economic Growth: Evidence from the Last Half Century. NBER Working Paper 14132
European Investment Bank (2007) An efficient, sustainable and secure supply of energy for Europe Meeting the challenge. EIB Papers Volume 12. n°1/2007 and Volume 12, n°2/2007
European Commission DG ECFIN (2009) The EU's response to support the real economy during the economic crisis: an overview of Member States' recovery measures. European Economy Occasional paper n°51
European Commission DG TAXUD (2009) Taxation trends in the European Union 2009. Data for the EU Member States and Norway
European Commission DG TREN (2009) Renewable energy progress report 2009
European Environment Agency (2003) Environmental Indicators: Typology and Use in Reporting. Prepared by Peter Gabrielsen and Peter Bosch.
Fischer, C., Newell, R. G. (2008) Environmental and technology policies for climate mitigation. Journal of Environmental Economics and Management 55(2), pp. 142-162
Fisher, E., van Marrewijk, C. (1998) Pollution and Economic Growth. Journal of International Trade & Economic Development 7 (1), pp. 55-69.
Fisher, C. (2008) Emissions pricing, spillovers, and public investment in environmentally friendly technologies. Energy Economics Volume 30, Issue 2, March 2008, pp. 487-502
Hart, R. (2004) Growth, Environment and Innovation: A Model with Production Vintages and Environmentally Oriented Research. Journal of Environmental Economics and Management 48(3), pp. 1078-1098
Hettich, F. (1998) Growth Effects of a Revenue-Neutral Environmental Tax Reform. Journal of Economics 67(3), pp. 287-316
Hope, C., (2009) How deep should the deep cuts be? Optimal CO2 emissions over time under uncertainty Climate Policy Volume 9, Number 1, 2009 , pp. 3-8(6)
IEA (2009) Energy technology R&D budgets: beyond 2020 Documentation, 2009 Edition. International Energy Agency Data service
Joint Research Centre (2008) Biofuels in the European Context: Facts and Uncertainties
Kanerva, M., Arundel, A., Kemp, R. (2009) Environmental innovation: Using qualitative models to identify indicators for policy

European Commission Economic paper no 401
61
Le Coq, C., Paltseva, E. (2009) Measuring the Security of External Energy Supply in the European Union. Stockholm School of Economics Working Paper N°2 Ostro, B., Eskeland, G., Feyzioglu, T., Sanchez, J., (1998) Air Pollution and Health Effects: A Study of Respiratory Illness Among Children in Santiago, Chile. World Bank, Country Economics Department, series papers n.1932, Washington.
Ricci, F. (2002) Environmental Policy and Growth when Inputs are Differentiated in Pollution Intensity. FEEM Working paper 16.02
Ricci, F. (2007) Channels of Transmission of Environmental Policy to Economic Growth: a Survey of the Theory. Ecological Economics 60(4), pp. 688-699
Rosendahl, K.E. (1996) Does Improved Environmental Policy Enhance Economic Growth? Environmental and Resource Economics, 9, pp. 341-364.
Rubio, S.J., Aznar, J. (2000) Sustainable Growth and Environmental Policies. FEEM Working paper 00.25.
Stavins, R. (2003) Chapter 9 Experience with market-based environmental policy instruments. Handbook of Environmental Economics Volume 1, 2003 Environmental Degradation and Institutional Responses, pp. 355-435
Smulders, S. (1995) Environmental Policy and Sustainable Economic Growth. De Economist, 143(2), pp. 163-195.
Smulders, S. (2009) The Green New Deal – a theory-based answer to a practical question. EAERE 17th Annual conference, June 2009.
Smulders, S., de Nooij, M. (2003) The impact of energy conservation on technology and economic growth. Resource and Energy Economics, 2003, vol. 25, nr. 1, pp. 59-79
Verdier, T. (1995) Environmental Pollution and Endogenous Growth: a Comparison between Emission taxes and Technological Standards. In Carraro, C., Filar, J.A. (ed.s), Control and Game-Theoretic Models of the Environment (Annals of the International Society of Dynamic Games). Birkhauser, Boston, Basel and Berlin, vol. 2, pp. 175-200.
Vouvaki, D., Xepapadeas, A. (2009) Total Factor Productivity Growth when Factors of Production Generate Environmental Externalities. FEEM Working Papers 20.2009