ameren InvestorMeetings_0308
43
investing for our future. 1 Investor Meetings March 2008
-
Upload
finance30 -
Category
Economy & Finance
-
view
219 -
download
0
Transcript of ameren InvestorMeetings_0308
investing for our future.1
InvestorMeetingsMarch 2008
investing for our future.2
Warner BaxterExecutive Vice President & Chief Financial Officer
Bruce SteinkeVice President and Controller
investing for our future.3
All forecasted numbers in this presentation are issued and effective as of January 17, 2008
Regulation G StatementAmeren has presented certain information in this presentation on a diluted cents per share basis. These diluted per share amounts reflect certain factors that directly impact Ameren’s total earnings per share. The non-GAAP earnings per share and non-GAAP earnings per share guidance excludes one or more of the following: costs related to severe January 2007 storms, abnormal weather, the earnings impact of the settlement agreement among parties in Illinois for comprehensive electric rate relief and customer assistance, the reversal of accruals made in 2006 for low-income energy assistance and energy efficiency program funding commitments in Illinois and a March 2007 FERC order, which retroactively adjusted prior years’ regional transmission organization costs. Ameren believes this information is useful because it enables readers to better understand the impact of these factors on Ameren’s results of operations and earnings per share. In providing non-GAAP earnings guidance and a non-GAAP earnings growth forecast, there could be differences between non-GAAP earnings and earnings prepared in accordance with Generally Accepted Accounting Principles (GAAP) for unusual items, such as the 2007 Illinois electric settlement and the impact of abnormal weather. Except for the Illinois settlement, Ameren is not able to estimate the impact, if any, on future GAAP earnings of these items. Therefore, Ameren is not able to provide a corresponding GAAP equivalent for its earnings growth rate forecast.
Forward-looking StatementsAmeren’s consolidated and segment earnings guidance excludes one or more of the following: costs related to severe January 2007 storms, abnormal weather, the earnings impact of the settlement agreement among parties in Illinois for comprehensive electric rate relief and customer assistance, the reversal of accruals made in 2006 for low-income energy assistance and energy efficiency program funding commitments in Illinois and a March 2007 FERC order, which retroactively adjusted prior years’ regional transmission organization costs. Ameren’s earnings guidance assumes normal weather and is subject to, among other things, regulatory and legislative decisions, plant operations, energy market and economic conditions, severe storms, unusual or otherwise unexpected gains or losses and other risks and uncertainties outlined in Ameren’s Forward-looking Statements in its news release issued today and in the Forward-looking Statements and Risk Factors sections in its periodic filings with the Securities and Exchange Commission.
Cautionary Statements
investing for our future.4
UEIP
CIPS
CILCO
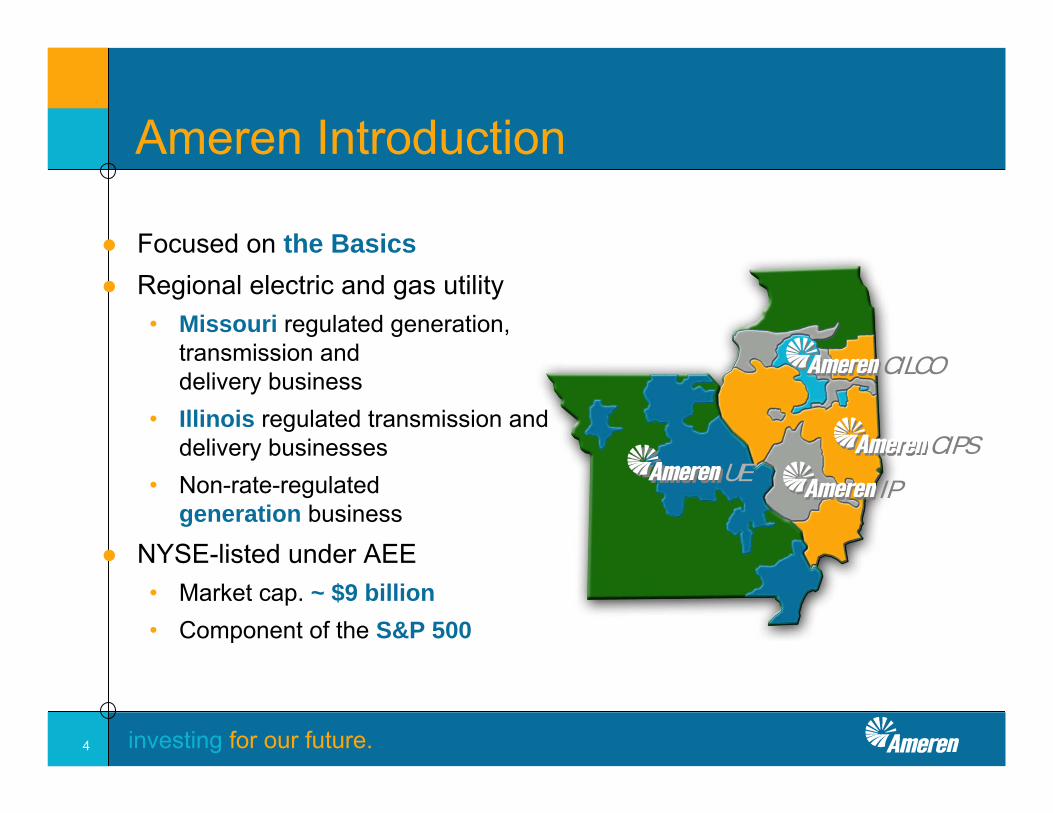
Ameren Introduction
● Focused on the Basics● Regional electric and gas utility
• Missouri regulated generation, transmission and delivery business
• Illinois regulated transmission and delivery businesses
• Non-rate-regulated generation business
● NYSE-listed under AEE• Market cap. ~ $9 billion• Component of the S&P 500
investing for our future.5
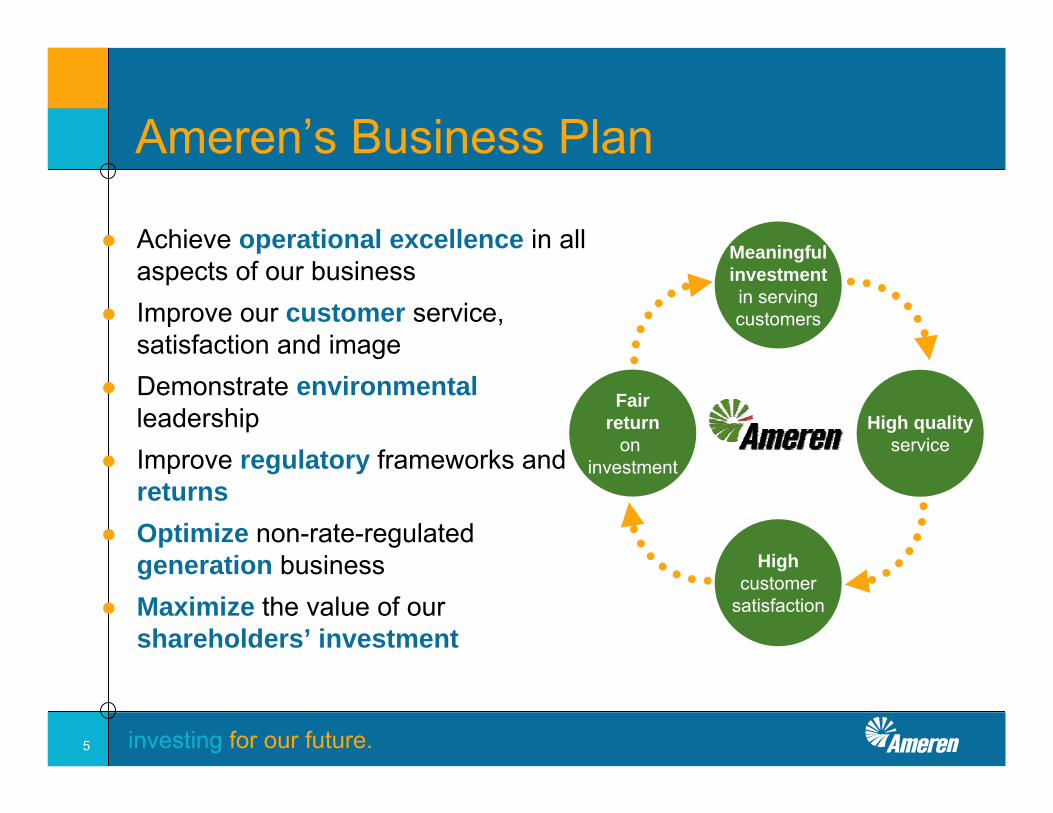
Ameren’s Business Plan
● Achieve operational excellence in all aspects of our business
● Improve our customer service, satisfaction and image
● Demonstrate environmentalleadership
● Improve regulatory frameworks andreturns
● Optimize non-rate-regulated generation business
● Maximize the value of our shareholders’ investment
Highcustomer
satisfaction
Meaningfulinvestmentin servingcustomers
Fairreturn
on investment
High qualityservice
investing for our future.6
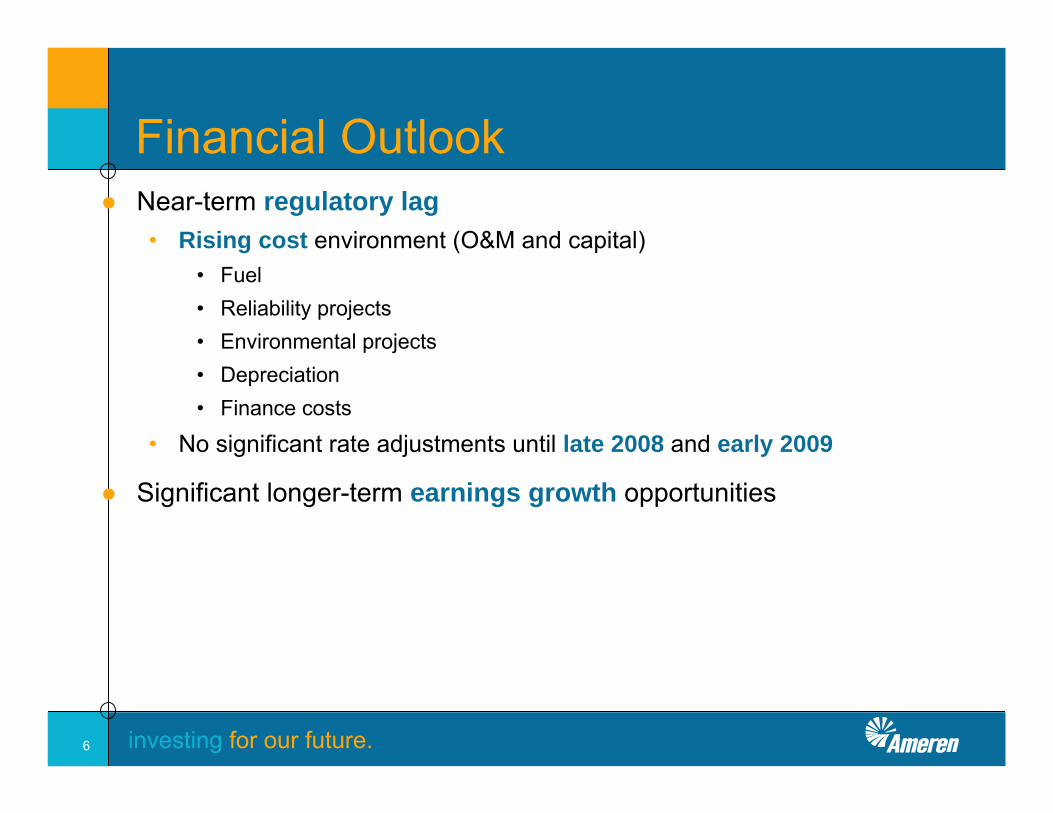
Financial Outlook● Near-term regulatory lag
• Rising cost environment (O&M and capital)• Fuel• Reliability projects• Environmental projects• Depreciation• Finance costs
• No significant rate adjustments until late 2008 and early 2009
● Significant longer-term earnings growth opportunities
investing for our future.7
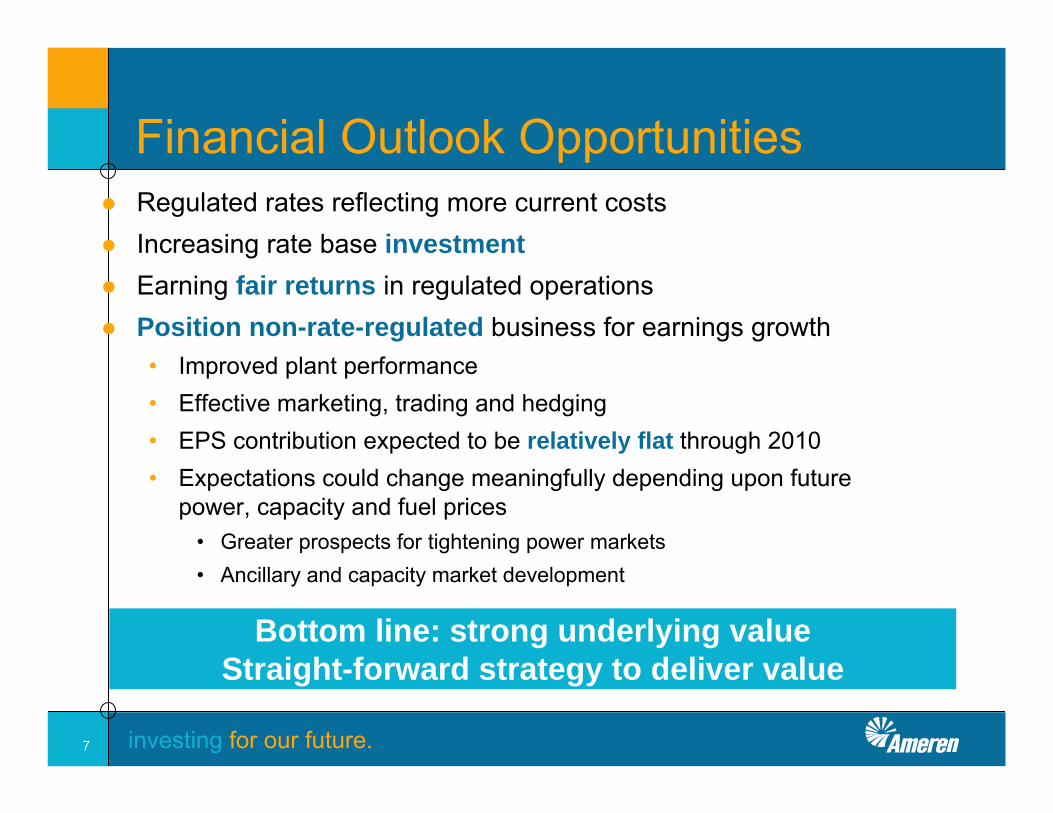
Financial Outlook Opportunities● Regulated rates reflecting more current costs● Increasing rate base investment● Earning fair returns in regulated operations● Position non-rate-regulated business for earnings growth
• Improved plant performance • Effective marketing, trading and hedging• EPS contribution expected to be relatively flat through 2010• Expectations could change meaningfully depending upon future
power, capacity and fuel prices• Greater prospects for tightening power markets• Ancillary and capacity market development
Bottom line: strong underlying valueStraight-forward strategy to deliver value
investing for our future.8
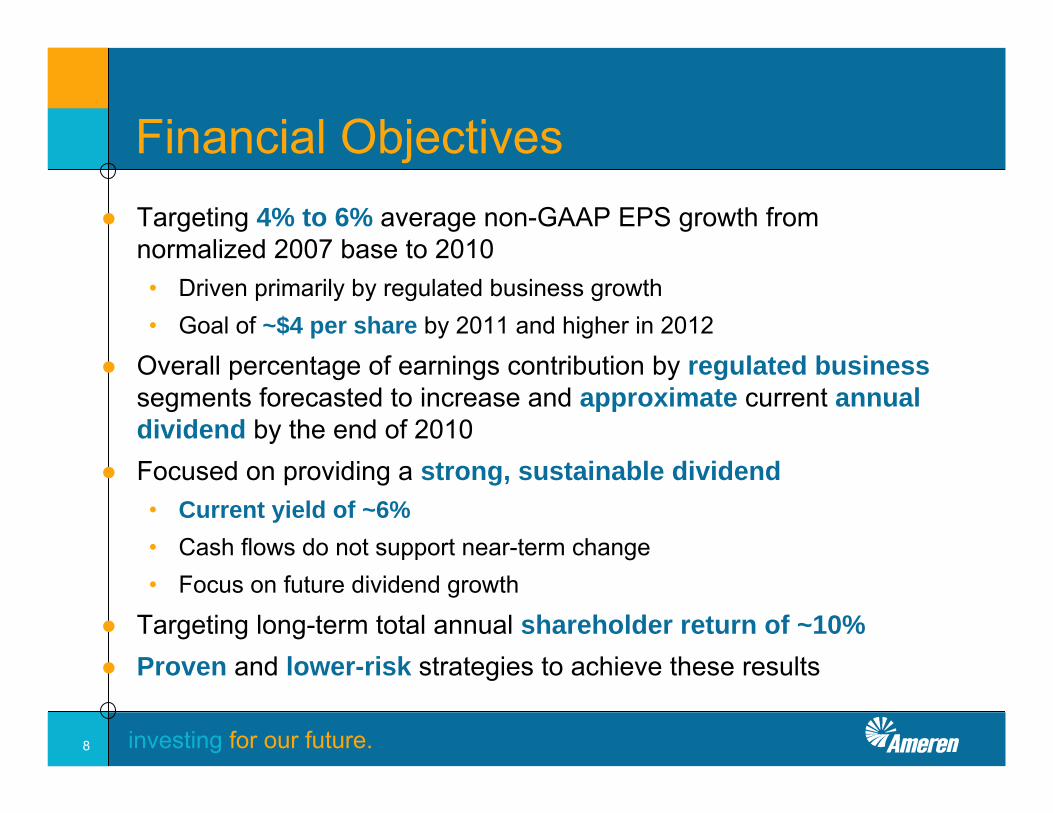
Financial Objectives● Targeting 4% to 6% average non-GAAP EPS growth from
normalized 2007 base to 2010• Driven primarily by regulated business growth• Goal of ~$4 per share by 2011 and higher in 2012
● Overall percentage of earnings contribution by regulated businesssegments forecasted to increase and approximate current annual dividend by the end of 2010
● Focused on providing a strong, sustainable dividend• Current yield of ~6%• Cash flows do not support near-term change• Focus on future dividend growth
● Targeting long-term total annual shareholder return of ~10%● Proven and lower-risk strategies to achieve these results
investing for our future.9
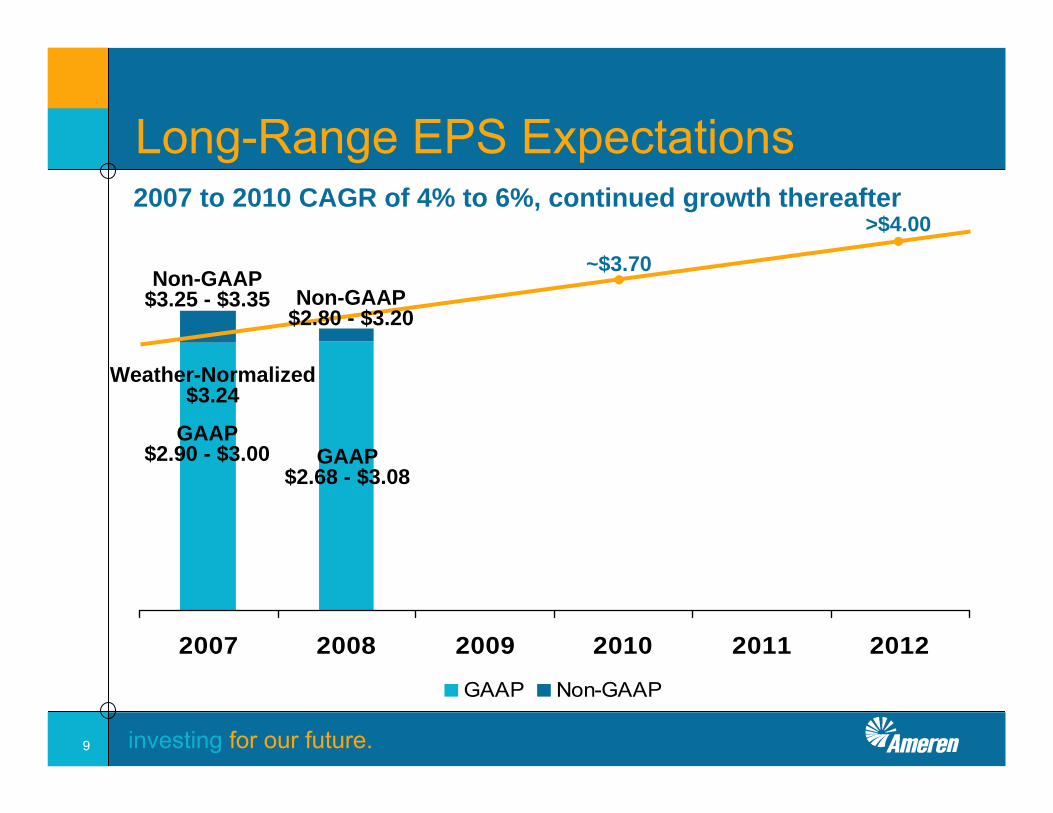
2007 2008 2009 2010 2011 2012
GAAP Non-GAAP
2007 to 2010 CAGR of 4% to 6%, continued growth thereafter
Non-GAAP$3.25 - $3.35
GAAP$2.90 - $3.00 GAAP
$2.68 - $3.08
Long-Range EPS Expectations
~$3.70
>$4.00
Weather-Normalized$3.24
Non-GAAP$2.80 - $3.20
investing for our future.10
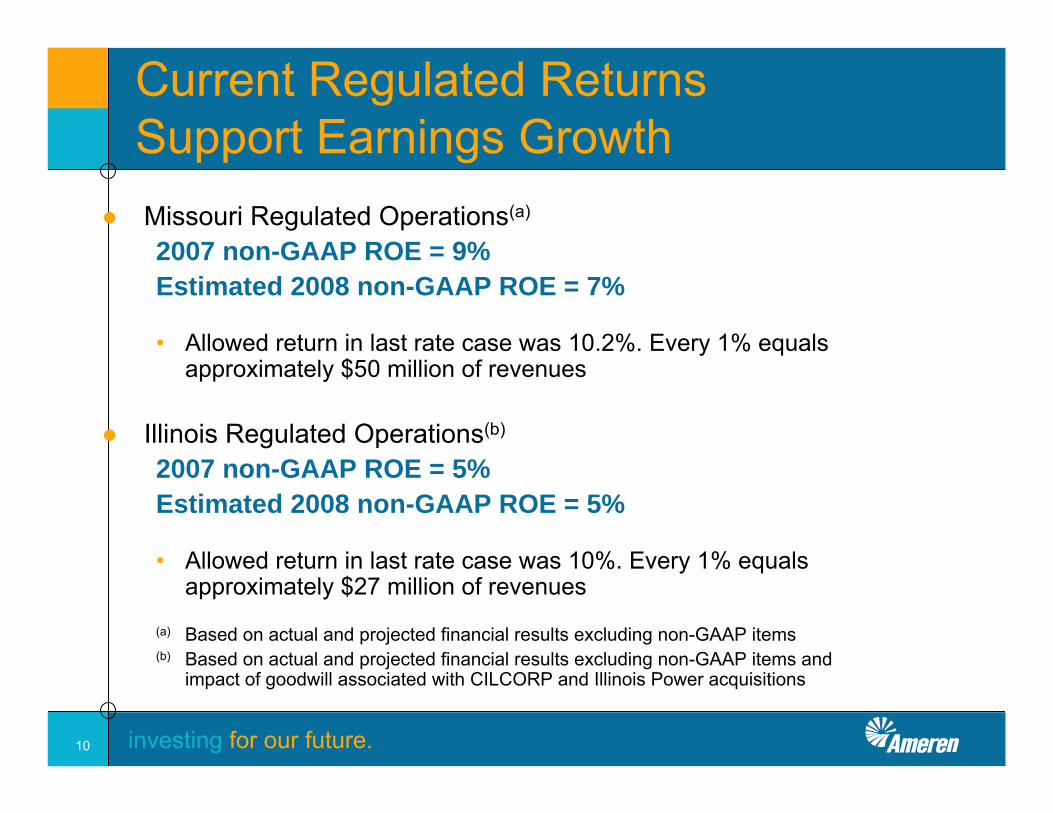
Current Regulated Returns Support Earnings Growth
● Missouri Regulated Operations(a)
2007 non-GAAP ROE = 9%Estimated 2008 non-GAAP ROE = 7%
• Allowed return in last rate case was 10.2%. Every 1% equals approximately $50 million of revenues
● Illinois Regulated Operations(b)
2007 non-GAAP ROE = 5%Estimated 2008 non-GAAP ROE = 5%
• Allowed return in last rate case was 10%. Every 1% equals approximately $27 million of revenues
(a) Based on actual and projected financial results excluding non-GAAP items(b) Based on actual and projected financial results excluding non-GAAP items and
impact of goodwill associated with CILCORP and Illinois Power acquisitions
investing for our future.11
$0
$1,000
$2,000
$3,000
$4,000
$5,000
$6,000
$7,000
$8,000
$9,000
2006 2007 2008 2009 2010 2011 2012
$0
$500
$1,000
$1,500
$2,000
$2,500
$3,000
$3,500
$4,000
$4,500
2006 2007 2008 2009 2010 2011 2012
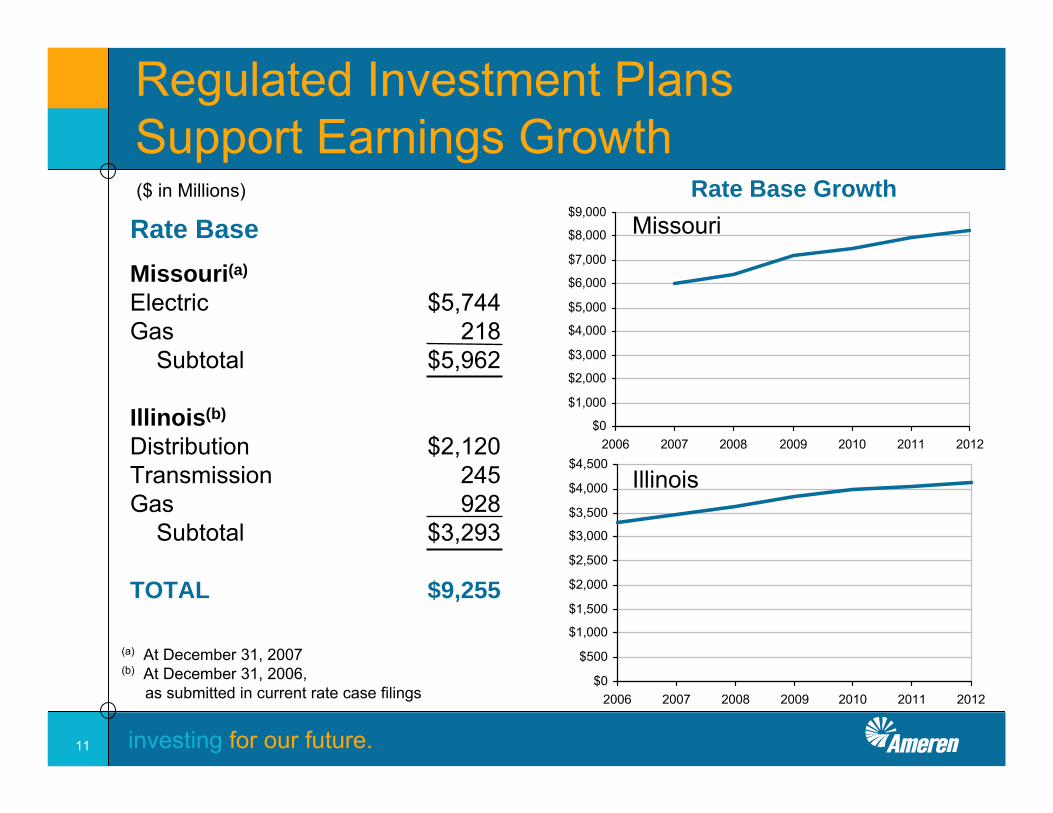
Regulated Investment Plans Support Earnings Growth
Rate Base
Illinois
Missouri
Missouri(a)
Electric $5,744Gas 218
Subtotal $5,962
Illinois(b)
Distribution $2,120Transmission 245Gas 928
Subtotal $3,293
TOTAL $9,255
(a) At December 31, 2007(b) At December 31, 2006,
as submitted in current rate case filings
Rate Base Growth($ in Millions)
investing for our future.12
Illinois Rate Filings
● Illinois electric and gas delivery service rate cases filed November 2, 2007• Decision by end of September 2008
● Requested revenue increase of $247 million($180 million electric, $67 million gas) • Electric: 11% ROE; 51% to 53% equity;
rate base = $2.1 billion• IP residential increase capped at 9.9% in year 1
• Gas 11% ROE; 51% to 53% equity;rate base = $0.9 billion
● Increase driven by higher costs and increased investment● Requested rider rate-making mechanisms for electric infrastructure
investment, gas decoupling and bad debt expenses
investing for our future.13
Missouri Rate Case Filing
● Expect to file next electric rate case in Q2 2008• Rate case process in Missouri is typically an 11-month process, but
can be settled earlier
● Increase driven by higher costs and increased investment
● Expect to seek implementation of fuel and environmental cost recovery mechanisms in next rate case
● Gas infrastructure cost recovery mechanism currently in place
investing for our future.14
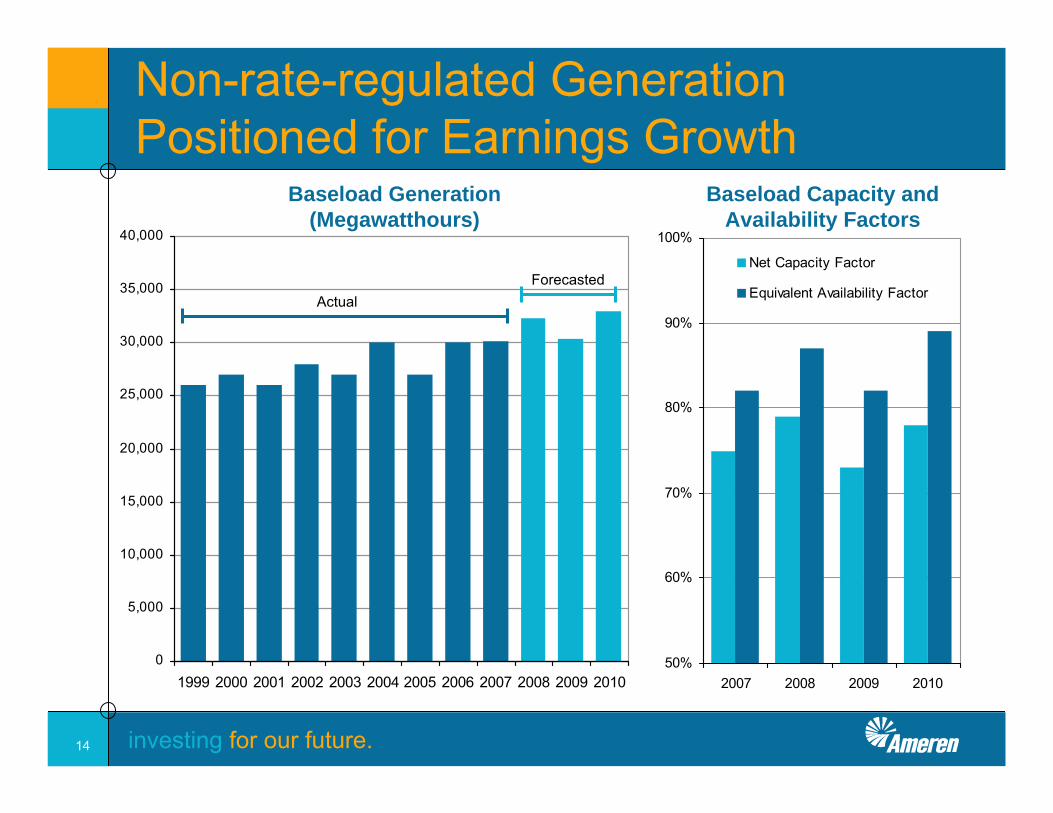
Non-rate-regulated Generation Positioned for Earnings Growth
0
5,000
10,000
15,000
20,000
25,000
30,000
35,000
40,000
1999 2000 2001 2002 2003 2004 2005 2006 2007 2008 2009 2010
Baseload Generation (Megawatthours)
50%
60%
70%
80%
90%
100%
2007 2008 2009 2010
Net Capacity Factor
Equivalent Availability Factor
Baseload Capacity and Availability Factors
ActualForecasted
investing for our future.15
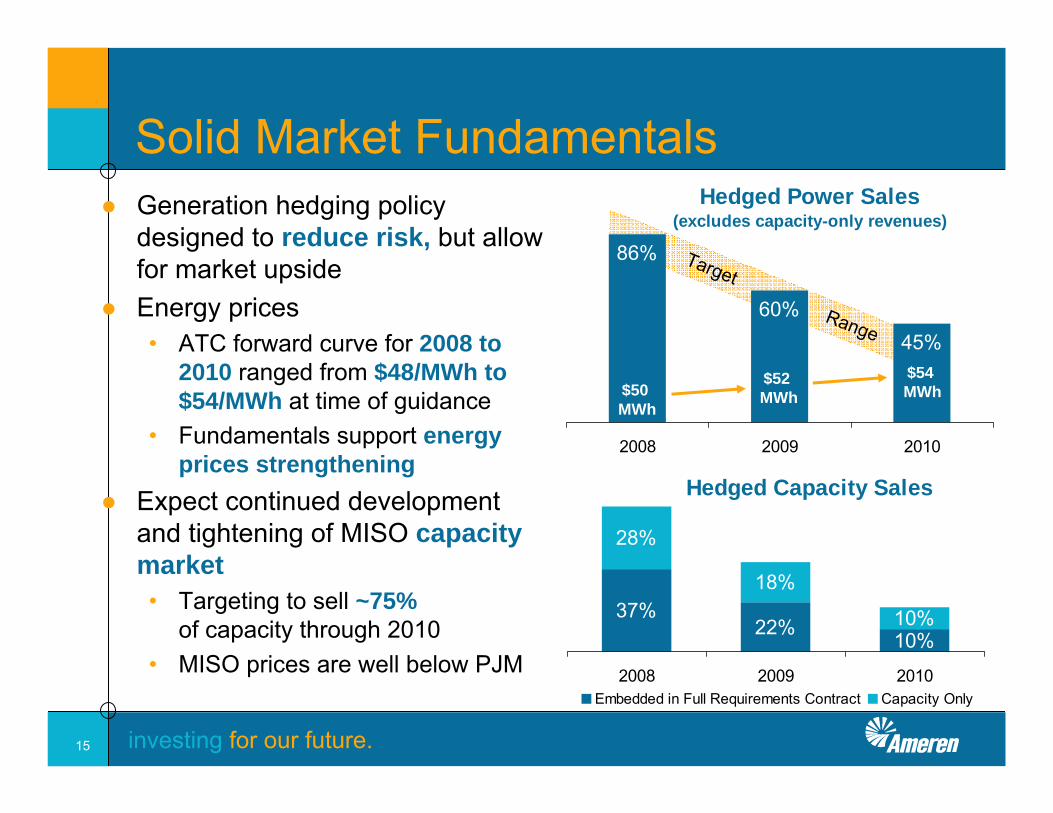
Hedged Power Sales (excludes capacity-only revenues)
60%45%
86%
2008 2009 2010
Solid Market Fundamentals● Generation hedging policy
designed to reduce risk, but allow for market upside
● Energy prices• ATC forward curve for 2008 to
2010 ranged from $48/MWh to $54/MWh at time of guidance
• Fundamentals support energy prices strengthening
● Expect continued development and tightening of MISO capacity market• Targeting to sell ~75%
of capacity through 2010• MISO prices are well below PJM
$50 MWh
Hedged Capacity Sales
28%
18%
10%37%10%22%
2008 2009 2010Embedded in Full Requirements Contract Capacity Only
$52 MWh
$54 MWh
Target
Range
investing for our future.16
Investment Highlights● Focused on the Basics - the generation of electricity,
and the delivery of electricity and natural gas● Strong EPS growth prospects through 2010 – continued growth
thereafter (goal of ~$4 per share by 2011 and higher in 2012)• 4% - 6% CAGR• Driven primarily by regulated business growth• Optimization of existing non-rate-regulated generation/potential tightening
of power markets● Strong, sustainable dividend
• Current yield of ~6%• Focused on future dividend growth
● Commitment to conservative financial management● Attractive, risk-adjusted long-term total return potential ● Strong underlying value/straight-forward strategy to deliver
shareholder value
investing for our future.17
Appendix

investing for our future.18
Ameren Segments
investing for our future.19
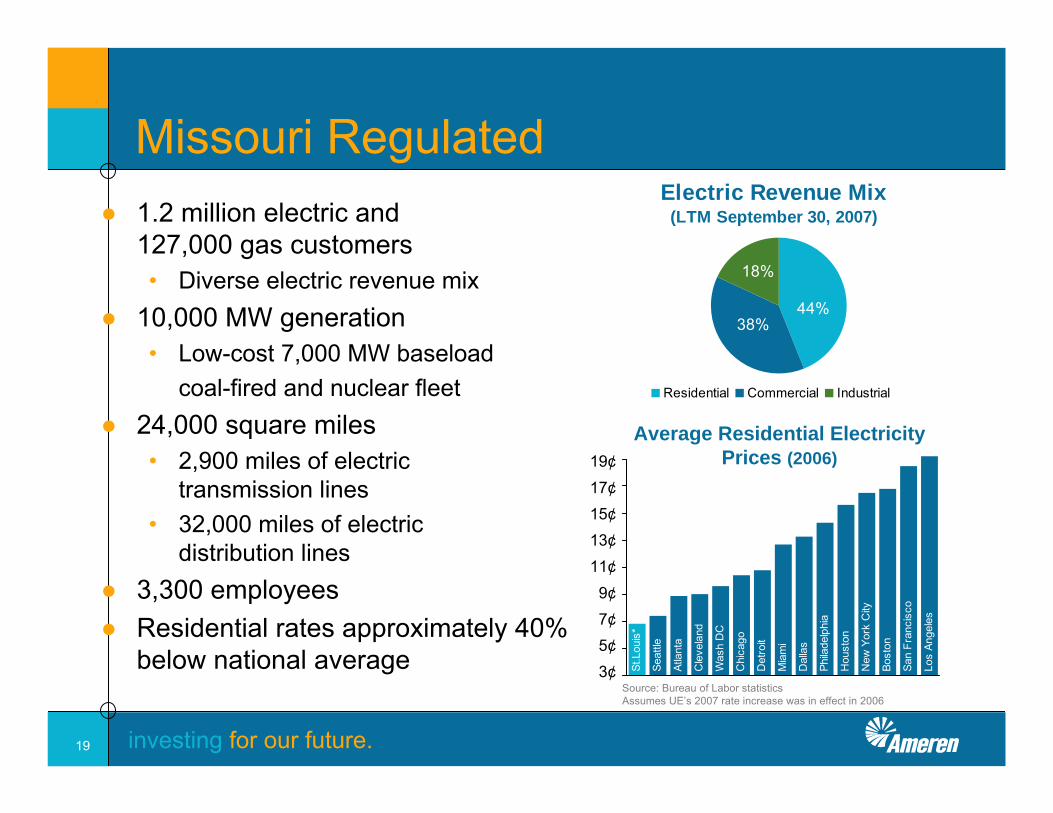
● 1.2 million electric and 127,000 gas customers • Diverse electric revenue mix
● 10,000 MW generation• Low-cost 7,000 MW baseload
coal-fired and nuclear fleet● 24,000 square miles
• 2,900 miles of electric transmission lines
• 32,000 miles of electric distribution lines
● 3,300 employees● Residential rates approximately 40%
below national average Atla
nta
Cle
vela
nd
Was
h D
C
Chi
cago
Det
roit
Mia
mi
Dal
las
Phila
delp
hia
Hou
ston
New
Yor
k C
ity
Bost
on
San
Fran
cisc
o
Los
Ange
les
Seat
tle
St.L
ouis
*
0.03
0.05
0.07
0.09
0.11
0.13
0.15
0.17
0.19
Electric Revenue Mix (LTM September 30, 2007)
44%38%
18%
Residential Commercial Industrial
Average Residential Electricity Prices (2006)
Source: Bureau of Labor statistics Assumes UE’s 2007 rate increase was in effect in 2006
Missouri Regulated
19¢17¢15¢13¢11¢9¢7¢5¢3¢
investing for our future.20
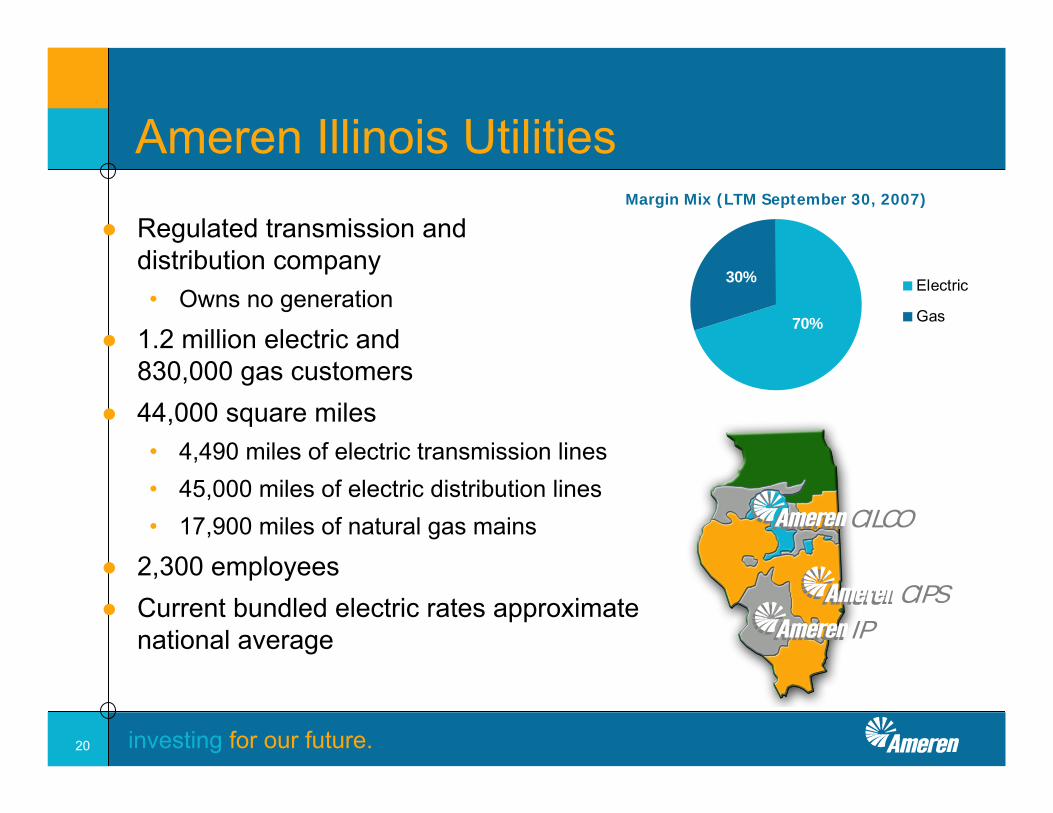
Margin Mix (LTM September 30, 2007)
70%
30% Electric
Gas
Ameren Illinois Utilities
● Regulated transmission and distribution company• Owns no generation
● 1.2 million electric and 830,000 gas customers
● 44,000 square miles• 4,490 miles of electric transmission lines• 45,000 miles of electric distribution lines• 17,900 miles of natural gas mains
● 2,300 employees● Current bundled electric rates approximate
national average
CILCO
CIPSIP
investing for our future.21
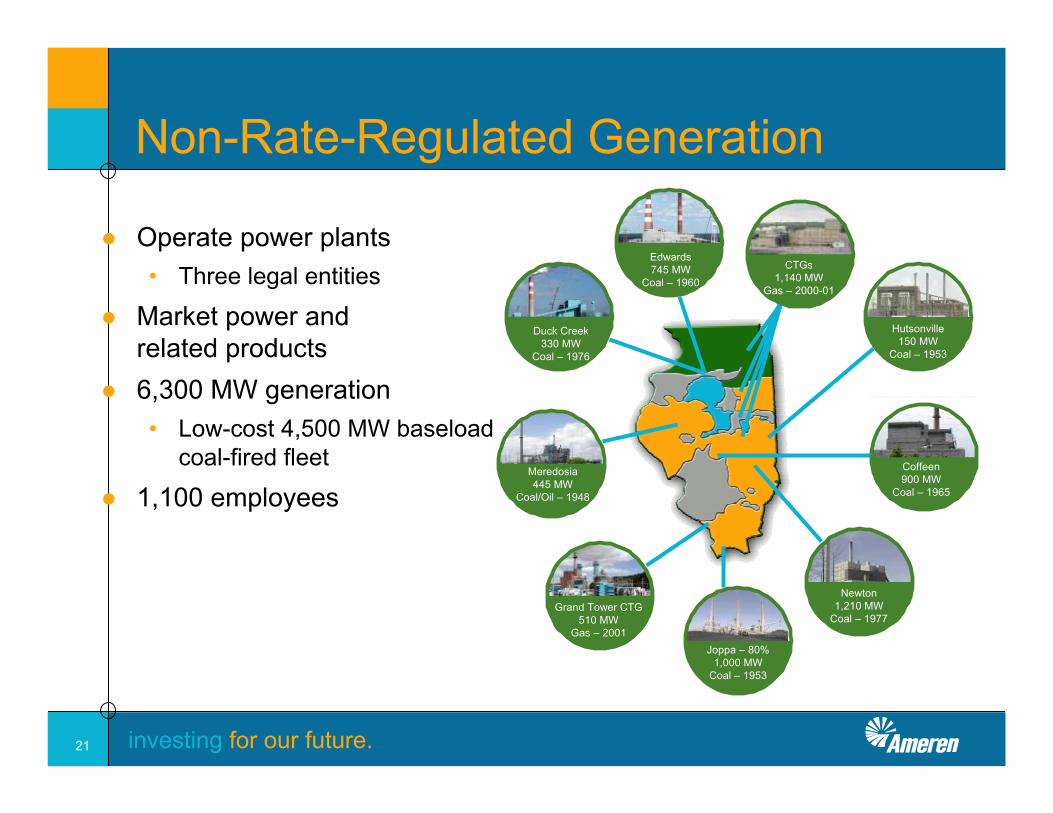
Non-Rate-Regulated Generation
● Operate power plants• Three legal entities
● Market power and related products
● 6,300 MW generation• Low-cost 4,500 MW baseload
coal-fired fleet
● 1,100 employees
Duck Creek330 MW
Coal – 1976
Edwards745 MW
Coal – 1960CTGs
1,140 MWGas – 2000-01
Hutsonville150 MW
Coal – 1953
Coffeen900 MW
Coal – 1965
Newton1,210 MW
Coal – 1977
Joppa – 80%1,000 MW
Coal – 1953
Grand Tower CTG510 MW
Gas – 2001
Meredosia445 MW
Coal/Oil – 1948

investing for our future.22
Earnings Guidance
investing for our future.23
Major 2008 AssumptionsMissouri Regulated Segment
● Electric rate case expected to be filed Q2-2008• No impact on 2008 earnings/regulatory lag
● Rising cost environment continues• Labor, materials, etc.• Fuel • Depreciation and financing costs
● Increased investment in rate base and operating expenses to improve reliability and environmental compliance
● Generation output of 51 million MWh (capacity factor ~83%)● Callaway nuclear plant refueling in Fall 2008 (25-30 days)● Normal weather and organic growth
investing for our future.24
Major 2008 AssumptionsIllinois Regulated Segment
● Electric and gas rate orders effective October 2008• Requested 11% ROE• Bad debt expense, electric infrastructure investment and gas decoupling rate
mechanisms approved
● Rising cost environment continues• Labor, materials, etc.• Depreciation and financing costs
● Increased investment in rate base and operating expenses to improve reliability
● Impact of Illinois electric settlement (5 cents per share) excluded from guidance
● Normal weather and organic growth
investing for our future.25
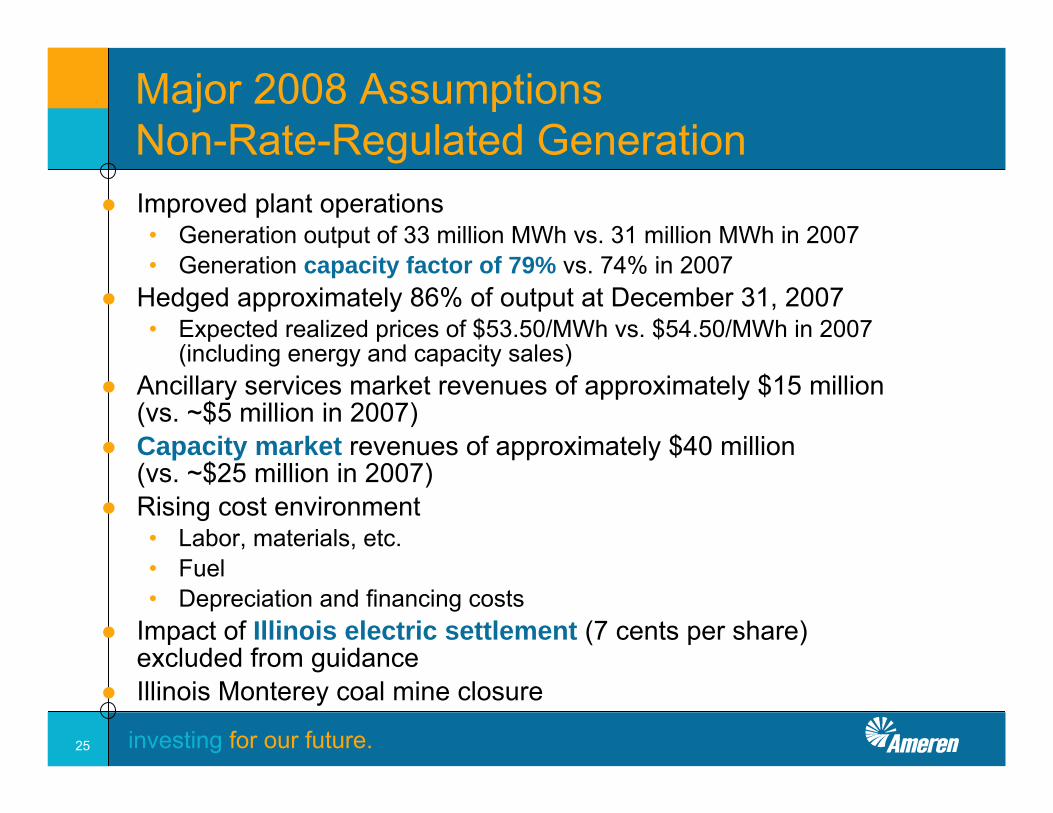
Major 2008 AssumptionsNon-Rate-Regulated Generation
● Improved plant operations • Generation output of 33 million MWh vs. 31 million MWh in 2007• Generation capacity factor of 79% vs. 74% in 2007
● Hedged approximately 86% of output at December 31, 2007• Expected realized prices of $53.50/MWh vs. $54.50/MWh in 2007
(including energy and capacity sales)● Ancillary services market revenues of approximately $15 million
(vs. ~$5 million in 2007)● Capacity market revenues of approximately $40 million
(vs. ~$25 million in 2007)● Rising cost environment
• Labor, materials, etc.• Fuel• Depreciation and financing costs
● Impact of Illinois electric settlement (7 cents per share) excluded from guidance
● Illinois Monterey coal mine closure
investing for our future.26
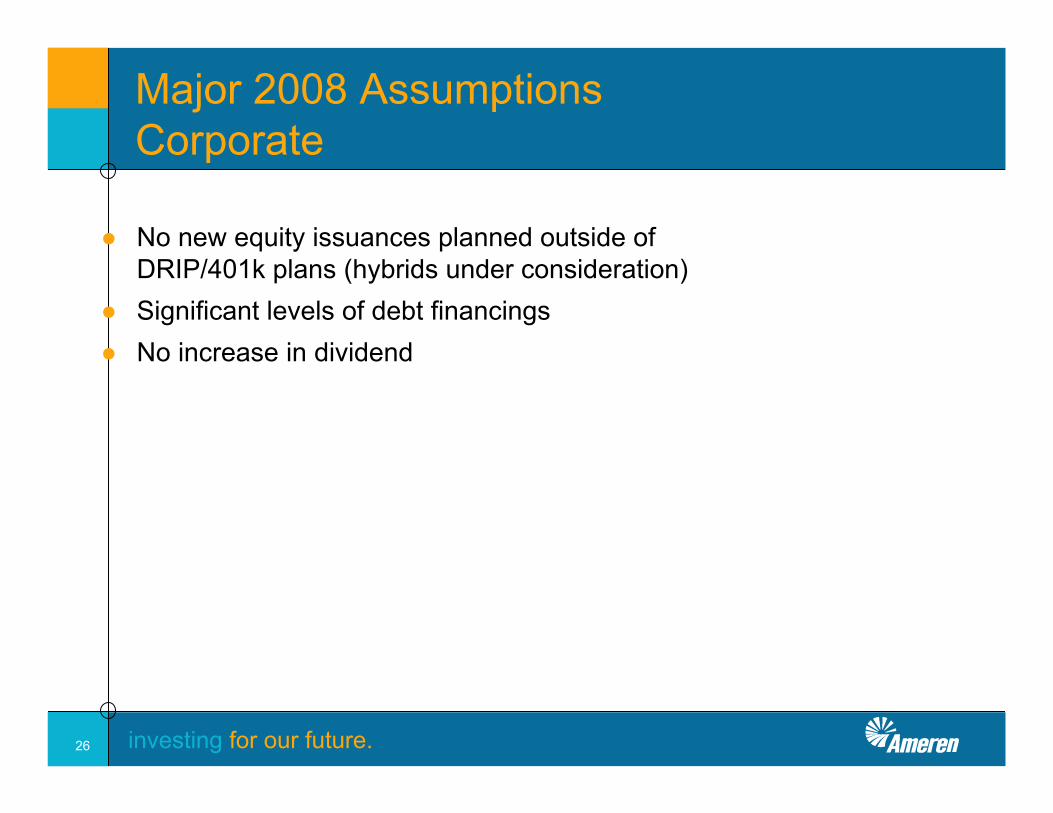
Major 2008 AssumptionsCorporate
● No new equity issuances planned outside of DRIP/401k plans (hybrids under consideration)
● Significant levels of debt financings● No increase in dividend
investing for our future.27
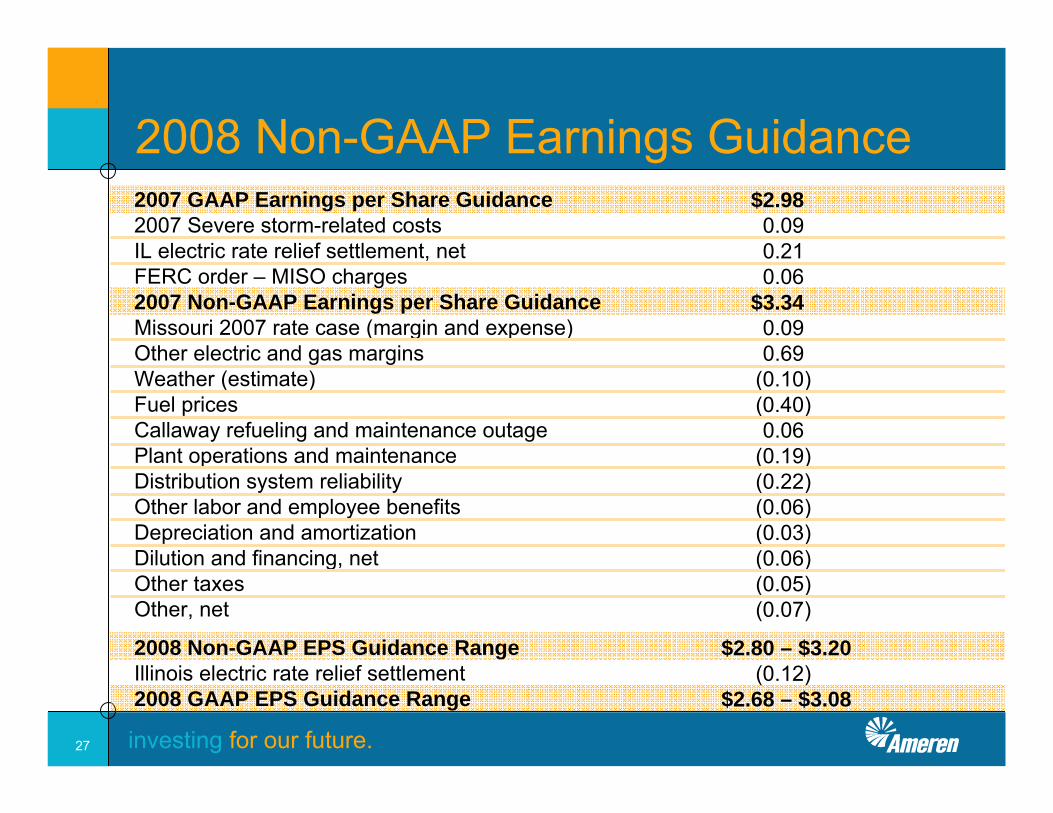
2007 GAAP Earnings per Share Guidance2007 Severe storm-related costsIL electric rate relief settlement, netFERC order – MISO charges2007 Non-GAAP Earnings per Share GuidanceMissouri 2007 rate case (margin and expense)Other electric and gas marginsWeather (estimate)Fuel pricesCallaway refueling and maintenance outagePlant operations and maintenanceDistribution system reliabilityOther labor and employee benefitsDepreciation and amortizationDilution and financing, netOther taxesOther, net
2008 Non-GAAP EPS Guidance RangeIllinois electric rate relief settlement2008 GAAP EPS Guidance Range
$2.980.090.210.06
$3.340.090.69
(0.10) (0.40)0.06
(0.19)(0.22)(0.06)(0.03)(0.06)(0.05)(0.07)
$2.80 – $3.20(0.12)
$2.68 – $3.08
2008 Non-GAAP Earnings Guidance
investing for our future.28
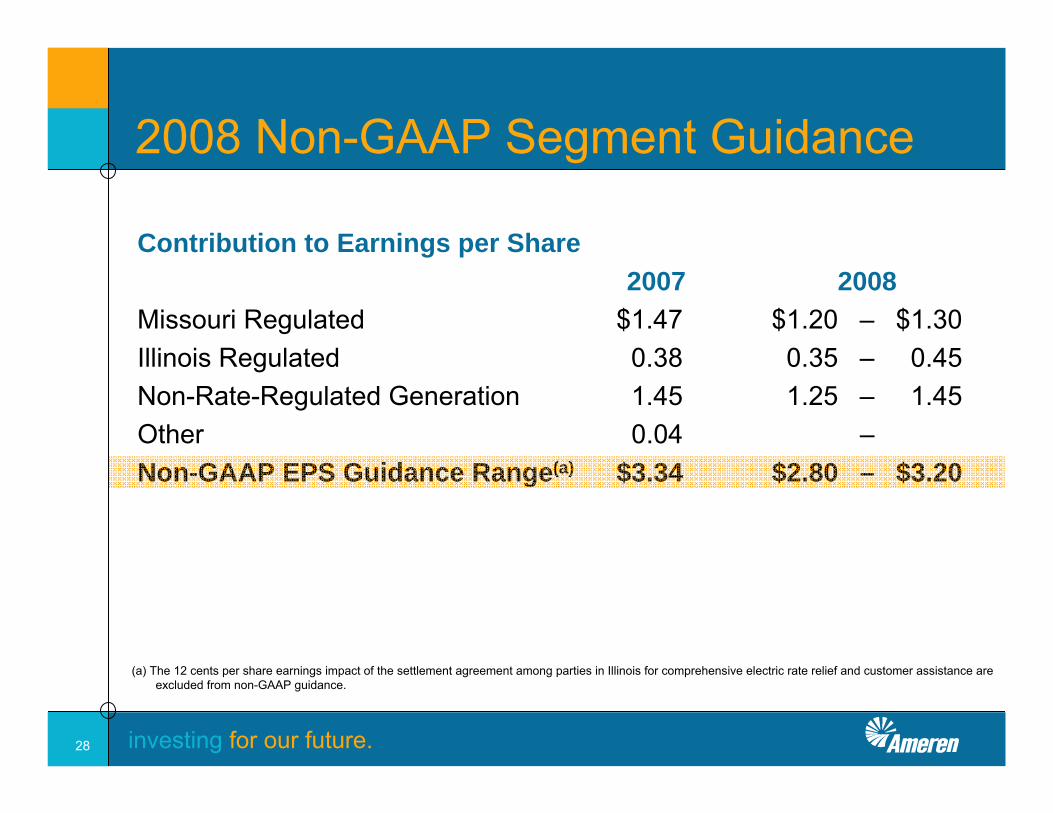
(a) The 12 cents per share earnings impact of the settlement agreement among parties in Illinois for comprehensive electric rate relief and customer assistance are excluded from non-GAAP guidance.
2008 Non-GAAP Segment Guidance
Contribution to Earnings per Share2007 2008
Missouri Regulated $1.47 $1.20 – $1.30Illinois Regulated 0.38 0.35 – 0.45Non-Rate-Regulated Generation 1.45 1.25 – 1.45Other 0.04 –Non-GAAP EPS Guidance Range(a) $3.34 $2.80 – $3.20
investing for our future.29
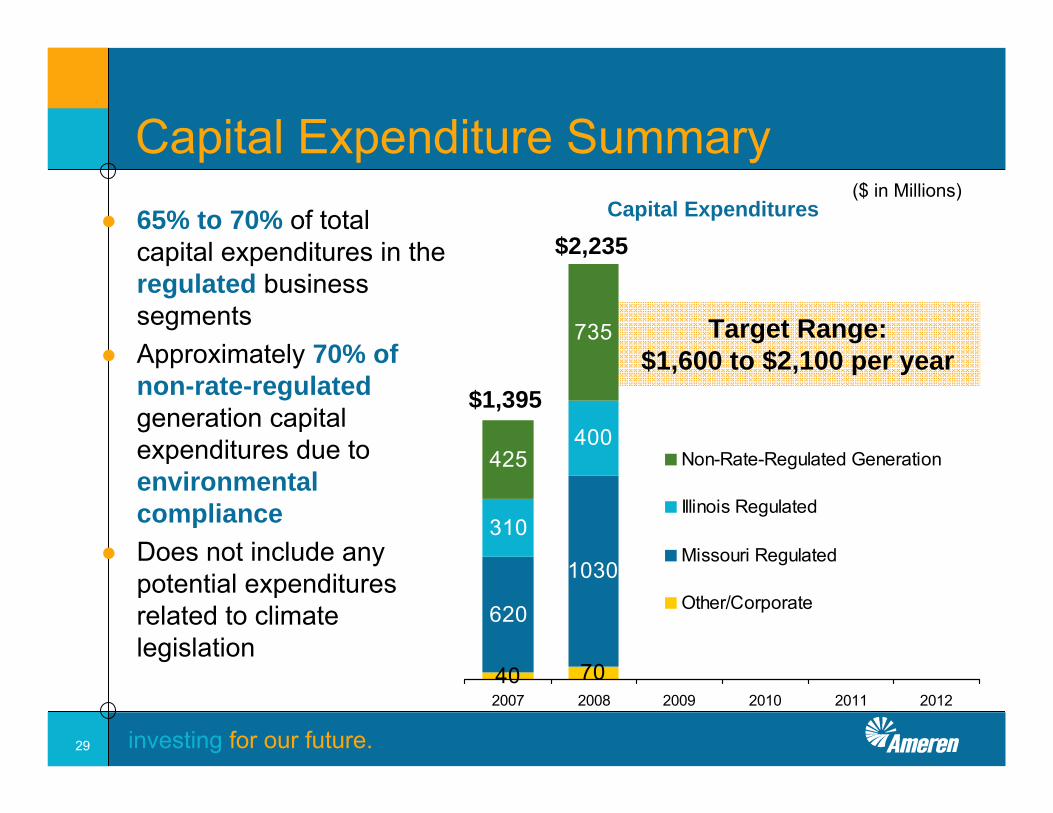
40 70
620
1030
310
400425
735
2007 2008 2009 2010 2011 2012
Non-Rate-Regulated Generation
Illinois Regulated
Missouri Regulated
Other/Corporate
Capital Expenditure Summary● 65% to 70% of total
capital expenditures in the regulated business segments
● Approximately 70% of non-rate-regulatedgeneration capital expenditures due to environmental compliance
● Does not include any potential expenditures related to climate legislation
Capital Expenditures
Target Range:$1,600 to $2,100 per year
$2,235
$1,395
($ in Millions)
investing for our future.30
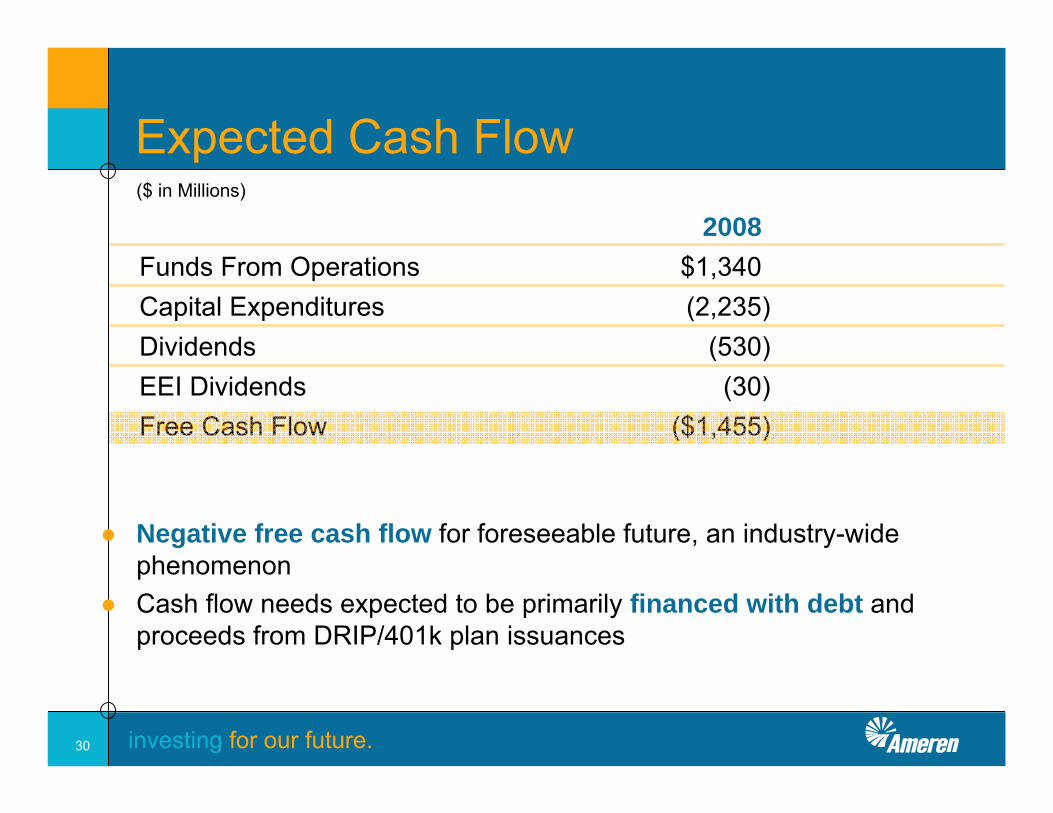
● Negative free cash flow for foreseeable future, an industry-wide phenomenon
● Cash flow needs expected to be primarily financed with debt and proceeds from DRIP/401k plan issuances
2008Funds From Operations $1,340Capital Expenditures (2,235)Dividends (530)EEI Dividends (30)Free Cash Flow ($1,455)
Expected Cash Flow($ in Millions)
investing for our future.31
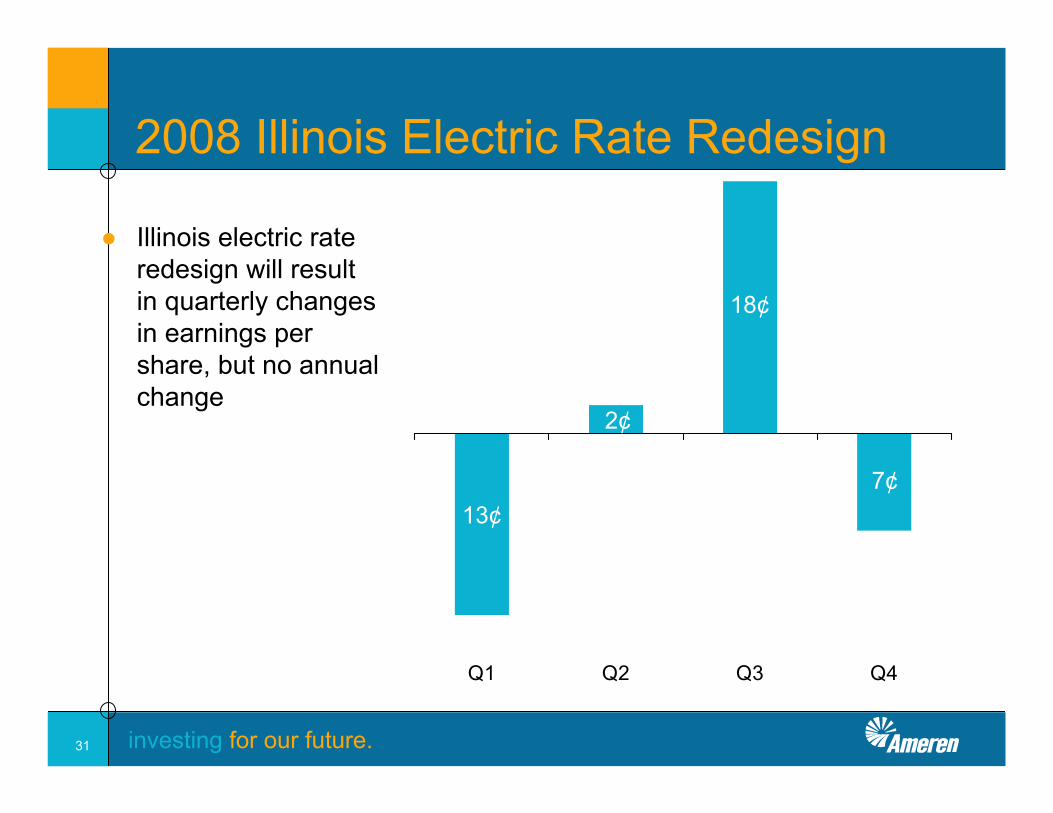
Q1 Q2 Q3 Q4
2008 Illinois Electric Rate Redesign
● Illinois electric rate redesign will result in quarterly changes in earnings per share, but no annual change
13¢
2¢
18¢
7¢
investing for our future.32
Post-2008 Commentary
● Rising cost environment continues (e.g. labor, materials, fuel, depreciation, financing)
● Regulatory lag will persist, but will be less significant over time● Rate cases
• Will be more frequent• Proposed recovery mechanisms will be granted• Granted fair ROEs
● No Callaway refueling in 2009 and 2012● New baseload plant decision for Missouri regulated operations
will need to be made• Constructive regulatory framework will need to be in place
investing for our future.33
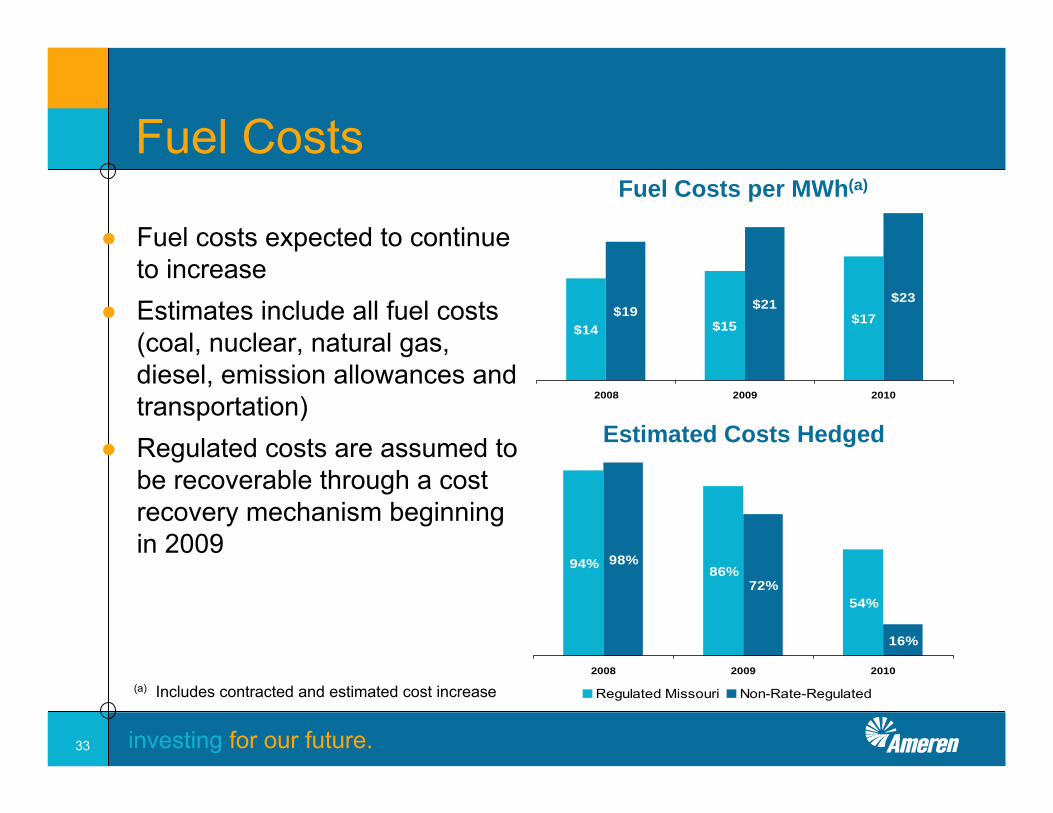
$14 $15 $17$19 $21 $23
2008 2009 2010
Fuel Costs
● Fuel costs expected to continue to increase
● Estimates include all fuel costs (coal, nuclear, natural gas, diesel, emission allowances and transportation)
● Regulated costs are assumed to be recoverable through a cost recovery mechanism beginning in 2009
(a) Includes contracted and estimated cost increase
Fuel Costs per MWh(a)
94% 86%
54%
98%
72%
16%
2008 2009 2010
Regulated Missouri Non-Rate-Regulated
Estimated Costs Hedged
investing for our future.34
Post-2008 Commentary
● Improved non-rate-regulated generation plant performance● 2 million MWhs of below-market wholesale contracts at ~$33/MWh
expire in late 2008● Fundamentals point to more robust energy and capacity prices
compared to current forward curves● No impact from climate legislation● No new equity issuances currently planned through 2010, excluding
DRIP/401k plans (hybrids under consideration)● Focused on strong, sustainable dividend and growing dividend in
the future

investing for our future.35
Illinois Settlement
investing for our future.36
Illinois Electric Settlement
● Constructively resolved significant legislative, regulatory and legal uncertainties• All major parties participated in settlement
● Provides stability to Illinois electric market and provides agreed path for power procurement
● Significant disincentives for additional legislative action• Rate relief programs would terminate• Financial swap agreements could be terminated or renegotiated• Strong legal position
● No prohibition on ability to file for delivery service rate increases
investing for our future.37
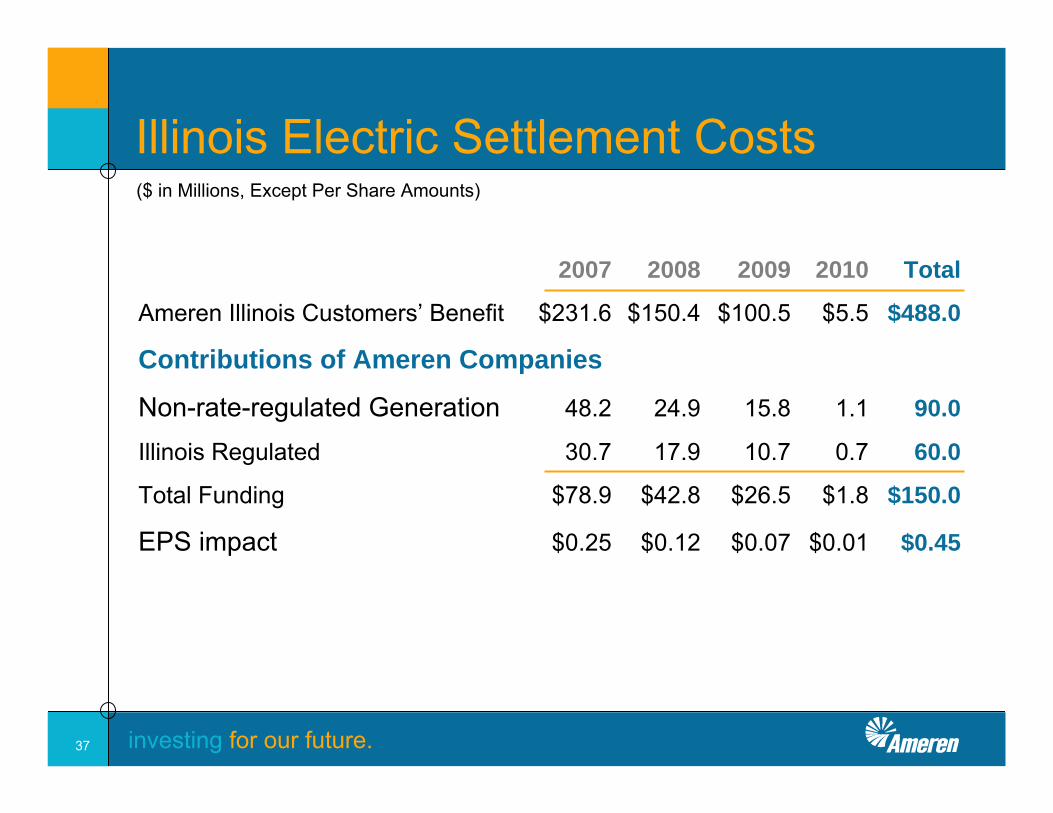
2007 2008 2009 2010 Total
Ameren Illinois Customers’ Benefit $231.6 $150.4 $100.5 $5.5 $488.0
Contributions of Ameren Companies
Non-rate-regulated Generation 48.2 24.9 15.8 1.1 90.0
Illinois Regulated 30.7 17.9 10.7 0.7 60.0
Total Funding $78.9 $42.8 $26.5 $1.8 $150.0
EPS impact $0.25 $0.12 $0.07 $0.01 $0.45
Illinois Electric Settlement Costs($ in Millions, Except Per Share Amounts)
investing for our future.38
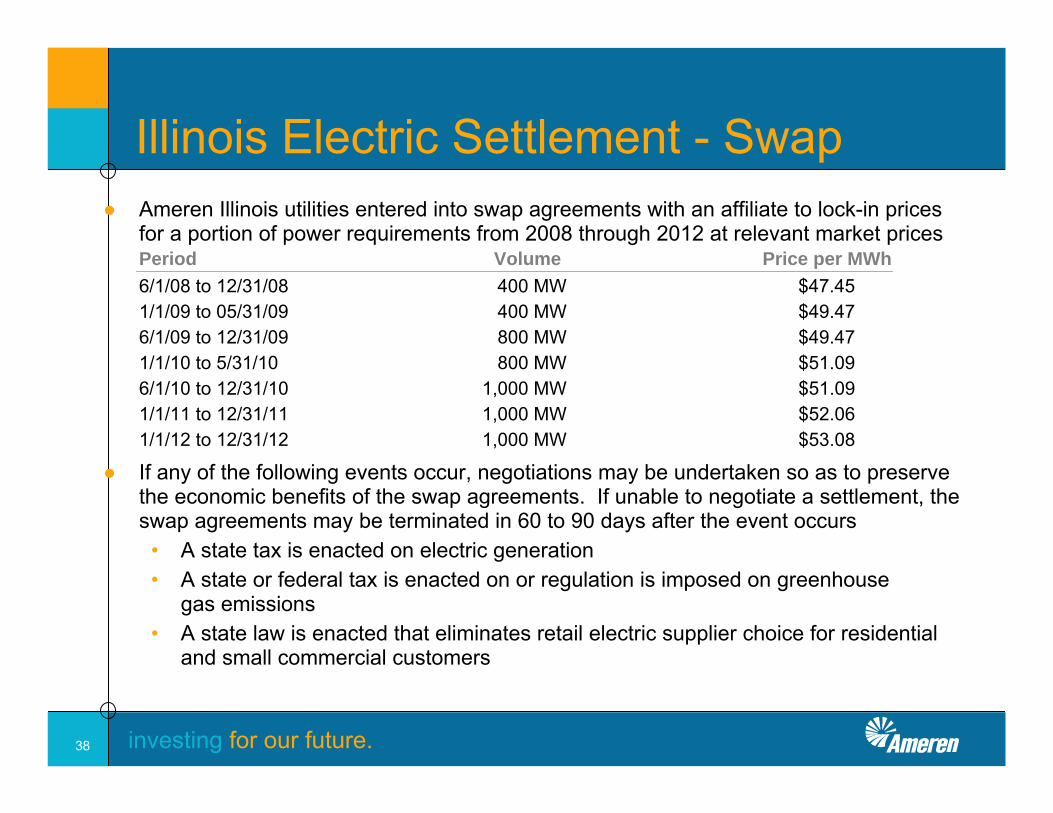
Illinois Electric Settlement - Swap● Ameren Illinois utilities entered into swap agreements with an affiliate to lock-in prices
for a portion of power requirements from 2008 through 2012 at relevant market prices
6/1/08 to 12/31/08 400 MW $47.451/1/09 to 05/31/09 400 MW $49.476/1/09 to 12/31/09 800 MW $49.471/1/10 to 5/31/10 800 MW $51.096/1/10 to 12/31/10 1,000 MW $51.091/1/11 to 12/31/11 1,000 MW $52.061/1/12 to 12/31/12 1,000 MW $53.08
● If any of the following events occur, negotiations may be undertaken so as to preserve the economic benefits of the swap agreements. If unable to negotiate a settlement, the swap agreements may be terminated in 60 to 90 days after the event occurs
• A state tax is enacted on electric generation• A state or federal tax is enacted on or regulation is imposed on greenhouse
gas emissions• A state law is enacted that eliminates retail electric supplier choice for residential
and small commercial customers
Period Volume Price per MWh
investing for our future.39
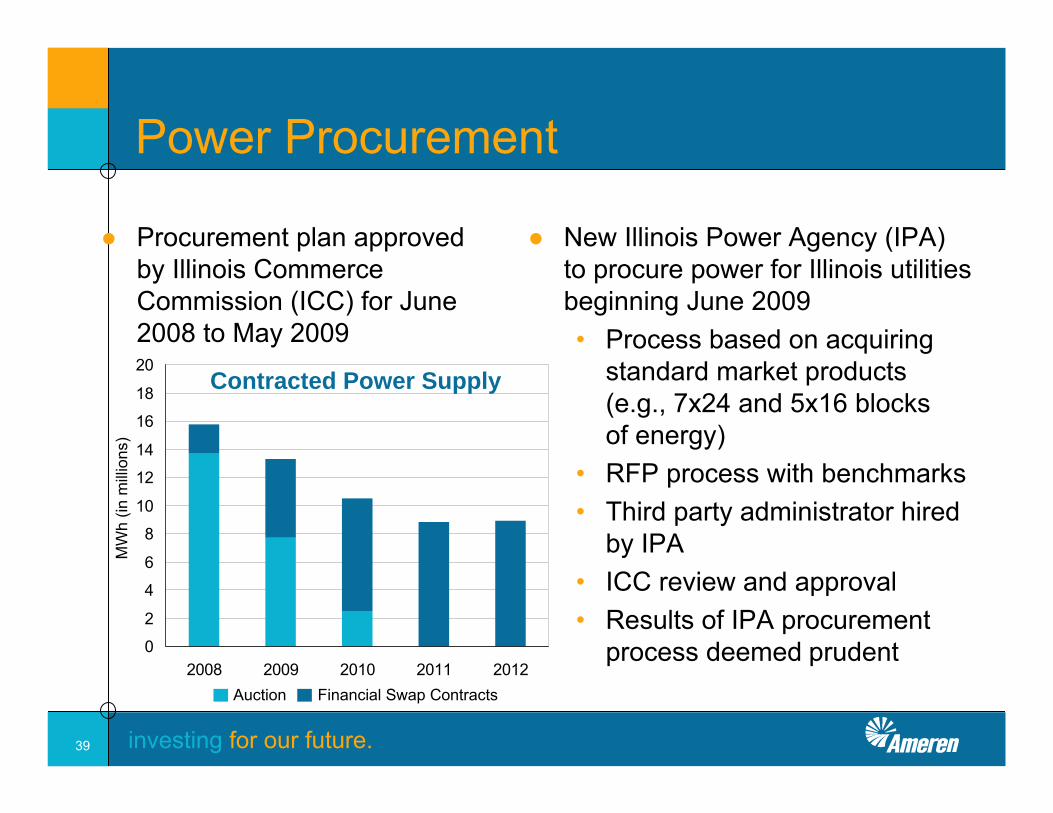
● Procurement plan approved by Illinois Commerce Commission (ICC) for June 2008 to May 2009
0
2
4
6
8
10
12
14
16
18
20
2008 2009 2010 2011 2012
MW
h (in
milli
ons)
Power Procurement
● New Illinois Power Agency (IPA) to procure power for Illinois utilities beginning June 2009• Process based on acquiring
standard market products (e.g., 7x24 and 5x16 blocks of energy)
• RFP process with benchmarks• Third party administrator hired
by IPA• ICC review and approval• Results of IPA procurement
process deemed prudentAuction Financial Swap Contracts
Contracted Power Supply
investing for our future.40
References
investing for our future.41
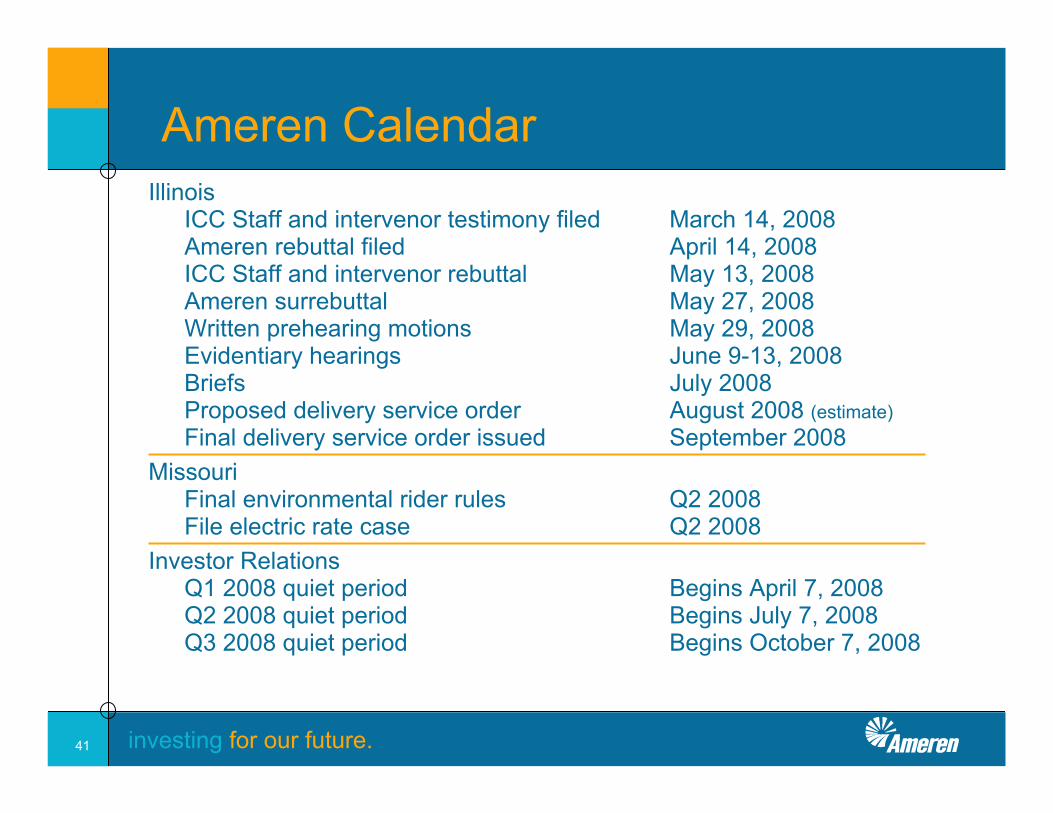
Ameren CalendarIllinois
ICC Staff and intervenor testimony filed March 14, 2008Ameren rebuttal filed April 14, 2008ICC Staff and intervenor rebuttal May 13, 2008Ameren surrebuttal May 27, 2008Written prehearing motions May 29, 2008Evidentiary hearings June 9-13, 2008Briefs July 2008Proposed delivery service order August 2008 (estimate)Final delivery service order issued September 2008
MissouriFinal environmental rider rules Q2 2008File electric rate case Q2 2008
Investor RelationsQ1 2008 quiet period Begins April 7, 2008Q2 2008 quiet period Begins July 7, 2008Q3 2008 quiet period Begins October 7, 2008
investing for our future.42
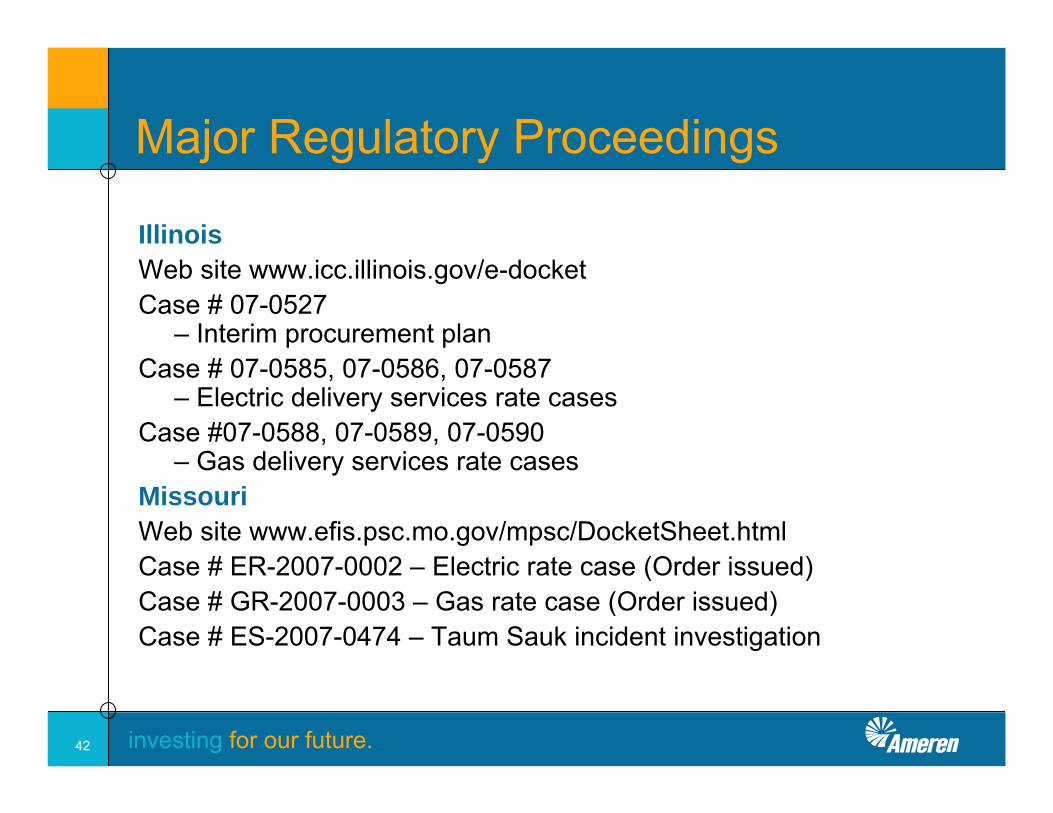
Major Regulatory Proceedings
IllinoisWeb site www.icc.illinois.gov/e-docketCase # 07-0527
– Interim procurement planCase # 07-0585, 07-0586, 07-0587
– Electric delivery services rate casesCase #07-0588, 07-0589, 07-0590
– Gas delivery services rate casesMissouriWeb site www.efis.psc.mo.gov/mpsc/DocketSheet.htmlCase # ER-2007-0002 – Electric rate case (Order issued)Case # GR-2007-0003 – Gas rate case (Order issued)Case # ES-2007-0474 – Taum Sauk incident investigation
investing for our future.43
Investor Relations Contacts
● Bruce Steinke 314-554-2574• Vice President & Controller [email protected]
Manager – Investor Relations
● Theresa Nistendirk 314-206-0693• Managing Supervisor, [email protected]
Investor Relations