Ameren Illinois Market Potential Study -...
30
Ameren Illinois Market Potential Study Study Overview and Preliminary Residential Potential Estimates October 27, 2015
Transcript of Ameren Illinois Market Potential Study -...

Ameren Illinois Market Potential Study Study Overview and Preliminary Residential Potential Estimates
October 27, 2015

2 PRELIMINARY
Topics
• Introductions • Study Objectives • Overview of Analysis Approach • Preliminary Results for the Residential Sector
• Customer surveys • Market characterization • Baseline projection • Potential estimates

3 PRELIMINARY
Recap of Study Objectives
• The focus of this Study is to assess: Traditional end-use energy efficiency potential Behavioral energy efficiency potential including Home Energy Reports & Demand-side
Rates Combined heat and power (CHP) potential in the C&I sectors
• The Study: Covers both electric and natural gas end uses Assesses the technical potential, economic potential, maximum achievable potential
(MAP), and realistic achievable potential (RAP) in each of the residential, commercial, and industrial sectors for the Ameren Illinois service area Identifies all cost-effective measures both at the measure and program levels Satisfies planning requirements with respect to Illinois DSM-related legislation for Plan
Years 10 through 12

4 PRELIMINARY Baseline forecasting
Overview of AEG Analysis Approach
5 PRELIMINARY
Recap of Market Research Approach
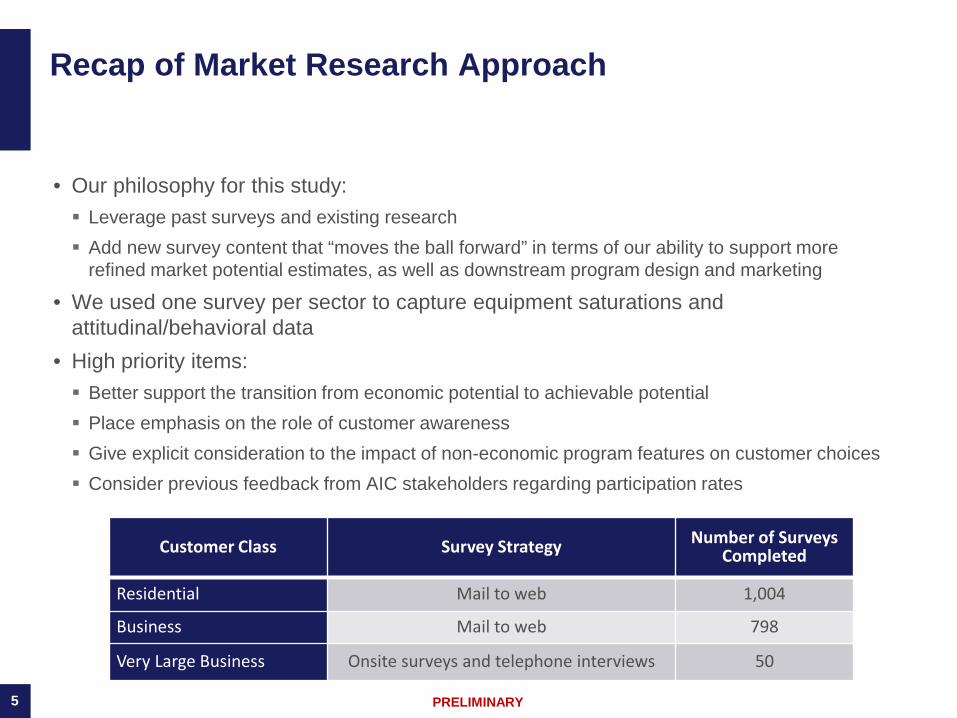
• Our philosophy for this study: Leverage past surveys and existing research Add new survey content that “moves the ball forward” in terms of our ability to support more
refined market potential estimates, as well as downstream program design and marketing
• We used one survey per sector to capture equipment saturations and attitudinal/behavioral data
• High priority items: Better support the transition from economic potential to achievable potential Place emphasis on the role of customer awareness Give explicit consideration to the impact of non-economic program features on customer choices Consider previous feedback from AIC stakeholders regarding participation rates
Customer Class Survey Strategy Number of Surveys
Completed
Residential Mail to web 1,004
Business Mail to web 798
Very Large Business Onsite surveys and telephone interviews 50

Saturation Survey Results and Residential Baseline Characterization

7 PRELIMINARY
Residential Customer Survey Saturation highlights
• The latest saturation survey shows a decline in incandescent lamps and an increase in both CFLs and LEDs
• Electronics saturations have changed: • Heavy reductions in desktop PCs and cable set top boxes • Shift toward smaller, mobile devices such as tablets and smart phones • “Cord cutting,” where more consumers are using streaming, internet-based services rather than
cable, DVDs, DVRs, and the like
• Approximately 1% of Ameren Illinois residential customers have a Solar PV system installed and 1% have a plug-in Electric Vehicle
Home Size Compact
fluorescent lamps (CFLs)
Conventional / Incandescent
lamps
LED screw-in
Tube fluorescent
lamps
Halogen lamps
Panel / Tube LEDS
Other TOTAL
Less than 1,000 sq. ft. 51% 31% 6% 6% 4% 0% 2% 100%
1,000-1,999 sq. ft. 42% 30% 11% 10% 5% 1% 1% 100%
2,000-2,999 sq. ft. 39% 31% 14% 9% 5% 1% 1% 100%
3,000+ sq. ft. 38% 31% 15% 10% 4% 1% 1% 100%
All Homes 39% 29% 12% 9% 4% 1% 3% 100%
Distribution of Residential Indoor Lighting Technologies

8 PRELIMINARY
Segment Number of Customers
Electricity Sales
(GWh)
% of Total Usage
Avg. Use / Customer
(kWh)
Peak Demand Summer (MW)
Peak Demand Winter (MW)
Single Family – Non-Elec Heat, Non-Low Income 463,394 5,232 45% 11,290 1,588 1,130 Multi Family– Non-Elec Heat, Non-Low Income 41,784 325 3% 7,776 72 88 Single Family - Elec Heat, Non-Low Income 93,187 1,669 14% 17,907 267 558 Multi Family - Elec Heat, Non-Low Income 23,431 229 2% 9,784 32 84 Single Family - Low Income, Non-Elec Heat 258,192 2,475 21% 9,586 783 498 Multi Family - Low Income, Non-Elec Heat 69,582 459 4% 6,603 148 107 Single Family - Low Income, Elec Heat 46,114 728 6% 15,796 112 238 Multi Family - Low Income, Elec Heat 66,960 578 5% 8,630 79 205 Total 1,062,644 11,695 100% 11,006 3,082 2,908
Residential Market Characterization – Electricity
SF - NEH, NLI 44%
MF - NEH, NLI 4%
SF - EH, NLI 9%
MF - EH, NLI 2%
SF - LI, NEH 24%
MF - LI, NEH 7%
SF - LI, EH 4%
MF - LI, EH 6%
# Customers
SF - NEH, NLI 45%
MF - NEH, NLI 3%
SF - EH, NLI 14% MF - EH, NLI
2%
SF - LI, NEH 21%
MF - LI, NEH 4%
SF - LI, EH 6%
MF - LI, EH 5%
Electricity Sales (GWh)

9 PRELIMINARY
Annual Consumption by End Use (%) Annual Household Intensity by End Use (kWh/HH)
-
2,000
4,000
6,000
8,000
10,000
12,000
14,000
16,000
18,000
20,000
SingleFamily
MultiFamily
SingleFamily
MultiFamily
SingleFamily
MultiFamily
SingleFamily
MultiFamily
Electric Heat Low Income Low Income -Electric Heat
Annu
al E
nerg
y In
tens
ity (k
Wh/
HH)
Cooling
Heating
Water Heating
Interior Lighting
Exterior Lighting
Appliances
Electronics
Miscellaneous
Cooling 18%
Heating 10%
Water Heating 8%
Interior Lighting
9% Exterior Lighting
3%
Appliances 27%
Electronics 10%
Miscellaneous 15%
Residential Market Profile – Electricity • Lighting has become a smaller share of total use, reflecting EISA standard and customer
adoption of CFLs and, increasingly, LEDs • Electronics has become a smaller share of total use as well as customers shift away from
desktop computers to smaller devices • On a weather-adjusted basis, average use per customer is about 4% lower compared to
last study (base year 2011)
NEH, NLI NLI NEH

10 PRELIMINARY
Residential Baseline Electricity Projection
• The study’s baseline projection aligns with Ameren Illinois’ most recent load forecast • The baseline projection includes effects of appliance standards, EISA and naturally
occurring efficiency • Baseline projection decreases by 3.4% from 2015 to 2026, average growth of -0.3% per
year
0
2,000
4,000
6,000
8,000
10,000
12,000
14,000
2015 2017 2019 2021 2023 2025
Annual Use (GWh)
Cooling
Heating
Water Heating
Interior Lighting
Exterior Lighting
Appliances
Electronics
Miscellaneous

11 PRELIMINARY
Residential Market Profile – Natural Gas
Annual Consumption by End Use (%) Annual Household Intensity by End Use (kWh/HH)
Segment Number of Customers
Natural Gas Sales
(MMtherms)
% of Total Usage
Avg. Use / Customer (therms)
Single Family – Non-Elec Heat, Non-Low Income 325,787 379 57% 1,165 Multi Family– Non-Elec Heat, Non-Low Income 29,376 24 4% 807 Single Family - Elec Heat, Non-Low Income 65,515 15 2% 224 Multi Family - Elec Heat, Non-Low Income 16,473 2 0% 130 Single Family - Low Income, Non-Elec Heat 181,521 196 29% 1,078 Multi Family - Low Income, Non-Elec Heat 48,919 41 6% 838 Single Family - Low Income, Elec Heat 32,420 7 1% 205 Multi Family - Low Income, Elec Heat 47,076 7 1% 144 Total 747,088 670 100% 897
-
200
400
600
800
1,000
1,200
1,400
SingleFamily
MultiFamily
SingleFamily
MultiFamily
SingleFamily
MultiFamily
SingleFamily
MultiFamily
Electric Heat Low Income Low Income -Electric Heat
Annu
al E
nerg
y In
tens
ity (k
Wh/
HH)
Heating
Water Heating
Appliances
Miscellaneous
Heating 73%
Water Heating
17%
Appliances 4%
Miscellaneous
6%
NEH, NLI NLI NEH

12 PRELIMINARY
Residential Baseline Projection – Natural Gas
• Baseline projection aligns with Ameren Illinois’ most recent load forecast • It includes effects of appliance standards and naturally occurring efficiency • Baseline load decreases by 0.5% from 2015 to 2026
-
100
200
300
400
500
600
2015 2017 2019 2021 2023 2025
Annual Use (MMTherm)
Heating
Water Heating
Appliances
Miscellaneous

Preliminary Residential Potential Estimates for Electricity

14 PRELIMINARY
The Levels of Potential
• Technical & economic potential are theoretical constructs. Savings cannot be realized in actual markets. • Achievable potential at the measure-level is calculated by applying take-rates for achievable customer
adoption. • Measure-level potential must be translated into programs with realizable delivery, measure-bundling,
and cost structures.
Program MAP
Program RAP
Technical
Economic
Achievable (Maximum)
Achievable (Realistic)
Measure-Level Potential Program-Level Potential
Apply Program Delivery & Cost Structures
Apply Program Delivery & Cost Structures

15 PRELIMINARY
Residential Electricity Measure-Level Potential Technical and Economic Potential
• Technical potential is 8.3% by end of next 3-year cycle. Reaches 19.7% by 2026.
• Top 5 measures include: • LED lamps • Behavioral programs • Central air conditioners • Smart thermostats • Heat pump water heaters
• Economic potential is 6.0% by end of next 3-year cycle and 10.4% by 2026. • LEDs, Behavioral, and Smart thermostats pass
to Economic potential largely unchanged. • ACs: Lower SEER levels are cost effective than
technical case • HPWHs not cost effective

16 PRELIMINARY
Market Adoption Rates Overview of Approach
• Estimating take rates using customer information is an important, and controversial, aspect of a potential study
• Common methods for developing adoption rates are: • Use past program accomplishments • Use customer surveys • Borrow from other studies • Use Delphi approach or survey of experts • Use judgment
• This Ameren Illinois study uses a hybrid approach

17 PRELIMINARY
Residential Customer Survey (cont’d) Approach for estimating adoption rates using customer-survey data & Ameren information
EXAMPLE QUESTION FORMAT: Suppose you need to replace your HVAC system… <Begin with baseline rebate program description focusing on Economic Payback, then move on to understand the additional impact of Delivery Mechanism, Non-energy Factors, and/or Contextual Factors> What is your likelihood of purchasing the high efficiency unit instead of the standard efficiency unit? Not At All Likely Extremely Likely To Do This To Do This 1 2 3 4 5 6 7 8 9 10
1) Start with surveys of Ameren Illinois Customers…
0%10%20%30%40%50%60%70%80%
1 2 3 4 5 6 7 8 9 10
Act
ual T
aker
s
Self-Reported Likelihood of Taking
Ameren Illinois DSM Program
Data Example
Unadjusted Average Take Rate:
62%
Example Average Adjusted Take Rate:
37%
Example Average Adjusted Take Rate:
39%
2b) Current Study Method: Calibrate Survey Responses to real-life Ameren Illinois Participation Data
2a) Previous 2013 Study Method: Implement Adjustment for Respondent Over-Optimism based on panel research (The Say/Do Problem)

18 PRELIMINARY
Who We Are Realistic Achievable Take Rates
Average Unadjusted Take-Rate from Survey
Actual PY4 and PY5 Participation in this specific
program
Survey Adjustment Factor
% of Homes Participating in Ameren Illinois CFL program 79% 39% 0.50
Take Rates
Unadjusted Take Rate Adjusted Take Rate
(RAP with 3-year payback & reference conditions)
Low Income High Income Low Income High Income
HVAC 60% 75% 30% 37% Refrigerator 60% 74% 30% 37% PC 59% 68% 29% 34% Advanced Programmable Thermostat 54% 66% 27% 33% Efficient lamps (CFLs & LEDs) 78% 79% 39% 39%
Survey Anchor Question: Calibrate Survey Responses to Reality
RAP Take Rates for Other Measures
• Low Income HH’s are less likely to adopt high cost items like HVAC equipment (0.82X) and slightly less likely to adopt low cost items like a light bulb (0.98X).
• The revised method of anchoring surveys in recent actual program Take Rates produces similar results to previous method

19 PRELIMINARY
Maximum Achievable Take Rates
• Realistic Achievable Take Rates come from the mid-tier payback options without any “lift” or “penalty” from decision factors
• Maximum Achievable Take Rates are based on combining the most favorable scenarios in the survey Stacks the “lift” in customers uptake based on shortest economic payback and best possible non-
payback factors.
Take Rate “Lift” from Various Factors
Lift from Fastest Payback (0 or 1-year) vs. 3-year 10% Lift from Best Delivery Mechanism vs Avg. 22% Lift from Best Features vs Avg. 1% Lift from Best Customer Financial Situation vs Avg. 14% Lift from Highest Awareness vs Avg. 11% Maximum Lift with All Factors Stacked 57%

20 PRELIMINARY
Residential Electricity Measure-Level Potential
Realistic achievable energy savings over the next 3-year cycle are about half of economic potential: • 318 GWh by 2019 or 2.8%
of the baseline forecast. • By 2026, this is 610 GWh,
or 5.6% of the baseline forecast.
Cumulative Energy Savings 2017 2018 2019 2026 Baseline Forecast (GWh) 11,440 11,434 11,395 10,909 Potential Forecasts (GWh)
Realistic Achievable Potential 11,330 11,209 11,077 10,298 Maximum Achievable Potential 11,297 11,129 10,966 10,135 Economic Potential 11,119 10,917 10,709 9,776 Technical Potential 11,031 10,743 10,447 8,756
Cumulative Savings (GWh) Realistic Achievable Potential 111 225 318 610 Maximum Achievable Potential 144 305 430 773 Economic Potential 322 517 687 1,133 Technical Potential 409 691 948 2,153
Energy Savings (% of Baseline) Realistic Achievable Potential 1.0% 2.0% 2.8% 5.6% Maximum Achievable Potential 1.3% 2.7% 3.8% 7.1% Economic Potential 2.8% 4.5% 6.0% 10.4% Technical Potential 3.6% 6.0% 8.3% 19.7%

21 PRELIMINARY
Baseline Projection and Potential Forecasts
• Realistic achievable potential reduces average annual load growth from -0.3% to -0.9% • MAP reduces load growth to -1.0%

22 PRELIMINARY
Residential Realistic Achievable Potential (RAP) Top Measures in 2019 (Electricity)
Cumulative Savings by End Use in 2019
Rank Measure / Technology
2019 Realistic Achievable
Cumulative Savings (GWh)
% of Savings
1 Behavioral Programs 90.7 28.5% 2 Interior Lighting - General Service Screw-In 87.5 27.5% 3 Thermostat - Programmable/Interactive 42.1 13.2% 4 Exterior Lighting - Screw-in 22.5 7.1% 5 Interior Lighting - Exempted Screw-In 19.3 6.1% 6 Refrigerator - Decommissioning and Recycling 11.6 3.6% 7 Freezer - Decommisioning and Recycling 7.7 2.4% 8 Building Shell - Air Sealing 7.2 2.3% 9 Cooling - Central AC 4.1 1.3%
10 Windows - Install Reflective Film 3.3 1.0% 11 Appliances - Air Purifier 2.8 0.9% 12 Electronics - Personal Computers 2.7 0.8% 13 Ducting - Repair and Sealing 2.3 0.7% 14 Insulation - Wall Cavity 1.6 0.5% 15 Electronics - Laptops 1.5 0.5% 16 Appliances - Dehumidifier 1.3 0.4% 17 Insulation - Radiant Barrier 1.2 0.4% 18 Water Heater - Low-Flow Showerheads 1.0 0.3% 19 Electronics - TVs 0.9 0.3% 20 Pool Pump - Timer 0.9 0.3% Total 312.0 98.0%
Total Cumulative Savings in 2019 318.3 100.0%
Behavioral programs and Lighting have the largest savings in Cycle 4.
Approximately 200,000 smart thermostats in Cycle 4; ranked the number 3 measure by savings.
About 5,000 refrigerators recycled per year indicates a ramp down from current levels as the available stock becomes more efficient and decreases in numbers
Cooling 19%
Heating 8%
Water Heating
4% Interior Lighting
36%
Exterior Lighting
8%
Appliances 15%
Electronics 5%
Miscellaneous 5%

Preliminary Residential Potential Estimates for Natural Gas

24 PRELIMINARY
Residential Natural Gas Measure-Level Potential
Cumulative Energy Savings Potential 2017 2018 2019 2026 Baseline Forecast (MMTherm) 522.3 524.0 525.1 524.5 Potential Forecasts (MMTherm)
Realistic Achievable Potential 519.3 517.8 515.8 494.9 Maximum Achievable Potential 519.0 516.9 514.5 491.3 Economic Potential 515.7 512.7 509.2 477.6 Technical Potential 512.3 506.0 499.1 444.3
Cumulative Savings (MMTherm) Realistic Achievable Potential 3.0 6.2 9.2 29.6 Maximum Achievable Potential 3.3 7.1 10.6 33.3 Economic Potential 6.6 11.3 15.9 47.0 Technical Potential 10.0 18.0 26.0 80.2
Energy Savings (% of Baseline) Realistic Achievable Potential 0.6% 1.2% 1.8% 5.6% Maximum Achievable Potential 0.6% 1.4% 2.0% 6.3% Economic Potential 1.3% 2.1% 3.0% 9.0% Technical Potential 1.9% 3.4% 4.9% 15.3%
Realistic achievable natural gas savings are 9.2 MMtherms by 2019, or 1.8% of the baseline forecast. By 2026, this is 29.6 MMtherms, or 5.6% of the baseline forecast.
25 PRELIMINARY
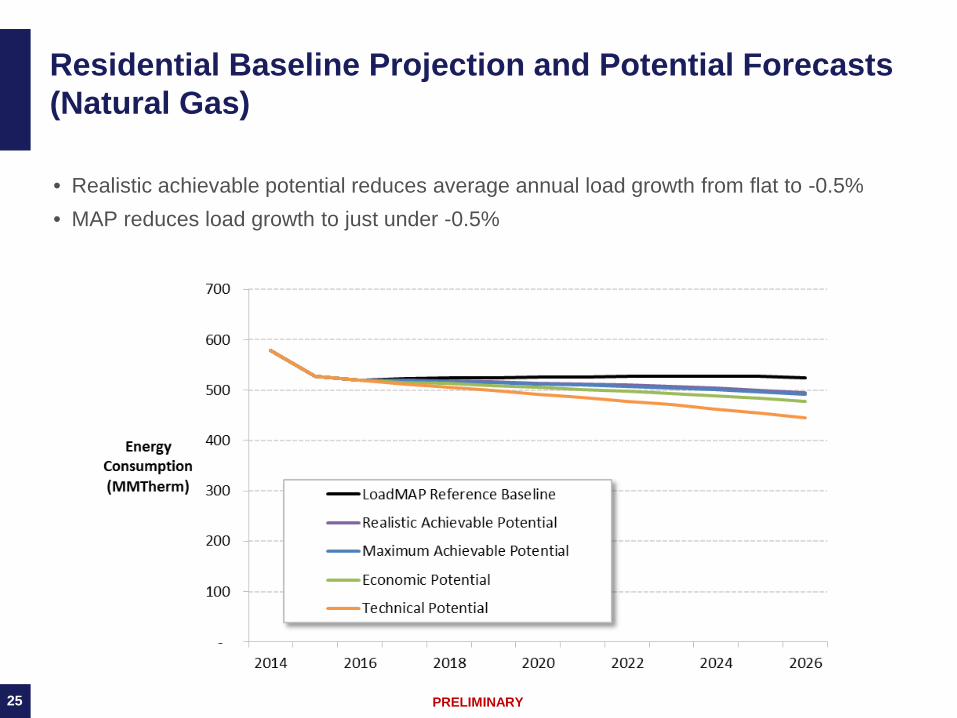
Residential Baseline Projection and Potential Forecasts (Natural Gas)
• Realistic achievable potential reduces average annual load growth from flat to -0.5% • MAP reduces load growth to just under -0.5%

26 PRELIMINARY
Residential Realistic Achievable Potential (RAP) Top Measures in 2019 (Natural Gas)
Rank Measure / Technology
2019 Realistic Achievable Cumulative
Savings (MMTherm)
% of Savings
1 Thermostat - Programmable/Interactive 6.2 66.6% 2 Behavioral Programs 1.5 16.0% 3 Ducting - Repair and Sealing 0.5 5.5% 4 Building Shell - Air Sealing 0.4 4.7% 5 Insulation - Radiant Barrier 0.3 2.8% 6 Water Heater - Tank Wrap 0.1 0.9% 7 Water Heater - Low-Flow Showerheads 0.1 0.8% 8 Water Heater - Pipe Insulation 0.0 0.5% 9 Insulation - Floor 0.0 0.4%
10 Boiler - Maintenance 0.0 0.4% 11 Heating - Furnace 0.0 0.3% 12 Water Heater - Thermostatic Restrictor Shower Valve 0.0 0.3% 13 Water Heater - Faucet Aerators 0.0 0.3% 14 Water Heater - Desuperheater 0.0 0.2% 15 Water Heater - Temperature Setback 0.0 0.2% 16 Insulation - Basement Sidewall 0.0 0.1% Total 9.2 100.0%
Total Cumulative Savings in 2019 9.2 100.0%
Smart thermostats are now the top measure, followed by behavioral programs and shell measures.
Low avoided costs result in a low incidence of equipment, weatherization, and maintenance measures relative to the previous study.
Heating 92%
Water Heating
6%
Appliances 1%
Miscellaneous 1%

Program Potential (Forthcoming)

28 PRELIMINARY
• This study is developing preliminary estimates of program potential that will be refined into program designs in a separate effort in 2016
• General considerations when translating from Measure-level potential to Program-level potential: • Consider measure bundles that include measures that are not cost-effective on a stand-
alone basis • May include multiple efficiency levels for a particular technology • May exclude some measures that have very small potential or are challenging to
implement • Adds program administrative & delivery costs may render certain measures or bundles
not cost-effective • May adjust participation rates to reflect priorities • Net to gross and realization rates may affect savings
Program Potential

29 PRELIMINARY
Program Potential (Cont’d)
Specifically, for this analysis we will: • Exclude any measure that did not pass the measure-level TRC screen • Exclude Residential Electronics Measures – no viable program delivery method • Apply program delivery costs to Behavioral programs – they are modeled with a
nominal cost of $0.01 at the measure level • Allocate each passing measure to one or more program • The programs (shown below) are very similar to those currently being offered in the
Ameren Illinois service territory:
Residential Programs
Appliance Recycling Multifamily Lighting School Kits Behavior Modification Rural Kits New Homes Moderate Income Whole Home Low Income - Single Family HVAC Low Income - Multi Family

Thank You!
Ingrid Rohmund, Vice President [email protected] Dave Costenaro, Senior Project Manager [email protected]