Amer v2
32
DEVELOPMENT OF UNCERTAINTY FACTORS FROM HISTORICAL NASA PROJECTS Dr. Tahani Amer, OE/IPAO NASA-HQ Dr. Will Jarvis, OE/IPAO NASA-HQ Dr. Ariel Pinto, Old Dominion University NASA Program Management Challenge 2012 This briefing is for status only and does not represent complete release of usage.
-
Upload
nasapmc -
Category
Technology
-
view
13.965 -
download
3
description
Transcript of Amer v2
DEVELOPMENT OF UNCERTAINTY FACTORS FROM
HISTORICAL NASA PROJECTS
Dr. Tahani Amer, OE/IPAO NASA-HQDr. Will Jarvis, OE/IPAO NASA-HQ
Dr. Ariel Pinto, Old Dominion University
NASA Program Management Challenge 2012 This briefing is for status only and does not represent complete release of usage.

Project Background
• Uncertainty analysis should be performed to capture the program risks.
• NASA has been using available uncertainty factors from Aerospace, Air Force, and Booz Allen Hamilton.
• NASA has no insight into the development of these factors, which can lead to unrealistic risks in most NASA projects.
• SRB analysis requires cost growth factors that are transparent and based on recent NASA experience.
• Better estimation and prediction of missions cost is needed early on.
NASA Program Management Challenge 2012 This briefing is for status only and does not represent complete release of usage. 2
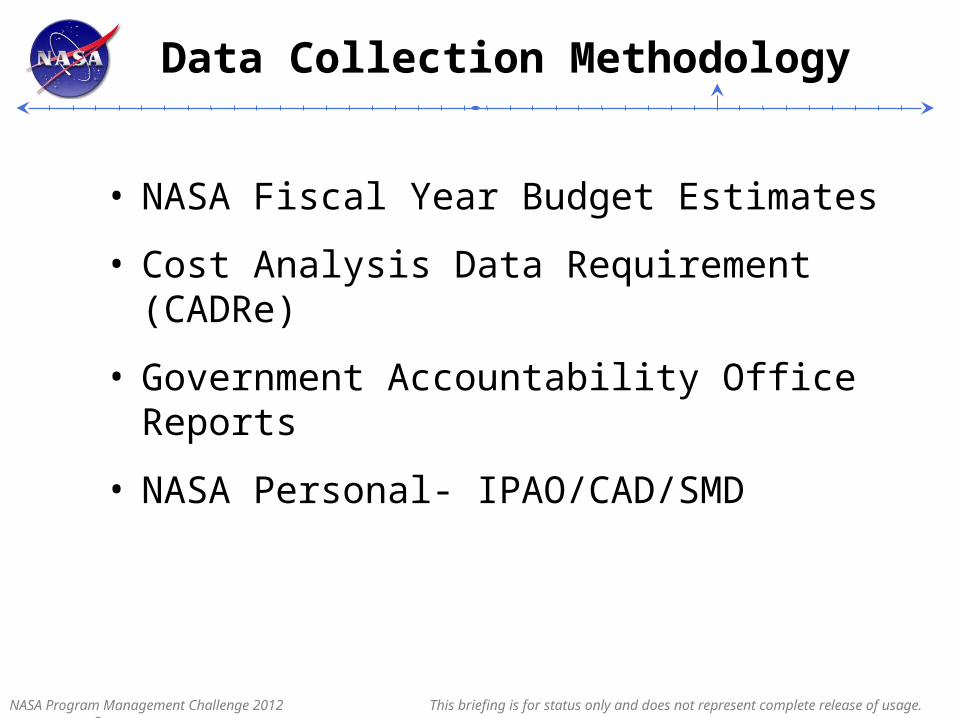
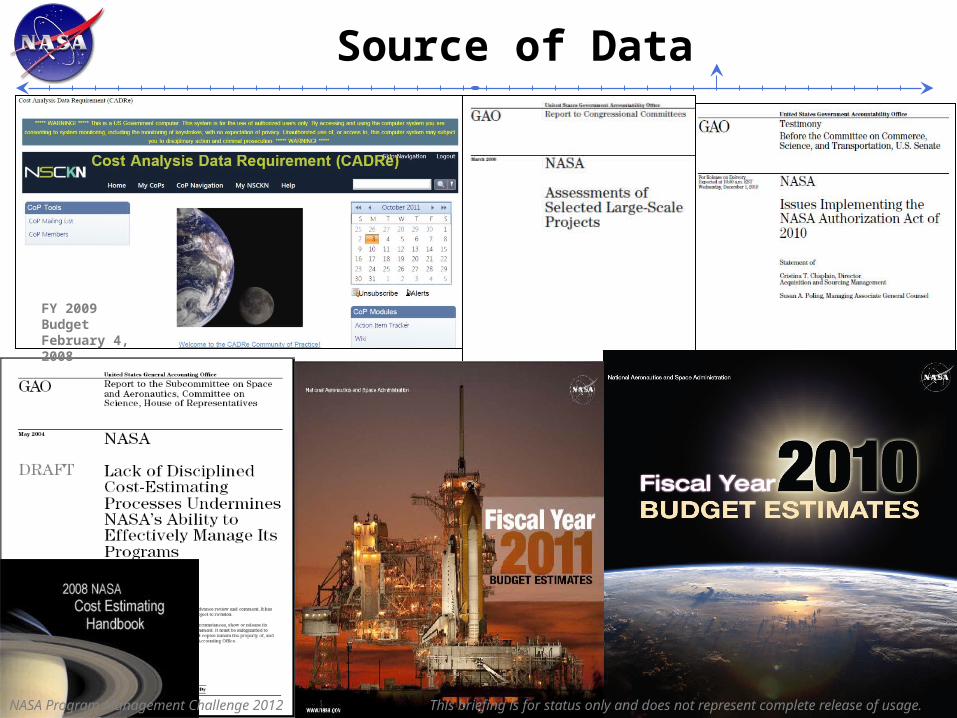
Data Collection Methodology
• NASA Fiscal Year Budget Estimates
• Cost Analysis Data Requirement (CADRe)
• Government Accountability Office Reports
• NASA Personal- IPAO/CAD/SMD
NASA Program Management Challenge 2012 This briefing is for status only and does not represent complete release of usage. 3
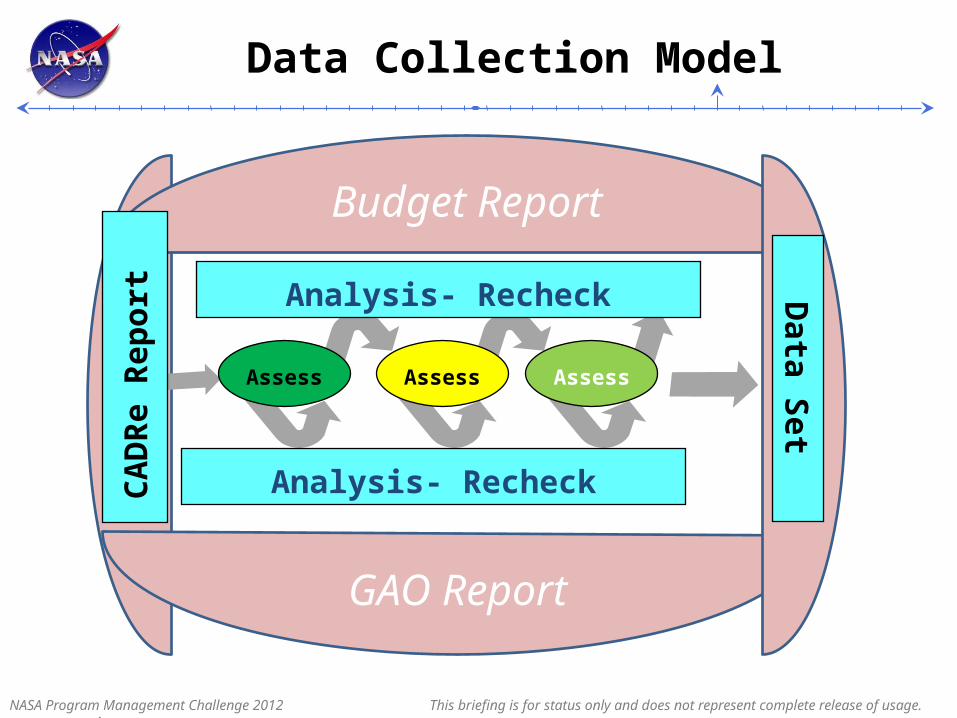
Data Collection Model
GAO Report
Budget Report
Analysis- Recheck
Analysis- Recheck
Assess Assess Assess
CA
DR
e R
epo
rt Data S
et
NASA Program Management Challenge 2012 This briefing is for status only and does not represent complete release of usage. 4
5
FY 2009 BudgetFebruary 4, 2008
Amer DENG
Source of Data
NASA Program Management Challenge 2012 This briefing is for status only and does not represent complete release of usage. 5
Data Sampling Criteria
• Difficulty in collecting accurate data – limited dataset
• Criteria– Science Mission Projects– Developmental Phase– Only cost data– Use CARDe data as final for completed Missions– For active missions: used in search of credible earliest available
and latest available estimates. Errors probably exist because some projects are still in development and continue to evolve
NASA Program Management Challenge 2012 This briefing is for status only and does not represent complete release of usage. 6

Summary of NASA Missions Investigated
Completed Missions Active Missions
NEARLUNAR PROSPECTOR GENESISMESSENGERMARS PATHFINDER STARDUST CONTOURDEEP IMPACT MGSMCO/MPL
MERMRO FAST SWAS TRACE WIRE ACE FUSE IMAGEMAP
HESSI GALEX SWIFT GRACE CLOUDSAT CALIPSODS-1EO-1SIRTFSTEREO
EOS-Aqua EOS-Aura LANDSAT-7TRMM TIMEDGRAVITY PROBE B THEMISHETE-II SORCEICESAT
AIM DAWN PHOENIX GLAST KEPLER SDOWISENEW HORIZONS LROOCO
JUNO AQUARIUS LDCMNPP GPM MMS JWSTMSL GLORYGRAIL
NASA Program Management Challenge 2012 This briefing is for status only and does not represent complete release of usage. 7
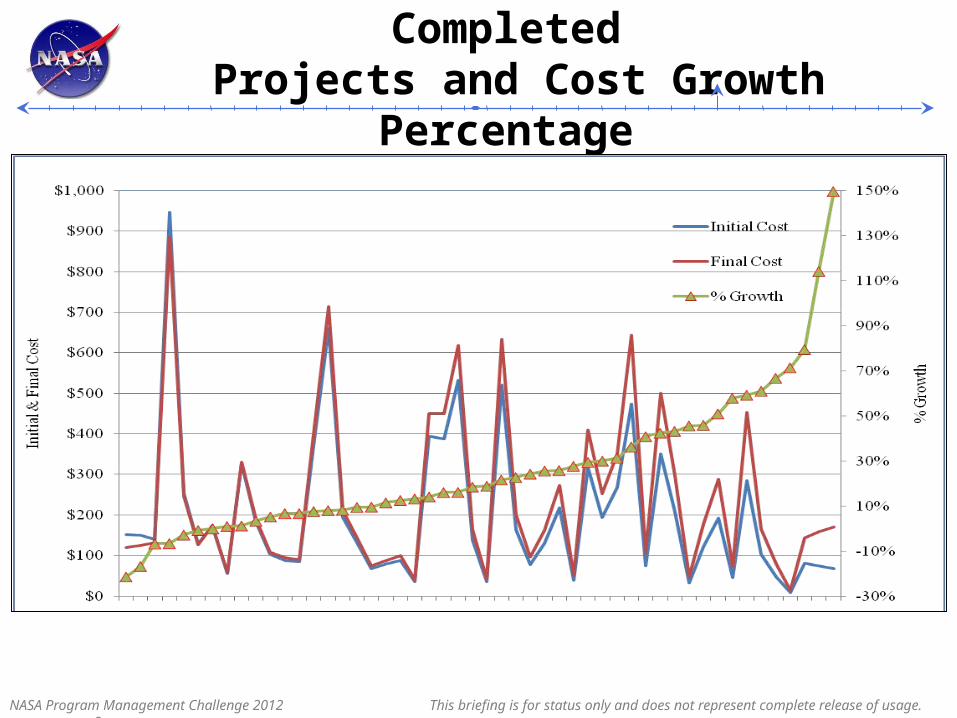
Initial & Final Cost for 50 Completed Projects and Cost Growth Percentage
NASA Program Management Challenge 2012 This briefing is for status only and does not represent complete release of usage. 8
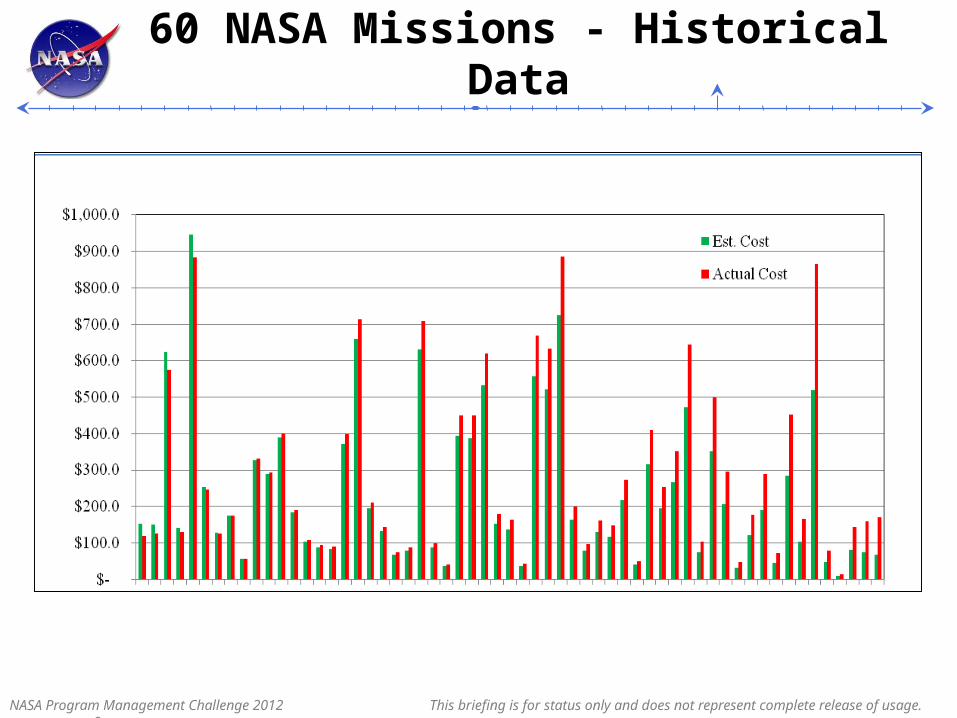
60 NASA Missions - Historical Data
NASA Program Management Challenge 2012 This briefing is for status only and does not represent complete release of usage. 9
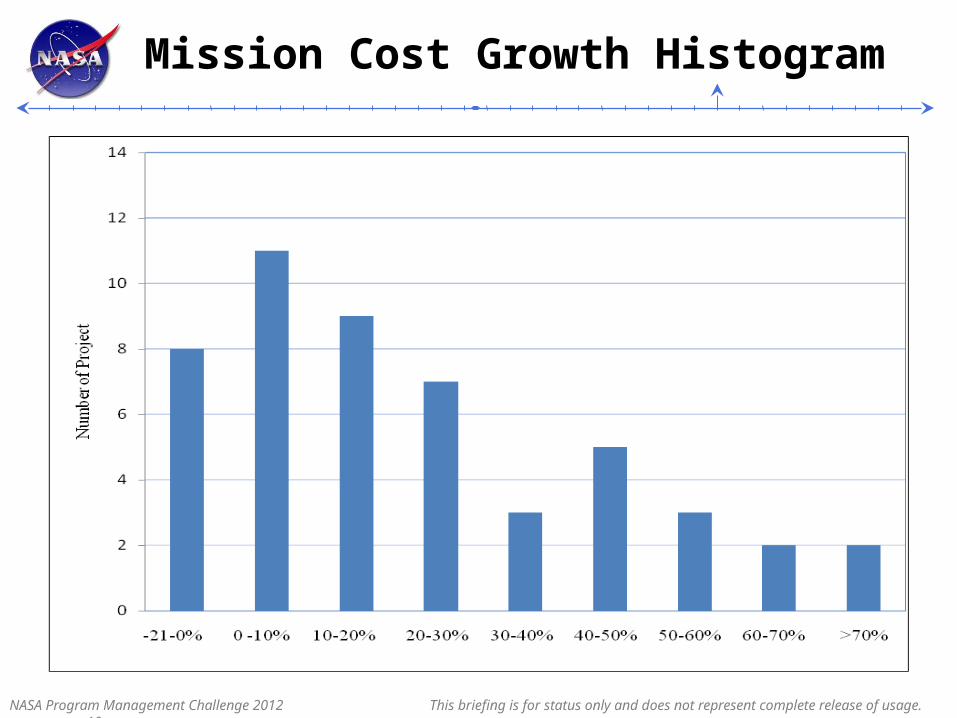
Mission Cost Growth Histogram
NASA Program Management Challenge 2012 This briefing is for status only and does not represent complete release of usage. 10
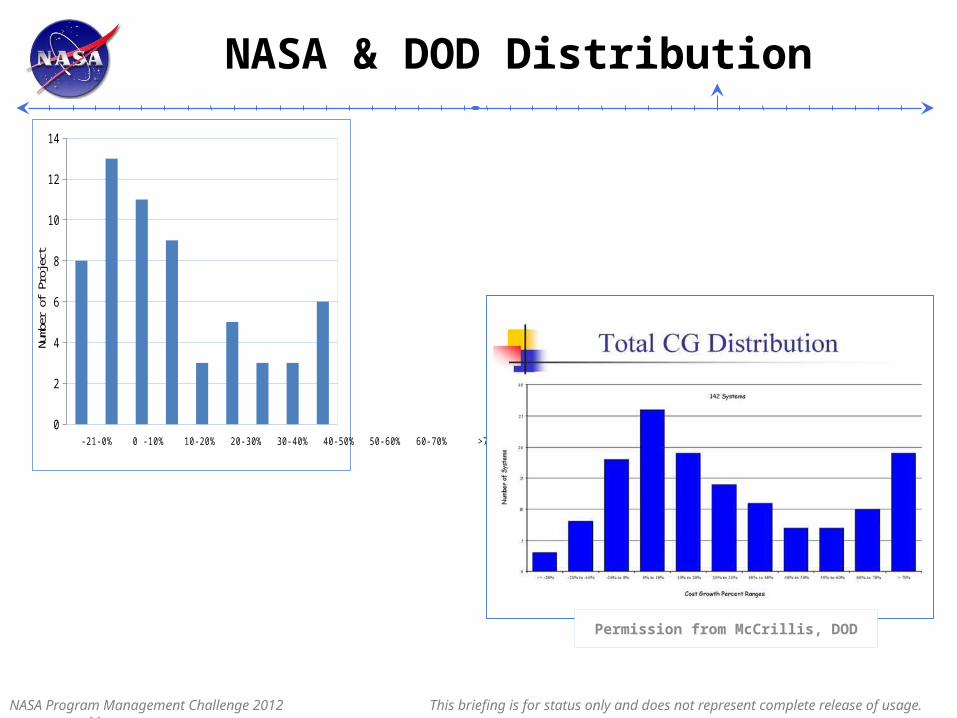
NASA & DOD Distribution
0
2
4
6
8
10
12
14
Num
ber o
f Pro
ject
-21-0% 0 -10% 10-20% 20-30% 30-40% 40-50% 50-60% 60-70% >70%
Permission from McCrillis, DOD
NASA Program Management Challenge 2012 This briefing is for status only and does not represent complete release of usage. 11
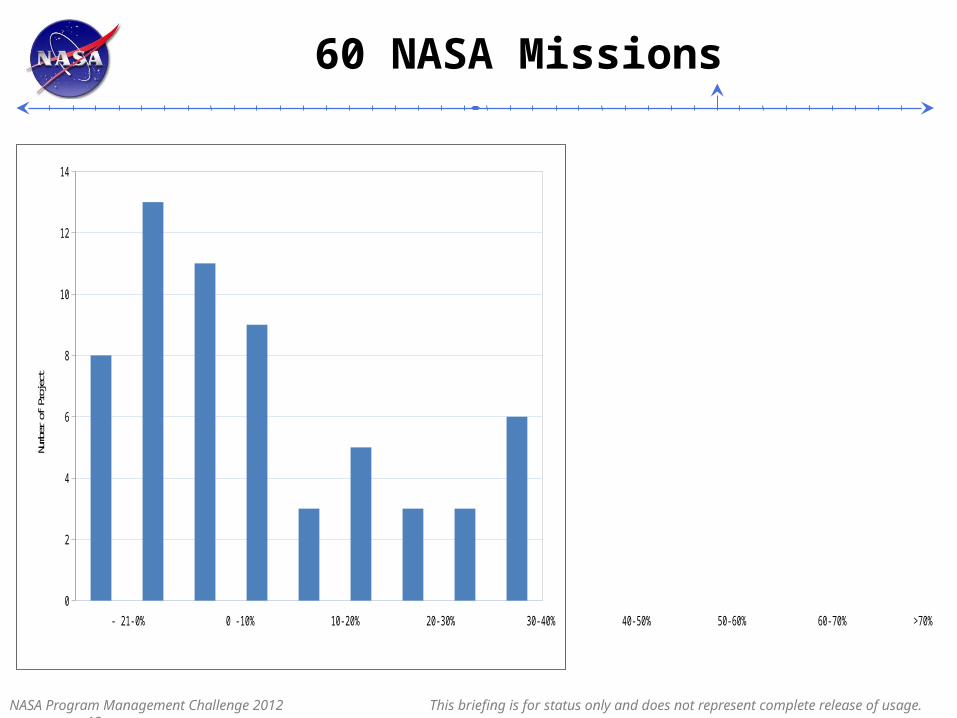
60 NASA Missions
0
2
4
6
8
10
12
14
Num
ber o
f Pro
ject
- 21-0% 0 -10% 10-20% 20-30% 30-40% 40-50% 50-60% 60-70% >70%
NASA Program Management Challenge 2012 This briefing is for status only and does not represent complete release of usage. 12
Reasons for Cost Growth
• The major categories for cost growth:
– Overly optimistic and unrealistic initial cost estimates– Project instability and funding issues– Problems with development of instruments and other spacecraft
technology– Launch service issues– “Stuff” Happens
NASA Program Management Challenge 2012 This briefing is for status only and does not represent complete release of usage. 13

Level Optimistic Most Likely Pessimistic
Low 0.95 1 1.1
Low Plus 0.96 1 1.23
Moderate 0.97 1 1.36
Moderate Plus 0.98 1 1.49
High 0.98 1 1.61
High Plus 0.99 1 1.74
Very High 1 1 1.87
Very High Plus 1 1 2
Aerospace Air Force
Booz Allen Hamilton
Uncertainly Factors from non-NASA Missions
NASA Program Management Challenge 2012 This briefing is for status only and does not represent complete release of usage. 14
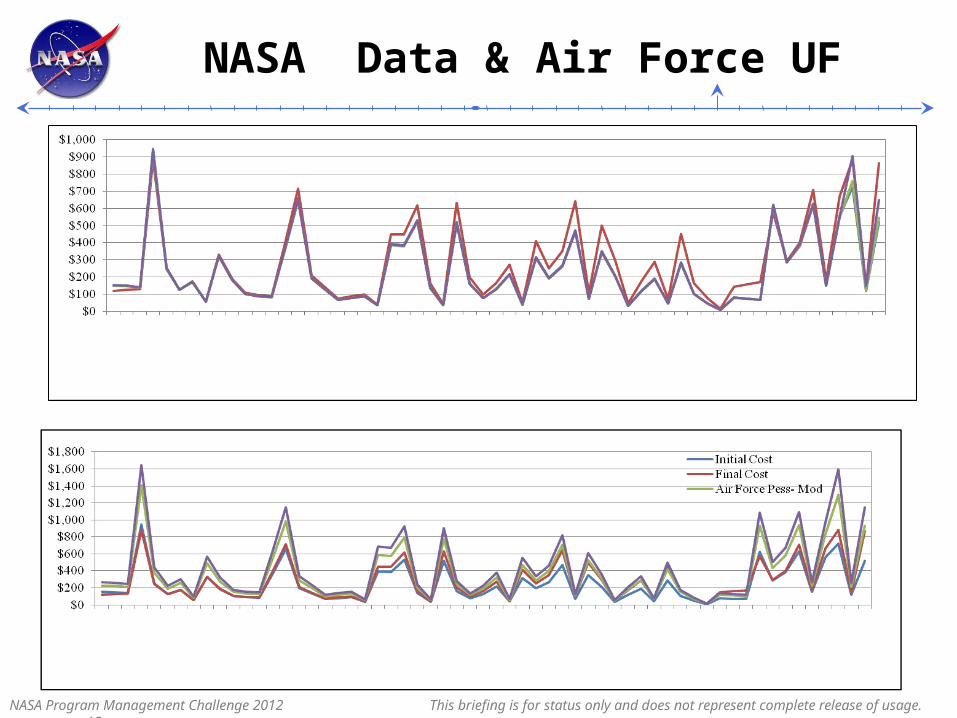
NASA Data & Air Force UF
NASA Program Management Challenge 2012 This briefing is for status only and does not represent complete release of usage. 15
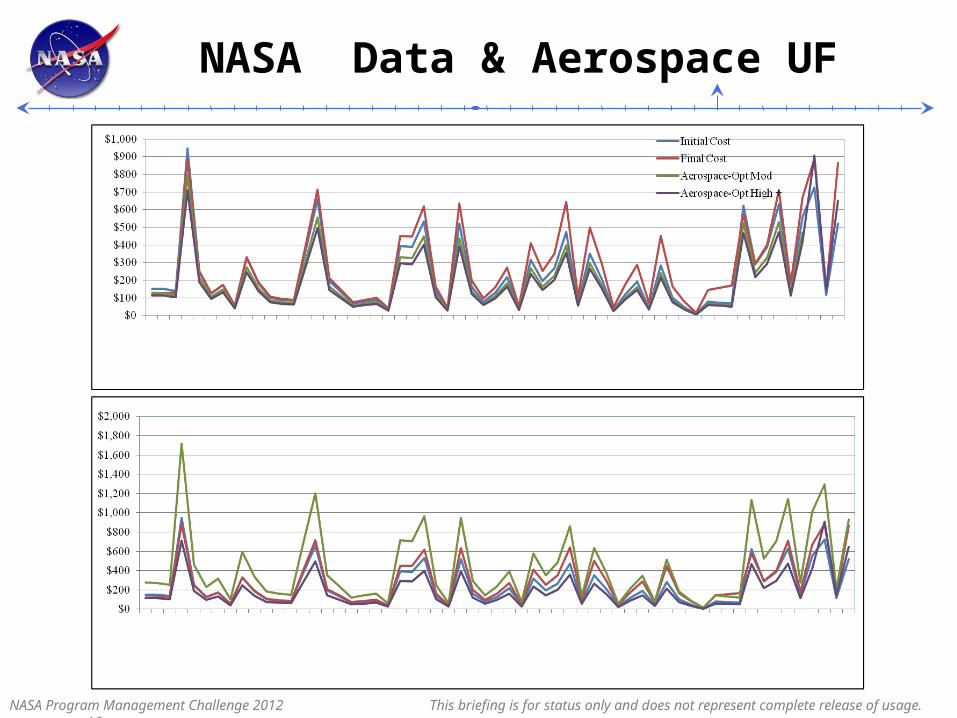
NASA Data & Aerospace UF
NASA Program Management Challenge 2012 This briefing is for status only and does not represent complete release of usage. 16
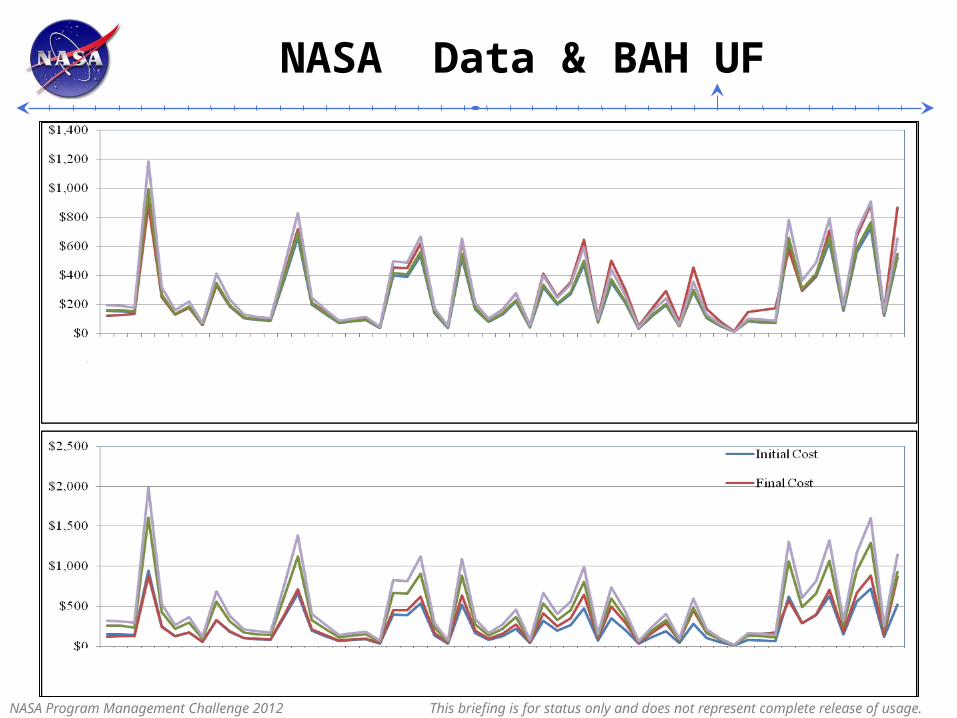
NASA Data & BAH UF
NASA Program Management Challenge 2012 This briefing is for status only and does not represent complete release of usage. 17

Development of Distribution-54
NASA Program Management Challenge 2012 This briefing is for status only and does not represent complete release of usage. 18

Development of Distribution-44
Lognormal
Cost Growth (%)1501401301201101009080706050403020100
PD
F
0.12
0.11
0.1
0.09
0.08
0.07
0.06
0.05
0.04
0.03
0.02
0.01
0
F(X) =
µ= 3.03σ= 1.08
NASA Program Management Challenge 2012 This briefing is for status only and does not represent complete release of usage. 19
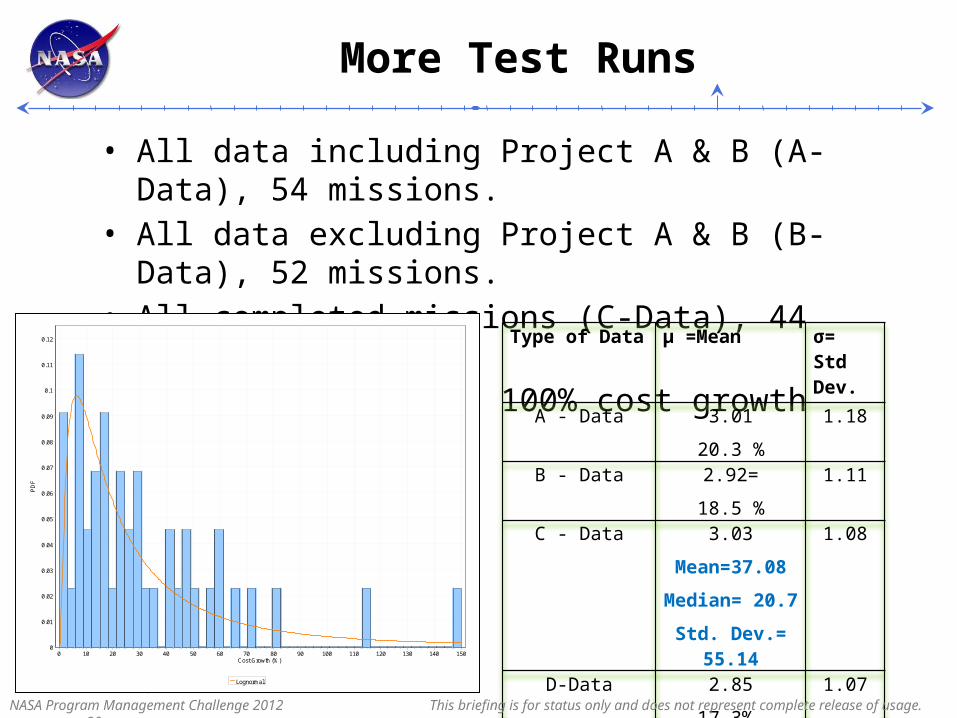
More Test Runs
• All data including Project A & B (A- Data), 54 missions.• All data excluding Project A & B (B- Data), 52 missions.• All completed missions (C-Data), 44 missions.• All data less than 100% cost growth (D- Data).
Type of Data µ =Mean σ= Std Dev.
A - Data 3.01
20.3 %
1.18
B - Data 2.92=
18.5 %
1.11
C - Data 3.03
Mean=37.08
Median= 20.7
Std. Dev.= 55.14
1.08
D-Data 2.85
17.3%
1.07
October 7, 2011 Lognormal
Cost Growth (%)1501401301201101009080706050403020100
PD
F
0.12
0.11
0.1
0.09
0.08
0.07
0.06
0.05
0.04
0.03
0.02
0.01
0
NASA Program Management Challenge 2012 This briefing is for status only and does not represent complete release of usage. 20

Selected Distribution
• The lognormal distribution is the most suitable distribution that the cost estimator can use to perform an uncertainty analysis for the NASA data.
• The quality of the fit of two tests: – The Kolmogorov-test – The Anderson-Darling test
Lognormal (1.08; 3.03)
Cost Growth (%)100500
PD
F
0.032
0.028
0.024
0.02
0.016
0.012
0.008
0.004
0
NASA Program Management Challenge 2012 This briefing is for status only and does not represent complete release of usage. 21
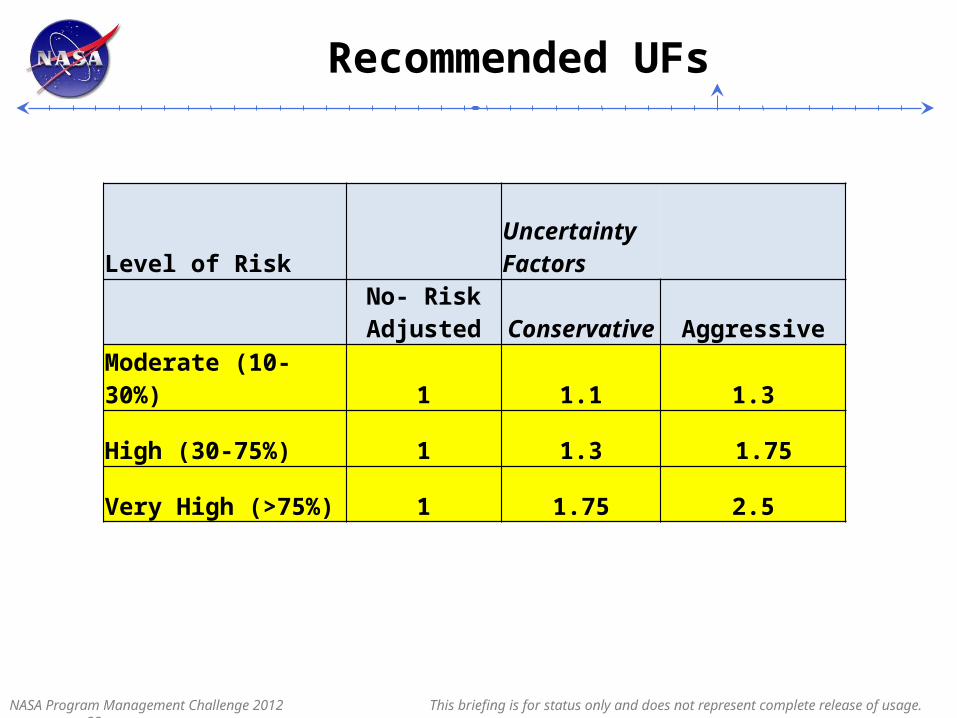
Recommended UFs
Level of RiskUncertainty Factors
No- Risk Adjusted Conservative Aggressive
Moderate (10-30%) 1 1.1 1.3
High (30-75%) 1 1.3 1.75
Very High (>75%) 1 1.75 2.5
NASA Program Management Challenge 2012 This briefing is for status only and does not represent complete release of usage. 22
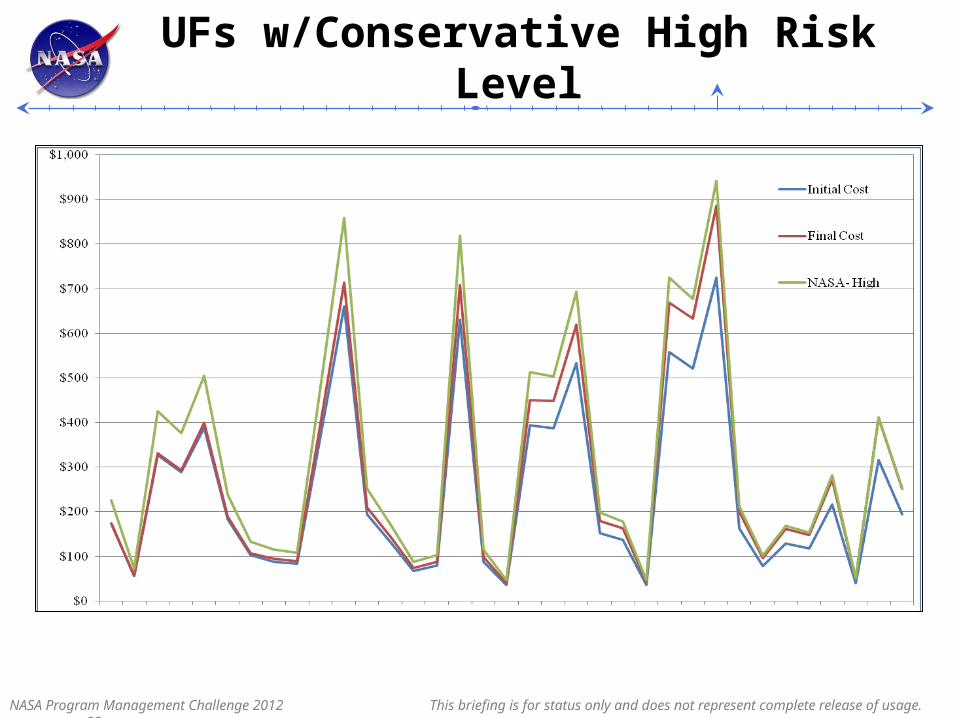
UFs w/Conservative High Risk Level
NASA Program Management Challenge 2012 This briefing is for status only and does not represent complete release of usage. 23
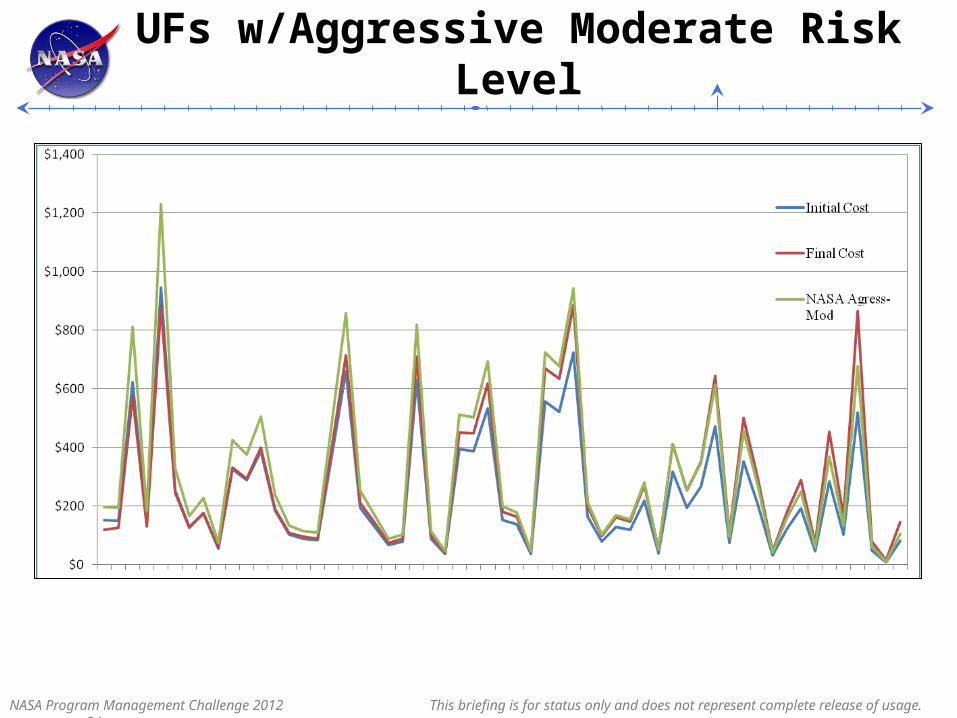
UFs w/Aggressive Moderate Risk Level
NASA Program Management Challenge 2012 This briefing is for status only and does not represent complete release of usage. 24

Guideline to UFs
• Cost Analyst Judgment
• Mission Complexity: Number of Instruments, Technical Development
• Heritage Level
• Partners Performance
• Mission Visibility: International & Commercial
• Similarity of Missions
NASA Program Management Challenge 2012 This briefing is for status only and does not represent complete release of usage. 25
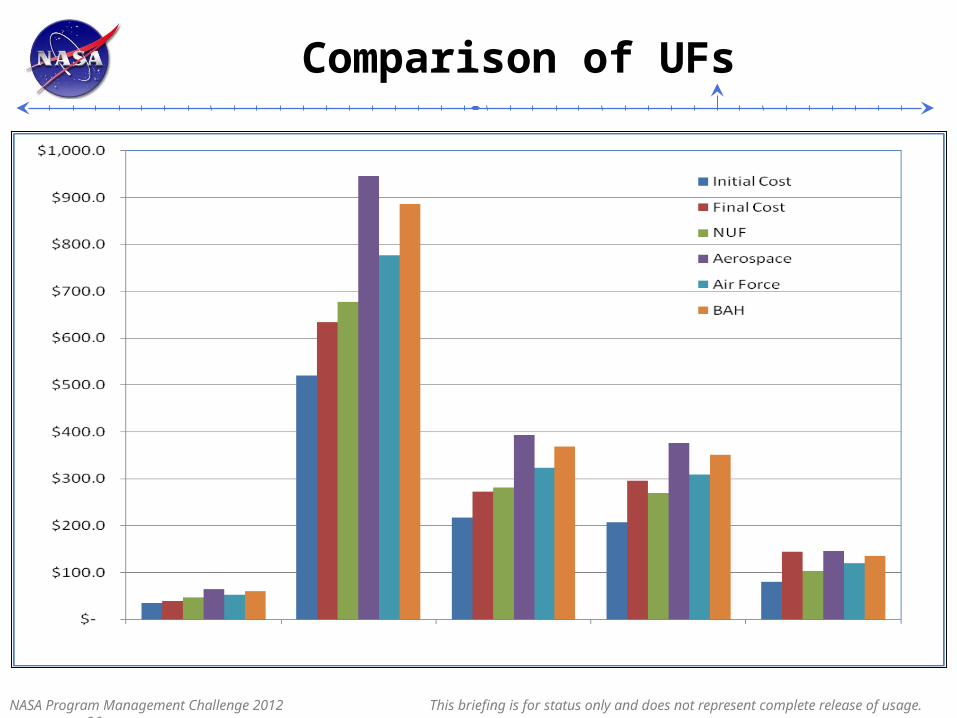
Comparison of UFs
NASA Program Management Challenge 2012 This briefing is for status only and does not represent complete release of usage. 26
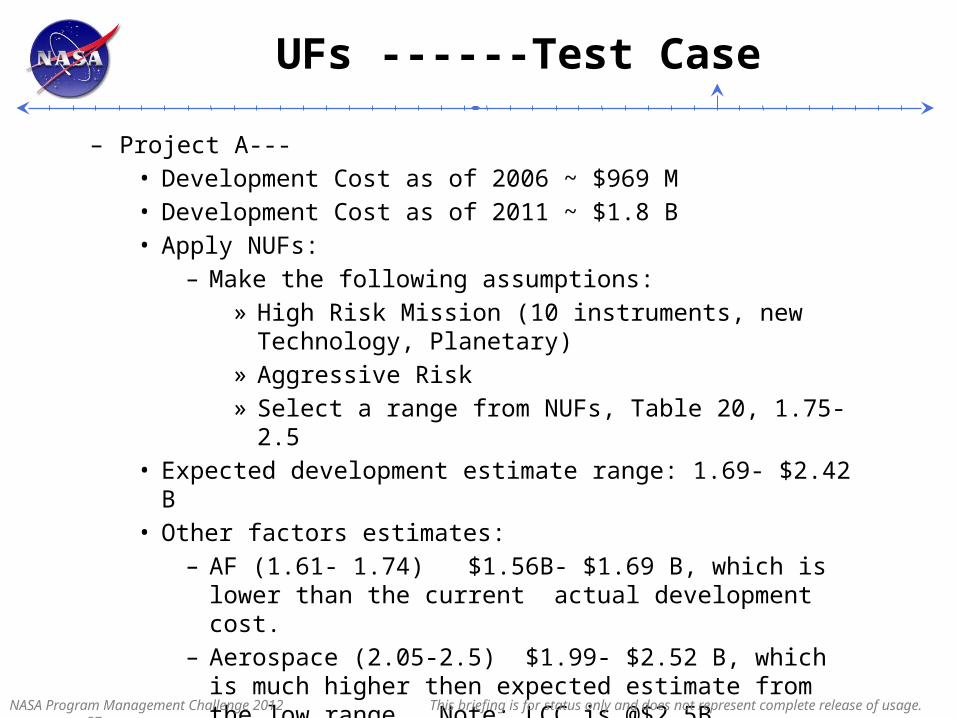
UFs ------Test Case
– Project A---• Development Cost as of 2006 ~ $969 M• Development Cost as of 2011 ~ $1.8 B• Apply NUFs:
– Make the following assumptions:» High Risk Mission (10 instruments, new Technology, Planetary)» Aggressive Risk » Select a range from NUFs, Table 20, 1.75-2.5
• Expected development estimate range: 1.69- $2.42 B• Other factors estimates:
– AF (1.61- 1.74) $1.56B- $1.69 B, which is lower than the current actual development cost.
– Aerospace (2.05-2.5) $1.99- $2.52 B, which is much higher then expected estimate from the low range. Note: LCC is @$2.5B.
– BAH (1.9-2.10) $1.84- $2.03 B, which is might be closer to the expected development cost . Note: see section 3.3 for these factors interpolation from BAH table.
NASA Program Management Challenge 2012 This briefing is for status only and does not represent complete release of usage. 27
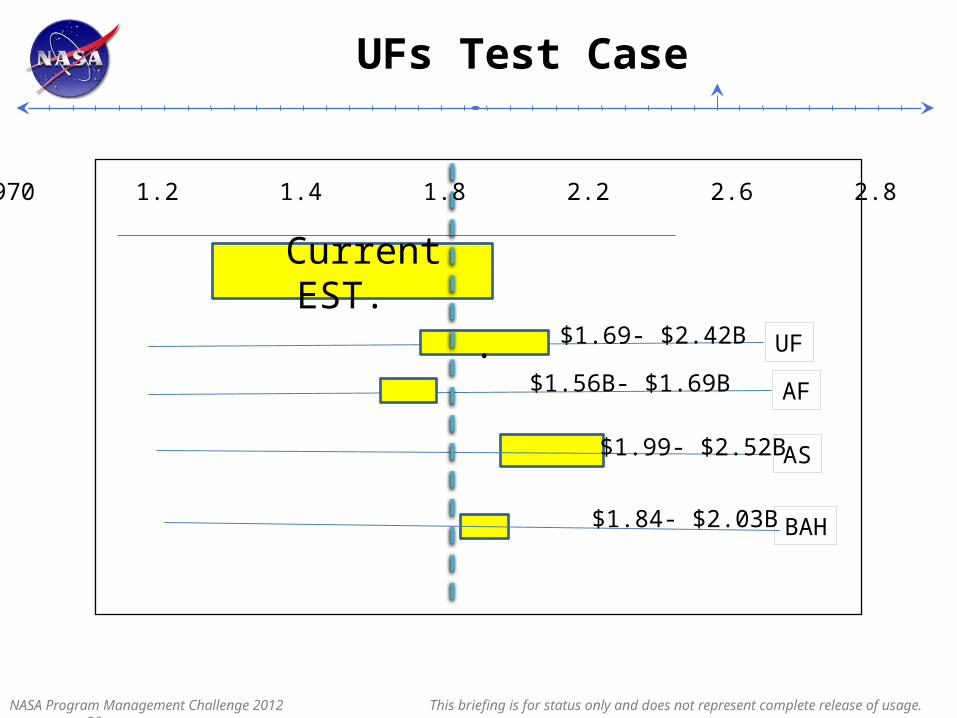
UFs Test Case
NASA Program Management Challenge 2012 This briefing is for status only and does not represent complete release of usage. 28
.
Current EST.
970 1.2 1.4 1.8 2.2 2.6 2.8
UF
AF
AS
BAH
$1.69- $2.42B
$1.56B- $1.69B
$1.99- $2.52B
$1.84- $2.03B
Conclusions
• This research provides an important contribution to the discipline of cost estimating.
• It has developed a solid database of actual cost growth history and adds some statistical rigor to the derivation of cost growth factors based on the data.
• Thoughtful execution and effective monitoring of the NUFs will improve the cost estimating.
• Additionally, it is expected that this work will be referenced often for independent cost estimates, correction of advocacy-bias in project-generated estimates, and other programmatic work.
NASA Program Management Challenge 2012 This briefing is for status only and does not represent complete release of usage. 29
Point Taken
• The greatest benefit of this research is providing a proactive approach to make a quick cost estimating as in back of envelope by:
– Program Managers– Decision Makers– Congressional Staffer– Cost analysts– Awareness and reference to Standard Review Board
NASA Program Management Challenge 2012 This briefing is for status only and does not represent complete release of usage. 30
Future Work
• Increase the number of historical missions captured in the database.
• Validate UFs with more available actual cost data.
• Test the UFs for missions in various life-cycle phases.
• Develop a more adaptable tool for NUFs.
• Accept the UFs by the cost analysis’ community for implementation.
• Develop Agency standard.
NASA Program Management Challenge 2012 This briefing is for status only and does not represent complete release of usage. 31
Backup
NASA Program Management Challenge 2012 This briefing is for status only and does not represent complete release of usage. 32