Alternative Education - San Joaquin High School School ... · 2015-16 School Accountability ... San...
12
2015-16 School Accountability Report Card for Alternative Education - San Joaquin High School Page 1 of 12 Alternative Education - San Joaquin High School School Accountability Report Card Reported Using Data from the 2015-16 School Year Published During 2016-17 By February 1 of each year, every school in California is required by state law to publish a School Accountability Report Card (SARC). The SARC contains information about the condition and performance of each California public school. Under the Local Control Funding Formula (LCFF) all local educational agencies (LEAs) are required to prepare a Local Control and Accountability Plan (LCAP), which describes how they intend to meet annual school-specific goals for all pupils, with specific activities to address state and local priorities. Additionally, data reported in an LCAP is to be consistent with data reported in the SARC. • For more information about SARC requirements, see the California Department of Education (CDE) SARC Web page at http://www.cde.ca.gov/ta/ac/sa/. • For more information about the LCFF or LCAP, see the CDE LCFF Web page at http://www.cde.ca.gov/fg/aa/lc/. • For additional information about the school, parents/guardians and community members should contact the school principal or the district office. DataQuest DataQuest is an online data tool located on the CDE DataQuest Web page at http://dq.cde.ca.gov/dataquest/ that contains additional information about this school and comparisons of the school to the district and the county. Specifically, DataQuest is a dynamic system that provides reports for accountability (e.g., test data, enrollment, high school graduates, dropouts, course enrollments, staffing, and data regarding English learners). Internet Access Internet access is available at public libraries and other locations that are publicly accessible (e.g., the California State Library). Access to the Internet at libraries and public locations is generally provided on a first-come, first-served basis. Other use restrictions may include the hours of operation, the length of time that a workstation may be used (depending on availability), the types of software programs available on a workstation, and the ability to print documents. About This School Contact Information (School Year 2016-17) School Contact Information School Name------- Alternative Education - San Joaquin High School Street------- 3387 Barranca Pkwy. City, State, Zip------- Irvine, CA 92606 Phone Number------- (949) 936-7440 Principal------- Rebecca Roberts E-mail Address------- [email protected] Web Site------- http://iusd.org/sjhs/ CDS Code 30-73650-3030467
-
Upload
phungduong -
Category
Documents
-
view
220 -
download
2
Transcript of Alternative Education - San Joaquin High School School ... · 2015-16 School Accountability ... San...

2015-16 School Accountability Report Card for Alternative Education - San Joaquin High School Page 1 of 12
Alternative Education - San Joaquin High School
School Accountability Report Card
Reported Using Data from the 2015-16 School Year
Published During 2016-17
By February 1 of each year, every school in California is required by state law to publish a School Accountability Report Card (SARC). The SARC contains information about the condition and performance of each California public school. Under the Local Control Funding Formula (LCFF) all local educational agencies (LEAs) are required to prepare a Local Control and Accountability Plan (LCAP), which describes how they intend to meet annual school-specific goals for all pupils, with specific activities to address state and local priorities. Additionally, data reported in an LCAP is to be consistent with data reported in the SARC. • For more information about SARC requirements, see the California Department of Education (CDE) SARC Web page at
http://www.cde.ca.gov/ta/ac/sa/. • For more information about the LCFF or LCAP, see the CDE LCFF Web page at http://www.cde.ca.gov/fg/aa/lc/. • For additional information about the school, parents/guardians and community members should contact the school principal or
the district office. DataQuest DataQuest is an online data tool located on the CDE DataQuest Web page at http://dq.cde.ca.gov/dataquest/ that contains additional information about this school and comparisons of the school to the district and the county. Specifically, DataQuest is a dynamic system that provides reports for accountability (e.g., test data, enrollment, high school graduates, dropouts, course enrollments, staffing, and data regarding English learners). Internet Access Internet access is available at public libraries and other locations that are publicly accessible (e.g., the California State Library). Access to the Internet at libraries and public locations is generally provided on a first-come, first-served basis. Other use restrictions may include the hours of operation, the length of time that a workstation may be used (depending on availability), the types of software programs available on a workstation, and the ability to print documents.
About This School Contact Information (School Year 2016-17)
School Contact Information
School Name------- Alternative Education - San Joaquin High School
Street------- 3387 Barranca Pkwy.
City, State, Zip------- Irvine, CA 92606
Phone Number------- (949) 936-7440
Principal------- Rebecca Roberts
E-mail Address------- [email protected]
Web Site------- http://iusd.org/sjhs/
CDS Code 30-73650-3030467

2015-16 School Accountability Report Card for Alternative Education - San Joaquin High School Page 2 of 12
District Contact Information
District Name------- Irvine Unified School District
Phone Number------- (949) 936-5000
Superintendent-------
Terry Walker
E-mail Address------- [email protected]
Web Site------- www.iusd.org
School Description and Mission Statement (School Year 2016-17)
The missions of the San Joaquin Schools, San Joaquin High School and the Irvine Home School, are to prepare students academically, socially, and emotionally to be responsible, contributing members of a diverse, rapidly changing, and increasingly interdependent and interrelated global community. Further, San Joaquin High School will prepare its graduates to be: • EFFECTIVE COMMUNICATORS • STRATEGIC THINKERS • HEALTHY SELF-DIRECTED INDIVIDUALS • CONTRIBUTING 21ST CENTURY CITIZENS To our students, their families and our greater community: The 2014-2015 School Year began our 36th year as an alternative education program for Irvine young men, women, and their families. We were excited about the opportunity to support their educational and personal goals. Each professional staff member takes great pride in our mission and believes strongly in the effectiveness of alternative education. We are a workable and proven choice to Irvine's larger traditional high schools. The quality of education here will be superior if the student commits and determines to work hard. San Joaquin High School (9-12 Independent Study) was established in the summer of 1979. It was the result of the efforts of a group of students, parents, teachers and administrators who challenged the assumption that the comprehensive high school is an appropriate learning environment for all students and that independent study was a very appropriate learning strategy for high school students. The school relocated in September 2007 to our new site at the corner of Barranca Parkway and Harvard Street. The new school facilities are located on a 8.5 acres of a 20 acre school district site in west Irvine. The site, now officially called the Creekside Education Center, provides much more appropriate, state of the art instructional spaces for our students. We graduate 40-to-60 students each year. San Joaquin's graduation requirements are the same as the other high schools in the district. Additionally, San Joaquin participates is a process of ongoing self-study and program improvement and has received the maximum number of years of accreditation (six) from the Accrediting Commission of the Western Association of Schools and Colleges. The economic and ethnic make-up of San Joaquin's students is diverse and represents the diversity of our traditional high schools and the District. English-speaking students represent the majority of the student population; however, a number of minority students represents a variety of ethnic backgrounds and speak many different languages. San Joaquin staff put tremendous emphasis on facilitating personalized, disciplined learning that leads to achievement. A student’s presence at San Joaquin places greater personal responsibility and discipline to respond, not only to graduation requirements, but to prepare themselves academically, socially, and emotionally for "life after high school." We are committed to our students becoming independent learners who ultimately, are accountable for their own education, achievement of personal goals, and finding happiness. Habits are what one does repeatedly, and ultimately, we become what we do repeatedly. We ask students to take an honest look at themselves, develop a positive attitude, and do the right thing everyday. Our San Joaquin motto: “Every day is a new day to succeed.” We believe in the power of those words and in the destiny of each student to grow and develop in positive successful ways. Each day, students prove the reality of those words by achieving academically, socially, and emotionally. Irvine Home School (K-8 Independent Study) opened in the fall of 1990 and assists students, grades K-8, their parents and families who choose to provide quality educational experiences within the context of their own homes rather than participate in the more traditional school model while working with the highly skilled and well-trained professional Irvine Unified teaching staff.

2015-16 School Accountability Report Card for Alternative Education - San Joaquin High School Page 3 of 12
Student Enrollment by Grade Level (School Year 2015-16)
Grade Number of
Level Students
Kindergarten 3
Grade 1 2
Grade 2 3
Grade 3 4
Grade 4 7
Grade 5 9
Grade 6 3
Grade 7 5
Grade 8 7
Grade 9 5
Grade 10 6
Grade 11 12
Grade 12 10
Total Enrollment 76
Student Enrollment by Group (School Year 2015-16)
Student Percent of
Group Total Enrollment
Black or African American 1.3
American Indian or Alaska Native 1.3
Asian 17.1
Filipino 2.6
Hispanic or Latino 11.8
Native Hawaiian or Pacific Islander 2.6
White 52.6
Two or More Races 6.6
Socioeconomically Disadvantaged 9.2
English Learners 2.6
Students with Disabilities 10.5
Foster Youth 0
2015-16 School Accountability Report Card for Alternative Education - San Joaquin High School Page 4 of 12
A. Conditions of Learning
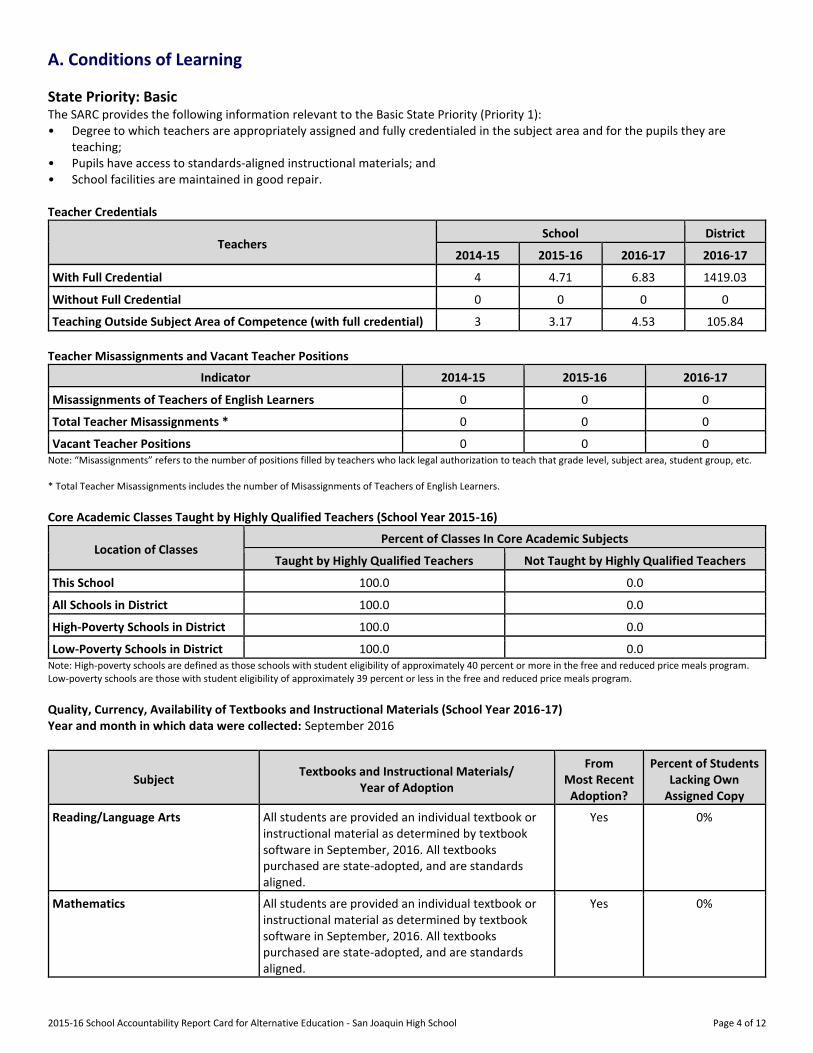
State Priority: Basic The SARC provides the following information relevant to the Basic State Priority (Priority 1): • Degree to which teachers are appropriately assigned and fully credentialed in the subject area and for the pupils they are
teaching; • Pupils have access to standards-aligned instructional materials; and • School facilities are maintained in good repair. Teacher Credentials
Teachers School District
2014-15 2015-16 2016-17 2016-17
With Full Credential 4 4.71 6.83 1419.03
Without Full Credential 0 0 0 0
Teaching Outside Subject Area of Competence (with full credential) 3 3.17 4.53 105.84
Teacher Misassignments and Vacant Teacher Positions
Indicator 2014-15 2015-16 2016-17
Misassignments of Teachers of English Learners 0 0 0
Total Teacher Misassignments * 0 0 0
Vacant Teacher Positions 0 0 0 Note: “Misassignments” refers to the number of positions filled by teachers who lack legal authorization to teach that grade level, subject area, student group, etc. * Total Teacher Misassignments includes the number of Misassignments of Teachers of English Learners. Core Academic Classes Taught by Highly Qualified Teachers (School Year 2015-16)
Location of Classes Percent of Classes In Core Academic Subjects
Taught by Highly Qualified Teachers Not Taught by Highly Qualified Teachers
This School 100.0 0.0
All Schools in District 100.0 0.0
High-Poverty Schools in District 100.0 0.0
Low-Poverty Schools in District 100.0 0.0 Note: High-poverty schools are defined as those schools with student eligibility of approximately 40 percent or more in the free and reduced price meals program. Low-poverty schools are those with student eligibility of approximately 39 percent or less in the free and reduced price meals program. Quality, Currency, Availability of Textbooks and Instructional Materials (School Year 2016-17) Year and month in which data were collected: September 2016
Subject Textbooks and Instructional Materials/
Year of Adoption
From Most Recent
Adoption?
Percent of Students Lacking Own
Assigned Copy
Reading/Language Arts All students are provided an individual textbook or instructional material as determined by textbook software in September, 2016. All textbooks purchased are state-adopted, and are standards aligned.
Yes 0%
Mathematics All students are provided an individual textbook or instructional material as determined by textbook software in September, 2016. All textbooks purchased are state-adopted, and are standards aligned.
Yes 0%

2015-16 School Accountability Report Card for Alternative Education - San Joaquin High School Page 5 of 12
Subject Textbooks and Instructional Materials/
Year of Adoption
From Most Recent
Adoption?
Percent of Students Lacking Own
Assigned Copy
Science All students are provided an individual textbook or instructional material as determined by textbook software in September, 2016. All textbooks purchased are state-adopted, and are standards aligned.
Yes 0%
History-Social Science All students are provided an individual textbook or instructional material as determined by a survey conducted in September 2016. All textbooks purchased are state-adopted, and are standards aligned.
Yes 0%
Foreign Language All students are provided an individual textbook or instructional material. All textbooks purchased are state-adopted, and are standards aligned.
Yes 0%
Health All students are provided an individual textbook or instructional material as determined by textbook software in September, 2016. All textbooks purchased are state-adopted, and are standards aligned.
Yes 0%
Visual and Performing Arts All students are provided an individual textbook and/or instructional material.
Yes 0%
Science Laboratory Equipment (grades 9-12)
All students are provided an individual textbook or
instructional material as determined by textbook
software in November, 2014. All textbooks purchased
are state-adopted, and are standards aligned.
Yes 0%
School Facility Conditions and Planned Improvements (Most Recent Year)
Our emphasis — to ensure a safe school environment for our students — includes the re-certification of our staff in disaster preparedness, such as search and rescue techniques, CPR/First Aid, and in-service activities related to school safety assessments, violence assessments, legal updates, gangs and gang identification, and aggressive involvement by all stakeholders in assuring a safe school environment. Apart from this, we have an annual district safety inspection. Our continued success depends on close working relationships between district administrators and school faculty and staff, as well as the active participation of parents and community leaders. San Joaquin students and staff have an exceptionally excellent collaborative working relationship with the Irvine Police Department’s School Resource Officers and investigators. Students take pride in these relationships and the ability to keep San Joaquin safe. School Facility Good Repair Status (Most Recent Year)
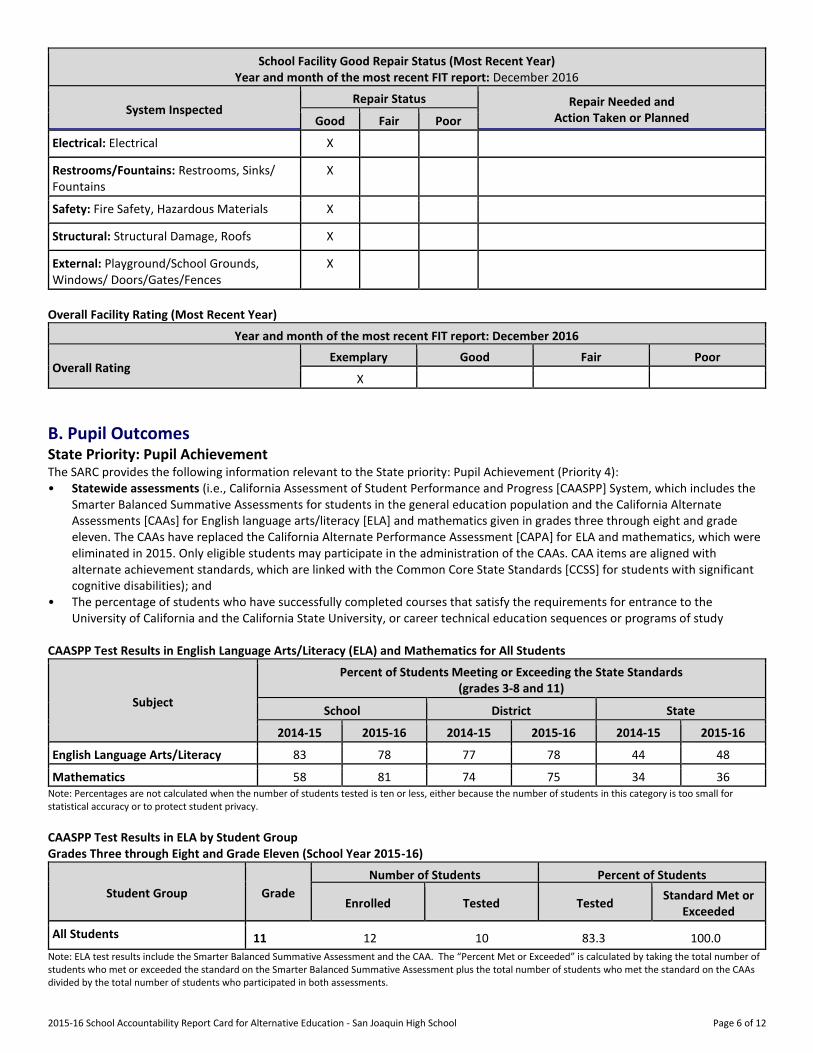
School Facility Good Repair Status (Most Recent Year) Year and month of the most recent FIT report: December 2016
System Inspected Repair Status Repair Needed and
Action Taken or Planned Good Fair Poor
Systems: Gas Leaks, Mechanical/HVAC, Sewer
X
Interior: Interior Surfaces X
Cleanliness: Overall Cleanliness, Pest/ Vermin Infestation
X
2015-16 School Accountability Report Card for Alternative Education - San Joaquin High School Page 6 of 12
School Facility Good Repair Status (Most Recent Year) Year and month of the most recent FIT report: December 2016
System Inspected Repair Status Repair Needed and
Action Taken or Planned Good Fair Poor
Electrical: Electrical X
Restrooms/Fountains: Restrooms, Sinks/ Fountains
X
Safety: Fire Safety, Hazardous Materials X
Structural: Structural Damage, Roofs X
External: Playground/School Grounds, Windows/ Doors/Gates/Fences
X
Overall Facility Rating (Most Recent Year)
Year and month of the most recent FIT report: December 2016
Overall Rating Exemplary Good Fair Poor
X
B. Pupil Outcomes State Priority: Pupil Achievement The SARC provides the following information relevant to the State priority: Pupil Achievement (Priority 4): • Statewide assessments (i.e., California Assessment of Student Performance and Progress [CAASPP] System, which includes the
Smarter Balanced Summative Assessments for students in the general education population and the California Alternate Assessments [CAAs] for English language arts/literacy [ELA] and mathematics given in grades three through eight and grade eleven. The CAAs have replaced the California Alternate Performance Assessment [CAPA] for ELA and mathematics, which were eliminated in 2015. Only eligible students may participate in the administration of the CAAs. CAA items are aligned with alternate achievement standards, which are linked with the Common Core State Standards [CCSS] for students with significant cognitive disabilities); and
• The percentage of students who have successfully completed courses that satisfy the requirements for entrance to the University of California and the California State University, or career technical education sequences or programs of study
CAASPP Test Results in English Language Arts/Literacy (ELA) and Mathematics for All Students
Subject
Percent of Students Meeting or Exceeding the State Standards (grades 3-8 and 11)
School District State
2014-15 2015-16 2014-15 2015-16 2014-15 2015-16
English Language Arts/Literacy 83 78 77 78 44 48
Mathematics 58 81 74 75 34 36 Note: Percentages are not calculated when the number of students tested is ten or less, either because the number of students in this category is too small for statistical accuracy or to protect student privacy.
CAASPP Test Results in ELA by Student Group Grades Three through Eight and Grade Eleven (School Year 2015-16)
Student Group Grade
Number of Students Percent of Students
Enrolled Tested Tested Standard Met or
Exceeded
All Students 11 12 10 83.3 100.0
Note: ELA test results include the Smarter Balanced Summative Assessment and the CAA. The “Percent Met or Exceeded” is calculated by taking the total number of students who met or exceeded the standard on the Smarter Balanced Summative Assessment plus the total number of students who met the standard on the CAAs divided by the total number of students who participated in both assessments.

2015-16 School Accountability Report Card for Alternative Education - San Joaquin High School Page 7 of 12
Double dashes (--) appear in the table when the number of students is ten or less, either because the number of students in this category is too small for statistical accuracy or to protect student privacy. Note: The number of students tested includes all students who participated in the test whether they received a score or not; however, the number of students tested is not the number that was used to calculate the achievement level percentages. The achievement level percentages are calculated using only students who received scores.
CAASPP Test Results in Mathematics by Student Group Grades Three through Eight and Grade Eleven (School Year 2015-16)
Student Group Grade
Number of Students Percent of Students
Enrolled Tested Tested Standard Met or
Exceeded
All Students 11 12 10 83.3 90.0
Note: Mathematics test results include the Smarter Balanced Summative Assessment and the CAA. The “Percent Met or Exceeded” is calculated by taking the total number of students who met or exceeded the standard on the Smarter Balanced Summative Assessment plus the total number of students who met the standard on the CAAs divided by the total number of students who participated in both assessments. Double dashes (--) appear in the table when the number of students is ten or less, either because the number of students in this category is too small for statistical accuracy or to protect student privacy. Note: The number of students tested includes all students who participated in the test whether they received a score or not; however, the number of students tested is not the number that was used to calculate the achievement level percentages. The achievement level percentages are calculated using only students who received scores.
CAASPP Test Results in Science for All Students
Subject
Percent of Students Scoring at Proficient or Advanced (meeting or exceeding the state standards)
School District State
2013-14 2014-15 2015-16 2013-14 2014-15 2015-16 2013-14 2014-15 2015-16
Science (grades 5, 8, and 10) 91 92 89 88 88 87 60 56 54 Note: Science test results include California Standards Tests (CSTs), California Modified Assessment (CMA), and California Alternate Performance Assessment (CAPA) in grades five, eight, and ten. Note: Scores are not shown when the number of students tested is ten or less, either because the number of students in this category is too small for statistical accuracy or to protect student privacy.
CAASPP Test Results in Science by Student Group Grades Five, Eight, and Ten (School Year 2015-16)
Student Group
Total Enrollment
# of Students with Valid Scores
% of Students with Valid Scores
% of Students Proficient or
Advanced
All Students 26 19 73.1 89.5
Male 12 9 75.0 88.9
Female 14 10 71.4 90.0
White 14 10 71.4 90.0 Note: Science test results include CSTs, CMA, and CAPA in grades five, eight, and ten. The “Proficient or Advanced” is calculated by taking the total number of students who scored at Proficient or Advanced on the science assessment divided by the total number of students with valid scores. Note: Scores are not shown when the number of students tested is ten or less, either because the number of students in this category is too small for statistical accuracy or to protect student privacy.
2015-16 School Accountability Report Card for Alternative Education - San Joaquin High School Page 8 of 12
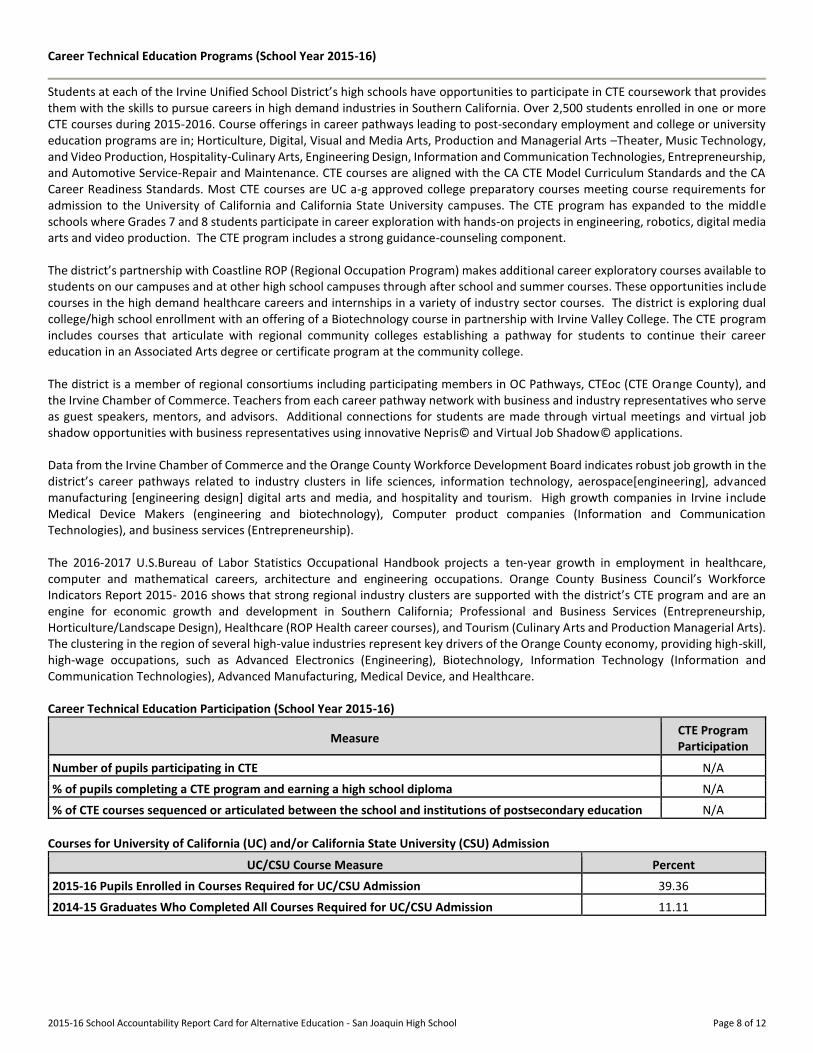
Career Technical Education Programs (School Year 2015-16)
Students at each of the Irvine Unified School District’s high schools have opportunities to participate in CTE coursework that provides them with the skills to pursue careers in high demand industries in Southern California. Over 2,500 students enrolled in one or more CTE courses during 2015-2016. Course offerings in career pathways leading to post-secondary employment and college or university education programs are in; Horticulture, Digital, Visual and Media Arts, Production and Managerial Arts –Theater, Music Technology, and Video Production, Hospitality-Culinary Arts, Engineering Design, Information and Communication Technologies, Entrepreneurship, and Automotive Service-Repair and Maintenance. CTE courses are aligned with the CA CTE Model Curriculum Standards and the CA Career Readiness Standards. Most CTE courses are UC a-g approved college preparatory courses meeting course requirements for admission to the University of California and California State University campuses. The CTE program has expanded to the middle schools where Grades 7 and 8 students participate in career exploration with hands-on projects in engineering, robotics, digital media arts and video production. The CTE program includes a strong guidance-counseling component. The district’s partnership with Coastline ROP (Regional Occupation Program) makes additional career exploratory courses available to students on our campuses and at other high school campuses through after school and summer courses. These opportunities include courses in the high demand healthcare careers and internships in a variety of industry sector courses. The district is exploring dual college/high school enrollment with an offering of a Biotechnology course in partnership with Irvine Valley College. The CTE program includes courses that articulate with regional community colleges establishing a pathway for students to continue their career education in an Associated Arts degree or certificate program at the community college. The district is a member of regional consortiums including participating members in OC Pathways, CTEoc (CTE Orange County), and the Irvine Chamber of Commerce. Teachers from each career pathway network with business and industry representatives who serve as guest speakers, mentors, and advisors. Additional connections for students are made through virtual meetings and virtual job shadow opportunities with business representatives using innovative Nepris© and Virtual Job Shadow© applications. Data from the Irvine Chamber of Commerce and the Orange County Workforce Development Board indicates robust job growth in the district’s career pathways related to industry clusters in life sciences, information technology, aerospace[engineering], advanced manufacturing [engineering design] digital arts and media, and hospitality and tourism. High growth companies in Irvine include Medical Device Makers (engineering and biotechnology), Computer product companies (Information and Communication Technologies), and business services (Entrepreneurship). The 2016-2017 U.S.Bureau of Labor Statistics Occupational Handbook projects a ten-year growth in employment in healthcare, computer and mathematical careers, architecture and engineering occupations. Orange County Business Council’s Workforce Indicators Report 2015- 2016 shows that strong regional industry clusters are supported with the district’s CTE program and are an engine for economic growth and development in Southern California; Professional and Business Services (Entrepreneurship, Horticulture/Landscape Design), Healthcare (ROP Health career courses), and Tourism (Culinary Arts and Production Managerial Arts). The clustering in the region of several high-value industries represent key drivers of the Orange County economy, providing high-skill, high-wage occupations, such as Advanced Electronics (Engineering), Biotechnology, Information Technology (Information and Communication Technologies), Advanced Manufacturing, Medical Device, and Healthcare. Career Technical Education Participation (School Year 2015-16)
Measure CTE Program Participation
Number of pupils participating in CTE N/A
% of pupils completing a CTE program and earning a high school diploma N/A
% of CTE courses sequenced or articulated between the school and institutions of postsecondary education N/A
Courses for University of California (UC) and/or California State University (CSU) Admission
UC/CSU Course Measure Percent
2015-16 Pupils Enrolled in Courses Required for UC/CSU Admission 39.36
2014-15 Graduates Who Completed All Courses Required for UC/CSU Admission 11.11

2015-16 School Accountability Report Card for Alternative Education - San Joaquin High School Page 9 of 12
C. Engagement
State Priority: Parental Involvement The SARC provides the following information relevant to the Parental Involvement State Priority (Priority 3): • Efforts the school district makes to seek parent input in making decisions for the school district and each schoolsite. Opportunities for Parental Involvement (School Year 2016-17)
Our parents are involved in student-parent-staff conferences, home instruction with their sons and daughters, field days and field trips/Irvine Home School, instructional workshops and seminars/Irvine Home School.
State Priority: Pupil Engagement The SARC provides the following information relevant to the Pupil Engagement State Priority (Priority 5): • High school dropout rates; and • High school graduation rates. Dropout Rate and Graduation Rate (Four-Year Cohort Rate)
Indicator School District State
2012-13 2013-14 2014-15 2012-13 2013-14 2014-15 2012-13 2013-14 2014-15
Dropout Rate 15.40 18.50 34.60 2.40 2.60 2.80 11.40 11.50 10.70
Graduation Rate 80.77 81.48 65.38 95.48 95.78 94.75 80.44 80.95 82.27
Completion of High School Graduation Requirements - Graduating Class of 2015 (One-Year Rate)
Group Graduating Class of 2015
School District State
All Students 100 96 86
Black or African American 0 87 78
American Indian or Alaska Native 0 100 78
Asian 100 97 93
Filipino 0 98 93
Hispanic or Latino 100 93 83
Native Hawaiian/Pacific Islander 0 100 85
White 100 95 91
Two or More Races 100 94 89
Socioeconomically Disadvantaged 0 84 66
English Learners 0 75 54
Students with Disabilities 67 92 78

2015-16 School Accountability Report Card for Alternative Education - San Joaquin High School Page 10 of 12
State Priority: School Climate The SARC provides the following information relevant to the School Climate State Priority (Priority 6): • Pupil suspension rates; • Pupil expulsion rates; and • Other local measures on the sense of safety. Suspensions and Expulsions
Rate School District State
2013-14 2014-15 2015-16 2013-14 2014-15 2015-16 2013-14 2014-15 2015-16
Suspensions------- 0.0 0.5 0.0 1.3 1.4 1.2 4.4 3.8 3.7
Expulsions------- 0.0 0.0 0.0 0.0 0.0 0.0 0.1 0.1 0.1
School Safety Plan (School Year 2016-17)
Our emphasis — to ensure a safe school environment for our students — includes the re-certification of our staff in disaster preparedness, such as search and rescue techniques, CPR/First Aid, and in-service activities related to school safety assessments, violence assessments, legal updates, gangs and gang identification, and aggressive involvement by all stakeholders in assuring a safe school environment. Apart from this, we have an annual district safety inspection. Our continued success depends on close working relationships between district administrators and school faculty and staff, as well as the active participation of parents and community leaders. San Joaquin students and staff have an exceptionally excellent collaborative working relationship with the Irvine Police Department’s School Resource Officers and investigators. Students take pride in these relationships and the ability to keep San Joaquin safe.
D. Other SARC Information The information in this section is required to be in the SARC but is not included in the state priorities for LCFF. Federal Intervention Program (School Year 2016-17)
Indicator School District
Program Improvement Status In PI
First Year of Program Improvement 2012-2013
Year in Program Improvement* Year 3
Number of Schools Currently in Program Improvement N/A 7
Percent of Schools Currently in Program Improvement N/A 46.7 Note: Cells with N/A values do not require data.
Average Class Size and Class Size Distribution (Elementary)
Grade Level
2013-14 2014-15 2015-16
Avg. Class Size
Number of Classes Avg. Class Size
Number of Classes Avg. Class Size
Number of Classes
1-20 21-32 33+ 1-20 21-32 33+ 1-20 21-32 33+
K
4 1 20 1 1 1
1
8 1 2 1
2
6 1 1 1
3
10 1 4 1
4
8 1 8 1
5
7 1 9 1
6
8 1 21 1 7 1 Number of classes indicates how many classes fall into each size category (a range of total students per class).

2015-16 School Accountability Report Card for Alternative Education - San Joaquin High School Page 11 of 12
Average Class Size and Class Size Distribution (Secondary)
Subject
2013-14 2014-15 2015-16
Avg. Class Size
Number of Classrooms Avg. Class Size
Number of Classrooms Avg. Class Size
Number of Classrooms
1-22 23-32 33+ 1-22 23-32 33+ 1-22 23-32 33+
English------- ----------
4 10 5 6 5.5 6
Mathematics ----------
3 8 4.33 6
Science------- ----------
4 8 2 3 9 5
Social Science ----------
5 9 5 9 3.36 14 Note: Number of classes indicates how many classrooms fall into each size category (a range of total students per classroom). At the secondary school level, this information is reported by subject area rather than grade level. Academic Counselors and Other Support Staff (School Year 2015-16)
Title Number of FTE
Assigned to School Average Number of Students per
Academic Counselor
Academic Counselor------- 0 0
Counselor (Social/Behavioral or Career Development) 0 N/A
Library Media Teacher (Librarian) 0 N/A
Library Media Services Staff (Paraprofessional) 0 N/A
Psychologist------- 0.06 N/A
Social Worker------- 0 N/A
Nurse------- 0 N/A
Speech/Language/Hearing Specialist 0 N/A
Resource Specialist------- 0 N/A
Other------- 0 N/A Note: Cells with N/A values do not require data. *One Full Time Equivalent (FTE) equals one staff member working full time; one FTE could also represent two staff members who each work 50 percent of full time.
Expenditures per Pupil and School Site Teacher Salaries (Fiscal Year 2014-15)
Level
Expenditures Per Pupil Average Teacher Salary Total
Supplemental/ Restricted
Basic/ Unrestricted
School Site------- $17,982 $8 $17,975 $91,826
District------- N/A N/A $4,979 $77,121
Percent Difference: School Site and District N/A N/A 261.0 19.1
State------- N/A N/A $5,677 $75,837
Percent Difference: School Site and State N/A N/A 216.6 21.1 Note: Cells with N/A values do not require data.
Types of Services Funded (Fiscal Year 2015-16)
The Local Control Funding Formula has replaced California’s previous method of allocating funds to school districts. In place of more than 40 specific funding categories, the new model has established three sources of state funding with increased local discretion to determine how best to spend those funds in the service of students. All districts receive a base of per-student funding that varies slightly depending on grade level. All districts also receive supplemental funding. This additional funding adds 20 percent to the base funding for each English-language learner, low-income student and foster youth. Finally, concentration grant funding equal to 50 percent of the base is provided to districts in which English-learners, low-income students and foster youth exceed 55 percent of the total enrollment. Irvine Unified School District is not eligible for concentration funding because its enrollment does not exceed the 55 percent threshold.

2015-16 School Accountability Report Card for Alternative Education - San Joaquin High School Page 12 of 12
Teacher and Administrative Salaries (Fiscal Year 2014-15)
Category District Amount State Average for Districts In Same Category
Beginning Teacher Salary $44,105 $45,092
Mid-Range Teacher Salary $78,770 $71,627
Highest Teacher Salary $101,821 $93,288
Average Principal Salary (Elementary) $118,926 $115,631
Average Principal Salary (Middle) $123,149 $120,915
Average Principal Salary (High) $139,516 $132,029
Superintendent Salary $264,920 $249,537
Percent of Budget for Teacher Salaries 38% 37%
Percent of Budget for Administrative Salaries 5% 5% For detailed information on salaries, see the CDE Certificated Salaries & Benefits Web page at http://www.cde.ca.gov/ds/fd/cs/. Advanced Placement (AP) Courses (School Year 2015-16)
Subject Number of AP Courses Offered* Percent of Students In AP Courses
Computer Science 0 N/A
English------- 0 N/A
Fine and Performing Arts 0 N/A
Foreign Language 0 N/A
Mathematics 0 N/A
Science------- 0 N/A
Social Science 1 N/A
All courses 1 1.9% Cells with N/A values do not require data. *Where there are student course enrollments of at least one student.
Professional Development (Most Recent Three Years)
High quality staff development, like quality teaching, is learning-based, activity driven, focused on instructional improvement and is an on-going process of professional renewal. San Joaquin and Irvine Home School's Continuous Improvement Efforts enable professional staff to reexamine their assumptions about teaching and learning. Staff development activities include significant time to develop personalized responses to instructional improvement with both appropriate collegial and expert assistance networking. High quality staff development challenges professional staff to make learning dynamic, intellectually stimulating, and connected to thinking which goes beyond the classroom walls. Effective staff development creates a learning community among professional staff that strengthens the individual teacher and the bond among teachers. Tailored staff development activities are essential for maintaining and improving quality education. District-wide general staff development activities included: performance assessment, thinking skills enhancement, Language Development Specialist credential training, technology-based skills training, diversity training, and content-based reading strategies. Over the past three years the San Joaquin Schools (San Joaquin High School and Irvine Home School) staff development emphasis was on activities tailored to the needs of the school. Here is a partial listing of staff development activities: • Students’ personality and learning styles • Results-based Learning and Assessmen • Instructional strategies for home school students/parents – making the most effective use of independent study • Online Instruction • CST Test Analysis and Implications • Effective Reading and Writing Strategies in the Content Areas • English-Language Arts – Normative writing • Across the Curriculum Writing Standards Rubric Pursuant to new state guidelines a total of three days per year are allocated for targeted staff development activities.