Salinity in the Central Valley and Sacramento-San Joaquin Delta
CALIFORNIA ENVIRONMENTAL PROTECTION AGENCY
REGIONAL WATER QUALITY CONTROL BOARD
CENTRAL VALLEY REGION
Sacramento and San Joaquin Delta Pesticides Monitoring Report
2002 and 2003
August 2004
STATE OF CALIFORNIA
RE
GIO
NA
LW
ATER QUALITY CONTRO
LB
OA
RD
★ ★
CENTRALVALLEYREGION

State of California
California Environmental Protection Agency
REGIONAL WATER QUALITY CONTROL BOARD CENTRAL VALLEY REGION
Robert Schneider, Chair
Karl E. Longley, Vice Chair Beverly Alves, Member Alson Brizard, Member
Christopher Cabaldon, Member Cher Kablanow, Member
Robert Fong, Member Lucille Palmer-Byrd, Member
Thomas R. Pinkos, Executive Officer
11020 Sun Center Drive, # 200
Rancho Cordova, CA 95670-6114
Phone: (916) 464-3291
D I S C L A I M E R
This publication is a technical report by staf f of the Cali fornia Regional Water Quali ty Control Board, Central Valley Region.
No policy or regulation is ei ther expressed or intended.

CALIFORNIA ENVIRONMENTAL PROTECTION AGENCY
REGIONAL WATER QUALITY CONTROL BOARD CENTRAL VALLEY REGION
Sacramento and San Joaquin Delta Pesticides Monitoring Report
2002 and 2003
August 2004
REPORT PREPARED BY:
Zhimin Lu, Water Resource Control Engineer

i
TABLE OF CONTENTS LIST OF FIGURES ............................................................................................................ ii LIST OF TABLES.............................................................................................................. ii APPENDICES .................................................................................................................... ii DISCLAIMER ................................................................................................................... iii ACKNOWLEDGEMENTS............................................................................................... iii 1 INTRODUCTION .......................................................................................................... 1 1.1 Delta Overview ................................................................................................... 1 1.2 Delta Monitoring 2002 – 2003 Overview........................................................... 1
2 2002 – 2003 DELTA MONITORING METHODS ....................................................... 2 2.1 Sampling Sites .................................................................................................... 2 2.2 Sampling Frequency ........................................................................................... 2 2.3 Sample Collection............................................................................................... 3 2.4 Field Measurements ............................................................................................ 4 2.5 Chemical Analysis .............................................................................................. 4
3 2002-2003 DELTA MONITORING RESULTS............................................................ 4 3.1 Chemical Concentrations .................................................................................... 4 3.2 Quality Control Data........................................................................................... 6 3.3 Flow Measurements and Load Calculations ....................................................... 7 3.4 Field Parameter Measurements........................................................................... 7 3.5 Precipitation Measurements................................................................................ 8
4 DISCUSSION AND CONCLUSIONS .......................................................................... 8 4.1 Diazinon.............................................................................................................. 8 4.2 Chlorpyrifos ........................................................................................................ 9 4.3 Future work....................................................................................................... 10
5 REFERENCES ............................................................................................................. 10

ii
LIST OF FIGURES Figure 1. Study area and monitoring sites ………………………………………………12 Figure 2. Diazinon concentrations for all sites by month ……………………………….13 Figure 3. Diazinon concentrations by sampling site …………………………………….13 Figure 4. Chlorpyrifos concentrations for all sites by month ……………………...……14 Figure 5. Chlorpyrifos concentrations by sampling site ………………………………...14 Figure 6. Observed diazinon concentrations during storms ……………………………..15 Figure 7. Observed chlorpyrifos concentrations during storms ………………………....15 Figure 8. Measured temperature (°C) by month ………………………………………...16 Figure 9. Measured temperature (°C) by sampling site …………………………………16 Figure 10. Measured pH by month ……………………………………………….……..17 Figure 11. Measured pH by sampling site ………………………………………………17 Figure 12. Measured EC (µS) by month ………………………………………………...18 Figure 13. Measured EC (µS) by sampling site …………………………………………18 Figure 14. Monthly rainfall during sampling period ……………………………………19 Figure 15. Flow rates and diazinon loads at Ulatis Creek site during storms..…………..19 Figure 16. Flow rates and chlorpyrifos loads at Ulatis Creek site during storms …….…20 LIST OF TABLES Table 1. Primary sampling sites and descriptions.………………………...…………….22 Table 2. Diazinon and chlorpyrifos concentrations during storms………………………24 Table 3. Calculated maximum instantaneous loads (g/day).…………………………….24 Table 4. Summary of field spike sample recovery.……….……………………………..24 Table 5. Summary of lab spike sample recovery..……………………………………….25 Table 6. Relative percent difference (RPD) of duplicates.………………………………25 Table 7. Summary of surrogate analysis percent recovery for all samples.…….……….25 Table 8. Average monthly diazinon use from 1993 to 2002.………….…………………26 Table 9. Average monthly chlorpyrifos use from 1993 to 2002.………………………...26 APPENDICES Table A1. Diazinon and chlorpyrifos concentrations Table A2. Pesticide results (excluding diazinon and chlorpyrifos) Table A3. Field spike percent recovery Table A4. Field duplicates Table A5. Lab blank data Table A6. Recovery of lab spikes and surrogates Table A7. Flow rates and instantaneous loads

iii
DISCLAIMER Mention of trade names or commercial products in this report does not constitute endorsement or recommendation for use. ACKNOWLEDGEMENTS The project could not be completed successfully without the efforts of the entire team. First, I would like to thank Henry Calanchini, Anja Wehrmann, and all the people who worked in the Delta Sampling Team from the University of California, Davis for their field sampling efforts. Second, thanks go to Nate Martin, Debbie Daniels, and Jessica Dyke from the CVRWQCB for their sample collection efforts. Third, thanks go to Mark Lee, Stephen Siegel, and staff from the California Department of Food and Agriculture lab for conducting the chemical analysis. Fourth, thanks go to Shakoora Azimi-Gaylon from the CVRWQCB who served as the UCD contract manager. Special thanks go to Gene Davis from the CVRWQCB for providing the GIS map and investigation of the sampling sites. Lastly, a thank you goes to Joe Karkoski from the CVRWQCB for reviewing the monitoring plan and this report.

1
1 INTRODUCTION 1.1 Delta Overview The Sacramento and San Joaquin Delta (Delta) covers 1,153 square miles with 78 square miles of water. Agricultural land use covers about 538,000 acres, which is about 73% of the total land in the Delta. The Delta receives over 40% of the State’s runoff, mostly from the Sacramento and San Joaquin rivers. The tide affects the flow direction and water level in individual waterways. For example, the flows in the Sacramento River at Rio Vista can vary from 71,000 cubic feet per second (cfs) upstream to 80,000 cfs downstream (DWR, 1995). Pesticides used within the Delta are important sources for the occurrence of pesticides found in the Delta waterways. From 1993 to 2002, the average annual reported diazinon and chlorpyrifos uses within the Delta were approximately 12,000 and 30,000 lbs, respectively. In 2002, about 8,000 lbs of diazinon and 19,000 lbs of chlorpyrifos were reportedly applied for agricultural, commercial structural, and landscape purposes (DPR PUR database, 2002). The Delta was monitored between June 2002 and May 2003 for the identification of diazinon and chlorpyrifos sources. The monitoring includes surface water sample collection and field parameter measurements. Over 400 samples were collected during the one-year program. 1.2 Delta Monitoring 2002 – 2003 Overview From June to December 2002, 14 primary sites were monitored on a monthly basis. In January and February 2003, nine primary sites were monitored during and following two storms events (5 or 6 days per storm event) on a daily basis and five primary sites were monitored on a monthly basis. From early March to April 2003, ten primary sites were monitored twice per week and four primary sites were monitored weekly. During this period, five additional sites were monitored weekly. In May 2003, only the primary sites were monitored: seven sites were sampled weekly and the other seven sites were sampled twice per month. The measured field parameters included pH, water temperature, electrical conductivity (EC), and flow rates for selected sites and sampling periods. All water samples were sent to the California Department of Food and Agriculture (CDFA) laboratory in Sacramento, California for chemical analysis using gas chromatography (GC) and a flame photometric detector (FPD). From June to December 2002, water samples were collected by the Central Valley Regional Water Quality Control Board (CVRWQCB) staff and students. From January to May 2003, water samples were collected by a monitoring team at the University of California, Davis (UCD) under a contract with the CVRWQCB. The CDFA laboratory analyzed 17 chemical compounds for each water sample. The chemical analysis results obtained from the laboratory and parameters measured in the field are presented in this report. The detection frequency and calculated instantaneous loads for diazinon and chlorpyrifos are also presented.

2
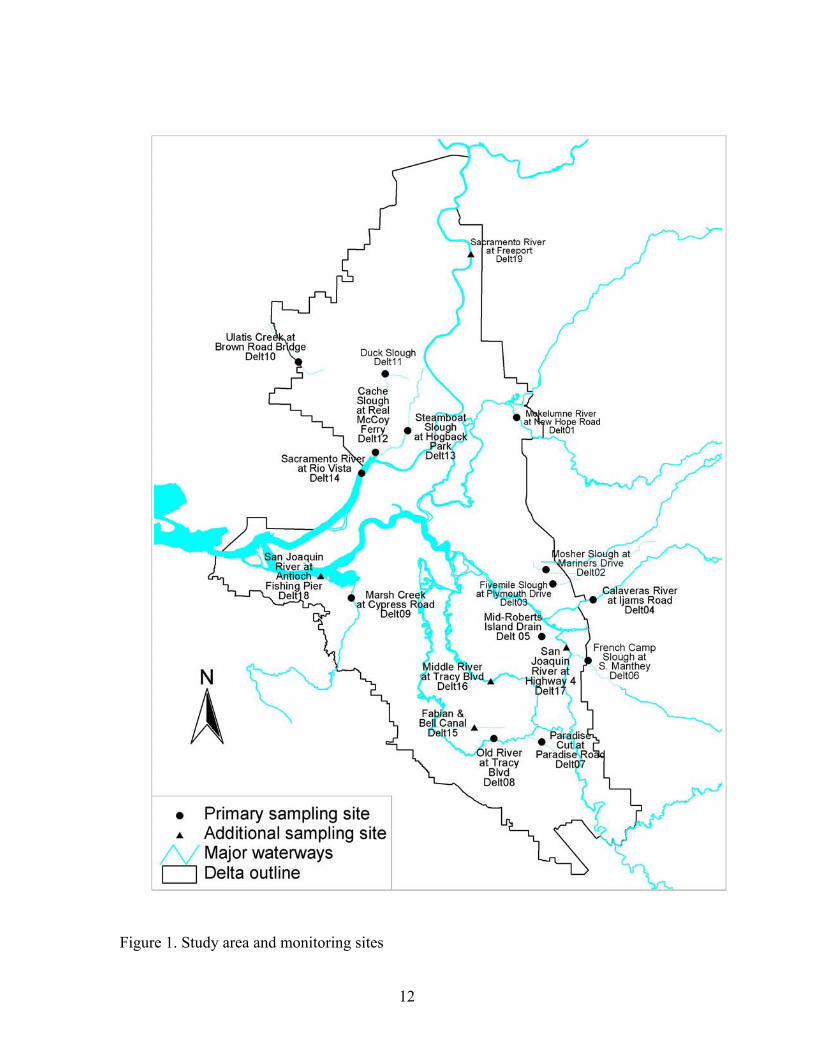
2 2002 – 2003 DELTA MONITORING METHODS 2.1 Sampling Sites Figure 1 shows the study area and monitoring sites. Site descriptions for each site are listed in Table 1. The monitoring plan was designed to monitor the pesticide concentrations in the main rivers, back sloughs, agricultural drains, and urban areas of the Delta. Of the 14 primary sites (Delt01 to Delt14), the Mokelumne River (Delt01) and Sacramento River (Delt14) sites are in the main rivers; Mosher Slough (Delt02) and Five Mile Slough (Delt03) are in back sloughs of urban areas; Mid-Roberts Island Drain (Delt05) and Duck Slough (Delt11) are in main drains of agricultural fields; and the remaining sites are in back sloughs that drain primarily agricultural areas. To determine the pesticide distributions in the Delta, the selected sites include the boundaries and interior of the Delta. The sampling sites at Mokelumne River (Delt01), Calaveras River (Delt04), French Camp Slough (Delt06), and Ulatis Creek (Delt10) are located near, or at the Delta boundary. The Mokelumne and Calaveras Rivers are two major rivers that carry most of the flow, including runoff from upstream agricultural lands, from east of the Delta. French Camp Slough is a back slough that contains runoff from agricultural lands southeast of Stockton. Ulatis Creek is a back slough that receives runoff from agricultural land in Solano and Yolo counties. The other sites are within the Delta. The sampling sites at Mid-Roberts Island Drain (Delt05), Paradise Cut (Delt07), and Old River at Tracy Road (Delt08) are located in the southern Delta and receive runoff from agricultural lands. In particular, Delt05 is located in alfalfa fields. The sites at Duck Slough (Delt11), Steamboat Slough (Delt12), and Cache Slough (Delt13) are located in the northwest part of the Delta, where the runoff is from agricultural areas including alfalfa fields and pear orchards. The Mosher Slough (Delt02) and Five Mile Slough (Delt03) sites are located in the northern part of the Stockton urban area and likely represent urban runoff from the city of Stockton. The Five Mile Slough site is downstream of a golf course. The Fabian and Bell Canal (Delt15) and Middle River (Delt16) sites are located in the southern Delta, where the main source is probably agricultural runoff. The San Joaquin River at Highway 4 (Delt17), San Joaquin River at Antioch (Delt18), and Sacramento River near Freeport (Delt19) sites are located on major rivers. Delt17 is located inside the Delta, where the upstream runoff is mainly from agricultural fields. Delt18 is located west of the Delta and represents the output of the Delta from San Joaquin River. Delt19 represents the input to the Delta from the Sacramento River. 2.2 Sampling Frequency The monitoring frequencies varied for different sampling sites. From June to December 2002, all 14 primary sampling sites (Delt01 to Delt14) were monitored on a monthly basis (Table 1). The samples were collected during the third week of each month, typically over two days, with approximately seven sites visited each day. In January and February 2003, five sampling sites (Delt04 to Delt08) were monitored on a monthly basis (Table 1). The other nine primary sites (Delt01 to Delt03, and Delt09 to Delt14) were sampled daily during two storms. The first storm was from January 21 to
3
25, 2003. The second storm was from February 13 to 17, 2003. Delt01 to Delt03 and Delt09 to Delt12 were sampled once per day over each five-day storm event. Delt13 and Delt14 were sampled over a six-day period (for one more day after each storm event). The six-day storm sampling was designed to capture the pesticides transported from the upstream portion of the Sacramento River watershed. From March to May 2003, seven primary sites (Delt04 to Delt10) were monitored weekly and the other seven primary sites were sampled twice per month, except between March 12 and April 4, 2003. From March 12 to April 4, 2003, additional sampling sites Delt15 to Delt19 were monitored once per week, primary sites Delt01, Delt04, Delt08, and Delt09 were sampled once per week, and the other primary sampling sites were monitored twice per week. 2.3 Sample Collection All water samples were collected using grab sampling methods. Two types of sample bottles were used for water collection: a 3-liter Teflon bottle (3-liter bottle) and a 1-liter amber glass bottle (1-liter bottle). The 3-liter bottle was placed into a metal holder to collect water samples from bridges. In some cases, the samples were collected from three points equally spaced across the bridge with approximately equal amounts of water collected at each point. The 1-liter bottle was fastened to a sampling pole to collect samples near the stream banks. All water samples submitted to the CDFA lab required a 1-liter bottle. Thus, approximately one-third of the sample collected using the 3-liter bottle was poured into a 1-liter bottle onsite at the time of sample collection. Approximately 15% of all of the field samples were quality control (QC) samples. QC samples included field duplicates, field blanks, equipment blanks, and field spike samples. The duplicates were split samples. For samples collected using the 3-liter Teflon bottle, the water was poured into two 1-liter bottles. For samples collected using a 1-liter bottle, two bottles were tied to the sampling pole and the water samples were collected at the same time. The field blanks were organic-free water. If using the 3-liter bottle for sampling, the cleaned bottle was filled with organic-free water (deionized), which was then poured into a 1-liter bottle as a field blank. If using the 1-liter bottle, a cleaned bottle was filled with the organic-free water directly. The equipment blanks were collected only for new (never been used) sampling equipment (e.g. metal holder and sampling pole). The equipment was cleaned according to the standard cleaning procedure (Lu, 2002) and then rinsed with organic-free water. The rinse water was collected in a 1-liter bottle as an equipment blank. The field spike samples were collected in the same manner as the field duplicate samples, however a spike mixture was added to the field spike samples in the lab. All field samples, including QC samples, were placed into an ice chest (ice chest was filled with ice to keep the temperature of samples at approximately 4°C). In general, samples were delivered under chain-of-custody (COC) protocol to the lab on the sampling day. If the samples could not be transported to the lab on the sampling day, the samples were stored in a refrigerator (approximately 4°C) and then transported to the lab within 3 days.

4
To minimize the dilution of pollutants caused by an influx of water during high tides, the samples should have been collected during low or outgoing tides. However, since several sampling sites were visited each sampling day, some samples might have been collected during rising tides. 2.4 Field Measurements Flow rate, pH, water temperature, and EC were measured at the time of water sample collection at selected sites. The instantaneous flow was measured at four sites (Delt01, Delt04, Delt09, and Delt10). The flow rate for each site was calculated by multiplying the measured flow velocity by each cross-sectional area. Flow velocities were measured with a Sworrer Current Velocity meter (Model 2100). Flow velocity measurements were made either by wading across the stream or by suspending the flowmeter from a bridge. For flow rate measurements made from bridges that were not perpendicular to the stream channel, the flow rate was corrected using an appropriate coefficient (Nolan et al., 2001). 2.5 Chemical Analysis The CDFA lab conducted the organophosphate insecticides analysis using GC FPD. Seventeen compounds were analyzed for each sample. The limits of quantitation (LOQ) for diazinon and chlorpyrifos were 20 and 10 nanograms per liter (ng/L), respectively. The detection limits (LOD) were 7 and 4 ng/L for diazinon and chlorpyrifos, respectively. The lab reported estimated values when the values were below the LOQ but above the LOD. To ensure the accuracy and precision of the sample analysis, lab spikes, blanks, and a surrogate standard (chlorpyrifos methyl) were used. If the recovery of a spike sample was out of the control range, the water sample was re-analyzed. 3 2002-2003 DELTA MONITORING RESULTS The results include pesticide concentrations, field parameter measurements, and quality control data. The diazinon and chlorpyrifos concentrations are listed in Table A1, and other chemical components are listed in Table A2. Tables A3 and A4 list the results of field spikes and duplicates, respectively. For each analytical set of environmental samples, the laboratory analyzed at least one spike and one blank. For each environmental sample, chlorpyrifos methyl was added as a surrogate and analyzed. Table A5 lists the results of the lab blanks and Table A6 lists the recoveries of lab spikes and surrogates. 3.1 Chemical Concentrations The concentrations of diazinon and chlorpyrifos were compared to their respective California Department of Fish Game (CDFG) freshwater Criterion Continuous Concentration (CCC) and Criterion Maximum Concentration (CMC) values (Siepmann and Finlayson, 2000). Since all of the samples were collected as grab samples, the analytical results may not reflect the four-day and one-hour average values upon which the CCC and CMC, respectively, are based.

5
The diazinon concentrations were evaluated by month and by site using boxplots (Figures 2 and 3, respectively). The highest diazinon concentration (460 ng/L) was observed in January at the Five Mile Slough site (Table A1). Relatively high concentrations were observed between January and April at the Mosher Slough (Delt02), Five Mile Slough (Delt03), Calaveras River (Delt04), Marsh Creek (Delt09), and Ulatis Creek (Delt10) sites. In September, a high diazinon concentration (110 ng/L) was detected at the Calaveras River site. In May, June, August, and October, the maximum diazinon concentrations were above the LOQ (20 ng/L) but below the diazinon CMC (80 ng/L). In July, no diazinon was detected. In November and December, high diazinon concentrations were detected at the Mosher Slough site (Delt02). The maximum diazinon concentrations detected at the Mokelumne River (Delt01), Mid-Roberts Island (Delt05), Old River (Delt08), Duck Slough (Delt11), and Sacramento River at Rio Vista (Delt14) sites were over the LOQ but below the diazinon CMC. Diazinon concentrations were not detected above the LOQ at the Paradise Cut (Delt07), Steamboat Slough (Delt12), Cache Slough (Delt13), Fabian and Bell Canal (Delt15), Middle River (Delt16), San Joaquin River at Hwy 4 (Delt17), San Joaquin River at Antioch (Delt18), and Sacramento River at Freeport (Delt19) sites. The chlorpyrifos concentrations were also analyzed by month and by site using boxplots (Figures 4 and 5, respectively). The highest chlorpyrifos concentration (360 ng/L) was observed in March at the Mid-Roberts Island Drain site. Relatively high chlorpyrifos concentrations were observed from January to May (Figure 4). In July and August, the concentrations were above the LOQ (10 ng/L) but below the chlorpyrifos CCC (14 ng/L). In June, October, and November, no chlorpyrifos was detected above the LOQ. In September, the highest chlorpyrifos concentrations were equal to the CMC (20 ng/L). On December 23, samples collected from all of the sites had chlorpyrifos concentrations between 20 ng/L and 40 ng/L, including sites at which chlorpyrifos was not detected in other months, (the Mokelumne River, Steamboat, Cache Slough, and Sacramento River at Rio Vista sites). The highest chlorpyrifos concentrations were observed at Mid-Roberts Island Drain (360 ng/L) and Ulatis Creek (110 ng/L) (Table A1 and Figure 5). Samples from most of the sites had observed chlorpyrifos concentrations over 20 ng/L during the entire sampling period (Table A1). Samples collected from the Fabian and Bell Canal, Middle River, and San Joaquin River at Hwy 4 sites (samples were collected only between March 12 and April 4, 2003) contained chlorpyrifos concentrations greater than the LOQ (10 ng/L) but lower than the chlorpyrifos CMC value (20 ng/L). Samples collected during the same limited period from the San Joaquin River at Antioch and Sacramento River near Freeport sites did not contain chlorpyrifos concentrations above the LOQ. Monthly sampling at the Calaveras River, Mid-Roberts Island, French Camp Slough, Paradise Cut, and Old River at Tracy Rd sites coincided with two storms. Diazinon

6
concentrations from samples collected at three of these five sites (Calaveras River, Mid-Robert Island, and French Camp Slough) were above the diazinon LOQ (Table A2). The maximum diazinon concentration was 220 ng/L at the Calaveras River site. Chlorpyrifos was not detected above the chlorpyrifos LOQ at any of the five sites. During the two storm sampling events, diazinon concentrations above the diazinon CCC value (50 ng/L) were also detected at the Mosher Slough, Five Mile Slough, Marsh Creek, and Ulatis Creek sites and chlorpyrifos concentrations above the chlorpyrifos CCC value (14 ng/L) were only detected at the Ulatis Creek site (Table 2). The relationships between daily rainfall amounts and diazinon concentrations are shown in Figure 6. The relationships between rainfall amounts and chlorpyrifos concentrations are shown in Figure 7. 3.2 Quality Control Data The precision and accuracy of the chemical analyses are determined by field and lab QC data. The field QC data includes the analytical results of spike, duplicate, and blank samples. The spike sample results are used to evaluate the accuracy of the analytical process and system performance. The field spike samples included the addition of 100 ng/L diazinon, 50 ng/L chlorpyrifos, and 200 ng/L bifenthrin at the laboratory. The lab spikes were prepared in the laboratory using organic-free water with the same amounts of pesticides added as the field spikes. The lab blanks were used to identify possible contamination during sample preparation and chemical analysis in the laboratory. The lab QC samples were prepared and analyzed for each analytical set of field samples. In addition, the surrogate compound (500 ng/L chlorpyrifos methyl) was added to all samples to evaluate sample recovery. The surrogate recovery provides an indicator of the accuracy of each sample analysis. The field duplicate sample results are used to estimate the precision of laboratory analysis and the sampling process. Relative percentage differences (RPD) were calculated to determine the variability between primary and duplicate samples. The blank samples are used to determine the magnitude of any contamination during sample handling in the field and laboratory. The field and equipment blanks were analyzed to detect possible contamination that could occur during sampling, handling, transporting, and lab analysis. The ranges and averages of recovery values for lab and field spike samples (Tables 4 and 5, respectively) were similar for each spiked compound. The low average recovery values for each compound suggest that the results “under-estimated” the actual (spiked) concentrations. The lowest recoveries for all three spiked compounds occurred in the samples collected at Marsh Creek on January 24, 2003 (Table A3). The sample was re-injected but the re-analyzed results were still quite low (48%, 62%, and 34% for diazinon, chlorpyrifos, and bifenthrin, respectively). Of a total of 22 duplicate samples, only five associated primary samples contained analytes that exceeded their respective LOQs (Table 6). The highest RPD (23% for chlorpyrifos) had a high bias because the concentrations of the duplicate samples were

7
very close to the LODs. The calculated RPD of lab and field duplicates are less than 10% except for samples near the LOQ, therefore, the precision of analyzed data are acceptable. Analytes in all blank samples were below their respective LODs, except for one sample that contained simazine at an estimated concentration of 9 ng/L (LOD = 5 ng/L). Since the present study focused on diazinon and chlorpyrifos, the blank sample results are acceptable. For individual samples, the surrogate recoveries met the lab acceptance range (50% to 150%). The averages and standard deviations for the recovery of surrogate samples were 75% ±10% for lab control samples, 79%±9% for field QC samples, and 80%±11% for primary field samples (Table 7). 3.3 Flow Measurements and Load Calculations The measured instantaneous flow rates and their corresponding diazinon and chlorpyrifos concentrations were used to calculate loads (Table A7). There were only eight flow measurements at the Mokelumne River site. The measured flow rates ranged from 41 to 234 cfs with a median value of 164 cfs. For the Calaveras River site, only three flow measurements were taken because the flow rates were too low to be measured during other monitoring events. The measured flows ranged from 5 to14 cfs with a median of 12 cfs. For the Marsh Creek site, 21 flow measurements were taken. The flows ranged from 1 to 27 cfs with a median flow of 9 cfs. The Ulatis Creek site had 31 flow measurements and the flow rates ranged from 8 to 1,115 cfs with a median of 62 cfs. The instantaneous loads are calculated only when the concentration is over the LOD. The calculated maximum diazinon loads showed that the highest load was at the Ulatis Creek site and the lowest load was at the Calaveras River site (Table 3). The maximum load of chlorpyrifos was much lower than that of diazinon. At the Ulatis Creek site, the highest load was 160 g/d and 60 g/d for diazinon and chlorpyrifos, respectively. 3.4 Field Parameter Measurements Water temperature, pH, and EC were only measured from January to May 2003 during sample collection because no equipment was available from June to December 2002. The ranges and medians of the three parameters for each month are shown in Figures 8 to 13. The temperatures ranged from 10.1 to 23.8 °C with an average of 16.4 °C and generally increased from January to May (Figure 8). The ranges of temperature for each site are shown in Figure 9. The pH values ranged from 6.56 to 9.47 with an average of 7.70. There is no major difference among the mean pH values by month (Figure 10). However, the pH ranges varied from site to site (Figure 11). The pH values measured at the Five Mile Slough and Calaveras River sites had relatively higher variability than the other sites. The EC values varied from 47 to 2,620 micro siemens (µs) with an average of 679 µs. The EC values were relatively lower between January and March than in April and May (Figure 12). The Mid-Roberts Drain, Paradise Cut, and Marsh Creek sites had higher EC values than the other sites (Figure 13). The Mokelumne River site had the lowest EC values.

8
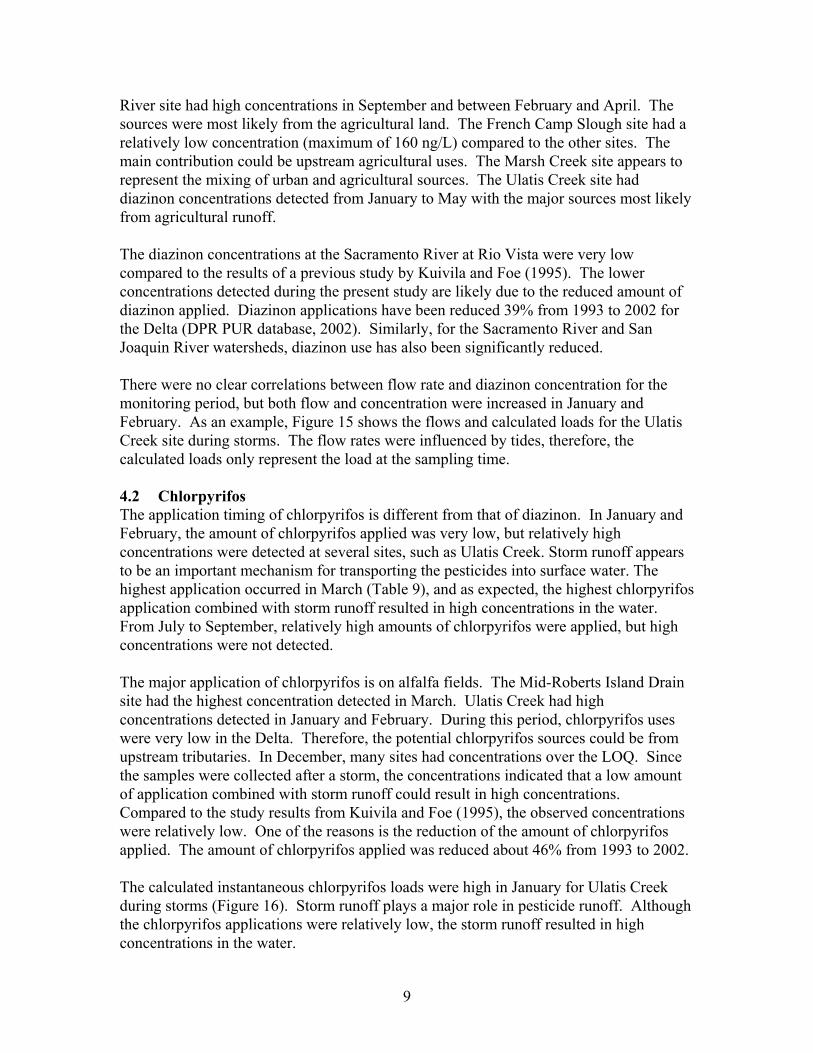
3.5 Precipitation Measurements Monthly rainfall at the Sacramento International Airport and Stockton from June 2002 to May 2003 are shown in Figure 14. There was no rainfall from June to October 2002. The highest monthly rainfall was in December during the sampling period. On December 19, 2002 (a sampling day), the daily precipitation was 0.65 inch in Sacramento and 0.59 inch in Stockton. In January and February, two storm events were monitored. The total precipitation for Storm 1 was 0.66 inch and the highest daily rainfall was 0.37 inch. The total precipitation for Storm 2 was 1.14 inches and the highest rainfall was 0.44 inch (Table 2). The amount of rainfall in December 2002 was about double the historical average (Figure 14). The amount of rainfall in January and February 2003 was less than 50% of normal and the rainfall in April and May was more than double the normal amount. 4 DISCUSSION AND CONCLUSIONS The monitoring results indicate that the concentrations of diazinon and chlorpyrifos periodically exceeded the CDFG CCC and CMC. The amount of pesticides applied, timing of application, type of application, and amount of rainfall affect the diazinon and chlorpyrifos concentrations in the water. To identify the pesticide sources, the pesticide application data are needed. Since diazinon and chlorpyrifos application data are not currently available for the monitoring period (2003), the average monthly pesticide use data from 1992 to 2002 were used (Tables 8 and 9). The historical data showed relatively high diazinon uses in January to March, May, and October. The chlorpyrifos application patterns were different from diazinon. The highest amount of chlorpyrifos use was in March. In January and February, the amounts of chlorpyrifos applied were very low. 4.1 Diazinon In January and February, the peak diazinon concentrations were due to high application amounts and subsequent storm runoff. In March, although diazinon application was not very high, diazinon was detected. The unusual heavy storm in March apparently transported residual diazinon from fields into receiving waters. In May 2003, the monthly rainfall was higher than normal years, but the amount of precipitation apparently did not cause significant diazinon runoff. Although the amount of diazinon applied was relative high, the detected concentrations were very low. In October, the diazinon application on agricultural land was the highest (mainly applied on pears trees), but no diazinon was detected at the sites receiving agricultural runoff. There was one low diazinon concentration detected at an urban site. In November and December, the storm season began but the runoff and the amount of pesticides applied were not at their highest levels, so the observed concentrations were relatively low. High diazinon concentrations were detected at the Mosher Slough, Five Mile Slough, Calaveras River, French Camp Slough, Marsh Creek, and Ulatis Creek sites in January and February. The Mosher Slough site is located in the city of Stockton, and also had high concentrations detected in November and December. The sources were most likely due to urban applications. Five Mile Slough likely had similar sources. The Calaveras
9
River site had high concentrations in September and between February and April. The sources were most likely from the agricultural land. The French Camp Slough site had a relatively low concentration (maximum of 160 ng/L) compared to the other sites. The main contribution could be upstream agricultural uses. The Marsh Creek site appears to represent the mixing of urban and agricultural sources. The Ulatis Creek site had diazinon concentrations detected from January to May with the major sources most likely from agricultural runoff. The diazinon concentrations at the Sacramento River at Rio Vista were very low compared to the results of a previous study by Kuivila and Foe (1995). The lower concentrations detected during the present study are likely due to the reduced amount of diazinon applied. Diazinon applications have been reduced 39% from 1993 to 2002 for the Delta (DPR PUR database, 2002). Similarly, for the Sacramento River and San Joaquin River watersheds, diazinon use has also been significantly reduced. There were no clear correlations between flow rate and diazinon concentration for the monitoring period, but both flow and concentration were increased in January and February. As an example, Figure 15 shows the flows and calculated loads for the Ulatis Creek site during storms. The flow rates were influenced by tides, therefore, the calculated loads only represent the load at the sampling time. 4.2 Chlorpyrifos The application timing of chlorpyrifos is different from that of diazinon. In January and February, the amount of chlorpyrifos applied was very low, but relatively high concentrations were detected at several sites, such as Ulatis Creek. Storm runoff appears to be an important mechanism for transporting the pesticides into surface water. The highest application occurred in March (Table 9), and as expected, the highest chlorpyrifos application combined with storm runoff resulted in high concentrations in the water. From July to September, relatively high amounts of chlorpyrifos were applied, but high concentrations were not detected. The major application of chlorpyrifos is on alfalfa fields. The Mid-Roberts Island Drain site had the highest concentration detected in March. Ulatis Creek had high concentrations detected in January and February. During this period, chlorpyrifos uses were very low in the Delta. Therefore, the potential chlorpyrifos sources could be from upstream tributaries. In December, many sites had concentrations over the LOQ. Since the samples were collected after a storm, the concentrations indicated that a low amount of application combined with storm runoff could result in high concentrations. Compared to the study results from Kuivila and Foe (1995), the observed concentrations were relatively low. One of the reasons is the reduction of the amount of chlorpyrifos applied. The amount of chlorpyrifos applied was reduced about 46% from 1993 to 2002. The calculated instantaneous chlorpyrifos loads were high in January for Ulatis Creek during storms (Figure 16). Storm runoff plays a major role in pesticide runoff. Although the chlorpyrifos applications were relatively low, the storm runoff resulted in high concentrations in the water.
10
4.3 Future work The monitoring program should be continued because more data will help in identifying diazinon and chlorpyrifos sources in Delta waterways. The measured chlorpyrifos in December showed relatively high concentration (greater than 20 but less than 40 ng/L) after storm events, therefore, pesticide runoff during storm events should be monitored in order to further determine the sources. Samples should be collected only during low and outgoing tides from the sites where tidal influence is strong. The analytical method needs to be refined or modified by the lab to address quality assurance issues. 5 REFERENCES DWR. 1995. Sacramento-San Joaquin Delta Atlas. California Department of Water
Resources. pp.121. DPR PUR database. 2002. http://www.cdpr.ca.gov/docs/pur/purmain.htm Kuivila, K.M. and C.G. Foe. 1995. Concentrations, transport and biological effects of
dormant pesticides in the San Francisco estuary, California. Env. Toxic. and Chem. Vol. 14. No. 7. pp. 1141 –1150.
Lu, Z. 2002. Diazinon and chlorpyrifos monitoring plan for Sacramento and San Joaquin
Delta Waterways. Appendix IV of Regional Board – UC Davis Contract number 00-197-150-0
Nolan, M., C. Fred, and J. Jacobson. 2001. Surface water field techniques training class
(Version 1.0). Water Resources investigations Report 98-4252. USGS Training Class-SW 4230. http:/wwwrcamnl.wr.usgs.gov/sws/fieldmethods/index.html
Siepmann, S. and B. Finlayson. 2000. Water quality criteria for diazinon and
chlorpyrifos. California Department of Fish and Game. Office of Spill Prevention and Response. Administrative Report 00-3. 2000.

11
Figures
12
Figure 1. Study area and monitoring sites

13
Figure 2. Diazinon concentrations for all sites by month (for each month, a central box covers the middle 50% of the data, the median is the horizontal line inside the box, the plus sign (+) indicates the mean value, the whiskers show the 1.5 times inter-quartile ranges from the lower and upper quartiles, the points between 1.5 times inter-quartile and 3 times inter-quartile are shown as small squares, and the points beyond 3 times inter-quartile are shown, with a plus sign (+) within a small square, as outliers).
Figure 3. Diazinon concentrations by sampling site (for each site, the mean, median, outliers, and frequency distribution are indicated by a boxplot, see Figure 2 for description of boxplot).

14
Figure 4. Chlorpyrifos concentrations for all sites by month (for each month, the mean, median, outliers, and frequency distribution are indicated by a boxplot, see Figure 2 for description of boxplot).
Figure 5. Chlorpyrifos concentrations by sampling site (for each site, a boxplot shows the mean, median, outliers, and frequency distribution, see Figure 2 for description of boxplot).

15
Figure 6. Observed diazinon concentrations during storms
Figure 7. Observed chlorpyrifos concentrations during storms
0
100
200
300
400
500
1/21 1/22 1/23 1/24 1/25 1/26 2/12 2/13 2/14 2/15 2/16 2/17 2/18 Dia
zino
n C
once
ntra
tion
(ng/
L)
0
0.1
0.2
0.3
0.4
0.5
Rai
nfal
l in
Sac
City
(inc
h) X
RainFall (inch) Mosher Sl. Five Mile Sl.Marsh Ck Ulatis Ck
Storm 1 Storm 2
0
20
40
60
80
100
120
1/21 1/22 1/23 1/24 1/25 1/26 2/12 2/13 2/14 2/15 2/16 2/17 2/18
Chl
orpy
rifos
Con
c. (n
g/L)
00.050.10.150.20.250.30.350.40.450.5
Rai
nfal
l in
Sac
City
(inc
h)
RainFall (inch) Ulatis Ck
Storm 1 Storm 2

16
Tem
pera
ture
Month
Jan Feb Mar Apr May10
13
16
19
22
25
Figure 8. Measured temperature (°C) by month (for each month, a boxplot shows the mean, median, outliers, and frequency distribution, see Figure 2 for description of boxplot).
Tem
pera
ture
Sampling site
Del
t01
Del
t02
Del
t03
Del
t04
Del
t05
Del
t06
Del
t07
Del
t08
Del
t09
Del
t10
Del
t11
Del
t12
Del
t13
Del
t14
Del
t15
Del
t16
Del
t17
Del
t18
Del
t19
6.5
7
7.5
8
8.5
9
Figure 9. Measured temperature (°C) by sampling site (for each site, a boxplot shows the mean, median, outliers, and frequency distribution, see Figure 2 for description of boxplot).

17
Jan Feb Mar Apr May
pH
Month
6.5
7
7.5
8
8.5
9
9.5
Figure 10. Measured pH by month (for each month, a boxplot shows the mean, median, outliers, and frequency distribution, see Figure 2 for description of boxplot).
pH
Sampling site
Del
t01
Del
t02
Del
t03
Del
t04
Del
t05
Del
t06
Del
t07
Del
t08
Del
t09
Del
t10
Del
t11
Del
t12
Del
t13
Del
t14
Del
t15
Del
t16
Del
t17
Del
t18
Del
t19
6.5
7
7.5
8
8.5
9
9.5
Figure 11. Measured pH by sampling site (for each site, a boxplot shows the mean, median, outliers, and frequency distribution, see Figure 2 for description of boxplot).

18
EC
Month
Jan Feb Mar Apr May0
0.5
1
1.5
2
2.5
3(X 1000)
Figure 12. Measured EC (µS) by month (for each month, a boxplot shows the mean, median, outliers, and frequency distribution, see Figure 2 for description of boxplot).
EC
Sampling site
Del
t01
Del
t02
Del
t03
Del
t04
Del
t05
Del
t06
Del
t07
Del
t08
Del
t09
Del
t10
Del
t11
Del
t12
Del
t13
Del
t14
Del
t15
Del
t16
Del
t17
Del
t18
Del
t19
0
0.5
1
1.5
2
2.5
3(X 1000)
Figure 13. Measured EC (µS) by sampling site (for each site, a boxplot shows the mean, median, outliers, and frequency distribution, see Figure 2 for description of boxplot).

19
Figure 14. Monthly rainfall during sampling period
Figure 15. Flow rates and diazinon loads at Ulatis Creek site during storms
0123456789
June
July
Aug
Sept
Oct
Nov Dec Jan
Feb
Mar
Apr
il
May
Rai
nfal
l (in
ch)
SacAirportStocktonNormal (Sac)
0
200
400
600
800
1000
1200
1/21
1/22
1/23
1/24
1/25
2/13
2/14
2/15
2/16
2/17
Flow
rate
(cfs
)
0
20
40
60
80
100
120
140
160
180
Dia
zino
n Lo
ad (g
/d)
Flow (cfs) Diaz Load (g/day)
Storm Storm

20
Figure 16. Flow rates and chlorpyrifos loads at Ulatis Creek site during storms
0
200
400
600
800
1000
1200
1/21
1/22
1/23
1/24
1/25
2/13
2/14
2/15
2/16
2/17
Flow
rate
(cfs
)
0
10
20
30
40
50
60
70
Chl
orpy
rifos
Loa
d (g
/d)
Flow (cfs) Chlor Load (g/d)
Storm 1
Storm

21
Tables

22
Table 1. Primary sampling sites and descriptions
Site ID Site Location
Flow Measure
(Y/N) Type of
Waterway Latitude/ Longitude Sampling Location
Delt01 Mokelumne River at New Hope Rd Bridge
N Main River to the Delta
38° 14' 13.30''/ -121° 25' 4.49''
Collected from the bridge
Delt02 Mosher Slough at Mariners Drive
N Back Slough in the Delta
38° 1' 58.42''/ -121° 21' 1.57''
Collected from the bank near bridge
Delt03 Five Mile Slough at Plymouth Rd
N Back Slough in the Delta
38° 0' 49.66''/ -121° 21' 6.76''
Collected from the five culverts
Delt04 Calaveras River at Ijams Rd
Y Tributaries to the Delta
37° 59' 36.41''/ -121° 16' 9.17''
Collected from the bank of the west bridge
Delt05 Mid-Roberts Island Drain N Ag. Drain in the Delta
37° 56' 35.15''/ -121° 22' 9.50''
Collected from the platform of the pump station
Delt06 French Camp Slough at S Manthey Rd
N Back Slough in the Delta
37° 54' 41.86''/ -121° 17' 24.13''
Collected under the bridge
Delt07 Paradise Cut at Paradise Rd
N Back Slough in the Delta
37° 48' 3.62''/ -121° 22' 1.24''
Collected from the south bridge.
Delt08 Old River at Tracy Road N Back Slough in the Delta
37° 48' 16.50''/ -121° 26' 54.57''
Collected under the bridge
Delt09 Marsh Creek at Cypress Rd bridge
Y Tributary to the Delta
37° 59' 26.55''/ -121° 41' 41.45''
Collected under the bridge
Delt10 Ulatis Creek at Brown Rd Y Tributary to the Delta
38° 18' 25.43''/ -121° 47' 33.36''
Collected from the bridge or under the bridge
Delt11 Duck Slough at Five Point
N Back Slough in the Delta
38° 17' 35.12''/ -121° 38' 35.19''
Collected from the bank near the platform of pump station
Delt12 Steamboat Slough at Hogback Park
N Back Slough in the Delta
38° 12' 50.85''/ -121° 36' 20.34''
Collected from the west bank of land in the Park
Delt13 Cache Slough at Real McCoy Ferry
N Back Slough in the Delta
38° 14' 16.26''/ -121° 39' 29.69''
Collected from the bank of Cache Slough, north of the Real McCoy Ferry on Hwy 84, Ryer Island.
Delt14 Sac River at Rio Vista N Main River in the Delta
38° 9' 34.64''/ -121° 41' 0.92''
Collected from DWR's dock

23
Table 1 (continued) Additional sampling sites
Site ID Site Location
Flow Measure
(Y/N) Type of
Waterway Latitude/ Longitude Sampling Location
Delt15 Fabian and Bell Canal N Canal 37° 49' 8.43''/ -121° 29' 7.63''
Collected from bank on Grimes Rd.
Delt16 Middle River at Tracy Blvd N Stream 37° 52' 54.51''/
-121° 27' 18.47'' Collected from downstream (west) side of bridge
Delt17 San Joaquin River at Hwy 4 N Main River 37° 55' 43.31''/
-121° 19' 37.24''
Collected from bridge walkway
Delt18 San Joaquin River at Antioch Fishing Pier N Main River 38° 1' 9.99''/
-121° 44' 57.19'' Collected from the Antioch Fishing Pier
Delt19
Sacramento River near Freeport
N Main River 38° 27' 23.18''/ -121° 30' 0.58''
Collected from east bank

24
Table 2. Diazinon and chlorpyrifos concentrations during storms
Diazinon
(ng/L) Chlorpyrifos
(ng/L)
Storm Date Rainfall (inch)
Mosher Slough
Five Mile Slough
Marsh Creek
Ulatis Creek
Ulatis Creek
Storm1 1/21/03 0.37 77 460 66 36 75 Storm1 1/22/03 0.20 100 170 380 96 49 Storm1 1/23/03 0.09 100 200 100 380 60 Storm1 1/24/03 0.00 89 71 39 98 110 Storm1 1/25/03 0.00 74 62 28 130 110 Storm2 2/13/03 0.03 220 36 190 62 10 Storm2 2/14/03 0.00 180 32 ND 90 71 Storm2 2/15/03 0.34 140 42 150 89 83 Storm2 2/16/03 0.33 L 39 160 42 22 Storm2 2/17/03 0.00 130 65 37 ND 15
ND = not detectable (below LOQ or LOD) L = sample lost
Table 3. Calculated maximum instantaneous loads (g/day)
Mokelumne River Calaveras River Marsh Creek
Ulatis Creek
Diazinon Chlorpy. Diazinon Chlorpy. Diazinon Chlorpy. Diazinon Chlorpy. Maximum
Load (g/day) 5.45 ND 1.82 0.20 8.39 0.22 159.90 60.10
Table 4. Summary of field spike sample recovery
Parameter Diazinon Chlorpyrifos Bifenthrin Chlorpyrifos Methyl
(Surrogate) Number of Analyses 23 21 27 27
Maximum 157% 121% 96% 100%Minimum 43% 26% 29% 52%
Average 76% 73% 56% 76%Median 71% 74% 57% 76%
Standard deviation 29% 18% 17% 12%

25
Table 5. Summary of lab spike sample recovery
Parameter Diazinon Chlorpyrifos Bifenthrin
Chlorpyrifos Methyl
(Surrogate) Number of analyses 73 78 71 79
Maximum 164% 105% 119% 94% Minimum 47% 46% 59% 48%
Average 83% 72% 84% 76% Median 75% 72% 83% 76%
Standard deviation 25% 12% 13% 10% Table 6. Relative percent difference (RPD) of duplicates
Date Diazinon Chlorpyrifos 8/20/02 ND 23%
12/23/02 ND 3% 1/22/03 6% ND 1/22/03 2% ND 3/11/03 ND 1%
Table 7. Summary of surrogate analysis percent recovery for all samples
Parameter Lab QC Field QC Primary Samples
Maximum 101% 100% 110%Minimum 45% 52% 18%Average 75% 79% 80%Median 76% 80% 81%
Standard Deviation 10% 9% 11%Number of samples <50% 1 0 7

26
Table 8. Average monthly diazinon use from 1993 to 2002
Month Diazinon Use Major Crops January 11.9% Apricot, almond, apple, peach February 10.0% Apple, apricot, cherry, peach March 10.5% Apple, pear, tomato April 5.6% Tomato, apple, pear, cherry May 14.6% Apricot, tomato, carrots June 6.6% Corn, walnut, carrots July 4.6% Corn, tomato, walnut August 7.1% Tomato, corn, September 3.5% Pear, tomato October 20.3% Pear November 4.7% Pear December 0.6% Peach, cherry, apricot
Table 9. Average monthly chlorpyrifos use from 1993 to 2002
Month Chlorpyrifos Use Major Crops January 0.5% Apple, peach, alfalfa February 1.5% Alfalfa, apple March 31.2% Alfalfa April 4.5% Alfalfa, walnut, apple, sugarbeet May 6.6% Walnut, almond, sugarbeet, apple June 8.2% Walnut, corn, sugarbeet, alfalfa July 15.6% Sugarbeet, walnut, nursery, alfalfa August 17.2% Alfalfa, sugarbeet, asparagus, walnutSeptember 10.9% Alfalfa, sugarbeet, asparagus October 3.3% Asparagus, sugarbeet, alfalfa November 0.3% Asparagus, alfalfa December 0.3% Nursery, asparagus, sugarbeet

A1
Appendix

A2
Table A1. Diazinon and chlorpyrifos concentrations.
Site ID Date Collected Time Collected Diazinon
(ng/L) Chlorpyrifos
(ng/L) Chlorpyrifos Methyl
(Surrogate)
Mokelumne River 6/18/02 7:25 ND ND 96%Mokelumne River 7/23/02 7:50 ND ND 89%Mokelumne River 8/20/02 11:20 ND ND 95%Mokelumne River 9/18/02 11:20 ND ND 92%Mokelumne River 10/24/02 14:30 ND ND 85%Mokelumne River 11/21/02 12:15 ND ND 81%Mokelumne River 12/23/02 11:50 28 31 83%Mokelumne River 1/21/03 18:20 ND ND 76%Mokelumne River 1/22/03 16:10 ND ND 78%Mokelumne River 1/23/03 8:10 ND ND 87%Mokelumne River 1/24/03 17:30 ND ND 83%Mokelumne River 1/25/03 15:00 ND ND 81%Mokelumne River 2/13/03 15:20 ND ND 92%Mokelumne River 2/14/03 14:10 ND ND 82%Mokelumne River 2/15/03 14:50 ND ND 82%Mokelumne River 2/16/03 15:50 ND ND 91%Mokelumne River 2/17/03 14:40 ND ND 91%Mokelumne River 3/4/03 9:10 ND ND 73%Mokelumne River 3/12/03 15:50 ND ND 78%Mokelumne River 3/19/03 13:30 ND ND 77%Mokelumne River 3/26/03 11:20 ND ND 78%Mokelumne River 4/2/03 10:50 ND ND 71%Mokelumne River 4/15/03 11:30 ND ND 77%Mokelumne River 4/29/03 7:50 ND ND 72%Mokelumne River 5/13/03 12:50 ND ND 85%Mosher Slough 6/18/02 8:10 22 ND 94%Mosher Slough 7/23/02 8:40 ND ND 87%Mosher Slough 8/20/02 10:35 20 ND 86%Mosher Slough 9/18/02 10:35 24 ND 98%Mosher Slough 10/24/02 12:55 35 ND 80%Mosher Slough 11/21/02 11:35 130 ND 86%Mosher Slough 12/23/02 11:15 130 40 84%Mosher Slough 1/21/03 17:50 77 ND 64%Mosher Slough 1/22/03 11:00 100 ND 80%Mosher Slough 1/23/03 9:20 100 ND 83%Mosher Slough 1/24/03 17:00 89 ND 56%Mosher Slough 1/25/03 14:40 74 ND 62%Mosher Slough 2/13/03 14:50 220 ND 94%Mosher Slough 2/14/03 13:40 180 ND 83%Mosher Slough 2/15/03 14:20 140 ND 85%Mosher Slough 2/17/03 14:10 130 ND 88%Mosher Slough 3/3/03 14:50 75 ND 83%Mosher Slough 3/11/03 10:10 44 ND 84%Mosher Slough 3/14/03 8:20 40 39 74%Mosher Slough 3/18/03 14:00 140 27 88%Mosher Slough 3/21/03 11:10 98 21 72%

A3
Table A1 (continued). Diazinon and chlorpyrifos concentrations.
Site ID Date Collected Time Collected Diazinon
(ng/L) Chlorpyrifos
(ng/L) Chlorpyrifos Methyl
(Surrogate)
Mosher Slough 3/25/03 9:30 85 25 73%Mosher Slough 3/28/03 10:50 66 15 72%Mosher Slough 4/1/03 11:50 200 12 90%Mosher Slough 4/4/03 10:40 140 ND 73%Mosher Slough 4/14/03 11:30 120 ND 76%Mosher Slough 4/28/03 10:00 110 ND 76%Mosher Slough 5/12/03 8:20 40 ND 86%Five Mile Slough 6/18/02 8:30 ND ND 102%Five Mile Slough 7/23/02 8:50 ND ND 97%Five Mile Slough 8/20/02 10:50 ND ND 99%Five Mile Slough 9/18/02 10:45 ND ND 94%Five Mile Slough 10/24/02 13:10 ND ND 83%Five Mile Slough 11/21/02 11:50 ND ND 90%Five Mile Slough 12/23/02 11:20 76 30 85%Five Mile Slough 1/21/03 17:00 460 14 62%Five Mile Slough 1/22/03 10:10 170 ND 79%Five Mile Slough 1/23/03 9:30 200 ND 76%Five Mile Slough 1/24/03 16:40 71 ND 69%Five Mile Slough 1/25/03 14:30 62 ND 55%Five Mile Slough 2/13/03 14:30 36 ND 61%Five Mile Slough 2/14/03 13:20 32 ND 53%Five Mile Slough 2/15/03 14:00 42 ND 68%Five Mile Slough 2/16/03 15:10 39 ND 50%Five Mile Slough 2/17/03 14:00 65 ND 86%Five Mile Slough 3/3/03 14:40 21 ND 81%Five Mile Slough 3/11/03 10:00 ND ND 75%Five Mile Slough 3/14/03 8:30 ND ND 52%Five Mile Slough 3/18/03 14:20 64 20 88%Five Mile Slough 3/21/03 11:30 60 14 88%Five Mile Slough 3/25/03 10:00 35 12 74%Five Mile Slough 3/28/03 11:10 27 ND 68%Five Mile Slough 4/1/03 12:10 360 ND 75%Five Mile Slough 4/4/03 11:00 130 ND 72%Five Mile Slough 4/14/03 11:40 65 ND 78%Five Mile Slough 4/28/03 10:20 29 ND 78%Five Mile Slough 5/12/03 8:50 ND ND 81%Calaveras River 6/18/02 8:50 ND ND 110%Calaveras River 7/23/02 9:20 ND ND 76%Calaveras River 8/20/02 8:40 35 ND 97%Calaveras River 9/17/02 8:40 110 ND 93%Calaveras River 12/19/02 8:50 ND ND 79%Calaveras River 1/22/03 14:50 54 ND 78%Calaveras River 2/18/03 14:10 220 ND 78%Calaveras River 3/3/03 14:10 150 ND 83%Calaveras River 3/18/03 14:50 52 16 92%Calaveras River 3/25/03 10:30 350 ND 69%

A4
Table A1 (continued). Diazinon and chlorpyrifos concentrations.
Site ID Date Collected Time Collected Diazinon
(ng/L) Chlorpyrifos
(ng/L) Chlorpyrifos Methyl
(Surrogate)
Calaveras River 4/8/03 10:30 170 ND 72%Calaveras River 4/14/03 12:10 130 ND 80%Calaveras River 4/22/03 11:20 42 ND 69%Calaveras River 4/28/03 11:00 76 ND 76%Calaveras River 5/6/03 9:30 29 ND 88%Calaveras River 5/12/03 9:10 NW NW NWCalaveras River 5/19/03 11:20 49 ND 80%Mid-Roberts Is. Drain 6/18/02 9:40 ND ND 102%Mid-Roberts Is. Drain 7/23/02 10:10 ND 10 89%Mid-Roberts Is. Drain 8/20/02 9:40 ND ND 86%Mid-Roberts Is. Drain 9/17/02 9:00 ND ND 88%Mid-Roberts Is. Drain 10/24/02 13:30 ND ND 84%Mid-Roberts Is. Drain 11/19/02 8:10 ND ND 80%Mid-Roberts Is. Drain 12/19/02 9:20 ND 23 80%Mid-Roberts Is. Drain 1/22/03 11:30 28 ND 83%Mid-Roberts Is. Drain 2/18/03 15:00 ND ND 70%Mid-Roberts Is. Drain 3/3/03 12:40 ND ND 82%Mid-Roberts Is. Drain 3/11/03 9:00 ND 24 74%Mid-Roberts Is. Drain 3/14/03 8:50 ND 360 66%Mid-Roberts Is. Drain 3/18/03 15:40 ND 60 83%Mid-Roberts Is. Drain 3/21/03 12:10 ND 35 72%Mid-Roberts Is. Drain 3/25/03 12:00 ND 31 72%Mid-Roberts Is. Drain 3/28/03 11:30 ND 16 78%
Mid-Roberts Is. Drain 4/1/03 13:20 ND 19 81%Mid-Roberts Is. Drain 4/4/03 11:30 ND 22 77%Mid-Roberts Is. Drain 4/8/03 11:10 ND 49 73%Mid-Roberts Is. Drain 4/14/03 12:50 ND 13 73%Mid-Roberts Is. Drain 4/22/03 12:00 ND ND 65%Mid-Roberts Is. Drain 4/28/03 11:40 ND ND 75%Mid-Roberts Is. Drain 5/6/03 10:00 ND 72 88%Mid-Roberts Is. Drain 5/12/03 9:50 ND 12 83%Mid-Roberts Is. Drain 5/19/03 12:00 ND ND 89%French Camp Slough 6/18/02 10:20 ND ND 102%French Camp Slough 7/23/02 10:30 ND ND 100%French Camp Slough 8/20/02 10:10 ND ND 91%French Camp Slough 9/17/02 9:30 ND ND 94%French Camp Slough 10/24/02 14:00 ND ND 86%French Camp Slough 11/19/02 8:30 77 ND 90%French Camp Slough 12/19/02 9:40 ND ND 80%French Camp Slough 1/22/03 12:00 64 ND 66%French Camp Slough 2/18/03 12:00 160 ND 75%French Camp Slough 3/3/03 12:20 58 ND 84%French Camp Slough 3/11/03 8:40 ND ND 79%French Camp Slough 3/14/03 9:10 ND 62 80%French Camp Slough 3/18/03 16:50 30 13 82%French Camp Slough 3/21/03 12:30 ND 14 84%

A5
Table A1 (continued). Diazinon and chlorpyrifos concentrations.
Site ID Date Collected Time Collected Diazinon
(ng/L) Chlorpyrifos
(ng/L) Chlorpyrifos Methyl
(Surrogate)
French Camp Slough 3/25/03 11:30 ND ND 73%French Camp Slough 3/28/03 12:00 ND ND 72%French Camp Slough 4/1/03 13:50 ND ND 81%French Camp Slough 4/4/03 11:50 ND ND 71%French Camp Slough 4/8/03 11:30 ND ND 71%French Camp Slough 4/14/03 13:10 ND ND 74%French Camp Slough 4/22/03 12:20 ND ND 59%French Camp Slough 4/28/03 12:10 ND ND 73%French Camp Slough 5/6/03 10:30 ND ND 83%French Camp Slough 5/12/03 10:15 ND ND 67%French Camp Slough 5/19/03 12:40 ND ND 88%Paradise Cut 6/18/02 10:50 ND ND 102%Paradise Cut 7/23/02 11:00 ND ND 91%Paradise Cut 8/20/02 10:40 ND 11 97%Paradise Cut 9/17/02 10:00 ND 20 97%Paradise Cut 10/22/02 9:55 ND ND 70%Paradise Cut 11/19/02 9:05 ND ND 88%Paradise Cut 12/19/02 10:05 ND ND 84%Paradise Cut 1/22/03 13:40 ND ND 63%Paradise Cut 2/18/03 11:10 ND ND 67%Paradise Cut 3/3/03 11:50 ND ND 83%Paradise Cut 3/12/03 14:50 ND 11 77%Paradise Cut 3/19/03 16:20 ND ND 89%Paradise Cut 3/26/03 10:20 ND ND 77%Paradise Cut 4/2/03 14:30 ND ND 75%Paradise Cut 4/8/03 12:00 ND ND 57%Paradise Cut 4/14/03 13:40 ND ND 73%Paradise Cut 4/22/03 12:50 ND ND 59%Paradise Cut 4/28/03 12:30 ND ND 72%Paradise Cut 5/6/03 11:00 ND ND 85%Paradise Cut 5/12/03 11:00 ND ND 77%Paradise Cut 5/19/03 13:30 ND ND 81%Old River 6/18/02 11:30 L L LOld River 7/23/02 11:30 ND ND 94%Old River 8/20/02 11:10 ND ND 96%Old River 9/17/02 10:30 ND ND 97%Old River 9/17/02 11:40 28 ND 100%Old River 10/22/02 10:30 ND ND 58%Old River 11/19/02 9:30 ND ND 81%Old River 12/19/02 10:30 ND ND 81%Old River 1/22/03 14:20 ND ND 79%Old River 2/18/03 10:50 ND ND 83%Old River 3/3/03 11:20 ND ND 77%Old River 3/12/03 14:30 ND 37 73%Old River 3/19/03 15:50 ND ND 84%Old River 3/26/03 10:00 ND ND 74%
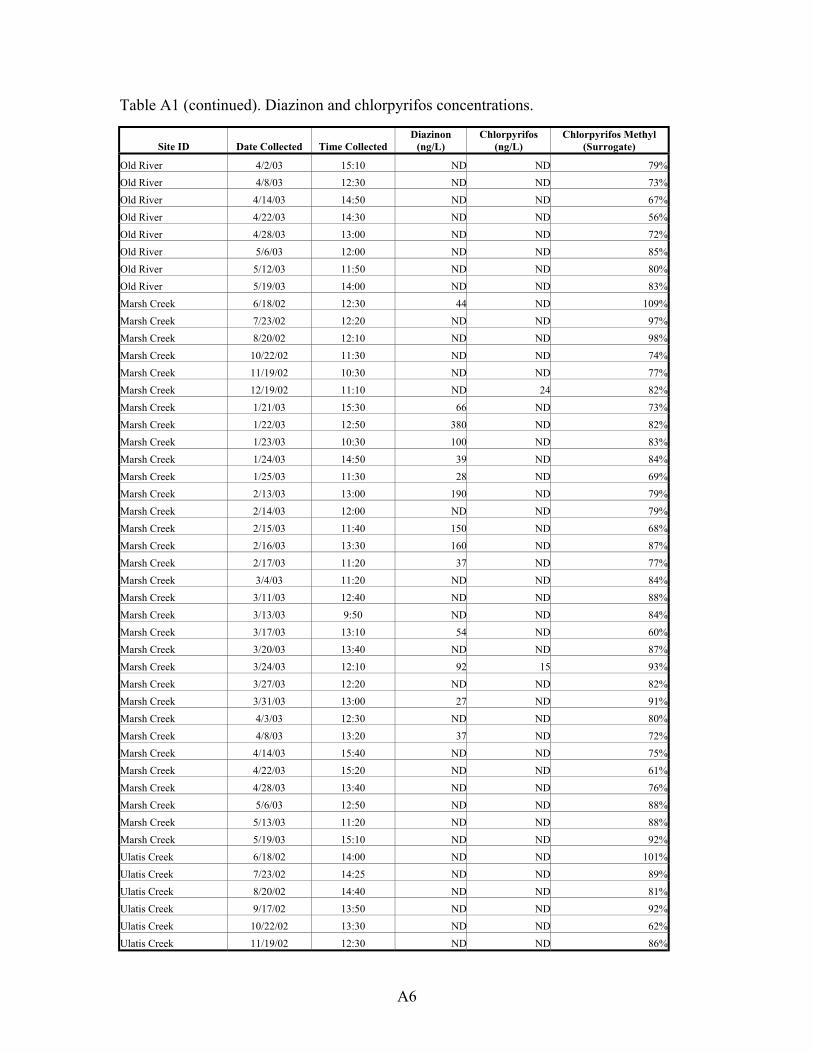
A6
Table A1 (continued). Diazinon and chlorpyrifos concentrations.
Site ID Date Collected Time Collected Diazinon
(ng/L) Chlorpyrifos
(ng/L) Chlorpyrifos Methyl
(Surrogate)
Old River 4/2/03 15:10 ND ND 79%Old River 4/8/03 12:30 ND ND 73%Old River 4/14/03 14:50 ND ND 67%Old River 4/22/03 14:30 ND ND 56%Old River 4/28/03 13:00 ND ND 72%Old River 5/6/03 12:00 ND ND 85%Old River 5/12/03 11:50 ND ND 80%Old River 5/19/03 14:00 ND ND 83%Marsh Creek 6/18/02 12:30 44 ND 109%Marsh Creek 7/23/02 12:20 ND ND 97%Marsh Creek 8/20/02 12:10 ND ND 98%Marsh Creek 10/22/02 11:30 ND ND 74%Marsh Creek 11/19/02 10:30 ND ND 77%Marsh Creek 12/19/02 11:10 ND 24 82%Marsh Creek 1/21/03 15:30 66 ND 73%Marsh Creek 1/22/03 12:50 380 ND 82%Marsh Creek 1/23/03 10:30 100 ND 83%Marsh Creek 1/24/03 14:50 39 ND 84%Marsh Creek 1/25/03 11:30 28 ND 69%Marsh Creek 2/13/03 13:00 190 ND 79%Marsh Creek 2/14/03 12:00 ND ND 79%Marsh Creek 2/15/03 11:40 150 ND 68%Marsh Creek 2/16/03 13:30 160 ND 87%Marsh Creek 2/17/03 11:20 37 ND 77%Marsh Creek 3/4/03 11:20 ND ND 84%Marsh Creek 3/11/03 12:40 ND ND 88%Marsh Creek 3/13/03 9:50 ND ND 84%Marsh Creek 3/17/03 13:10 54 ND 60%Marsh Creek 3/20/03 13:40 ND ND 87%Marsh Creek 3/24/03 12:10 92 15 93%Marsh Creek 3/27/03 12:20 ND ND 82%Marsh Creek 3/31/03 13:00 27 ND 91%Marsh Creek 4/3/03 12:30 ND ND 80%Marsh Creek 4/8/03 13:20 37 ND 72%Marsh Creek 4/14/03 15:40 ND ND 75%Marsh Creek 4/22/03 15:20 ND ND 61%Marsh Creek 4/28/03 13:40 ND ND 76%Marsh Creek 5/6/03 12:50 ND ND 88%Marsh Creek 5/13/03 11:20 ND ND 88%Marsh Creek 5/19/03 15:10 ND ND 92%Ulatis Creek 6/18/02 14:00 ND ND 101%Ulatis Creek 7/23/02 14:25 ND ND 89%Ulatis Creek 8/20/02 14:40 ND ND 81%Ulatis Creek 9/17/02 13:50 ND ND 92%Ulatis Creek 10/22/02 13:30 ND ND 62%Ulatis Creek 11/19/02 12:30 ND ND 86%
A7
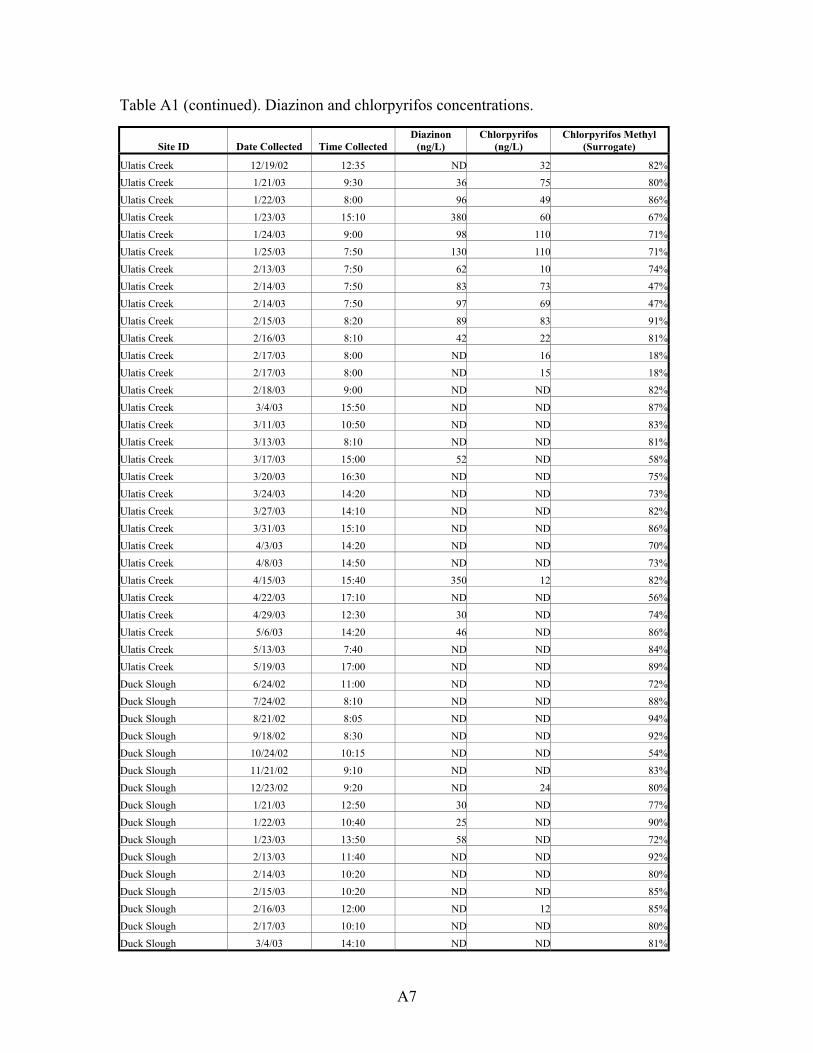
Table A1 (continued). Diazinon and chlorpyrifos concentrations.
Site ID Date Collected Time Collected Diazinon
(ng/L) Chlorpyrifos
(ng/L) Chlorpyrifos Methyl
(Surrogate)
Ulatis Creek 12/19/02 12:35 ND 32 82%Ulatis Creek 1/21/03 9:30 36 75 80%Ulatis Creek 1/22/03 8:00 96 49 86%Ulatis Creek 1/23/03 15:10 380 60 67%Ulatis Creek 1/24/03 9:00 98 110 71%Ulatis Creek 1/25/03 7:50 130 110 71%Ulatis Creek 2/13/03 7:50 62 10 74%Ulatis Creek 2/14/03 7:50 83 73 47%Ulatis Creek 2/14/03 7:50 97 69 47%Ulatis Creek 2/15/03 8:20 89 83 91%Ulatis Creek 2/16/03 8:10 42 22 81%Ulatis Creek 2/17/03 8:00 ND 16 18%Ulatis Creek 2/17/03 8:00 ND 15 18%Ulatis Creek 2/18/03 9:00 ND ND 82%Ulatis Creek 3/4/03 15:50 ND ND 87%Ulatis Creek 3/11/03 10:50 ND ND 83%Ulatis Creek 3/13/03 8:10 ND ND 81%Ulatis Creek 3/17/03 15:00 52 ND 58%Ulatis Creek 3/20/03 16:30 ND ND 75%Ulatis Creek 3/24/03 14:20 ND ND 73%Ulatis Creek 3/27/03 14:10 ND ND 82%Ulatis Creek 3/31/03 15:10 ND ND 86%Ulatis Creek 4/3/03 14:20 ND ND 70%Ulatis Creek 4/8/03 14:50 ND ND 73%Ulatis Creek 4/15/03 15:40 350 12 82%Ulatis Creek 4/22/03 17:10 ND ND 56%Ulatis Creek 4/29/03 12:30 30 ND 74%Ulatis Creek 5/6/03 14:20 46 ND 86%Ulatis Creek 5/13/03 7:40 ND ND 84%Ulatis Creek 5/19/03 17:00 ND ND 89%Duck Slough 6/24/02 11:00 ND ND 72%Duck Slough 7/24/02 8:10 ND ND 88%Duck Slough 8/21/02 8:05 ND ND 94%Duck Slough 9/18/02 8:30 ND ND 92%Duck Slough 10/24/02 10:15 ND ND 54%Duck Slough 11/21/02 9:10 ND ND 83%Duck Slough 12/23/02 9:20 ND 24 80%Duck Slough 1/21/03 12:50 30 ND 77%Duck Slough 1/22/03 10:40 25 ND 90%Duck Slough 1/23/03 13:50 58 ND 72%Duck Slough 2/13/03 11:40 ND ND 92%Duck Slough 2/14/03 10:20 ND ND 80%Duck Slough 2/15/03 10:20 ND ND 85%Duck Slough 2/16/03 12:00 ND 12 85%Duck Slough 2/17/03 10:10 ND ND 80%Duck Slough 3/4/03 14:10 ND ND 81%

A8
Table A1 (continued). Diazinon and chlorpyrifos concentrations.
Site ID Date Collected Time Collected Diazinon
(ng/L) Chlorpyrifos
(ng/L) Chlorpyrifos Methyl
(Surrogate)
Duck Slough 3/11/03 15:30 ND ND 80%Duck Slough 3/13/03 11:30 ND ND 70%Duck Slough 3/17/03 10:20 ND ND 80%Duck Slough 3/20/03 10:40 ND ND 87%Duck Slough 3/24/03 10:50 ND ND 78%Duck Slough 3/27/03 9:40 ND ND 81%Duck Slough 3/31/03 10:30 ND ND 83%Duck Slough 4/3/03 9:50 ND ND 85%Duck Slough 4/15/03 13:00 ND ND 76%Duck Slough 4/29/03 10:30 ND ND 72%Duck Slough 5/13/03 9:40 ND ND 83%Steamboat Slough 7/24/02 9:50 ND ND 98%Steamboat Slough 8/20/02 8:35 ND ND 97%Steamboat Slough 9/18/02 9:00 ND ND 96%Steamboat Slough 10/24/02 10:45 ND ND 88%Steamboat Slough 11/21/02 10:10 ND ND 83%Steamboat Slough 12/23/02 9:45 ND 33 81%Steamboat Slough 1/21/03 13:20 ND ND 64%Steamboat Slough 1/22/03 11:10 ND ND 76%Steamboat Slough 1/23/03 13:10 ND ND 84%Steamboat Slough 1/24/03 12:30 ND ND 81%Steamboat Slough 1/25/03 10:40 ND ND 57%Steamboat Slough 2/13/03 12:00 ND ND 90%Steamboat Slough 2/14/03 10:50 ND ND 81%Steamboat Slough 2/15/03 10:40 ND ND 75%Steamboat Slough 2/16/03 12:30 ND ND 84%Steamboat Slough 2/17/03 10:30 ND ND 77%Steamboat Slough 3/4/03 13:40 ND ND 82%Steamboat Slough 3/11/03 15:00 ND ND 84%Steamboat Slough 3/13/03 11:50 ND ND 65%Steamboat Slough 3/17/03 11:00 ND ND 82%Steamboat Slough 3/20/03 11:10 ND ND 85%Steamboat Slough 3/24/03 11:20 ND ND 83%Steamboat Slough 3/27/03 10:20 ND ND 81%Steamboat Slough 3/31/03 11:00 ND ND 65%Steamboat Slough 4/3/03 10:20 ND ND 84%Steamboat Slough 4/15/03 13:30 ND ND 80%Steamboat Slough 4/29/03 10:10 ND ND 69%Steamboat Slough 5/13/03 10:30 ND ND 86%Cache Slough 7/24/02 10:40 ND ND 100%Cache Slough 8/20/02 9:05 ND ND 92%Cache Slough 9/18/02 9:25 ND ND 90%Cache Slough 10/24/02 11:15 ND ND 87%Cache Slough 11/21/02 10:40 ND ND 83%Cache Slough 12/23/02 10:15 ND 36 81%Cache Slough 1/21/03 12:30 ND ND 67%

A9
Table A1 (continued). Diazinon and chlorpyrifos concentrations.
Site ID Date Collected Time Collected Diazinon
(ng/L) Chlorpyrifos
(ng/L) Chlorpyrifos Methyl
(Surrogate)
Cache Slough 1/22/03 10:10 ND ND 88%Cache Slough 1/23/03 14:10 ND ND 66%Cache Slough 1/24/03 11:20 ND ND 82%Cache Slough 1/25/03 10:20 ND ND 53%Cache Slough 1/26/03 10:10 ND ND 82%Cache Slough 2/13/03 11:10 ND ND 86%Cache Slough 2/14/03 9:50 ND ND 90%Cache Slough 2/15/03 9:50 ND ND 85%Cache Slough 2/16/03 11:40 ND ND 92%Cache Slough 2/17/03 9:50 ND ND 68%Cache Slough 2/18/03 9:30 ND ND 85%Cache Slough 3/4/03 14:40 ND ND 83%Cache Slough 3/11/03 16:00 ND ND 81%Cache Slough 3/13/03 11:00 ND ND 74%Cache Slough 3/17/03 11:40 ND ND 84%Cache Slough 3/20/03 11:40 ND ND 89%Cache Slough 3/24/03 10:20 ND ND 75%Cache Slough 3/27/03 10:50 ND ND 77%Cache Slough 3/31/03 11:30 ND ND 80%Cache Slough 4/3/03 10:50 ND ND 78%Cache Slough 4/15/03 14:00 ND ND 75%Cache Slough 4/29/03 10:50 ND ND 72%Cache Slough 5/13/03 9:20 ND ND 80%Sac River at Rio Vista 7/24/02 10:55 ND ND 97%Sac River at Rio Vista 8/20/02 9:40 ND ND 91%Sac River at Rio Vista 9/18/02 9:50 ND ND 98%Sac River at Rio Vista 10/24/02 12:15 ND ND 83%Sac River at Rio Vista 11/21/02 10:50 ND ND 82%Sac River at Rio Vista 12/19/02 11:50 40 30 83%Sac River at Rio Vista 12/23/02 10:30 ND 36 84%Sac River at Rio Vista 1/21/03 11:40 ND ND 68%Sac River at Rio Vista 1/22/03 9:40 ND ND 78%Sac River at Rio Vista 1/23/03 14:30 ND ND 71%Sac River at Rio Vista 1/24/03 10:50 ND ND 68%Sac River at Rio Vista 1/25/03 9:30 ND ND 78%Sac River at Rio Vista 1/26/03 9:40 ND ND 47%Sac River at Rio Vista 1/26/03 9:40 ND ND 48%Sac River at Rio Vista 2/13/03 10:50 ND ND 88%Sac River at Rio Vista 2/14/03 9:20 ND ND 47%Sac River at Rio Vista 2/15/03 9:20 ND ND 84%Sac River at Rio Vista 2/16/03 11:10 ND ND 92%Sac River at Rio Vista 2/17/03 9:20 ND ND 80%Sac River at Rio Vista 2/19/03 8:00 ND ND 83%Sac River at Rio Vista 3/4/03 15:00 ND ND 85%Sac River at Rio Vista 3/11/03 16:20 ND ND 77%Sac River at Rio Vista 3/13/03 10:40 ND ND 73%

A10
Table A1 (continued). Diazinon and chlorpyrifos concentrations.
Site ID Date Collected Time Collected Diazinon
(ng/L) Chlorpyrifos
(ng/L) Chlorpyrifos Methyl
(Surrogate)
Sac River at Rio Vista 3/17/03 12:00 ND ND 81%Sac River at Rio Vista 3/20/03 12:10 ND ND 90%Sac River at Rio Vista 3/24/03 9:40 ND ND 80%Sac River at Rio Vista 3/27/03 11:10 ND ND 81%Sac River at Rio Vista 3/31/03 11:50 ND ND 75%Sac River at Rio Vista 4/3/03 11:20 ND ND 83%Sac River at Rio Vista 4/15/03 14:20 ND ND 78%
Sac River at Rio Vista 4/29/03 11:30 ND ND 67%Sac River at Rio Vista 5/13/03 8:50 ND ND 88%Fabian and Bell Canal 3/12/03 14:20 ND 15 75%Fabian and Bell Canal 3/19/03 15:30 ND ND 87%Fabian and Bell Canal 3/26/03 9:50 ND ND 79%Fabian and Bell Canal 4/2/03 15:30 ND ND 76%Middle River 3/12/03 13:50 ND 14 78%
Middle River 3/19/03 14:50 ND 14 84%Middle River 3/26/03 9:30 ND ND 80%Middle River 4/2/03 16:00 ND ND 74%San Joaquin River at Hwy4 3/11/03 7:50 ND 12 74%San Joaquin River at Hwy4 3/18/03 16:00 ND 16 84%San Joaquin River at Hwy4 3/25/03 12:20 ND ND 79%San Joaquin River at Hwy4 4/1/03 14:10 ND ND 81%
San Joaquin at Antioch 3/13/03 9:10 ND ND 83%San Joaquin at Antioch 3/20/03 15:10 ND ND 80%San Joaquin at Antioch 3/27/03 11:50 ND ND 76%San Joaquin at Antioch 4/3/03 13:20 ND ND 61%Sac River nr Freeport 3/12/03 17:30 ND ND 69%Sac River nr Freeport 3/19/03 12:50 ND ND 82%Sac River nr Freeport 3/26/03 12:00 ND ND 73%
Sac River nr Freeport 4/2/03 17:20 ND ND 82%*ND = none detected or below LOQ NW = no water L = sample lost

Tabl
e A
2. P
estic
ide
resu
lts (e
xclu
ding
dia
zino
n an
d ch
lorp
yrifo
s).
(Con
cent
ratio
ns a
re in
uni
ts o
f µg/
L. N
D: N
ot d
etec
ted.
BQ
L: th
e co
ncen
tratio
ns w
ere
abov
e th
e de
tect
ion
limit
but b
elow
the
quan
tific
atio
n le
vel,
so th
e va
lues
wer
e es
timat
ed.
Ever
y sa
mpl
e w
as a
lso
anal
yzed
for p
ropa
rgite
, 1-c
yhal
othr
in, c
yflu
thrin
s, cy
perm
ethr
ins,
and
esfe
nval
erat
e, w
hich
wer
e no
t pre
sent
at d
etec
tabl
e le
vels
).
Site
ID
Dat
e C
olle
cted
T
ime
EPT
C
(Ept
am)
Sim
azin
e D
isul
foto
n C
arba
ryl
Met
olac
hlor
C
yana
zine
D
acth
al (D
CPA
) M
ethi
dath
ion
Bife
nthr
in
Azi
npho
s m
ethy
l
Del
t01
6/18
/02
7:25
N
DB
QL
( 0.0
12 J
) N
D
ND
N
D
ND
N
D
ND
N
D
ND
Del
t01
7/23
/02
7:50
N
DB
QL
( 0.0
09 J
) N
D
ND
B
QL
( 0.0
11 J
) N
D
ND
N
D
ND
N
DD
elt0
1 8/
20/0
2 11
:20
ND
ND
N
D
ND
N
D
ND
N
D
ND
0.
084
ND
Del
t01
9/18
/02
11:2
0 N
DN
D
ND
N
D
ND
N
D
ND
N
D
ND
N
DD
elt0
1 10
/24/
02
14:3
0 N
DN
D
ND
N
D
ND
N
D
ND
N
D
ND
N
DD
elt0
1 11
/21/
02
12:1
5 N
DN
D
ND
N
D
ND
N
D
ND
N
D
ND
N
DD
elt0
1 12
/23/
02
11:5
0 N
DB
QL
( 0.1
1 J )
N
D
ND
N
D
ND
N
D
ND
N
D
ND
Del
t01
1/21
/03
18:2
0 N
DN
D
ND
N
D
ND
N
D
ND
N
D
ND
N
DD
elt0
1 1/
22/0
3 16
:10
ND
ND
N
D
ND
N
D
ND
N
D
ND
N
D
ND
Del
t01
1/23
/03
8:10
N
DN
D
ND
N
D
ND
N
D
ND
N
D
ND
N
DD
elt0
1 1/
24/0
3 17
:30
ND
ND
N
D
ND
N
D
ND
N
D
ND
N
D
ND
Del
t01
1/25
/03
15:0
0 N
DN
D
ND
N
D
ND
N
D
ND
N
D
ND
N
DD
elt0
1 2/
13/0
3 15
:20
ND
BQ
L ( 0
.011
J )
ND
N
D
ND
N
D
ND
N
D
ND
N
DD
elt0
1 2/
14/0
3 14
:10
ND
BQ
L ( 0
.016
J )
ND
N
D
ND
N
D
ND
N
D
ND
N
DD
elt0
1 2/
15/0
3 14
:50
ND
ND
N
D
ND
N
D
ND
N
D
ND
N
D
ND
Del
t01
2/16
/03
15:5
0 N
DN
D
ND
N
D
ND
N
D
ND
N
D
ND
N
DD
elt0
1 2/
17/0
3 14
:40
ND
BQ
L ( 0
.021
J )
ND
N
D
ND
N
D
ND
N
D
ND
N
DD
elt0
1 3/
4/03
9:
10
ND
ND
N
D
ND
N
D
ND
N
D
ND
N
D
ND
Del
t01
3/12
/03
15:5
0 N
DN
D
ND
N
D
ND
N
D
ND
N
D
ND
N
DD
elt0
1 3/
19/0
3 13
:30
ND
ND
N
D
ND
N
D
ND
N
D
ND
N
D
ND
Del
t01
3/26
/03
11:2
0 N
DB
QL
( 0.0
09 J
) N
D
ND
N
D
ND
N
D
ND
N
D
ND
Del
t01
4/2/
03
10:5
0 N
DN
D
ND
N
D
ND
N
D
ND
N
D
ND
N
DD
elt0
1 4/
15/0
3 11
:30
ND
BQ
L ( 0
.052
J )
ND
0.
11
ND
N
D
ND
N
D
ND
N
DD
elt0
1 4/
29/0
3 7:
50
ND
ND
N
D
ND
N
D
ND
N
D
ND
N
D
ND
Del
t01
5/13
/03
12:5
0 N
DN
D
ND
N
D
ND
N
D
ND
N
D
ND
N
DD
elt0
2 6/
18/0
2 8:
10
ND
BQ
L ( 0
.046
J )
ND
N
D
BQ
L ( 0
.007
J )
ND
N
D
ND
N
D
ND
Del
t02
7/23
/02
8:40
N
DB
QL
( 0.0
66 J
) N
D
ND
B
QL
( 0.0
18 J
) N
D
ND
N
D
ND
N
D
A11

Tabl
e A
2 (c
ontin
ued)
.
Site
ID
Dat
e C
olle
cted
T
ime
EPT
C
(Ept
am)
Sim
azin
e D
isul
foto
n C
arba
ryl
Met
olac
hlor
C
yana
zine
D
acth
al (D
CPA
) M
ethi
dath
ion
Bife
nthr
in
Azi
npho
s m
ethy
l D
elt0
2 8/
20/0
2 10
:35
ND
BQ
L ( 0
.007
J )
ND
N
D
ND
N
D
ND
N
D
ND
0.
340
Del
t02
9/18
/02
10:3
5 N
DB
QL
( 0.0
20 J
) N
D
ND
N
D
ND
N
D
ND
N
D
ND
Del
t02
10/2
4/02
12
:55
ND
BQ
L ( 0
.006
J )
ND
BQ
L ( 0
.008
J )
ND
N
D
ND
N
D
ND
N
DD
elt0
2 11
/21/
02
11:3
5 N
DB
QL
( 0.0
31 J
) N
D
0.13
N
D
ND
N
D
ND
N
D
ND
Del
t02
12/2
3/02
11
:15
ND
0.55
N
D B
QL
( 0.0
15 J
) 0.
030
ND
N
D
ND
N
D
ND
Del
t02
1/21
/03
17:5
0 N
D0.
35
ND
BQ
L ( 0
.009
J )
ND
N
D
ND
N
D
ND
N
DD
elt0
2 1/
22/0
3 11
:00
ND
0.42
N
D B
QL
( 0.0
12 J
) N
D
ND
N
D
ND
N
D
ND
Del
t02
1/23
/03
9:20
N
D0.
49
ND
BQ
L ( 0
.014
J )
BQ
L ( 0
.007
J )
ND
N
D
ND
N
D
ND
Del
t02
1/24
/03
17:0
0 N
D0.
24
ND
BQ
L ( 0
.007
J )
ND
N
D
ND
N
D
ND
N
DD
elt0
2 1/
25/0
3 14
:40
ND
0.31
N
D B
QL
( 0.0
09 J
) N
D
ND
N
D
ND
N
D
ND
Del
t02
2/13
/03
14:5
0 N
D0.
23
ND
0.
031
ND
N
D
ND
N
D
ND
N
DD
elt0
2 2/
14/0
3 13
:40
ND
BQ
L ( 0
.18
J )
ND
0.
04
ND
N
D
ND
B
QL
( 0.0
12 J
) N
D
ND
Del
t02
2/15
/03
14:2
0 N
D0.
21
ND
BQ
L ( 0
.019
J )
ND
N
D
ND
B
QL
( 0.0
11 J
) N
D
ND
Del
t02
2/17
/03
14:1
0 N
DB
QL
( 0.0
70 J
) N
D
0.1
ND
N
D
ND
N
D
ND
N
DD
elt0
2 3/
3/03
14
:50
ND
BQ
L ( 0
.12
J )
ND
BQ
L ( 0
.014
J )
ND
N
D
ND
N
D
ND
N
DD
elt0
2 3/
11/0
3 10
:10
ND
BQ
L ( 0
.10
J )
ND
N
D
ND
N
D
ND
N
D
ND
N
DD
elt0
2 3/
14/0
3 8:
20
ND
BQ
L ( 0
.089
J )
ND
N
D
ND
N
D
ND
N
D
ND
N
DD
elt0
2 3/
18/0
3 14
:00
ND
BQ
L ( 0
.055
J )
ND
0.
082
BQ
L ( 0
.007
J )
ND
B
QL
( 0.0
07 J
) N
D
ND
N
DD
elt0
2 3/
21/0
3 11
:10
ND
BQ
L ( 0
.068
J )
ND
0.
076
ND
N
D
ND
N
D
ND
N
DD
elt0
2 3/
25/0
3 9:
30
ND
BQ
L ( 0
.11
J )
ND
0.
032
ND
N
D
ND
N
D
ND
N
DD
elt0
2 3/
28/0
3 10
:50
ND
BQ
L ( 0
.072
J )
ND
0.
028
ND
N
D
ND
N
D
ND
N
DD
elt0
2 4/
1/03
11
:50
ND
BQ
L ( 0
.099
J )
ND
0.
036
BQ
L ( 0
.007
J )
ND
N
D
ND
N
D
ND
Del
t02
4/4/
03
10:4
0 N
DB
QL
( 0.0
61 J
) N
D
0.43
N
D
ND
N
D
ND
N
D
ND
Del
t02
4/14
/03
11:3
0 N
DB
QL
( 0.0
42 J
) N
D
0.14
0.
021
ND
B
QL
( 0.0
08 J
) N
D
ND
N
DD
elt0
2 4/
28/0
3 10
:00
ND
BQ
L ( 0
.018
J )
BQ
L ( 0
.014
J )
0.31
B
QL
( 0.0
12 J
) N
D
ND
N
D
ND
N
DD
elt0
2 5/
12/0
3 8:
20
ND
BQ
L ( 0
.031
J )
ND
0.
087
BQ
L ( 0
.010
J )
ND
N
D
ND
N
D
ND
Del
t03
6/18
/02
8:30
N
D0.
22
ND
N
D
BQ
L ( 0
.016
J )
ND
N
D
ND
N
D
ND
Del
t03
7/23
/02
8:50
N
DB
QL
( 0.0
25 J
) N
D
ND
B
QL
( 0.0
09 J
) N
D
ND
N
D
ND
N
DD
elt0
3 8/
20/0
2 10
:50
ND
BQ
L ( 0
.009
J )
ND
N
D
0.02
6 N
D
ND
N
D
ND
N
DD
elt0
3 9/
18/0
2 10
:45
ND
BQ
L ( 0
.010
J )
ND
N
D
BQ
L ( 0
.016
J )
ND
N
D
ND
N
D
ND
Del
t03
10/2
4/02
13
:10
ND
BQ
L ( 0
.006
J )
ND
N
D
ND
N
D
ND
N
D
ND
N
DD
elt0
3 11
/21/
02
11:5
0 N
DN
D
ND
0.
13
ND
N
D
ND
N
D
ND
N
DD
elt0
3 12
/23/
02
11:2
0 N
DB
QL
( 0.0
16 J
) N
D B
QL
( 0.0
11 J
) N
D
ND
N
D
ND
N
D
ND
Del
t03
1/21
/03
17:0
0 N
DB
QL
( 0.0
57 J
) N
D B
QL
( 0.0
18 J
) N
D
ND
N
D
0.06
3 B
QL
( 0.0
09 J
) N
DD
elt0
3 1/
22/0
3 10
:10
ND
BQ
L ( 0
.057
J )
ND
BQ
L ( 0
.012
J )
ND
N
D
ND
B
QL
( 0.0
15 J
) N
D
ND
Del
t03
1/23
/03
9:30
N
DB
QL
( 0.0
78 J
) N
D B
QL
( 0.0
14 J
) N
D
ND
N
D
BQ
L ( 0
.017
J )
ND
N
DD
elt0
3 1/
24/0
3 16
:40
ND
BQ
L ( 0
.013
J )
ND
N
D
ND
N
D
ND
N
D
ND
N
DD
elt0
3 1/
25/0
3 14
:30
ND
BQ
L ( 0
.092
J )
ND
N
D
ND
N
D
ND
N
D
ND
N
DD
elt0
3 2/
13/0
3 14
:30
ND
BQ
L ( 0
.15
J )
ND
N
D
ND
N
D
ND
N
D
ND
N
DD
elt0
3 2/
14/0
3 13
:20
ND
BQ
L ( 0
.14
J )
ND
N
D
ND
N
D
ND
N
D
ND
N
DD
elt0
3 2/
15/0
3 14
:00
ND
BQ
L ( 0
.16
J )
ND
N
D
ND
N
D
ND
N
D
ND
N
DD
elt0
3 2/
16/0
3 15
:10
ND
BQ
L ( 0
.047
J )
ND
BQ
L ( 0
.013
J )
ND
N
D
ND
N
D
ND
N
D
A12

Tabl
e A
2 (c
ontin
ued)
.
Site
ID
Dat
e C
olle
cted
T
ime
EPT
C
(Ept
am)
Sim
azin
e D
isul
foto
n C
arba
ryl
Met
olac
hlor
C
yana
zine
D
acth
al (D
CPA
) M
ethi
dath
ion
Bife
nthr
in
Azi
npho
s m
ethy
l D
elt0
3 2/
17/0
3 14
:00
ND
BQ
L ( 0
.093
J )
ND
0.
03
ND
N
D
ND
N
D
ND
N
DD
elt0
3 3/
3/03
14
:40
ND
BQ
L ( 0
.14
J )
ND
N
D
ND
N
D
ND
N
D
BQ
L(0.
008
J)
ND
Del
t03
3/11
/03
10:0
0 N
DB
QL
( 0.1
6 J )
N
D
ND
N
D
ND
N
D
ND
N
D
ND
Del
t03
3/14
/03
8:30
N
DB
QL
( 0.1
0 J )
N
D
ND
N
D
ND
N
D
ND
N
D
ND
Del
t03
3/18
/03
14:2
0 N
DB
QL
( 0.0
48 J
) N
D
0.07
6 N
D
ND
N
D
ND
N
D
ND
Del
t03
3/21
/03
11:3
0 N
DB
QL
( 0.0
72 J
) N
D B
QL
( 0.0
18 J
) N
D
ND
N
D
ND
N
D
ND
Del
t03
3/25
/03
10:0
0 N
DB
QL
( 0.0
39 J
) N
D B
QL
( 0.0
12 J
) N
D
ND
N
D
ND
N
D
ND
Del
t03
3/28
/03
11:1
0 N
DB
QL
( 0.1
1 J )
N
D
ND
N
D
ND
N
D
ND
N
D
ND
Del
t03
4/1/
03
12:1
0 N
DB
QL
( 0.1
2 J )
N
D
0.05
8 N
D
ND
N
D
ND
N
D
ND
Del
t03
4/4/
03
11:0
0 N
DB
QL
( 0.0
71 J
) N
D
0.12
N
D
ND
N
D
ND
N
D
ND
Del
t03
4/14
/03
11:4
0 N
DB
QL
( 0.0
66 J
) N
D
0.10
B
QL
( 0.0
13 J
) N
D
ND
N
D
ND
N
DD
elt0
3 4/
28/0
3 10
:20
ND
BQ
L ( 0
.031
J )
ND
0.
092
BQ
L ( 0
.013
J )
ND
N
D
ND
N
D
ND
Del
t03
5/12
/03
8:50
N
DB
QL
( 0.0
49 J
) N
D
ND
0.
025
ND
N
D
ND
N
D
ND
Del
t04
6/18
/02
8:50
N
DB
QL
( 0.0
30 J
) N
D
ND
0.
062
ND
N
D
ND
N
D
ND
Del
t04
7/23
/02
9:20
N
DB
QL
( 0.0
76 J
) N
D
ND
0.
036
ND
N
D
ND
N
D
ND
Del
t04
8/20
/02
8:40
N
DB
QL
( 0.0
16 J
) N
D
ND
0.
048
ND
N
D
ND
N
D
BQ
L ( 0
.022
J )
Del
t04
9/17
/02
8:40
N
DB
QL
( 0.0
05 J
) N
D
ND
N
D
ND
N
D
ND
N
D
ND
Del
t04
12/1
9/02
8:
50
ND
1.23
N
D
ND
N
D
ND
N
D
ND
N
D
ND
Del
t04
1/22
/03
14:5
0 N
DB
QL
( 0.1
4 J )
N
D
ND
N
D
ND
N
D
BQ
L ( 0
.029
J )
ND
N
DD
elt0
4 2/
18/0
3 14
:10
ND
0.49
N
D
0.03
6 0.
045
ND
B
QL
( 0.0
07 J
) B
QL
( 0.0
17 J
) N
D
ND
Del
t04
3/3/
03
14:1
0 N
D0.
23
ND
N
D
BQ
L(0.
019
J)
ND
N
D
ND
N
D
ND
Del
t04
3/18
/03
14:5
0 N
D0.
43
ND
N
D
BQ
L(0.
007
J)
ND
N
D
ND
N
D
ND
Del
t04
3/25
/03
10:3
0 N
DB
QL
( 0.0
70 J
) N
D
0.27
N
D
ND
N
D
ND
N
D
ND
Del
t04
4/8/
03
10:3
0 N
DB
QL
( 0.0
78 J
) N
D
0.20
B
QL
( 0.0
10 J
) N
D
ND
N
D
ND
N
DD
elt0
4 4/
14/0
3 12
:10
ND
BQ
L ( 0
.076
J )
ND
0.
20
0.02
2 N
D
BQ
L ( 0
.015
J )
ND
N
D
ND
Del
t04
4/22
/03
11:2
0 N
DB
QL
( 0.0
62 J
) N
D
ND
B
QL
( 0.0
19 J
) N
D
ND
N
D
ND
N
DD
elt0
4 4/
28/0
3 11
:00
ND
BQ
L ( 0
.076
J )
ND
0.
26
BQ
L ( 0
.016
J )
ND
N
D
ND
N
D
ND
Del
t04
5/6/
03
9:30
N
DB
QL
( 0.0
38 J
) N
D
ND
B
QL
( 0.0
12 J
) N
D
ND
N
D
ND
N
DD
elt0
4 5/
12/0
3 9:
10
no w
ater
Del
t04
5/19
/03
11:2
0 N
DB
QL
( 0.0
24 J
) N
D
ND
B
QL
( 0.0
13 J
) N
D
ND
N
D
ND
N
DD
elt0
5 6/
18/0
2 9:
40
ND
BQ
L ( 0
.086
J )
ND
BQ
L ( 0
.009
J )
0.14
0 N
D
ND
N
D
ND
N
DD
elt0
5 7/
23/0
2 10
:10
ND
BQ
L ( 0
.042
J )
ND
N
D
1.8
E (A
QL)
N
D
ND
N
D
ND
N
DD
elt0
5 8/
20/0
2 9:
40
ND
BQ
L ( 0
.022
J )
ND
N
D
0.26
0 N
D
ND
N
D
ND
N
DD
elt0
5 9/
17/0
2 9:
00
ND
BQ
L ( 0
.008
J )
ND
N
D
0.05
9 N
D
ND
N
D
ND
N
D
Del
t05
10/2
4/02
13
:30
BQ
L( 0
.025
J )
BQ
L ( 0
.012
J )
ND
N
D
0.04
0 N
D
ND
N
D
ND
N
DD
elt0
5 11
/19/
02
8:10
N
DB
QL
( 0.0
83 J
) N
D
ND
0.
056
ND
N
D
ND
N
D
ND
Del
t05
12/1
9/02
9:
20
ND
1.95
N
D
ND
0.
30
ND
N
D
ND
N
D
ND
Del
t05
1/22
/03
11:3
0 N
DB
QL
( 0.1
9 J )
N
D
ND
0.
043
ND
N
D
ND
N
D
ND
Del
t05
2/18
/03
15:0
0 N
DB
QL
( 0.0
74 J
) N
D
ND
0.
04
ND
N
D
ND
N
D
ND
Del
t05
3/3/
03
12:4
0 N
DB
QL
( 0.0
48 J
) N
D
ND
0.
036
ND
N
D
ND
N
D
ND
Del
t05
3/11
/03
9:00
N
DB
QL
( 0.0
84 J
) N
D
ND
0.
037
ND
N
D
ND
N
D
ND
A13
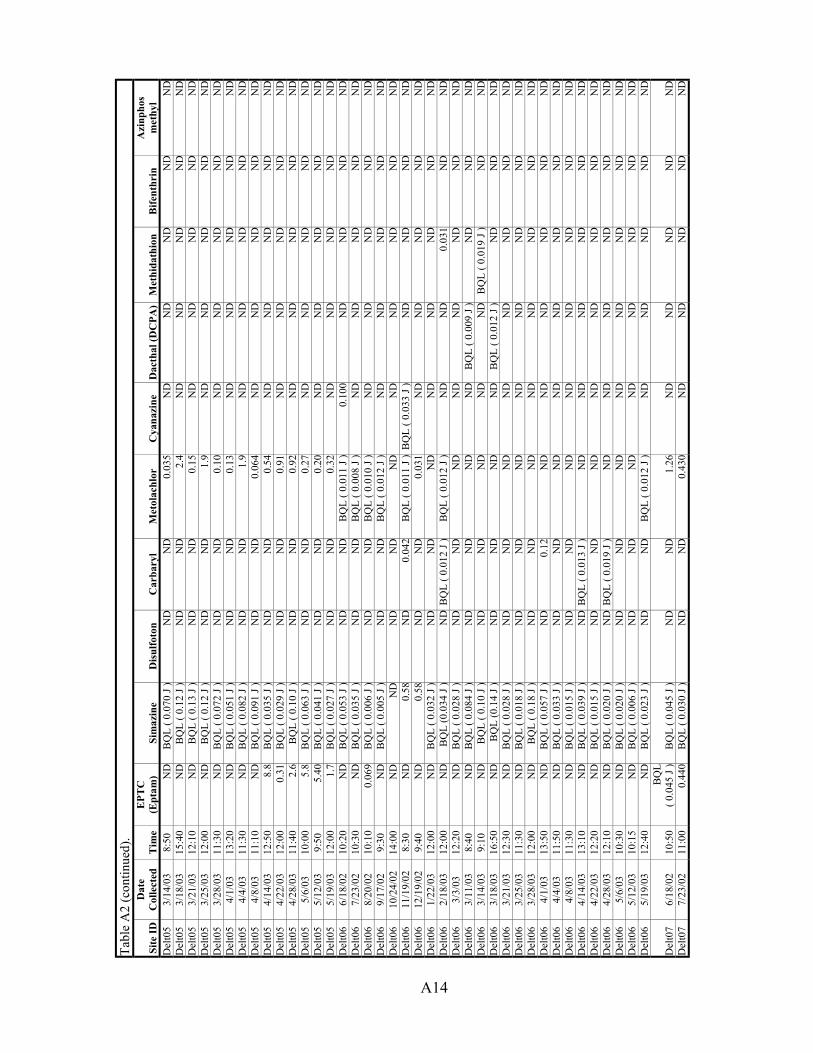
Tabl
e A
2 (c
ontin
ued)
.
Site
ID
Dat
e C
olle
cted
T
ime
EPT
C
(Ept
am)
Sim
azin
e D
isul
foto
n C
arba
ryl
Met
olac
hlor
C
yana
zine
D
acth
al (D
CPA
) M
ethi
dath
ion
Bife
nthr
in
Azi
npho
s m
ethy
l D
elt0
5 3/
14/0
3 8:
50
ND
BQ
L ( 0
.070
J )
ND
N
D
0.03
5 N
D
ND
N
D
ND
N
DD
elt0
5 3/
18/0
3 15
:40
ND
BQ
L ( 0
.12
J )
ND
N
D
2.4
ND
N
D
ND
N
D
ND
Del
t05
3/21
/03
12:1
0 N
DB
QL
( 0.1
3 J )
N
D
ND
0.
15
ND
N
D
ND
N
D
ND
Del
t05
3/25
/03
12:0
0 N
DB
QL
( 0.1
2 J )
N
D
ND
1.
9 N
D
ND
N
D
ND
N
DD
elt0
5 3/
28/0
3 11
:30
ND
BQ
L ( 0
.072
J )
ND
N
D
0.10
N
D
ND
N
D
ND
N
DD
elt0
5 4/
1/03
13
:20
ND
BQ
L ( 0
.051
J )
ND
N
D
0.13
N
D
ND
N
D
ND
N
DD
elt0
5 4/
4/03
11
:30
ND
BQ
L ( 0
.082
J )
ND
N
D
1.9
ND
N
D
ND
N
D
ND
Del
t05
4/8/
03
11:1
0 N
DB
QL
( 0.0
91 J
) N
D
ND
0.
064
ND
N
D
ND
N
D
ND
Del
t05
4/14
/03
12:5
0 8.
8B
QL
( 0.0
35 J
) N
D
ND
0.
54
ND
N
D
ND
N
D
ND
Del
t05
4/22
/03
12:0
0 0.
31B
QL
( 0.0
29 J
) N
D
ND
0.
91
ND
N
D
ND
N
D
ND
Del
t05
4/28
/03
11:4
0 2.
6B
QL
( 0.1
0 J )
N
D
ND
0.
92
ND
N
D
ND
N
D
ND
Del
t05
5/6/
03
10:0
0 5.
8B
QL
( 0.0
63 J
) N
D
ND
0.
27
ND
N
D
ND
N
D
ND
Del
t05
5/12
/03
9:50
5.
40B
QL
( 0.0
41 J
) N
D
ND
0.
20
ND
N
D
ND
N
D
ND
Del
t05
5/19
/03
12:0
0 1.
7B
QL
( 0.0
27 J
) N
D
ND
0.
32
ND
N
D
ND
N
D
ND
Del
t06
6/18
/02
10:2
0 N
DB
QL
( 0.0
53 J
) N
D
ND
B
QL
( 0.0
11 J
) 0.
100
ND
N
D
ND
N
DD
elt0
6 7/
23/0
2 10
:30
ND
BQ
L ( 0
.035
J )
ND
N
D
BQ
L ( 0
.008
J )
ND
N
D
ND
N
D
ND
Del
t06
8/20
/02
10:1
0 0.
069
BQ
L ( 0
.006
J )
ND
N
D
BQ
L ( 0
.010
J )
ND
N
D
ND
N
D
ND
Del
t06
9/17
/02
9:30
N
DB
QL
( 0.0
05 J
) N
D
ND
B
QL
( 0.0
12 J
) N
D
ND
N
D
ND
N
DD
elt0
6 10
/24/
02
14:0
0 N
DN
D
ND
N
D
ND
N
D
ND
N
D
ND
N
DD
elt0
6 11
/19/
02
8:30
N
D0.
58
ND
0.
042
BQ
L ( 0
.011
J )
BQ
L ( 0
.033
J )
ND
N
D
ND
N
DD
elt0
6 12
/19/
02
9:40
N
D0.
58
ND
N
D
0.03
1 N
D
ND
N
D
ND
N
DD
elt0
6 1/
22/0
3 12
:00
ND
BQ
L ( 0
.032
J )
ND
N
D
ND
N
D
ND
N
D
ND
N
DD
elt0
6 2/
18/0
3 12
:00
ND
BQ
L (0
.034
J )
ND
BQ
L ( 0
.012
J )
BQ
L ( 0
.012
J )
ND
N
D
0.03
1 N
D
ND
Del
t06
3/3/
03
12:2
0 N
DB
QL
( 0.0
28 J
) N
D
ND
N
D
ND
N
D
ND
N
D
ND
Del
t06
3/11
/03
8:40
N
DB
QL
( 0.0
84 J
) N
D
ND
N
D
ND
B
QL
( 0.0
09 J
) N
D
ND
N
DD
elt0
6 3/
14/0
3 9:
10
ND
BQ
L ( 0
.10
J )
ND
N
D
ND
N
D
ND
B
QL
( 0.0
19 J
) N
D
ND
Del
t06
3/18
/03
16:5
0 N
DB
QL
(0.1
4 J )
N
D
ND
N
D
ND
B
QL
( 0.0
12 J
) N
D
ND
N
DD
elt0
6 3/
21/0
3 12
:30
ND
BQ
L ( 0
.028
J )
ND
N
D
ND
N
D
ND
N
D
ND
N
DD
elt0
6 3/
25/0
3 11
:30
ND
BQ
L ( 0
.018
J )
ND
N
D
ND
N
D
ND
N
D
ND
N
DD
elt0
6 3/
28/0
3 12
:00
ND
BQ
L ( 0
.18
J )
ND
N
D
ND
N
D
ND
N
D
ND
N
DD
elt0
6 4/
1/03
13
:50
ND
BQ
L ( 0
.057
J )
ND
0.
12
ND
N
D
ND
N
D
ND
N
DD
elt0
6 4/
4/03
11
:50
ND
BQ
L ( 0
.033
J )
ND
N
D
ND
N
D
ND
N
D
ND
N
DD
elt0
6 4/
8/03
11
:30
ND
BQ
L ( 0
.015
J )
ND
N
D
ND
N
D
ND
N
D
ND
N
DD
elt0
6 4/
14/0
3 13
:10
ND
BQ
L ( 0
.039
J )
ND
BQ
L ( 0
.013
J )
ND
N
D
ND
N
D
ND
N
DD
elt0
6 4/
22/0
3 12
:20
ND
BQ
L ( 0
.015
J )
ND
N
D
ND
N
D
ND
N
D
ND
N
DD
elt0
6 4/
28/0
3 12
:10
ND
BQ
L ( 0
.020
J )
ND
BQ
L ( 0
.019
J )
ND
N
D
ND
N
D
ND
N
DD
elt0
6 5/
6/03
10
:30
ND
BQ
L ( 0
.020
J )
ND
N
D
ND
N
D
ND
N
D
ND
N
DD
elt0
6 5/
12/0
3 10
:15
ND
BQ
L ( 0
.006
J )
ND
N
D
ND
N
D
ND
N
D
ND
N
DD
elt0
6 5/
19/0
3 12
:40
ND
BQ
L ( 0
.023
J )
ND
N
D
BQ
L ( 0
.012
J )
ND
N
D
ND
N
D
ND
Del
t07
6/18
/02
10:5
0 B
QL
( 0.0
45 J
)B
QL
( 0.0
45 J
) N
D
ND
1.
26
ND
N
D
ND
N
D
ND
Del
t07
7/23
/02
11:0
0 0.
440
BQ
L ( 0
.030
J )
ND
N
D
0.43
0 N
D
ND
N
D
ND
N
D
A14

Tabl
e A
2 (c
ontin
ued)
.
Site
ID
Dat
e C
olle
cted
T
ime
EPT
C
(Ept
am)
Sim
azin
e D
isul
foto
n C
arba
ryl
Met
olac
hlor
C
yana
zine
D
acth
al (D
CPA
) M
ethi
dath
ion
Bife
nthr
in
Azi
npho
s m
ethy
l
Del
t07
8/20
/02
10:4
0 B
QL
( 0.0
23 J
)B
QL
( 0.0
07 J
) N
D
ND
0.
180
ND
N
D
ND
N
D
ND
Del
t07
9/17
/02
10:0
0 N
DB
QL
( 0.0
07 J
) N
D
ND
0.
11
ND
N
D
ND
N
D
ND
Del
t07
10/2
2/02
9:
55
ND
ND
N
D
ND
0.
11
ND
N
D
ND
N
D
ND
Del
t07
11/1
9/02
9:
05
ND
BQ
L ( 0
.006
J )
ND
N
D
0.04
9 N
D
ND
N
D
ND
N
DD
elt0
7 12
/19/
02
10:0
5 N
DB
QL
( 0.0
16 J
) N
D
ND
B
QL
( 0.0
12 J
) N
D
ND
N
D
ND
N
DD
elt0
7 1/
22/0
3 13
:40
ND
BQ
L ( 0
.039
J )
ND
N
D
BQ
L ( 0
.008
2 J )
N
D
ND
N
D
ND
N
DD
elt0
7 2/
18/0
3 11
:10
ND
BQ
L ( 0
.012
J )
ND
N
D
BQ
L ( 0
.007
J )
ND
N
D
ND
N
D
ND
Del
t07
3/3/
03
11:5
0 N
DB
QL
( 0.0
18 J
) N
D
ND
B
QL
( 0.0
08 J
) N
D
ND
N
D
ND
N
DD
elt0
7 3/
12/0
3 14
:50
ND
BQ
L ( 0
.017
J )
ND
N
D
BQ
L ( 0
.007
J )
ND
N
D
ND
N
D
ND
Del
t07
3/19
/03
16:2
0 N
DB
QL(
0.0
14 J
) N
D
ND
B
QL
( 0.0
07 J
) N
D
ND
N
D
ND
N
DD
elt0
7 3/
26/0
3 10
:20
ND
BQ
L ( 0
.019
J )
ND
N
D
BQ
L ( 0
.012
J )
ND
N
D
ND
N
D
ND
Del
t07
4/2/
03
14:3
0 N
DB
QL
( 0.0
36 J
) N
D
ND
0.
022
ND
N
D
ND
N
D
ND
Del
t07
4/8/
03
12:0
0 0.
45B
QL
( 0.0
22 J
) N
D
ND
B
QL
( 0.0
13 J
) N
D
ND
N
D
ND
N
DD
elt0
7 4/
14/0
3 13
:40
0.18
BQ
L ( 0
.024
J )
ND
N
D
BQ
L ( 0
.015
J )
ND
N
D
ND
N
D
ND
Del
t07
4/22
/03
12:5
0 N
DB
QL
( 0.0
15 J
) N
D
ND
B
QL
( 0.0
08 J
) N
D
ND
N
D
ND
N
D
Del
t07
4/28
/03
12:3
0 B
QL
( 0.0
28 J
)B
QL
( 0.0
14 J
) N
D
ND
0.
32
ND
N
D
ND
N
D
ND
Del
t07
5/6/
03
11:0
0 0.
078
BQ
L ( 0
.016
J )
ND
N
D
0.58
N
D
ND
N
D
ND
N
DD
elt0
7 5/
12/0
3 11
:00
0.86
BQ
L ( 0
.008
J )
ND
N
D
0.53
N
D
ND
N
D
ND
N
DD
elt0
7 5/
19/0
3 13
:30
9.80
BQ
L ( 0
.015
J)
ND
N
D
0.89
N
D
ND
N
D
ND
N
DD
elt0
8 6/
18/0
2 11
:30
ND
BQ
L ( 0
.083
J )
ND
N
D
0.20
0 N
D
ND
N
D
ND
N
DD
elt0
8 7/
23/0
2 11
:30
0.12
0B
QL
( 0.0
29 J
) N
D
ND
0.
110
ND
N
D
ND
N
D
ND
Del
t08
8/20
/02
11:1
0 N
DN
D
ND
N
D
0.03
8 N
D
ND
N
D
ND
N
DD
elt0
8 9/
17/0
2 10
:30
ND
BQ
L ( 0
.008
J )
ND
N
D
BQ
L ( 0
.016
J )
ND
N
D
ND
N
D
ND
Del
t08
9/17
/02
11:4
0 N
D1.
1 N
D
0.36
N
D
ND
N
D
ND
N
D
ND
Del
t08
10/2
2/02
10
:30
ND
ND
N
D
ND
N
D
ND
N
D
ND
N
D
ND
Del
t08
11/1
9/02
9:
30
ND
BQ
L ( 0
.041
J )
ND
N
D
ND
N
D
ND
N
D
ND
N
DD
elt0
8 12
/19/
02
10:3
0 N
DB
QL
( 0.1
1 J )
N
D
ND
B
QL
( 0.0
15 J
) N
D
ND
N
D
ND
N
DD
elt0
8 1/
22/0
3 14
:20
ND
BQ
L ( 0
.026
J )
ND
N
D
ND
N
D
ND
N
D
ND
N
DD
elt0
8 2/
18/0
3 10
:50
ND
BQ
L ( 0
.012
J )
ND
0.
035
ND
N
D
ND
N
D
ND
N
D
Del
t08
3/3/
03
11:2
0 B
QL
( 0.0
48 J)
BQ
L ( 0
.020
J )
ND
N
D
ND
N
D
ND
N
D
ND
N
DD
elt0
8 3/
12/0
3 14
:30
ND
BQ
L ( 0
.024
J )
ND
N
D
ND
N
D
ND
N
D
ND
N
DD
elt0
8 3/
19/0
3 15
:50
ND
BQ
L ( 0
.10J
) N
D
ND
B
QL
( 0.0
10 J
) N
D
ND
N
D
ND
N
DD
elt0
8 3/
26/0
3 10
:00
ND
BQ
L ( 0
.047
J )
ND
N
D
BQ
L ( 0
.010
J )
ND
N
D
ND
N
D
ND
Del
t08
4/2/
03
15:1
0 N
DB
QL
( 0.0
31 J
) N
D
ND
B
QL
( 0.0
07 J
) N
D
ND
N
D
ND
N
D
Del
t08
4/8/
03
12:3
0 B
QL
( 0.0
30 J
)B
QL
( 0.0
23 J
) N
D
ND
N
D
ND
N
D
ND
N
D
ND
Del
t08
4/14
/03
14:5
0 N
DB
QL
( 0.0
18 J
) N
D
ND
N
D
ND
N
D
ND
N
D
ND
Del
t08
4/22
/03
14:3
0 0.
095
BQ
L ( 0
.013
J )
ND
N
D
BQ
L ( 0
.010
J )
ND
N
D
ND
N
D
ND
Del
t08
4/28
/03
13:0
0 0.
37B
QL
( 0.0
29 J
) N
D
ND
0.
028
ND
N
D
ND
N
D
ND
A15
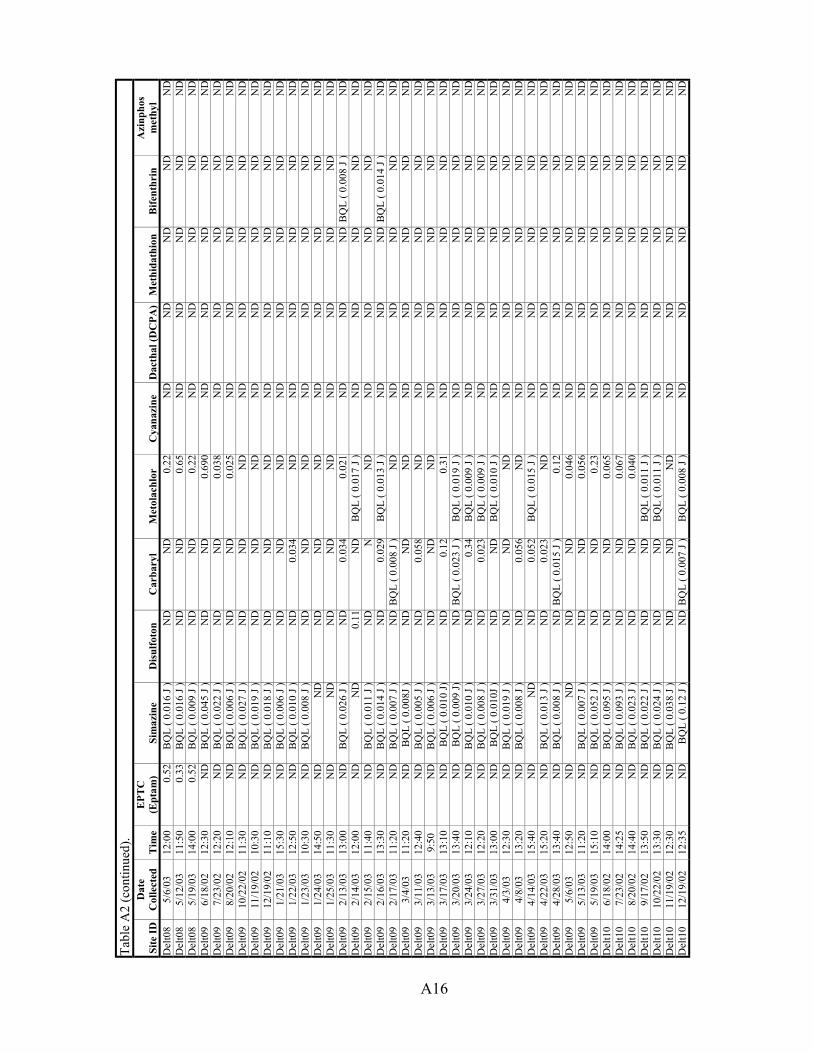
Tabl
e A
2 (c
ontin
ued)
.
Site
ID
Dat
e C
olle
cted
T
ime
EPT
C
(Ept
am)
Sim
azin
e D
isul
foto
n C
arba
ryl
Met
olac
hlor
C
yana
zine
D
acth
al (D
CPA
) M
ethi
dath
ion
Bife
nthr
in
Azi
npho
s m
ethy
l D
elt0
8 5/
6/03
12
:00
0.52
BQ
L ( 0
.016
J )
ND
N
D
0.22
N
D
ND
N
D
ND
N
DD
elt0
8 5/
12/0
3 11
:50
0.33
BQ
L ( 0
.016
J )
ND
N
D
0.65
N
D
ND
N
D
ND
N
DD
elt0
8 5/
19/0
3 14
:00
0.52
BQ
L ( 0
.009
J )
ND
N
D
0.22
N
D
ND
N
D
ND
N
DD
elt0
9 6/
18/0
2 12
:30
ND
BQ
L ( 0
.045
J )
ND
N
D
0.69
0 N
D
ND
N
D
ND
N
DD
elt0
9 7/
23/0
2 12
:20
ND
BQ
L ( 0
.022
J )
ND
N
D
0.03
8 N
D
ND
N
D
ND
N
DD
elt0
9 8/
20/0
2 12
:10
ND
BQ
L ( 0
.006
J )
ND
N
D
0.02
5 N
D
ND
N
D
ND
N
DD
elt0
9 10
/22/
02
11:3
0 N
DB
QL
( 0.0
27 J
) N
D
ND
N
D
ND
N
D
ND
N
D
ND
Del
t09
11/1
9/02
10
:30
ND
BQ
L ( 0
.019
J )
ND
N
D
ND
N
D
ND
N
D
ND
N
DD
elt0
9 12
/19/
02
11:1
0 N
DB
QL
( 0.0
18 J
) N
D
ND
N
D
ND
N
D
ND
N
D
ND
Del
t09
1/21
/03
15:3
0 N
DB
QL
( 0.0
06 J
) N
D
ND
N
D
ND
N
D
ND
N
D
ND
Del
t09
1/22
/03
12:5
0 N
DB
QL
( 0.0
10 J
) N
D
0.03
4 N
D
ND
N
D
ND
N
D
ND
Del
t09
1/23
/03
10:3
0 N
DB
QL
( 0.0
08 J
) N
D
ND
N
D
ND
N
D
ND
N
D
ND
Del
t09
1/24
/03
14:5
0 N
DN
D
ND
N
D
ND
N
D
ND
N
D
ND
N
DD
elt0
9 1/
25/0
3 11
:30
ND
ND
N
D
ND
N
D
ND
N
D
ND
N
D
ND
Del
t09
2/13
/03
13:0
0 N
DB
QL
( 0.0
26 J
) N
D
0.03
4 0.
021
ND
N
D
ND
BQ
L ( 0
.008
J )
ND
Del
t09
2/14
/03
12:0
0 N
DN
D
0.11
N
D
BQ
L ( 0
.017
J )
ND
N
D
ND
N
D
ND
Del
t09
2/15
/03
11:4
0 N
DB
QL
( 0.0
11 J
) N
D
N
ND
N
D
ND
N
D
ND
N
DD
elt0
9 2/
16/0
3 13
:30
ND
BQ
L ( 0
.014
J )
ND
0.
029
BQ
L ( 0
.013
J )
ND
N
D
ND
BQ
L ( 0
.014
J )
ND
Del
t09
2/17
/03
11:2
0 N
DB
QL
( 0.0
07 J
) N
D B
QL
( 0.0
08 J
) N
D
ND
N
D
ND
N
D
ND
Del
t09
3/4/
03
11:2
0 N
DB
QL
( 0.0
08J )
N
D
ND
N
D
ND
N
D
ND
N
D
ND
Del
t09
3/11
/03
12:4
0 N
DB
QL
( 0.0
05 J
) N
D
0.05
8 N
D
ND
N
D
ND
N
D
ND
Del
t09
3/13
/03
9:50
N
DB
QL
( 0.0
06 J
) N
D
ND
N
D
ND
N
D
ND
N
D
ND
Del
t09
3/17
/03
13:1
0 N
DB
QL
( 0.0
10 J)
N
D
0.12
0.
31
ND
N
D
ND
N
D
ND
Del
t09
3/20
/03
13:4
0 N
DB
QL
( 0.0
09 J)
N
D B
QL
( 0.0
23 J
) B
QL
( 0.0
19 J
) N
D
ND
N
D
ND
N
DD
elt0
9 3/
24/0
3 12
:10
ND
BQ
L ( 0
.010
J )
ND
0.
34
BQ
L ( 0
.009
J )
ND
N
D
ND
N
D
ND
Del
t09
3/27
/03
12:2
0 N
DB
QL
( 0.0
08 J
) N
D
0.02
3 B
QL
( 0.0
09 J
) N
D
ND
N
D
ND
N
DD
elt0
9 3/
31/0
3 13
:00
ND
BQ
L ( 0
.010
J )
ND
N
D
BQ
L ( 0
.010
J )
ND
N
D
ND
N
D
ND
Del
t09
4/3/
03
12:3
0 N
DB
QL
( 0.0
19 J
) N
D
ND
N
D
ND
N
D
ND
N
D
ND
Del
t09
4/8/
03
13:2
0 N
DB
QL
( 0.0
08 J
) N
D
0.05
6 N
D
ND
N
D
ND
N
D
ND
Del
t09
4/14
/03
15:4
0 N
DN
D
ND
0.
052
BQ
L ( 0
.015
J )
ND
N
D
ND
N
D
ND
Del
t09
4/22
/03
15:2
0 N
DB
QL
( 0.0
13 J
) N
D
0.02
3 N
D
ND
N
D
ND
N
D
ND
Del
t09
4/28
/03
13:4
0 N
DB
QL
( 0.0
08 J
) N
D B
QL
( 0.0
15 J
) 0.
12
ND
N
D
ND
N
D
ND
Del
t09
5/6/
03
12:5
0 N
DN
D
ND
N
D
0.04
6 N
D
ND
N
D
ND
N
DD
elt0
9 5/
13/0
3 11
:20
ND
BQ
L ( 0
.007
J )
ND
N
D
0.05
6 N
D
ND
N
D
ND
N
DD
elt0
9 5/
19/0
3 15
:10
ND
BQ
L ( 0
.052
J )
ND
N
D
0.23
N
D
ND
N
D
ND
N
DD
elt1
0 6/
18/0
2 14
:00
ND
BQ
L ( 0
.095
J )
ND
N
D
0.06
5 N
D
ND
N
D
ND
N
DD
elt1
0 7/
23/0
2 14
:25
ND
BQ
L ( 0
.093
J )
ND
N
D
0.06
7 N
D
ND
N
D
ND
N
DD
elt1
0 8/
20/0
2 14
:40
ND
BQ
L ( 0
.023
J )
ND
N
D
0.04
0 N
D
ND
N
D
ND
N
DD
elt1
0 9/
17/0
2 13
:50
ND
BQ
L ( 0
.022
J )
ND
N
D
BQ
L ( 0
.011
J )
ND
N
D
ND
N
D
ND
Del
t10
10/2
2/02
13
:30
ND
BQ
L ( 0
.024
J )
ND
N
D
BQ
L ( 0
.011
J )
ND
N
D
ND
N
D
ND
Del
t10
11/1
9/02
12
:30
ND
BQ
L ( 0
.038
J )
ND
N
D
ND
N
D
ND
N
D
ND
N
DD
elt1
0 12
/19/
02
12:3
5 N
DB
QL
( 0.1
2 J )
N
D B
QL
( 0.0
07 J
) B
QL
( 0.0
08 J
) N
D
ND
N
D
ND
N
D
A16

Tabl
e A
2 (c
ontin
ued)
.
Site
ID
Dat
e C
olle
cted
T
ime
EPT
C
(Ept
am)
Sim
azin
e D
isul
foto
n C
arba
ryl
Met
olac
hlor
C
yana
zine
D
acth
al (D
CPA
) M
ethi
dath
ion
Bife
nthr
in
Azi
npho
s m
ethy
l D
elt1
0 1/
21/0
3 9:
30
ND
BQ
L ( 0
.080
J )
ND
N
D
ND
N
D
ND
N
D
ND
N
DD
elt1
0 1/
22/0
3 8:
00
ND
0.45
N
D
ND
0.
024
ND
N
D
ND
N
D
ND
Del
t10
1/23
/03
15:1
0 N
D0.
51
ND
N
D
0.03
6 N
D
ND
N
D
ND
N
DD
elt1
0 1/
24/0
3 9:
00
ND
0.35
N
D
ND
0.
026
ND
N
D
ND
N
D
ND
Del
t10
1/25
/03
7:50
N
D0.
27
ND
N
D
BQ
L ( 0
.019
J )
ND
N
D
ND
N
D
ND
Del
t10
2/13
/03
7:50
N
D0.
82
ND
0.
035
BQ
L ( 0
.008
J )
ND
N
D
ND
N
D
ND
Del
t10
2/14
/03
7:50
N
D0.
62
ND
N
D
BQ
L ( 0
.009
J )
ND
N
D
ND
N
D
ND
Del
t10
2/14
/03
7:50
N
D0.
64
ND
N
D
BQ
L ( 0
.009
J )
ND
N
D
ND
N
D
ND
Del
t10
2/15
/03
8:20
N
D0.
89
ND
N
D
BQ
L ( 0
.008
J )
ND
N
D
ND
N
D
ND
Del
t10
2/16
/03
8:10
N
D1
ND
0.
031
0.05
N
D
ND
N
D
ND
N
DD
elt1
0 2/
17/0
3 8:
00
ND
BQ
L ( 0
.17
J )
ND
N
D
ND
N
D
ND
N
D
ND
N
DD
elt1
0 2/
18/0
3 9:
00
ND
BQ
L ( 0
.007
J )
ND
N
D
ND
N
D
ND
N
D
ND
N
DD
elt1
0 3/
4/03
15
:50
ND
BQ
L ( 0
.030
J )
ND
N
D
ND
N
D
ND
N
D
ND
N
DD
elt1
0 3/
11/0
3 10
:50
ND
BQ
L ( 0
.025
J )
ND
N
D
ND
N
D
ND
N
D
ND
N
DD
elt1
0 3/
13/0
3 8:
10
ND
BQ
L ( 0
.022
J )
ND
N
D
ND
N
D
ND
N
D
ND
N
DD
elt1
0 3/
17/0
3 15
:00
ND
0.59
N
D
ND
N
D
ND
N
D
ND
N
D
ND
Del
t10
3/20
/03
16:3
0 N
DB
QL
( 0.
13 J
) N
D
ND
N
D
ND
N
D
ND
N
D
ND
Del
t10
3/24
/03
14:2
0 N
DB
QL
( 0.0
52 J
) N
D
ND
N
D
ND
N
D
ND
N
D
ND
Del
t10
3/27
/03
14:1
0 N
DB
QL
( 0.0
40 J
) N
D
ND
N
D
ND
N
D
ND
N
D
ND
Del
t10
3/31
/03
15:1
0 N
DB
QL
( 0.0
41 J
) N
D
ND
N
D
ND
N
D
ND
N
D
ND
Del
t10
4/3/
03
14:2
0 N
DB
QL
( 0.0
56 J
) N
D
ND
N
D
ND
N
D
ND
N
D
ND
Del
t10
4/8/
03
14:5
0 N
D0.
21
ND
N
D
BQ
L ( 0
.007
J )
ND
N
D
ND
N
D
ND
Del
t10
4/15
/03
15:4
0 N
DB
QL
( 0.
19 J
) N
D
0.12
B
QL
( 0.0
7 J )
N
D
ND
N
D
ND
N
DD
elt1
0 4/
22/0
3 17
:10
ND
BQ
L ( 0
.056
J )
ND
N
D
ND
N
D
ND
N
D
ND
N
DD
elt1
0 4/
29/0
3 12
:30
ND
BQ
L ( 0
.034
J )
ND
BQ
L ( 0
.007
J )
ND
N
D
ND
N
D
ND
N
DD
elt1
0 5/
6/03
14
:20
ND
BQ
L ( 0
.074
J )
ND
N
D
BQ
L ( 0
.014
J )
ND
N
D
ND
N
D
ND
Del
t10
5/13
/03
7:40
N
DB
QL
( 0.0
39 J
) N
D
ND
N
D
ND
N
D
ND
N
D
ND
Del
t10
5/
19/0
3 17
:00
ND
BQ
L ( 0
.062
J )
ND
N
D
0.11
N
D
ND
N
D
ND
N
DD
elt1
1 6/
24/0
2 11
:00
ND
BQ
L ( 0
.034
J )
ND
N
D
ND
N
D
ND
N
D
ND
N
DD
elt1
1 7/
24/0
2 8:
10
ND
BQ
L ( 0
.016
J )
ND
N
D
ND
N
D
ND
N
D
ND
N
DD
elt1
1 8/
21/0
2 8:
05
ND
ND
N
D
ND
N
D
ND
N
D
ND
N
D
ND
Del
t11
9/18
/02
8:30
N
DN
D
ND
N
D
BQ
L ( 0
.015
J )
ND
N
D
ND
N
D
ND
Del
t11
10/2
4/02
10
:15
ND
ND
N
D
ND
N
D
ND
N
D
ND
N
D
ND
Del
t11
11/2
1/02
9:
10
ND
BQ
L ( 0
.11
J )
ND
N
D
ND
N
D
ND
N
D
ND
N
DD
elt1
1 12
/23/
02
9:20
N
D2.
8 N
D
ND
B
QL
( 0.0
08 J
) N
D
ND
N
D
ND
N
DD
elt1
1 1/
21/0
3 12
:50
ND
0.21
N
D
ND
N
D
ND
N
D
ND
N
D
ND
Del
t11
1/22
/03
10:4
0 N
D0.
31
ND
N
D
ND
N
D
ND
N
D
ND
N
DD
elt1
1 1/
23/0
3 13
:50
ND
BQ
L ( 0
.17
J )
ND
N
D
ND
N
D
ND
N
D
ND
N
DD
elt1
1 2/
13/0
3 11
:40
ND
BQ
L ( 0
.068
J )
ND
N
D
ND
N
D
ND
N
D
ND
N
DD
elt1
1 2/
14/0
3 10
:20
ND
0.2
ND
N
D
ND
N
D
ND
N
D
ND
N
DD
elt1
1 2/
15/0
3 10
:20
ND
BQ
L ( 0
.11
J )
ND
N
D
ND
N
D
ND
N
D
ND
N
DD
elt1
1 2/
16/0
3 12
:00
ND
BQ
L ( 0
.17
J )
ND
N
D
ND
N
D
ND
N
D
ND
N
D
A17

Tabl
e A
2 (c
ontin
ued)
.
Site
ID
Dat
e C
olle
cted
T
ime
EPT
C
(Ept
am)
Sim
azin
e D
isul
foto
n C
arba
ryl
Met
olac
hlor
C
yana
zine
D
acth
al (D
CPA
) M
ethi
dath
ion
Bife
nthr
in
Azi
npho
s m
ethy
l D
elt1
1 2/
17/0
3 10
:10
ND
0.27
N
D
ND
N
D
ND
N
D
ND
N
D
ND
Del
t11
3/4/
03
14:1
0 N
DB
QL
( 0.0
63 J
) N
D
ND
N
D
ND
N
D
ND
N
D
ND
Del
t11
3/11
/03
15:3
0 N
DB
QL
( 0.0
67 J
) N
D
ND
N
D
ND
N
D
ND
N
D
ND
Del
t11
3/13
/03
11:3
0 N
DB
QL
( 0.0
63 J
) N
D
ND
N
D
ND
N
D
ND
N
D
ND
Del
t11
3/17
/03
10:2
0 N
DB
QL
( 0.0
56 J
) N
D
ND
N
D
ND
N
D
ND
N
D
ND
Del
t11
3/20
/03
10:4
0 N
DB
QL
( 0.0
36 J)
N
D
ND
N
D
ND
N
D
ND
N
D
ND
Del
t11
3/24
/03
10:5
0 N
DB
QL
( 0.1
4 J )
N
D
ND
N
D
ND
N
D
ND
N
D
ND
Del
t11
3/27
/03
9:40
N
DB
QL
( 0.0
70 J
) N
D
ND
N
D
ND
N
D
ND
N
D
ND
Del
t11
3/31
/03
10:3
0 N
DB
QL
( 0.0
55 J
) N
D
ND
N
D
ND
N
D
ND
N
D
ND
Del
t11
4/3/
03
9:50
N
DB
QL
( 0.0
62 J
) N
D
ND
N
D
ND
N
D
ND
N
D
ND
Del
t11
4/15
/03
13:0
0 N
DB
QL
( 0.0
23 J
) N
D
0.03
2 N
D
ND
N
D
ND
N
D
ND
Del
t11
4/29
/03
10:3
0 N
DB
QL
( 0.0
46 J
) N
D
ND
N
D
ND
N
D
ND
N
D
ND
Del
t11
5/13
/03
9:40
N
DB
QL
( 0.0
33 J
) N
D
ND
N
D
ND
N
D
ND
N
D
ND
Del
t12
7/24
/02
9:50
N
DN
D
ND
N
D
ND
N
D
ND
N
D
ND
N
DD
elt1
2 8/
20/0
2 8:
35
ND
ND
N
D
ND
N
D
ND
N
D
ND
N
D
ND
Del
t12
9/18
/02
9:00
N
DN
D
ND
N
D
ND
N
D
ND
N
D
ND
N
DD
elt1
2 10
/24/
02
10:4
5 N
DN
D
ND
N
D
ND
N
D
ND
N
D
ND
N
DD
elt1
2 11
/21/
02
10:1
0 N
DN
D
ND
N
D
ND
N
D
ND
N
D
ND
N
DD
elt1
2 12
/23/
02
9:45
N
DB
QL
( 0.0
39 J
) N
D
ND
N
D
ND
N
D
ND
N
D
ND
Del
t12
1/21
/03
13:2
0 N
DN
D
ND
N
D
ND
N
D
ND
N
D
ND
N
DD
elt1
2 1/
22/0
3 11
:10
ND
ND
N
D
ND
N
D
ND
N
D
ND
N
D
ND
Del
t12
1/23
/03
13:1
0 N
DN
D
ND
N
D
ND
N
D
ND
N
D
ND
N
DD
elt1
2 1/
24/0
3 12
:30
ND
ND
N
D
ND
N
D
ND
N
D
ND
N
D
ND
Del
t12
1/25
/03
10:4
0 N
DN
D
ND
N
D
ND
N
D
ND
N
D
ND
N
DD
elt1
2 2/
13/0
3 12
:00
ND
ND
N
D
ND
N
D
ND
N
D
ND
N
D
ND
Del
t12
2/14
/03
10:5
0 N
DN
D
ND
N
D
ND
N
D
ND
N
D
ND
N
DD
elt1
2 2/
15/0
3 10
:40
ND
ND
N
D
ND
N
D
ND
N
D
ND
N
D
ND
Del
t12
2/16
/03
12:3
0 N
DN
D
ND
N
D
ND
N
D
ND
N
D
ND
N
DD
elt1
2 2/
17/0
3 10
:30
ND
BQ
L ( 0
.007
J )
ND
BQ
L ( 0
.007
J )
ND
N
D
ND
N
D
ND
N
DD
elt1
2 3/
4/03
13
:40
ND
ND
N
D
ND
N
D
ND
N
D
ND
N
D
ND
Del
t12
3/11
/03
15:0
0 N
DN
D
ND
N
D
ND
N
D
ND
N
D
ND
N
DD
elt1
2 3/
13/0
3 11
:50
ND
ND
N
D
ND
N
D
ND
N
D
ND
N
D
ND
Del
t12
3/17
/03
11:0
0 N
DB
QL
( 0.0
11 J
) N
D
ND
N
D
ND
N
D
ND
N
D
ND
Del
t12
3/20
/03
11:1
0 N
DB
QL
( 0.0
27 J
) N
D
ND
N
D
ND
N
D
ND
N
D
ND
Del
t12
3/24
/03
11:2
0 N
DB
QL
( 0.0
11 J
) N
D
ND
N
D
ND
N
D
ND
N
D
ND
Del
t12
3/27
/03
10:2
0 N
DB
QL
( 0.0
07 J
) N
D
ND
N
D
ND
N
D
ND
N
D
ND
Del
t12
3/31
/03
11:0
0 N
DB
QL
( 0.0
05 J
) N
D
ND
N
D
ND
N
D
ND
N
D
ND
Del
t12
4/3/
03
10:2
0 N
DB
QL
( 0.0
05 J
) N
D
ND
N
D
ND
N
D
ND
N
D
ND
Del
t12
4/15
/03
13:3
0 N
DB
QL
( 0.0
06 J
) N
D
0.07
6 N
D
ND
N
D
ND
N
D
ND
Del
t12
4/29
/03
10:1
0 N
DB
QL
( 0.0
06 J
) N
D
ND
N
D
ND
N
D
ND
N
D
ND
Del
t12
5/13
/03
10:3
0 N
DN
D
ND
N
D
ND
N
D
ND
N
D
ND
N
DD
elt1
3 7/
24/0
2 10
:40
ND
ND
N
D
ND
N
D
ND
N
D
ND
N
D
ND
A18

Tabl
e A
2 (c
ontin
ued)
.
Site
ID
Dat
e C
olle
cted
T
ime
EPT
C
(Ept
am)
Sim
azin
e D
isul
foto
n C
arba
ryl
Met
olac
hlor
C
yana
zine
D
acth
al (D
CPA
) M
ethi
dath
ion
Bife
nthr
in
Azi
npho
s m
ethy
l D
elt1
3 8/
20/0
2 9:
05
ND
ND
N
D
ND
N
D
ND
N
D
ND
N
D
ND
Del
t13
9/18
/02
9:25
N
DN
D
ND
N
D
ND
N
D
ND
N
D
ND
N
DD
elt1
3 10
/24/
02
11:1
5 N
DN
D
ND
N
D
ND
N
D
ND
N
D
ND
N
DD
elt1
3 11
/21/
02
10:4
0 N
DN
D
ND
N
D
ND
N
D
ND
N
D
ND
N
DD
elt1
3 12
/23/
02
10:1
5 N
DB
QL
( 0.0
65 J
) N
D
ND
B
QL
( 0.0
08 J
) N
D
ND
N
D
ND
N
DD
elt1
3 1/
21/0
3 12
:30
ND
BQ
L ( 0
.015
J )
ND
N
D
ND
N
D
ND
N
D
ND
N
DD
elt1
3 1/
22/0
3 10
:10
ND
BQ
L ( 0
.012
J )
ND
N
D
ND
N
D
ND
N
D
ND
N
DD
elt1
3 1/
23/0
3 14
:10
ND
BQ
L ( 0
.014
J )
ND
N
D
ND
N
D
ND
N
D
ND
N
DD
elt1
3 1/
24/0
3 11
:20
ND
BQ
L ( 0
.008
J )
ND
N
D
ND
N
D
ND
N
D
ND
N
DD
elt1
3 1/
25/0
3 10
:20
ND
ND
N
D
ND
N
D
ND
N
D
ND
N
D
ND
Del
t13
1/26
/03
10:1
0 N
DN
D B
QL
( 0.0
13 J
) N
D
ND
N
D
ND
N
D
ND
N
DD
elt1
3 2/
13/0
3 11
:10
ND
BQ
L ( 0
.006
J )
ND
N
D
ND
N
D
ND
B
QL
( 0.0
11 J
) N
D
ND
Del
t13
2/14
/03
9:50
N
DB
QL
( 0.0
06 J
) N
D
ND
N
D
ND
N
D
ND
N
D
ND
Del
t13
2/15
/03
9:50
N
DB
QL
( 0.0
05 J
) N
D
ND
N
D
ND
N
D
ND
N
D
ND
Del
t13
2/16
/03
11:4
0 N
DB
QL
( 0.0
07 J
) N
D
ND
N
D
ND
N
D
ND
N
D
ND
Del
t13
2/17
/03
9:50
N
DB
QL
( 0.0
07 J
) N
D
ND
N
D
ND
N
D
ND
N
D
ND
Del
t13
2/18
/03
9:30
N
DB
QL
( 0.0
09 J
) N
D
ND
N
D
ND
N
D
ND
N
D
ND
Del
t13
3/4/
03
14:4
0 N
DN
D
ND
N
D
ND
N
D
ND
N
D
ND
N
DD
elt1
3 3/
11/0
3 16
:00
ND
BQ
L ( 0
.010
J )
ND
N
D
ND
N
D
ND
N
D
ND
N
DD
elt1
3 3/
13/0
3 11
:00
ND
ND
N
D
ND
N
D
ND
N
D
ND
N
D
ND
Del
t13
3/17
/03
11:4
0 N
DB
QL
( 0.0
28 J
) N
D
ND
N
D
ND
N
D
ND
N
D
ND
Del
t13
3/20
/03
11:4
0 N
DB
QL
( 0.1
0 J )
N
D
ND
N
D
ND
N
D
ND
N
D
ND
Del
t13
3/24
/03
10:2
0 N
DB
QL
( 0.0
42 J
) N
D
ND
N
D
ND
N
D
ND
N
D
ND
Del
t13
3/27
/03
10:5
0 N
DB
QL
( 0.0
27 J
) N
D
ND
N
D
ND
N
D
ND
N
D
ND
Del
t13
3/31
/03
11:3
0 N
DB
QL
( 0.0
29 J
) N
D
ND
N
D
ND
N
D
ND
N
D
ND
Del
t13
4/3/
03
10:5
0 N
DB
QL
( 0.0
19 J
) N
D
ND
N
D
ND
N
D
ND
N
D
ND
Del
t13
4/15
/03
14:0
0 N
DB
QL
( 0.0
12 J
) N
D
0.04
3 N
D
ND
N
D
ND
N
D
ND
Del
t13
4/29
/03
10:5
0 N
DB
QL
( 0.0
11 J
) N
D
ND
N
D
ND
N
D
ND
N
D
ND
Del
t13
5/13
/03
9:20
N
DB
QL
( 0.0
07 J
) N
D
ND
N
D
ND
N
D
ND
N
D
ND
Del
t14
7/24
/02
10:5
5 N
DN
D
ND
N
D
ND
N
D
ND
N
D
ND
N
DD
elt1
4 8/
20/0
2 9:
40
ND
ND
N
D
ND
N
D
ND
N
D
ND
N
D
ND
Del
t14
9/18
/02
9:50
N
DN
D
ND
N
D
ND
N
D
ND
N
D
ND
N
DD
elt1
4 10
/24/
02
12:1
5 N
DN
D
ND
N
D
ND
N
D
ND
N
D
ND
N
DD
elt1
4 11
/21/
02
10:5
0 N
DN
D
ND
N
D
ND
N
D
ND
N
D
ND
N
DD
elt1
4 12
/19/
02
11:5
0 N
D0.
38
ND
N
D
0.03
7 N
D
ND
N
D
ND
N
DD
elt1
4 12
/23/
02
10:3
0 N
DB
QL
( 0.0
61 J
) N
D
ND
B
QL
( 0.0
07 J
) N
D
ND
N
D
ND
N
DD
elt1
4 1/
21/0
3 11
:40
ND
BQ
L ( 0
.016
J )
ND
N
D
ND
N
D
ND
N
D
ND
N
DD
elt1
4 1/
22/0
3 9:
40
ND
BQ
L ( 0
.010
J )
ND
N
D
ND
N
D
ND
N
D
ND
N
DD
elt1
4 1/
23/0
3 14
:30
ND
BQ
L ( 0
.015
J )
ND
N
D
ND
N
D
ND
N
D
ND
N
DD
elt1
4 1/
24/0
3 10
:50
ND
BQ
L ( 0
.020
J )
ND
N
D
ND
N
D
ND
N
D
ND
N
DD
elt1
4 1/
25/0
3 9:
30
ND
BQ
L ( 0
.017
J )
ND
N
D
ND
N
D
ND
N
D
ND
N
DD
elt1
4 1/
26/0
3 9:
40
ND
ND
BQ
L ( 0
.012
J )
ND
N
D
ND
N
D
ND
N
D
ND
A19

Tabl
e A
2 (c
ontin
ued)
.
Site
ID
Dat
e C
olle
cted
T
ime
EPT
C
(Ept
am)
Sim
azin
e D
isul
foto
n C
arba
ryl
Met
olac
hlor
C
yana
zine
D
acth
al (D
CPA
) M
ethi
dath
ion
Bife
nthr
in
Azi
npho
s m
ethy
l D
elt1
4 1/
26/0
3 9:
40
ND
ND
BQ
L ( 0
.011
J )
ND
N
D
ND
N
D
ND
N
D
ND
Del
t14
2/13
/03
10:5
0 N
DB
QL
( 0.0
07 J
) N
D
ND
N
D
ND
N
D
ND
N
D
ND
Del
t14
2/14
/03
9:20
N
DB
QL
( 0.0
06 J
) N
D
ND
N
D
ND
N
D
ND
N
D
ND
Del
t14
2/15
/03
9:20
N
DB
QL
( 0.0
06 J
) N
D
ND
N
D
ND
N
D
ND
N
D
ND
Del
t14
2/16
/03
11:1
0 N
DB
QL
( 0.0
06 J
) N
D
ND
N
D
ND
N
D
ND
N
D
ND
Del
t14
2/17
/03
9:20
N
DB
QL
( 0.0
07 J
) N
D
ND
N
D
ND
N
D
ND
N
D
ND
Del
t14
2/19
/03
8:00
N
DB
QL
( 0.0
19 J
) N
D
ND
N
D
ND
N
D
ND
N
D
ND
Del
t14
3/4/
03
15:0
0 N
DB
QL
( 0.0
13 J
) N
D
ND
N
D
ND
N
D
ND
N
D
ND
Del
t14
3/11
/03
16:2
0 N
DB
QL
( 0.0
08 J
) N
D
ND
N
D
ND
N
D
ND
N
D
ND
Del
t14
3/13
/03
10:4
0 N
DB
QL
( 0.0
06 J
) N
D
ND
N
D
ND
N
D
ND
N
D
ND
Del
t14
3/17
/03
12:0
0 N
DB
QL
( 0.0
20 J
) N
D
ND
N
D
ND
N
D
ND
N
D
ND
Del
t14
3/20
/03
12:1
0 N
DB
QL
( 0.0
99 J
) N
D
ND
N
D
ND
N
D
ND
N
D
ND
Del
t14
3/24
/03
9:40
N
DB
QL
( 0.0
61 J
) N
D
ND
N
D
ND
N
D
ND
N
D
ND
Del
t14
3/27
/03
11:1
0 N
DB
QL
( 0.0
38 J
) N
D
ND
N
D
ND
N
D
ND
N
D
ND
Del
t14
3/31
/03
11:5
0 N
DB
QL
( 0.0
24 J
) N
D
ND
N
D
ND
N
D
ND
N
D
ND
Del
t14
4/3/
03
11:2
0 N
DB
QL
( 0.0
17 J
) N
D
ND
N
D
ND
N
D
ND
N
D
ND
Del
t14
4/15
/03
14:2
0 N
DB
QL
( 0.0
12 J
) N
D
0.03
6 N
D
ND
N
D
ND
N
D
ND
Del
t14
4/29
/03
11:3
0 N
DB
QL
( 0.0
10 J
) N
D
ND
N
D
ND
N
D
ND
N
D
ND
Del
t14
5/13
/03
8:50
N
DB
QL
( 0.0
06 J
) N
D
ND
N
D
ND
N
D
ND
N
D
ND
Del
t15
3/12
/03
14:2
0 N
DB
QL
( 0.0
22 J
) N
D
ND
N
D
ND
N
D
ND
N
D
ND
Del
t15
3/19
/03
15:3
0 N
DB
QL
( 0.0
44 J
) N
D
ND
B
QL
( 0.0
08 J
) N
D
ND
N
D
ND
N
DD
elt1
5 3/
26/0
3 9:
50
ND
BQ
L ( 0
.047
J )
ND
N
D
BQ
L ( 0
.008
J )
ND
N
D
ND
N
D
ND
Del
t15
4/2/
03
15:3
0 N
DB
QL
( 0.0
27 J
) N
D
ND
B
QL
( 0.0
07 J
) N
D
ND
N
D
ND
N
DD
elt1
6 3/
12/0
3 13
:50
ND
BQ
L ( 0
.026
J )
ND
N
D
ND
N
D
ND
N
D
ND
N
DD
elt1
6 3/
19/0
3 14
:50
ND
BQ
L ( 0
.092
J )
ND
N
D
0.02
9 N
D
ND
N
D
ND
N
DD
elt1
6 3/
26/0
3 9:
30
ND
BQ
L ( 0
.062
J )
ND
N
D
BQ
L ( 0
.010
J )
ND
N
D
ND
N
D
ND
Del
t16
4/2/
03
16:0
0 N
DB
QL
( 0.0
39 J
) N
D
ND
B
QL
( 0.0
08 J
) N
D
ND
N
D
ND
N
DD
elt1
7 3/
11/0
3 7:
50
ND
BQ
L ( 0
.035
J )
ND
0.
028
ND
N
D
ND
N
D
ND
N
DD
elt1
7 3/
18/0
3 16
:00
ND
BQ
L ( 0
.10
J )
ND
BQ
L ( 0
.008
J )
BQ
L ( 0
.010
J )
ND
B
QL
( 0.0
26 J
) N
D
ND
N
DD
elt1
7 3/
25/0
3 12
:20
ND
BQ
L ( 0
.056
J )
ND
N
D
0.05
0 N
D
ND
N
D
ND
N
DD
elt1
7 4/
1/03
14
:10
ND
BQ
L ( 0
.034
J )
ND
N
D
BQ
L ( 0
.011
J )
ND
N
D
ND
N
D
ND
Del
t18
3/13
/03
9:10
N
DB
QL
( 0.0
08 J
) N
D
ND
N
D
ND
N
D
ND
N
D
ND
Del
t18
3/20
/03
15:1
0 N
DB
QL
( 0.0
08 J
) N
D
ND
N
D
ND
N
D
ND
N
D
ND
Del
t18
3/27
/03
11:5
0 N
DB
QL
( 0.0
37 J
) N
D
ND
N
D
ND
N
D
ND
N
D
ND
Del
t18
4/3/
03
13:2
0 N
DB
QL
( 0.0
22 J
) N
D
ND
N
D
ND
N
D
ND
N
D
ND
Del
t19
3/12
/03
17:3
0 N
DN
D
ND
N
D
ND
N
D
ND
N
D
ND
N
DD
elt1
9 3/
19/0
3 12
:50
ND
BQ
L ( 0
.030
J )
ND
N
D
ND
N
D
ND
N
D
ND
N
DD
elt1
9 3/
26/0
3 12
:00
ND
BQ
L ( 0
.006
J )
ND
N
D
ND
N
D
ND
N
D
ND
N
DD
elt1
9 4/
2/03
17
:20
ND
ND
N
D
ND
N
D
ND
N
D
ND
N
D
ND
A20

A21
Table A3. Field spike percent recovery
* Reinjection NA = not analyzed
Site ID Date
Collected Time Diazinon Chlorpyrifos Bifenthrin
Chlorpyrifos Methyl
(Surrogate)
Delt01 1/21/03 18:20 72% 75% 61% 72%
Delt02 2/14/03 13:40 66% 121% 70% 78%
Delt03 3/28/03 11:10 48% 65% 38% 57%
Delt03 3/28/03* 11:10 48% NA 43% 52%
Delt03 4/28/03 10:20 71% 83% 47% 76%
Delt03 4/28/03* 10:20 NA NA 41% 92%
Delt04 3/18/03 14:50 78% 71% 40% 87%
Delt04 3/18/03* 14:50 NA NA 47% 79%
Delt05 2/18/03 15:00 70% 60% 43% 86%
Delt06 4/14/03 13:10 90% 68% 57% 68%
Delt08 3/12/03 14:30 65% 63% 38% 75%
Delt08 3/12/03* 14:30 NA NA 39% 69%
Delt09 8/20/02 12:10 142% 86% 85% 100%
Delt09 1/24/03 14:50 44% 26% 29% 59%
Delt09 1/24/03* 14:50 48% 62% 34% 65%
Delt09 4/28/03 13:40 79% 76% 76% 75%
Delt10 2/13/03 7:50 94% 94% 58% 88%
Delt10 3/27/03 14:10 77% 86% 79% 84%
Delt10 4/22/03 17:10 62% 57% 61% 62%
Delt11 2/15/03 10:20 78% 74% 52% 83%
Delt12 3/11/03 15:00 75% 76% 56% 80%
Delt13 10/24/02 11:15 157% 86% 72% 87%
Delt13 3/24/03 10:20 69% 75% 59% 80%
Delt13 4/15/03 14:00 55% 53% 62% 65%
Delt14 5/13/03 8:50 118% 67% 96% 85%
Delt19 4/2/03 17:20 65% 61% 47% 74%
Delt19 4/2/03* 17:20 NA NA 60% 64%

A22
Table A4. Field duplicates
Site ID Date Time Diazinon (ng/L) Chlorpyrifos (ng/L) Bifenthrin (ng/L) Chlorpyrifos Methyl
(Surrogate) Type of samples Delt01 2/17/03 14:40 ND ND ND 91% Primary Delt01 2/17/03 14:45 ND ND ND 83% Duplicate Delt02 1/22/03 11:00 100 ND ND 80% Primary Delt02 1/22/03 11:05 110 ND ND 82% Duplicate Delt04 1/22/03 14:50 54 ND ND 78% Primary Delt04 1/22/03 14:55 42 ND ND 62% Duplicate Delt05 10/24/02 13:30 ND ND ND 84% Primary Delt05 10/24/02 13:40 ND ND ND 85% Duplicate Delt05 11/19/02 8:10 ND ND ND 80% Primary Delt05 11/19/02 8:10 ND ND ND 79% Duplicate Delt05 3/11/03 9:00 ND 24 ND 74% Primary Delt05 3/11/03 9:05 ND 25 ND 79% Duplicate Delt06 9/17/02 9:30 ND ND ND 94% Primary Delt06 9/17/02 9:30 ND ND ND 90% Duplicate Delt06 5/12/03 10:15 ND ND ND 67% Primary Delt06 5/12/03 10:20 ND ND ND 74% Duplicate Delt06 5/19/03 12:40 ND ND ND 88% Primary Delt06 5/19/03 12:45 ND ND ND 82% Duplicate Delt07 8/20/02 10:40 ND 11 ND 97% Primary Delt07 8/20/02 10:40 ND 4 ND 85% Duplicate Delt07 12/19/02 10:05 ND ND ND 84% Primary Delt07 12/19/02 10:05 ND ND ND 81% Duplicate Delt08 7/23/02 11:30 ND ND ND 94% Primary Delt08 7/23/02 11:33 ND ND ND 97% Duplicate Delt09 3/13/03 9:50 ND ND ND 84% Primary Delt09 3/13/03 9:55 ND ND ND 84% Duplicate Delt10 4/8/03 14:50 ND ND ND 73% Primary Delt10 4/8/03 14:55 ND ND ND 73% Duplicate Delt11 6/24/02 11:00 ND ND ND 72% Primary Delt11 6/24/02 11:05 ND ND ND 73% Duplicate Delt11 12/23/02 9:20 ND 24 ND 80% Primary Delt11 12/23/02 9:20 ND 27 ND 85% Duplicate Delt11 4/3/03 9:50 ND ND ND 85% Primary Delt11 4/3/03 9:55 ND ND ND 79% Duplicate Delt12 2/16/03 12:30 ND ND ND 84% Primary Delt12 2/16/03 12:35 ND ND ND 83% Duplicate Delt12 3/20/03 11:10 ND ND ND 85% Primary Delt12 3/20/03 11:15 ND ND ND 85% Duplicate Delt13 1/24/03 11:20 ND ND ND 82% Primary Delt13 1/24/03 11:25 ND ND ND 79% Duplicate Delt14 11/21/02 10:50 ND ND ND 82% Primary Delt14 11/21/02 10:55 ND ND ND 87% Duplicate Delt14 3/31/03 11:50 ND ND ND 75% Primary Delt14 3/31/03 11:55 ND ND ND 84% Duplicate Delt15 3/19/03 15:30 ND ND ND 87% Primary Delt15 3/19/03 15:35 ND ND ND 87% Duplicate Delt17 3/25/03 12:20 ND ND ND 79% Primary Delt17 3/25/03 12:25 ND ND ND 76% Duplicate ND = not detected

A23
Table A5. Lab blank data (No pesticides were present at detectable levels. The pesticides include azinphos methyl, bifenthrin, carbaryl, chlorpyrifos, cyanazine, l-cyhalothrin, cyfluthrins, cypermethrins, diazinon, disulfoton, dacthal (DCPA), esfenvalerate, EPTC (Eptam), metolachlor, methidathion, propargite, simazine)
Date Analyzed
Chlorpyrifos Methyl
(Surrogate): Recovery
Date Analyzed
Chlorpyrifos Methyl
(Surrogate): Recovery
7/7/02 101% 3/17/03 70%7/9/02 66% 3/17/03 70%8/6/02 95% 3/20/03 72%8/6/02 81% 3/19/03 74%8/28/02 93% 3/20/03 72%8/29/02 92% 3/26/03 75%9/30/02 85% 3/27/03 70%10/1/02 89% 4/2/03 78%11/8/02 85% 4/3/03 86%11/7/02 82% 4/4/03 81%12/6/02 76% 4/4/03 81%12/6/02 79% 4/9/03 75%1/8/03 79% 4/9/03 75%1/8/03 85% 4/10/03 79%1/27/03 80% 4/15/03 76%1/28/03 82% 4/15/03 76%1/28/03 82% 4/17/03 83%2/2/03 82% 4/17/03 83%2/4/03 82% 4/17/03 83%2/3/03 80% 4/19/03 67%2/4/03 82% 4/30/03 54%*2/21/03 87% 4/21/03 63%2/21/03 87% 4/30/03 58%*3/1/03 82% 4/21/03 63%3/2/03 84% 4/30/03 58%*3/6/03 63% 4/28/03 45%4/2/03 66%* 4/30/03 47%*3/10/03 70% 5/2/03 69%
03/10/03 70% 5/13/03 88%*3/14/03 63% 5/2/03 69%3/14/03 62%* 5/13/03 88%*3/14/03 63% 3/14/03 62%*
* Reinjection

A24
Table A6. Recovery of lab spikes and surrogates
Date Analyzed Diazinon Chlorpyrifos Bifenthrin Surrogate
Date Analyzed Diazinon Chlorpyrifos Bifenthrin Surrogate
7/7/02 70% 97% 94% 74% 3/20/03 62% 59% 70% 67%7/9/02 67% 83% 69% 65% 4/8/03* 62% 57% 73% 65%8/6/02 73% 99% 102% 76% 3/26/03 68% 73% 61% 83%8/6/02 80% 105% 104% 86% 4/8/03* 73% 80% 83% 80%
8/28/02 132% 74% 101% 85% 4/1/03 61% 61% 86% 70%8/29/02 140% 74% 98% 89% 4/2/03* 61% 60% 94% 71%9/30/02 121% 70% 93% 85% 4/2/03 64% 61% 90% 72%10/1/02 151% 81% 100% 94% 4/8/03* 66% 62% 86% 73%11/8/02 129% 81% 72% 85% 4/3/03 75% 82% 97% 90%11/7/02 117% 84% 66% 80% 4/4/03 77% 77% 76% 89%12/6/02 98% 64% 88% 68% 4/5/03 77% 77% 76% 89%12/6/02 136% 68% 92% 84% 4/9/03 76% 76% 104% 80%1/8/03 140% 83% 94% 76% 4/9/03 76% 76% 104% 80%1/8/03 164% 97% 98% 85% 4/10/03 79% 81% 96% 81%
1/27/03 74% 73% 79% 78% 4/15/03 103% 72% 97% 75%1/28/03 81% 86% 86% 84% 4/15/03 103% 72% 97% 75%1/28/03 81% 86% 86% 84% 4/17/03 61% 56% 72% 66%2/2/03 84% 81% 80% 92% 4/29/03* 63% 56% NR 56%2/4/03 75% 76% 72% 84% 4/17/03 61% 56% 72% 66%2/3/03 66% 68% 75% 70% 4/29/03* 63% 56% NR 56%3/5/03* 67% 76% 82% 74% 4/17/03 61% 56% 72% 66%2/4/03 75% 76% 72% 84% 4/29/03* 63% 56% NR 56%
2/21/03 80% 88% 83% 89% 4/19/03 66% 64% 71% 68%2/21/03 80% 88% 83% 89% 4/30/03* 69% 61% 71% 64%2/21/03 80% 88% 83% 89% 4/21/03 88% 64% 90% 66%3/1/03 74% 78% 59% 80% 4/30/03* NR 60% NR 63%3/1/03* NR NR 81% 78% 4/21/03 88% 64% 90% 66%3/2/03* 77% 78% 73% 84% 4/30/03* NR 60% NR 63%3/6/03 69% 72% 68% 77% 4/28/03 47% 46% 71% 48%4/2/03* 70% 73% 78% 77% 4/30/03* 49% 51% 69% 50%
3/10/03* 95% 84% 119% 76% 5/2/03 70% 66% 83% 71%03/10/03 94% 92% 87% 76% 5/2/03* NR 72% NR 89%3/14/03 89% 79% 94% 77% 5/2/03 70% 66% 83% 71%3/14/03 89% 79% 94% 77% 5/2/03* NR 72% NR 89%3/17/03 68% 62% 80% 72% 5/12/03 102% 59% 83% 77%4/10/03* 65% 69% 82% 72% 5/13/03* NR 65% NR 81%3/20/03 62% 59% 70% 67% 5/18/03 105% 75% 101% 70%4/8/03* 62% 57% 73% 65% 5/18/03 105% 75% 101% 70%3/19/03 66% 69% 66% 80% 6/4/03 121% 71% 101% 80%4/8/03* 68% 67% 69% 76%
* Reinjection NR = not reported

A25
Table A7. Flow rates and instantaneous loads
Site ID Date
Flow (cfs)
Diazinon Concentration
(ng/L)
Chlorpyrifos Concentration
(ng/L)
Diazinon Load
(g/day)
Chlorpyrifos Load (g/d)
Delt01 1/21/03 NM1 ND2 ND NC3 NC Delt01 1/22/03 NM 8 ND NC NC Delt01 1/23/03 NM ND ND NC NC Delt01 1/24/03 NM ND ND NC NC Delt01 1/25/03 NM ND ND NC NC Delt01 2/13/03 159 14 ND 5.45 NC Delt01 2/14/03 NM 8 ND NC NC Delt01 2/15/03 NM ND ND NC NC Delt01 2/16/03 41 ND ND NC NC Delt01 2/17/03 79 ND ND NC NC Delt01 3/4/03 234 ND ND NC NC Delt01 3/12/03 233 ND ND NC NC Delt01 3/19/03 NM ND ND NC NC Delt01 3/26/03 NM ND ND NC NC Delt01 4/2/03 233 ND ND NC NC Delt01 4/15/03 NM 11 ND NC NC Delt01 4/29/03 170 ND ND NC NC Delt01 5/13/03 73 ND ND NC NC Delt04 7/23/02 12 ND ND NC NC Delt04 8/20/02 5 35 9 0.47 0.12
Delt04 9/17/02 NM 110 ND NC NC Delt04 12/20/02 NM ND ND NC NC Delt04 1/22/03 14 54 6 1.82 0.20
Delt04 2/18/03 NM 220 ND NC NC Delt04 3/3/03 NM 150 ND NC NC Delt04 3/18/03 NM 52 16 NC NC Delt04 3/25/03 NM 350 13 NC NC Delt04 4/8/03 NM 170 6 NC NC Delt04 4/14/03 NM 130 ND NC NC Delt04 4/22/03 NM 42 ND NC NC Delt04 4/28/03 NM 76 ND NC NC Delt04 5/6/03 NM 29 ND NC NC Delt04 5/19/03 NM 49 ND NC NC Delt09 7/23/02 8 10 ND 0.20 NC Delt09 8/20/02 13 18 ND 0.58 NC Delt09 9/17/02 7 NM NM NC NC Delt09 10/22/02 3 ND ND NC NC Delt09 11/19/02 2 ND 24 NC 0.11
Delt09 1/21/03 15 66 ND 2.42 NC Delt09 1/22/03 9 380 9 8.39 0.20
Delt09 1/23/03 7 100 5 1.82 0.09
Delt09 1/24/03 8 39 ND 0.72 NC Delt09 1/25/03 6 28 ND 0.39 NC Delt09 2/13/03 11 190 ND 5.32 NC Delt09 2/14/03 4 22 12 0.24 0.13
Delt09 2/15/03 4 150 ND 1.37 NC Delt09 2/16/03 20 160 ND 7.93

A26
Table A7. (continued) Flow rates and instantaneous loads
SiteID Date Flow Rate
(cfs)
Diazinon concentration
(ng/L)
Chlorpyrifos concentration
(ng/L)
Diazinon Load
(g/day)
Chlorpyrifos Load (g/d)
Delt09 2/17/03 17 37 ND 1.54 NCDelt09 3/4/03 5 11 ND 0.13 NCDelt09 3/11/03 5 ND ND NC NCDelt09 3/13/03 1 10 ND 0.03 NCDelt09 3/17/03 19 54 ND 2.48 NCDelt09 3/20/03 11 16 ND 0.43 NCDelt09 3/24/03 6 92 15 1.35 0.22
Delt09 3/27/03 4 18 ND 0.16 NCDelt09 3/31/03 9 27 ND 0.61 NCDelt09 4/3/03 9 10 ND 0.22 NCDelt09 4/8/03 5 37 ND 0.48 NCDelt09 4/14/03 27 19 ND 1.25 NCDelt09 4/22/03 9 16 ND 0.35 NCDelt09 4/28/03 18 14 ND 0.61 NCDelt09 5/6/03 18 17 ND 0.74 NCDelt09 5/13/03 13 17 ND 0.56 NCDelt09 5/19/03 11 ND ND NC NCDelt10 7/23/02 30 ND 8 NC 0.59
Delt10 8/20/02 56 ND ND NC NCDelt10 9/17/02 8 ND ND NC NCDelt10 10/22/02 30 ND ND NC NCDelt10 11/19/02 23 ND ND NC NCDelt10 12/20/02 NM ND 32 NC NCDelt10 1/21/03 123 36 75 10.85 22.61
Delt10 1/22/03 112 96 49 26.41 13.48
Delt10 1/23/03 172 380 60 159.90 25.25
Delt10 1/24/03 128 98 110 30.63 34.38
Delt10 1/25/03 91 130 110 29.14 24.66
Delt10 2/13/03 509 62 10 77.36 12.48
Delt10 2/14/03 96 90 71 21.18 16.71
Delt10 2/15/03 71 89 83 15.42 14.38
Delt10 2/16/03 1115 42 22 114.73 60.10
Delt10 2/17/03 131 12 16 3.86 5.15
Delt10 3/4/03 35 ND 6 NC 0.52
Delt10 3/11/03 40 ND 5 NC 0.49
Delt10 3/13/03 42 ND 5 NC 0.51
Delt10 3/17/03 185 52 10 23.53 4.52
Delt10 3/20/03 87 9 6 1.92 1.28
Delt10 3/24/03 43 9 4 0.95 0.42
Delt10 3/27/03 39 ND ND NC NCDelt10 3/31/03 62 ND ND NC NCDelt10 4/3/03 65 ND ND NC NCDelt10 4/8/03 57 ND ND NC NCDelt10 4/15/03 65 350 12 55.71 1.91
Delt10 4/22/03 17 ND ND NC NCDelt10 4/29/03 72 30 ND 5.32 NC

A27
Table A7. (continued) Flow rates and instantaneous loads
SiteID Date Flow Rate
(cfs)
Diazinon concentration
(ng/L)
Chlorpyrifos concentration
(ng/L)
Diazinon Load
(g/day)
Chlorpyrifos Load (g/d)
Delt10 5/6/03 62 46 ND 6.96 NCDelt10 5/13/03 36 ND ND NC NCDelt10 5/19/03 15 ND ND NC NC
1NM = flow rate was not measured/measurable or water sample was lost 2ND = below the limit of quantitation (BQL) and the limit of detection (LOD) 3NC = load not calculated (no flow rate and/or concentration data)

Filename: Delta monitoring report-02-03 draft02.doc Directory: C:\TEMP Template: C:\WINDOWS\Application
Data\Microsoft\Templates\Normal.dot Title: Draft Subject: Author: Zhimin Lu Keywords: Comments: Creation Date: 08/11/2004 2:41 PM Change Number: 6 Last Saved On: 08/11/2004 3:48 PM Last Saved By: DavisG Total Editing Time: 9 Minutes Last Printed On: 08/11/2004 3:53 PM As of Last Complete Printing Number of Pages: 59 Number of Words: 14,601 (approx.) Number of Characters: 83,230 (approx.)