
agmanager
35
Department of Agricultural Economics Kansas State U N I V E R S I T Y www.agmanager.inf o Pasture lease rates Department of Agricultural Economics Kevin C. Dhuyvetter [email protected] – 785-532-3527 Department of Ag Economics Kansas State University www.agmanager.info
-
Upload
thane-bruce -
Category
Documents
-
view
16 -
download
0
description
www.agmanager.info. Department of Agricultural Economics. Pasture lease rates. Kevin C. Dhuyvetter [email protected] – 785-532-3527 Department of Ag Economics Kansas State University www.agmanager.info. Factors impacting pasture lease rates…. Supply (availability) - PowerPoint PPT Presentation
Transcript of agmanager

Department of Agricultural Economics
Kansas StateU N I V E R S I T Y
www.agmanager.info
Pasture lease rates
Department of Agricultural Economics
Kevin C. [email protected] – 785-532-3527
Department of Ag EconomicsKansas State Universitywww.agmanager.info

Department of Agricultural Economics
Kansas StateU N I V E R S I T Y
• Supply (availability)
– Competing uses of grass (hunting, urban, crops) -- acres
– Growing conditions (rainfall, competition) – lbs/acre
• Demand
– Cattle numbers
– Feed prices
– “Quality” of pasture (size, fence, water, productivity)
• S&D factors can vary considerably regionally(and even within a county)
• Other factors (L/T relationship, information, etc.)
Factors impacting pasture lease rates…

Department of Agricultural Economics
Kansas StateU N I V E R S I T Y
Change from 2009
National average = 0.0%KS = 0.0%; NE = 0.0%
OK = +4.8%; MO = -4.0%
* Corresponding changes in crop land rents were US=+3.0%; KS=0.0%; NE=+6.2%; OK=0.0%; and MO=+4.4%.
Source: USDA NASS Land Values and Cash Rents 2010 Summary and Dhuyvetter (KSU), August 2010
Pasture Land Average Rent per Acre, 2010
15.50
Department of Agricultural Economics
Kansas StateU N I V E R S I T Y
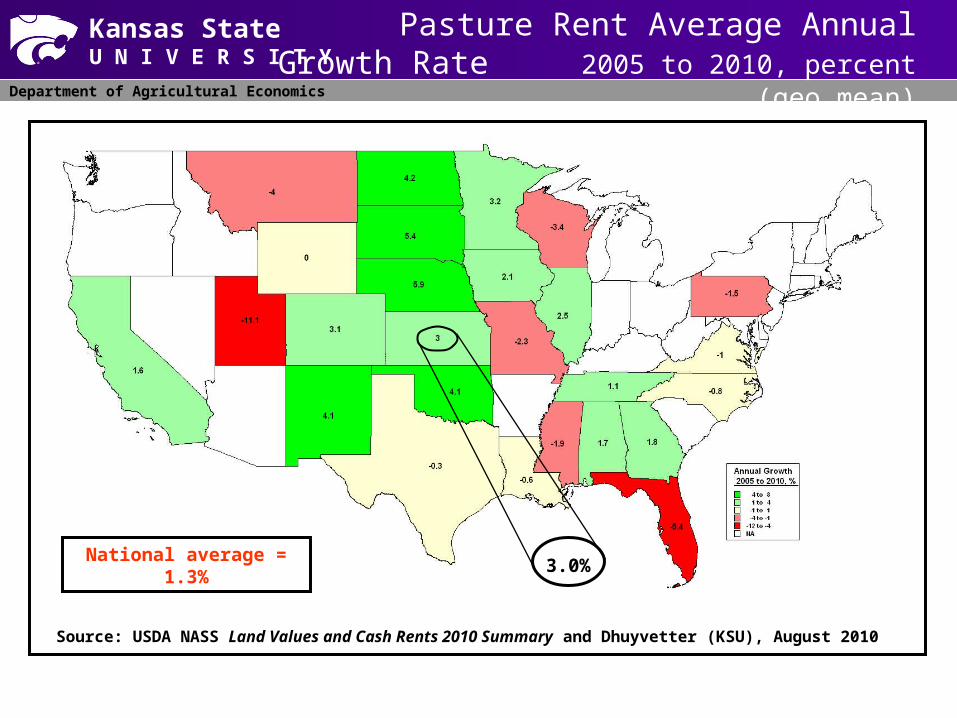
National average = 1.3%
Source: USDA NASS Land Values and Cash Rents 2010 Summary and Dhuyvetter (KSU), August 2010
Pasture Rent Average Annual Growth Rate 2005 to 2010, percent (geo mean)
3.0%

Department of Agricultural Economics
Kansas StateU N I V E R S I T Y
National average = 5.5%
Source: USDA NASS Land Values and Cash Rents 2010 Summary and Dhuyvetter (KSU), August 2010
Pasture Value Average Annual Growth Rate Jan 1, 2005 to Jan 1, 2010, percent (geo mean)
9.0%

Department of Agricultural Economics
Kansas StateU N I V E R S I T Y
Source: USDA NASS Land Values and Cash Rents 2010 Summary and Dhuyvetter (KSU), August 2010
Change from 2009
National average = 0.0%KS = +2.7%; NE = +5.6%
OK = +1.0%; MO = -2.4%
* Corresponding changes in crop land values were US= +1.1%; KS=+6.7%; NE=+10.6%; OK=+2.7%; and MO=+5.1%.
Pasture Average Value per Acre Jan 1, 2009
770

Department of Agricultural Economics
Kansas StateU N I V E R S I T Y
• In recent years, pasture land values have been increasing at faster rates than pasture rents
• Buying pasture ties up a lot of equity that is not generating a cash return unless some other income stream exists (e.g., lease hunting)
• Is this starting to change --- i.e., are rents going to start increasing at faster rates?
Pasture values versus rents…

Department of Agricultural Economics
Kansas StateU N I V E R S I T YPasture rental rates in Kansas

Department of Agricultural Economics
Kansas StateU N I V E R S I T Y
• Kansas Agricultural Statistics (KAS) collects data annually from landowners and producers regarding land values and cash rents– Agricultural Land Values – reported at the county level in
2009 (CRD level in years prior)
– Bluestem Pasture – 14-county area, discontinued in 2010
• Local and regional surveys of leasing practices
• With surveys there is often a trade-off between statistical validity and level of aggregation(tremendous variability always exists, i.e., think S&D factors)
Market established rates

Kansas Agricultural Statistics surveyed market rental rates(available at http://www.nass.usda.gov/Statistics_by_State/Kansas/index.asp)
Switched to county-level in 2009. Discontinued in 2010.

Department of Agricultural Economics
Kansas StateU N I V E R S I T Y
2000 2001 2002 2003 2004 2005 2006 2007 2008 2009
8
10
12
14
16
18
20
22
24
Cas
h r
ent,
$/a
cre
NW SC NE SE
Source: Kansas Agricultural Statistics
Kansas Pasture Rent
Historical rents for various regions
Department of Agricultural Economics
Kansas StateU N I V E R S I T Y
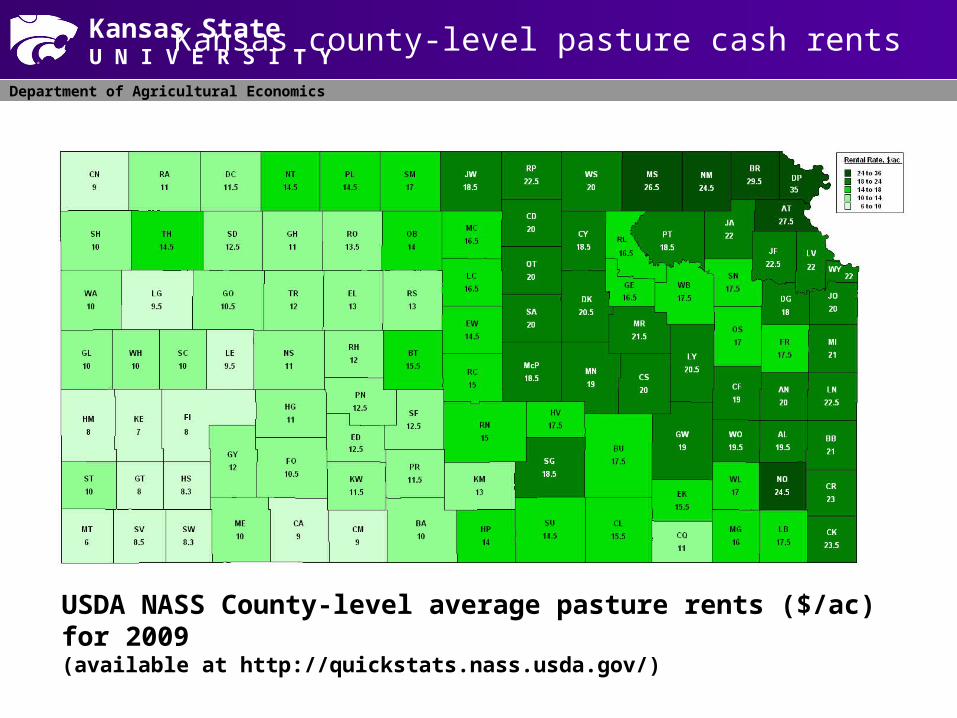
Kansas county-level pasture cash rents
USDA NASS County-level average pasture rents ($/ac) for 2009(available at http://quickstats.nass.usda.gov/)

Department of Agricultural Economics
Kansas StateU N I V E R S I T Y
19801982
19841986
19881990
19921994
19961998
20002002
20042006
2008
10
11
12
13
14
15
16
17
18
19
20
Ren
t, $
/acr
e
Ag Land Values & Rents (avg=1.1%; % neg=25.8%)
Bluestem Report, cow/calf (avg=1.8%; % neg=23.3%)
Bluestem Report, stocker (avg=1.1%; % neg=40.0%)
Source: Kansas Agricultural Statistics
Average Kansas Pasture Rents over Time
Pasture rents per acre trend up over time (but they do decrease 20-40% of the time)

Department of Agricultural Economics
Kansas StateU N I V E R S I T Y
19801982
19841986
19881990
19921994
19961998
20002002
20042006
2008
70
80
90
100
110
120
130
140
Co
w/c
alf,
$/p
air
40
45
50
55
60
65
70
75
Sto
cker
, $/h
ead
Bluestem Report, cow/calf (avg=1.8%; % neg=23.3%)
Bluestem Report, stocker (avg=1.1%; % neg=40.0%)
Source: Kansas Agricultural Statistics
Average Kansas Pasture Rents over Time
Rent per pair (head) is a better measure than per acre…

Department of Agricultural Economics
Kansas StateU N I V E R S I T Y
• Values represent average paid (received) from survey respondents
• Typically there is no information reported regarding variability within a county or region
• Question that arises is, How well do these average values reflect the “going market” rates?
USDA NASS survey values…

Department of Agricultural Economics
Kansas StateU N I V E R S I T Y
Determining futures rental rates in the absence of
publicly available reports
Department of Agricultural Economics

Department of Agricultural Economics
Kansas StateU N I V E R S I T Y
Trend in Pasture Rent over Time, 1978-2009
40
45
50
55
60
65
70
75
1976 1980 1984 1988 1992 1996 2000 2004 2008
Year
500-
699
Lb
Sto
cker
Ren
t, $
/hd
(fu
l)
What drives pasture rental rates?
Rents increase over time
Department of Agricultural Economics
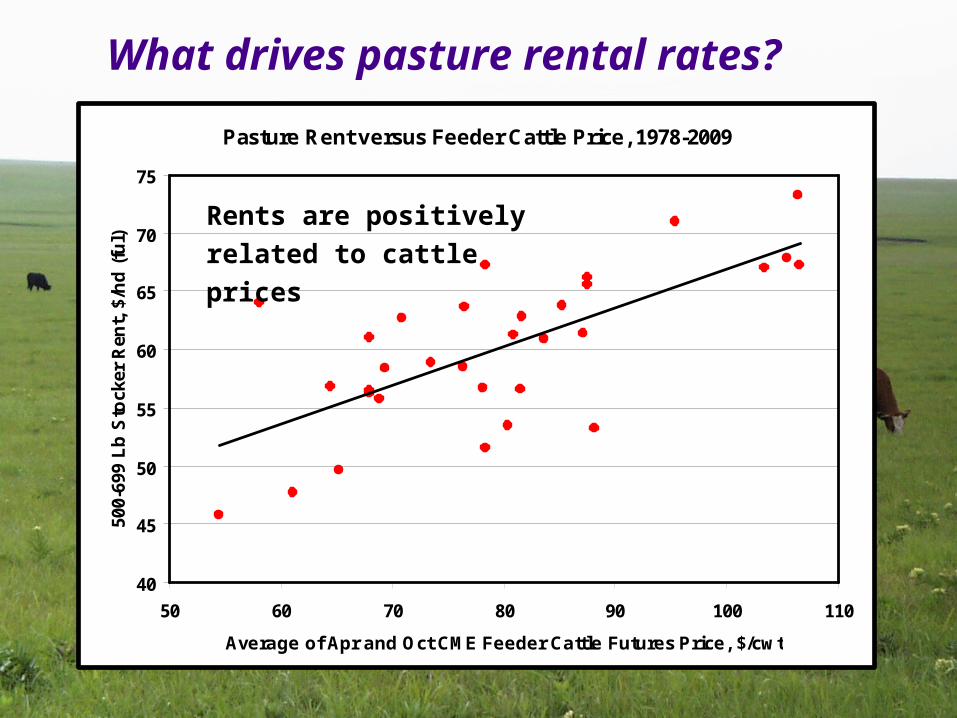
Kansas StateU N I V E R S I T YWhat drives pasture rental rates?
Pasture Rent versus Feeder Cattle Price, 1978-2009
40
45
50
55
60
65
70
75
50 60 70 80 90 100 110
Average of Apr and Oct CME Feeder Cattle Futures Price, $/cwt
500-
699
Lb
Sto
cker
Ren
t, $
/hd
(fu
l)
Rents are positively related
to cattle prices

Department of Agricultural Economics
Kansas StateU N I V E R S I T Y
Pasture Rent versus Corn Futures Price, 1978-2009
40
45
50
55
60
65
70
75
1.50 2.00 2.50 3.00 3.50 4.00 4.50 5.00 5.50 6.00
Average of May and Dec CBOT Corn Futures Price, $/bu
500-
699
Lb
Sto
cker
Ren
t, $
/hd
(fu
ll s
easo
n)
What drives pasture rental rates?
Rents are positively
related to corn prices

Department of Agricultural Economics
Kansas StateU N I V E R S I T Y What drives pasture rental rates?
Publication on agmanager.info
that reports historical pasture
rents and equations that can be
used to forecast future rents (where forecasts are a function of
time, feeder cattle prices, and corn
prices).
Equations are also built into an
online web tool…
(tool could be helpful in helping to
determine how to change rents
from year-to-year)

Department of Agricultural Economics
Kansas StateU N I V E R S I T Y
Inputs
Output(calculated values)

Department of Agricultural Economics
Kansas StateU N I V E R S I T Y 2010

Department of Agricultural Economics
Kansas StateU N I V E R S I T Y
-1.05% 0.00% +2.79% +0.48% +3.21% +1.91%
2011
Department of Agricultural Economics
Kansas StateU N I V E R S I T Y
KFMA Beef Cow-Calf Enterprise Data
Department of Agricultural Economics

Department of Agricultural Economics
Kansas StateU N I V E R S I T Y 2009 Cow-calf enterprise budget
Starting in 2009, total feed costs are classified as “Pasture” and “Feed Purchased.”

Department of Agricultural Economics
Kansas StateU N I V E R S I T Y
Profitability vs. feed cost
-700
-600
-500
-400
-300
-200
-100
0
100
200
150 200 250 300 350 400 450 500 550
Total feed costs, $/cow
Ret
urn
s o
ver
tota
l co
sts,
$/c
ow
Top 1/3 ($0 / $279)
Middle 1/3 ($-154 / $322)
Bottom 1/3 ($-357) / $363)
2005-09 returns over total cost
Based on analysis of 73 farms having at least three years of data from 2005-2009.

Department of Agricultural Economics
Kansas StateU N I V E R S I T Y
0
3
6
9
12
15
18
21
24
27
25 50 75 100 125 150 175 200 225 250 >250
Perc
ent o
f ope
ratio
ns
Pasture cost, $/cow
Distribution of 2009 Pasture Costs -- Beef Cows, Sell Calves
2009 pasture costs
Total of 108 farms (avg = $127; range = $19-$327) – 96 farms between $50-$250 (avg $133)

Department of Agricultural Economics
Kansas StateU N I V E R S I T Y
0
3
6
9
12
15
18
21
24
27
25 50 75 100 125 150 175 200 225 250 >250
Perc
ent o
f ope
ratio
ns
Pasture cost, $/cow
Distribution of 2009 Pasture Costs -- Beef Cows, Sell Calves
2009 pasture costs
Bluestem Report (combined average lease rate)
Average with fall calves = $127.60
Average with spring calves = $131.30
Overall average = $130.10
KFMA producer enterprise data and
Bluestem survey data match up quite well!
Average = $137
Range = $19-$327
Wide range across all cow/calf lease types surveyed.

Department of Agricultural Economics
Kansas StateU N I V E R S I T Y
• Length of grazing season
– Trade-off between pasture cost and purchased feed cost
– Ability to graze stalks in late fall/winter
• Pasture management / intensity
– Rotational grazing
– Pasture size / efficiency of use
• Lease rate paid
• Other?
What is driving variability across producers?
Pasture cost variability0
3
6
9
12
15
18
21
24
27
25 50 75 100 125 150 175 200 225 250 >250
Perc
ent o
f ope
ratio
ns
Pasture cost, $/cow
Distribution of 2009 Pasture Costs -- Beef Cows, Sell Calves

Department of Agricultural Economics
Kansas StateU N I V E R S I T Y
0
50
100
150
200
250
300
350
0 100 200 300 400 500 600
Past
ure
cost
, $/c
ow
Purchased feed cost, $/cow
2009 Pasture and Feed Costs -- Beef Cows, Sell Calves
2009 pasture costs
Fairly weak relationship between pasture and purchased feed costs.

Department of Agricultural Economics
Kansas StateU N I V E R S I T Y
0
50
100
150
200
250
300
350
0 100 200 300 400 500 600
Past
ure
cost
, $/c
ow
Purchased feed cost, $/cow
2009 Pasture and Feed Costs -- Beef Cows, Sell Calves
60 of 108 (55%) operations are to the left of the line and 48 (45%) are to the right of the line.
Combinations of pasture and purchased feed costs resulting in average total feed cost of $377/head.
2009 pasture costs

Department of Agricultural Economics
Kansas StateU N I V E R S I T Y Pasture cost variability
0
50
100
150
200
250
300
350
0 100 200 300 400 500 600
Past
ure
cost
, $/c
ow
Purchased feed cost, $/cow
2009 Pasture and Feed Costs -- Beef Cows, Sell Calves
Identifying where your farm falls on this figure (and why) is an important benchmark.
22.2%
10.2%
23.1%
13.0%
23.1%
0
3
6
9
12
15
18
21
24
27
25 50 75 100 125 150 175 200 225 250 >250
Perc
ent o
f ope
ratio
ns
Pasture cost, $/cow
Distribution of 2009 Pasture Costs -- Beef Cows, Sell Calves
Avg pasture cost = $127
Avg purchased
feed cost = $250
8.3%

Department of Agricultural Economics
Kansas StateU N I V E R S I T Y
• Publicly available data for analyzing and setting pasture rental rates is changing…– Bluestem Pasture Report -- discontinued
– CRD-level rates being replaced by NASS county-level rates
• Problems with using reported pasture rates– survey averages do not always reflect the “market”
– $/acre is not particularly useful w/o knowing productivity
– $/hd (pair) will become less meaningful as practices change
• Tremendous variability in rates exists and it is important to understand drivers of this
• Make sure you know if the rates you are paying on rented land are competitive and thus sustainable
Summary

Department of Agricultural Economics
Kansas StateU N I V E R S I T Y
Questions ???
www.agmanager.info
If interested in receiving weekly AgManager.info Update or any of our other Ag Econ newsletters via email, please let me know.

Department of Agricultural Economics
Kansas StateU N I V E R S I T Y
D
S
PE
QE
Q
P


