AFRICA b2C E-CommERCE REpoRt 2013 -
11
Transcript of AFRICA b2C E-CommERCE REpoRt 2013 -


€ 950 (excl. VAT)
€ 1,425 (excl. VAT)
€ 1,900 (excl. VAT)

Twitter LinkedIn Google+ FacebookPhone: +49 (0) 40 - 39 90 68 50Fax: +49 (0) 40 - 39 90 68 51
3- -
Africa B2C E-Commerce Report 2013
b2C E-Commerce increases in other African nations.
Currently, only a small percentage of roughly half of the Egyptian population that has access to the Internet shops online. As Internet and mobile penetration increase in Egypt, the potential B2C E-Commerce will be enhanced. Mass merchants Souq.com and Jumia.com were the leading E-Commerce websites in Egypt by audience reach, followed by international players Alibaba and Amazon. The leading product categories for online purchases in Egypt last year were movies and music, tickets and reservations, and clothes, shoes and accessories.
In Morocco, B2C sales in the first three quarter of 2013 have already passed the transaction total for 2012. The number of online shoppers reached over 300,000 last year. B2C E-Commerce transactions with bank cards grew by a more than a half year-on-year in 2012, reaching over EUR 50 million. Over a half of Moroccan online shoppers shopped from local sites only, while under a third preferred international merchants. Household appliances and clothing were the most purchased product categories.
Due to its large population and fast growing Internet penetration, Nigeria has a potential to become one of the leaders in B2C E-Commerce in Africa. The lack of supply in brick-and-mortar retail also drives demand for online outlets. B2C E-Commerce sales in Nigeria grew by a high double-digit rate in 2012, reaching under EUR 20 million. Around a quarter of urban Internet users shopped online in 2012.
In Kenya, B2C E-Commerce is driven by a surging mobile Internet penetration and popularity of mobile payments. The number of Internet users reached almost 20 million in June 2013, accounting for half of the population, while online shopping reached less than 20% of Kenyans even in urban areas.
Tunisia has one of the highest Internet penetration rates in Africa, almost 40%. In Tunisia, there were over 500 active E-Commerce platforms in September 2013, which generated sales of under EUR 20 million in the first eight months of 2013. The most purchased product categories were consumer electronics, travel, and clothing and accessories.
The pace of growth is slower in some other African nations. B2C E-Commerce is emerging in Algeria, with several players launching online shops and regulators taking notice. Internet penetration is very low in Ethiopia due to a telecommunications monopoly and the resulting low accessibility of ICT services. Further only a small one-digit share of Ethiopians with Internet access shop online. The number of Internet subscribers in Senegal grows steadily, reaching over 1 million in 2013. Of the Internet users residing in urban areas in Senegal, 4% bought products or services online. In Uganda, M-Commerce has a high potential due to popularity of mobile Internet and payment. In Zimbabwe, launch of a nationwide online payment system in September 2013 is expected to have a positive effect on E-Commerce as is the growing Internet penetration.
Key Findings (2 of 2)

Twitter LinkedIn Google+ Facebook
1. mANAGEmENt SUmmARY
2. AFRICA (REGIoNAl)• B2C E-Commerce Trends, 2013• B2C E-Commerce Sales, in USD billion,
2012 & 2025f• Internet Penetration, in % of Total Population,
by Selected Countries, 2012• Experience with Internet Usage, in Years,
in % of Internet Users, by Selected Countries, 2012
• Online Shopper Penetration on Active Internet Users, by Selected Countries, in %, 2013
• Mobile Shopper Penetration on Active Internet Users, in %, 2012 & 2013
• Mobile Shopper Penetration on Active Internet Users, by Selected Countries, in %, 2012 & 2013
• Frequent Online Activities Performed on PC, Laptop or Tablet, Incl. „Online Shopping“ in % of Internet Users, 2011/2012
• Frequent Online Activities Performed on a Mobile Phone, Incl. „Online Shopping“, in % of Internet Users, 2011/2012
• Share of Online Shoppers Who Would Prefer to Shop Online via Mobile Phone Over Shopping via Computer, by Selected Countries, in %, July 2013
• Frequent Online Activities Performed on PC, Laptop or Tablet, Incl. „Online Shopping“, in % of Internet Users, 2011/2012
• Frequent Online Activities Performed on a Mobile Phone, Incl. „Online Shopping“, in % of Internet Users, 2011/2012
• Share of Online Shoppers Who Would Prefer to Shop Online via Mobile Phone Over Shopping via Computer, by Selected Countries, in %, July 2013
• Perception of Advantages of Online Shopping, by Selected Countries, in %, July 2013
• Perception of Disadvantages of Online Shopping, by Selected Countries, in %, July 2013
3. SoUth AFRICA (pRIoRItY A CoUNtRY)• B2C E-Commerce Trends, 2013• B2C E-Commerce Sales, in ZAR billion,
2012 & 2013f• Share of B2C E-Commerce on Total Retail Sales,
in %, 2012
3. SoUth AFRICA (pRIoRItY A CoUNtRY) (CoNt.)• Number of Active Internet Users, in millions,
2012 & 2013f• Number of Fixed Broadband Internet Subscribers,
in thousands, and in % Year-on-Year Change, 2008-2012
• Share of Individuals and Households Having Internet Access, in %, 2012
• Types of Internet Connection, in % of Households with Internet Access, 2012, and Place of Accessing Internet, in % of Internet Users, 2012
• Online Web Traffic, Incl. Unique Visitors, in millions, and in % Mobile Traffic Share, June 2012 and June 2013
• Online Activities of Internet Users, Including Online Shopping, in % of Internet Users, October 2013
• Purposes of Internet Usage, in % of Internet Users, by Urban and Rural, 2012
• Breakdown of Online Shoppers, by Gender, in %, 2013
• Product Categories Purchased Online, in % of Internet Users, November 2012
• Payment Methods Used in B2C E-Commerce, in % of Online Shoppers, July 2013
• Breakdown of Concern Over Providing Credit Card or Banking Information When Shopping Online, in % of Internet Users, 2012
• Share of Cross-Border Online Shoppers on Active Internet Users, in % of Online Shoppers, 2011 & 2012
• Most Visited E-Commerce Website Categories, in % of Online Shoppers, January 2013
• Most Popular E-Commerce Websites, in % of Online Shoppers, 2012
• B2C E-Commerce Player Overview, 2013
4. EGYpt (pRIoRItY b CoUNtRY)• B2C E-Commerce Trends and Player Overview,
2013• Number of Internet Users, in millions and
in % Internet Penetration on Individuals, Q2 2012 - Q2 2013
• Breakdown of Internet Users, by Access Type, Q2 2012 - Q2 2013
• E-Commerce User Penetration on Households with Internet Access, in %, 2012
Phone: +49 (0) 40 - 39 90 68 50Fax: +49 (0) 40 - 39 90 68 51
4- -
Africa B2C E-Commerce Report 2013
table of Contents (1 of 3)

Twitter LinkedIn Google+ Facebook
4. EGYpt (pRIoRItY b CoUNtRY) (CoNt.)
• Online Shopper Penetration on Internet Users, in %, 2012
• E-Commerce Activities of Internet Users, in %, 2012
• Most Purchased Product Categories in B2C E-Commerce, in % of Online Shoppers, 2012
• Product and Service Categories Purchased in E-Commerce, in % of E-Commerce Users, 2012
• Problems Faced in E-Commerce, in % of Online Shoppers, 2012
• Leading E-Commerce Websites, by Audience Reach, in % of Internet Users, 2012
5. moRoCCo (pRIoRItY b CoUNtRY)
• B2C E-Commerce Trends, 2013• Value and Number of B2C E-Commerce
Transactions Made with Bank Cards, in MAD million and in thousands, 2011 & 2012
• Value and Number of B2C E-Commerce Transactions Made with Bank Cards, in MAD million and in thousands, Q1-Q3 2013 & Q1-Q3 2012
• Internet Penetration on Households, by Technology, in %, 2011 & 2012
• Online Shopper Penetration, in % of Internet Users, 2011 & 2012
• Number of Online Shoppers, in thousands, by Shopped Once, More than Once, and Total, 2011 & 2012
• Share of Consumers Who Purchased Online At Least Once, May 2013
• Breakdown of Online Shopping Expenditure, in % of Online Shoppers, 2012
• Breakdown of Preferred Payment Methods in B2C E-Commerce, in % of Online Shoppers, 2012
• Breakdown of Online Shoppers, by Shopping Destination, May 2013
• Product Categories Purchased Online, in % of Online Shoppers, 2012
• Product and Services Purchased Online, in % of Online Shoppers, May 2013
• Reasons Not to Shop Online, in % of Consumers Who Do Not Shop Online, May 2013
6. NIGERIA (pRIoRItY b CoUNtRY)
• B2C E-Commerce Trends, 2013• B2C E-Commerce Sales in Nigeria, in NGN billions,
2011 & 2012• Internet Penetration on Individuals, in %,
2011 & 2012• Types of Internet Connection, in % of
Households with Internet Access, 2012, and Place of Accessing Internet, in % of Internet Users, 2012
• Number of Mobile Internet Subscribers, H1 2012 & H1 2013
• Frequent Online Activities, by Performed on a Computer and Mobile Phone, Incl. „Online Shopping“, in % of Urban Internet Users, 2012
• Payment Methods Used in B2C E-Commerce, in % of Online Shoppers, July 2013
7. KENYA (pRIoRItY C CoUNtRY)
• B2C E-Commerce Trends, 2013• Number of Internet Users, in millions and
in % of Total Population, June 2012, September 2012, December 2012, March 2013, June 2013
• Frequent Online Activities, by Performed on a Computer and Mobile Phone, Incl. „Online Shopping“, in % of Urban Internet Users, 2012
• Payment Methods Used in B2C E-Commerce, in % of Online Shoppers, July 2013
8. tUNISIA (pRIoRItY C CoUNtRY)
• B2C E-Commerce Trends, 2013• B2C E-Commerce Sales, in TND million,
H1 2012 & January 2013 - August 2013• Number of Internet Subscriptions,
in millions and in % of Total Population, 2009 - 2013e
• Number of Internet Users, in millions and in % of Total Population, 2009 - 2011
• Breakdown of the Most Used Payment Methods, March 2013
• Most Purchased Product Categories, in % of Online Shoppers, March 2013
Phone: +49 (0) 40 - 39 90 68 50Fax: +49 (0) 40 - 39 90 68 51
5- -
Africa B2C E-Commerce Report 2013
table of Contents (2 of 3)

Twitter LinkedIn Google+ Facebook
9. AlGERIA
• B2C E-Commerce Trends, 2013• Internet Penetration on Individuals, in %,
2011 & 2012
10. EthIopIA
• Internet Penetration on Individuals, in %, 2011 & 2012
• Frequent Online Activities, by Performed on a Computer and Mobile Phone, Incl. „Online Shopping“, in % of Urban Internet Users, 2012
11. GhANA• B2C E-Commerce Trends, 2013• Internet Penetration on Individuals, in %,
2011 & 2012• Frequent Online Activities,
by Performed on a Computer and Mobile Phone, Incl. „Online Shopping“, in % of Urban Internet Users, 2012
12. SENEGAl• Number of Internet Subscribers, in millions and
in % of Total Population, June 2012, September 2012, December 2012, March 2013, June 2013
• Frequent Online Activities, by Performed on a Computer and Mobile Phone, Incl. „Online Shopping“, in % of Urban Internet Users, 2012
13. UGANDA
• B2C E-Commerce Trends, 2013• Number of Internet Subscriptions, in millions,
June 2012 & June 2013• Payment Methods Used in B2C E-Commerce,
in % of Online Shoppers, July 2013
14. ZImbAbWE
• B2C E-Commerce Trends, 2013• Internet Penetration on Individuals, in %,
2011 & 2012
Phone: +49 (0) 40 - 39 90 68 50Fax: +49 (0) 40 - 39 90 68 51
6- -
Africa B2C E-Commerce Report 2013
table of Contents (3 of 3)

Twitter LinkedIn Google+ FacebookPhone: +49 (0) 40 - 39 90 68 50Fax: +49 (0) 40 - 39 90 68 51
7- -
Samples
Africa B2C E-Commerce Report 2013
SAmplE oUtpUt: StAtIStIC
We deliver the facts – you make the decisionsRESEARCH ON INTERNATIONAL MARKETS
Morocco (49%) was the African country with the highest Internet penetration in December 2011, followed by the Seychelles and Tunisia.Africa: Top Internet Countries, Rank 1-10, by Internet Penetration, in % of Population, December 2011
38,0%
49,0%
36,3%
36,0%Reunion (FR)
Tunisia
Seychelles
Morocco
International Sales Users / ShoppersProductsShares PlayersTrends
10
Source: to be mentioned in the report
36,0%
25,5%
26,4%
29,0%
28,8%
24,8%
17,3%
0% 25% 50% 75%
Sao Tome & Principe
Mauritius
Kenya
Egypt
Cape Verde
Nigeria
Reunion (FR)
SAmplE oUtpUt: CompANY pRoFIlE
We deliver the facts – you make the decisionsRESEARCH ON INTERNATIONAL MARKETS
In Q3 2012, multi-channel mass merchant Magazine Luiza generated 12% of its total revenues through online sales.Brazil: Profile of Magazine Luiza
18
Name of Company Magazine Luiza S.A.
Headquarters Franca, Sao Paulo, Brazil
Major Online Shop www.magazineluiza.com.br
Company Type Multi-Channel Retailer
Product Range Mass Merchant
Financial Data • Consolidated gross revenues of BRL 2.2 billion in Q3 2012, up by +15.2% from Q3 2011• Online sales of BRL 269 million in Q3 2012, up by +25.5% from Q3 2011
E-Commerce related News
• Magazine Luiza launched its improved online shop in November 2012, which aims at ensuring customer responsivenessthrough close contact. On the new website, product categories are organized by color and stores. Furthermore,customers receive recommendations based on their browsing and purchasing behavior. The new website also featureshigher browser and mobile device compatibility and claims to be faster than any other E-Commerce site in Brazil.
• In November 2012, Magazine Luiza diversified its online offering by opening a virtual florist. Besides buying flowers forspecific categories such as birthdays and apologies, customers can order additions such as chocolates and books to gowith the flowers.
• In Q3 2012, online sales accounted for 12% of total revenues of Magazine Luiza.
International Sales Users / ShoppersProductsShares PlayersTrends
Source: to be mentioned in the report
SAmplE oUtpUt: RANKING SAmplE oUtpUt: tRENDS
We deliver the facts – you make the decisionsRESEARCH ON INTERNATIONAL MARKETS
The number of mobile Internet users in Japan is estimated to increase to 93 million in 2016, up from 66 million in 2012.
3
Japan: Mobile Internet Users, in millions and in % of Country Population, 2010-2016f
in m
illion
s
in %
of C
ount
ry P
opul
atio
n
International Sales Users / ShoppersProductsShares PlayersTrends
6066
7480
87
93
55
44%47%
52%58%
63%69%
74%
0
20
40
60
80
100
120
140
2010 2011 2012f 2013f 2014f 2015f 2016f0%
10%
20%
30%
40%
50%
60%
70%
80%
Number of Mobile Internet Users Percentage of Country Population
Definition: mobile phone users of any age, who access the Internet from a mobile browser or an installed application at least once per month; excludes SMS, MMS, IMSource: to be mentioned in the report
We deliver the facts – you make the decisionsRESEARCH ON INTERNATIONAL MARKETS
1515
French online travel revenue (+16%) grew stronger between January and September 2011 than French B2C E-Commerce revenue (+12%).France: Online Travel Trends, 2011
Between January and September 2011, online travel revenue in France increased by +16%, which is a stronger growth thanthat of B2C E-Commerce as a whole (+12%). Growth in French online travel was mainly driven by Voyages-sncf.com, asreported by L’Echo Touristique.
In Q1 2011, travel sales had increased by +12% and +20% in Q2, followed by a growth of +15% in Q3 2011, despite thefinancial crisis and the Arab Spring. In total 2011, online travel sales in France amounted to EUR 12 billion, up from EUR10.7 billion in 2010.
The Internet was very popular among French travelers in 2011. 59% of them gather information online before booking a trip.56% of French travelers bought travel services online, while 22% exclusively purchased their travel services online, accordingto Fevad.
The average travel-related online shopping basket was EUR 291 in France, three times higher than the average E-Commerce basket in the country.
35% of French online travel shoppers bought train tickets and 23% booked tickets for other transportation services. A further31% also made online reservations for hotels and other accommodations, while 20% used the Internet to find rental services.
Furthermore, “Travel and Holiday Accommodation” was the leading sector in French B2C E-Commerce in 2011, reachinghigher sales than the next four top sectors combined.
After Malaysia, France was the market with the second highest growth in reach of airlines category, reaching 12.2% growthin February 2011.
International Sales Users / ShoppersProductsShares PlayersTrends
Source: to be mentioned in the report

Twitter LinkedIn Google+ Facebook
methodology
Phone: +49 (0) 40 - 39 90 68 50Fax: +49 (0) 40 - 39 90 68 51
8- -
Africa B2C E-Commerce Report 2013
General methodology of our market Reports:
• The reports include the results of secondary market research: By using various sources we ensure maximum objectivity for all obtained data. As a result companies get a precise and unbiased impression of the market situation.
• Cross referencing of data was conducted in order to ensure validity and reliability.
• The reports contain a Management Summary, summarizing the main information provided in each chapter.
• Besides providing information on the specific topic, every chart contains an Action Title, which summarizes the main statement of the chart and a Sub Title, which gives information about the country, the topic, the unit or currency, and the time period the dataon the chart refers to.
• Furthermore, the source of information and its release date are provided on every chart. It is possible that the information included in one chart is derived from several sources. Then, all sources are mentioned on the chart.
• If available, additional information about the data collection, for example the time of survey and number of people asked, is provided in the form of a note. In some cases, the note (also) contains additional information needed to fully understand the contents of the respective data.
• When providing information about amounts of money, local currencies were mostly used. When referencing them in the Action Title, the EUR values are also provided in brackets. The conversions are always made using the average currency exchange ratefor the respective time period. Should the currency figure be in the future, the average exchange rate of the past 12 months is used.
• The reports include mainly data from the last 12 months. The exact publication dates are mentioned in every chart.
methodology for our b2C E-Commerce market Reports:
This B2C E-Commerce Report by yStats.com is produced in a holistic approach to provide relevant information about recent market trends, sales figures, shares, products, Internet users and Internet shoppers as well as important player news in B2C E-Commerce in the relevant region.
• This report covers the B2C E-Commerce market. It takes into account a wide definition of B2C E-Commerce, and might include mobile commerce and social commerce. B2B E-Commerce and C2C E-Commerce are not included, unless stated otherwise.
• This report also includes rankings. Within these rankings, it is possible that the total amount adds up to more than 100%. If this is the case, multiple answers were possible, and this is then mentioned in the note of the chart.
• This report contains a Management Summary, summarizing the main information provided in each chapter.
• The chapter number two of this report covers regional development, such B2C E-Commerce trends, sales, as well as information on Internet users and shoppers, including regional data and country comparisons.
• The remaining chapters provide information on a by country basis.
• The country leading in the region in terms of B2C E-Commerce sales and online shopper penetration is covered first in the country chapters (Priority A Country). The information includes major trends in the B2C E-Commerce market, sales figures, shares of B2C E-Commerce on the total retail market, development in Internet and online shopper penetration, main B2C E-Commerce product categories, and payment methods. Furthermore, major players in the B2C E-Commerce market were identified and presented in rankings and an overview.
• The countries ranking next by B2C E-Commerce sales and online shopper penetration in the region (Priority B and C Countries) are presented next, with information on B2C E-Commerce trends, sales, shares, Internet and online shopper penetration, depending on data availability.
• Further countries (Others) were presented in alphabetical order, grouped under. For these countries, major developments on the B2C E-Commerce market were summarized in trends and data on Internet penetration and online shopping penetration, where available.
Twitter LinkedIn Google+ Facebook
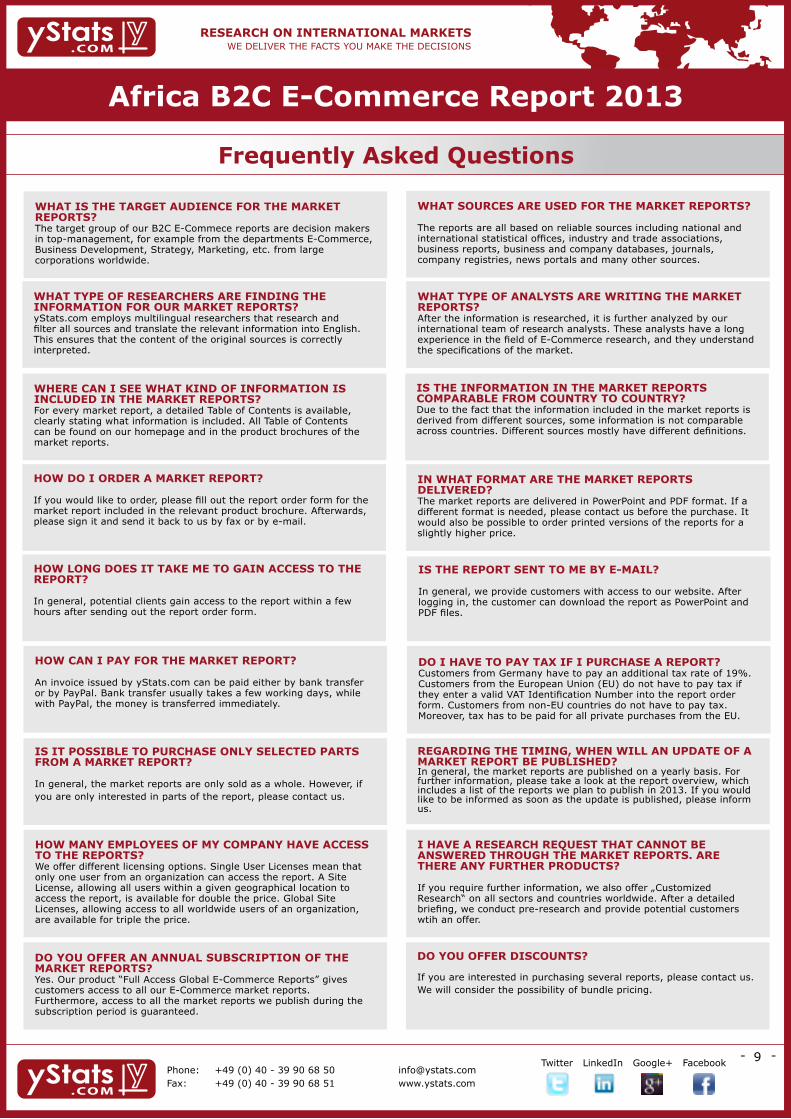
Frequently Asked Questions
Phone: +49 (0) 40 - 39 90 68 50Fax: +49 (0) 40 - 39 90 68 51
9- -
Africa B2C E-Commerce Report 2013
WhAt IS thE tARGEt AUDIENCE FoR thE mARKEt REpoRtS? The target group of our B2C E-Commece reports are decision makers in top-management, for example from the departments E-Commerce, Business Development, Strategy, Marketing, etc. from large corporations worldwide.
IS thE INFoRmAtIoN IN thE mARKEt REpoRtS CompARAblE FRom CoUNtRY to CoUNtRY? Due to the fact that the information included in the market reports is derived from different sources, some information is not comparable across countries. Different sources mostly have different definitions.
WhAt tYpE oF RESEARChERS ARE FINDING thE INFoRmAtIoN FoR oUR mARKEt REpoRtS? yStats.com employs multilingual researchers that research and filter all sources and translate the relevant information into English. This ensures that the content of the original sources is correctly interpreted.
WhERE CAN I SEE WhAt KIND oF INFoRmAtIoN IS INClUDED IN thE mARKEt REpoRtS? For every market report, a detailed Table of Contents is available, clearly stating what information is included. All Table of Contents can be found on our homepage and in the product brochures of the market reports.
IN WhAt FoRmAt ARE thE mARKEt REpoRtS DElIVERED? The market reports are delivered in PowerPoint and PDF format. If a different format is needed, please contact us before the purchase. It would also be possible to order printed versions of the reports for a slightly higher price.
hoW loNG DoES It tAKE mE to GAIN ACCESS to thE REpoRt? In general, potential clients gain access to the report within a few hours after sending out the report order form.
hoW CAN I pAY FoR thE mARKEt REpoRt?
An invoice issued by yStats.com can be paid either by bank transfer or by PayPal. Bank transfer usually takes a few working days, while with PayPal, the money is transferred immediately.
Do I hAVE to pAY tAX IF I pURChASE A REpoRt? Customers from Germany have to pay an additional tax rate of 19%. Customers from the European Union (EU) do not have to pay tax if they enter a valid VAT Identification Number into the report order form. Customers from non-EU countries do not have to pay tax. Moreover, tax has to be paid for all private purchases from the EU.
hoW mANY EmploYEES oF mY CompANY hAVE ACCESS to thE REpoRtS? We offer different licensing options. Single User Licenses mean that only one user from an organization can access the report. A Site License, allowing all users within a given geographical location to access the report, is available for double the price. Global Site Licenses, allowing access to all worldwide users of an organization, are available for triple the price.
REGARDING thE tImING, WhEN WIll AN UpDAtE oF A mARKEt REpoRt bE pUblIShED?In general, the market reports are published on a yearly basis. For further information, please take a look at the report overview, which includes a list of the reports we plan to publish in 2013. If you would like to be informed as soon as the update is published, please inform us.
I hAVE A RESEARCh REQUESt thAt CANNot bE ANSWERED thRoUGh thE mARKEt REpoRtS. ARE thERE ANY FURthER pRoDUCtS?
If you require further information, we also offer „Customized Research“ on all sectors and countries worldwide. After a detailed briefing, we conduct pre-research and provide potential customers wtih an offer.
hoW Do I oRDER A mARKEt REpoRt? If you would like to order, please fill out the report order form for the market report included in the relevant product brochure. Afterwards, please sign it and send it back to us by fax or by e-mail.
IS thE REpoRt SENt to mE bY E-mAIl? In general, we provide customers with access to our website. After logging in, the customer can download the report as PowerPoint and PDF files.
WhAt SoURCES ARE USED FoR thE mARKEt REpoRtS? The reports are all based on reliable sources including national and international statistical offices, industry and trade associations, business reports, business and company databases, journals, company registries, news portals and many other sources.
WhAt tYpE oF ANAlYStS ARE WRItING thE mARKEt REpoRtS? After the information is researched, it is further analyzed by our international team of research analysts. These analysts have a long experience in the field of E-Commerce research, and they understand the specifications of the market.
IS It poSSIblE to pURChASE oNlY SElECtED pARtS FRom A mARKEt REpoRt?
In general, the market reports are only sold as a whole. However, if you are only interested in parts of the report, please contact us.
Do YoU oFFER DISCoUNtS? If you are interested in purchasing several reports, please contact us. We will consider the possibility of bundle pricing.
Do YoU oFFER AN ANNUAl SUbSCRIptIoN oF thE mARKEt REpoRtS?Yes. Our product “Full Access Global E-Commerce Reports” gives customers access to all our E-Commerce market reports. Furthermore, access to all the market reports we publish during the subscription period is guaranteed.

10

11