
Aerospace Suppo tsn Remote Sensing
12
¥•• "Made available under NASA sponsorship in the interest of early and wide dis- semnation of Earth Resources Survey D 'twam information and without liability •o' any use made thereof." Suppo r tsn SR-P1-04163 NAS9-1C466 A Joint Program for Agriculture and Resources Inventory Surveys Through Aerospace Remote Sensing April 1980 issi ANALYTICAL DESIGN OF MULTISPtCTRAL SENSORS .OF POOR QUALITY D. J. Wiersma, D. A. Landgrebe (£83-10337) ANALYTICAL DESIGN OP HULTI^PECTBAL SENSOKS (Purdue Univ.) tl D HC A02/KF AOJ ~ ' cs Purdue University/LARS W. Lafayette, Indiana 47906 N8J-297n8 Uuclas G3/U3 00337 Lyndon B. Johnson Space Center Houston, Texas 77058
Transcript of Aerospace Suppo tsn Remote Sensing

¥••
"Made available under NASA sponsorshipin the interest of early and wide dis-semnation of Earth Resources SurveyD'twam information and without liability•o' any use made thereof."
Supportsn
SR-P1-04163NAS9-1C466
A Joint Program forAgriculture andResources InventorySurveys ThroughAerospaceRemote Sensing
April 1980
issi
ANALYTICAL DESIGN OF MULTISPtCTRAL SENSORS
.OF POOR QUALITY
D. J. Wiersma, D. A. Landgrebe
(£83-10337) A N A L Y T I C A L D E S I G N OPHULTI^PECTBAL SENSOKS ( P u r d u e U n i v . ) t l DHC A02/KF AOJ ~ 'c s
Purdue University/LARSW. Lafayette, Indiana 47906
N8J-297n8
UuclasG3/U3 00337
Lyndon B. Johnson Space CenterHouston, Texas 77058

180Of POOR QUAL.iY H 1 G 8 0
ItLE TRANSACTIONS ON GtOSCIENCE AND RFMOTE SENSING. VOL GE 18, NO. 2. APRIL 1980
Analytical Design of Multispectral SensorsDANIEL J W1ERSMA, MEMBER. IEEE, AND DAVID A LANDGREBE, FELLOW, IELE
Abstract-An analytical f racedure for the design of the spectral chan-nels for multiipcclral remo<e sensor systems is defined. An optimaldesign based on the cnler'on of minimum mean-square representationerror using the Karhunen-Locvc expansion was developed to representthe spectral response functions from a stratum based upon a stochasticprocess scene model. From the overall pattern recognition svslcmperspective the effect of the representation accuracy on a typical per-formance criterion, the probability of correct classification, is investi-gated. The optimum sensor design provides a standard against whichpractical (suboptimum) operational sensors can be compared. An ex-ample design is provided and its performance is illustrated.
Although tht analytical technique was developed primarily for thepurpose of sensor design H was found that the procedure has potentialfor making important contributions to scene understanding. It was con-cluded that spectral channels which have narrow bandwidths relative tocuirenl sensor systems may be necessary to provide adequate spectralrepresentation and improved classification performance.
I INTRODUCTION
PATTERN recognition system as used in a remotesensing system for eartli resources consists of three
fundamental components-the scene, the sensor, and the pro-cessor (Fig 1) The scene is, that portion of the earth's surfaceobserved by the sensor The desired information is containedin the spcctial, spatial, and temporal variations of the electro-magnetic energy emanating from the scene The sensor col-lects the energy and measures its features The processor istypically a digitally implemented classification algorithmwhich makes ,-n appropriate decision based on the featuremeasurements provided by the output from the sensor Vari-ous types of ancil lary data are also now typically used in thedecision-making process
At present the design of the processor algorithms is quiteadvanced and provides variety and flexibili ty for optimal per-formance given a feature set [4], [5] However, the design ofthe best set of features is a complex mat ter winch is not wellunderstood There are many sensor parameters involved [ I I ,ch 7] In the current work we limit considerations to the de-sign of the spcciral aspects of features to make the problemmore tractable, leaving other aspects to later occasions
Manuscupt received January 4, 1979, revised December 7, 1979 Thiswork was supported by NASA/Johnson Spate Center andcr ContractsNAS9-14970and NAS9-15466
D J Wicrsma was wilh the Department of Elcitrical Knginecrmg andthe LaborJlory for Applications of Remote Sensing (LARS), PurdueUniversity, Lafayette. IN He is now wi th the Mmncapo.is HoneywellCompan>, Minneapolis, MN
D A Landgrchc is with the Department of electrical Ensuntcnngand the Laboratory for ApphcaHons of Remote Sensing, Purdue Uni-"cmty, West Lafayette, IN 47907
SENSOR
«I
"3
\
PEOCESSOI(C1ASSIF1ER)
Tig 1 f-attcrn recognition system
II Sl ' ICTRAL RnfRHShNTATION AND OPTIMUM
SENSOR DESIGN
In order to achieve an optimal design of a set of spectral fea-tures one must have sui tat> ;e analytical representations for1) the spectral response of the scene, 2) the sensor system,3) the processor system, and 4) one must have a suitable,analytically expressible optimahty criterion Further, we notethe following factors which influence the creation of a spectralfeature design procedure
1) The scene 13 very complex in the fashion in which it re-flects and emits optical radiation Mathematical models whichpredict the scene radiant exitance at least to the level of ac-curacy and precision needed for our problem, do not yet existAs a result an empirical scene model must be used
2) Because satcllne-borne sensor systems are very expensivethey cannot usually be designed specifically for a ceitain aseor user Rather they must be optimized with regard to a largenumber of scenes and uses (Fig 2) The feature space whichthe sensor defines must be adequately detailed, for example,such that m cai ly season when agncultut il crop canopies haveachieved only 10-15-percent cover, both the crop speciesmapping user and the soils mapper ran be served This fact isimportant in the choice of optimahty cntcrion, as will be seenshortly
3) It is highly desirable that the spectral features be designedin such a way tha t they are maximally efficient in the sensethat a feature set of any given size contain the maximumamount of useful information possible so that any givenanalysis can proceed with the smallest number of featurespossible There are at least three reasons for this feature effi-ciency in this sense tends to decrease the amount of pioccssorcompulation icquircd, it tends to decrease the processor com-plexity required, and it tends to reduce the amount of trainingsample daia needed
4) There are a number of constraints on the design of asensor, generally of a practical character, which cannot rea-sonably be expressed analytically Examples are those result-ing from optical design considerations, sensor material sensi-tivity curves, cost factors, spacecraft size and weight
0196-2892/80/0400-0180SOO 75 © 1980 IEEE

W1ERSMA AND LANDGREBE DESIGN OF MULT'SPECTRAL SENSORSORIGINALOF POOR QUALITY 181
SCENES<ST«AT»)
CLASSIFIERS(PARTITIONS OF
nSATME SPACE)
Tig 2 A sensor system must be designed to perform satisfactorily formany reasons scenes at various times of the season, i c , defining fea-tures spaces detailed enough to permit successful partitions for vary-ing applications
OPTIHU.SEKSOR
Fig 3 Sensor systjm design procedure
considerations, etc , and especially from the interrelationshipsof these types of factors To mitigate this circumstance we willuse the scl'eme depicted in Fig 3. That is, we will determineoptimal sensor characteristics using entirely analytical meanswithout regard for their physical reahiability These charac-teristics will then serve as a guide by which to determinenearly equivalent but physically realisable characteristics whichperform nearly dS well
In order to achieve the desired spectral feature design schemewe must deal specifically with each of these lettered and num-bered items above
A The Scene Model
Let us begin by considering the information branng aspectsof the spectral response function .v(X) |8] This responsefunction (e g , from a single pixel) is proportional to the elec-tromagnetic energy received by the sensor as a function ofwavelength X (Fig 4) Many factors determine the spectral re-sponse function for a given observation The irradiance of thesun, the conditions of the atmosphere, and the reflectance ofthe surface features all have important effects on the responseSince a deterministic iclationship between the response func-tion and the many factors affecting it would be very complex,the set of functions which are observed in practice are bestmodeled as a stochastic process
The ensemble of the stochastic process [13] will be definedin terms of the stratif ication necessary to apply pattern recog-nition methods to the earth observational problem A stratumS is defined as the largest contiguous area wluch can be classi-fied to an acceptable level of perfoiTnance with a single train-
Fig 4 Spectral response function for Mature Wheat collected onAugust 4, 1977, over Williams County, ND
Fig 5 Realization of a s tratum ai> the ememble of spectral samplefunctions
ing of the classifier It is noted that the sensor must be de-signed to operate satisfactorily over a large number of suchstrata, which vary greatly with time, location and applicationThe collection of all possible strata which a sensor may ob-serve is denoted by S0 Since the set S0 is q 'nte large, it isnecessary to select a smaller subset which is representative in astatistical sense in order to perform the design
The random experiment for the stochastic proceis consistsof the observation of a point in a stratum 5 Each point in thestratum is mapped into a spectral response function (Fig 5)The collection of all response functions from a stratum definesan ensemble The ensemble plus the corresponding piobabihtymeasure defines the stochastic process [13] It is appropriateto assume a Gaussian probability measure for tlus process [3].
B The Sersor System Model
Next we choose a mathematical model for the sensor torepresent the spectral response function for each observationLet the sensor be represented by a set of A'filter functions orbasis functions (0,(X)} such that the output of each filter isgiven by (Fig. 6)
0)
The output of the sensor model is a sequence, {.t|,Xi,xN} = X, which represents the spectral response by the

182
cS
,v.
Pig 6
IfcbE TRANSACTIONS ON GEOSC1ENCE AND REMOTE SENSING. VOL GE-18, NO 2, APRIL 1980
fidelity with which the output of the sensor represents theinput We will choose the set {<£,(X)} such that for a givenJC(A) the approximation J?(X) is as close as possible to the truespectral response function One may think of this approach asone intended to minimize the information loss through thesensor even though it cannot be known to the sensor designerwhat the information is Ir passing fromx(X) to {*,} there isno information loss if x(X) is recoverable from {AT,}
A common criterion for representation accuracy is the ex-pected mean-square representation error given by
(3)
However, it is desirable at this point to generalize this criterionby introducing a weight function w(X) on the spectral intervalAs will be seen, the weight associated with each X can be usedto introduce into the analysis a pnan knowledge corcerningthe spectrum Thus (1) and (3) become [16].
x . . t i ' X -•x.e-.iu
Sensor system model
XUIIUlTig 7 Approximation of the spectral response function by a set of
four basic funclioiis
approximation
"-1- (la)
(2)
A simple il lustration of the concept is given in Fig 7 How-ever, by relaxing the usual restrictions on the shape of the{0n(X)l. considerable advantage tan be obtained There is notheoretical or practical reason, for example, for the {$,i(X)} tobe nonoverlapping What is needed is to d-iermme the orderedset of basis functions which are optimal with regard to a mean-ingful system performance cntenon
C The Optimalitv Cntenon Including the Processor Model
A key consideration is the choice of the optimahty cntenonIt is desirable to optimr/e the sensor design with respect to anoverall system (including the scene and processor) pciformancecriterion The probability of correct classification is the cri-terion to be used here This choice is made because it is an ob-jective indicator of desired performance in a practical sense fora large proportion of applications, and it is perhaps the beststudied and understood in a theoretical sense In selecting thisperformance measure there must also be associated with it aprocessor (classifier) model, in this use we chose the maxi-mum likelihood rule, for the same reasons
However, because of the design factor pointed out in item(2) and Fig 2, we find it desirable to define an intermediateoptimality criterion Because the sensor m^st function over avaried collection of strata using anv of a large collection ofcljssifieis, a criterion wai chosen which is a measure of the
I [x(\)-x(\)\* w(X)</XJ (3a)
We want to choose the set of basis functions (0,(X)} whichis optimal with respect to the spectral icpiescnta'-on criterionof expected mean-square error £ {cr} Merc specifically, it isdesired that the representation be complete in the sense thatthe expected mean-squaie error for any function in the en-semble be made arbitranly ''mall simply by including enoughterms, that convergence of the approximation to the originalresponse be rapid in the first few terms, and, without loss ofgenerality, we may aho ask that the basis functions beorthogonal to each other
A technique for deternv.mg the set of optimal basii func-tijns for an ensemble which satisfies the desired propones isbased on the weighted Karhunen-Loeve expansion [2J , (16],[17] The solution to the homogeneous linear integralequation is
*(A. (4)
with the covanance function of the stochastic process, A'(X, £),as kernel is a set of eigenfunctions (0,(X)} with correspondingeigenvalues ~f, If the eigenvalues are arranged in descendingorder, the corresponding sequence of eigenfunctions can beused to *"orm a linear combination of the eigenfunctions whichconverges to the origins) spectral response function with arbi-trardy small expected mean-square error Furthermore, be-cause of the ordering of the eigenvalues, convergence in thefirst few terms is very rapid This rap-d convergent allowstruncation of the series expansion after a finite number ofterms N with mean-square error minimized over all possiblechoices of/V basis functions The mean square error is given by

WIKKSMA AND LANOCRtBE HKSIGN Ot MULTISI'tCTRAL SENSORS
SIIKC the unmodified (w(X) = 1) Karhuncn-Locve expansion isa well-siudied technique and satisfies the desired properties forfinding the basis functions, a sound analytical method is pro-vided for determining the optimal set of basis functions
The optimal sensor design problem may be solved on a digitalcomputer using empirical data taken by field measurementsSome approximations must be made in order to take into con-sideration some practical constraints First the response func-tions arc not available as continuous functions but aro ob-tained in the field by sampling the spectrum with an instru-ment that uses very narrow spectral windows Secondly, theparameters of the process arc not known a pnon, hence, it isnecessary to est imate the mean and covanance functions usinga representative sample from the ensemble Finally, becausethe data will be stored and processed digitally it is necessary toqu.mti7e the ampli tude of the response at cacn of the spectralsample points Each of these constraints potentially can con-t r ibu te to the representation error It has been shown thatwi th reasonable care in selecting a suff ic ient ly high spectralsampling rate, a large enough sample from the ensemble, and alarge number of quantisation intervals that the contribution ofthese factors to the representation error is small [16] Theintegral equation (4) becomes the matr ix equation
183
<s>r = (6)
where <$> is the mamx of eigenvectors, I is the diagonal matrixof eigenvalues, K is the covanance mat r ix , and U'ls the diago-nal matrix of weight coefficients
I I I R F L A T I O N S H I I ' B u v M - r N THI S P I C T R A LRl 1'Kt.SI N T A P I O N \Hf> S Y b l h M Pl.R hORM ANC h
The performance of the overall system is ul i imately what wewish to optimi/c For this purpose, as previously indicated theprobabil i ty of rorrcct classification Pr has been chosen as theperformance ind ica to r to be optmiutd If the vector X is anobservation from one of M classes C,, i - I, 2, , M witha pnon probabilities />,, the probabili ty of correct classifica-tion, using the maximum likelihood rule is given by
(7)= max {plP(X\C,)]dX
where p(V|C,) is the conditional (mul t ivanant ) probabilitydensi ty func t i on lor class / The integral in (7) is over theobservation space
The analyt ical procedure based on the weighted Karhunen-Loeve expansion has prescribed a sensor design which mini-ITH/-CS the mean-square representation error One would liketo know how the abili ty to represent a process influences theclassification performance To study this relationship thegraph of the probabili ty of correct classification versus ex-pected mcan-squa'v- error is introduced (Fig 8) We willbrief ly discuss some of its character is t ics
The addition of terms to the series expansion causes ainonotonic decrease in the spectral representation error, butthe effect of the addi t iona l term;, on the overall s\sten: per-formance must be determined It can be shown that increasingthe number ol terms in the representat ion will never decrease
ORIGINAL PAGE ISOF POOR QUALITY
Expected Mean-Square Eirw
Probability of a correct classification as a fun-iion of expectedmean-square representation error
the performance provided that the stochastic process is com-pletely known If after A' terms thp improvement in per-formance is small compared to the reduction m representationciror, then the representation is sufficient This is illustratedby case A of Fig 8 in which the Threshold T indicates theminimum required K [er] However, if the performance isshowing significant improvement for i small decease in themean-square error, case B of Fig 8, mo.e terms are necessaryto complete lite representation
Since the parameters of the stochastic process must be esti-mated from j sample of the ensemble, the effect of the size ofthe sample relative to the dimensionality of the system is im-portant Hughes [10] has shown that if the sample sue is toosnidll, the classification performance may actually be degradedby adding terms to the expansion Thus it is necessary tomimtain a large set of sample functions from winch to esti-mate the statistics
The choice of information classes also influences the per-formance of the pattern recognition system For purposes ofclassifying the data i - to distinct classes it is required that theclass list have the following properties simultaneously [ I I ]
1) Each class must be of interest to the user, i e , of in-formational value
2) The classes must be separable in terms of the featuresavailable
3) The list must be exhaustive, i e , there must be a class towhich it is logical to assign each pixel in the sceneThe classes may be arranged in a luerarchial tree structure inwhich case classes deeper in the tree require different repre-sentation accuracies to achieve a given level of classificationperformance
The area of the ground resolution element is determined bysuch system characteristics as the instantaneous field-or-vicw(IFOV), the al t i tude of the sensor, the scan rate, and the ve-locity of the sensor These are examples of spatial representa-tion parameters The size of ihe objects which can be identi-fied and the energy available are influenced by the choice ofground resolution clement niie. If a typical object wluch onewishes to identify is smaller than the ground resolution ele-ment si/e, »hen it is veiy difficult to classify that objectMobassen [12] has investigated the effect of the area of the
; •*-* • v*'&'"•'
» £•184 lEtfc TRANSACTIONS ON Gf.OSCIENCE AND REMOTE SENSING, VOL GE-I8, NO 2. APRIL !983
resolution element on classification performance Increasingthe area often improves the signal-to-noise ratio which in turncan improve the classification performance
For a given remote sensing problem the signal is the part ofthe received response -vhich is information bearing, and thenoise is that part which is nonmformation beating The in-fluence of the s'gnal-to-noisc ratio where the noise is white,Gaussian and additive was demonstrated by Ready et al [14]Results show that overall classification performance decreasedwith an increase in the noise level A class which was difficultto identify under low noise level conditions suffered the mostdegradation when noise was added
IV E X P H R I M F N T A L SYS^M
An experimental software system has been set up to imple-ment the analytical procedure that has been developed Thesoftware system has been implemented on an IBM 370 com-puter at the Laboratory for Applications of Remote Sensing(LARS) at Purdue University, Lafayette, IN
A collection of field data consisting of spectral responsefunctions on three dates from Williams County. ND, and threedates from Finney County, KS, was available from the fieldmeasurements library at Purdue/LARS More than one thou-sand spectra were available from each location and collectiondate The response functions were sampled in wavelengthusing narrow windows of 0 02 pm over the range 04 <X < 2 4 Mm
The optimal set of basis functions is found numerically byestimating the covanance matrix from the sample responsefunction Maximum likelihood estimates of the mean andcovanaiKC matrices are given by
(8)
and
f\ ^ " j V ^ » j
N, *r, '(9)
where W, is ihe number of sample functions available and X, isthe ith sample vector The covanance is the kernel in thelinear integral cquition whose solutions are the optimal basis(unct ions or eigenvectors A remarkably stable and accuratemethod lor numerically computing the eigenvalues and eigen-vectors was published by Grad and LUebner |6]
The eigenvectors arc used to perform the linear transformation
y , * i T ( X ~ \ ) (10)
on the data set The class conditional statistics are computedusing the transformed data
In order to compare the performances of two systems analgon'hm which esiimates the probability of correct classifica-tion for an M class problem, given the class conditional multi-vanate Gaussian statistics, was used (16) This algorithm,which is based on the stratified posterior estimator [15], wasfound to be accurate within one-half of 1 percent
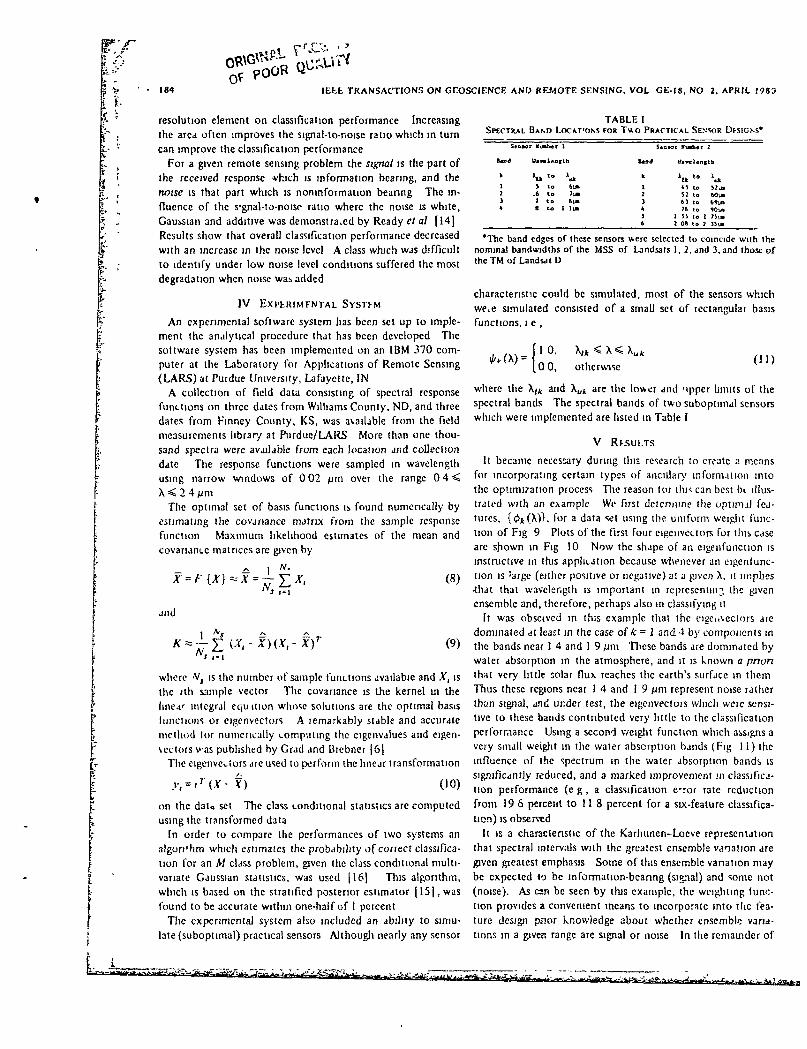
The experimental system also included an ability to simu-late (suboptimal) practical sensors Although nearly any sensor
TABLE ISPECTRAL BAND LOCAT'ONS FOR Two PRACTICAL SENSOR Dtsicss*
S«BI
too
t
1
2)4
Mr ttivb«r 1
lUolenttb S.
*li to *olJ to tl»
.6 to Timt to 6,.8 to 1 li»
ScoMt Huad
IQd L'«ve
! X
45
526176
1 55} 06
btr 2
eflSth
to X
0 }?J»
o b9uio 10u»o 1 75iBo I J5i«
'The band edges of these sensors were selected to coincide with thenominal bandwidths of the MSS of Landsals I, 2. and 3, and those ofthe TM of Landsal D
characteristic could be simulated, most of the sensors whichwe.e simulated consisted of a small set of rectangular basisfunctions, i e ,
10 . X , » < X < X U ) !
0 0, otherwise (11)
where the X/fc and XuA are the lower and 'ipper limits of thespectral bands The spectral bands of two suboptimal sensorswhich were implemented are listed in Table I
V RKSULTS
It became necessary during this research to create a meansfor incorporating certain types of ancillary information intothe optimization process The reason (or this can best bi illus-trated with an example We firsi determine the optimal fea-tures, (cijt(X)}, for a data set using the uniform weight func-tion of Fig 9 Plots of the first four eigenvectors for this caseare shown in Fig 10 Now the shape of an eigenfunction isinstructive in this application because whenever an eigenfunc-tion is 'arge (either positive or negative) a! a give/) X, i! implies•that that wavelength is important in representing the givenensemble and, therefore, perhaps also in classifying it
It was obseived in this example that the eigenvectors aredominated at least in the case of k = ] and 4 by components ;nthe bands near 1 4 and 1 9 urn These bands are dominated bywater absorption in the atmosphere, and it is known a priorithat very little solar flux reaches the earth's surface in themThus these regions near J 4 and I 9 /jm represent noise ratherthan signal, and under test, the eigenvectors which were sensi-tive to these bands contributed very lit t le to the classificationperformance Using a second weight function which assigns avery small weight m the water absorption bands (Fig 11) theinfluence of the spectrum in the water absorption bands issignificantly reduced, and a marked improvement in classifica-tion performance (e g, a classification error rate reductionfrom 19 6 percent to 11 8 percent for a six-feature classifica-tion) is observed
It is a characteristic of the Karhunen-Loeve representationthat spectra) intervals with the greatest ensemble vacation aregiven greatest emphasis Some of this ensemble variation maybe expected to be information-bearing (signal) and some not(noise). As can be seen by this example, the weighting func-tion provides a convenient means to incorporate into the fea-ture design pnor knowledge about whether ensemble varia-tions in a given range are signal or noise In the remainder of

•*',
W1ERSMA AND LANDGREBE DESIGN OF MULT1SPECTRAL SENSORS
ORIGINAL P»A(S8 ftOF POOR QUALITV IBS
~T4 1AtongttiUiml
Fig. 9 Weight function number 1
iDcenvoctttf 1
X
14 2.4Clg«n«ectar4
Fig 10 First four optimum basis functions using weight functionnumber 1 over Williams County, May 8, 1977,data
14 IAVfenknethUmi
Fig 11 Weight function number 2
the results presented, the weighting function of Fig 11 wasused Two other weighting functions have been tested [16],the choice of which is the best weighting function is thoughtto depend on a number of factors not all of which are wellunderstood
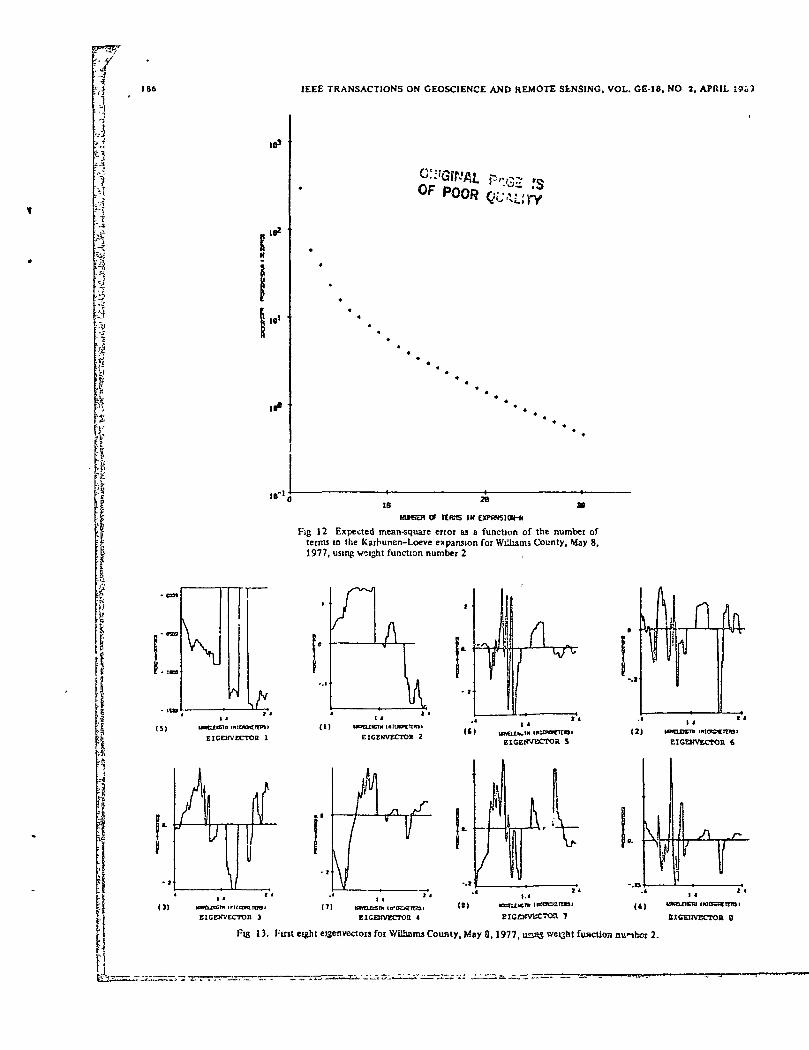
Results for the design of the optimal sensor for one of thesix sets of data are presented in Figs 12-14.' The data fromthe stratum was collected over Williams County, ND, on May8, 1977 The three classes represented in this d»ta set werespring wheat, summer fallow, and pasture Since the data weretaken relatively eaily in the growing season, the wheat canopywas still quite sparse which leads one to expect the wheat classto resemble spectrally bare soil or fallow In Fig 12 the ex-pected mean square error is plotted as .-. function of the num-
'Th< reiults for the other five data sets, which were from differenttime* of the yeir at the North Dakota site and a Kansas site, are con-tained m 116)
her of terms in the expansion Rapid convergence in the firstfew terms is demonstrated in thus graph
The first eight weighted eigenvectors are plotted in Fig 13Note that the magnitude of the first eigenvector has the gen-eral shape of a typical spectral response of soil, since the pre-dominant response in two of the three classes is soil, this firsteigenfunction may be thought of as the average response overthe ensemble The second eigenvector tends to divide up thespectrum into three to four relatively broad regions As thenumber of terms in ihe expansion is increased, the terms thatarc added require higher spectral resolution to reduce mean-square error, indicating that spectral fine structure may be in-creasingly important. We will comment further on tlus later.
In Fig 14 the estimated probability of correct classificationis graphed as a function of the expected mean-square error Jtis seen that at least the first eight basis functions contributesignificantly to the classification accuracy The numbers inparentheses on Fig 13 indicate the order in which the featureswere chosen by a feature selection processor2 The relativelybroad bands of 02M
are indicated as of greatest importanceto class discrimination but aoparently rather quickly there-after the finer spectral structure represented by 06(X) be-comes important
To complete the design illustration, the procedure was usedto determine a set of physically realizable rectangular spectralbands Six to ten bands were required based on a study of thedimensionality An initial ^el of band edges was chosen basedon an examination of the eigenvectors of the May 8 data setFrom (la) it is observed that regions of the spectrum that aresignificantly different from zero for a particular eigenvectormay contain important information This, together with thefeature ordering determined by a standard feature selectionalgorithm, indicates spectral mteivals important for discrimi-nation Zero crossings of the eigenvectors may be possible in-dicat. jns of band edges
Based upon such a study of the optima* • unctions a se! ofrectangular spectral bands was chosen. The final set of bandedges foi the example design is presented in Table II InFig !5, comparison of the two simulated senbors of Table Iand the optimum set is made on the basis of classification per-formance for the May 8 data The first ten optimal basis func-tions were used from the optimal design, where 10 featuresprovide a small mean-square error yet keep the computationaldifficulties involved with high dimensional systems to a rea-sonable le\el As shown in Fig 15, the four-band sensor 1compares rather poorly with the best four3 optimal basis func-tions, showing sensor 1 to be far from optimal for this set ofclasses Sensor 2 is an improvement over sensor 1, but stillsomewhaJ lower in performance than desirable The eight-band example design, however, demonstrates very good per-formance relative to the performance of the ten featureoptimal set. Also, the expected mean-square error is signifi-cantly reduced over that of sensors I and 2 It should be
JThe feature selection scheme is bawd upon maximizing the averageintenbss-pair divergence The details are in 1161
3The term "be*1" refers here to those chosen by a feature selectiont for discriminating botwccn the design set classes
Uiuad*
EFTS*
1
186
(5)
IEEE TRANSACTIONS ON GEOSCIENCE AND REMOTE SENSING. VOL. GE-18. NO 7. APRIL
10s
18*
ID!IB'
IB*
IB
OF TIKIS 1H tXPR»SIOH-M
Fig 1 2 Expected mean-square error as a function of the number ofterms in the Karrmnen-Loeve expansion for WiUiams County, Way 8,1977, using weight function number 2
rntowcrrmiEICEHVECTOR 1
( l)EICEHVECTCX 2 UWO1IK.IH IRtO
EICEKVECTOR 5
£T» iriuEIGEKVECTOH 3
sm tit*aElCEttVXCTOit 4 EIGEWVECTOa 7 IICZ1WECTOR S
Fig 13. First eight eigenvectors for Wilbamj County, May 8.1977, unas weght fvmctioji aunbor 2.

'*-
WIERSMA AND LANDGREBE DESIGN OF MULTISPECTRAL SENSORS
I.
.8
.0
.7
.8
.5
187
ORIGINAL :-Y\Cc ?"OF POOR QUAUrY
IB8 IB* IB*
ICRN-SOURR£ tFBWR
IB3
Fig 14 Estimate of probability of correct classification versus ex-pected mean-squaie error Williams County, May 8, 1977, using weightfunction number 2
IjO
s?S-ۥ
£
I
^
s?e
I!Fig 15 Comparison of sensor performance Wilbams County, May 8,
1977
TABLE IISPECTRAL BAND LOCATIONS FOR THE EXAMPLE DESIGN
w
s*t*
JB
.
a' —
i
^
1
%no!̂
M
1
jss
g
g
1
_ =
1I
|
1=
147
B
1
s^p
i•|
S^
Fig 16 Comparison of sensor performance Average of six cases
pointed out that these comparisons of classification per-formance are based on a particular set of information classesand the results may be different if different classes werechosen The reduced representation error may imply in-creased robustness in performance for differing informationclasses
The performance was evaluated for the six data sets and theaverage performance for each of the sensors is shown in Fig16 Again the experimental sensor is quite close in perfor-mance to the optimal, a difference of about one percent.

188 IEEE TRANSACTIONS ON GEOSC1ENCE AND REMOTE SENSING, VOL. GE-18, NO. 2. APRIL 1980
.1
ORIGINAL ??":: :sPE POOR QUALIFY
.92.4
Pig 17 Correlation coefficients versu« wavelength for Williams County, May 8,1977
Although the primary purpose of this work was to develop adesign procedure for sensors, important contributions to theunderstanding of the scene can be gamed Properties such assignal dimensionality for a given stratum, maximum possiblecla^s separability, the spectral resolution required, and theaccuracy of spectral representation required to obtain a givenlevel of performance can be studied
The dimensionality of the ensemble can be defined as thenumber of terms in the expansion necessary to represent theoriginal wavefoim to the desired accuracy For the informa-tion classes used on the six data sets the dimensionality wasbetween six and eight Some of the strata required fewerterms in (he expansion to obtain a good representation andgood performance while others required more terms
A review of the eigenvectors of Fig 13 shows an unexpectedamount fine structure, particularly in the region from 0 66to 1 26 pm as previously noted Up to this time it had oftenbeen observed that spectral bands very near to one anothertend to be highly correlated and thus redundant To investi-gate this structure a bit fur ther the correlation coefficient be-tween each band of width 002 pm and its nearest neighborwas calculated The results are shown in Fig 17 Based uponpreviously knoAti results one might expect the graph of thefigure to deviate l i t t le from uni ty The fact that it does de-viate significantly from umly Changing significantly in verynarrow bands may be fur ther evidence that there is useful in-formation in the spectral fine structure
VI CONCLUSION
The design of the spectra! bands for multispectral instru-ments has been an important matter for a number of years Inthe past such design has of necessity been carried out as aspectral band selection problem using in a subject"e mannerthe direct application of experience and judgment Nonovtr-lapping bands were selected one-by-one based upon the cur-rent understanding of reflec'ance phenomena Each band wasgenerally selected on its ow(i individual meters because evalu-ating sets of bands is difficult to do without computationalaids A typical example of this process was the design of theThematic Mapper bands [7] Although this procedure hasserved adequately to thr time, as !he level of sophistication ofapplications and, therefort, of dat? needs continues to grow, itseems clear that more quantitative and objective design toolsare needed It was this need to which (he work reportedherein was directed
A: has been seen the design technique which resultedutilizes an empirical stochastic scene model as the best cur-rently feasible means for defining quantitatively the scene andits information and noiiC content Since not all sensor systemlimitations can be analytically specified, the technique uliluesan optimal design calculation but it still requires engineeringjudgment as the best means for resolving the tradeoff of moretangible factors with those which are less tangible it is by nomeans intended as an "automatic" design procedure

WIERSMA AND LANDGREBE DESIGN OF MULTISPECTRAL SENSORS 189
The optimal design calculation was established utilizing anoverall performance measure, probability of correct classifica-tion, and an intermediate one, spectral representation erroraveraged over the ensemble. One can argue that it is overallsystem performance which is, after all, the most important.However, a specific performance measure calculation can onlybe earned out with regard to a specific set of classes Differentapplications frequently require the same data set to be classi-fied into different class sets; thus ore desires robustness withregard to various class sets as well m a feature set. The hy-pothesis used here is that a concern for representation ac-curacy will tend to insure thio robustness, thus the bilateralapproach to performar.ee index
The demonstration presented here of the design techniqueappea.s to warrant the conclusion that the calculation pro-cedure provides a substantial aid to the overall design processWith relatively limited effort a feature set with good overallperformance was obtained On the other hand, the band setgiven in Table II should by no means be regarded as worthy ofconsideration for implementation as is The ensemble defini-tion and sampling were not an important point in this workand would require much more detaJed and careful con-sideration than they received here The same is true of theband set and its comparison to alternative choices
And finally, we again draw attention to the use of the toolsof this design procedure for carrying out more basic researchinto understanding the scene itself and its spectral cnaractens-tics By being able to determine and quantitatively assess theinformation-bearing attributes of scene spectral characteristics,the ability to study potentially important characteristics ofthe scene is greatly facilitated
REFERENCES
(1) R B Ash, li formation 7 hcory New York Wiley, 1967|2] W B Davenport and W I Root, An Introduction to the Theory
of Random Signals and None New York McGraw-Hill, 1958(3) R B Crane, W A Mahla, and W Richardson, "Suitability of the
normal density assumption for processing multispcclr^.i scannerdata," IEEE Trans Ceosci Electron , vol CE-10, pp 158-165,1972R. O Duda and P E Hart, Pattern Classification and SceneAnalysis New York Wtiey, 1973
(5) K Fukunaga, Introduction to Statistical Pattern RecognitionNew York Academic, 1972
[6] J Grad and M A Brebner, "Eigenvalues and eigenvectors of areal genera! matrix, Algorithm 343," <ssociation for ComputingMachirery, Comm , vol 1 1, no 12, pp 820-826, 1968J L Manage ar,.' D A. Landgi^be, "Landsat-D Thematic MapperTechnical Working Group- Final Report," NASA/Johnson SpaceCenter report no JSC-90797. Houston, Texas, 1 975R A Holmes and R 1} MacDonald, "The physical basis of sys-tem design for remote sensing in agriculture," Proc lEEt, vol57, pp 629-639, 1969R M Hoffcr, "Biological and physical considerations in applyingcompater-aided analysis techniques to remote sensor data." inRemote Sensing The Quantitative Approach. P H Swain andS M Davis, eels New York McGraw-Hill, 1978G F Hughes, "On the mean accuracy of statistical pattern recog-nizers," IEEE Trans Inform. Theory, vol IT-14, pp 55-63,1968D A Landgrebs, "Useful inforn ation from multispectral imagedata another look," in Remote Sensing The Quantitative Ap-proach, P H Swam and S M Davis, eds New York McGraw-Hill, 1978B G Mobassen, C D McGillem, and P E. Anuta, "A parametricmulticUss Bajes error estimator for Ihe mulUspectral scannerspatial model performance evaluation," Ph D dissertation, LARSTechnical Rep 061578, Lab for Applications of Kejrote Sensing,Purdue Umv , West Lafayette, IN, 1978A Papouhs, Probability, Random Variables end S'ochauic Pro-cesses New York McGraw-Hill, 1%5
[14) P J Ready, P A Wintz, S J Whitsitt, and D A. Landgrcbe,"Effects of compression and random noise on multisp^itraldata," m Proc of the 7th Int Symp on Remote Sensing of theEnvironment, Ann Arbor, MI, 1971S J Whitsm and D A Landgrebe, "Frror estimation and sepa-rability measures in feature selection for multiclass pattern recog-nition," Ph D dissertation, LARS Inform Note 082377, LARS,Puidue, West Lafayette, IN, 1977D J Wiersma and D A Landi-rebe, "Pie analytical design ofspectral measurements for multispectral remote sensor systems, 'PhD dissertation, LARS Tech. Rep #122678, Purdue Uni-\ersity, West Laf.iyctte, IN, 1979H L VanTrees, Detection, Estimation, and Modulation Theory-Parti New York Wiley, 1968
[4 1
[7]
[8]
(9)
[101
[11]
(12)
[13]
[15]
[16]
[17|
'Ctf'AL P/"C'T r**OF POOR QUALITY

D
a
[ JD
cr.r::
c^