Advisory Board Presentation - AIMaim.nd.edu/assets/225946/aim_xliii_final_presentation.pdf ·...
121
Advisory Board Presentation AIM XLIII | December 5, 2016
Transcript of Advisory Board Presentation - AIMaim.nd.edu/assets/225946/aim_xliii_final_presentation.pdf ·...

Advisory Board Presentation
AIM XLIII | December 5, 2016
AIM XLIII t
Analyst Introductions
David Arney Cleveland, OH MarketAxess, Applied Materials James Burke Long Island, NY United Health Group, Constellation Brands Conor Colpoys Erie, PA Herman Miller, CoreCivic J.J. del Rosario St. Louis, MO Microsoft, LendingClub Savanna Dinkel Flower Mound, TX Envision Healthcare, Digital Realty Grant Ebenger Fort Lauderdale, FL O’Reilly Automotive, Infinera Ben Fouch Brownsburg, IN Wabtec, Activision-Blizzard
Peter Fox Grosse Pointe Farms, MI Kinder Morgan, Intel Jimmy Ganas Palatine, IL Check Point Software, Endo Bryan Hall Pittsburgh, PA Hain Celestial, Tempur Sealy Neil Jones Cincinnati, OH Sherwin-Williams, Kraft Heinz Conor Kinasz Des Plaines, IL Alphabet, Costco Anthony LaGuardia Seattle, WA Union Pacific, Alaska Air Group Joseph Lanzel Foxboro, MA Exxon Mobil, Under Armour
Christopher Leitten Birmingham, AL Gilead Sciences, Verisk Analytics Brooke LI Wuxi, China Equifax, Mosaic Colin Lillibridge Geneva, IL Knoll, Align Techology Jimmy Mangan Winnetka, IL McDonald’s, Buffalo Wild Wings Jack Markwalter Atlanta, GA Newmont Mining, Nvidia Nathaniel Marti Mount Vernon, IA Total System Services, Rockwell-Collins Cameron Perna Rochester, NY Jazz Pharmaceuticals, Dunkin’ Brands
Jesse Plante Floral Park, NY American Tower Corporation, Nike Ben Rosso Raleigh, NC Facebook, First Solar Ryan Seymour Winnetka, IL Whitestone REIT, HCA Holdings Theo Sholly Knoxville, TN Covanta, Verisign Taryn Stamper Spokane, WA Hannon Armstrong, Hanesbrands Jamie Sullivan Tampa, FL Sprouts Farmers Market, Priceline Group
2

Agenda Course Overview Economic Outlook Security Analysis Portfolio Performance AIM XLIII Review Concluding Remarks

Course Overview Fundamentals Analyst Responsibilities Investment Philosophy and Policies
Course Overview t
Fundamentals
Methodology
Analyst Selection Course Objectives
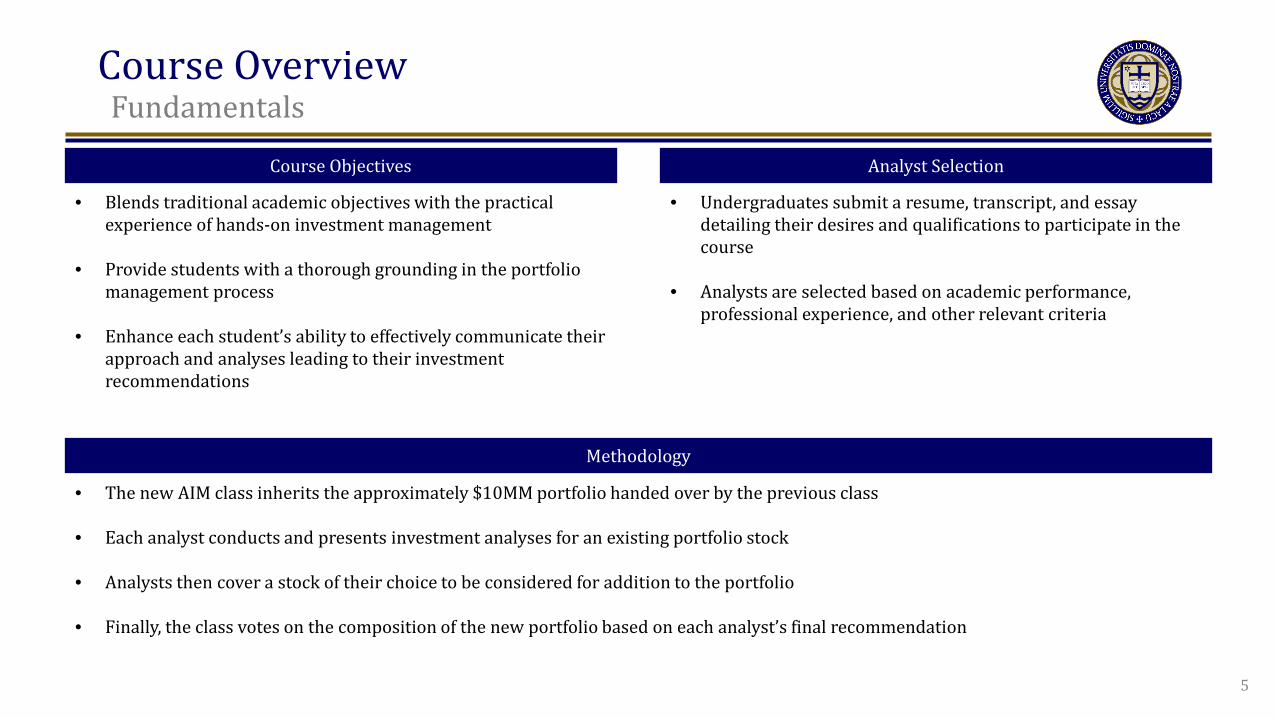
• Blends traditional academic objectives with the practical experience of hands-on investment management
• Provide students with a thorough grounding in the portfolio management process
• Enhance each student’s ability to effectively communicate their approach and analyses leading to their investment recommendations
• Undergraduates submit a resume, transcript, and essay detailing their desires and qualifications to participate in the course
• Analysts are selected based on academic performance, professional experience, and other relevant criteria
• The new AIM class inherits the approximately $10MM portfolio handed over by the previous class
• Each analyst conducts and presents investment analyses for an existing portfolio stock
• Analysts then cover a stock of their choice to be considered for addition to the portfolio
• Finally, the class votes on the composition of the new portfolio based on each analyst’s final recommendation
5
Course Overview t
Analyst Responsibilities
Analyst Reports Individual Responsibilities
Portfolio Management Group Projects
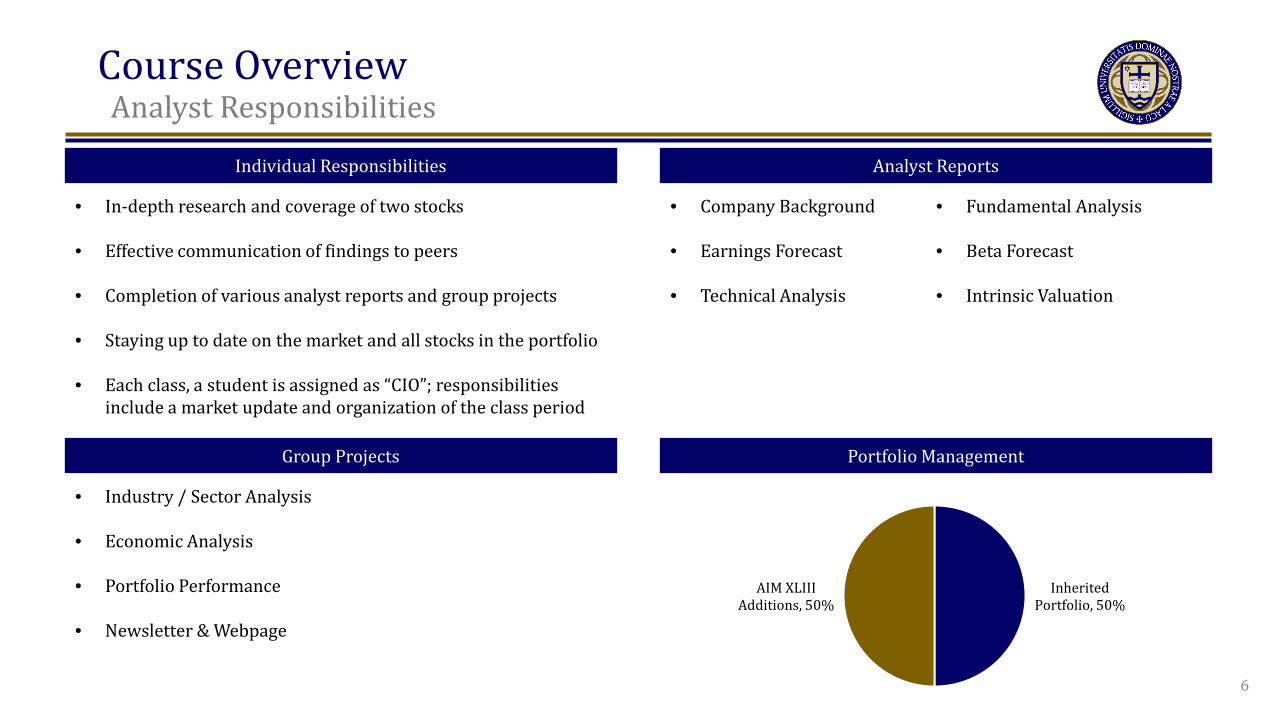
• Company Background
• Earnings Forecast
• Technical Analysis
• Fundamental Analysis
• Beta Forecast
• Intrinsic Valuation
• Industry / Sector Analysis
• Economic Analysis
• Portfolio Performance
• Newsletter & Webpage
• In-depth research and coverage of two stocks
• Effective communication of findings to peers
• Completion of various analyst reports and group projects • Staying up to date on the market and all stocks in the portfolio
• Each class, a student is assigned as “CIO”; responsibilities
include a market update and organization of the class period
Inherited Portfolio, 50%
AIM XLIII Additions, 50%
6
Course Overview t
Investment Philosophy and Policies
Investment Constraints Investment Philosophy
AIM XLIII Portfolio Composition Investment Guidelines
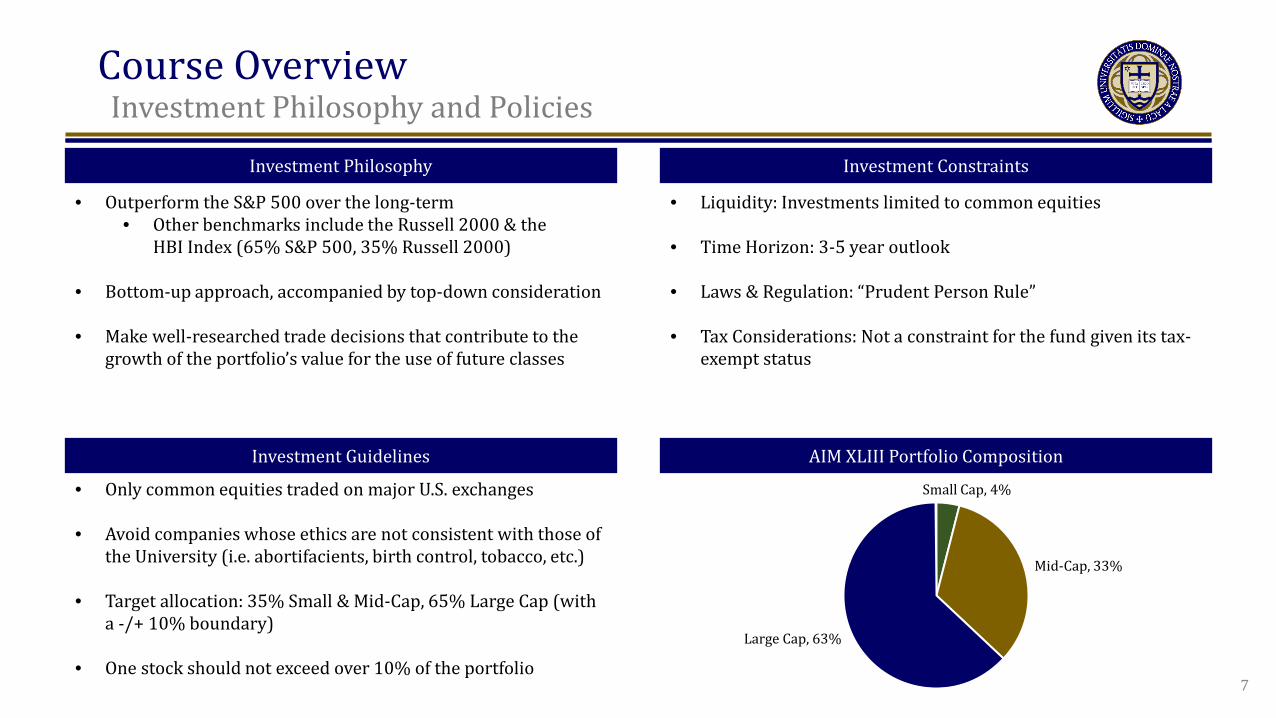
• Liquidity: Investments limited to common equities
• Time Horizon: 3-5 year outlook
• Laws & Regulation: “Prudent Person Rule”
• Tax Considerations: Not a constraint for the fund given its tax-exempt status
• Outperform the S&P 500 over the long-term • Other benchmarks include the Russell 2000 & the
HBI Index (65% S&P 500, 35% Russell 2000)
• Bottom-up approach, accompanied by top-down consideration • Make well-researched trade decisions that contribute to the
growth of the portfolio’s value for the use of future classes
• Only common equities traded on major U.S. exchanges
• Avoid companies whose ethics are not consistent with those of the University (i.e. abortifacients, birth control, tobacco, etc.)
• Target allocation: 35% Small & Mid-Cap, 65% Large Cap (with
a -/+ 10% boundary)
• One stock should not exceed over 10% of the portfolio
Small Cap, 4%
Mid-Cap, 33%
Large Cap, 63%
7

Economic Outlook Overview Sovereign Yields Central Bank Policy Labor Market Household Data and Consumption Foreign Exchange Current Events Impact on Portfolio
Economic Outlook t
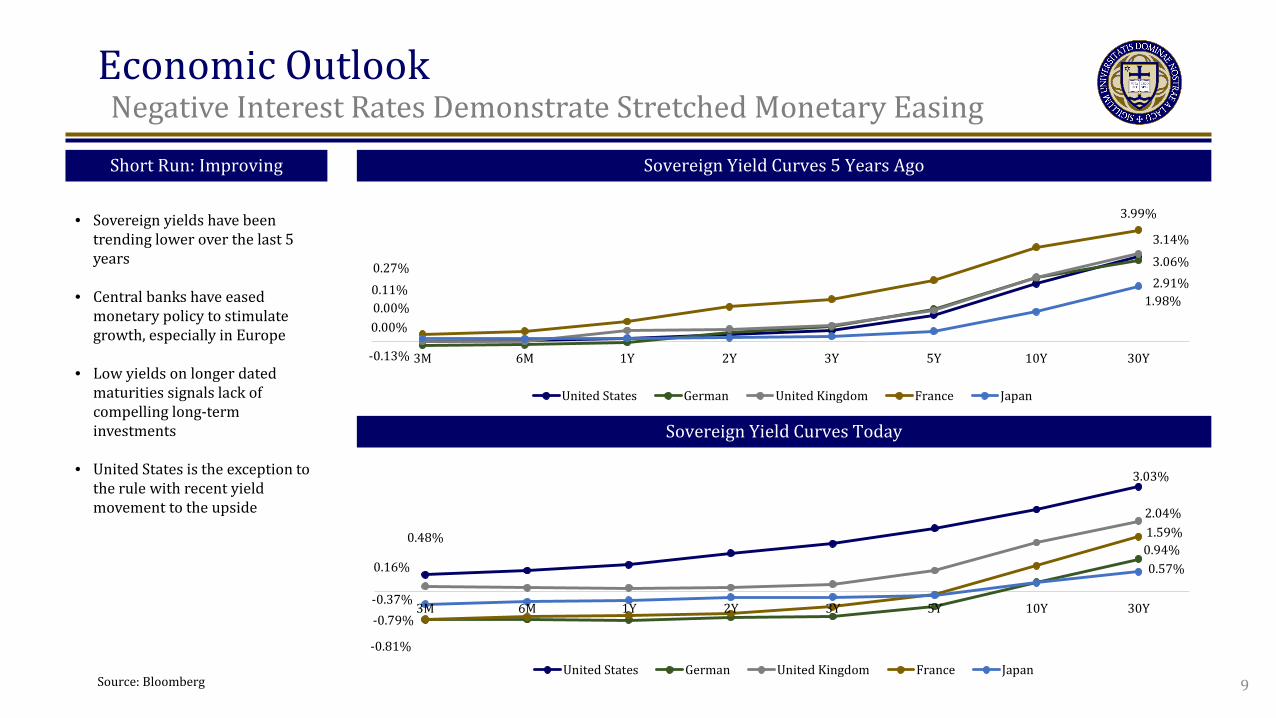
Negative Interest Rates Demonstrate Stretched Monetary Easing
Sovereign Yield Curves 5 Years Ago
Sovereign Yield Curves Today
0.48%
3.03%
-0.81%
0.94% 0.16%
2.04%
-0.79%
1.59%
-0.37%
0.57%
3M 6M 1Y 2Y 3Y 5Y 10Y 30Y
United States German United Kingdom France Japan
0.00%
3.06%
-0.13%
2.91%
0.00%
3.14%
0.27%
3.99%
0.11% 1.98%
3M 6M 1Y 2Y 3Y 5Y 10Y 30Y
United States German United Kingdom France Japan
Short Run: Improving
• Sovereign yields have been trending lower over the last 5 years
• Central banks have eased monetary policy to stimulate growth, especially in Europe
• Low yields on longer dated maturities signals lack of compelling long-term investments
• United States is the exception to the rule with recent yield movement to the upside
9 Source: Bloomberg

Economic Outlook t
Central Bank Balance Sheet Expansion
Central Bank Assets to GDP Commentary
• Central Banks have used their balance sheets to fuel asset purchases
• Goal has been to lower interest rates on longer dated maturities and provided liquidity
• Limits of QE have likely been reached as Central Bank balance sheets have grown
• Indicative of less monetary tools available in the future
5.6% 5.3% 5.4% 8.7% 12.4% 14.7% 15.9% 18.9%
23.0% 17.9%
14.9% 13.7% 14.7%
15.8% 18.4%
22.5%
31.2%
45.0%
0.0%
10.0%
20.0%
30.0%
40.0%
50.0%
60.0%
70.0%
80.0%
2006 2007 2008 2009 2010 2011 2012 2013 2014
FED BOJ
BOJ Oct. 2012: second increase in asset buybacks to curb deflation
BOJ Oct. 2012: increase in asset buybacks as Abe promises accommodative stance
BOJ Apr. 2013: Plan to purchase 60-70 trillion Yen a year, double money base in 2 years
BOJ Oct. 2014: Asset purchases begin at 80 trillion Yen a year
FED Nov. 2008: $30bn in Treasury purchases every month “QE1”
FED Nov. 2010: purchases of $600bn in Treasury securities for one year “QE2”
FED Jun. 2013: launch of $40bn additional purchases of agency mortgages back securities “QE3”
10 Source: St. Louis Fed
Economic Outlook t
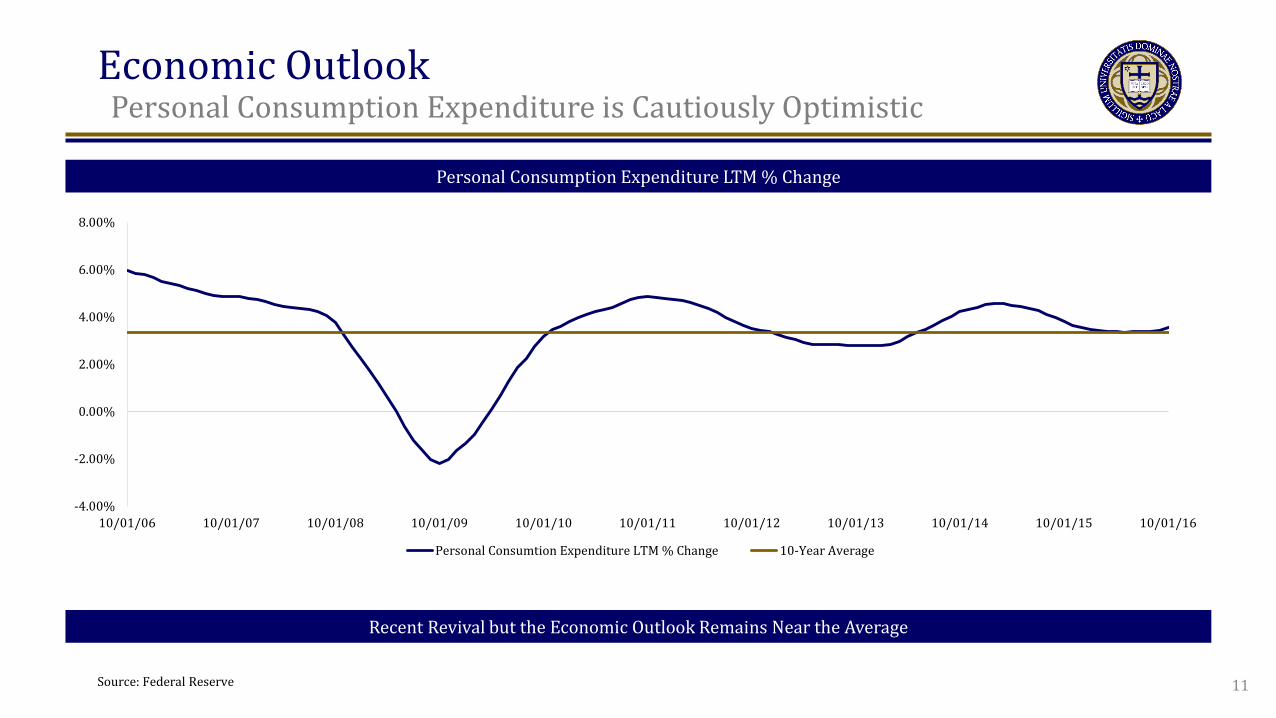
Personal Consumption Expenditure is Cautiously Optimistic
Personal Consumption Expenditure LTM % Change
-4.00%
-2.00%
0.00%
2.00%
4.00%
6.00%
8.00%
10/01/06 10/01/07 10/01/08 10/01/09 10/01/10 10/01/11 10/01/12 10/01/13 10/01/14 10/01/15 10/01/16
Personal Consumtion Expenditure LTM % Change 10-Year Average
Recent Revival but the Economic Outlook Remains Near the Average
11 Source: Federal Reserve
Economic Outlook t
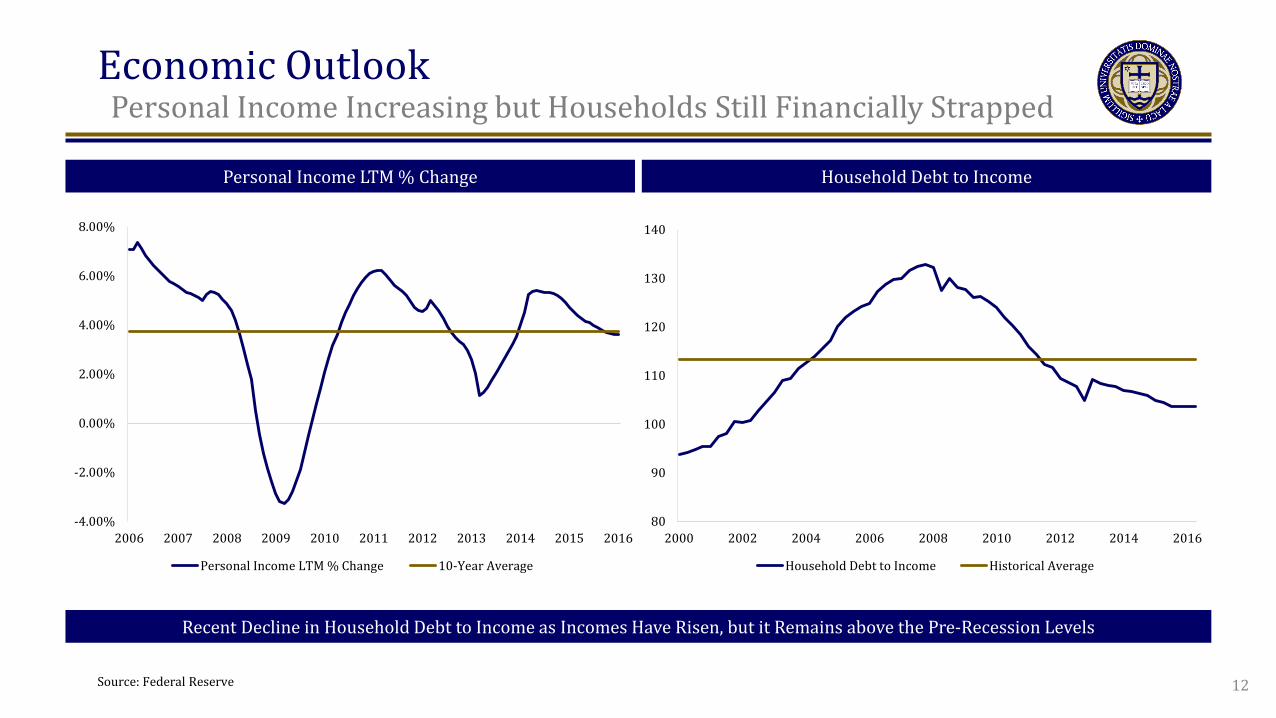
Personal Income Increasing but Households Still Financially Strapped
-4.00%
-2.00%
0.00%
2.00%
4.00%
6.00%
8.00%
2006 2007 2008 2009 2010 2011 2012 2013 2014 2015 2016
Personal Income LTM % Change 10-Year Average
Household Debt to Income Personal Income LTM % Change
80
90
100
110
120
130
140
2000 2002 2004 2006 2008 2010 2012 2014 2016
Household Debt to Income Historical Average
Recent Decline in Household Debt to Income as Incomes Have Risen, but it Remains above the Pre-Recession Levels
12 Source: Federal Reserve
Economic Outlook t
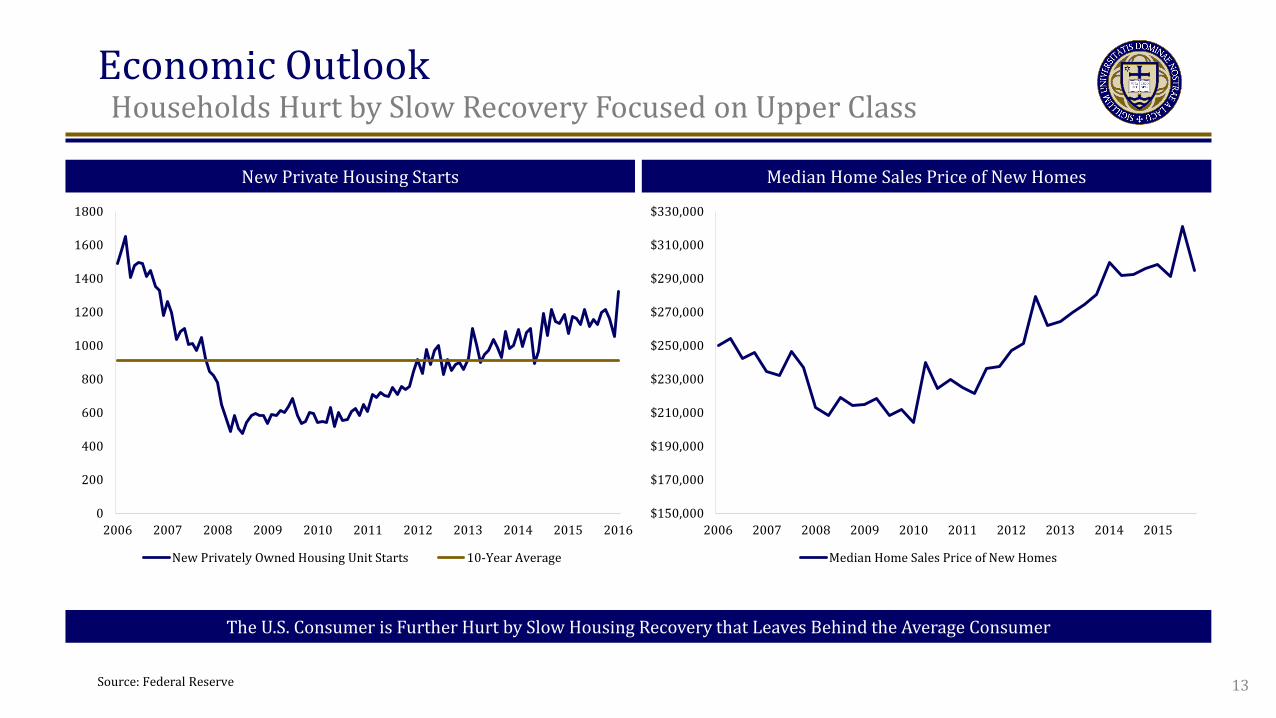
Households Hurt by Slow Recovery Focused on Upper Class
0
200
400
600
800
1000
1200
1400
1600
1800
2006 2007 2008 2009 2010 2011 2012 2013 2014 2015 2016
New Privately Owned Housing Unit Starts 10-Year Average
$150,000
$170,000
$190,000
$210,000
$230,000
$250,000
$270,000
$290,000
$310,000
$330,000
2006 2007 2008 2009 2010 2011 2012 2013 2014 2015
Median Home Sales Price of New Homes
Median Home Sales Price of New Homes New Private Housing Starts
The U.S. Consumer is Further Hurt by Slow Housing Recovery that Leaves Behind the Average Consumer
13 Source: Federal Reserve
Economic Outlook t
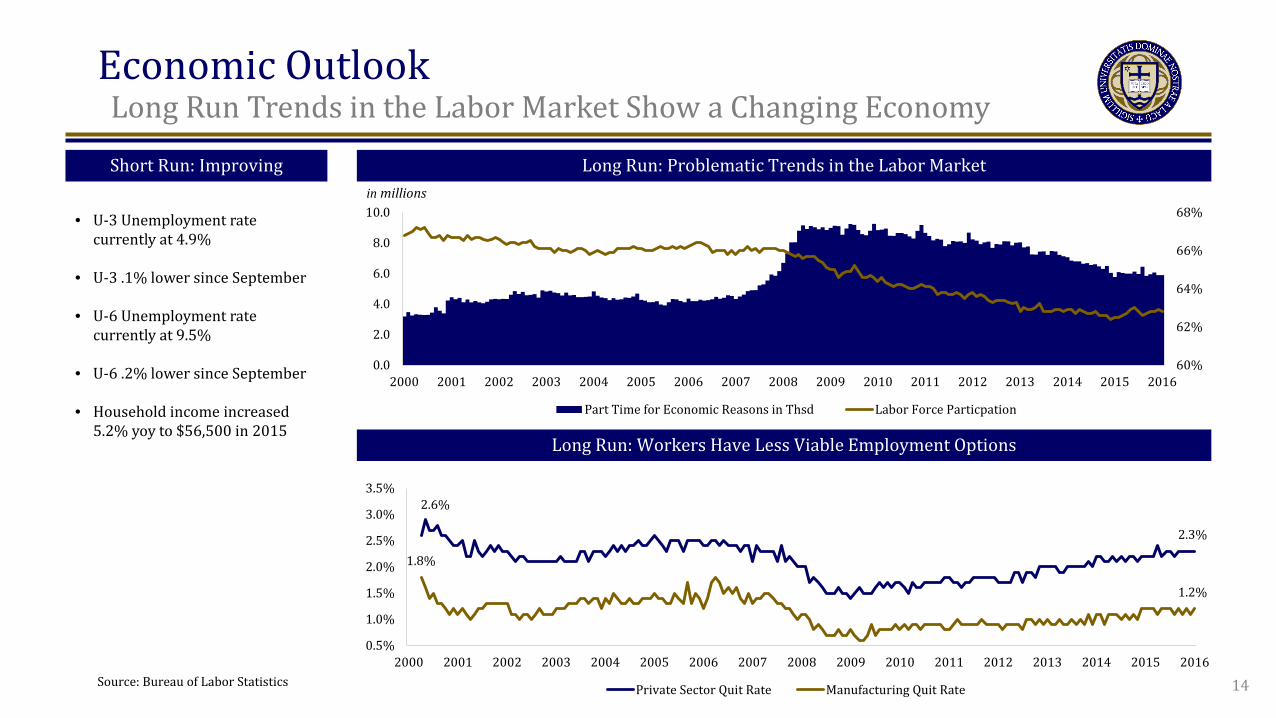
Long Run Trends in the Labor Market Show a Changing Economy
Long Run: Problematic Trends in the Labor Market
60%
62%
64%
66%
68%
0.0
2.0
4.0
6.0
8.0
10.0
2000 2001 2002 2003 2004 2005 2006 2007 2008 2009 2010 2011 2012 2013 2014 2015 2016
Part Time for Economic Reasons in Thsd Labor Force Particpation
2.6%
2.3%
1.8%
1.2%
0.5%
1.0%
1.5%
2.0%
2.5%
3.0%
3.5%
2000 2001 2002 2003 2004 2005 2006 2007 2008 2009 2010 2011 2012 2013 2014 2015 2016
Private Sector Quit Rate Manufacturing Quit Rate
Long Run: Workers Have Less Viable Employment Options
in millions
Short Run: Improving
• U-3 Unemployment rate currently at 4.9%
• U-3 .1% lower since September
• U-6 Unemployment rate currently at 9.5%
• U-6 .2% lower since September
• Household income increased 5.2% yoy to $56,500 in 2015
14 Source: Bureau of Labor Statistics
Economic Outlook t
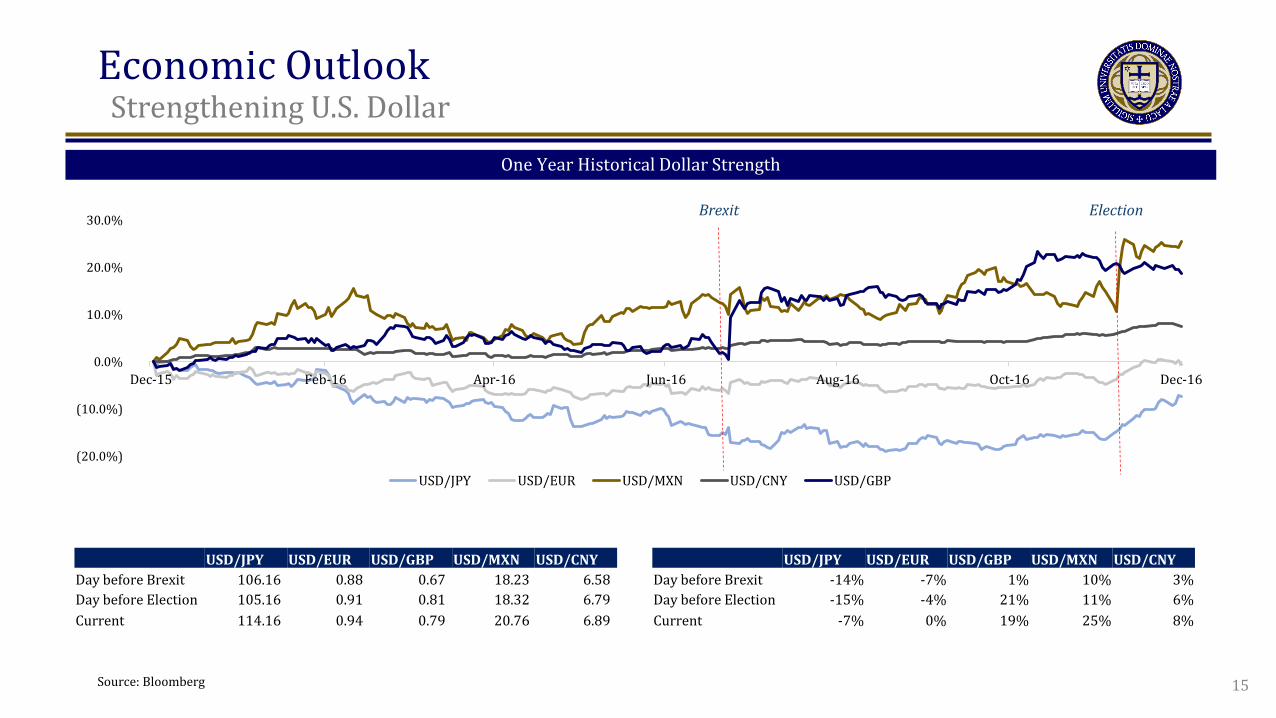
Strengthening U.S. Dollar One Year Historical Dollar Strength
(20.0%)
(10.0%)
0.0%
10.0%
20.0%
30.0%
Dec-15 Feb-16 Apr-16 Jun-16 Aug-16 Oct-16 Dec-16
USD/JPY USD/EUR USD/MXN USD/CNY USD/GBP
USD/JPY USD/EUR USD/GBP USD/MXN USD/CNY Day before Brexit -14% -7% 1% 10% 3% Day before Election -15% -4% 21% 11% 6% Current -7% 0% 19% 25% 8%
USD/JPY USD/EUR USD/GBP USD/MXN USD/CNY Day before Brexit 106.16 0.88 0.67 18.23 6.58 Day before Election 105.16 0.91 0.81 18.32 6.79 Current 114.16 0.94 0.79 20.76 6.89
Brexit Election
15 Source: Bloomberg
Economic Outlook t
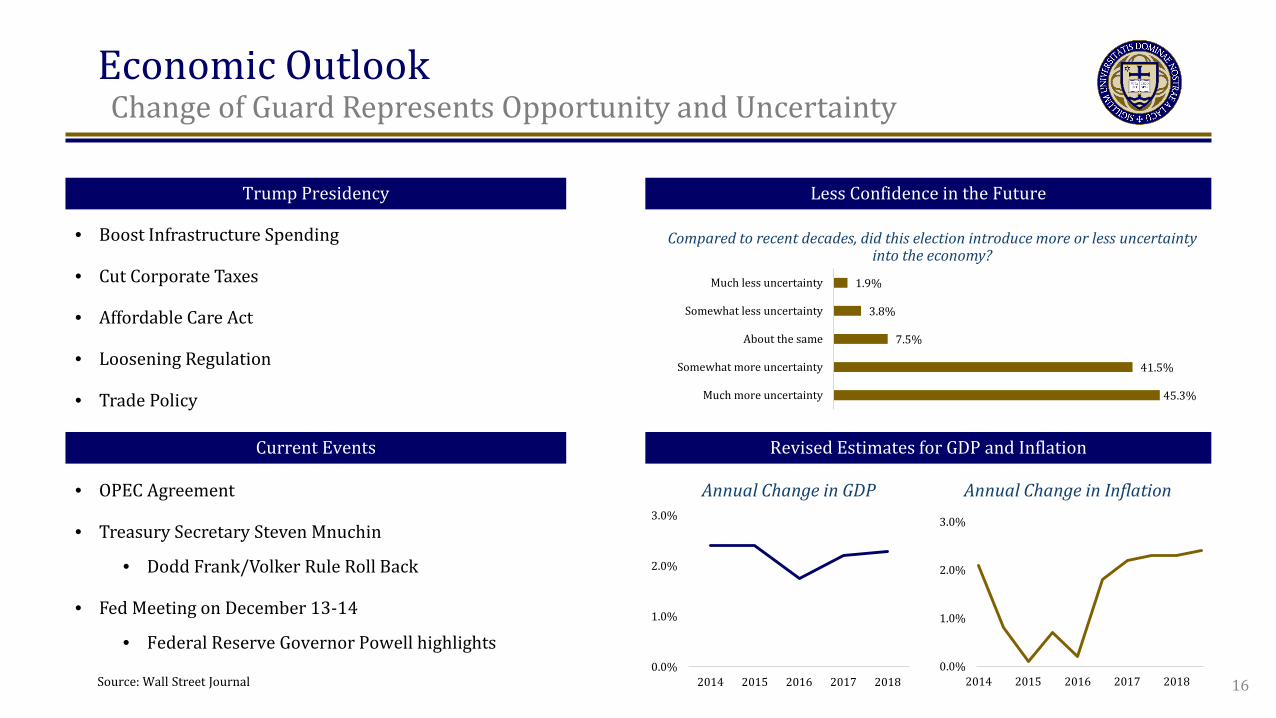
Change of Guard Represents Opportunity and Uncertainty
• Boost Infrastructure Spending
• Cut Corporate Taxes
• Affordable Care Act
• Loosening Regulation
• Trade Policy 45.3%
41.5%
7.5%
3.8%
1.9%
Much more uncertainty
Somewhat more uncertainty
About the same
Somewhat less uncertainty
Much less uncertainty
Compared to recent decades, did this election introduce more or less uncertainty into the economy?
0.0%
1.0%
2.0%
3.0%
2014 2015 2016 2017 20180.0%
1.0%
2.0%
3.0%
2014 2015 2016 2017 2018
Current Events
Annual Change in GDP Annual Change in Inflation
Trump Presidency
• OPEC Agreement
• Treasury Secretary Steven Mnuchin
• Dodd Frank/Volker Rule Roll Back
• Fed Meeting on December 13-14
• Federal Reserve Governor Powell highlights
Revised Estimates for GDP and Inflation
Less Confidence in the Future
16 Source: Wall Street Journal

Economic Outlook t
Key Themes in the U.S. Economy
Sovereign Yields
Central Bank Policy
Labor Market
Current Events
Household and Consumption
Limits of monetary policy to fuel growth
Central Bank balance sheets have expanded at a rapid pace
The workforce is changing, beginning of a “gig” economy
Market supportive rhetoric, but uncertainty as to actual policy
Growing consumer optimism, but households are financially strapped
Technology
Real Estate
Technology, Consumer Discretionary
Defense, Industrials
Consumer Discretionary
Foreign Exchange Strong dollar trend looks set to continue Industrials
17
Security Analysis Company & Industry Overview Fundamental Analysis Discovery Earnings Analysis Beta Analysis Relative Valuation Discounted Cash Flow Valuation Alternative Valuation
Security Analysis t
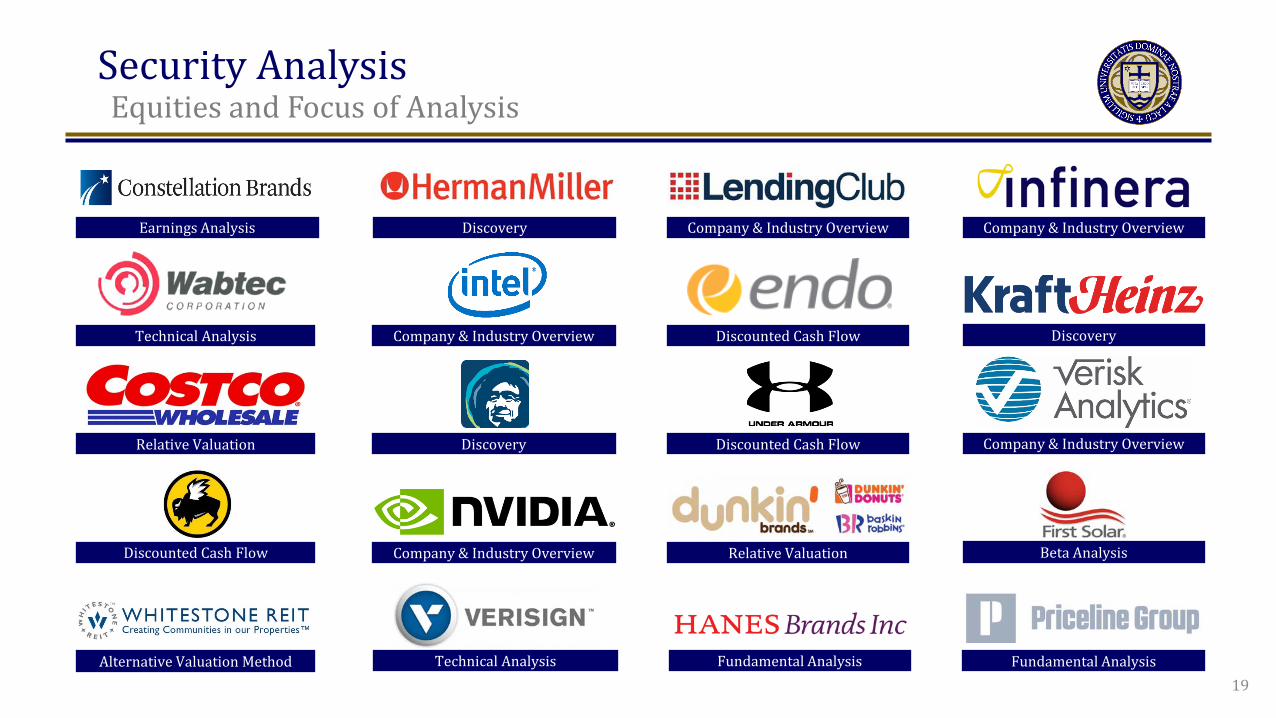
Equities and Focus of Analysis
19
Earnings Analysis
Technical Analysis
Relative Valuation
Discounted Cash Flow
Discovery Company & Industry Overview Company & Industry Overview
Company & Industry Overview Discounted Cash Flow Discovery
Discovery Discounted Cash Flow Company & Industry Overview
Company & Industry Overview Relative Valuation Beta Analysis
Technical Analysis Fundamental Analysis Alternative Valuation Method Fundamental Analysis
Constellation Brands t
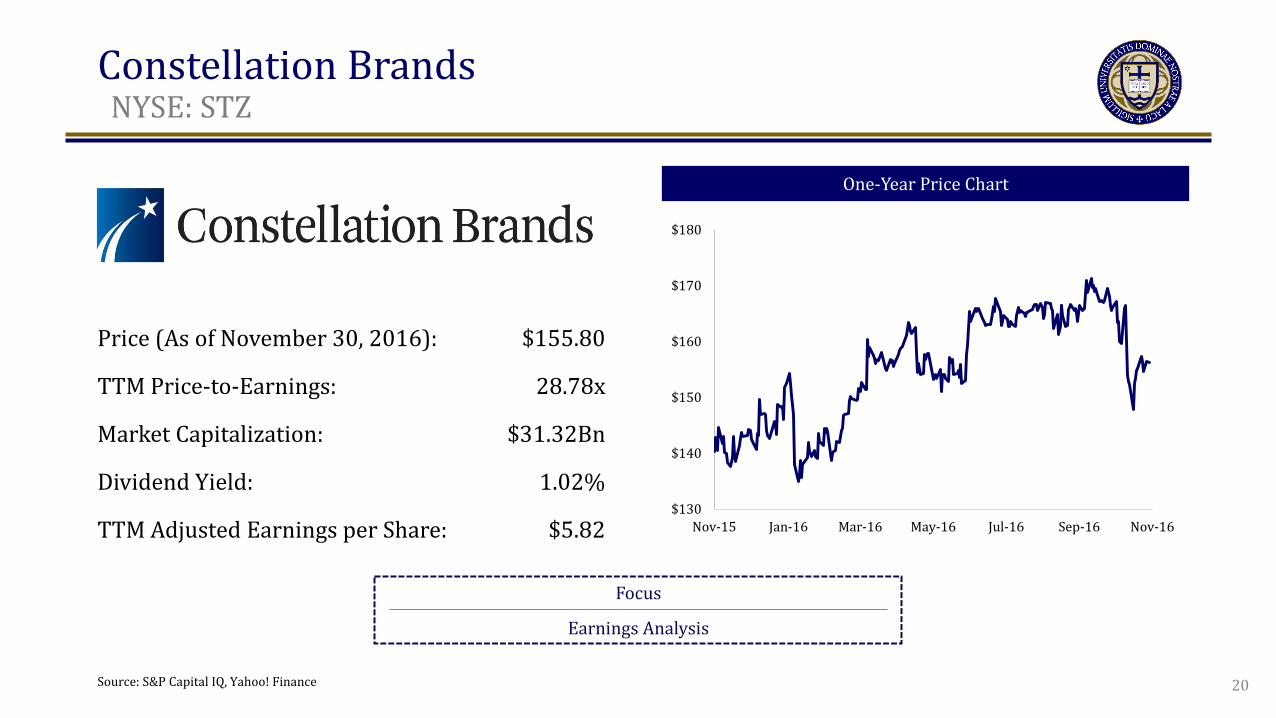
NYSE: STZ
One-Year Price Chart
Focus
Earnings Analysis
Price (As of November 30, 2016): $155.80
TTM Price-to-Earnings: 28.78x
Market Capitalization: $31.32Bn
Dividend Yield: 1.02%
TTM Adjusted Earnings per Share: $5.82
Source: S&P Capital IQ, Yahoo! Finance
$130
$140
$150
$160
$170
$180
Nov-15 Jan-16 Mar-16 May-16 Jul-16 Sep-16 Nov-16
20
Constellation Brands t
Earnings per Share (EPS) Forecast
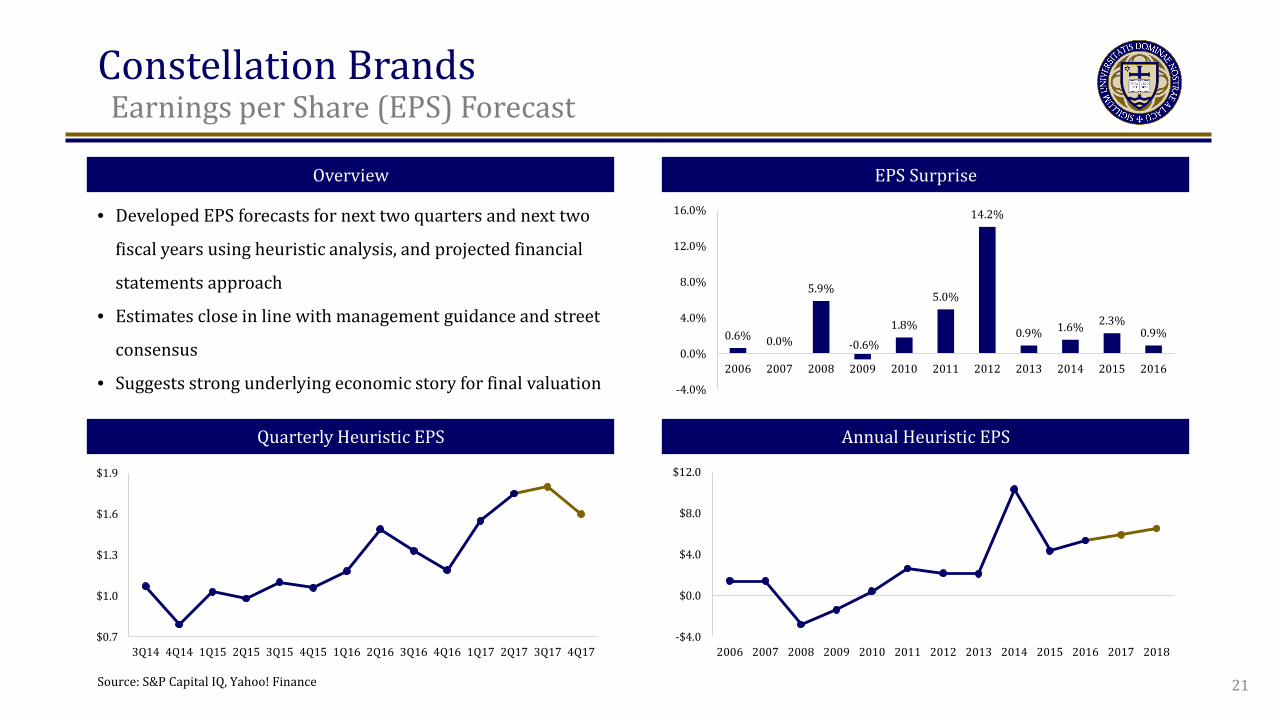
EPS Surprise Overview
Quarterly Heuristic EPS Annual Heuristic EPS
• Developed EPS forecasts for next two quarters and next two
fiscal years using heuristic analysis, and projected financial
statements approach
• Estimates close in line with management guidance and street
consensus
• Suggests strong underlying economic story for final valuation
0.6% 0.0%
5.9%
-0.6% 1.8%
5.0%
14.2%
0.9% 1.6% 2.3% 0.9%
-4.0%
0.0%
4.0%
8.0%
12.0%
16.0%
2006 2007 2008 2009 2010 2011 2012 2013 2014 2015 2016
-$4.0
$0.0
$4.0
$8.0
$12.0
2006 2007 2008 2009 2010 2011 2012 2013 2014 2015 2016 2017 2018$0.7
$1.0
$1.3
$1.6
$1.9
3Q14 4Q14 1Q15 2Q15 3Q15 4Q15 1Q16 2Q16 3Q16 4Q16 1Q17 2Q17 3Q17 4Q17
21 Source: S&P Capital IQ, Yahoo! Finance
Constellation Brands t
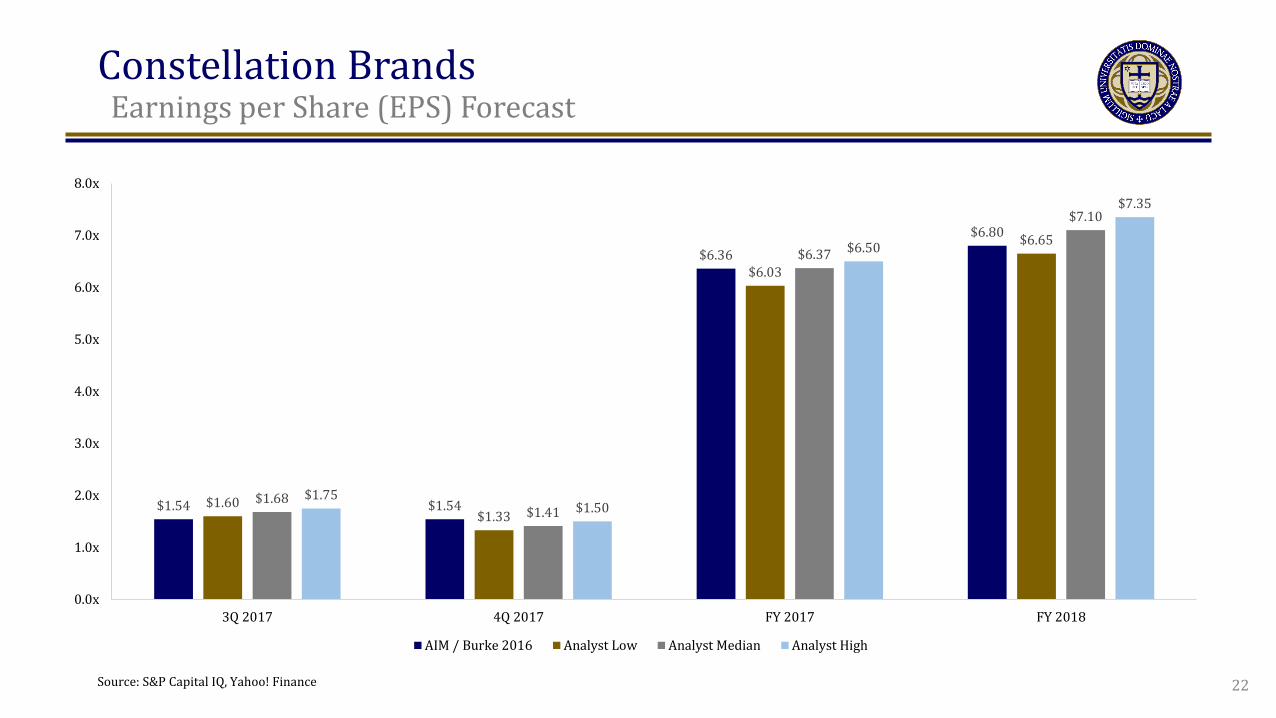
Earnings per Share (EPS) Forecast
22
$1.54 $1.54
$6.36 $6.80
$1.60 $1.33
$6.03
$6.65
$1.68 $1.41
$6.37
$7.10
$1.75 $1.50
$6.50
$7.35
0.0x
1.0x
2.0x
3.0x
4.0x
5.0x
6.0x
7.0x
8.0x
3Q 2017 4Q 2017 FY 2017 FY 2018
AIM / Burke 2016 Analyst Low Analyst Median Analyst High
Source: S&P Capital IQ, Yahoo! Finance
Constellation Brands t
Valuation, Investment Thesis, and Portfolio Decision
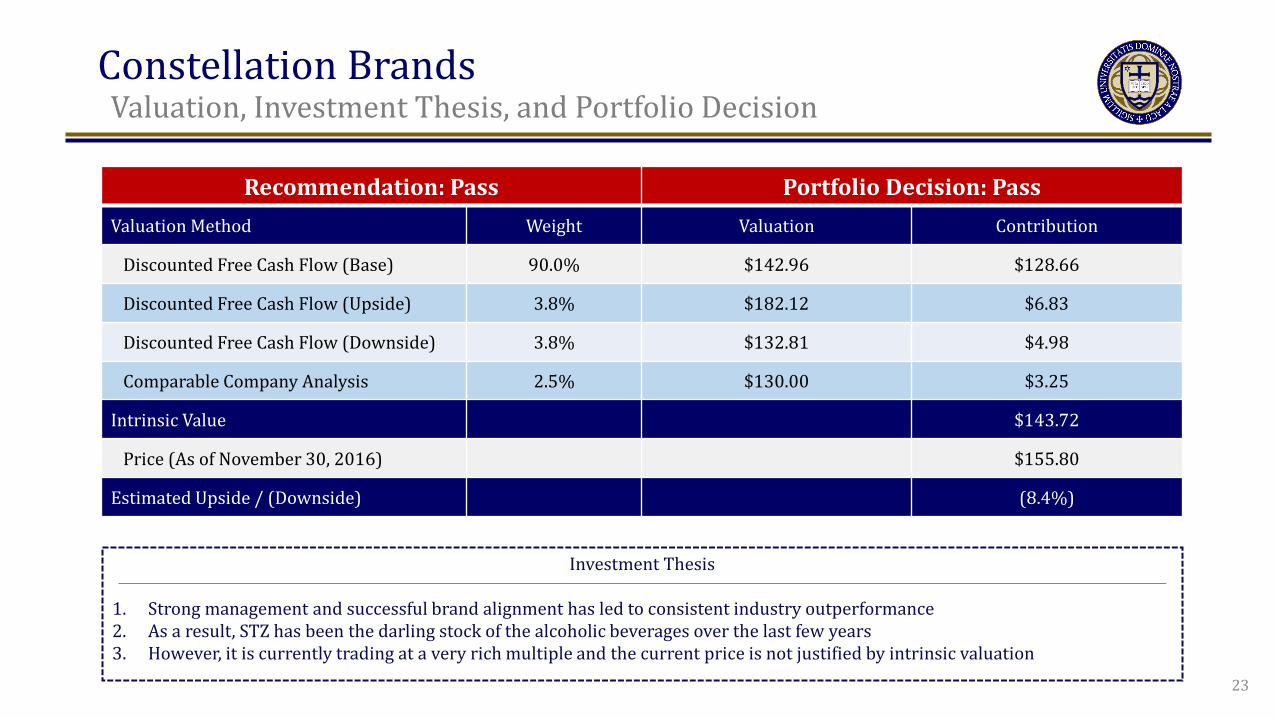
Recommendation: Pass Portfolio Decision: Pass Valuation Method Weight Valuation Contribution
Discounted Free Cash Flow (Base) 90.0% $142.96 $128.66
Discounted Free Cash Flow (Upside) 3.8% $182.12 $6.83
Discounted Free Cash Flow (Downside) 3.8% $132.81 $4.98
Comparable Company Analysis 2.5% $130.00 $3.25
Intrinsic Value $143.72
Price (As of November 30, 2016) $155.80
Estimated Upside / (Downside) (8.4%)
Investment Thesis
1. Strong management and successful brand alignment has led to consistent industry outperformance 2. As a result, STZ has been the darling stock of the alcoholic beverages over the last few years 3. However, it is currently trading at a very rich multiple and the current price is not justified by intrinsic valuation
23
Herman Millert
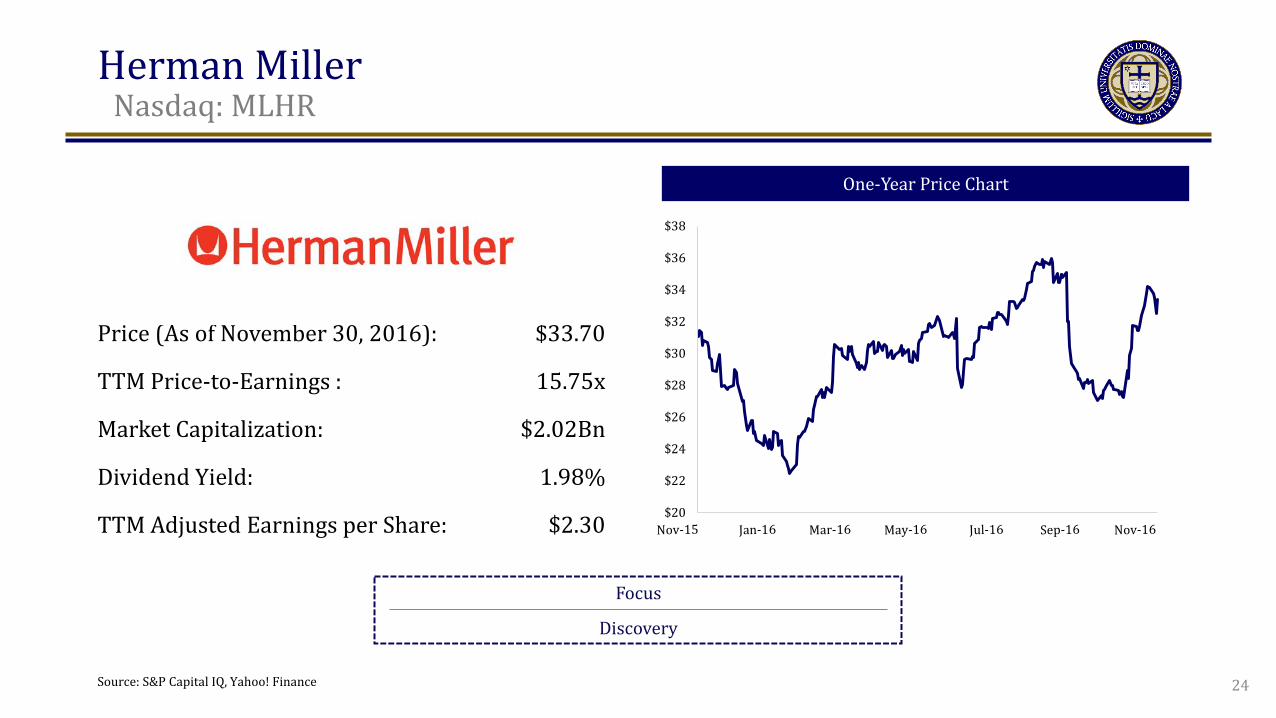
Nasdaq: MLHR
One-Year Price Chart
Focus
Discovery
Price (As of November 30, 2016): $33.70
TTM Price-to-Earnings : 15.75x
Market Capitalization: $2.02Bn
Dividend Yield: 1.98%
TTM Adjusted Earnings per Share: $2.30
Source: S&P Capital IQ, Yahoo! Finance
$20
$22
$24
$26
$28
$30
$32
$34
$36
$38
24
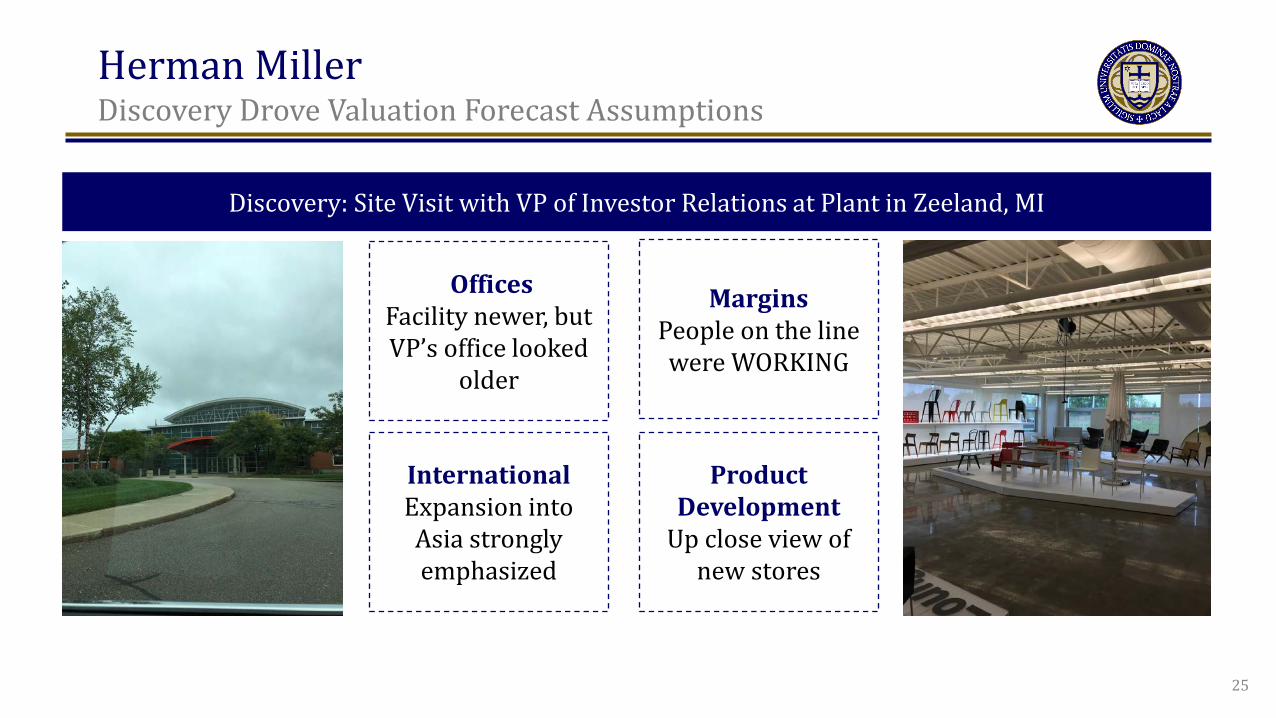
Herman Miller Discovery Drove Valuation Forecast Assumptions
Discovery: Site Visit with VP of Investor Relations at Plant in Zeeland, MI
Offices Facility newer, but VP’s office looked
older
Margins People on the line were WORKING
International Expansion into Asia strongly emphasized
Product Development
Up close view of new stores
25
Herman Miller t
Valuation, Investment Thesis, and Portfolio Decision
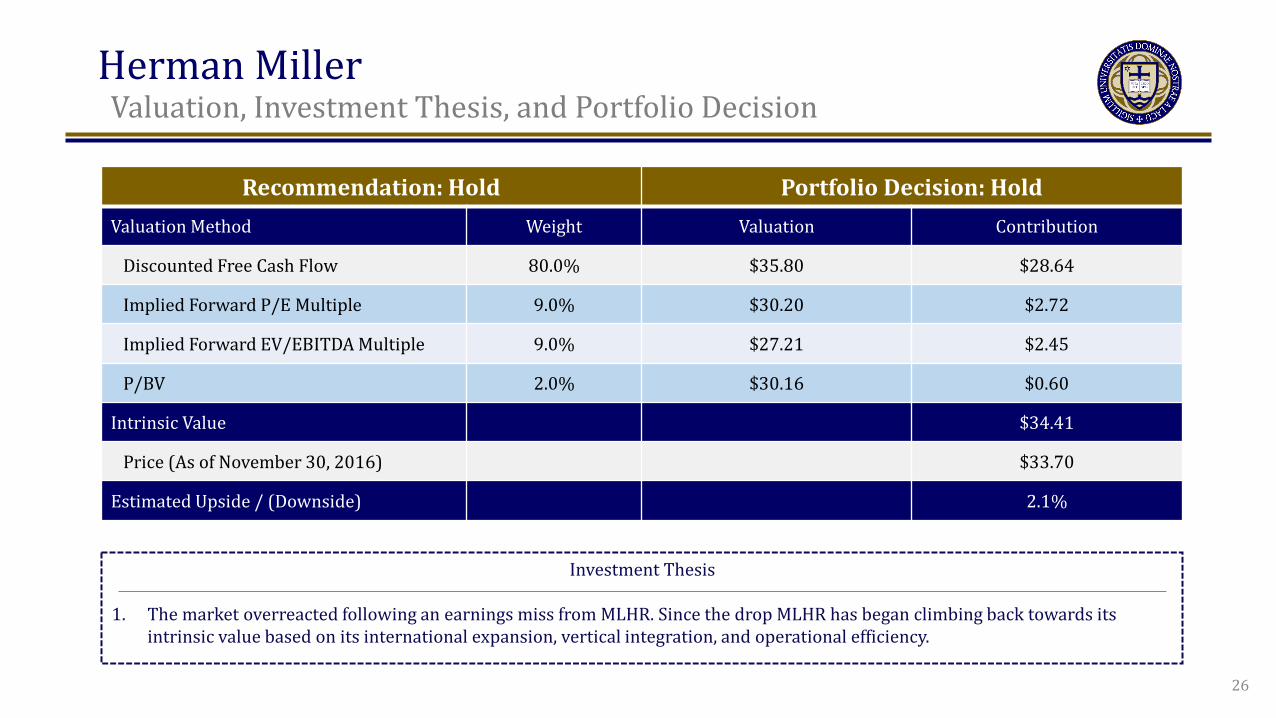
Recommendation: Hold Portfolio Decision: Hold Valuation Method Weight Valuation Contribution
Discounted Free Cash Flow 80.0% $35.80 $28.64
Implied Forward P/E Multiple 9.0% $30.20 $2.72
Implied Forward EV/EBITDA Multiple 9.0% $27.21 $2.45
P/BV 2.0% $30.16 $0.60
Intrinsic Value $34.41
Price (As of November 30, 2016) $33.70
Estimated Upside / (Downside) 2.1%
Investment Thesis
1. The market overreacted following an earnings miss from MLHR. Since the drop MLHR has began climbing back towards its intrinsic value based on its international expansion, vertical integration, and operational efficiency.
26

LendingClub Corporation t
NYSE: LC
One-Year Price Chart
Focus
Company and Industry Overview
Price (As of November 30, 2016): $5.62
TTM Price-to-Earnings: N/A
Market Capitalization: $2.22Bn
Short Interest: 17.03%
TTM Adjusted Earnings per Share: ($0.28) $0
$2
$4
$6
$8
$10
$12
$14
$16
Nov-15 Jan-16 Mar-16 May-16 Jul-16 Sep-16
27 Source: S&P Capital IQ, Yahoo! Finance

LendingClub Corporation t
Overview
Historical Revenue ($MM) Company Background
Business Model
• Online market maker for unsecured credit 1. Consumers/small businesses apply for loans online 2. Algorithm assesses credit, approves loans, sets interest
rates 3. LendingClub issues loans and securitizes them 4. Investors and banks purchase notes as investments 5. LendingClub takes a percentage of loans originated and of
interest/principal serviced Primary Loan Purposes
• Personal Loans • Credit Card Refinancing • Small Business Loans • Auto Loan Refinancing
$34 $98
$211
$430
$506
$0
$150
$300
$450
$600
2012 2013 2014 2015 LTM
Source: Company Filings
Historical Margins
-20.3%
7.5%
-15.6%
-1.2% -14.1%
-60.5% -48.5%
-13.2%
5.4% -8.7%
-80.0%
-60.0%
-40.0%
-20.0%
0.0%
20.0%
2012 2013 2014 2015 LTM
Net Profit Margin After-tax Operating Margin28

LendingClub Corporation t
Industry Trends in Peer-to-Peer Lending
U.S. Consumer Loan Originations ($Bn) Total Addressable Market: Credit Outstanding ($Bn)
$7,236 $7,376
$7,495 $7,573 $7,634 $7,734 $7,821 $7,907 $7,994
0%
1%
2%
3%
$6,800
$7,200
$7,600
$8,000
$8,400
2014 2015 2016E 2017E 2018E 2019E 2020E 2021E 2022E
Total Consumer Loans Originated Projected Market Penetration
Key Takeaways US Peer-to-Peer Lending Market Share (2015)
$0
$1,000
$2,000
2006 2007 2008 2009 2010 2011 2012 2013 2014 2015
Revolving Consumer Credit
46%
12%
12%
11%
19%
LendingClub Prosper OnDeck SoFi Other
Attractive Form of Borrower Financing • Competitive interest rates versus credit cards
Appeal of Unsecured Credit • Economically difficult for banks to underwrite small loans
Partnerships versus Direct Competition • Many banks pursue exposure through trusted platforms
that pass due diligence • Other banks have chosen compete directly
29
Revolving $853
Non-revolving $1,621
[SERIES NAME] [VALUE]
$0 $500 $1,000 $1,500 $2,000 $2,500 $3,000
1
Source: Statista, FRED, Federal Reserve

LendingClub Corporation t
Valuation, Investment Thesis, and Portfolio Decision
Recommendation: Buy Portfolio Decision: Pass Valuation Method Weight Valuation Contribution
Discounted Free Cash Flow 100.0% $6.69 $6.69
Implied Trailing P/S Multiple 0.0% $4.50 $0.00
Implied Forward EV/Revenue Multiple 0.0% $1.67 $0.00
Implied Forward P/E Multiple 0.0% N/A $0.00
Intrinsic Value $6.69
Price (As of November 30, 2016) $5.62
Estimated Upside / (Downside) 19.0%
Investment Thesis
1. Market over-reaction to resignation of Founder and CEO despite strong relationships with investor base 2. New management team tailored to developing relationships with financial institutions 3. Strong value proposition for borrowers; 80% use LendingClub for refinancing/debt consolidation of traditional loans
30
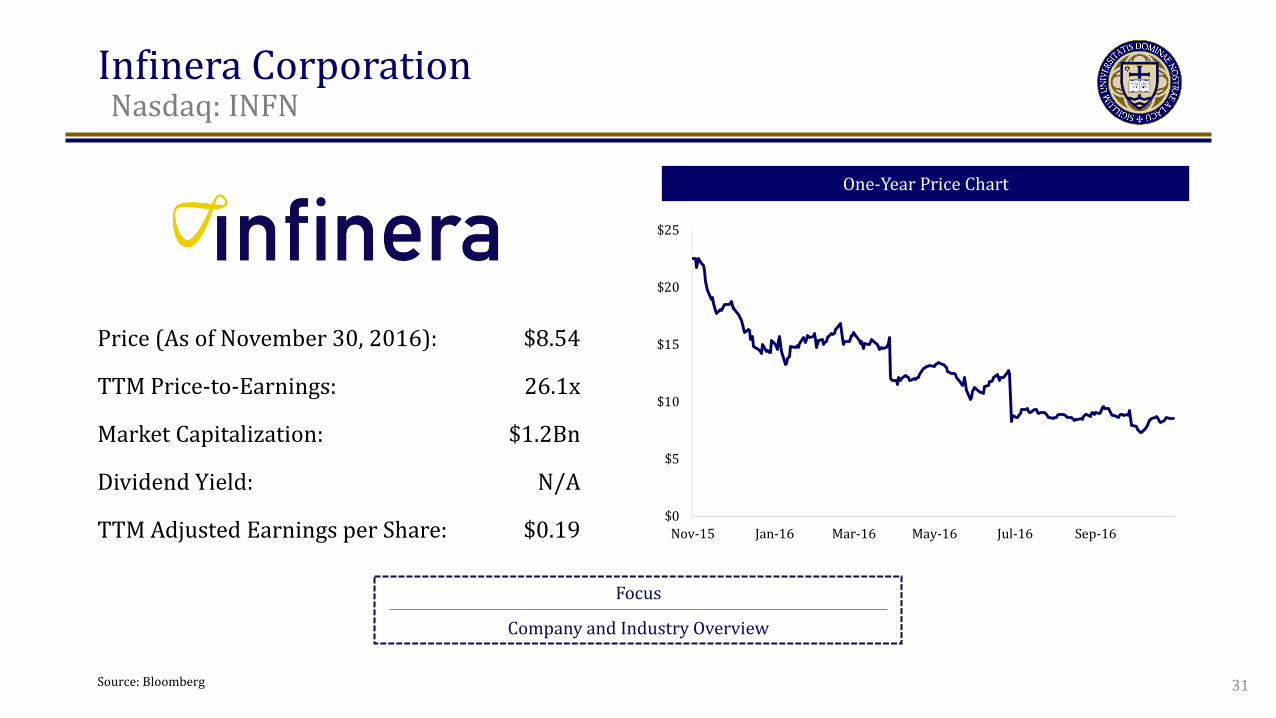
Infinera Corporation Nasdaq: INFN
One-Year Price Chart
Focus
Company and Industry Overview
Price (As of November 30, 2016):
TTM Price-to-Earnings:
Market Capitalization:
Dividend Yield:
TTM Adjusted Earnings per Share:
$8.54
26.1x
$1.2Bn
N/A
$0.19 $0
$5
$10
$15
$20
$25
Nov-15 Jan-16 Mar-16 May-16 Jul-16 Sep-16
31 Source: Bloomberg

Infinera Corporation t
Company and Industry Overview
PIC-Enabled Technology
• PIC Enables Scalable, Intelligent Functions: SDN, integrated switching, sliceable bandwidth
• High Capacity Applications: Long-haul, Metro Cloud, Metro Core
New Purpose-Built Products
• Cloud Xpress for DC Interconnect • XT-Series for Long-haul • XTM-Series & XTC-2 for Metro • 3x TAM expansion to >$15B in 2020
Vertical Integration
• Lower cost structure than competition • Supply chain control • Additional functionality due to
integration synergies
Infinera has a competitive advantage due to its unique PIC technology, market expansion opportunities, and vertically integrated business model.
32
Competitive advantages have launched INFN to grow Long-Haul market share by 500+ basis points in the past five years.
Source: Investor Presentation
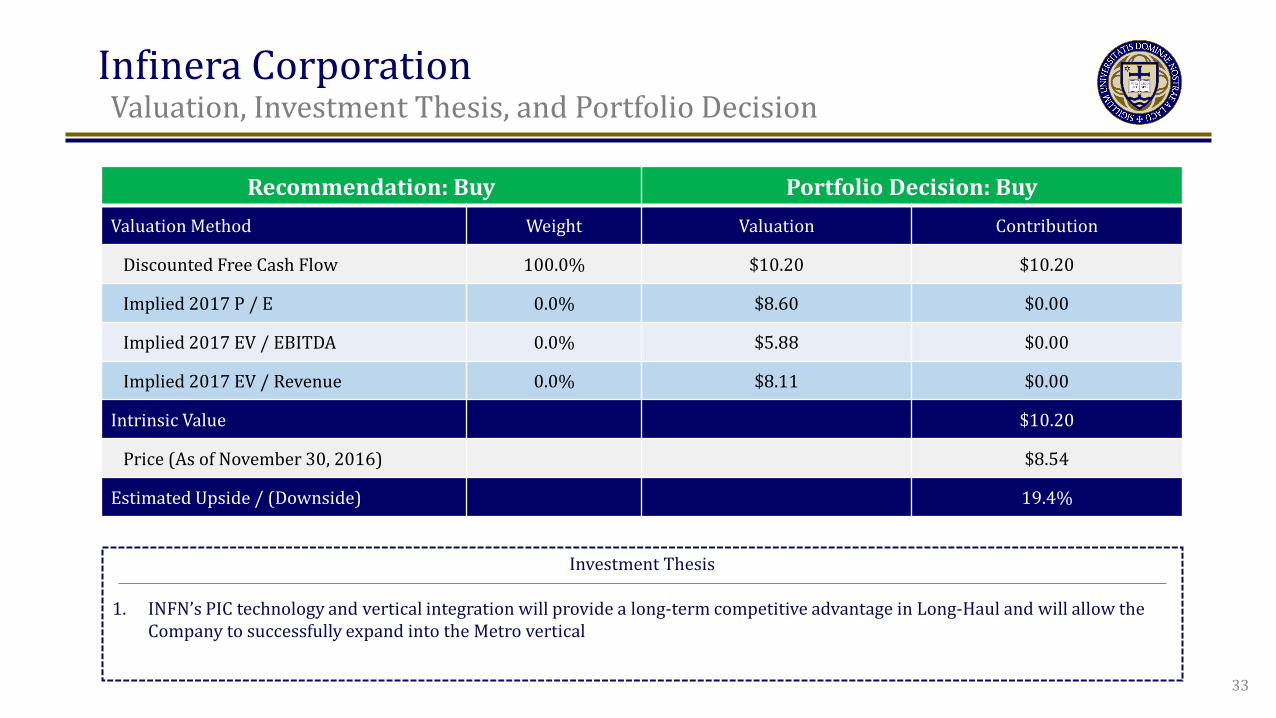
Infinera Corporation t
Valuation, Investment Thesis, and Portfolio Decision
Recommendation: Buy Portfolio Decision: Buy Valuation Method Weight Valuation Contribution
Discounted Free Cash Flow 100.0% $10.20 $10.20
Implied 2017 P / E 0.0% $8.60 $0.00
Implied 2017 EV / EBITDA 0.0% $5.88 $0.00
Implied 2017 EV / Revenue 0.0% $8.11 $0.00
Intrinsic Value $10.20
Price (As of November 30, 2016) $8.54
Estimated Upside / (Downside) 19.4%
Investment Thesis
1. INFN’s PIC technology and vertical integration will provide a long-term competitive advantage in Long-Haul and will allow the Company to successfully expand into the Metro vertical
33
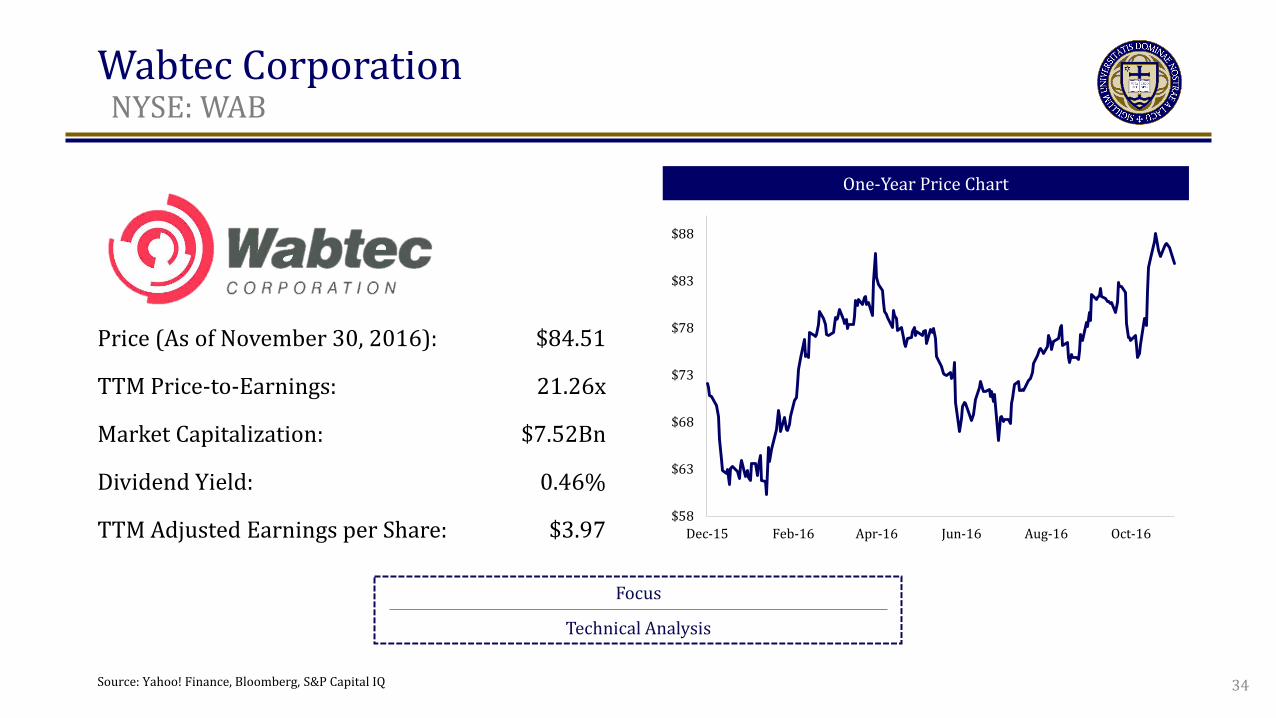
Wabtec Corporation t
NYSE: WAB
One-Year Price Chart
Focus
Technical Analysis
Price (As of November 30, 2016): $84.51
TTM Price-to-Earnings: 21.26x
Market Capitalization: $7.52Bn
Dividend Yield: 0.46%
TTM Adjusted Earnings per Share: $3.97 $58
$63
$68
$73
$78
$83
$88
Dec-15 Feb-16 Apr-16 Jun-16 Aug-16 Oct-16
Source: Yahoo! Finance, Bloomberg, S&P Capital IQ 34
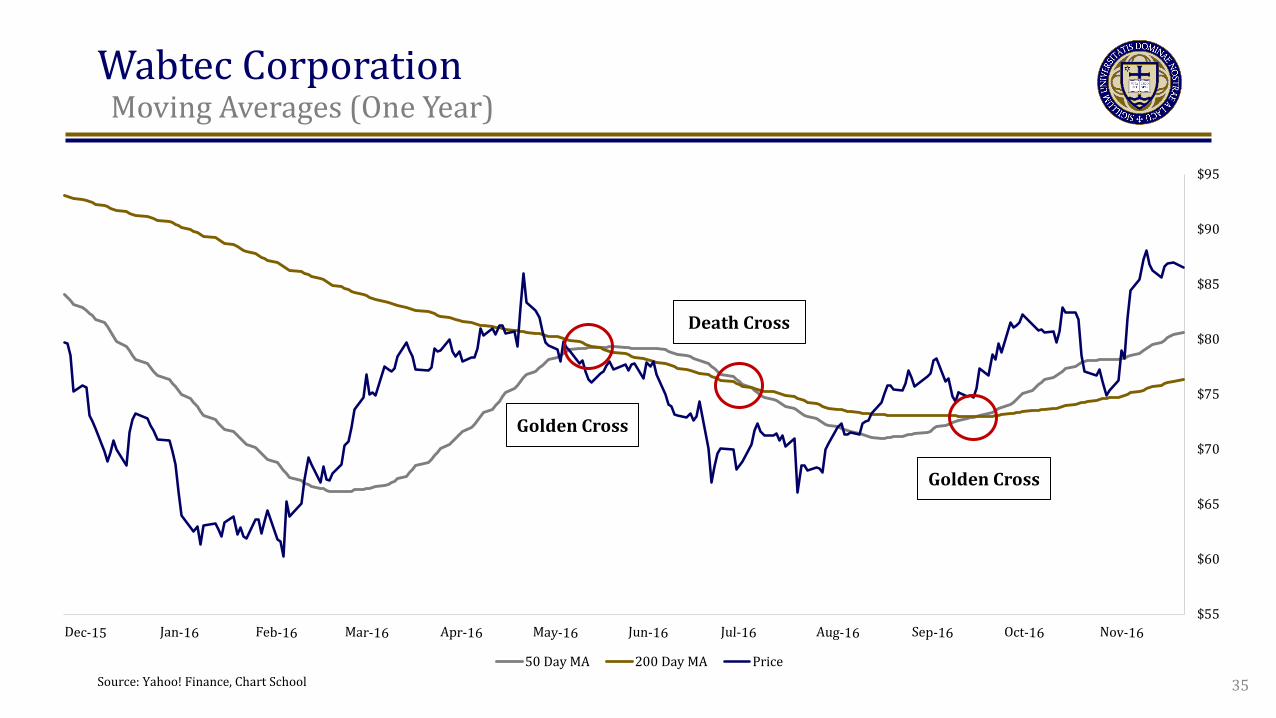
Wabtec Corporation t
Moving Averages (One Year)
$55
$60
$65
$70
$75
$80
$85
$90
$95
50 Day MA 200 Day MA Price
Golden Cross
Death Cross
Golden Cross
Source: Yahoo! Finance, Chart School 35

Wabtec Corporation t
Bollinger Bands
$58
$63
$68
$73
$78
$83
$88
Dec-15 Jan-16 Feb-16 Mar-16 Apr-16 May-16 Jul-16 Aug-16 Sep-16 Oct-16 Nov-16
WAB Price Upper Bound Lower Bound
Source: Yahoo! Finance, Chart School 36
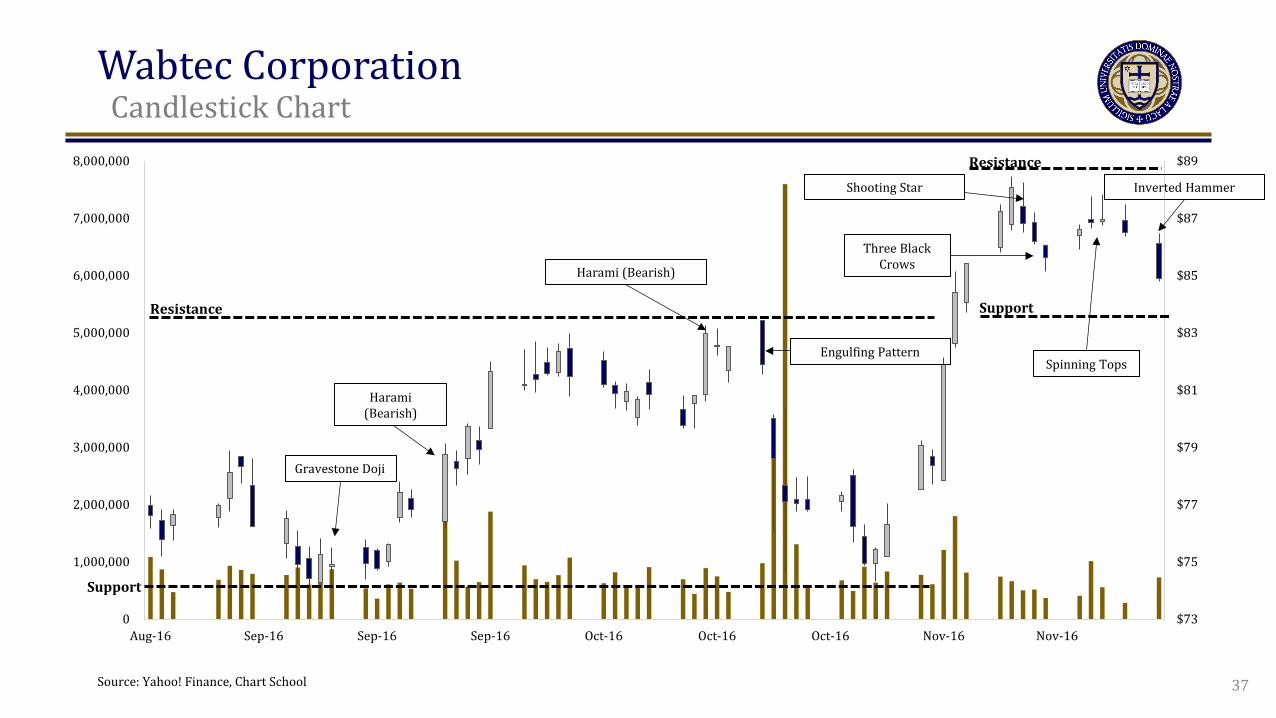
Wabtec Corporation t
Candlestick Chart
$73
$75
$77
$79
$81
$83
$85
$87
$89
0
1,000,000
2,000,000
3,000,000
4,000,000
5,000,000
6,000,000
7,000,000
8,000,000
Aug-16 Sep-16 Sep-16 Sep-16 Oct-16 Oct-16 Oct-16 Nov-16 Nov-16
Resistance
Support
Support
Resistance
Spinning Tops
Inverted Hammer
Gravestone Doji
Harami (Bearish)
Three Black Crows
Shooting Star
Harami (Bearish)
Engulfing Pattern
37 Source: Yahoo! Finance, Chart School

Wabtec Corporation t
Valuation, Investment Thesis, and Portfolio Decision
Recommendation: Hold Portfolio Decision: Hold Valuation Method Weight Valuation Contribution
Discounted Free Cash Flow 85.0% $88.98 $75.63
Price / Earnings 5.0% $90.11 $4.51
Enterprise / EBITDA 5.0% $87.99 $4.40
Enterprise / Revenue 5.0% $71.74 $3.59
Intrinsic Value $88.13
Price (As of November 30, 2016) $84.51
Estimated Upside / (Downside) 4.3%
Investment Thesis
1. Dominance across the domestic market and leadership within almost all product classes in original and aftermarket sales promise a steady revenue stream with decreasing service costs
2. Heavy investment in emerging Rail and Transit technologies will sustain above average growth in the US 3. Expansion into Europe with the Faiveley Transport Group acquisition opens the door to Europe and Near East Transit growth 38
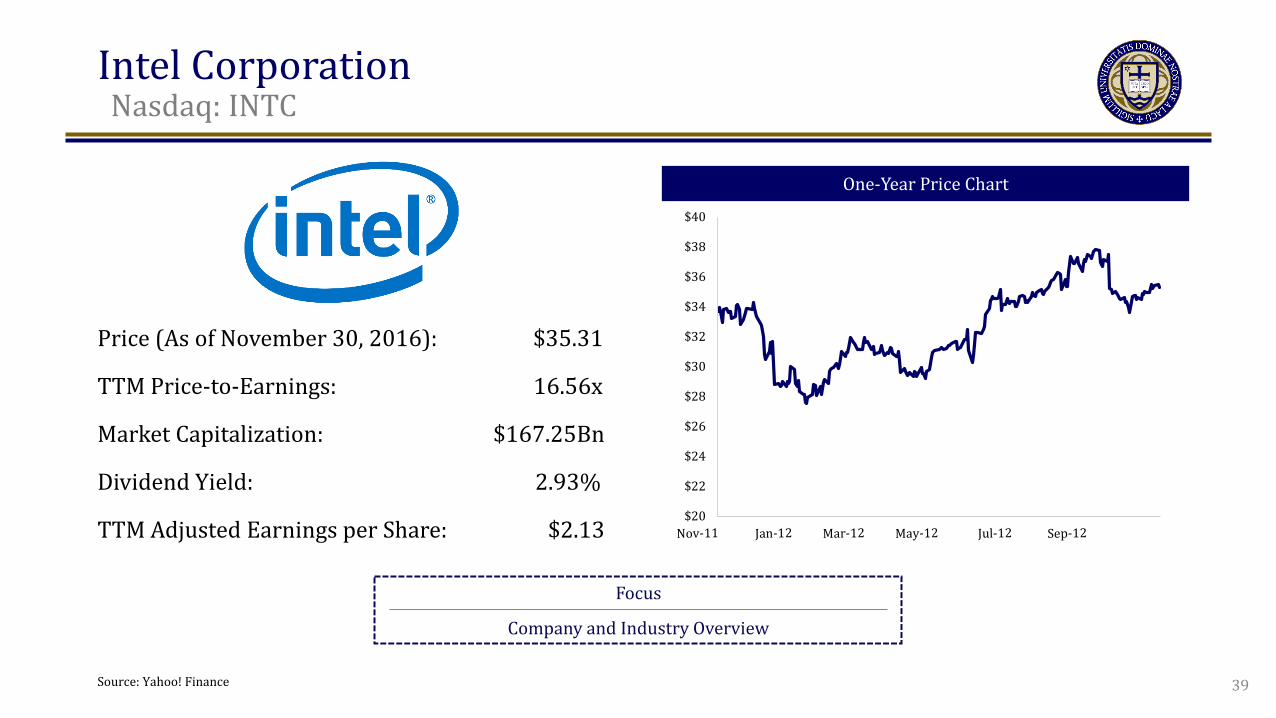
Intel Corporation Nasdaq: INTC
One-Year Price Chart
Focus
Company and Industry Overview
Price (As of November 30, 2016): $35.31
TTM Price-to-Earnings: 16.56x
Market Capitalization: $167.25Bn
Dividend Yield: 2.93%
TTM Adjusted Earnings per Share: $2.13 $20
$22
$24
$26
$28
$30
$32
$34
$36
$38
$40
39 Source: Yahoo! Finance
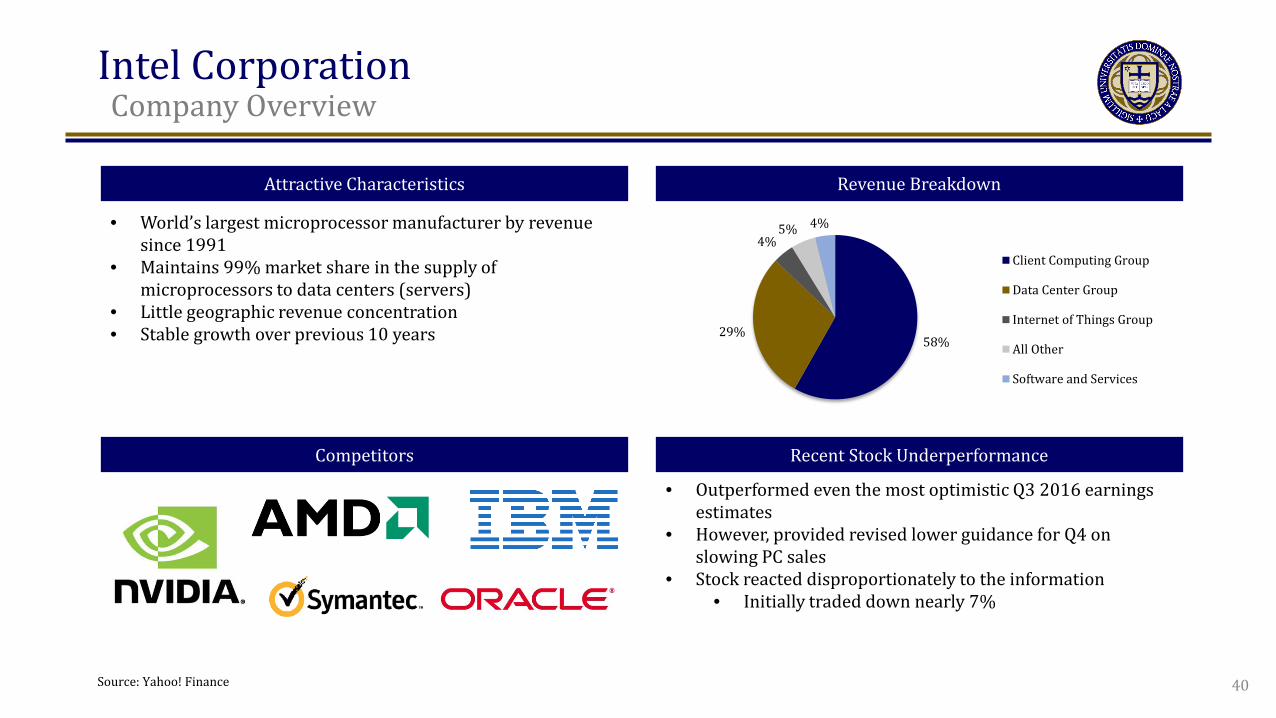
Intel Corporation Company Overview
Revenue Breakdown Attractive Characteristics
Recent Stock Underperformance Competitors
58% 29%
4% 5% 4%
Client Computing Group
Data Center Group
Internet of Things Group
All Other
Software and Services
• World’s largest microprocessor manufacturer by revenue since 1991
• Maintains 99% market share in the supply of microprocessors to data centers (servers)
• Little geographic revenue concentration • Stable growth over previous 10 years
40
• Outperformed even the most optimistic Q3 2016 earnings estimates
• However, provided revised lower guidance for Q4 on slowing PC sales
• Stock reacted disproportionately to the information • Initially traded down nearly 7%
Source: Yahoo! Finance
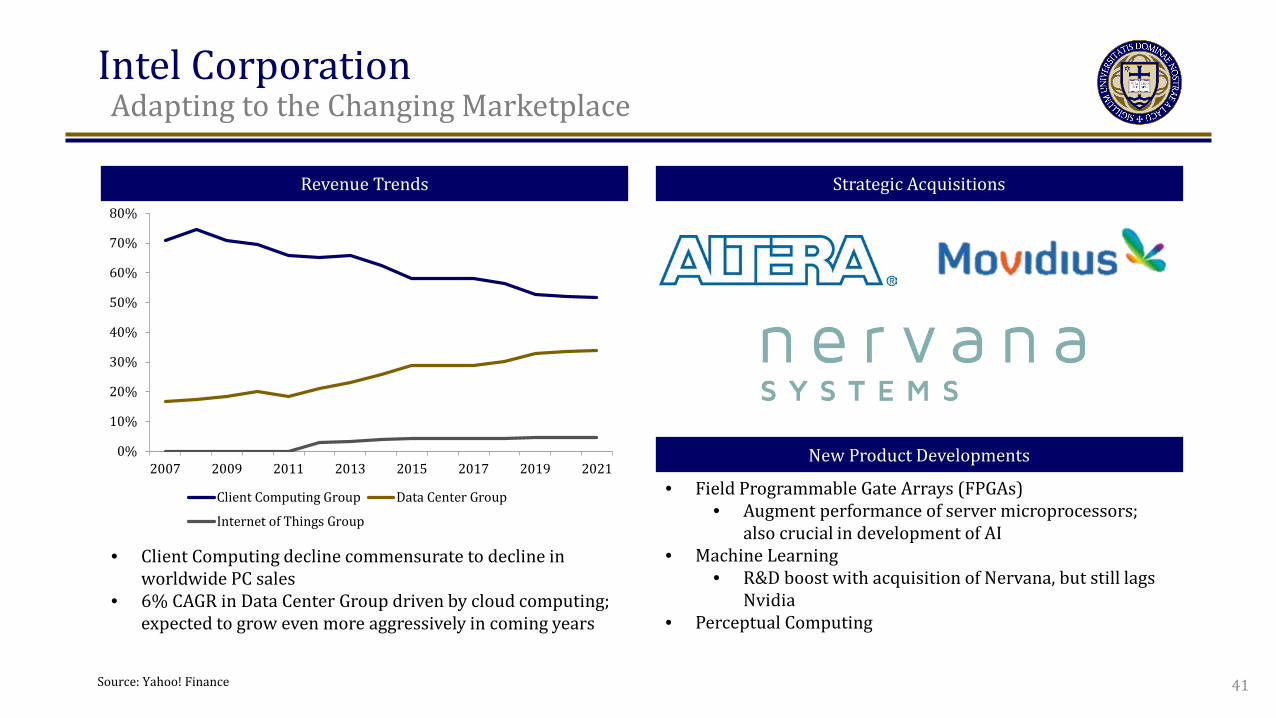
Intel Corporation Adapting to the Changing Marketplace
Strategic Acquisitions Revenue Trends
New Product Developments 0%
10%
20%
30%
40%
50%
60%
70%
80%
2007 2009 2011 2013 2015 2017 2019 2021
Client Computing Group Data Center Group
Internet of Things Group
• Field Programmable Gate Arrays (FPGAs) • Augment performance of server microprocessors;
also crucial in development of AI • Machine Learning
• R&D boost with acquisition of Nervana, but still lags Nvidia
• Perceptual Computing
• Client Computing decline commensurate to decline in worldwide PC sales
• 6% CAGR in Data Center Group driven by cloud computing; expected to grow even more aggressively in coming years
41 Source: Yahoo! Finance
Intel Corporation Valuation, Investment Thesis, and Portfolio Decision
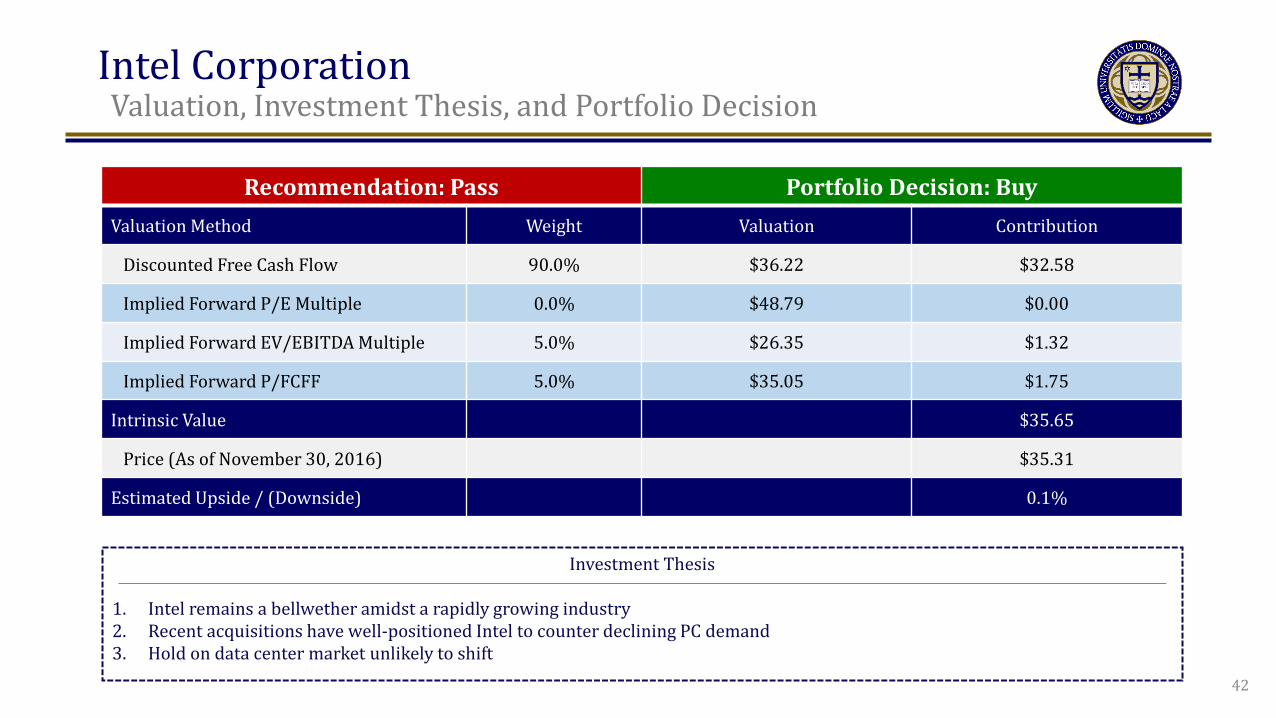
Recommendation: Pass Portfolio Decision: Buy Valuation Method Weight Valuation Contribution
Discounted Free Cash Flow 90.0% $36.22 $32.58
Implied Forward P/E Multiple 0.0% $48.79 $0.00
Implied Forward EV/EBITDA Multiple 5.0% $26.35 $1.32
Implied Forward P/FCFF 5.0% $35.05 $1.75
Intrinsic Value $35.65
Price (As of November 30, 2016) $35.31
Estimated Upside / (Downside) 0.1%
Investment Thesis
1. Intel remains a bellwether amidst a rapidly growing industry 2. Recent acquisitions have well-positioned Intel to counter declining PC demand 3. Hold on data center market unlikely to shift
42
Endo International plc t
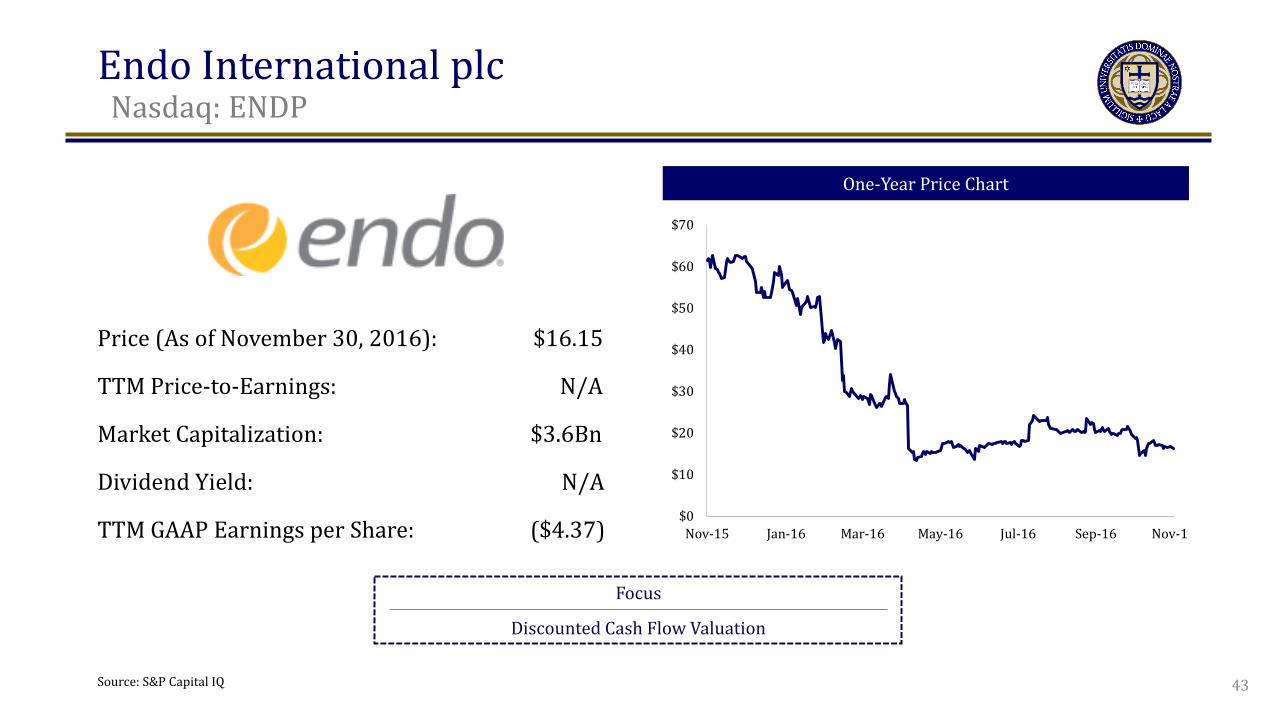
Nasdaq: ENDP
One-Year Price Chart
Focus
Discounted Cash Flow Valuation
Price (As of November 30, 2016): $16.15
TTM Price-to-Earnings: N/A
Market Capitalization: $3.6Bn
Dividend Yield: N/A
TTM GAAP Earnings per Share: ($4.37)
Source: S&P Capital IQ
$0
$10
$20
$30
$40
$50
$60
$70
Nov-15 Jan-16 Mar-16 May-16 Jul-16 Sep-16 Nov-16
43
Endo International plc t
Overview
Intangible Assets & Total Debt
$0
$500
$1,000
$1,500
$2,000
$2,500
$3,000
$3,500
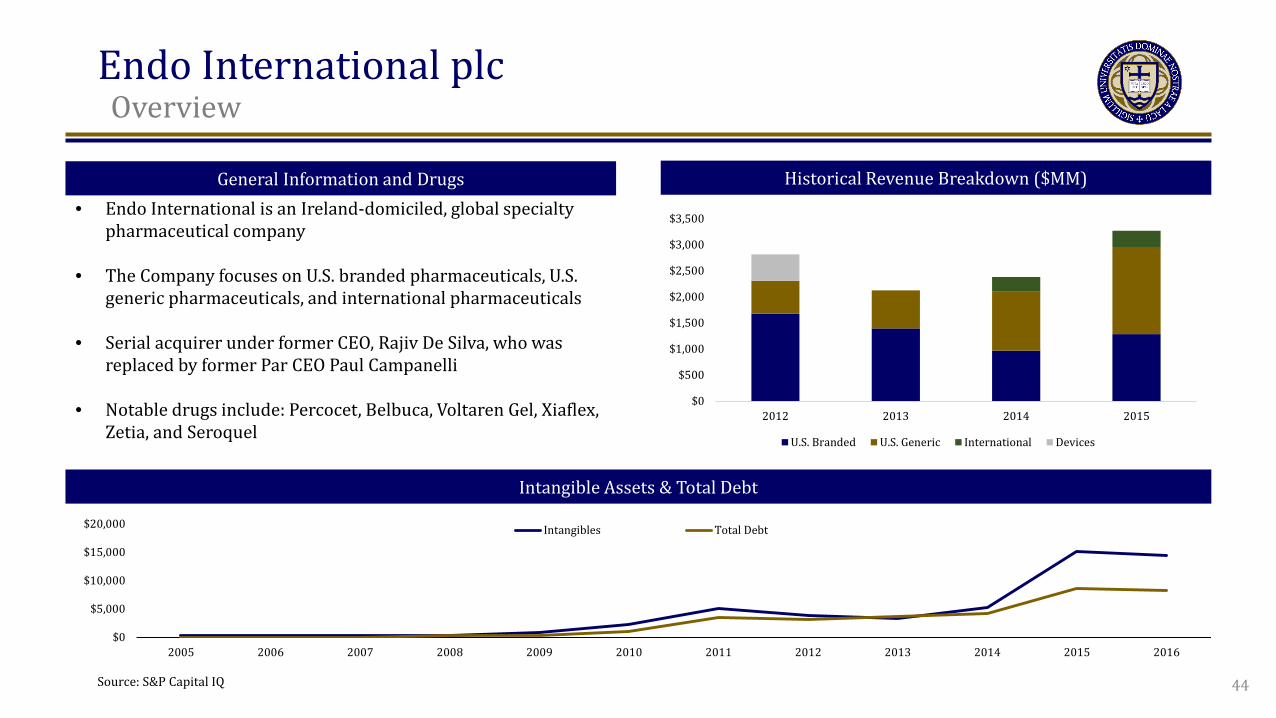
2012 2013 2014 2015
U.S. Branded U.S. Generic International Devices
Historical Revenue Breakdown ($MM) General Information and Drugs • Endo International is an Ireland-domiciled, global specialty
pharmaceutical company • The Company focuses on U.S. branded pharmaceuticals, U.S.
generic pharmaceuticals, and international pharmaceuticals • Serial acquirer under former CEO, Rajiv De Silva, who was
replaced by former Par CEO Paul Campanelli • Notable drugs include: Percocet, Belbuca, Voltaren Gel, Xiaflex,
Zetia, and Seroquel
$0
$5,000
$10,000
$15,000
$20,000
2005 2006 2007 2008 2009 2010 2011 2012 2013 2014 2015 2016
Intangibles Total Debt
44 Source: S&P Capital IQ

Endo International plc t
Discounted Cash Flow
Key Assumptions Revenue Build ($MM)
Weighted Average Cost of Capital Sensitivity Analysis
• Most revenue assumptions are based on management guidance ‒ When not applicable, drug-specific industry averages
are used • Projected costs are predominantly taken as a percentage of
sales $0$1,000$2,000$3,000$4,000$5,000$6,000
2012 2013 2014 2015 2016 2017 2018 2019 2020 2021 2022
U.S. Branded U.S. Generic International Devices
Perpetuity Growth 15.72 0.50% 0.75% 1.00% 1.25% 1.50%
5% $ 31.88 $ 34.62 $ 37.69 $ 41.14 $ 45.05 6% $ 20.92 $ 22.69 $ 24.63 $ 26.76 $ 29.11
WACC 7% $ 13.19 $ 14.41 $ 15.72 $ 17.14 $ 18.69 8% $ 7.44 $ 8.32 $ 9.25 $ 10.26 $ 11.33 9% $ 3.00 $ 3.65 $ 4.34 $ 5.08 $ 5.86
Perpetuity Growth 11.04 0.50% 0.75% 1.00% 1.25% 1.50%
5% 97% 114% 133% 155% 179% 6% 30% 40% 52% 66% 80%
WACC 7% -18% -11% -3% 6% 16% 8% -54% -48% -43% -36% -30% 9% -81% -77% -73% -69% -64%
Assumptions Market Risk Premium (Rm - Rf) 5.0% Multiplied by: ENDP Beta 1.30 Adjusted Market Risk Premium 6.5% Add: Risk-Free Rate of Return (Rf) 2.0% Cost of Equity 8.5% Multiply by: ENDP E/(D+E) 40.9% Cost of Equity Portion 3.5% Cost of Debt 8.0% Tax Rate 20% After Tax Cost of Debt 6% Multiply by: ENDP E/(D+E) 59.1% Cost of Debt Portion 3.8% WACC 7.3% 45
Endo International plc t
Valuation, Investment Thesis, and Portfolio Decision
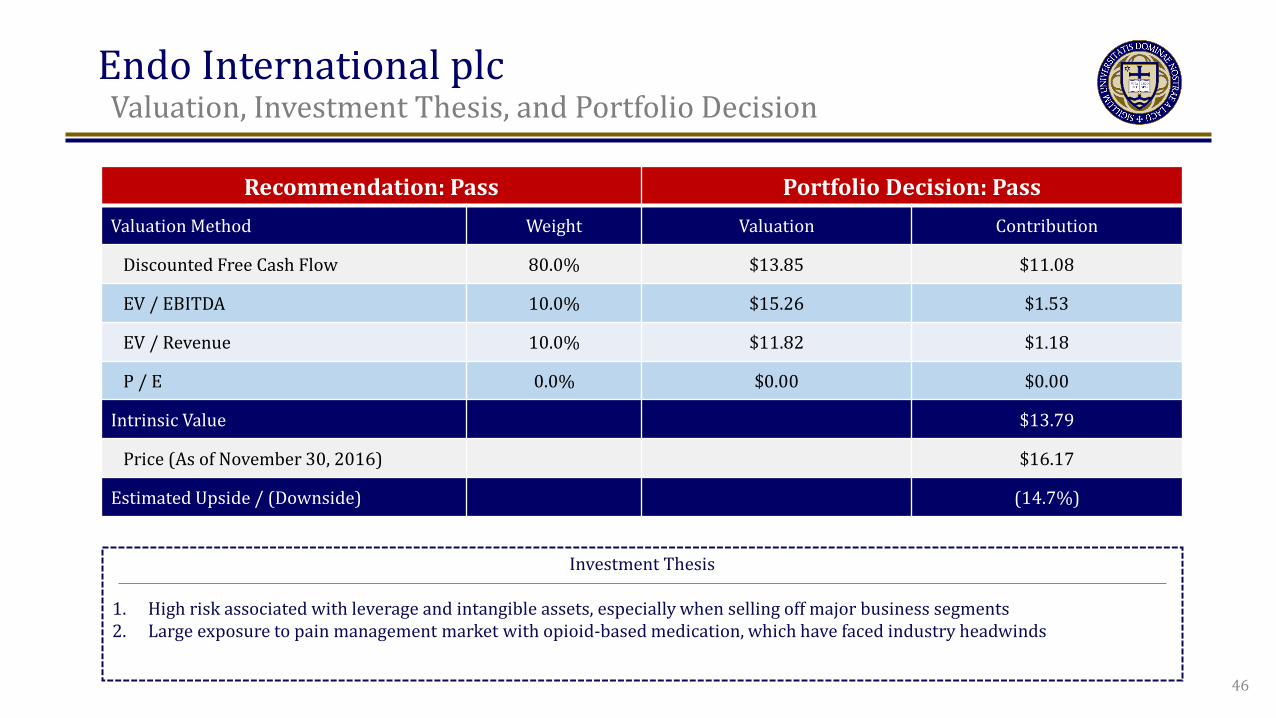
Recommendation: Pass Portfolio Decision: Pass Valuation Method Weight Valuation Contribution
Discounted Free Cash Flow 80.0% $13.85 $11.08
EV / EBITDA 10.0% $15.26 $1.53
EV / Revenue 10.0% $11.82 $1.18
P / E 0.0% $0.00 $0.00
Intrinsic Value $13.79
Price (As of November 30, 2016) $16.17
Estimated Upside / (Downside) (14.7%)
Investment Thesis
1. High risk associated with leverage and intangible assets, especially when selling off major business segments 2. Large exposure to pain management market with opioid-based medication, which have faced industry headwinds
46
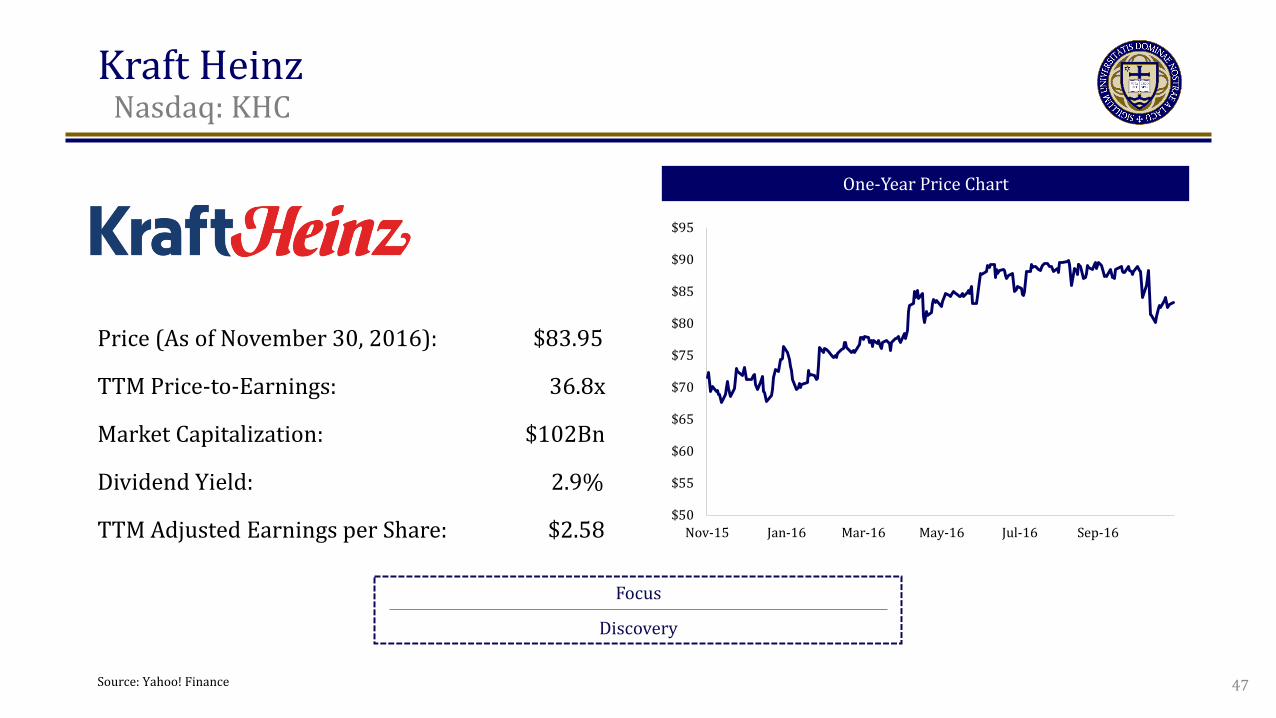
Kraft Heinz t
Nasdaq: KHC
One-Year Price Chart
Focus
Discovery
Price (As of November 30, 2016): $83.95
TTM Price-to-Earnings: 36.8x
Market Capitalization: $102Bn
Dividend Yield: 2.9%
TTM Adjusted Earnings per Share: $2.58
Source: Yahoo! Finance
$50
$55
$60
$65
$70
$75
$80
$85
$90
$95
Nov-15 Jan-16 Mar-16 May-16 Jul-16 Sep-16
47
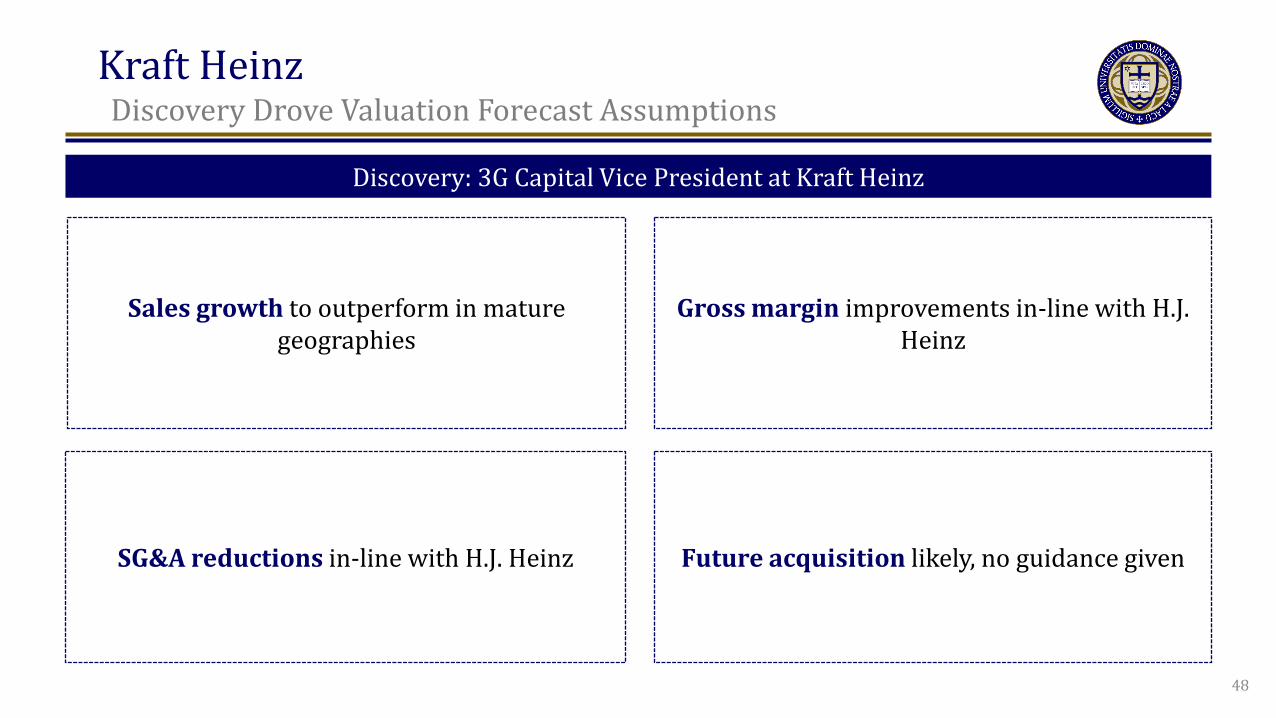
Kraft Heinz Discovery Drove Valuation Forecast Assumptions
Sales growth to outperform in mature geographies
Gross margin improvements in-line with H.J. Heinz
SG&A reductions in-line with H.J. Heinz Future acquisition likely, no guidance given
Discovery: 3G Capital Vice President at Kraft Heinz
48

Kraft Heinz t
COGS and SG&A Forecasts Based on Discovery
4%
7%
10%
13%
16%
SG&A % of Revenue - Historical
SG&A % of Revenue - Base Case
SG&A % of Revenue - Downside Case
SG&A % of Revenue - Upside Case
50%
55%
60%
65%
70%
75%COGS % of Sales (Historical)
COGS % of Sales Forecast - Base Case
COGS % of Sales Forecast - Downside Case
COGS % of Sales Forecast - Upside Case
COGS % of Revenue
49
SG&A % of Revenue
Kraft Heinz t
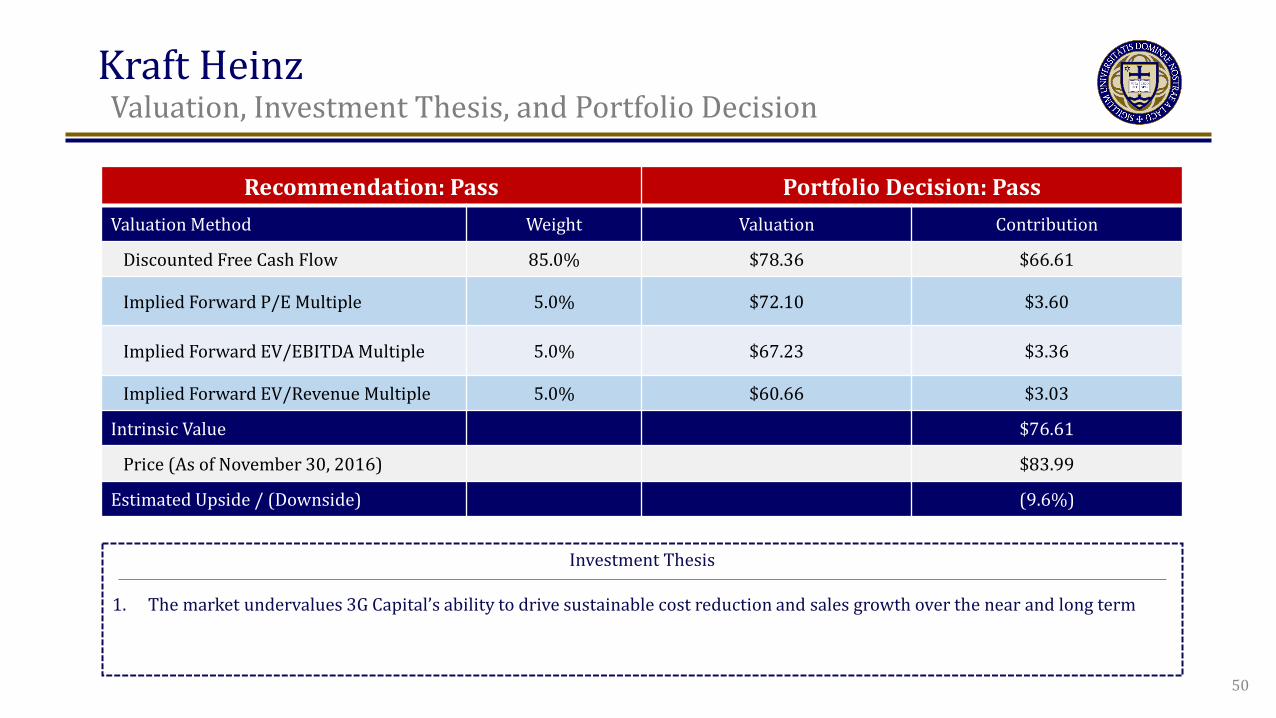
Valuation, Investment Thesis, and Portfolio Decision
Recommendation: Pass Portfolio Decision: Pass Valuation Method Weight Valuation Contribution
Discounted Free Cash Flow 85.0% $78.36 $66.61
Implied Forward P/E Multiple 5.0% $72.10 $3.60
Implied Forward EV/EBITDA Multiple 5.0% $67.23 $3.36
Implied Forward EV/Revenue Multiple 5.0% $60.66 $3.03
Intrinsic Value $76.61
Price (As of November 30, 2016) $83.99
Estimated Upside / (Downside) (9.6%)
Investment Thesis
1. The market undervalues 3G Capital’s ability to drive sustainable cost reduction and sales growth over the near and long term
50
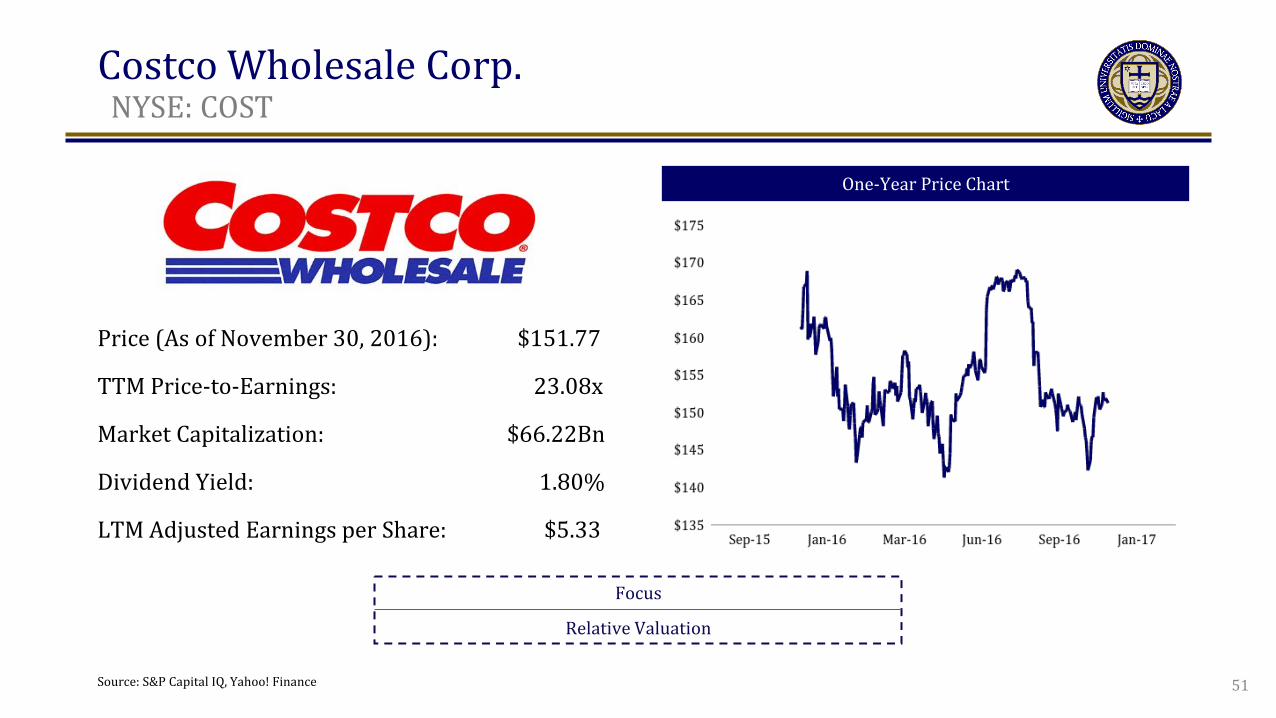
Costco Wholesale Corp. t
NYSE: COST
One-Year Price Chart
Focus
Relative Valuation
Price (As of November 30, 2016): $151.77
TTM Price-to-Earnings: 23.08x
Market Capitalization: $66.22Bn
Dividend Yield: 1.80%
LTM Adjusted Earnings per Share: $5.33
Source: S&P Capital IQ, Yahoo! Finance 51
Costco Wholesale Corp. t
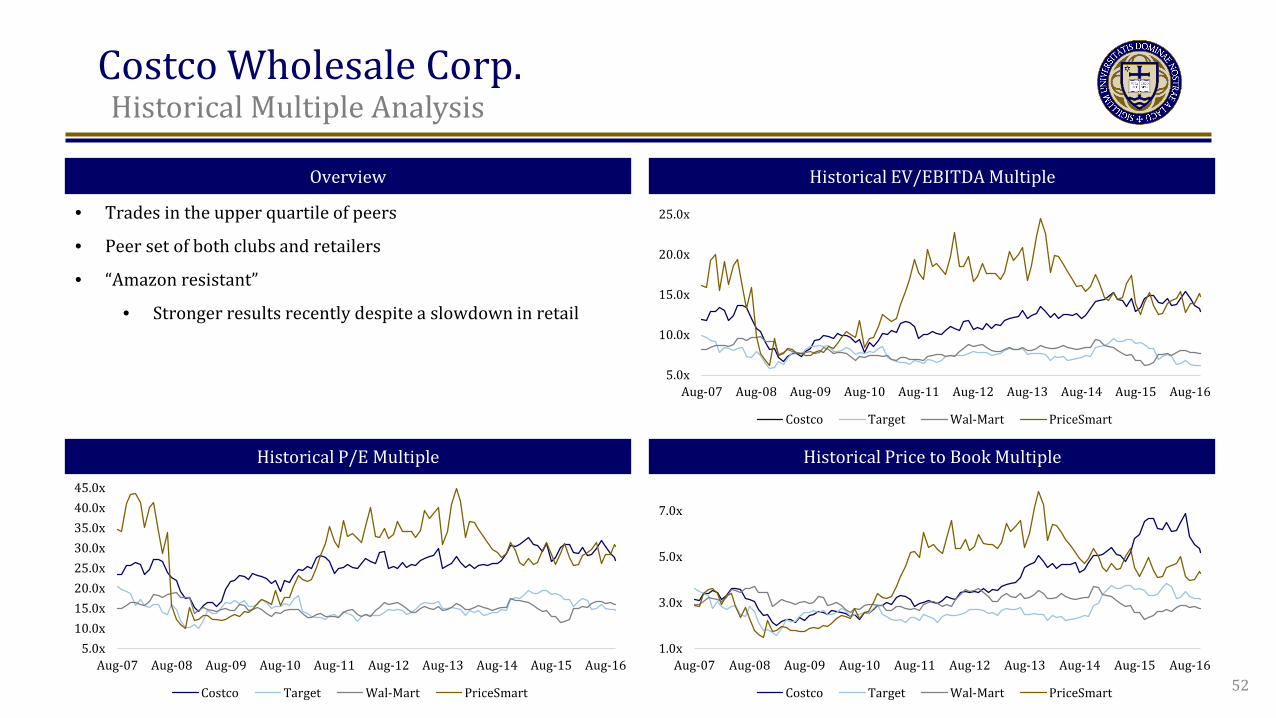
Historical Multiple Analysis
Overview
Historical P/E Multiple Historical Price to Book Multiple
Historical EV/EBITDA Multiple
• Trades in the upper quartile of peers
• Peer set of both clubs and retailers
• “Amazon resistant”
• Stronger results recently despite a slowdown in retail
52
5.0x10.0x15.0x20.0x25.0x30.0x35.0x40.0x45.0x
Aug-07 Aug-08 Aug-09 Aug-10 Aug-11 Aug-12 Aug-13 Aug-14 Aug-15 Aug-16
Costco Target Wal-Mart PriceSmart
1.0x
3.0x
5.0x
7.0x
Aug-07 Aug-08 Aug-09 Aug-10 Aug-11 Aug-12 Aug-13 Aug-14 Aug-15 Aug-16
Costco Target Wal-Mart PriceSmart
5.0x
10.0x
15.0x
20.0x
25.0x
Aug-07 Aug-08 Aug-09 Aug-10 Aug-11 Aug-12 Aug-13 Aug-14 Aug-15 Aug-16
Costco Target Wal-Mart PriceSmart

Costco Wholesale Corp. t
Relative Valuation Calculation
Forward P/E Multiple Forward Price to Book Multiple Forward EV/EBITDA Multiple
53
13.0x
16.1x
24.0x
27.4x
0.0x
5.0x
10.0x
15.0x
20.0x
25.0x
30.0x
Target Wal-Mart Costco PriceSmart
Implied Multiple: 25.3x
6.9x
7.9x
11.7x
13.4x
0.0x
2.0x
4.0x
6.0x
8.0x
10.0x
12.0x
14.0x
16.0x
Target Wal-Mart Costco PriceSmart
Implied Multiple: 11.1x
3.2x
4.3x
5.1x
5.9x
0.0x
1.0x
2.0x
3.0x
4.0x
5.0x
6.0x
7.0x
PriceSmart Wal-Mart Target Costco
Implied Multiple: 5.1x
Costco Wholesale Corp. t
Valuation, Investment Thesis, and Portfolio Decision
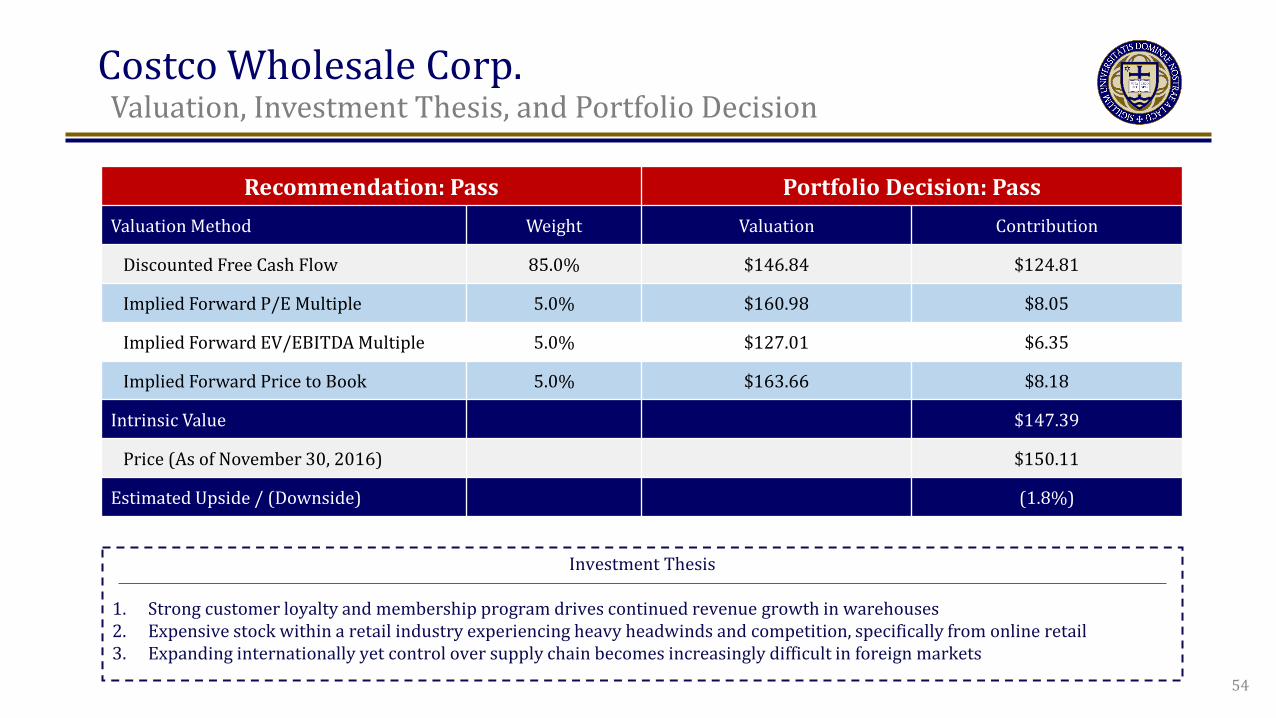
Recommendation: Pass Portfolio Decision: Pass Valuation Method Weight Valuation Contribution
Discounted Free Cash Flow 85.0% $146.84 $124.81
Implied Forward P/E Multiple 5.0% $160.98 $8.05
Implied Forward EV/EBITDA Multiple 5.0% $127.01 $6.35
Implied Forward Price to Book 5.0% $163.66 $8.18
Intrinsic Value $147.39
Price (As of November 30, 2016) $150.11
Estimated Upside / (Downside) (1.8%)
Investment Thesis
1. Strong customer loyalty and membership program drives continued revenue growth in warehouses 2. Expensive stock within a retail industry experiencing heavy headwinds and competition, specifically from online retail 3. Expanding internationally yet control over supply chain becomes increasingly difficult in foreign markets
54
Alaska Air Group t
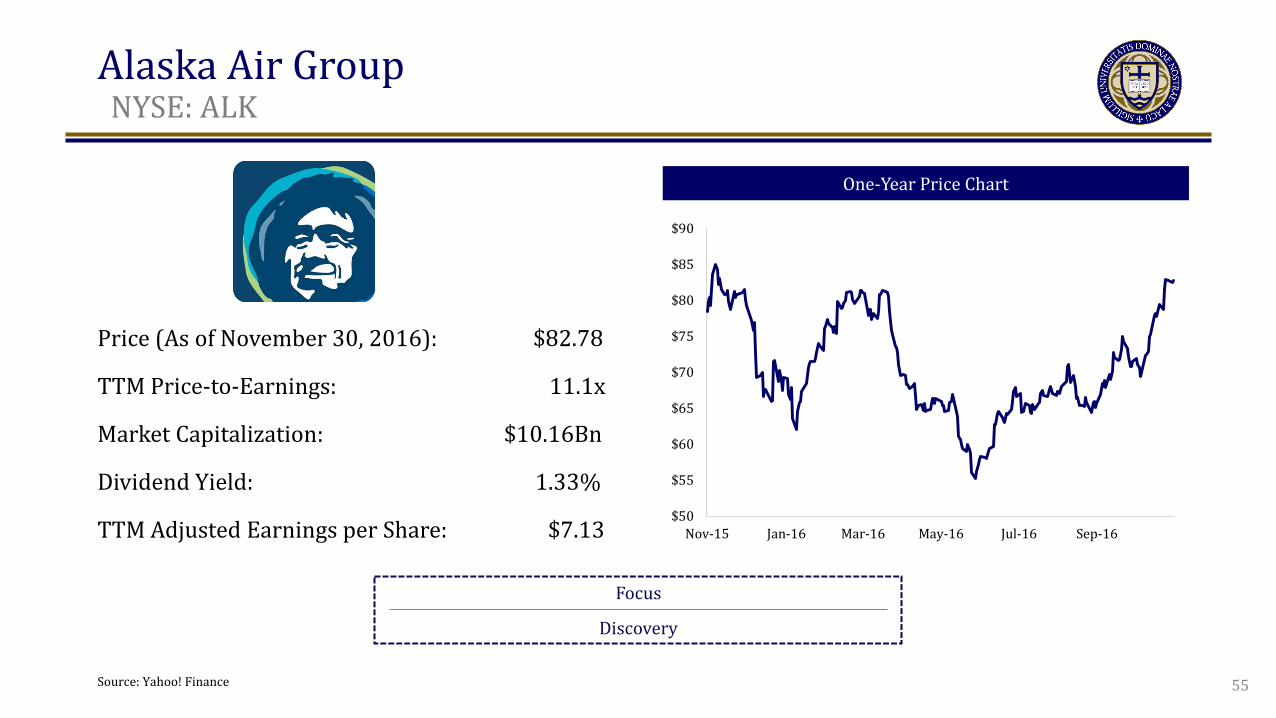
NYSE: ALK
One-Year Price Chart
Focus
Discovery
Price (As of November 30, 2016): $82.78
TTM Price-to-Earnings: 11.1x
Market Capitalization: $10.16Bn
Dividend Yield: 1.33%
TTM Adjusted Earnings per Share: $7.13
Source: Yahoo! Finance
$50
$55
$60
$65
$70
$75
$80
$85
$90
Nov-15 Jan-16 Mar-16 May-16 Jul-16 Sep-16
55
Alaska Air Group t
Discovery
Source: AIM / LaGuardia 2016
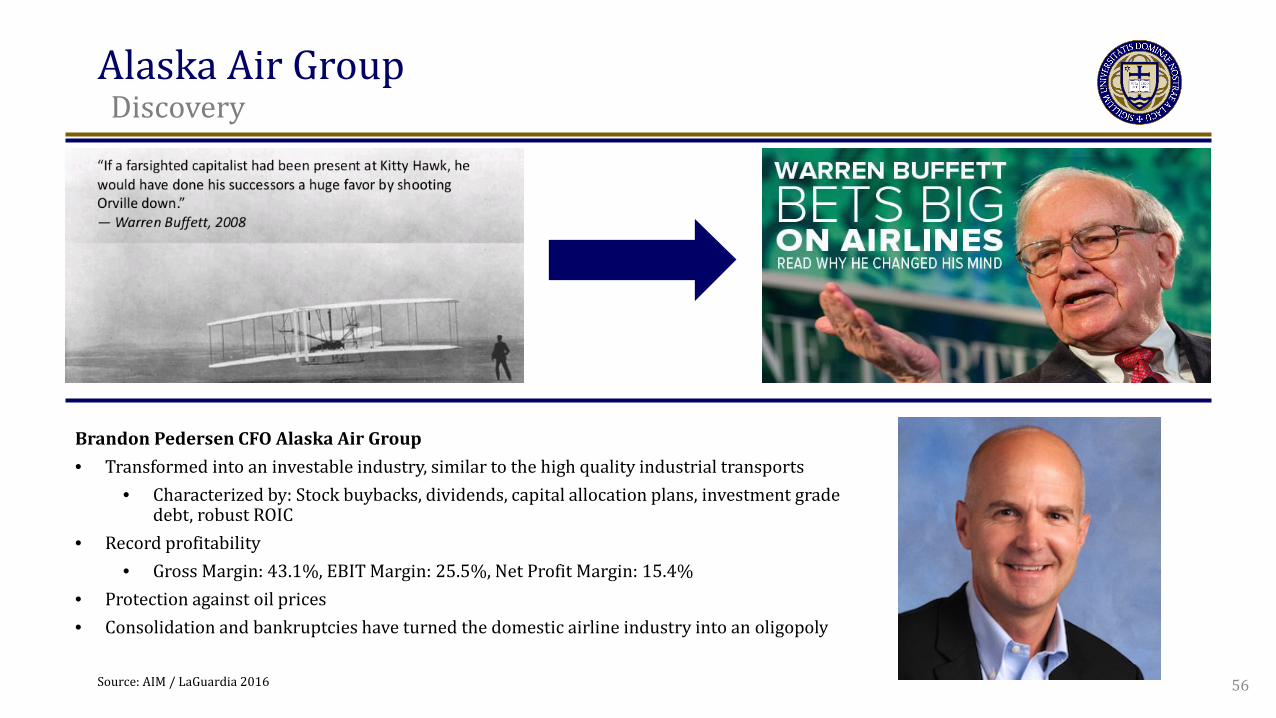
Brandon Pedersen CFO Alaska Air Group • Transformed into an investable industry, similar to the high quality industrial transports
• Characterized by: Stock buybacks, dividends, capital allocation plans, investment grade debt, robust ROIC
• Record profitability • Gross Margin: 43.1%, EBIT Margin: 25.5%, Net Profit Margin: 15.4%
• Protection against oil prices • Consolidation and bankruptcies have turned the domestic airline industry into an oligopoly
56
Alaska Air Group t
Valuation, Investment Thesis, and Portfolio Decision
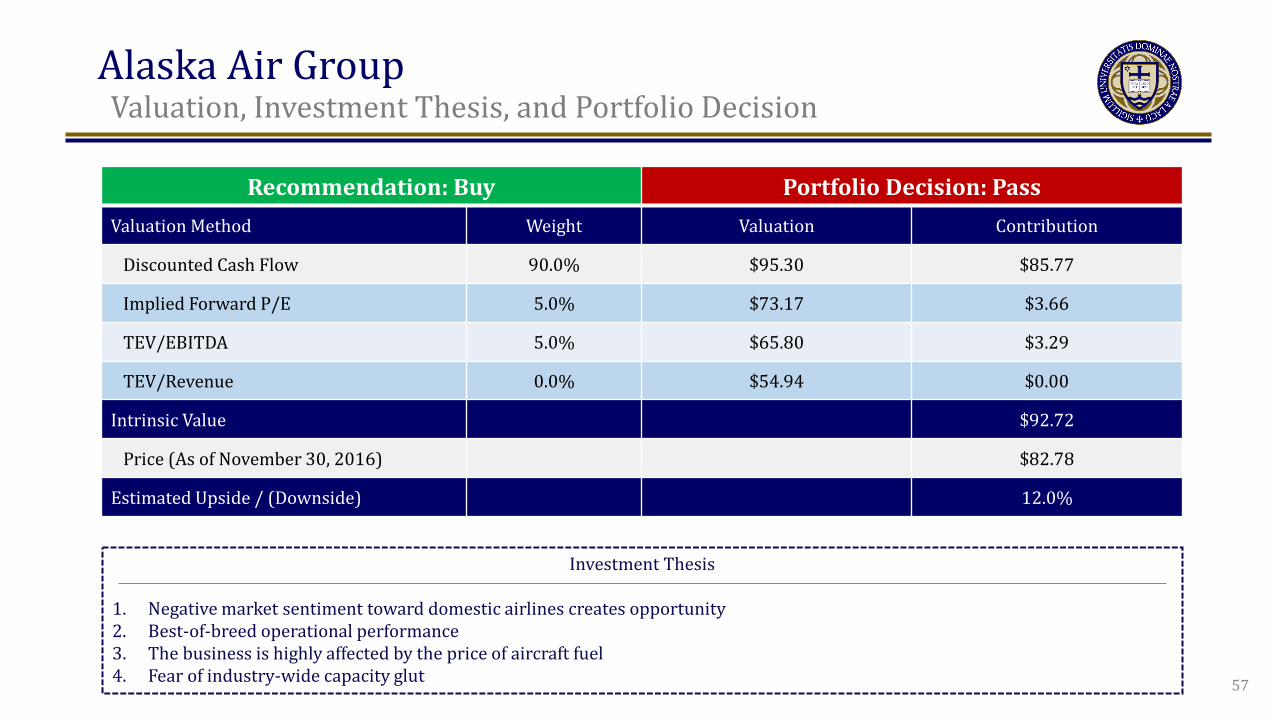
Recommendation: Buy Portfolio Decision: Pass Valuation Method Weight Valuation Contribution
Discounted Cash Flow 90.0% $95.30 $85.77
Implied Forward P/E 5.0% $73.17 $3.66
TEV/EBITDA 5.0% $65.80 $3.29
TEV/Revenue 0.0% $54.94 $0.00
Intrinsic Value $92.72
Price (As of November 30, 2016) $82.78
Estimated Upside / (Downside) 12.0%
Investment Thesis
1. Negative market sentiment toward domestic airlines creates opportunity 2. Best-of-breed operational performance 3. The business is highly affected by the price of aircraft fuel 4. Fear of industry-wide capacity glut 57
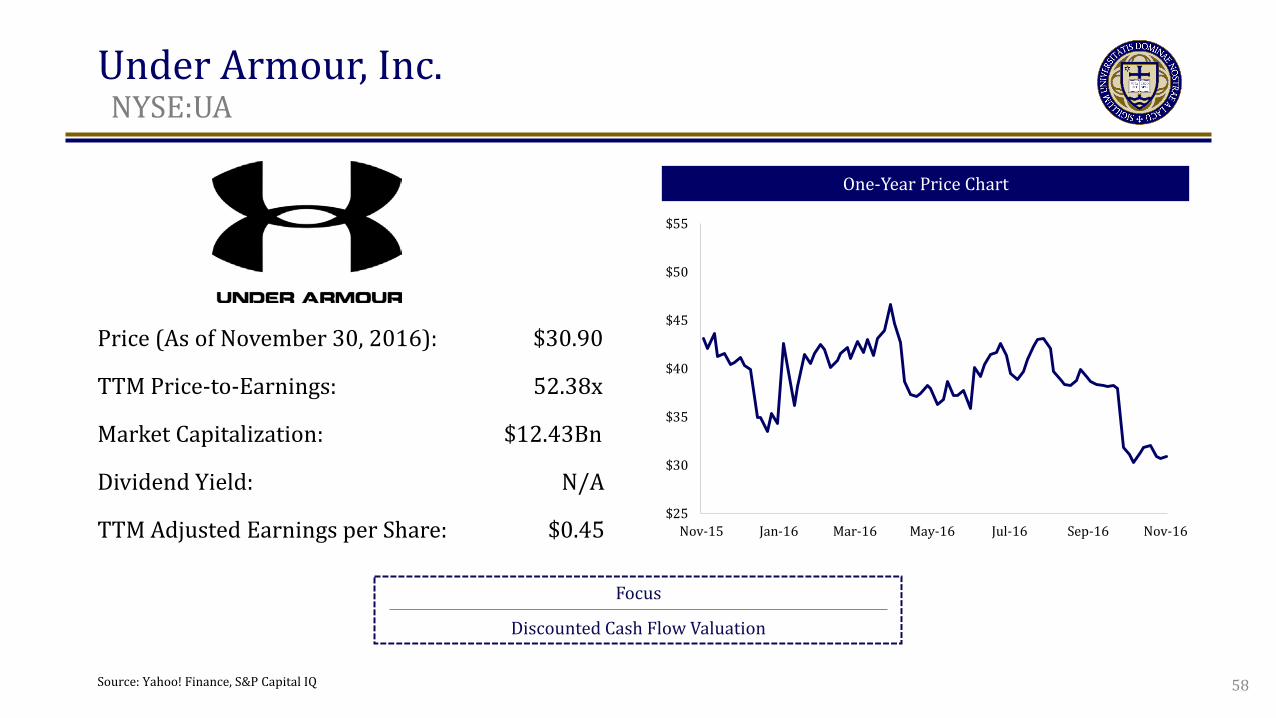
Under Armour, Inc. t
NYSE:UA
One-Year Price Chart
Focus
Discounted Cash Flow Valuation
Price (As of November 30, 2016): $30.90
TTM Price-to-Earnings: 52.38x
Market Capitalization: $12.43Bn
Dividend Yield: N/A
TTM Adjusted Earnings per Share: $0.45
Source: Yahoo! Finance, S&P Capital IQ
$25
$30
$35
$40
$45
$50
$55
Nov-15 Jan-16 Mar-16 May-16 Jul-16 Sep-16 Nov-16
58
Under Armour, Inc. t
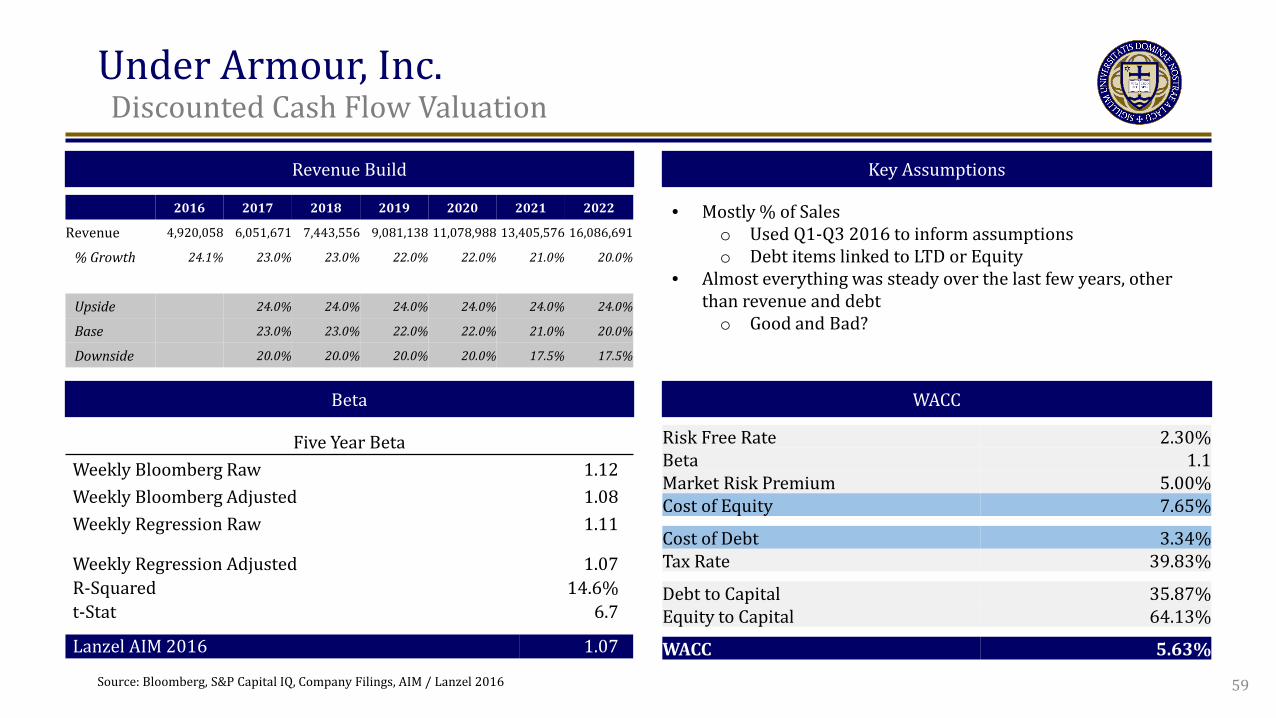
Discounted Cash Flow Valuation
Source: Bloomberg, S&P Capital IQ, Company Filings, AIM / Lanzel 2016
Revenue Build Key Assumptions
• Mostly % of Sales o Used Q1-Q3 2016 to inform assumptions o Debt items linked to LTD or Equity
• Almost everything was steady over the last few years, other than revenue and debt o Good and Bad?
Beta WACC
Risk Free Rate 2.30% Beta 1.1 Market Risk Premium 5.00% Cost of Equity 7.65%
Cost of Debt 3.34% Tax Rate 39.83%
Debt to Capital 35.87% Equity to Capital 64.13%
WACC 5.63%
Five Year Beta Weekly Bloomberg Raw 1.12 Weekly Bloomberg Adjusted 1.08 Weekly Regression Raw 1.11
Weekly Regression Adjusted R-Squared t-Stat
1.07 14.6%
6.7
Lanzel AIM 2016 1.07
59
2016 2017 2018 2019 2020 2021 2022
Revenue 4,920,058 6,051,671 7,443,556 9,081,138 11,078,988 13,405,576 16,086,691
% Growth 24.1% 23.0% 23.0% 22.0% 22.0% 21.0% 20.0%
Upside 24.0% 24.0% 24.0% 24.0% 24.0% 24.0%
Base 23.0% 23.0% 22.0% 22.0% 21.0% 20.0%
Downside 20.0% 20.0% 20.0% 20.0% 17.5% 17.5%
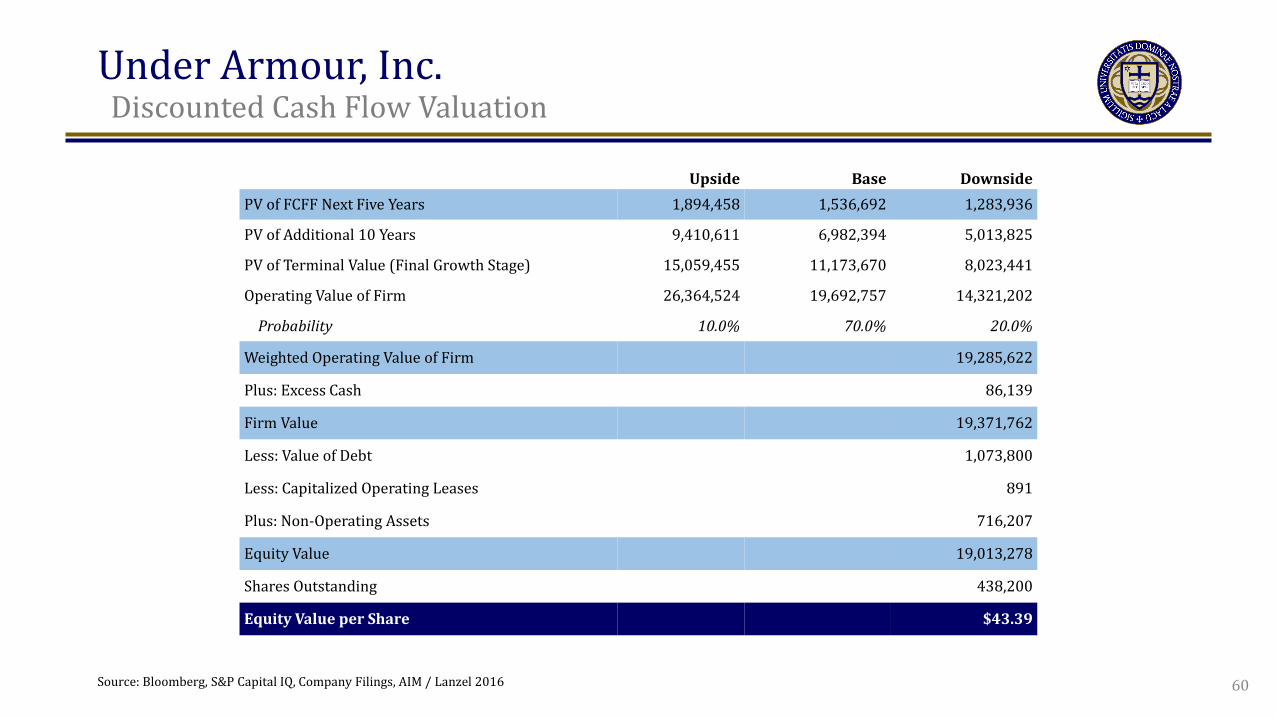
Under Armour, Inc. t
Discounted Cash Flow Valuation
Source: Bloomberg, S&P Capital IQ, Company Filings, AIM / Lanzel 2016 60
Upside Base Downside PV of FCFF Next Five Years 1,894,458 1,536,692 1,283,936
PV of Additional 10 Years 9,410,611 6,982,394 5,013,825
PV of Terminal Value (Final Growth Stage) 15,059,455 11,173,670 8,023,441
Operating Value of Firm 26,364,524 19,692,757 14,321,202
Probability 10.0% 70.0% 20.0%
Weighted Operating Value of Firm 19,285,622
Plus: Excess Cash 86,139
Firm Value 19,371,762
Less: Value of Debt 1,073,800
Less: Capitalized Operating Leases 891
Plus: Non-Operating Assets 716,207
Equity Value 19,013,278
Shares Outstanding 438,200
Equity Value per Share $43.39
Under Armour, Inc. t
Valuation, Investment Thesis, and Portfolio Decision
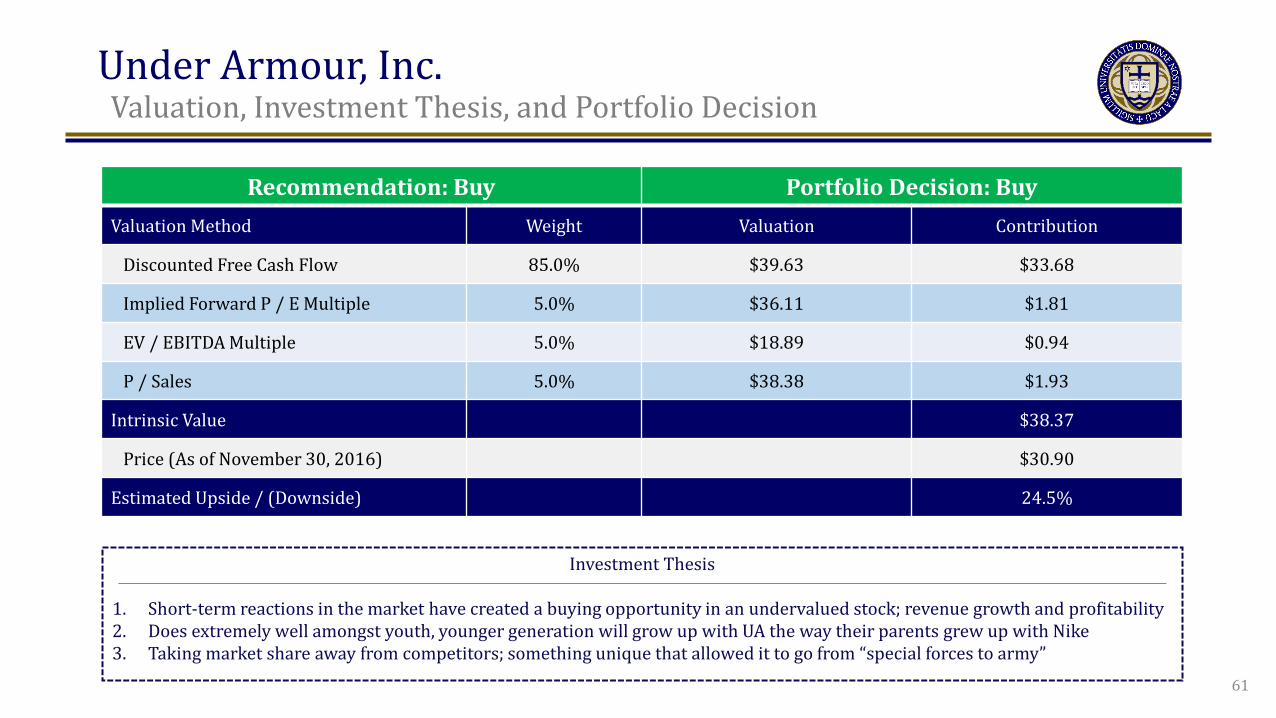
Recommendation: Buy Portfolio Decision: Buy Valuation Method Weight Valuation Contribution
Discounted Free Cash Flow 85.0% $39.63 $33.68
Implied Forward P / E Multiple 5.0% $36.11 $1.81
EV / EBITDA Multiple 5.0% $18.89 $0.94
P / Sales 5.0% $38.38 $1.93
Intrinsic Value $38.37
Price (As of November 30, 2016) $30.90
Estimated Upside / (Downside) 24.5%
Investment Thesis
1. Short-term reactions in the market have created a buying opportunity in an undervalued stock; revenue growth and profitability 2. Does extremely well amongst youth, younger generation will grow up with UA the way their parents grew up with Nike 3. Taking market share away from competitors; something unique that allowed it to go from “special forces to army”
61

Verisk Analytics t
Nasdaq: VRSK
One-Year Price Chart
Focus
Company & Industry Overview
Price (As of November 30, 2016): $83.88
TTM Price-to-Earnings: 24.2x
Market Capitalization: $14.05Bn
Beta: 0.65
TTM Adjusted Earnings per Share: $3.47
Source: Yahoo! Finance 62

Verisk Analytics t
Development of VRSK Business Model
1971: Insurance
Services Office (ISO) started as a not-for-profit
1997: Acquired American Insurance
Group (AISG) for large
insurance claim database
1998: Acquired National
Insurance Crime Bureau
2002: Acquired AIR, a
technology leader in
catastrophe modeling
2004: Entered Healthcare
space
2005: Entered mortgage
market
2006: Acquired Xactware, estimating
software for business/const
ruction
2009: IPO of Verisk
Analytics
2011-2015: Various
Acquisitions
1997: Converted to for-profit with ESOP structure
1971: Founded as not-for-profit advisory organization 2009: Began trading on Nasdaq
63 Source: Company Filings
Verisk Analytics t
Strong Competitive Moat Coupled with High Growth
Company Overview Historical Segment Revenue
FY2015 Risk Assessment Segment FY2015 Decision Analytics Segment
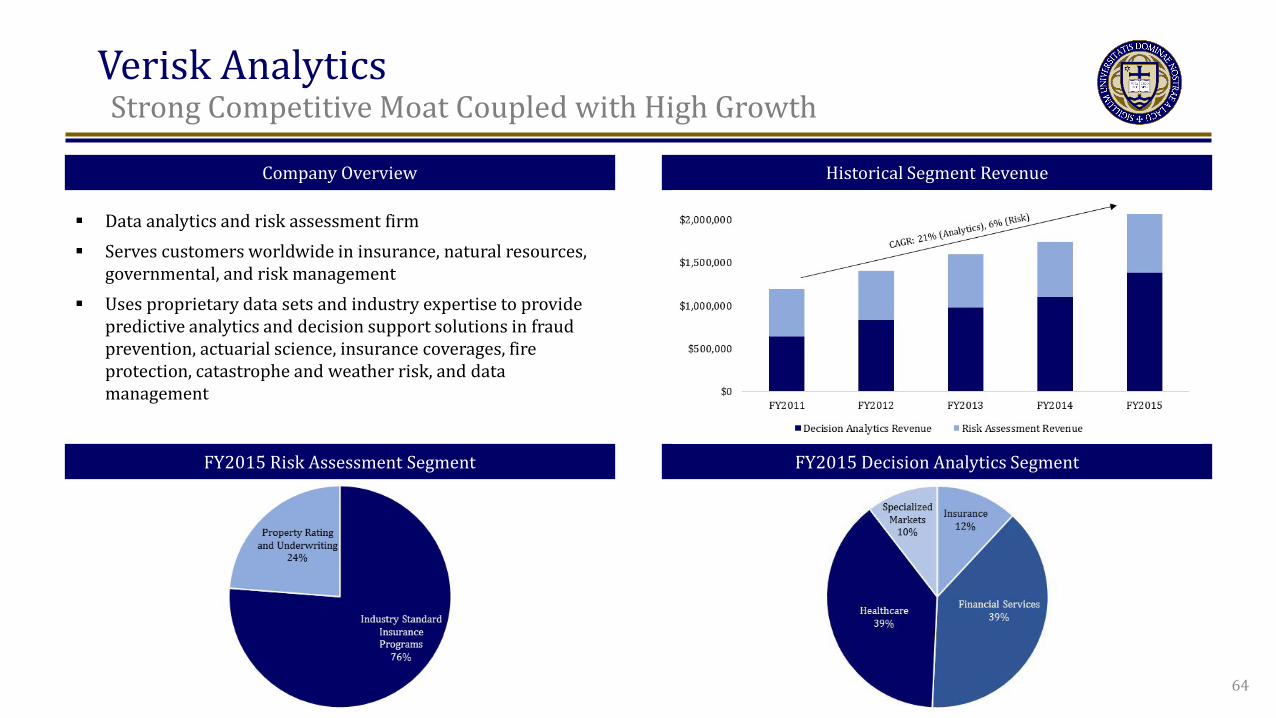
Data analytics and risk assessment firm Serves customers worldwide in insurance, natural resources,
governmental, and risk management Uses proprietary data sets and industry expertise to provide
predictive analytics and decision support solutions in fraud prevention, actuarial science, insurance coverages, fire protection, catastrophe and weather risk, and data management
64
Verisk Analytics t
Valuation, Investment Thesis, and Portfolio Decision
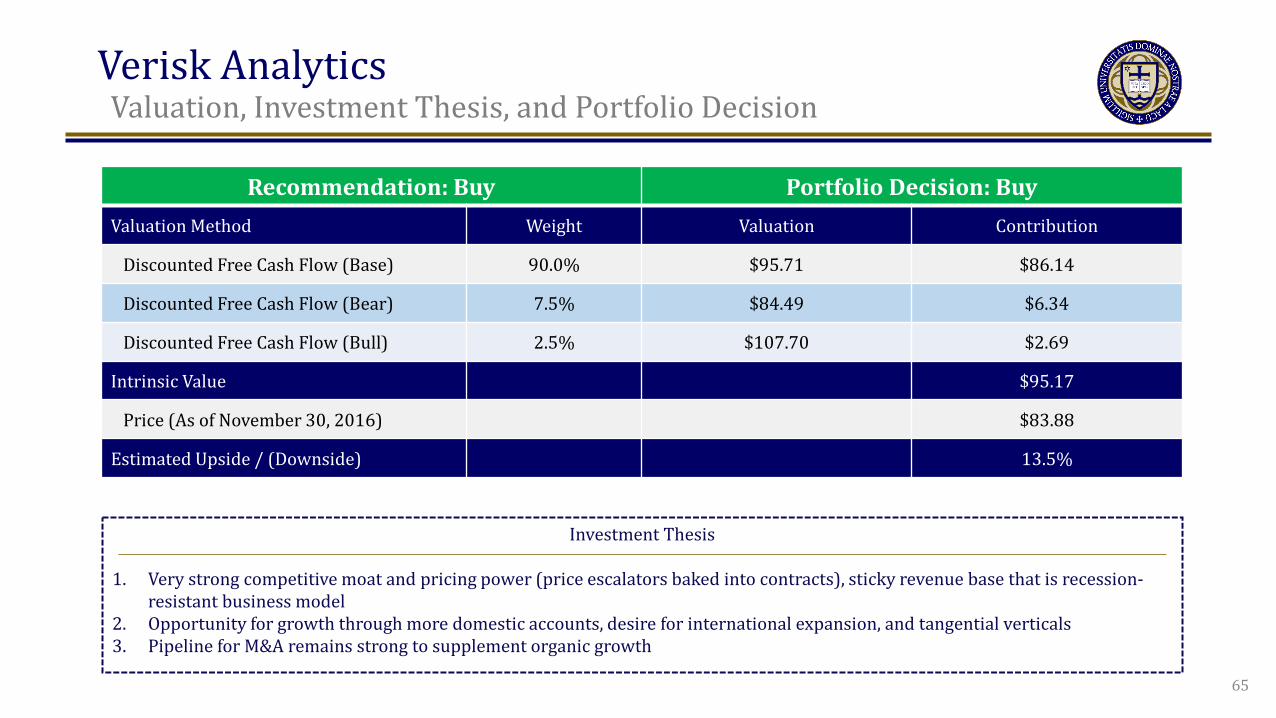
Recommendation: Buy Portfolio Decision: Buy Valuation Method Weight Valuation Contribution
Discounted Free Cash Flow (Base) 90.0% $95.71 $86.14
Discounted Free Cash Flow (Bear) 7.5% $84.49 $6.34
Discounted Free Cash Flow (Bull) 2.5% $107.70 $2.69
Intrinsic Value $95.17
Price (As of November 30, 2016) $83.88
Estimated Upside / (Downside) 13.5%
Investment Thesis
1. Very strong competitive moat and pricing power (price escalators baked into contracts), sticky revenue base that is recession-resistant business model
2. Opportunity for growth through more domestic accounts, desire for international expansion, and tangential verticals 3. Pipeline for M&A remains strong to supplement organic growth
65
Buffalo Wild Wings t
Nasdaq: BWLD
One-Year Price Chart
Focus
Discounted Cash Flow Valuation
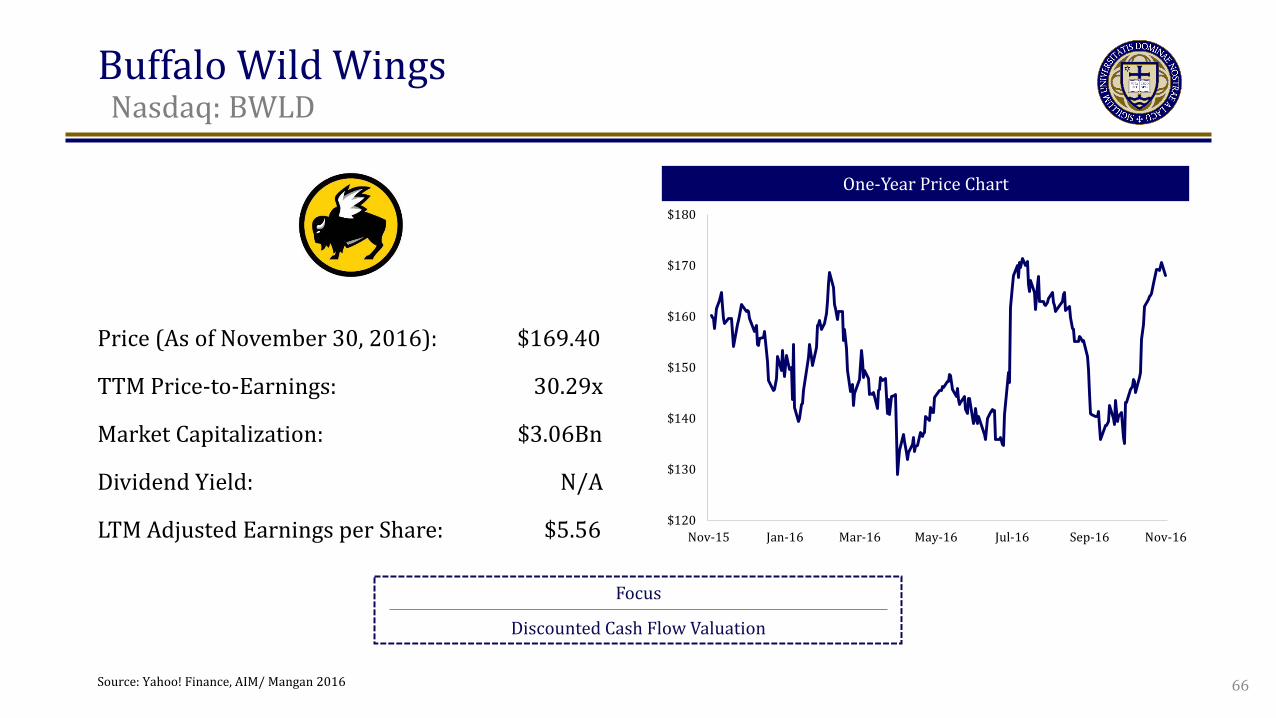
Price (As of November 30, 2016): $169.40
TTM Price-to-Earnings: 30.29x
Market Capitalization: $3.06Bn
Dividend Yield: N/A
LTM Adjusted Earnings per Share: $5.56
Source: Yahoo! Finance, AIM/ Mangan 2016
$120
$130
$140
$150
$160
$170
$180
Nov-15 Jan-16 Mar-16 May-16 Jul-16 Sep-16 Nov-16
66
Buffalo Wild Wings t
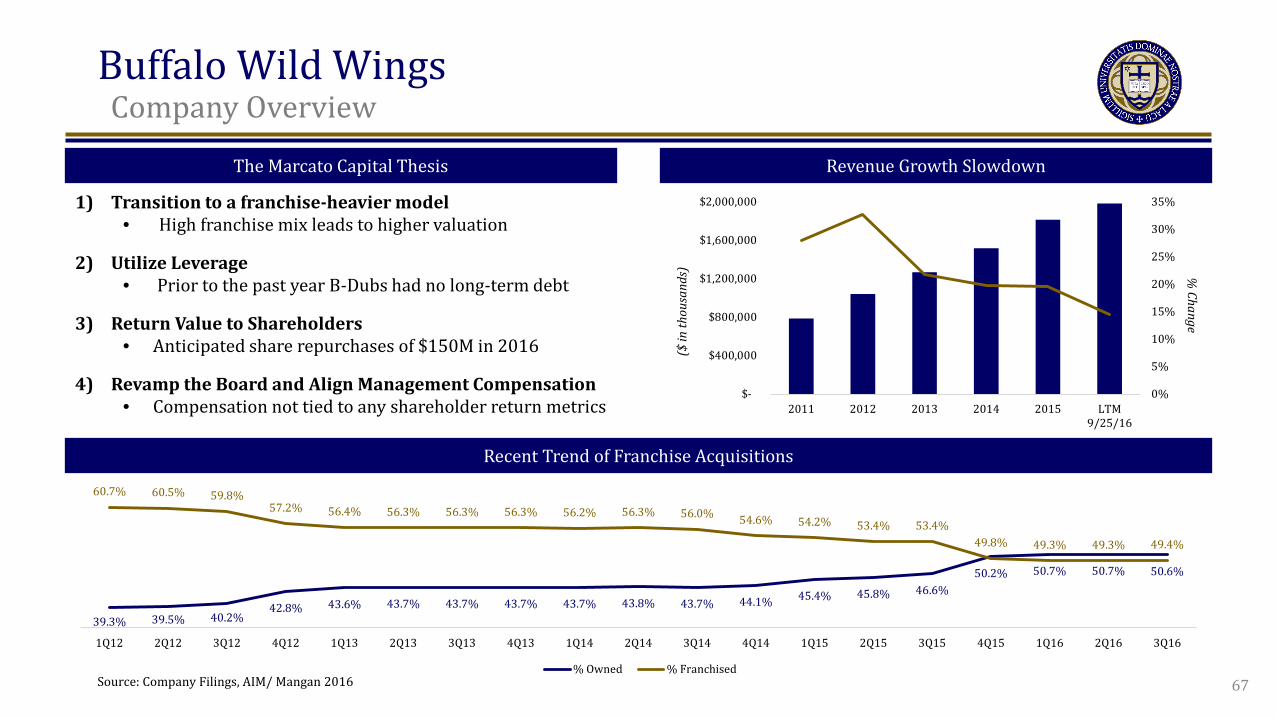
Company Overview
0%
5%
10%
15%
20%
25%
30%
35%
$-
$400,000
$800,000
$1,200,000
$1,600,000
$2,000,000
2011 2012 2013 2014 2015 LTM9/25/16
% Change
($ in
thou
sand
s)
Recent Trend of Franchise Acquisitions
Revenue Growth Slowdown The Marcato Capital Thesis
1) Transition to a franchise-heavier model • High franchise mix leads to higher valuation
2) Utilize Leverage • Prior to the past year B-Dubs had no long-term debt
3) Return Value to Shareholders • Anticipated share repurchases of $150M in 2016
4) Revamp the Board and Align Management Compensation • Compensation not tied to any shareholder return metrics
39.3% 39.5% 40.2% 42.8% 43.6% 43.7% 43.7% 43.7% 43.7% 43.8% 43.7% 44.1% 45.4% 45.8% 46.6%
50.2% 50.7% 50.7% 50.6%
60.7% 60.5% 59.8% 57.2% 56.4% 56.3% 56.3% 56.3% 56.2% 56.3% 56.0% 54.6% 54.2% 53.4% 53.4%
49.8% 49.3% 49.3% 49.4%
1Q12 2Q12 3Q12 4Q12 1Q13 2Q13 3Q13 4Q13 1Q14 2Q14 3Q14 4Q14 1Q15 2Q15 3Q15 4Q15 1Q16 2Q16 3Q16
% Owned % Franchised67 Source: Company Filings, AIM/ Mangan 2016
Buffalo Wild Wings t
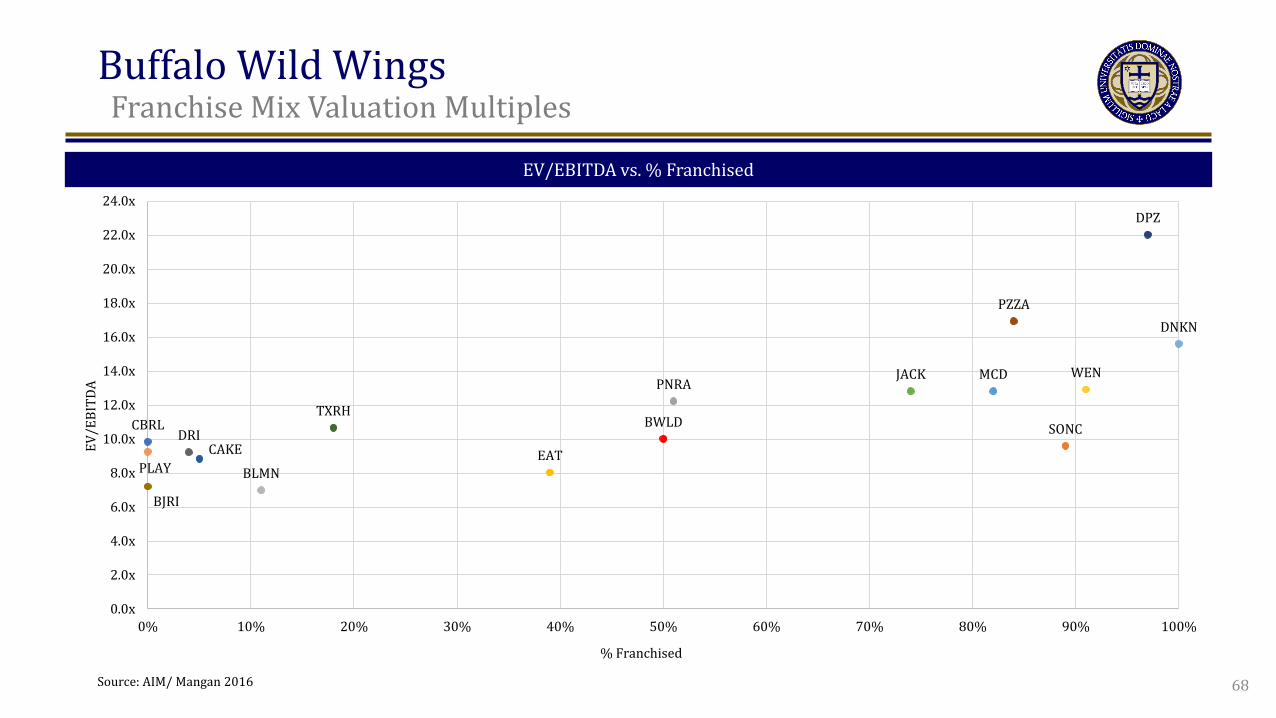
Franchise Mix Valuation Multiples
EV/EBITDA vs. % Franchised
68
MCD
SONC
PNRA
EAT
CBRL
JACK
CAKE
PZZA
DRI
BJRI
DPZ
TXRH
DNKN
PLAY BLMN
WEN
BWLD
0.0x
2.0x
4.0x
6.0x
8.0x
10.0x
12.0x
14.0x
16.0x
18.0x
20.0x
22.0x
24.0x
0% 10% 20% 30% 40% 50% 60% 70% 80% 90% 100%
EV/E
BITD
A
% Franchised
Source: AIM/ Mangan 2016
Buffalo Wild Wings t
Discounted Cash Flow Valuation
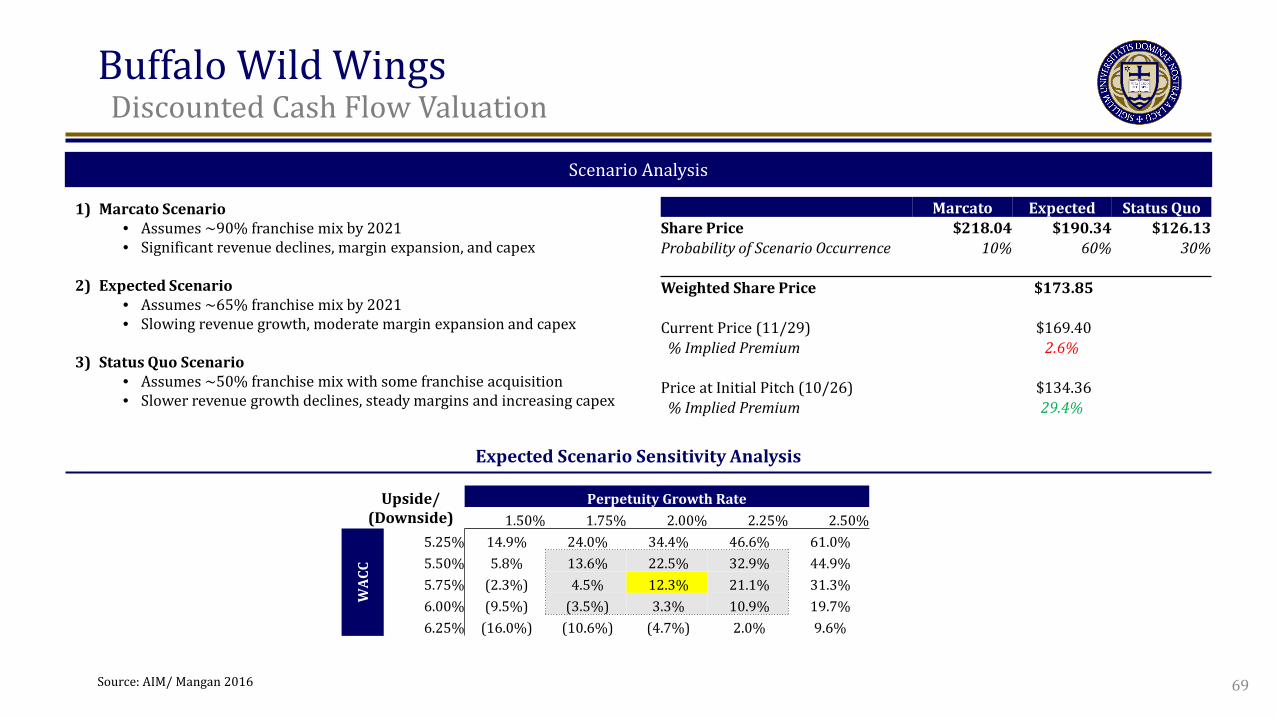
Scenario Analysis
Marcato Expected Status Quo Share Price $218.04 $190.34 $126.13 Probability of Scenario Occurrence 10% 60% 30% Weighted Share Price $173.85 Current Price (11/29) $169.40 % Implied Premium 2.6%
Price at Initial Pitch (10/26) $134.36 % Implied Premium 29.4%
1) Marcato Scenario • Assumes ~90% franchise mix by 2021 • Significant revenue declines, margin expansion, and capex
2) Expected Scenario • Assumes ~65% franchise mix by 2021 • Slowing revenue growth, moderate margin expansion and capex
3) Status Quo Scenario • Assumes ~50% franchise mix with some franchise acquisition • Slower revenue growth declines, steady margins and increasing capex
Expected Scenario Sensitivity Analysis
Perpetuity Growth Rate 1.50% 1.75% 2.00% 2.25% 2.50%
WAC
C
5.25% 14.9% 24.0% 34.4% 46.6% 61.0% 5.50% 5.8% 13.6% 22.5% 32.9% 44.9% 5.75% (2.3%) 4.5% 12.3% 21.1% 31.3% 6.00% (9.5%) (3.5%) 3.3% 10.9% 19.7% 6.25% (16.0%) (10.6%) (4.7%) 2.0% 9.6%
Upside/ (Downside)
69 Source: AIM/ Mangan 2016

Buffalo Wild Wings t
Valuation, Investment Thesis, and Portfolio Decision
Recommendation: Pass Portfolio Decision: Pass Valuation Method Weight Valuation Contribution
Discounted Free Cash Flow 90.0% $173.85 $156.46
Implied Forward P/E Multiple 2.5% $127.39 $3.18
Implied EV/EBITDA Multiple 2.5% $116.36 $2.91
Franchise Mix Valuation Multiple 5.0% $169.25 $8.48
Intrinsic Value $171.02
Price (As of November 30, 2016) $169.40
Estimated Upside / (Downside) 1.0%
Investment Thesis
1. Declining revenue growth and questionable capital allocation decisions led to stock struggles and activist interest 2. Potential for excess return exists through refranchising and capital optimization – all depends on management’s ability to do so 3. Uncertainty around future strategy and expensive current price make B-Dubs a risky opportunity with a depressed upside
70
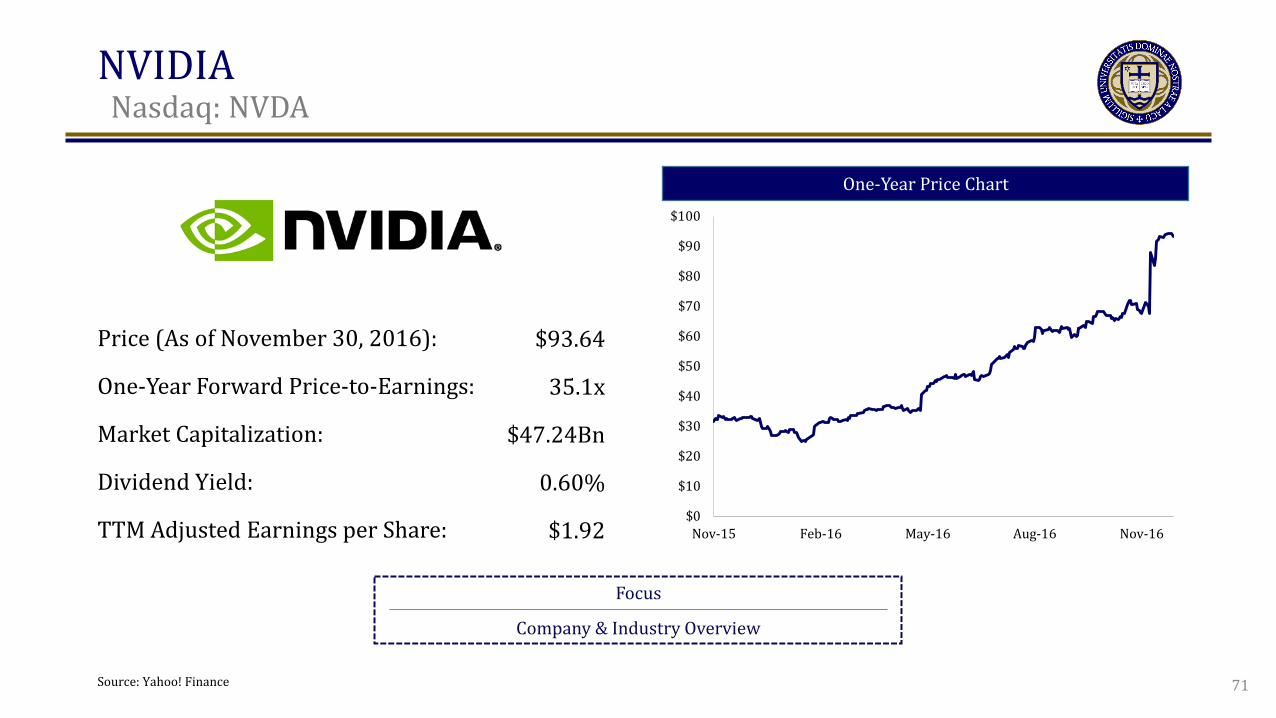
NVIDIA t
Nasdaq: NVDA
One-Year Price Chart
Focus
Company & Industry Overview
Price (As of November 30, 2016):
One-Year Forward Price-to-Earnings:
Market Capitalization:
Dividend Yield:
TTM Adjusted Earnings per Share:
Source: Yahoo! Finance
$0
$10
$20
$30
$40
$50
$60
$70
$80
$90
$100
Nov-15 Feb-16 May-16 Aug-16 Nov-16
$93.64
35.1x
$47.24Bn
0.60%
$1.92
71
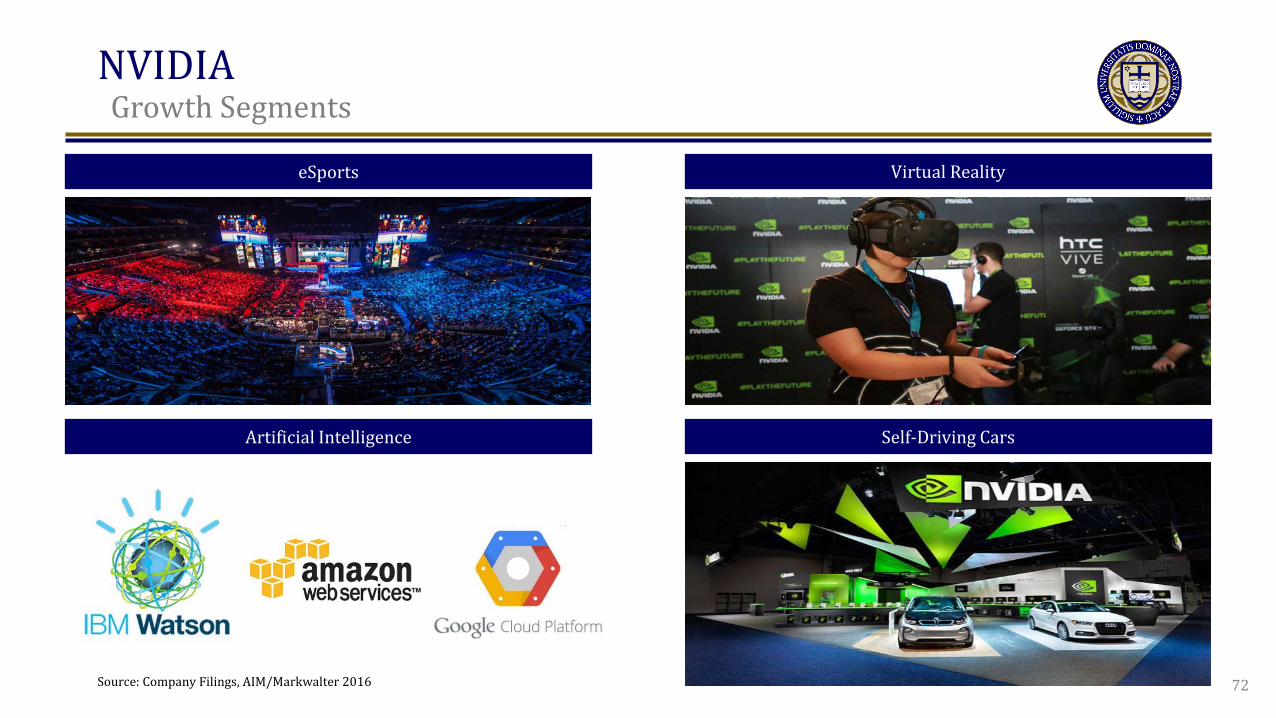
NVIDIA t
Growth Segments
Virtual Reality
Self-Driving Cars Artificial Intelligence
eSports
Source: Company Filings, AIM/Markwalter 2016 72

NVIDIA t
Valuation, Investment Thesis, and Portfolio Decision
Recommendation: Buy Portfolio Decision: Buy Valuation Method Weight Valuation Contribution
Discounted Free Cash Flow 100.0% $102.36 $102.36
Implied Forward P/E Multiple 0.0% $32.47 $0.00
Implied Forward EV/Revenue Multiple 0.0% $39.35 $0.00
Implied Forward EV/EBITDA Multiple 0.0% $34.97 $0.00
Intrinsic Value $102.36
Price (As of November 30, 2016) $92.20
Estimated Upside / (Downside) 11.0%
Investment Thesis
1. Artificial intelligence hardware market is not as competitive as the sell-side analysts believe it to be. 2. The market for artificial intelligence is larger than analysts believe it to be. 3. NVIDIA has a sustainable competitive advantage within the GPU market for the coming years.
73
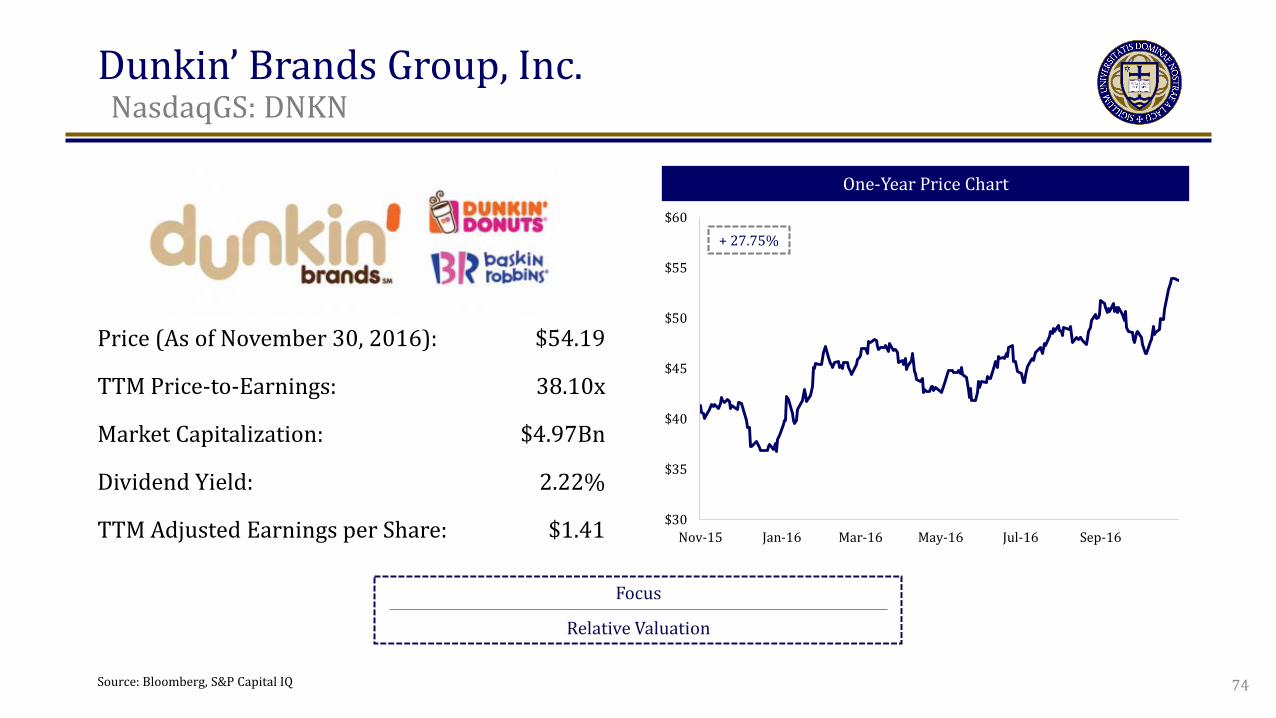
Dunkin’ Brands Group, Inc. t
NasdaqGS: DNKN
One-Year Price Chart
Focus
Relative Valuation
Price (As of November 30, 2016): $54.19
TTM Price-to-Earnings: 38.10x
Market Capitalization: $4.97Bn
Dividend Yield: 2.22%
TTM Adjusted Earnings per Share: $1.41
Source: Bloomberg, S&P Capital IQ
$30
$35
$40
$45
$50
$55
$60
Nov-15 Jan-16 Mar-16 May-16 Jul-16 Sep-16
+ 27.75%
74

Dunkin’ Brands Group, Inc. t
Dunkin’ Donuts U.S. Medium- to Long-Term Expansion
Average Initial Capital Requirement: $485,000 Average Annual Revenue: $900,000 Cash-on-Cash Return: 20.0%
Mid-West & West New Store Economics
Operational Initiatives
Comparable Stores Sales Growth: 38/39 Q’s Total Cost Savings Since 2014: $250.0mm
Source: Bloomberg, S&P Capital IQ 75
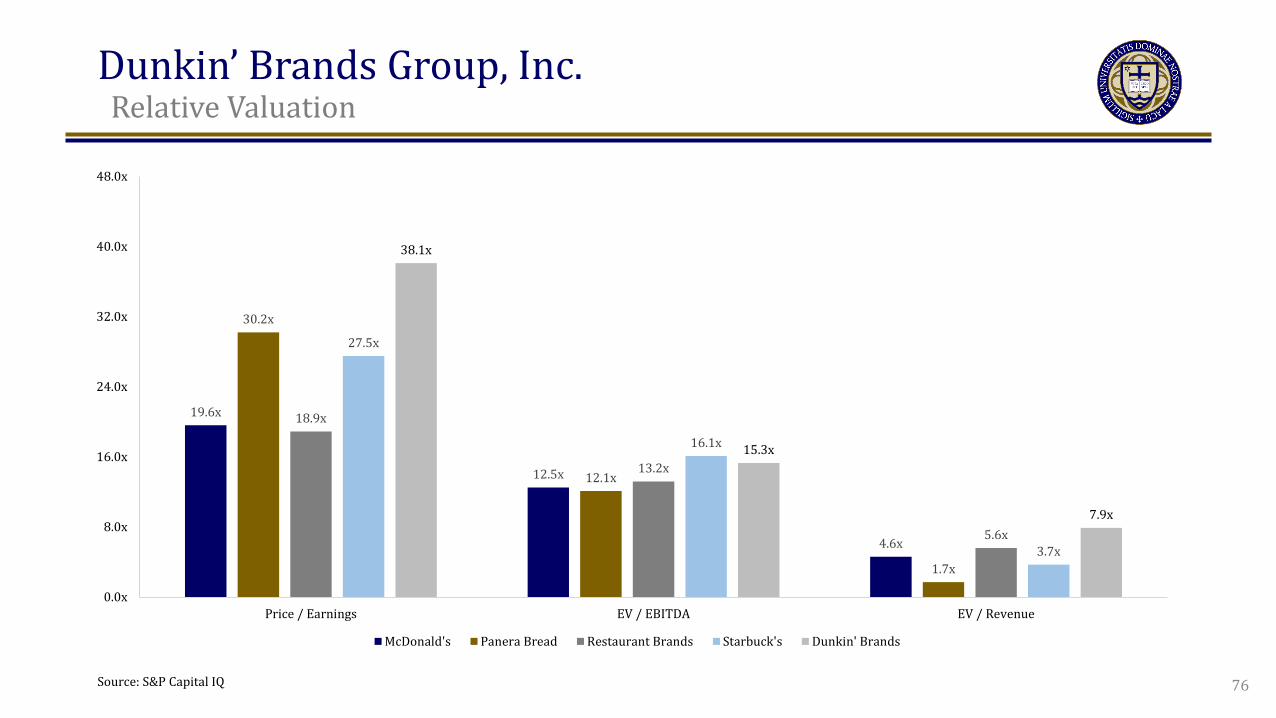
Dunkin’ Brands Group, Inc. t
Relative Valuation
19.6x
12.5x
4.6x
30.2x
12.1x
1.7x
18.9x
13.2x
5.6x
27.5x
16.1x
3.7x
38.1x
15.3x
7.9x
0.0x
8.0x
16.0x
24.0x
32.0x
40.0x
48.0x
Price / Earnings EV / EBITDA EV / Revenue
McDonald's Panera Bread Restaurant Brands Starbuck's Dunkin' Brands
Source: S&P Capital IQ 76
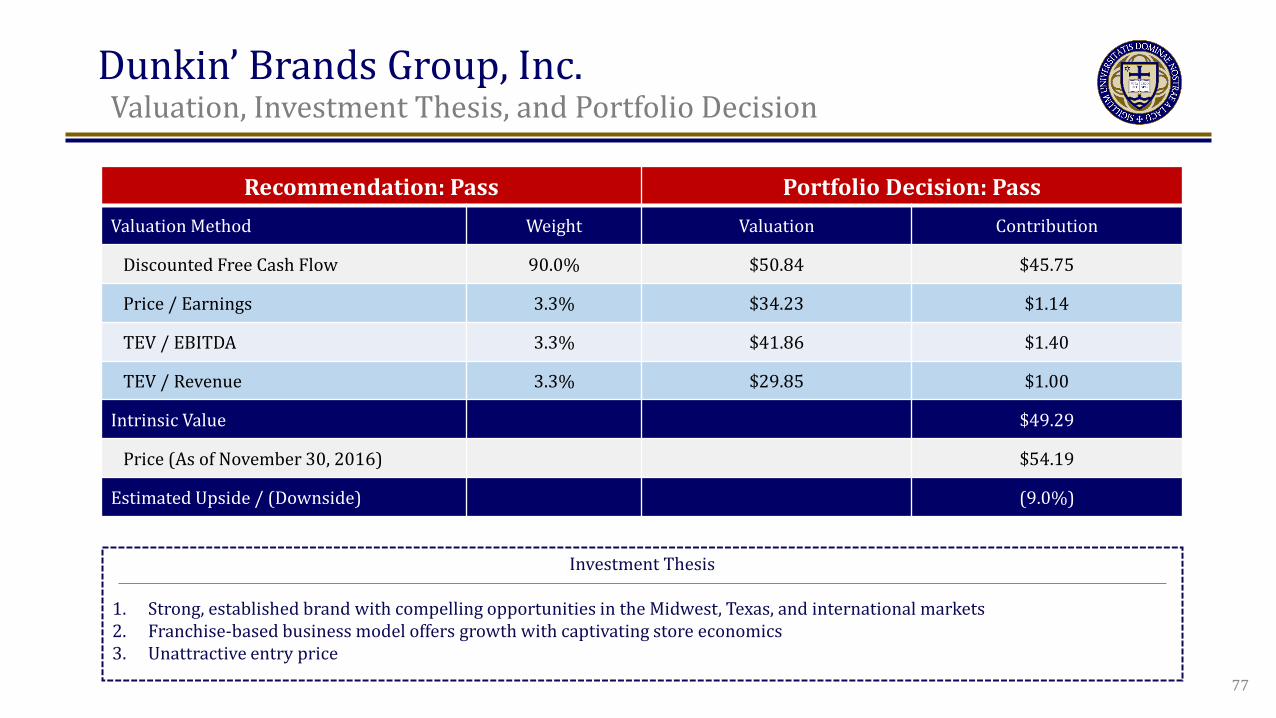
Dunkin’ Brands Group, Inc. t
Valuation, Investment Thesis, and Portfolio Decision
Recommendation: Pass Portfolio Decision: Pass Valuation Method Weight Valuation Contribution
Discounted Free Cash Flow 90.0% $50.84 $45.75
Price / Earnings 3.3% $34.23 $1.14
TEV / EBITDA 3.3% $41.86 $1.40
TEV / Revenue 3.3% $29.85 $1.00
Intrinsic Value $49.29
Price (As of November 30, 2016) $54.19
Estimated Upside / (Downside) (9.0%)
Investment Thesis
1. Strong, established brand with compelling opportunities in the Midwest, Texas, and international markets 2. Franchise-based business model offers growth with captivating store economics 3. Unattractive entry price
77
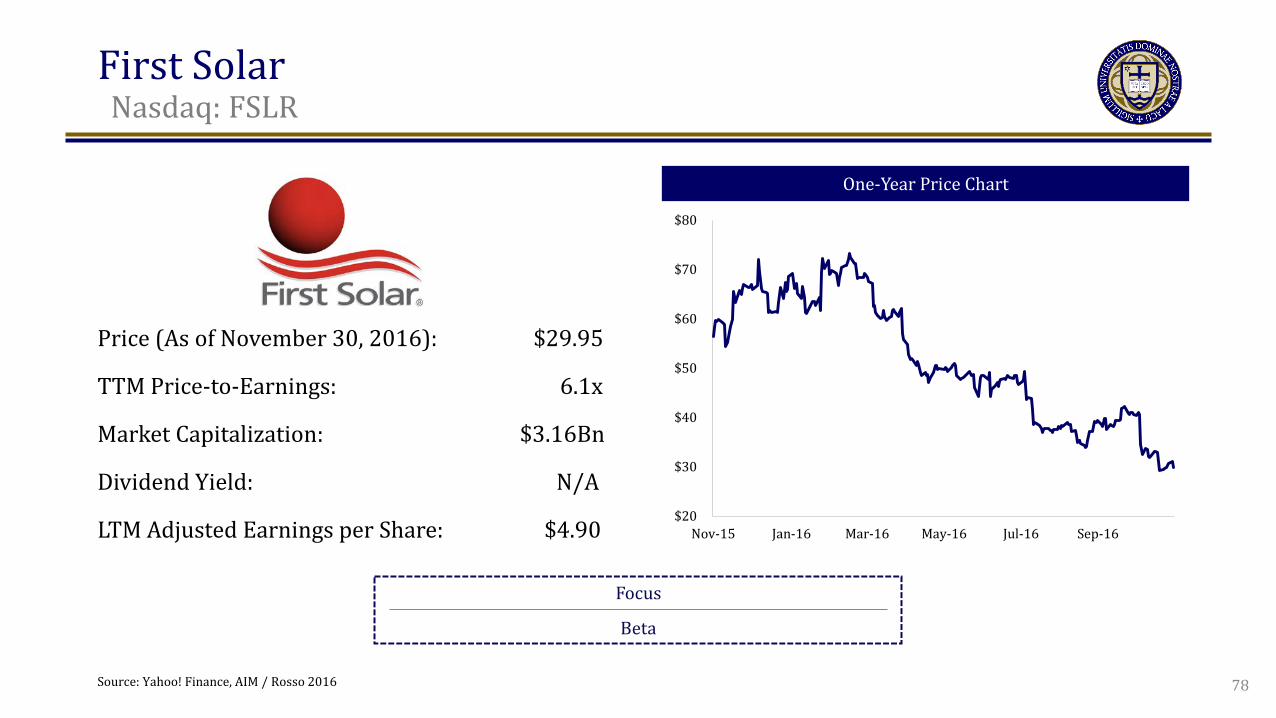
First Solar t
Nasdaq: FSLR
One-Year Price Chart
Focus
Beta
Price (As of November 30, 2016): $29.95
TTM Price-to-Earnings: 6.1x
Market Capitalization: $3.16Bn
Dividend Yield: N/A
LTM Adjusted Earnings per Share: $4.90 $20
$30
$40
$50
$60
$70
$80
Nov-15 Jan-16 Mar-16 May-16 Jul-16 Sep-16
78 Source: Yahoo! Finance, AIM / Rosso 2016
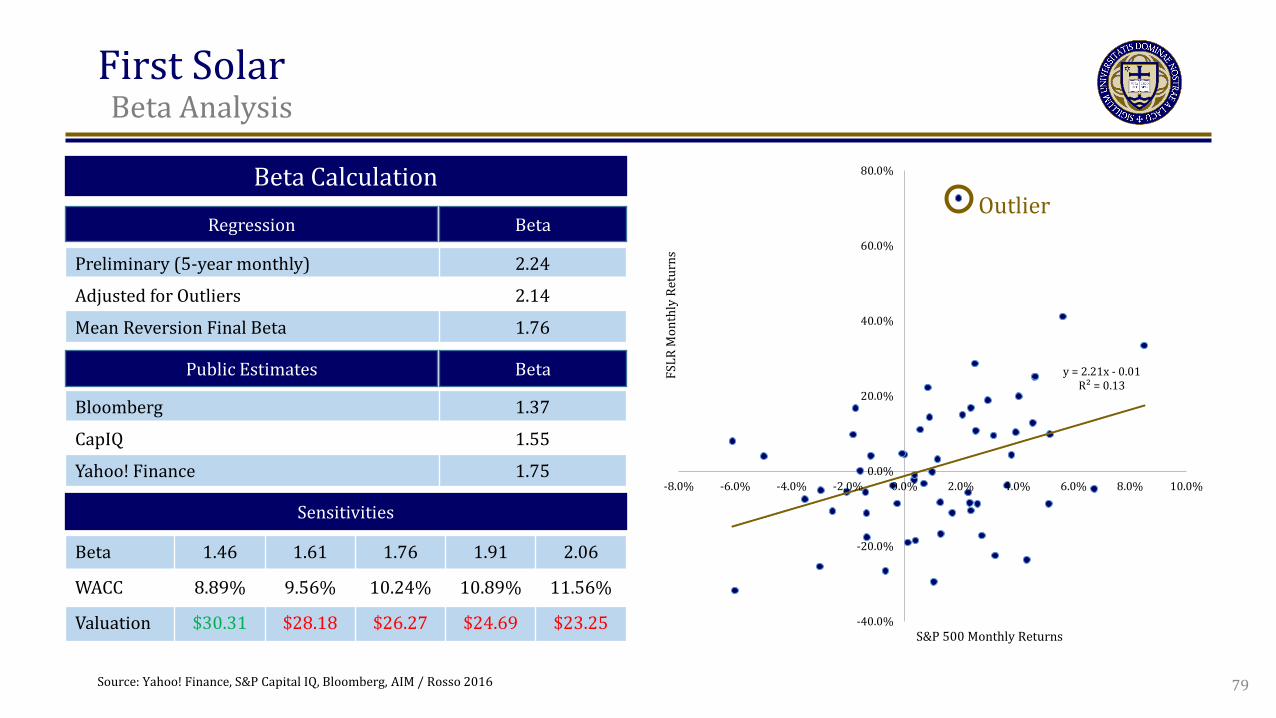
First Solar t
Beta Analysis
Beta Calculation
Regression Beta
Preliminary (5-year monthly) 2.24
Adjusted for Outliers 2.14
Mean Reversion Final Beta 1.76
Public Estimates Beta
Bloomberg 1.37
CapIQ 1.55
Yahoo! Finance 1.75
y = 2.21x - 0.01 R² = 0.13
-40.0%
-20.0%
0.0%
20.0%
40.0%
60.0%
80.0%
-8.0% -6.0% -4.0% -2.0% 0.0% 2.0% 4.0% 6.0% 8.0% 10.0%
FSLR
Mon
thly
Ret
urns
S&P 500 Monthly Returns
Outlier
Sensitivities
Beta 1.46 1.61 1.76 1.91 2.06
WACC 8.89% 9.56% 10.24% 10.89% 11.56%
Valuation $30.31 $28.18 $26.27 $24.69 $23.25
79 Source: Yahoo! Finance, S&P Capital IQ, Bloomberg, AIM / Rosso 2016
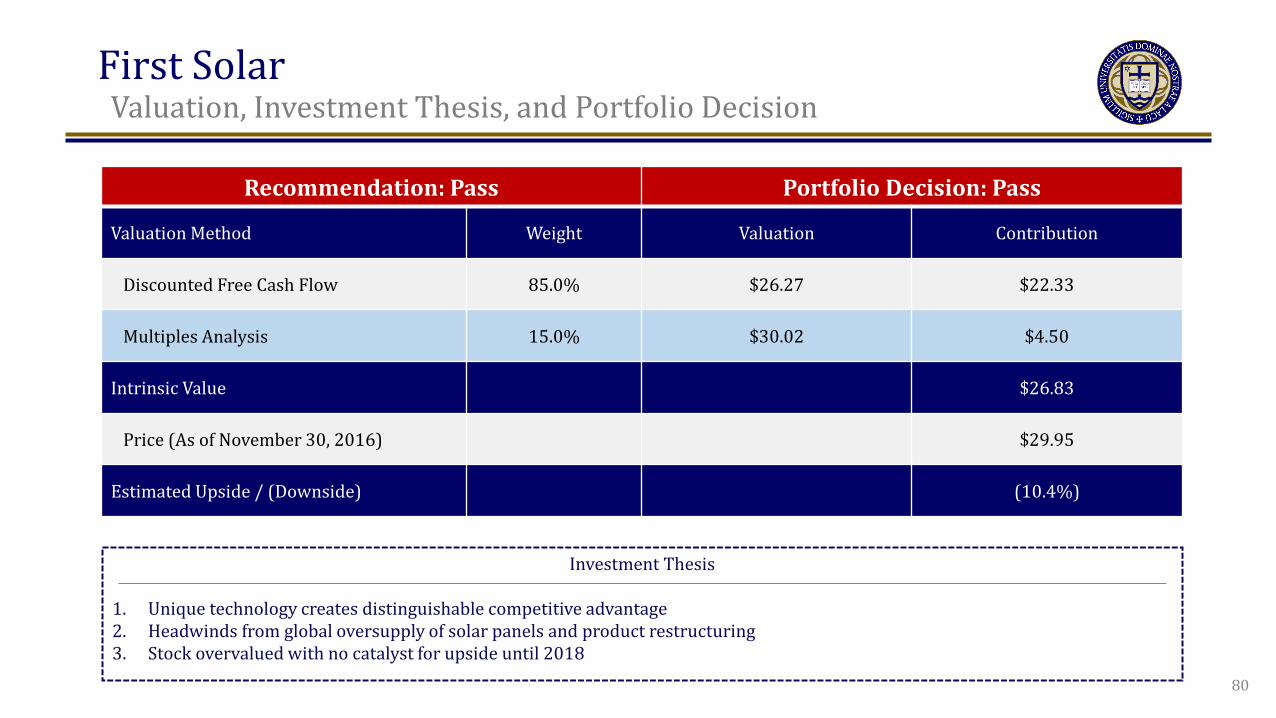
First Solar t
Valuation, Investment Thesis, and Portfolio Decision
Recommendation: Pass Portfolio Decision: Pass
Valuation Method Weight Valuation Contribution
Discounted Free Cash Flow 85.0% $26.27 $22.33
Multiples Analysis 15.0% $30.02 $4.50
Intrinsic Value $26.83
Price (As of November 30, 2016) $29.95
Estimated Upside / (Downside) (10.4%)
Investment Thesis
1. Unique technology creates distinguishable competitive advantage 2. Headwinds from global oversupply of solar panels and product restructuring 3. Stock overvalued with no catalyst for upside until 2018
80

Whitestone REIT t
NYSE: WSR
One-Year Price Chart
Focus
Alternative Valuation Methods
Price (As of November 30, 2016): $13.59
TTM Price-to-Earnings: 10.32x
Market Capitalization: $0.41Bn
Dividend Yield: 8.23%
TTM Adjusted Earnings per Share: $0.32
Source: Yahoo! Finance, AIM / Seymour 2016
$8
$9
$10
$11
$12
$13
$14
$15
$16
$17
Nov-15 Jan-16 Mar-16 May-16 Jul-16 Sep-16
81

Whitestone REIT t
Investment Highlights
Tenant Industry Distribution by Annualized Base Revenue Company Overview
• Whitestone REIT acquires and redevelops “Community
Center Properties”
• Diverse, “internet-resistant” tenant mix
• Grow through acquisitions and unlocking untapped
potential in high-growth, high-income communities
• 12 acquisitions in 2015, 2 YTD 2016; 71 total properties
Annualized Base Revenue by Geography ($ in thousands) Average Median Household Income ($ in thousands)
Services and Entertainment
23%
Dining 21%
Health & Wellness
20%
Specialty Retail 17%
Grocery 13%
Education 6%
77.4 75.7 70.5 60.3 58.7 57.1 53.8 52.7
FRT WSR REG KIM EQY DDR BRX WRI
Source: WSR 10-K, WSR August 2016 Investor Presentation, AIM / Seymour 2016 82
$5,329 $710
$10,726
$22,319 $26,735
$3,762
$0$5,000
$10,000$15,000$20,000$25,000$30,000
Austin Chicago Dallas Houston Phoenix San Antonio
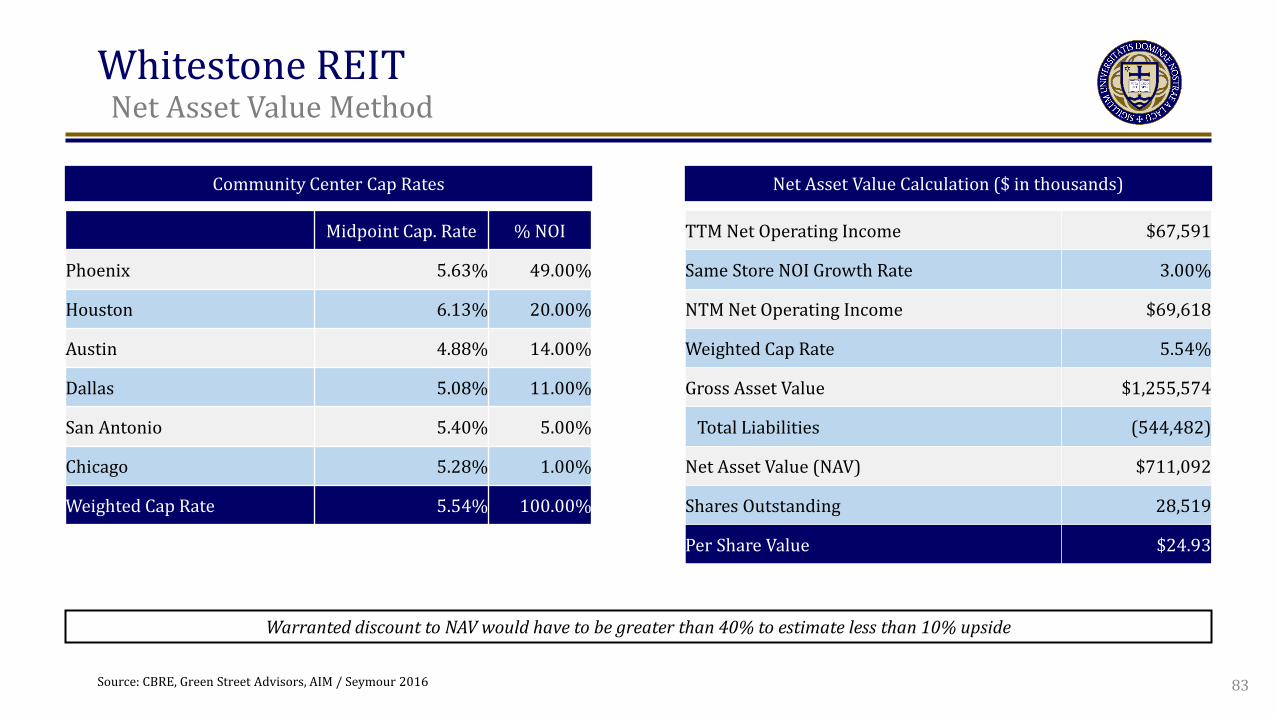
Whitestone REIT t
Net Asset Value Method
Community Center Cap Rates
Source: CBRE, Green Street Advisors, AIM / Seymour 2016
Midpoint Cap. Rate % NOI
Phoenix 5.63% 49.00%
Houston 6.13% 20.00%
Austin 4.88% 14.00%
Dallas 5.08% 11.00%
San Antonio 5.40% 5.00%
Chicago 5.28% 1.00%
Weighted Cap Rate 5.54% 100.00%
Net Asset Value Calculation ($ in thousands)
TTM Net Operating Income $67,591
Same Store NOI Growth Rate 3.00%
NTM Net Operating Income $69,618
Weighted Cap Rate 5.54%
Gross Asset Value $1,255,574
Total Liabilities (544,482)
Net Asset Value (NAV) $711,092
Shares Outstanding 28,519
Per Share Value $24.93
83
Warranted discount to NAV would have to be greater than 40% to estimate less than 10% upside
Whitestone REIT t
Valuation, Investment Thesis, and Portfolio Decision
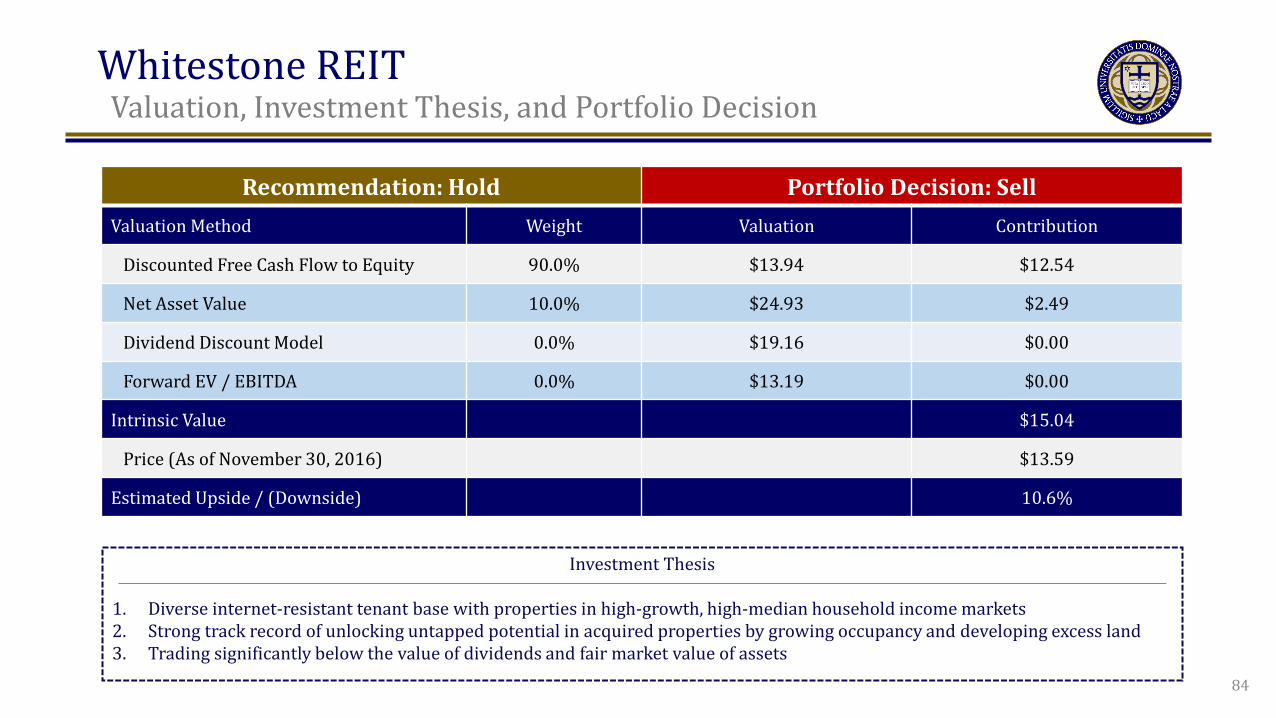
Recommendation: Hold Portfolio Decision: Sell Valuation Method Weight Valuation Contribution
Discounted Free Cash Flow to Equity 90.0% $13.94 $12.54
Net Asset Value 10.0% $24.93 $2.49
Dividend Discount Model 0.0% $19.16 $0.00
Forward EV / EBITDA 0.0% $13.19 $0.00
Intrinsic Value $15.04
Price (As of November 30, 2016) $13.59
Estimated Upside / (Downside) 10.6%
Investment Thesis
1. Diverse internet-resistant tenant base with properties in high-growth, high-median household income markets 2. Strong track record of unlocking untapped potential in acquired properties by growing occupancy and developing excess land 3. Trading significantly below the value of dividends and fair market value of assets
84
VeriSignt
Nasdaq: VRSN
One-Year Price Chart
Focus
Technical Analysis
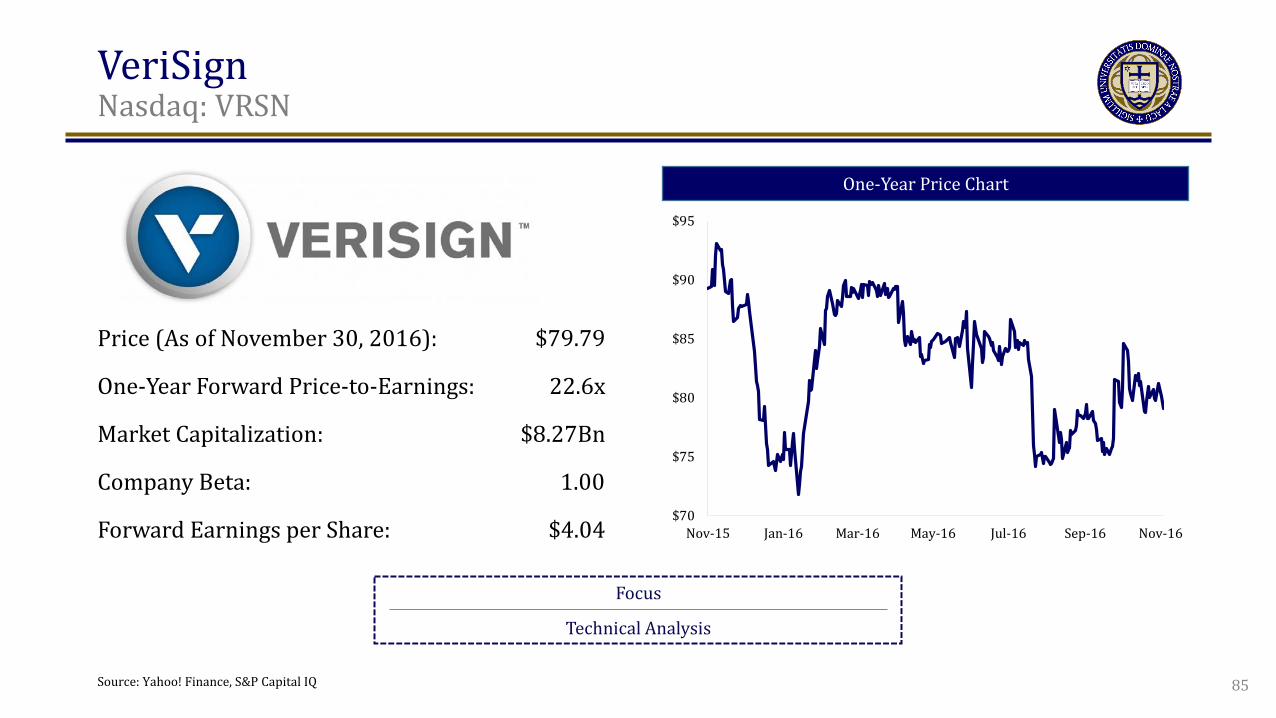
Price (As of November 30, 2016): $79.79
One-Year Forward Price-to-Earnings: 22.6x
Market Capitalization: $8.27Bn
Company Beta: 1.00
Forward Earnings per Share: $4.04
Source: Yahoo! Finance, S&P Capital IQ 85
$70
$75
$80
$85
$90
$95
Nov-15 Jan-16 Mar-16 May-16 Jul-16 Sep-16 Nov-16
VeriSign t
Technical Analysis
$0
$10
$20
$30
$40
$50
$60
$70
$80
$90
$100
2006 2007 2008 2009 2010 2011 2012 2013 2014 2015
VRSN Scaled S&P
$70
$72
$74
$76
$78
$80
$82
$84
$86
200%
205%
210%
215%
220%
225%
230%
235%
240%
245%
27-Sep 4-Oct 11-Oct 18-Oct 25-Oct 1-Nov 8-Nov 15-Nov 22-Nov 29-Nov
VRSN:S&P Relative Strength VRSN Price
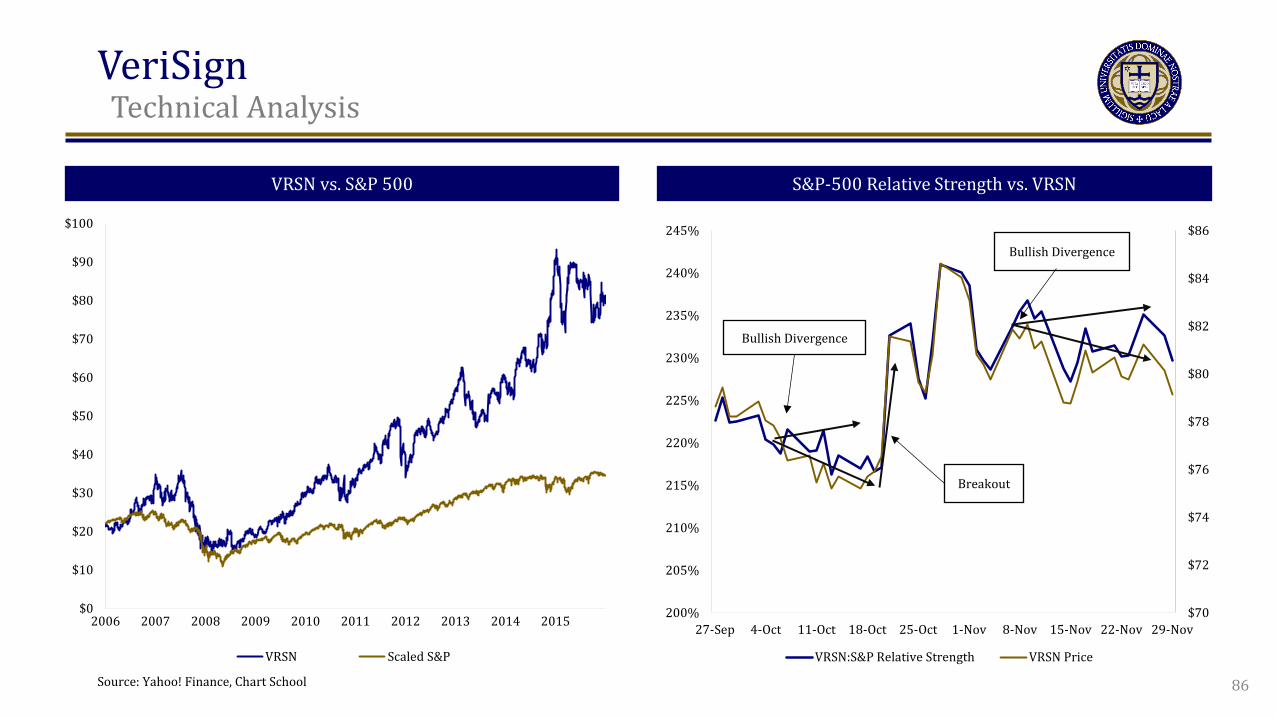
Bullish Divergence
Breakout
Bullish Divergence
86
VRSN vs. S&P 500 S&P-500 Relative Strength vs. VRSN
Source: Yahoo! Finance, Chart School

VeriSign t
Technical Analysis
0%
10%
20%
30%
40%
50%
60%
70%
80%
90%
Jan Feb Mar Apr May Jun Jul Aug Sep Oct Nov Dec
-10
-5
0
5
10
15
20
28-Nov 28-Feb 31-May 31-Aug 30-Nov 29-Feb 31-May 31-Aug
Bearish
Neutral
Bullish
$60
$65
$70
$75
$80
$85
$90
$95
$100
30-Nov 31-Jan 31-Mar 31-May 31-Jul 30-Sep
Close -2 sdma +2 sdma
Breakout
87
5 Year Seasonality 1 Year Bollinger Bands
MACD
Downward Momentum
W-Bottom W-Bottom
VeriSign t
Valuation, Investment Thesis, and Portfolio Decision
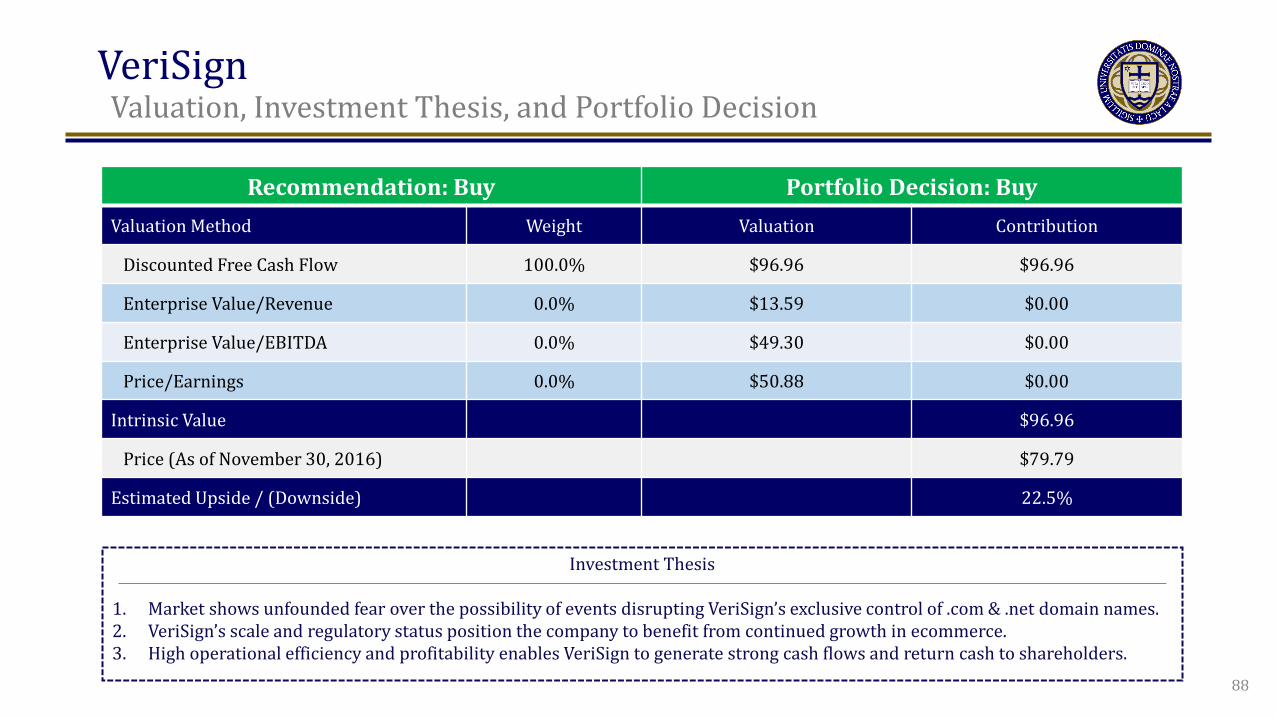
Recommendation: Buy Portfolio Decision: Buy Valuation Method Weight Valuation Contribution
Discounted Free Cash Flow 100.0% $96.96 $96.96
Enterprise Value/Revenue 0.0% $13.59 $0.00
Enterprise Value/EBITDA 0.0% $49.30 $0.00
Price/Earnings 0.0% $50.88 $0.00
Intrinsic Value $96.96
Price (As of November 30, 2016) $79.79
Estimated Upside / (Downside) 22.5%
Investment Thesis
1. Market shows unfounded fear over the possibility of events disrupting VeriSign’s exclusive control of .com & .net domain names. 2. VeriSign’s scale and regulatory status position the company to benefit from continued growth in ecommerce. 3. High operational efficiency and profitability enables VeriSign to generate strong cash flows and return cash to shareholders.
88
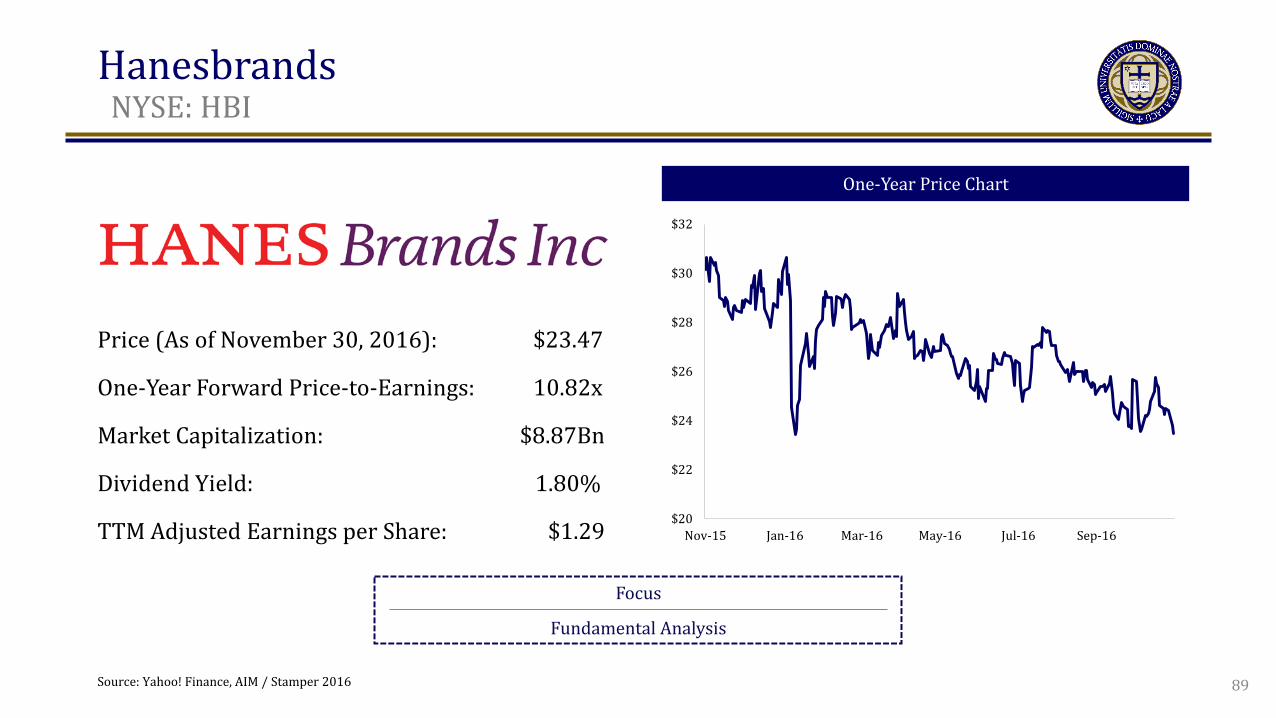
Price (As of November 30, 2016): $23.47
One-Year Forward Price-to-Earnings: 10.82x
Market Capitalization: $8.87Bn
Dividend Yield: 1.80%
TTM Adjusted Earnings per Share: $1.29
Hanesbrands t
NYSE: HBI
One-Year Price Chart
Focus
Fundamental Analysis
Source: Yahoo! Finance, AIM / Stamper 2016
$20
$22
$24
$26
$28
$30
$32
Nov-15 Jan-16 Mar-16 May-16 Jul-16 Sep-16
89

Hanesbrands t
Fundamental Analysis
–
2.0x
4.0x
6.0x
8.0x
10.0x
12.0x
14.0x
2007 2008 2009 2010 2011 2012 2013 2014 2015 2016
Accounts Receivable Turnover Inventory Turnover Accounts Payable Turnover
Adjusted Efficiency Ratios Accounts Payable Turnover Comparison
Source: Company Filings, S&P Capital IQ, AIM / Stamper 2016 Note: 2014 ratios due to restructuring in 2015
90
5.5x
8.8x
8.2x 6.1x
0.0x
2.0x
4.0x
6.0x
8.0x
10.0x
12.0x
2007 2008 2009 2010 2011 2012 2013 2014 2015 2016
Hanesbrands L Brands Gap Gildan Activeware
Net Profit Comparison
8.6%
9.7%
4.6%
0%
2%
4%
6%
8%
10%
12%
2007 2008 2009 2010 2011 2012 2013 2014 2015 2016
Hanesbrands L Brands Gap
$0
$1
$2
$3
$4
$5
$6
$7
0%5%
10%15%20%25%30%35%40%
2007 2008 2009 2010 2011 2012 2013 2014 2015 2016
Net sales Net Profit Margin After-tax Operating Margin Gross Profit Margin
Sales and Margins (%, $Bn)
Hanesbrands t
Valuation, Investment Thesis, and Portfolio Decision
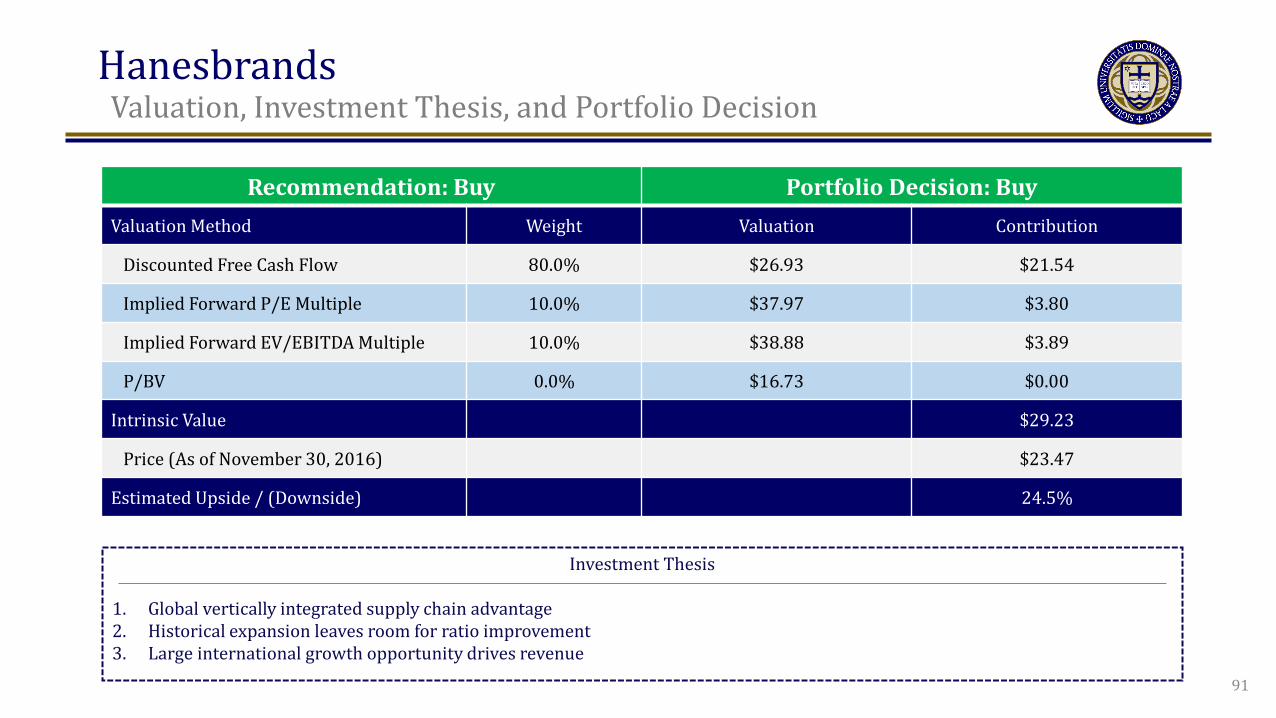
Recommendation: Buy Portfolio Decision: Buy Valuation Method Weight Valuation Contribution
Discounted Free Cash Flow 80.0% $26.93 $21.54
Implied Forward P/E Multiple 10.0% $37.97 $3.80
Implied Forward EV/EBITDA Multiple 10.0% $38.88 $3.89
P/BV 0.0% $16.73 $0.00
Intrinsic Value $29.23
Price (As of November 30, 2016) $23.47
Estimated Upside / (Downside) 24.5%
Investment Thesis
1. Global vertically integrated supply chain advantage 2. Historical expansion leaves room for ratio improvement 3. Large international growth opportunity drives revenue
91
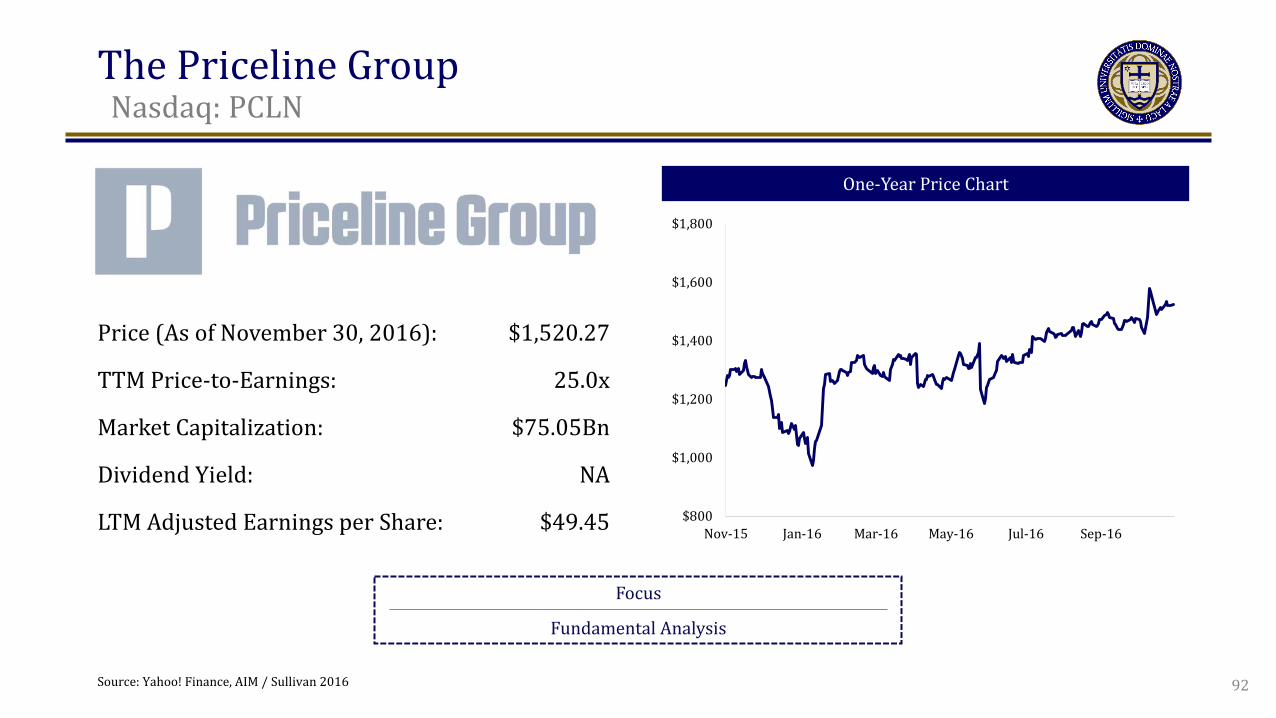
The Priceline Group t
Nasdaq: PCLN
One-Year Price Chart
Focus
Fundamental Analysis
$800
$1,000
$1,200
$1,400
$1,600
$1,800
Nov-15 Jan-16 Mar-16 May-16 Jul-16 Sep-16
Price (As of November 30, 2016): $1,520.27
TTM Price-to-Earnings: 25.0x
Market Capitalization: $75.05Bn
Dividend Yield: NA
LTM Adjusted Earnings per Share: $49.45
92 Source: Yahoo! Finance, AIM / Sullivan 2016
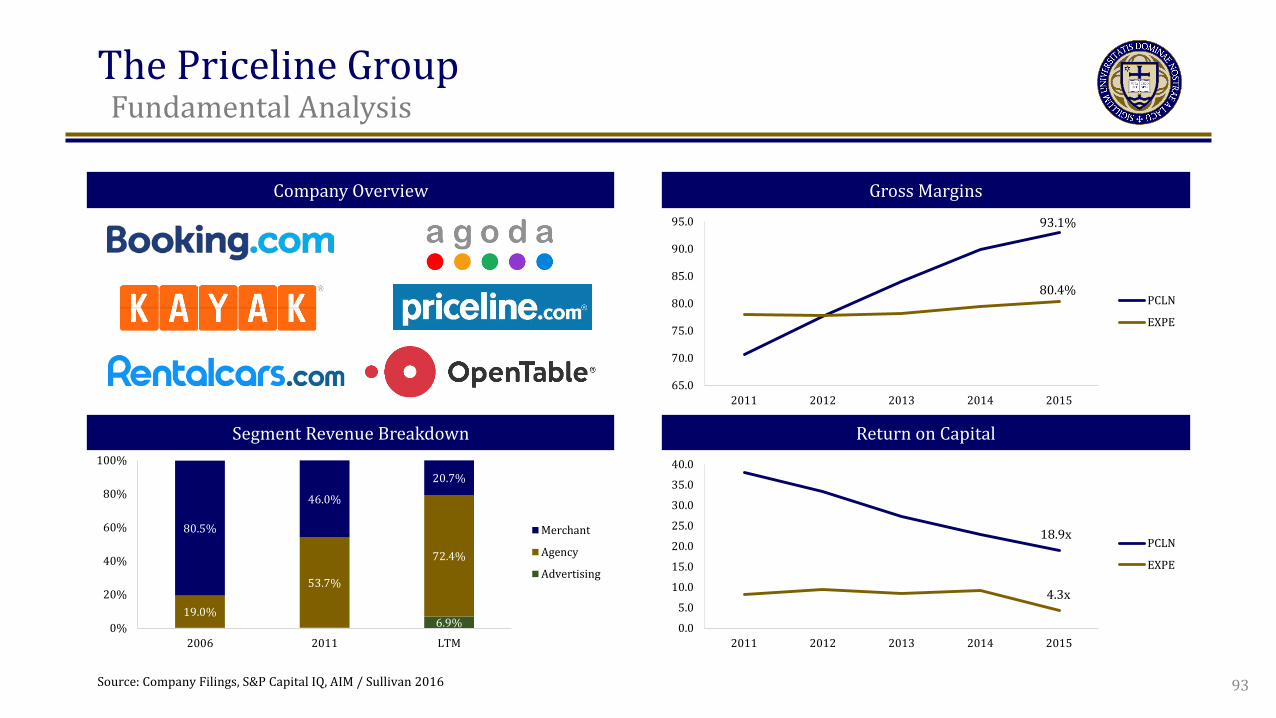
The Priceline Group t
Fundamental Analysis
Company Overview Gross Margins
Segment Revenue Breakdown Return on Capital
65.0
70.0
75.0
80.0
85.0
90.0
95.0
2011 2012 2013 2014 2015
PCLN
EXPE
0.0
5.0
10.0
15.0
20.0
25.0
30.0
35.0
40.0
2011 2012 2013 2014 2015
PCLN
EXPE
6.9% 19.0%
53.7%
72.4%
80.5%
46.0%
20.7%
0%
20%
40%
60%
80%
100%
2006 2011 LTM
Merchant
Agency
Advertising
93.1%
80.4%
18.9x
4.3x
93 Source: Company Filings, S&P Capital IQ, AIM / Sullivan 2016
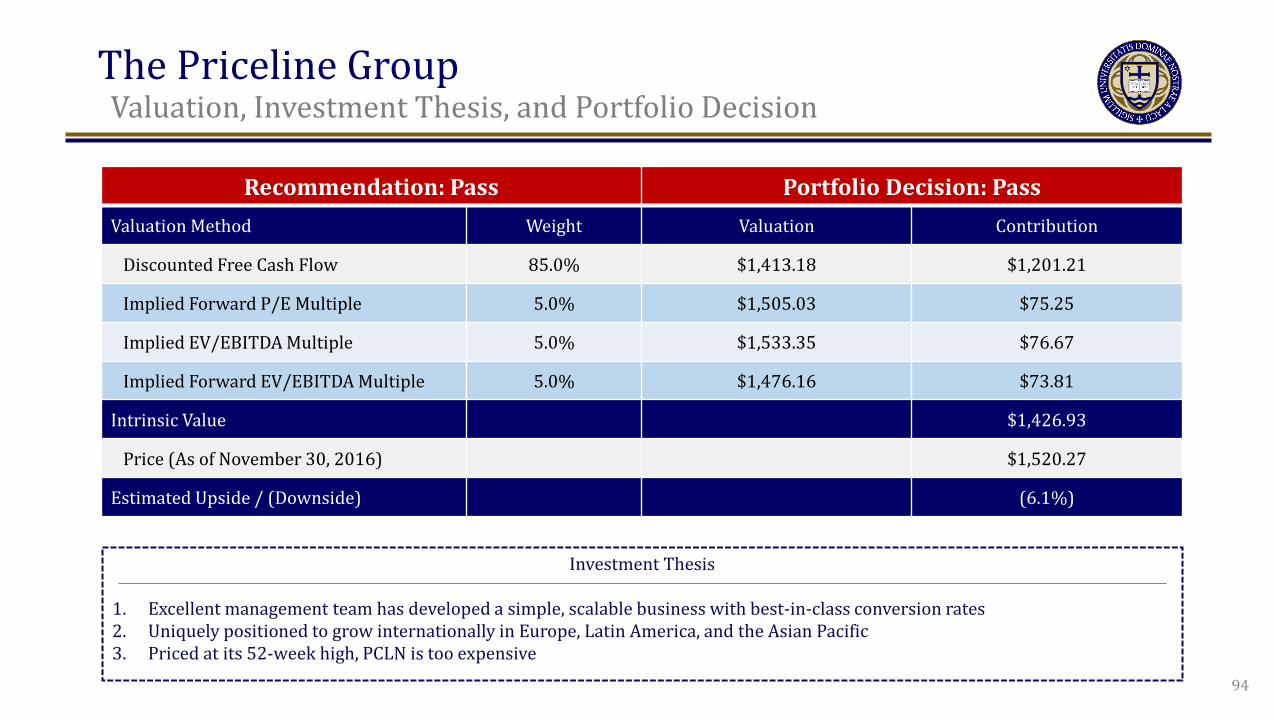
The Priceline Group t
Valuation, Investment Thesis, and Portfolio Decision
Recommendation: Pass Portfolio Decision: Pass Valuation Method Weight Valuation Contribution
Discounted Free Cash Flow 85.0% $1,413.18 $1,201.21
Implied Forward P/E Multiple 5.0% $1,505.03 $75.25
Implied EV/EBITDA Multiple 5.0% $1,533.35 $76.67
Implied Forward EV/EBITDA Multiple 5.0% $1,476.16 $73.81
Intrinsic Value $1,426.93
Price (As of November 30, 2016) $1,520.27
Estimated Upside / (Downside) (6.1%)
Investment Thesis
1. Excellent management team has developed a simple, scalable business with best-in-class conversion rates 2. Uniquely positioned to grow internationally in Europe, Latin America, and the Asian Pacific 3. Priced at its 52-week high, PCLN is too expensive
94
Portfolio Performance Historical Returns Against Benchmarks Risk-Adjusted Performance Attribution Analysis Best and Worst Performers Portfolio Additions and Deletions Finalized Portfolio

Portfolio Performance t
Key Themes
AIM Portfolio Returns
Risk-Adjusted Performance
Attribution Analysis
AIM XLIII Investments
• Long-term outperformance muted by near-term underperformance • LTM losses in energy, consumer staples, and select health care bets
• Allocation effect + selection effect = net management effect
• Allocation shift toward IT and Finance, away from health care and consumer staples
96
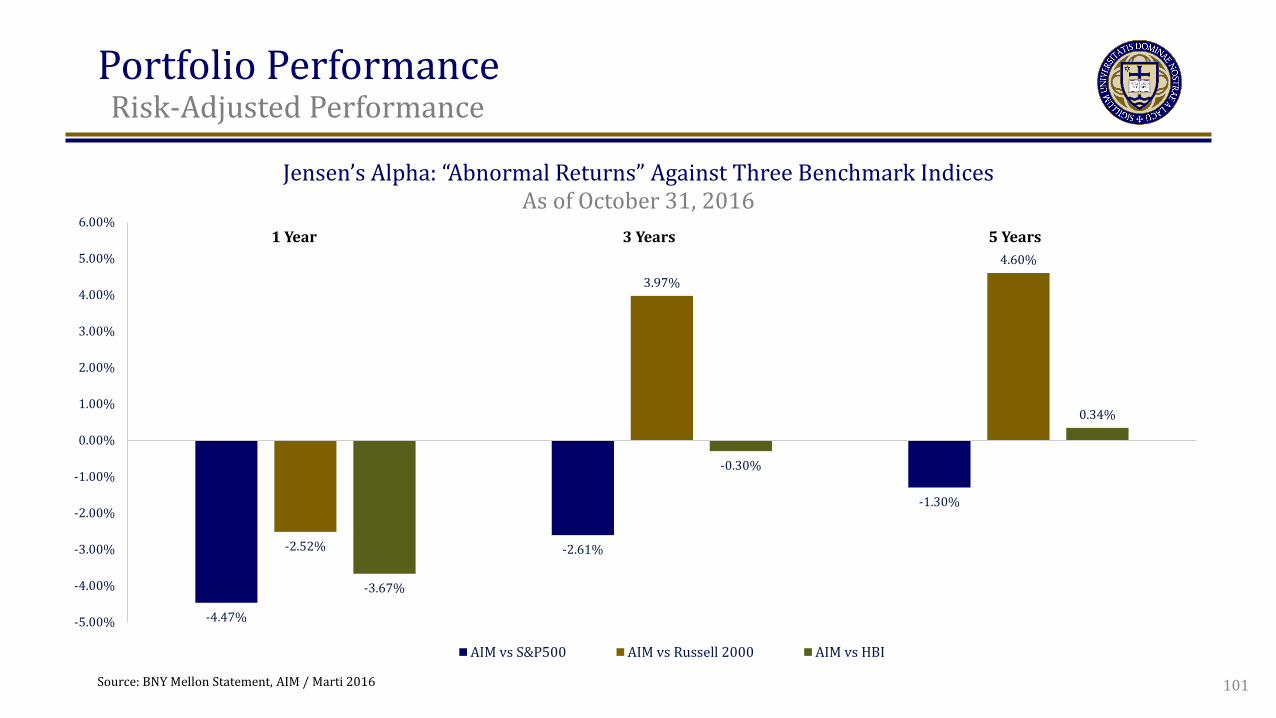
• Slightly above-market levels of systematic risk • Uninspiring relative returns + risk-on allocation = negative abnormal returns
Individual Winners & Losers • IT and Financials have delivered strong total returns, still trail indices • Of AIM XLII additions, MKTX and UNH were top performers, GILD and JAZZ brought big losses

Portfolio Performance t
Key Themes
AIM Portfolio Returns
Risk-Adjusted Performance
Attribution Analysis
AIM XLIII Investments
• Long-term outperformance muted by near-term underperformance • LTM losses in energy, consumer staples, and select health care bets
• Allocation effect + selection effect = net management effect
• Allocation shift toward IT and Finance, away from health care and consumer staples
97
• IT and Financials have delivered strong total returns, still trail indices • Of AIM XLII additions, MKTX and UNH were top performers, GILD and JAZZ brought big losses
• Slightly above-market levels of systematic risk • Uninspiring relative returns + risk-on allocation = negative abnormal returns
Individual Winners & Losers
Portfolio Performance t
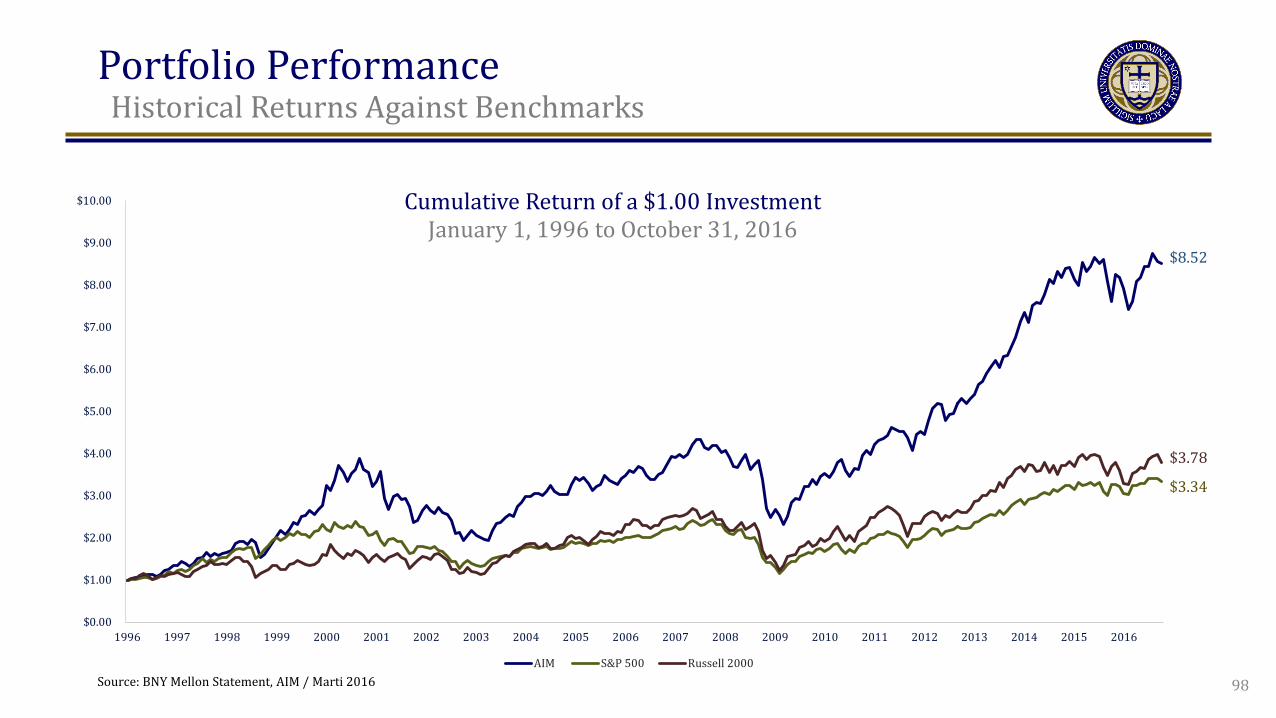
Historical Returns Against Benchmarks
$0.00
$1.00
$2.00
$3.00
$4.00
$5.00
$6.00
$7.00
$8.00
$9.00
$10.00
1996 1997 1998 1999 2000 2001 2002 2003 2004 2005 2006 2007 2008 2009 2010 2011 2012 2013 2014 2015 2016
AIM S&P 500 Russell 2000
$3.78
$8.52
$3.34
Cumulative Return of a $1.00 Investment January 1, 1996 to October 31, 2016
98 Source: BNY Mellon Statement, AIM / Marti 2016
Portfolio Performance t
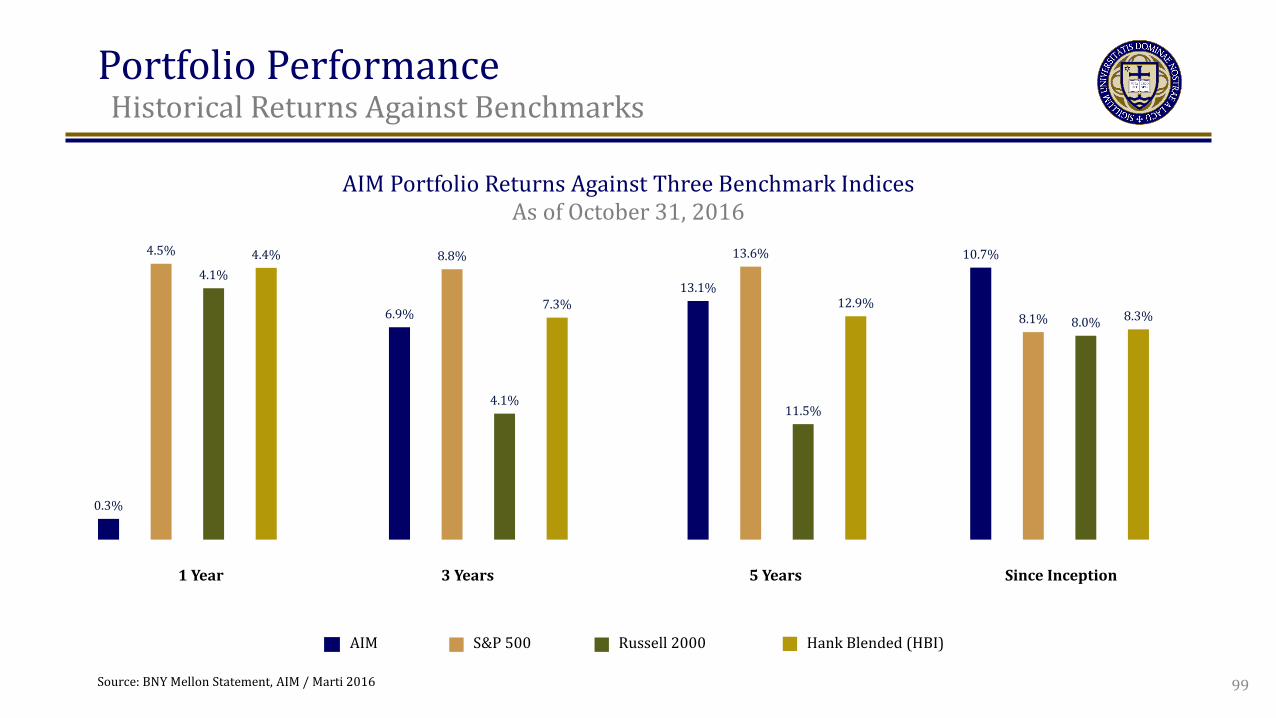
Historical Returns Against Benchmarks
AIM Portfolio Returns Against Three Benchmark Indices As of October 31, 2016
0.3%
4.5%
4.1% 4.4%
6.9%
8.8%
4.1%
7.3% 13.1%
13.6%
11.5%
12.9%
10.7%
8.1% 8.0% 8.3%
AIM S&P 500 Russell 2000 Hank Blended (HBI)
1 Year 3 Years 5 Years Since Inception
99 Source: BNY Mellon Statement, AIM / Marti 2016

Portfolio Performance t
Risk Profile
Beta: Systematic Risk Relative to Three Benchmark Indices As of October 31, 2016
1.13 1.12 1.08
0.65 0.69 0.71
0.93
1.02 1.00
0.00
0.20
0.40
0.60
0.80
1.00
1.20
1 Year 3 Years 5 Years
AIM vs. S&P AIM vs. Russell AIM vs. HBI
100 Source: BNY Mellon Statement, AIM / Marti 2016
Portfolio Performance t
Risk-Adjusted Performance
Jensen’s Alpha: “Abnormal Returns” Against Three Benchmark Indices As of October 31, 2016
-4.47%
-2.61%
-1.30%
-2.52%
3.97%
4.60%
-3.67%
-0.30%
0.34%
-5.00%
-4.00%
-3.00%
-2.00%
-1.00%
0.00%
1.00%
2.00%
3.00%
4.00%
5.00%
6.00%
AIM vs S&P500 AIM vs Russell 2000 AIM vs HBI
1 Year 3 Years 5 Years
101 Source: BNY Mellon Statement, AIM / Marti 2016
Portfolio Performance t
Risk-Adjusted Performance
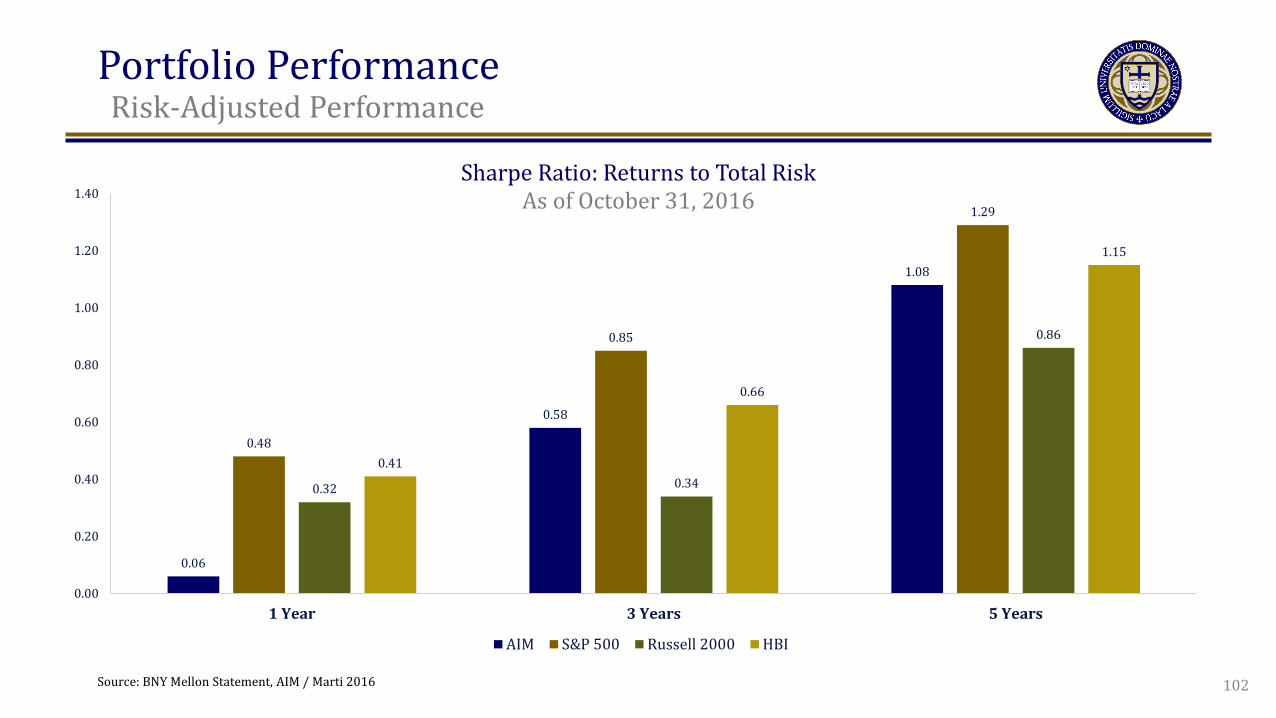
Sharpe Ratio: Returns to Total Risk As of October 31, 2016
0.06
0.58
1.08
0.48
0.85
1.29
0.32 0.34
0.86
0.41
0.66
1.15
0.00
0.20
0.40
0.60
0.80
1.00
1.20
1.40
1 Year 3 Years 5 Years
AIM S&P 500 Russell 2000 HBI
102 Source: BNY Mellon Statement, AIM / Marti 2016
Portfolio Performance t
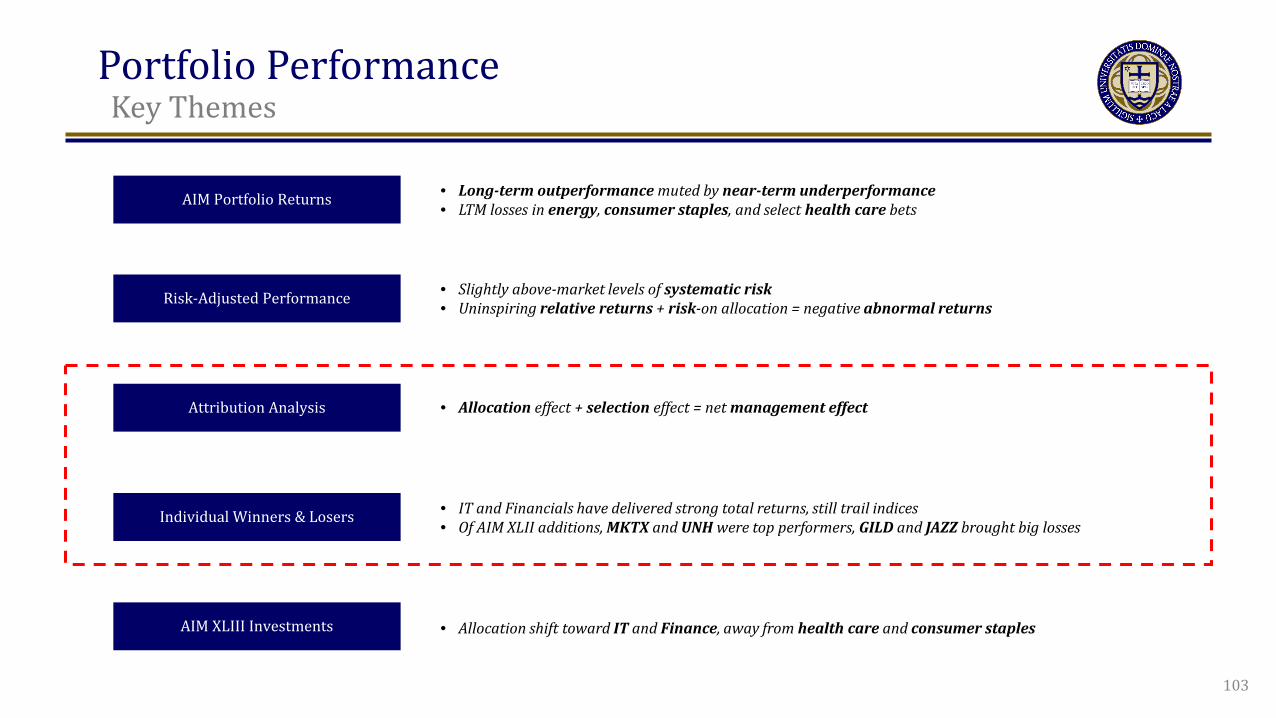
Key Themes
AIM Portfolio Returns
Risk-Adjusted Performance
Attribution Analysis
AIM XLIII Investments
• Long-term outperformance muted by near-term underperformance • LTM losses in energy, consumer staples, and select health care bets
• Allocation effect + selection effect = net management effect
• Allocation shift toward IT and Finance, away from health care and consumer staples
103
• IT and Financials have delivered strong total returns, still trail indices • Of AIM XLII additions, MKTX and UNH were top performers, GILD and JAZZ brought big losses
• Slightly above-market levels of systematic risk • Uninspiring relative returns + risk-on allocation = negative abnormal returns
Individual Winners & Losers
Portfolio Performance t
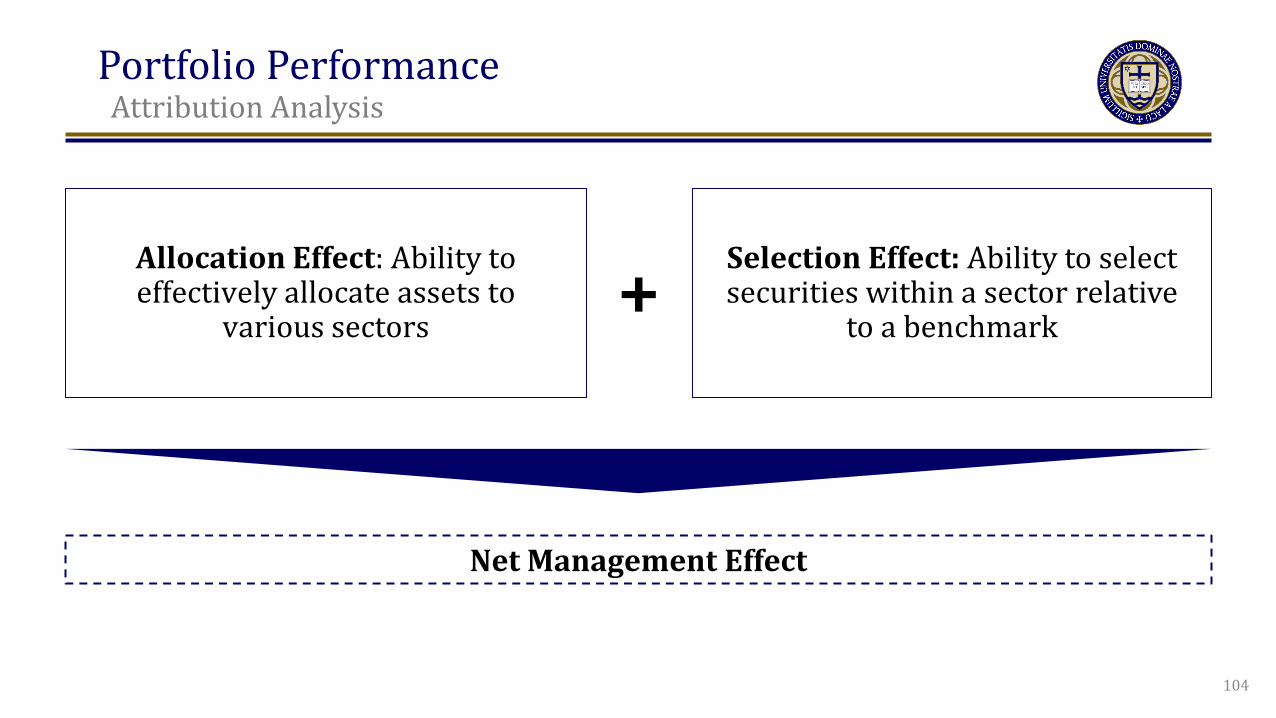
Attribution Analysis
Net Management Effect
104
Allocation Effect: Ability to effectively allocate assets to
various sectors
Selection Effect: Ability to select securities within a sector relative
to a benchmark +
Portfolio Performance t
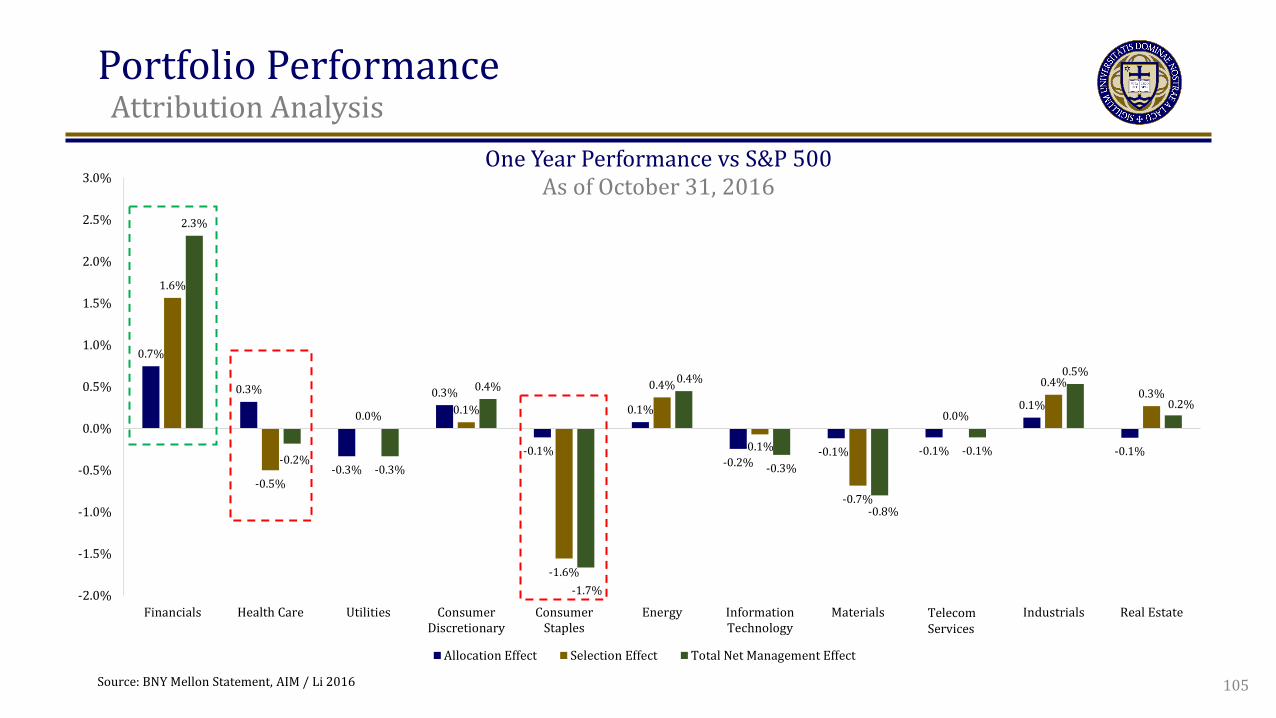
Attribution Analysis
0.7%
0.3%
-0.3%
0.3%
-0.1%
0.1%
-0.2% -0.1% -0.1%
0.1%
-0.1%
1.6%
-0.5%
0.0% 0.1%
-1.6%
0.4%
-0.1%
-0.7%
0.0%
0.4% 0.3%
2.3%
-0.2% -0.3%
0.4%
-1.7%
0.4%
-0.3%
-0.8%
-0.1%
0.5%
0.2%
-2.0%
-1.5%
-1.0%
-0.5%
0.0%
0.5%
1.0%
1.5%
2.0%
2.5%
3.0%
Financials Health Care Utilities ConsumerDiscretionary
ConsumerStaples
Energy InformationTechnology
Materials TelecommServices
Industrials Real Estate
Allocation Effect Selection Effect Total Net Management Effect
105
One Year Performance vs S&P 500 As of October 31, 2016
Telecom Services
Source: BNY Mellon Statement, AIM / Li 2016
Portfolio Performance t
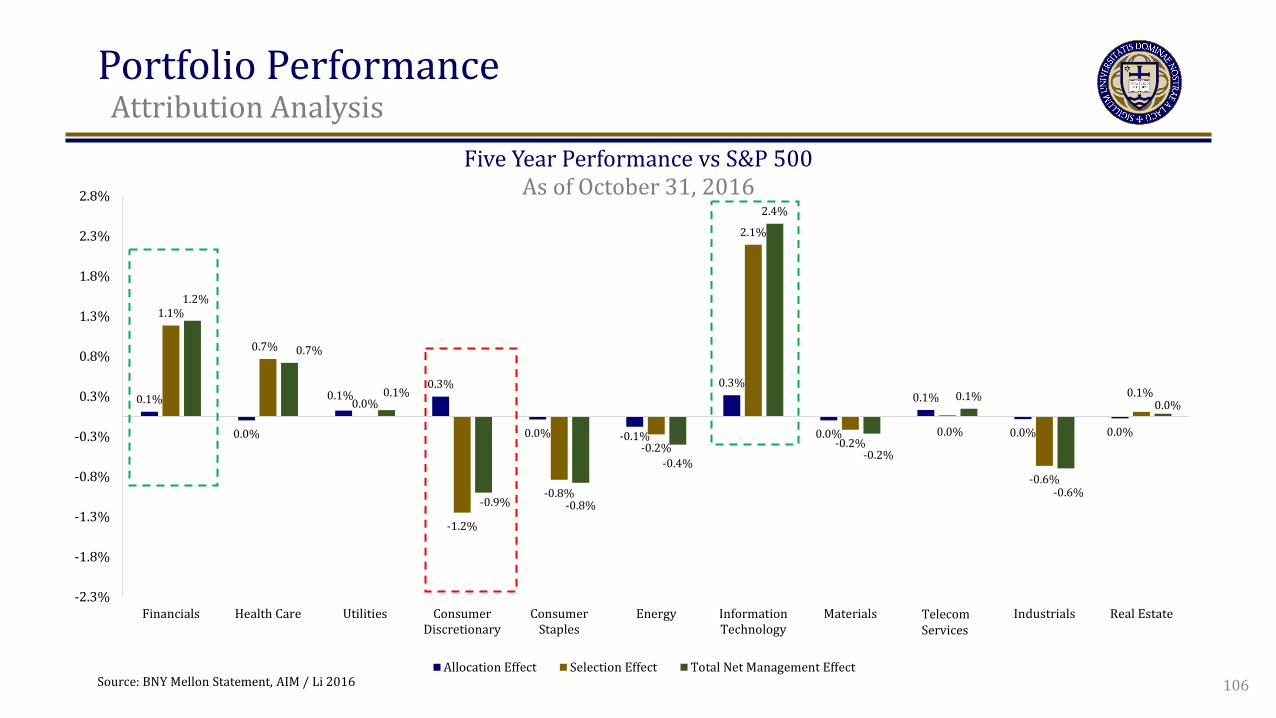
Attribution Analysis
0.1%
0.0%
0.1% 0.3%
0.0% -0.1%
0.3%
0.0%
0.1%
0.0% 0.0%
1.1%
0.7%
0.0%
-1.2%
-0.8%
-0.2%
2.1%
-0.2% 0.0%
-0.6%
0.1%
1.2%
0.7%
0.1%
-0.9% -0.8%
-0.4%
2.4%
-0.2%
0.1%
-0.6%
0.0%
-2.3%
-1.8%
-1.3%
-0.8%
-0.3%
0.3%
0.8%
1.3%
1.8%
2.3%
2.8%
Financials Health Care Utilities ConsumerDiscretionary
ConsumerStaples
Energy InformationTechnology
Materials TelecommServices
Industrials Real Estate
Allocation Effect Selection Effect Total Net Management Effect
Five Year Performance vs S&P 500 As of October 31, 2016
Telecom Services
106 Source: BNY Mellon Statement, AIM / Li 2016

Portfolio Performance t
Best & Worst Performers
Company Name Industry Return Company Name Industry ReturnGilead Sciences Healthcare (29.58%) MarketAxess Holdings* Financial Service 33.98%Jazz Pharmaceuticals Healthcare (27.35%) UnitedHealth Group Healthcare 30.84%Sprouts Farmers Mkt* Consumer Staples (27.25%) Knoll Inc.* Consumer/Industrials 19.98%Envision Healthcare Healthcare (22.51%) Union Pacific Corp Industrials 19.30%Covanta Holding Corp Industrials/Energy (9.45%) Facebook Inc. Information Tech 12.41%
Bottom 5 Performers Top 5 Performers
-29.6% -27.4% -27.2% -22.5%
-9.5% -5.8% -5.4% -5.2% -4.6% -4.4% -3.1%
0.2% 2.6% 4.2% 4.7% 4.9% 5.2% 5.6% 5.9% 8.7% 9.8% 12.4%
19.3% 20.0%
30.8% 34.0%
-40.00%
-20.00%
0.00%
20.00%
40.00%
107 *Stocks added to the AIM portfolio in Spring 2016, only holding period return calculated Source: Yahoo! Finance, BNY Mellon Statement, AIM / Li, 2016
Portfolio Performance t
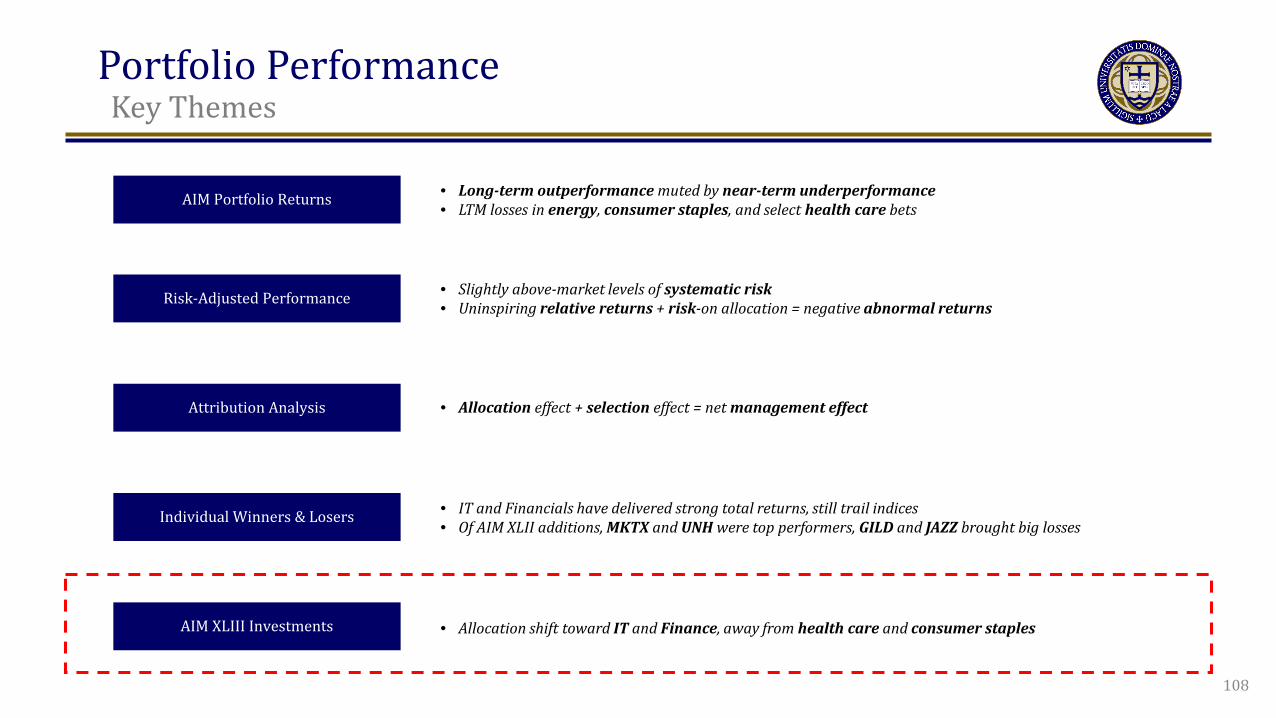
Key Themes
AIM Portfolio Returns
Risk-Adjusted Performance
Attribution Analysis
AIM XLIII Investments
• Long-term outperformance muted by near-term underperformance • LTM losses in energy, consumer staples, and select health care bets
• Allocation effect + selection effect = net management effect
• Allocation shift toward IT and Finance, away from health care and consumer staples
108
• IT and Financials have delivered strong total returns, still trail indices • Of AIM XLII additions, MKTX and UNH were top performers, GILD and JAZZ brought big losses
• Slightly above-market levels of systematic risk • Uninspiring relative returns + risk-on allocation = negative abnormal returns
Individual Winners & Losers
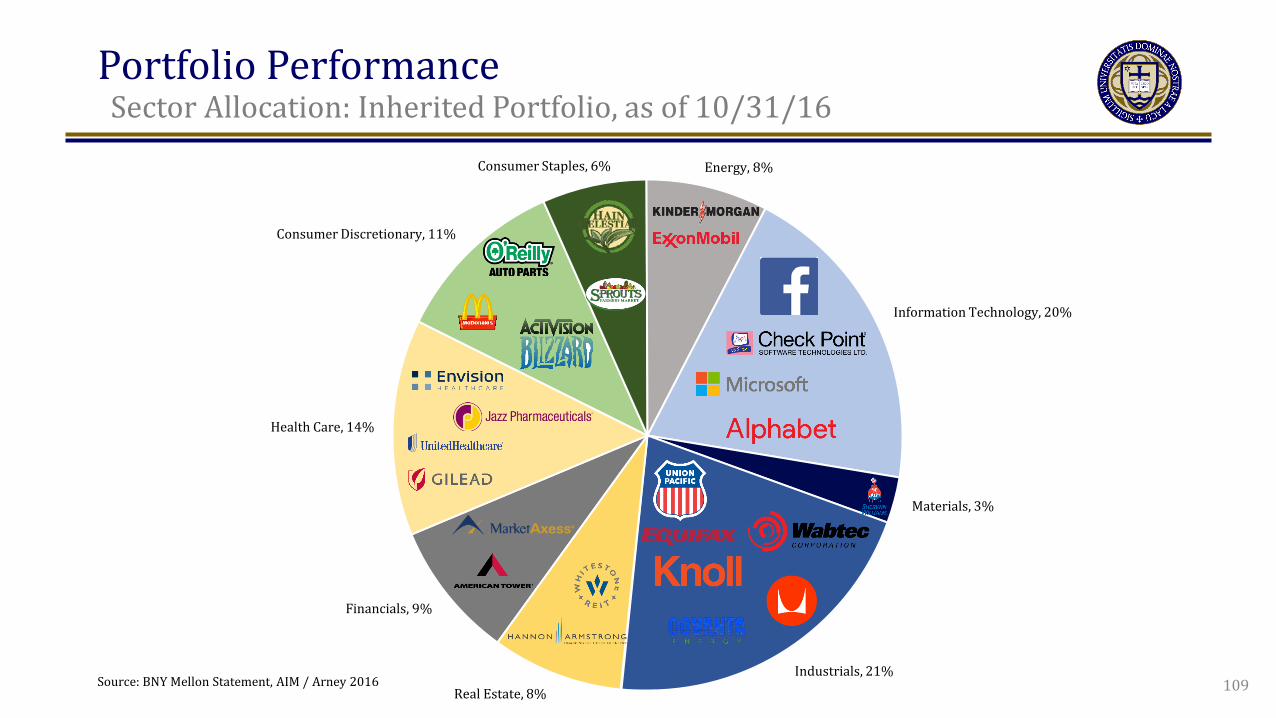
Financials, 9%
Health Care, 14%
Consumer Discretionary, 11%
Consumer Staples, 6% Energy, 8%
Information Technology, 20%
Materials, 3%
Industrials, 21% Real Estate, 8%
Portfolio Performance t
Sector Allocation: Inherited Portfolio, as of 10/31/16
109 Source: BNY Mellon Statement, AIM / Arney 2016

Portfolio Performance t
Additions and Deletions
Hanes Brands Under Armour Total System Services Align Technology Rockwell Collins Verisk Analytics Infinera Corp Intel Corp Nvidia Verisign Mosaic Co. Digital Reality REIT
McDonald's Corp O'Reilly Automotive Hain Celestial Group Sprouts Farmers Mkt Envision Healthcare Jazz Pharmaceuticals UnitedHealth Group Covanta Holding Corp Knoll Inc. Union Pacific Corp Check Point Software Sherwin-Williams Hannon Armstrong Whitestone REIT
Consumer Discretionary Consumer Discretionary Financials Health Care Industrials Industrials Information Technology Information Technology Information Technology Information Technology Materials Real Estate
Consumer Discretionary Consumer Discretionary Consumer Staples Consumer Staples Health Care Health Care Health Care Industrials Industrials Industrials Information Technology Materials Real Estate Real Estate
Portfolio Additions Portfolio Deletions
Company Industry Company Industry
110 Source: BNY Mellon Statement, AIM / Arney 2016
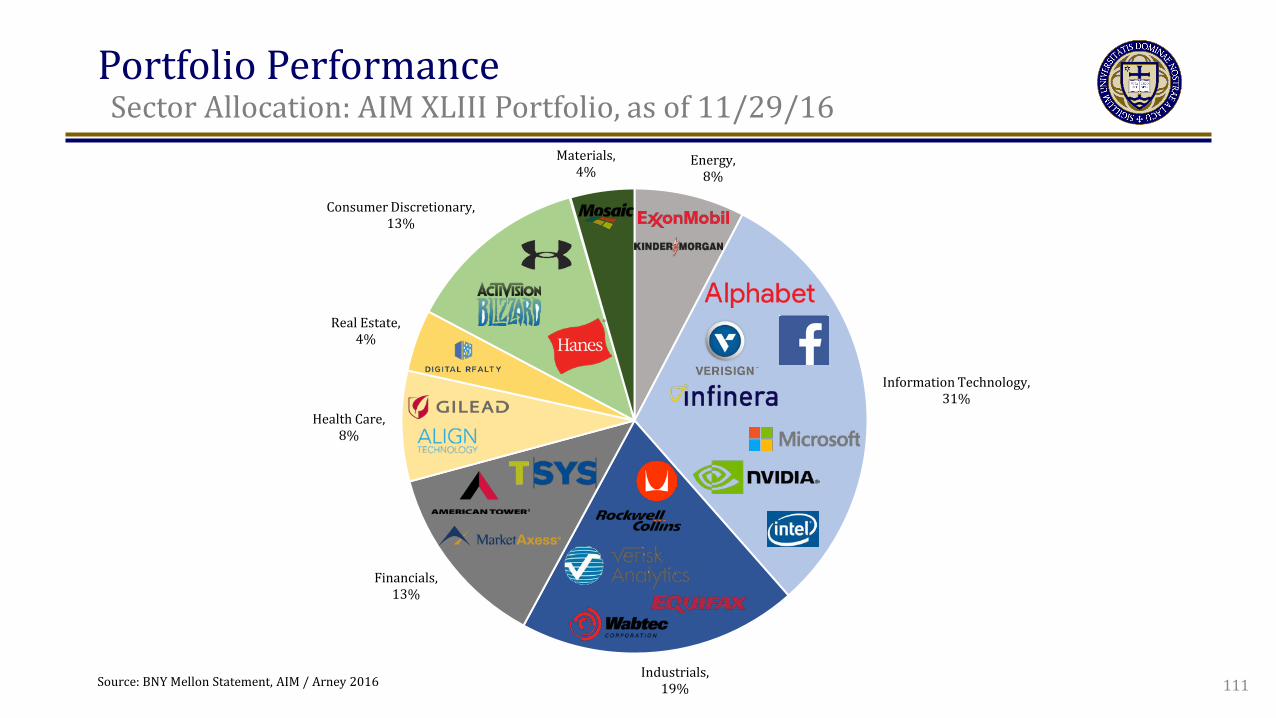
Energy, 8%
Information Technology, 31%
Industrials, 19%
Financials, 13%
Health Care, 8%
Real Estate, 4%
Consumer Discretionary, 13%
Materials, 4%
Portfolio Performance t
Sector Allocation: AIM XLIII Portfolio, as of 11/29/16
111 Source: BNY Mellon Statement, AIM / Arney 2016
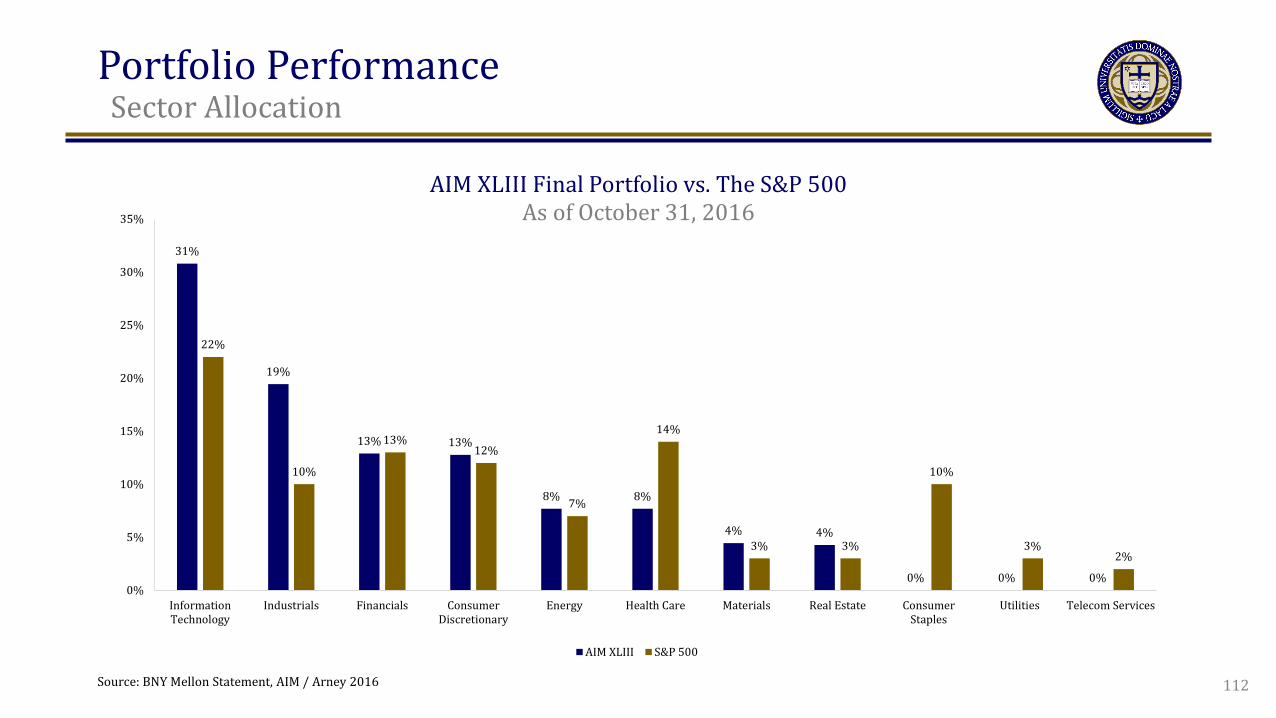
Portfolio Performance t
Sector Allocation
112
31%
19%
13% 13%
8% 8%
4% 4%
0% 0% 0%
22%
10%
13% 12%
7%
14%
3% 3%
10%
3% 2%
0%
5%
10%
15%
20%
25%
30%
35%
InformationTechnology
Industrials Financials ConsumerDiscretionary
Energy Health Care Materials Real Estate ConsumerStaples
Utilities Telecom Services
AIM XLIII S&P 500
AIM XLIII Final Portfolio vs. The S&P 500 As of October 31, 2016
Source: BNY Mellon Statement, AIM / Arney 2016

AIM XLIII Review Guest Speakers San Francisco Trip Website & Newsletter Concluding Remarks

AIM XLIII Review t
Guest Speakers
• Dave Baram – Founding Partner, VMG Partners
• Ted Weschler – Investment Manager, Berkshire Hathaway
• Kristen Collett-Schmitt – Professor, Finance, University of Notre Dame
• Tom Digenan – Managing Director & Head of the U.S. Intrinsic Value Equity, UBS
• Scott Malpass – CIO, University of Notre Dame
114

AIM XLIII Review t
San Francisco Trip
115

AIM XLIII Review t
San Francisco Trip
Bob Peck Managing Director
Jesse Lucas Head of FP&A
Rajiv Krishnarao Business Operations & Finance
Dave Thomas (’03, AIM XV) Principal
N/A
116

AIM XLIII Review t
San Francisco Trip
Saar Gur Partner
Jack Conte Co-Founder & CEO
Sumir Chadha Founder & Managing Director
Matthew Kinsella (’05, AIM XIX) Managing Director
117

AIM XLIII Review t
San Francisco Trip
Phin Barnes Partner
Adam Pisoni Founder & CEO
David George (’06, AIM XXI) Vice President
Stanford Graduate School of Business
118
AIM XLIII Review t
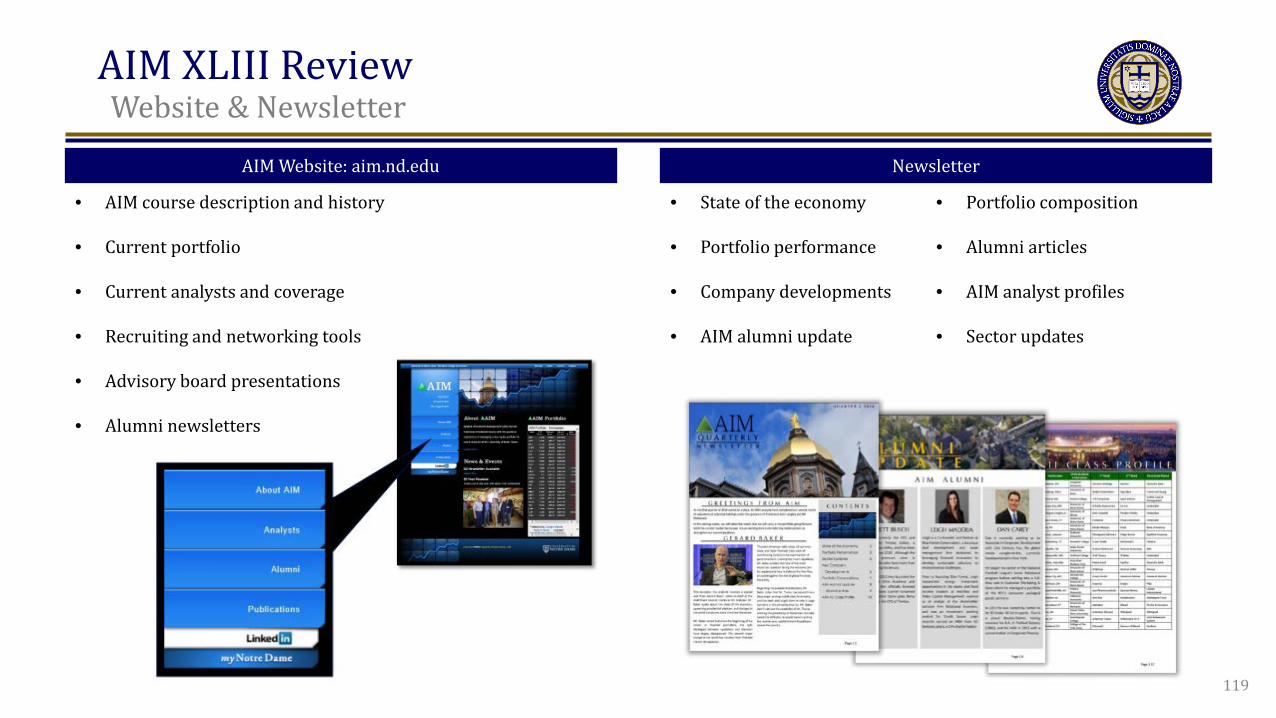
Website & Newsletter
Newsletter AIM Website: aim.nd.edu
• AIM course description and history
• Current portfolio
• Current analysts and coverage
• Recruiting and networking tools
• Advisory board presentations
• Alumni newsletters
• State of the economy
• Portfolio performance
• Company developments
• AIM alumni update
• Portfolio composition
• Alumni articles
• AIM analyst profiles • Sector updates
119

AIM XLIII Review t
Acknowledgements
Thank you for all of your guidance and support
AIM Advisory Board
Frank Reilly
Michael Hemler
Scott Malpass
Notre Dame Investment Office
Marlene Wasikowski
Bill McDonald
Shane Corwin
Kristen Collett-Schmitt
120

Our Sincerest Thank You
AIM XLIII | December 5, 2016