Advisory Board Presentation -...
121
Advisory Board Presentation 1 AIM XXXVIII Spring 2014
Transcript of Advisory Board Presentation -...

Advisory Board Presentation
1
AIM XXXVIII Spring 2014
AIM XXXVIII Analysts
2
Jason Aubuchon Aaron Backman Jessica Bonanno Brennan Clark St. Louis, Missouri Consul, Saskatchewan Orlando, Florida South Hadley, Massachusetts DiamondRock Hospitality, Fabrinet Rockwell Automation, Monsanto Covanta, Hain Celestial Apple, WWE
Andrew DePalma Matthew Dolgin Conor Douglass Carlos Farah Ellicott City, Maryland Buffalo Grove, Illinois Glen Ellyn, Illinois Guadalajara, Mexico Teradata, Under Armour Gilead Sciences, Verifone Google, Salesforce.com Intel, Amazon
Firas Fasheh Luke Friedman Prateek Garg Michael Gerbasich Amman, Jordan Geneva, Illinois Indore, India South Bend, Indiana Dollar Tree, Stratasys Select Comfort, Live Nation Estee Lauder, Yum Brands Delphi, Motorola Solutions
Jason Guindon Brent Kitts Michelle Knepel Thomas Laughner Escanaba, Michigan Portland, Oregon Monroe, Wisconsin Indianapolis, Indiana Cabot Oil & Gas, US Bancorp IPG Photonics, Check Point Apache Corporation, Schlumberger Jos A. Bank, Kinder Morgan
Daniel Leonard Thomas Maguire Matthew Maye Steven Nebbia Glen Ellyn, Illinois Miami, Florida Niskayuna, New York Omaha, Nebraska Cott Corporation, Deere & Co. Corning, Baker Hughes Inc. Activision Blizzard, Whole Foods Microsoft, Union Pacific
Rohan Saldanha Sivella Smith Curtis Vercruysse Peter Vignali Mumbai, India Knoxville, Tennessee Indianapolis, Indiana Clifton Park, New York Expeditors International, Tesla UnitedHealth Group, Danaher Cummins, Calumet Specialty Products PotashCorp, 3D Systems
Patrick Wolohan Yao Xie Saginaw, Michigan Ji'an, China InterActiveCorp, Lionsgate Pixelworks, InvenSense

Agenda
Objectives & Guidelines
Economic Environment
Security Analysis
Portfolio Performance
2014 Highlights
Conclusion
3

Objectives & Guidelines
AIM Overview
Analyst Responsibilities
Group Responsibilities
Philosophy and Policy
Market Capitalization
Ethics
4

AIM Overview
• Program objectives – Provide a thorough grounding in the process of
portfolio management – Emphasize the link between the theoretical and
practical aspects of the money management process
• Analyst selection – AIM is comprised of 25-30 analysts handpicked
from a competitive applicant pool
5

Analyst Responsibilities
• Stock selection – First round: analysts are assigned a stock from the
existing portfolio – Second round: analysts select a stock as a potential
addition to the AIM portfolio • Bottom-up selection
– Determine intrinsic valuation • Top-down conversation
– Develop macroeconomic outlook – Review industry verticals – Discuss current events
6

Group Responsibilities
• Economic Analysis – Analysis of recent events
and trends – Impact on portfolio
• Industry/Sector Analysis – Industry/sector overview – Outlook and recent trends
• Portfolio Performance Analysis – Performance benchmark
comparisons – Attribution analysis
• Trading Execution – Coordinate trading
activities – Work with Investment
Office
7
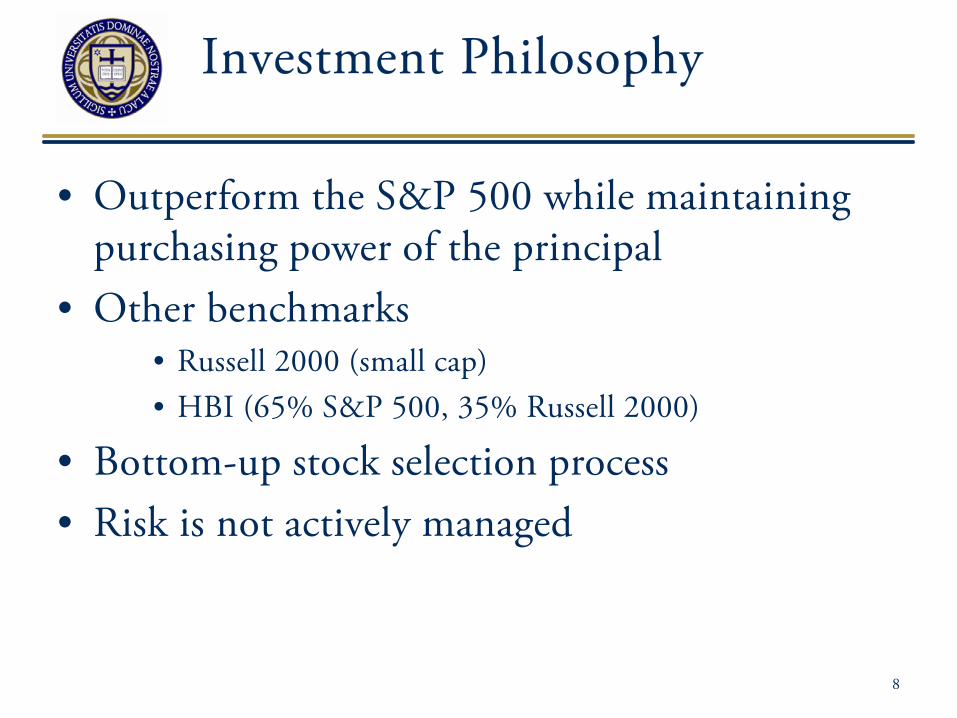
Investment Philosophy
• Outperform the S&P 500 while maintaining purchasing power of the principal
• Other benchmarks • Russell 2000 (small cap) • HBI (65% S&P 500, 35% Russell 2000)
• Bottom-up stock selection process • Risk is not actively managed
8

Investment Constraints
• Liquidity • Time horizon • Laws and regulations • Tax considerations
9

Investment Guidelines
• Common equities traded on U.S. exchanges • Sector allocation should roughly match that of
the S&P 500 • Portfolio market cap target allocations:
– Small/mid cap stocks: 35% – Large cap stocks: 65%
• Any one stock should not exceed 10% of the current portfolio
• Long-term target for cash holdings is 0% – Goal is to be fully invested
10

Market Capitalization
AIM XXXVII Portfolio Composition* AIM XXXVIII Portfolio Composition**
11
15.6%
23.0% 61.4%
Small Cap Mid Cap Large Cap
*As of final trades 11/25/2013 **As of final trades 4/23/2014
Source: BNY Workbench
11.7%
19.7%
68.6%
Small Cap Mid Cap Large Cap
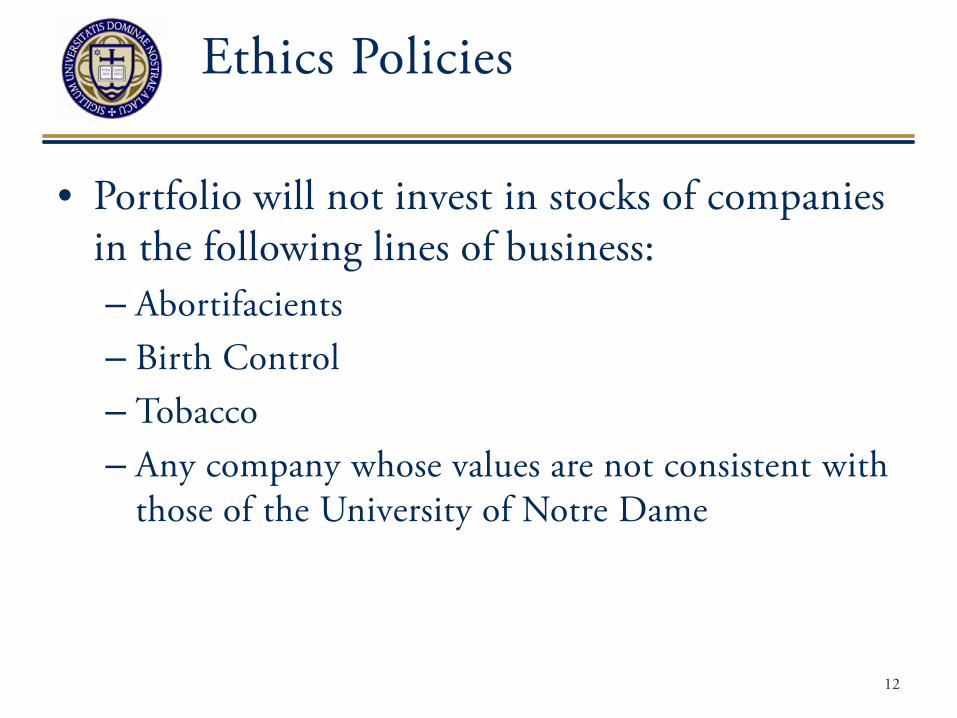
Ethics Policies
• Portfolio will not invest in stocks of companies in the following lines of business: – Abortifacients – Birth Control – Tobacco – Any company whose values are not consistent with
those of the University of Notre Dame
12

Economic Environment
GDP Overview
Consumer Spending
Housing Sector
Labor
Business Investment
Net Exports
Monetary and Fiscal Policy
13

14
Overall Environment Conflicting sentiment surrounding future growth
• GDP projections revised lower due to unexpected weakness in Q1 economic activity
• FOMC has recently backed off quantitative goals regarding unemployment • Potential regulatory changes set to impact business spending
• Above long run average growth through 2016 will be supported by: • Increase in consumer and business confidence • Need for business investment spending • Improving financial conditions and credit availability • Foreign economic recovery
GDP Growth 2014 2015 2016 Longer Run
December 2013 Projection 2.8-3.2% 3.0-3.4% 2.5-3.2% 2.2-2.4% March 2014 Projection 2.8-3.0% 3.0-3.2% 2.5-3.0% 2.2-2.3%
Source: FOMC

15
Overall Environment
Current conditions and forecast
• General economic activity increasing in all but two Federal Reserve districts (St. Louis and Cleveland) and outlook in most sectors is optimistic:
• Retail sales and foot traffic rebound
• Transportation strengthening
• Manufacturing re-gaining momentum
• Multifamily construction continues at strong rates
• Consumer and commercial loan demand increasing
Source: Federal Reserve Beige Book

Consumer Spending
• Largest contributor to GDP: 68.2% • Services make up two thirds of consumer
spending • Growth in early 2014 (annualized):
– January: 2.4% – February: 3.6%
• Growth buoyed by healthcare and utilities spending
16 Source: Bureau of Economic Analysis
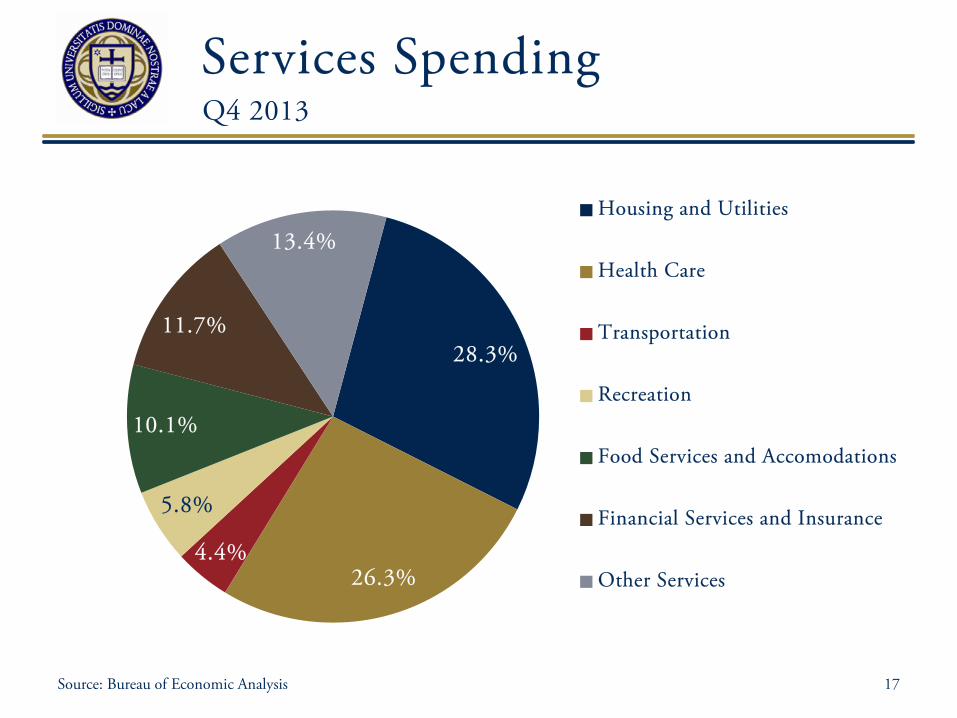
Services Spending
17
28.3%
26.3% 4.4%
5.8%
10.1%
11.7%
13.4% Housing and Utilities
Health Care
Transportation
Recreation
Food Services and Accomodations
Financial Services and Insurance
Other Services
Source: Bureau of Economic Analysis
Q4 2013

Consumer Spending
• Disposable personal income increased $42.3B, or 0.3%, in February
• Savings rate at 4.3% in February • Reduced expenditures on utilities • Consumer sentiment up to 84.1 in April from 80 in
March • Retail sales grew by 0.7% in February and 1.1% in March
18 Source: Bureau of Economic Analysis, University of Michigan Consumer Sentiment Index
Our Outlook – We project growth in consumer spending of 2.0%-2.5%

Housing
• 2nd largest contributor to GDP (15-19% of GDP) – 1) Residential fixed investment – 2) Housing services
• The harsh winter constrained housing activity
• “Prolonged housing weakness”
19

New Home Sales
20 Source: St. Louis Fed
New One Family Houses Sold: United States

New Home Sales/Starts
21 Source: St. Louis Fed
New One Family Houses and Housing Starts

Home Price Index
22 Source: St. Louis Fed
S&P Case-Shiller 20-City Home Price Index

Long-Term Interest Rates Historical Downward Trend
23 Source: St. Louis Fed
Long-Term Interest Rates

Rental Vacancy Rates
24 Source: St. Louis Fed
Rental Vacancy Rates for the United States

Housing Outlook
25
• “Housing will contribute positively to GDP this year, but not by nearly as much as in 2012 and 2013...” – Dana Saporta, Director of U.S. Economics Research at Credit Suisse in
New York
Optimism Pessimism 30 yr. mortgage rate still relatively low Shift to rental properties
Housing starts/permits are increasing Tight inventory leading to increase in prices
Lax lending standards
Source: Credit Suisse NY
Our Outlook – The real estate market will experience headwinds in the short term.

Unemployment FOMC abandons quantitative 6.5% target
26 Source: St. Louis Fed
Civilian Unemployment Rate Civilian Unemployment Rate

Declining Participation Is improvement a result of new jobs or frustrated job seekers?
27 Source: St. Louis Fed
Civilian Labor Force Participation Rate

Declining Participation Job seekers have dropped out of the labor force
28 Source: St. Louis Fed
3.8%
6.0%
Civilian Unemployment Rate Total Unemployed, Plus All Marginally Attached Workers

Insufficient Job Growth
29 Source: Wall Street Journal - 4/5/2014
Jobs have not kept up with population growth

Looming Changes
Affordable Care Act
• Lowers labor supply, not demand
• Subsidies increase ability to spend on non-healthcare goods and services
• Negative but minimal impact on employment
Minimum Wage Hikes
• Potential increases could improve incomes for 16M workers
• At the expense of 0.5M jobs
Government mandates could impact labor going forward
30 Source: Congressional Budget Office – February 2014 – Labor Market Effects of the ACA: Updated Estimates
Our Outlook – Unemployment is understated but job growth is likely to continue at a slow pace

Business Investment
31 Source: St. Louis Fed
Real Private Nonresidential Fixed Investment

Business Investment
32
Category Q4 Growth Q3 Growth
Structures -1.80% 13.40%
Equipment 10.90% 0.20%
Intellectual Property 4.00% 5.80%
Total Business Investment 5.70% 4.80%
Source: CBO
Recent Performance

Corporate Profits
33 Source: St. Louis Fed
Corporate Profits After Tax
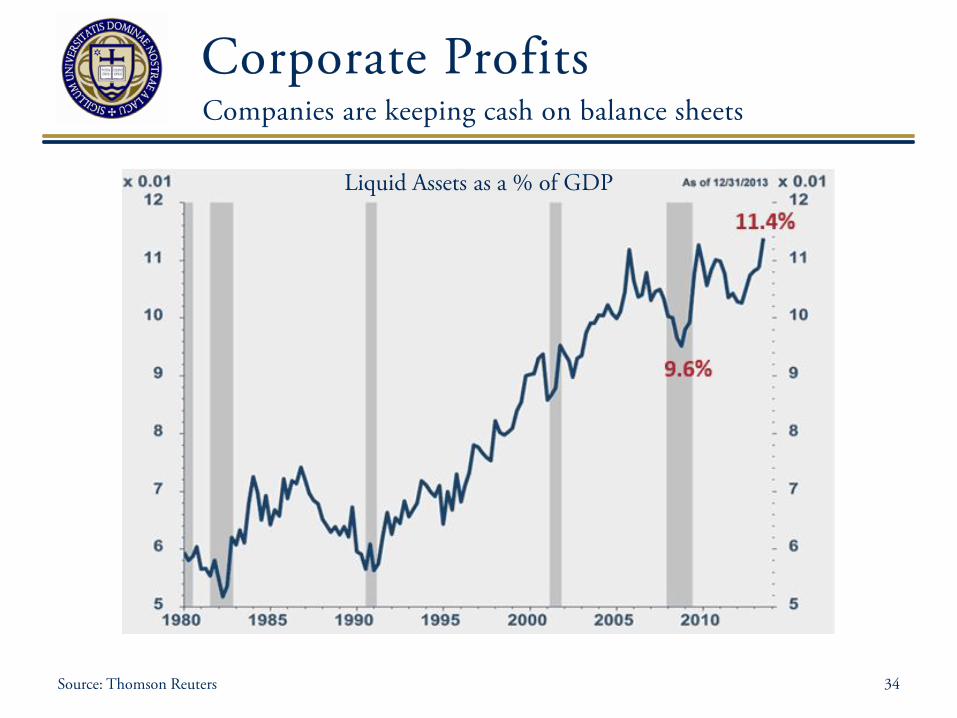
Corporate Profits
34 Source: Thomson Reuters
Companies are keeping cash on balance sheets
Liquid Assets as a % of GDP

Corporate Profits
35 Source: FactSet
Continued share repurchases despite bull market
$120B
Quarterly Share Repurchases ($M) and Buyback Yield (%)

Future Investment Potential
36 Source: BoA Merrill Lynch
Companies are deferring investment in fixed assets
16 years
Average Age of Private Nonresidential Fixed Assets (Years)

Future Investment Potential
37 Source: St. Louis Fed
Additional capacity may be needed in the near term
78.5%
Capacity Utilization: Total Industry

2014 Outlook
38 Source: Kiplinger, MAPI
Year Growth Rate
2012 6.0%
2013 1.5%
2014 Forecast 4.5-5.0%
Our Outlook – Businesses remain hesitant to spend but may be unable to defer spending much longer
Increased business investment spending likely in 2014

Net Exports
39 Source: St. Louis Fed
Negative contribution but improving
Net Exports of Goods & Services
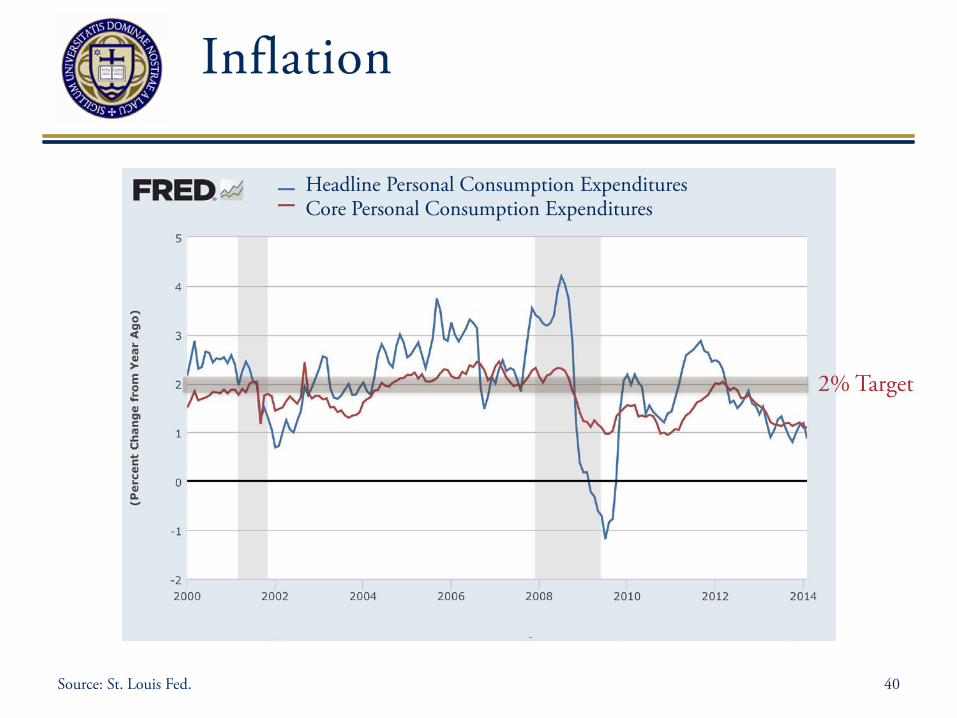
Inflation
40 Source: St. Louis Fed.
2% Target
Headline Personal Consumption Expenditures Core Personal Consumption Expenditures
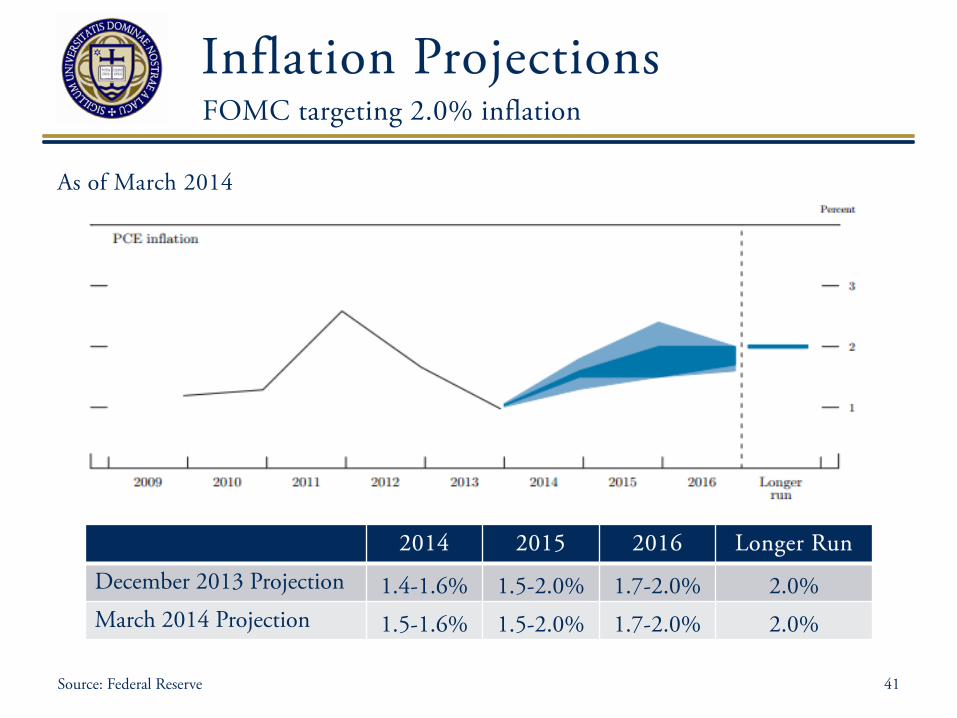
Inflation Projections
As of March 2014
41 Source: Federal Reserve
2014 2015 2016 Longer Run
December 2013 Projection 1.4-1.6% 1.5-2.0% 1.7-2.0% 2.0% March 2014 Projection 1.5-1.6% 1.5-2.0% 1.7-2.0% 2.0%
FOMC targeting 2.0% inflation

Monetary Policy
• Additional $10 billion reduction in monthly asset purchases
• Reaffirms commitment to low interest rates
• Removes reference to 6.5% unemployment threshold
• Next FOMC Meeting: April 29 and 30
Updates from March FOMC Meeting
42 Source: Federal Reserve

Monetary Policy
• Bond purchases will end in January 2015
• Rates will remain low throughout 2015
• Inflation, rather than unemployment, will dictate policy; no hardline markers
Long-term Outlook
43 Source: Federal Reserve
Our Outlook – Recent policies have not yet generated anticipated results and are unlikely to change
significantly in the near term

Fiscal Policy
• Mid-term elections = calmer environment – Debt ceiling is non-issue until March 2015 – No big changes to spending or tax policy expected in 2014
• Potential developments – Corporate taxes – Keystone Pipeline
44
Short-term Outlook

Fiscal Policy
• Budgeted 2014 Deficit = $649 billion – Deficit projected to rise after 2015 – Outlays go from $3.5 trillion to $6 trillion over next ten
years; “unsustainable growth in debt”
Current State and Long-term
45 Source: Congressional Budget Office; Government Accountability Office
Security Analysis
Overview
Corporate Governance
Selected Analysis
Valuation Method
Investment Thesis
46

Security Analysis
• Analysts complete seven analysis reports – Company Background – Fundamental – Earnings per share – Industry – Beta – Technical – Discovery, Valuation and Final Recommendation
• Each analyst considers all seven reports and makes a buy or sell recommendation.
Analysis and Valuation Reports
47

Investment Thesis:
48
Valuation and Thesis
Recommendation - Buy Valuation Method Weight Valuation Contribution
Book Value/Share % $ $ DFCF Value/Share % $ $ Forward Price/Earnings Multiple % $ $ Forward EV/EBITDA % $ $ Forward Price/Book Multiple % $ $ Forward Price/Sales % $ $ DDM Analysis % $ $
Intrinsic Value $ Market Price (04/14/2014) $ Estimated Upside/(Downside) %
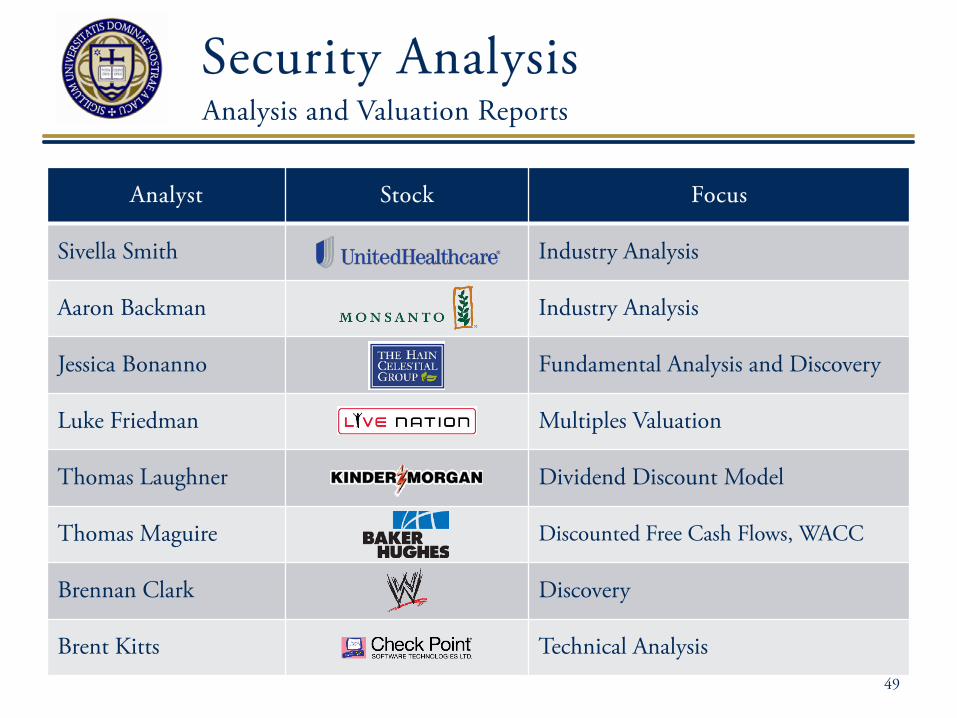
Security Analysis Analysis and Valuation Reports
49
Analyst Stock Focus
Sivella Smith Industry Analysis
Aaron Backman Industry Analysis
Jessica Bonanno Fundamental Analysis and Discovery
Luke Friedman Multiples Valuation
Thomas Laughner Dividend Discount Model
Thomas Maguire Discounted Free Cash Flows, WACC
Brennan Clark Discovery
Brent Kitts Technical Analysis

50
One Year Price Chart
0
5
10
15
20
25
$50
$60
$70
$80
$90
Apr-13 Jun-13 Aug-13 Oct-13 Dec-13 Feb-14
UnitedHealth Group, Inc. NYSE: UNH
Mill
ions
of S
hare
s Price (4/14/14): $79.18
Market Cap: $78.3B
One-Year Forward P/E: 14.09
One-Year Forward EPS: $5.62
Focus – Industry Analysis

Affordable Care Act (ACA)
• In 2012, 85% of Americans had health insurance coverage
• Healthcare reform is expected to extend coverage to an additional 25-30 million individuals by 2019
• Reforms will put pressure on operating margins for MCOs – Limits to premium amounts and variance
– Caps on gross margins
– No refusal or rescission of coverage
– $8 billion annual industry tax to help fund ACA
51 Source: Standard & Poor’s.
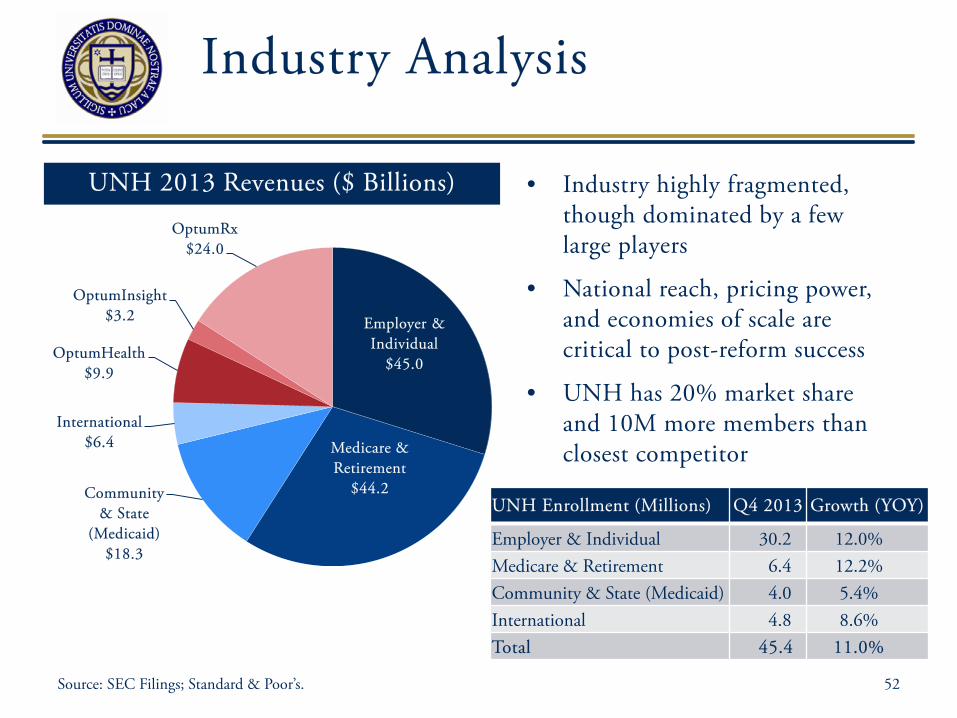
Industry Analysis
52
UNH 2013 Revenues ($ Billions) • Industry highly fragmented, though dominated by a few large players
• National reach, pricing power, and economies of scale are critical to post-reform success
• UNH has 20% market share and 10M more members than closest competitor
Source: SEC Filings; Standard & Poor’s.
Employer & Individual
$45.0
Medicare & Retirement
$44.2 Community & State
(Medicaid) $18.3
International $6.4
OptumHealth $9.9
OptumInsight $3.2
OptumRx $24.0
UNH Enrollment (Millions) Q4 2013 Growth (YOY)
Employer & Individual 30.2 12.0% Medicare & Retirement 6.4 12.2% Community & State (Medicaid) 4.0 5.4% International 4.8 8.6% Total 45.4 11.0%

Investment Thesis: • National healthcare industry to grow 5.5-6.5% per year over next decade • Leading, growing market share in most profitable member segments • Diverse revenue streams including analytics and international businesses • Unmatched economies of scale and pricing power • Well capitalized balance sheet and low operational risk
53
UnitedHealth Group Inc.
Recommendation - Buy Valuation Method Weight Valuation Contribution
DFCF Value/Share 80.0% $ 94.08 $ 75.27 Forward EV/Sales Multiple 6.7% $ 80.81 $ 5.39 Forward EV/EBITDA Multiple 6.7% $ 71.35 $ 4.76 Forward P/E Multiple 6.7% $ 61.20 $ 4.08
Intrinsic Value $ 89.49 Market Price (04/14/2014) $ 79.18 Estimated Upside/(Downside) 13.0%
Valuation and Thesis
Source: Smith/AIM 2014, Standard & Poor’s.

Price (4/14/14): $110.29
Market Cap: $58.9B
One-Year Forward P/E: 19.83
One-Year Forward EPS: $5.56
One Year Price Chart
54
0
2
4
6
8
10
12
14
$80
$85
$90
$95
$100
$105
$110
$115
$120
Apr-13 Jun-13 Aug-13 Oct-13 Dec-13 Feb-14
NYSE: MON
Monsanto
Source: Bloomberg
Mill
ions
of S
hare
s
Focus – Industry Analysis

Monsanto Background
55
2013 Profits • Operating Segments are Seed and
Genomics and Agricultural Productivity
• Growth is from seeds segment • USA – 54% of sales
Revenue Growth
54% 14%
18%
5% 9%
USA Europe South America Asia Pacific Other
2013 Revenue
-15%
-10%
-5%
0%
5%
10%
15%
20%
$0
$2,000
$4,000
$6,000
$8,000
$10,000
$12,000
$14,000
$16,000
2008 2009 2010 2011 2012 2013
Sale
s Gro
wth
(%
)
Rev
enue
s (0
00's)
Total Revenues Revenue Growth
51%
12%
16%
21%
Corn Soybeans Other Agricultural Productivity
Source: MON 10 -K
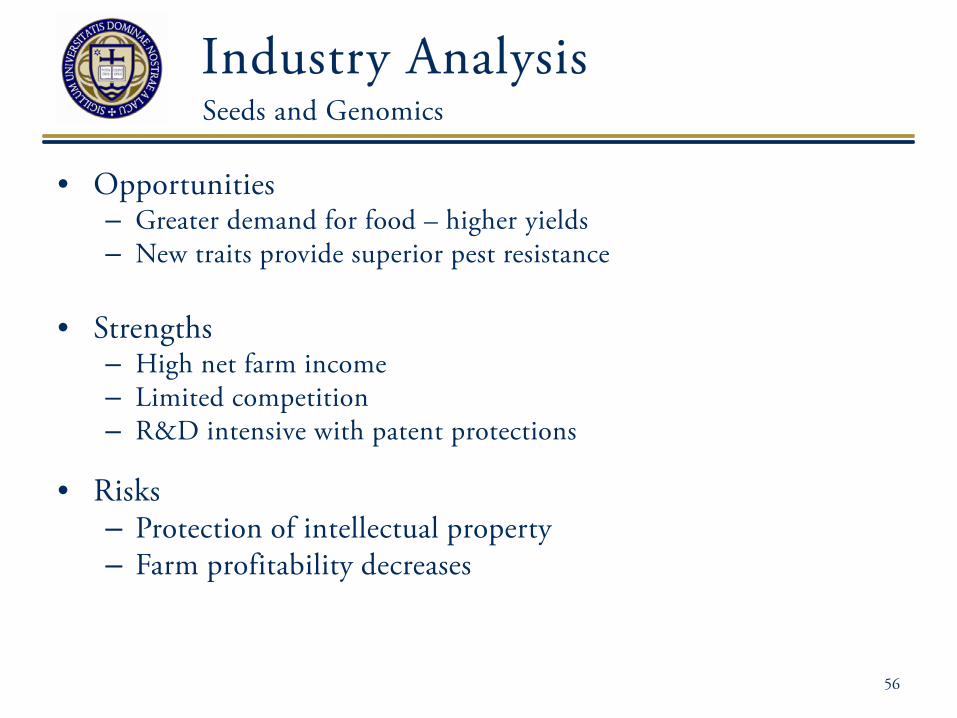
Industry Analysis
• Opportunities – Greater demand for food – higher yields – New traits provide superior pest resistance
• Strengths
– High net farm income – Limited competition – R&D intensive with patent protections
• Risks – Protection of intellectual property – Farm profitability decreases
Seeds and Genomics
56

Investment Thesis: • Monsanto’s traits needed to increase production • Limited competition provides ongoing pricing power • New traits provide sales and licensing opportunities
57
Recommendation - Buy Valuation Method Weight Valuation Contribution
Book Value/Share 0% $ 35.29 $ - DFCF Value/Share 80% $ 127.59 $ 102.07 Forward Price/Earnings Multiple 20% $ 105.56 $ 21.11 DDM Analysis 0% $ 82.61 $ - Price/Book Multiple 0% $ 116.46 $ -
Intrinsic Value $ 123.18 Market Price (04/14/2014) $ 110.29 Estimated Upside/(Downside) 11.7%
Valuation and Thesis Monsanto

One Year Price Chart
58
Mill
ions
of S
hare
s
NASDAQ: HAIN
The Hain Celestial Group
0
1
2
3
4
5
6
7
$0
$20
$40
$60
$80
$100
$120
Apr-13 Jun-13 Aug-13 Oct-13 Dec-13 Feb-14 Apr-14
Source: Yahoo Finance
Price (4/14/14): $84.25
Market Cap: $4.3B
One-Year Forward P/E: 22.37
One-Year Forward EPS: $3.35
Focus – Fundamentals and Discovery
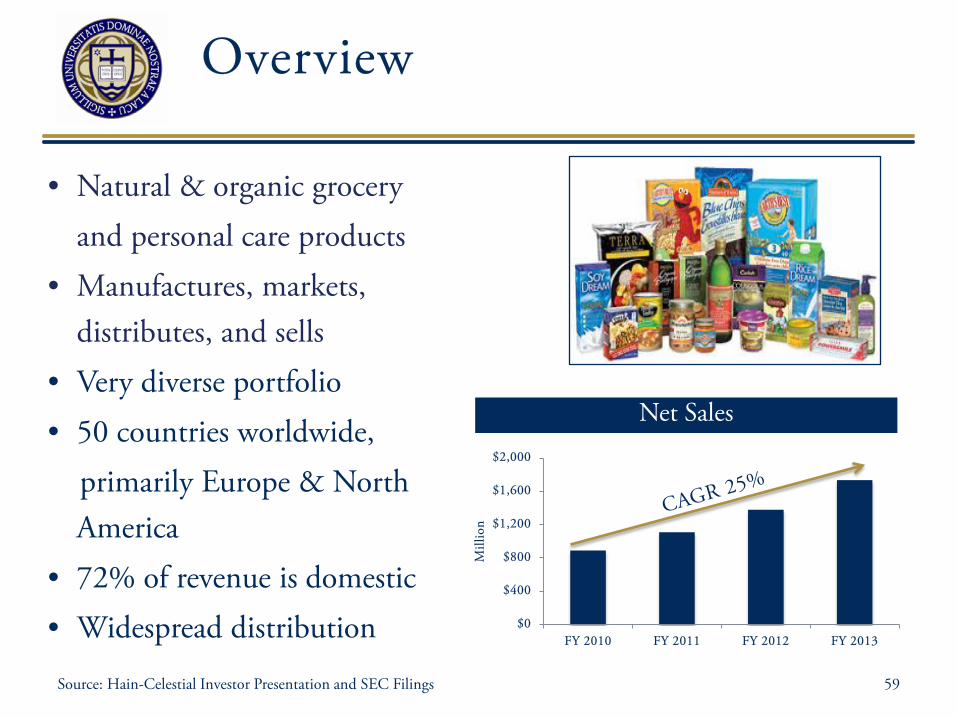
Overview
59
• Natural & organic grocery and personal care products • Manufactures, markets,
distributes, and sells • Very diverse portfolio • 50 countries worldwide, primarily Europe & North
America • 72% of revenue is domestic • Widespread distribution
$0
$400
$800
$1,200
$1,600
$2,000
FY 2010 FY 2011 FY 2012 FY 2013
Mill
ion
Source: Hain-Celestial Investor Presentation and SEC Filings
Net Sales

Fundamentals
60 Source: Capital IQ
0%
2%
4%
6%
8%
HAIN WWAV BDBD2011 2012 2013
0.00x0.25x0.50x0.75x1.00x1.25x
HAIN WWAV BDBD2011 2012 2013
0x
1x
2x
3x
HAIN WWAV BDBD2011 2012 2013
0%
4%
8%
12%
16%
HAIN WWAV BDBD2011 2012 2013
Profit Margin Financial Leverage
Asset Turnover Return on Equity
Market Cap $4.9B
2013 Sales $2.5B
Market Cap $1.0B
2013 Sales $0.5B
Market Cap $4.3B
2013 Sales $1.7B

Investment Thesis: • Diversified product portfolio • Trusted Brand reputations • Unique position as the sole organic conglomerate (advantages for distribution,
procurement, etc.) • High, prolonged industry growth forecast (12.3% CAGR through 2020) • Room to invest in growth from disciplined capital management
61
Valuation and Thesis The Hain Celestial Group
Recommendation - Buy Valuation Method Weight Valuation Contribution
Book Value/Share 0% $ 28.02 $ - Forward P/E Multiple 0% $ 75.05 $ - Forward P/B Multiple 0% $ 74.23 $ - DFCF/Share 100% $ 100.09 $ 100.09
Intrinsic Value $ 100.09 Market Price (04/14/2014) $ 84.25 Estimated Upside/(Downside) 18.8%

62
-
2
4
6
8
10
12
$0
$5
$10
$15
$20
$25
Apr-13 Jun-13 Aug-13 Oct-13 Dec-13 Feb-14
Mill
ions
of S
hare
s
One Year Price Chart
Live Nation Entertainment NYSE: LYV
Source: Yahoo! Finance
Price (4/14/14): $20.18
Market Cap: $4.07B
One-Year Forward P/E: 92.0
One-Year Forward EPS: $0.22
Focus – Multiples Analysis

2013 Revenue By Region 2013 Revenue By Segment
63
Overview
• Largest live entertainment firm – 33 countries
• Vertical Integration – Artist Nation – Sponsorship & advertising – Ticketing – Concerts
61%
39%
United States International
70%
21%
5% 5%
Concert Tickets Sponsorship & Advertising Artist Nation
Source: LYV 10-K
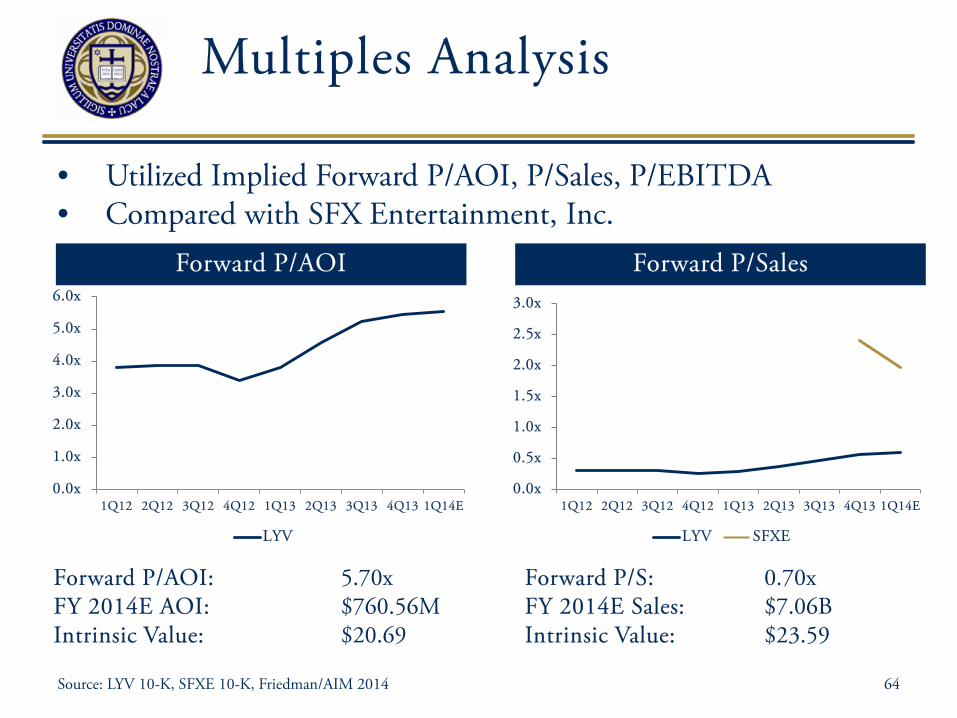
Multiples Analysis
64
• Utilized Implied Forward P/AOI, P/Sales, P/EBITDA • Compared with SFX Entertainment, Inc.
0.0x
0.5x
1.0x
1.5x
2.0x
2.5x
3.0x
1Q12 2Q12 3Q12 4Q12 1Q13 2Q13 3Q13 4Q13 1Q14E
LYV SFXE
0.0x
1.0x
2.0x
3.0x
4.0x
5.0x
6.0x
1Q12 2Q12 3Q12 4Q12 1Q13 2Q13 3Q13 4Q13 1Q14E
LYV
Forward P/AOI Forward P/Sales
Forward P/S: 0.70x FY 2014E Sales: $7.06B Intrinsic Value: $23.59
Forward P/AOI: 5.70x FY 2014E AOI: $760.56M Intrinsic Value: $20.69
Source: LYV 10-K, SFXE 10-K, Friedman/AIM 2014

Multiples Analysis
65
• Utilized Implied Forward P/AOI, P/Sales, P/EBITDA • Compared with SFX Entertainment, Inc.
Forward P/EBITDA
Forward P/EBITDA: 8.0x FY 2014E EBITDA: $537.85M Intrinsic Value: $21.82
0x
5x
10x
15x
20x
1Q12 2Q12 3Q12 4Q12 1Q13 2Q13 3Q13 4Q13 1Q14E
LYV SFXE
Source: LYV 10-K, Friedman/AIM 2014

Investment Thesis: • Flywheel synergies and cost savings • Monopoly on ticketing • Diversification of artists, venues, and genres
66
Live Nation
Valuation and Thesis
Recommendation - Buy Valuation Method Weight Valuation Contribution
Book Value/Share 0% $ 7.97 $ - Forward P/S Multiple 33% $ 23.59 $ 7.86 Forward P/EBITDA Multiple 33% $ 20.53 $ 6.84 Forward P/AOI Multiple 33% $ 20.69 $ 6.90 Discounted AOI/Share 0% $ 53.96 $ - DFCF/Share 0% $ (3.38) $ -
Intrinsic Value $ 21.60 Market Price (04/14/2014) $ 20.18 Estimated Upside/(Downside) 7.05%
Source: Yahoo! Finance 67
One Year Price Chart
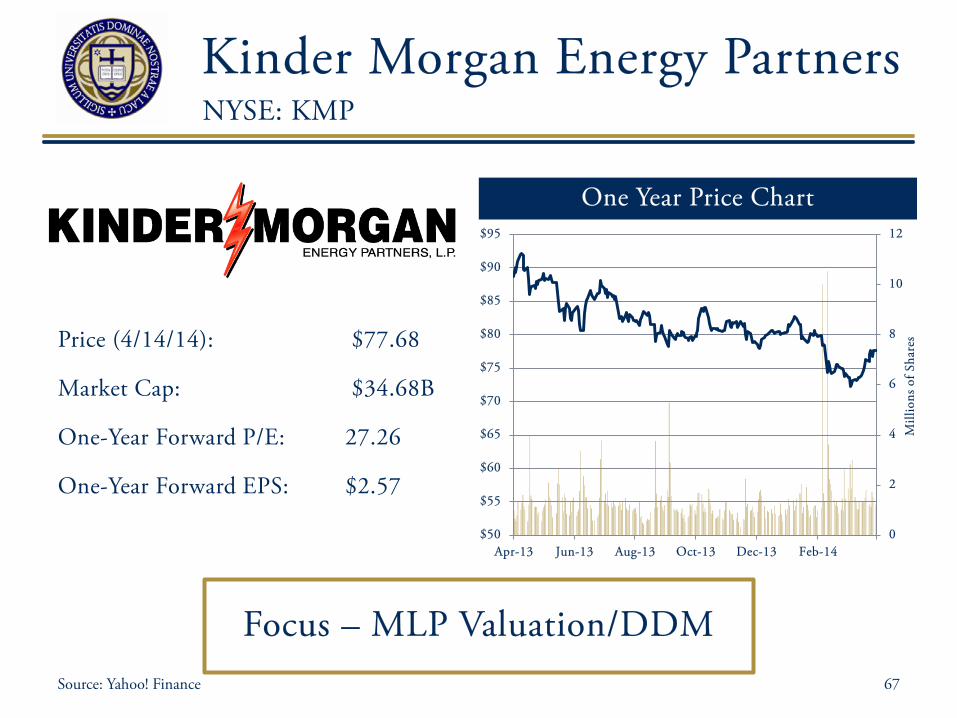
Price (4/14/14): $77.68
Market Cap: $34.68B
One-Year Forward P/E: 27.26
One-Year Forward EPS: $2.57
0
2
4
6
8
10
12
$50
$55
$60
$65
$70
$75
$80
$85
$90
$95
Apr-13 Jun-13 Aug-13 Oct-13 Dec-13 Feb-14
Mill
ions
of S
hare
s
Focus – MLP Valuation/DDM
Kinder Morgan Energy Partners NYSE: KMP

KMP Overview
68
2013 Revenues ($12.5B)
Revenue Growth
48%
23%
5%
10%
14%
Natural Gas CO2 KM Canada Products Pipeline Terminals
• North America’s largest midstream energy MLP • Pipeline transportation
– 52,000 miles • Energy storage
– 180 Terminals
Source: Company Filings
$-
$2
$4
$6
$8
$10
$12
$14
2009 2010 2011 2012 2013
Billi
ons
Yield Dist. Growth Coverage
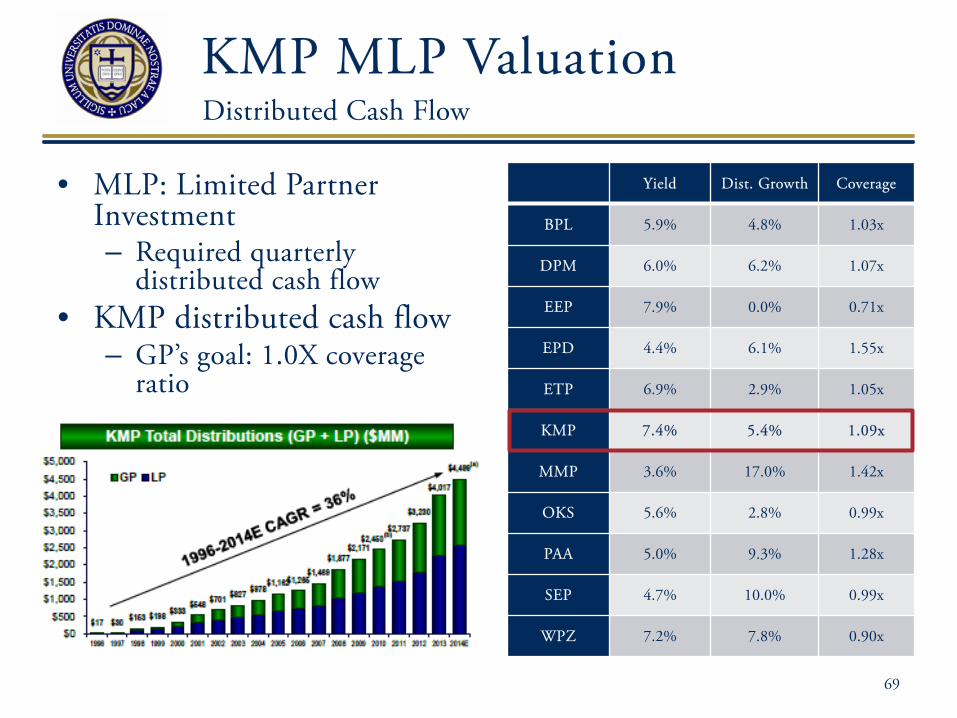
BPL 5.9% 4.8% 1.03x
DPM 6.0% 6.2% 1.07x
EEP 7.9% 0.0% 0.71x
EPD 4.4% 6.1% 1.55x
ETP 6.9% 2.9% 1.05x
KMP 7.4% 5.4% 1.09x
MMP 3.6% 17.0% 1.42x
OKS 5.6% 2.8% 0.99x
PAA 5.0% 9.3% 1.28x
SEP 4.7% 10.0% 0.99x
WPZ 7.2% 7.8% 0.90x
KMP MLP Valuation Distributed Cash Flow
69
• MLP: Limited Partner Investment – Required quarterly
distributed cash flow • KMP distributed cash flow
– GP’s goal: 1.0X coverage ratio
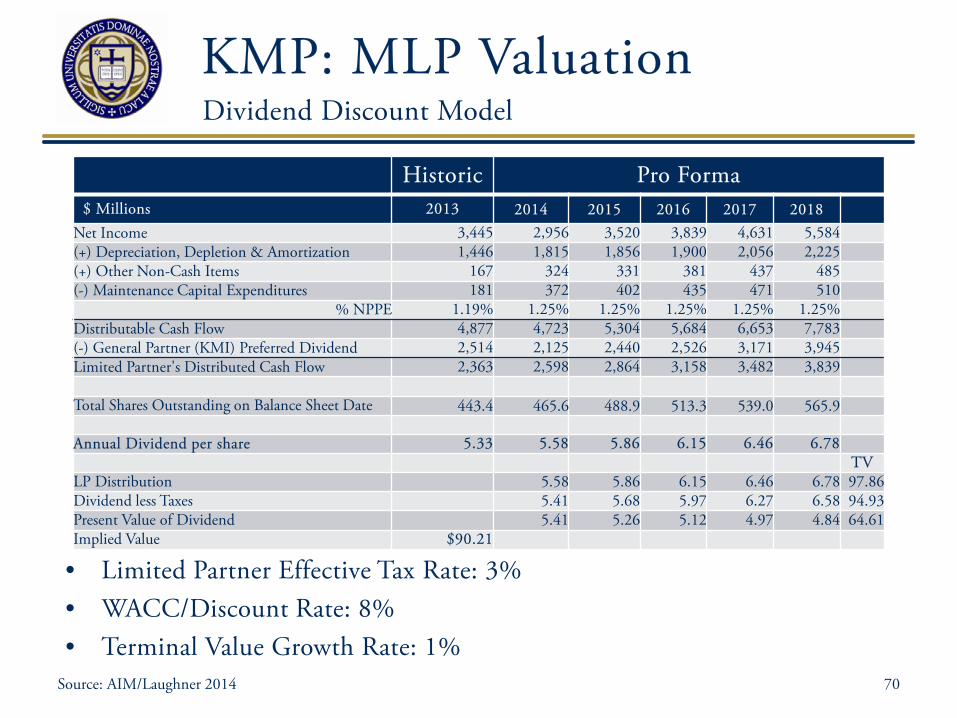
KMP: MLP Valuation Dividend Discount Model
70
• Limited Partner Effective Tax Rate: 3% • WACC/Discount Rate: 8% • Terminal Value Growth Rate: 1%
Source: AIM/Laughner 2014
Historic Pro Forma $ Millions 2013 2014 2015 2016 2017 2018
Net Income 3,445 2,956 3,520 3,839 4,631 5,584 (+) Depreciation, Depletion & Amortization 1,446 1,815 1,856 1,900 2,056 2,225 (+) Other Non-Cash Items 167 324 331 381 437 485 (-) Maintenance Capital Expenditures 181 372 402 435 471 510
% NPPE 1.19% 1.25% 1.25% 1.25% 1.25% 1.25% Distributable Cash Flow 4,877 4,723 5,304 5,684 6,653 7,783 (-) General Partner (KMI) Preferred Dividend 2,514 2,125 2,440 2,526 3,171 3,945 Limited Partner's Distributed Cash Flow 2,363 2,598 2,864 3,158 3,482 3,839
Total Shares Outstanding on Balance Sheet Date 443.4 465.6 488.9 513.3 539.0 565.9
Annual Dividend per share 5.33 5.58 5.86 6.15 6.46 6.78 TV
LP Distribution 5.58 5.86 6.15 6.46 6.78 97.86 Dividend less Taxes 5.41 5.68 5.97 6.27 6.58 94.93 Present Value of Dividend 5.41 5.26 5.12 4.97 4.84 64.61 Implied Value $90.21

Investment Thesis: • $14.8B committed in diversified infrastructure projects • Macro Environment:
– Domestic demand: Russia/Ukraine uncertainty – Low interest rates have positive effect on MLP’s
• Strong asset base: remote drilling, fracking, and horizontal drilling 71
Recommendation – Buy Valuation Method Weight Valuation Contribution
Book Value/Share 0% $ 49.16 $ - Dividend Discount Model 70% $ 90.21 $ 63.15 Forward Price/EBITDA 5% $ 73.38 $ 3.67 Forward P/E 5% $ 74.44 $ 3.72 FCF/Share 20% $ 81.36 $ 16.72
Intrinsic Value $ 86.81 Market Price (04/14/2014) $ 77.58 Estimated Upside/(Downside) 11.9%
Valuation and Thesis
72
One Year Price Chart
0
2
4
6
8
10
12
14
16
18
$0
$10
$20
$30
$40
$50
$60
$70
$80
Apr-13 Jun-13 Aug-13 Oct-13 Dec-13 Feb-14 Apr-14
Mill
ions
of S
hare
s
NYSE: BHI
Source: Yahoo! Finance, Analyst
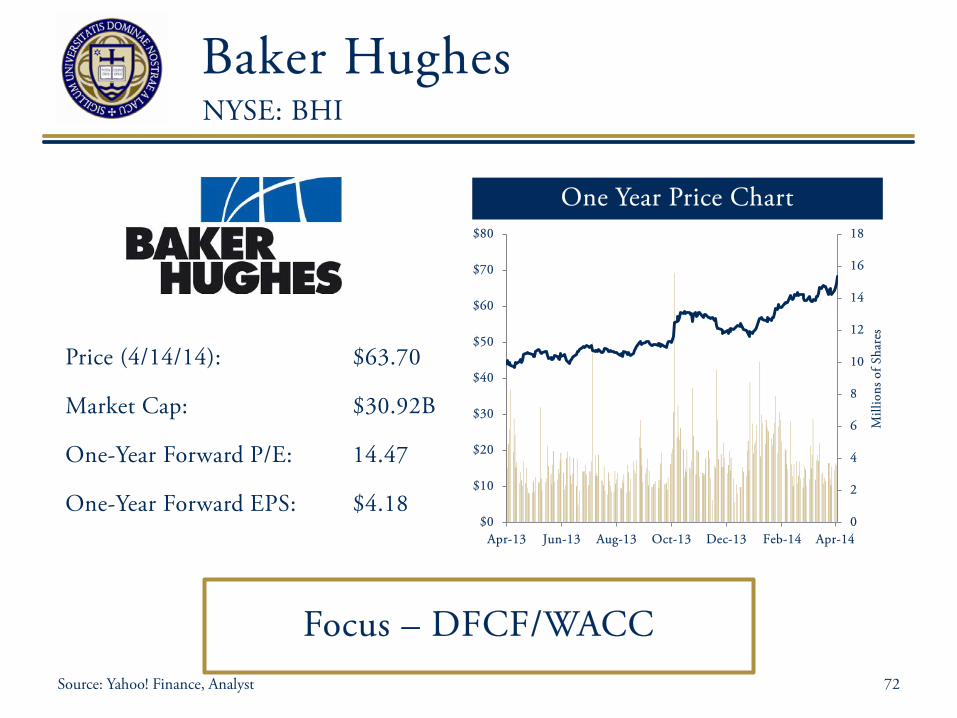
Baker Hughes
Price (4/14/14): $63.70
Market Cap: $30.92B
One-Year Forward P/E: 14.47
One-Year Forward EPS: $4.18
Focus – DFCF/WACC

73
2013 Revenues • Supplier of products and services to the worldwide oil & gas industry – Oilfield Operations & Industrial
Services Segments – Revenues driven by operations
• 2010 acquisition of BJ Services
Revenue Growth
49%
10%
17%
18%
6%
North America
Latin America
Europe/Africa/ RussiaCaspian
Middle East/AsiaPacific
Industrial Services
59%
35%
6% Completion andProduction
Drilling andEvaluation
Industrial Services-30%
-10%
10%
30%
50%
$-
$5
$10
$15
$20
$25
2004 2006 2008 2010 2012
Sale
s Gro
wth
(%
)
Tot
al R
even
ues
(Bill
ions
)
Revenue Sales Growth
Source: Company Filings
Background

Middle East/Asia Pacific Revenue Analysis 2014 2015 2016 2017 2018
Revenue $ 5,022 $ 6,026 $ 6,930 $ 7,277 $ 7,641 Growth in Revenue 24.0% 20.0% 15.0% 5.0% 5.0%
DFCF Revenue Build
74
• Latin America revenue stagnates as BHI repositions
• Middle East continues to
be firm’s fastest growing segment, normalizing in 2017
Source: Company Filings, AIM/Maguire 2014
($ in millions)
($ in millions)
($ in millions)
Latin America Revenue Analysis 2014 2015 2016 2017 2018
Revenue $ 2,192 $ 2,192 $ 2,246 $ 2,303 $ 2,360 Growth in Revenue -5.0% 0.0% 2.5% 2.5% 2.5%
BHI Projected Revenue by Reporting Segment 2014 2015 2016 2017 2018
North America $ 11,531 $ 12,684 $ 13,635 $ 14,317 $ 14,675 Latin America $ 2,192 $ 2,192 $ 2,246 $ 2,303 $ 2,360 Europe/Africa/ Russia Caspian $ 4,235 $ 4,553 $ 4,780 $ 5,019 $ 5,270 Middle East/Asia Pacific $ 5,022 $ 6,026 $ 6,930 $ 7,277 $ 7,641 Industrial Services $ 1,369 $ 1,437 $ 1,509 $ 1,584 $ 1,663 Total Revenue $ 24,348 $ 26,891 $ 29,101 $ 30,500 $ 31,609 Growth in Total Revenue 8.87% 10.45% 8.22% 4.81% 3.64%

DFCF
75
Beta Regression Results Monthly Monthly
(Post-Acquisition) Industry
Predicted Beta 1.61 1.54 1.71 R2 35.14% 32.75% 67.55% Adjusted Beta 1.41 1.36 1.48
WACC Calculation Total Debt After-Tax Cost of Debt Total Equity Cost of Equity WACC
$6,015 2.48% $28,604 9.76% 8.50% ($ in millions)
• Rationale: Below industry beta consistent with diversified offerings versus singularly focused competitors.
• Final Beta Forecast:1.4
Cost of Equity- CAPM Equity Risk Premium 5.0% Risk Free Rate 2.76% Beta 1.4 Cost of Equity 9.76%
Weighted Average Cost of Capital
Cost of Debt Cost of Debt 3.68% Tax Rate 32.50% After-Tax Cost of Debt 2.48%
Source: Company Filings, AIM/Maguire 2014

Investment Thesis: • Revenue growth driven by E&P Spending and ultimately energy prices • Potential ability to gain market through superior technology and processes • Good company, expensive stock
76
Recommendation – Do Not Buy Valuation Method Weight Valuation Contribution
Book Value/Share 0% $ 40.89 $ - DFCF Value / Share 80% $ 57.16 $ 45.73 Forward Price/Earnings Multiple 10% $ 60.42 $ 6.04 DDM Analysis 0% $ 13.49 $ - Implied DDM Analysis 10% $ 70.41 $ 7.04
Intrinsic Value $ 58.81 Market Price (04/14/2014) $ 63.70 Estimated Upside/(Downside) (7.7%)
Valuation and Thesis Baker Hughes
Source: Analyst

Price (4/14/14): $20.41
Market Cap: $1.6B
One-Year Forward P/E: 226.8
One-Year Forward EPS: $0.09
One Year Price Chart
77
0
1
2
3
4
5
6
7
8
9
10
$-
$5
$10
$15
$20
$25
$30
$35
Apr-13 Jun-13 Aug-13 Oct-13 Dec-13 Feb-14 Apr-14
Mill
ions
of S
hare
s
NYSE: WWE
Source: Yahoo Finance
Focus – Discovery
World Wrestling Entertainment
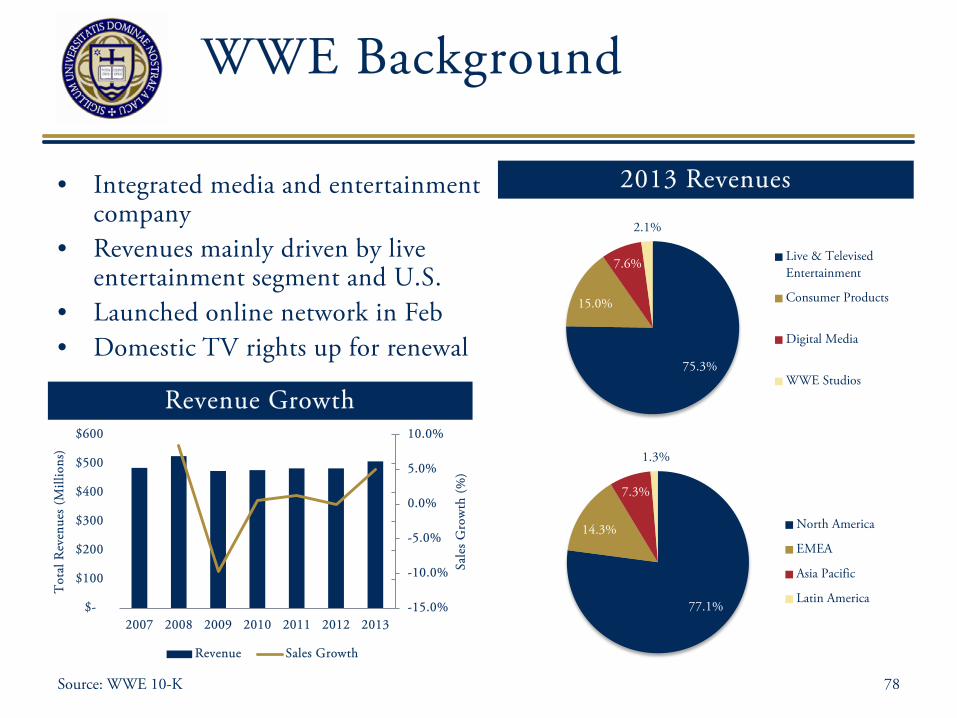
WWE Background
78
75.3%
15.0%
7.6%
2.1%
Live & TelevisedEntertainment
Consumer Products
Digital Media
WWE Studios
2013 Revenues
77.1%
14.3%
7.3%
1.3%
North America
EMEA
Asia Pacific
Latin America
• Integrated media and entertainment company
• Revenues mainly driven by live entertainment segment and U.S.
• Launched online network in Feb • Domestic TV rights up for renewal
Revenue Growth
-15.0%
-10.0%
-5.0%
0.0%
5.0%
10.0%
$-
$100
$200
$300
$400
$500
$600
2007 2008 2009 2010 2011 2012 2013
Sale
s Gro
wth
(%
)
Tot
al R
even
ues
(Mill
ions
)
Revenue Sales Growth
Source: WWE 10-K
$0
$1
$2
$3
$4
$5
NFL MLB NBA NASCAR WWE
TV
Rig
hts F
ees (
$Bill
ions
)
Current Deal Prior Deal
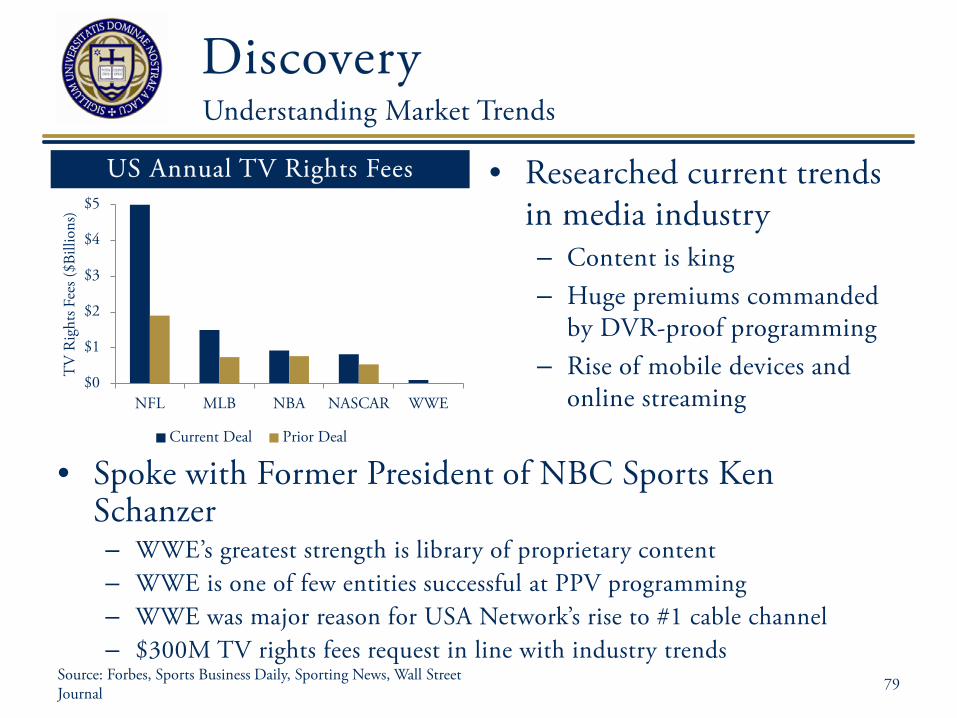
Discovery
• Researched current trends in media industry – Content is king – Huge premiums commanded
by DVR-proof programming – Rise of mobile devices and
online streaming
Understanding Market Trends
79
US Annual TV Rights Fees
• Spoke with Former President of NBC Sports Ken Schanzer – WWE’s greatest strength is library of proprietary content – WWE is one of few entities successful at PPV programming – WWE was major reason for USA Network’s rise to #1 cable channel – $300M TV rights fees request in line with industry trends Source: Forbes, Sports Business Daily, Sporting News, Wall Street
Journal

Discovery
• Annual domestic TV rights fees increase 150% • WWE Network surpasses 1M subscribers in early 2015 • WWE Network cannibalizes Pay-per-view revenues
Impact on Financial Performance
80
$- $50
$100 $150 $200 $250 $300 $350 $400
2007 2008 2009 2010 2011 2012 2013 2014(e) 2015(e) 2016(e) 2017(e) 2018(e)
Rev
enue
s (M
illio
n)
TV Rights Fees Pay-per-view WWE Network
Live & TV Entertainment Revenues
Source: WWE 10-K

Investment Thesis: • Strong growth potential from WWE Network in U.S. and internationally • Growing emphasis on live entertainment will drive significant TV rights fees increase • No additional investment required for increased TV rights fees, so margins and asset turnover
should improve significantly
81
Recommendation – Buy Valuation Method Weight Valuation Contribution
Base Case DFCF/Share 50% $ 22.02 $ 11.01 Bull Case DFCF/Share 20% $ 31.21 $ 6.24 Bear Case DFCF/Share 15% $ 14.96 $ 2.24 Dividend Discount Model 15% $ 21.49 $ 3.22 Forward Price/Earnings Multiple 0% $ 4.88 $ - Forward EV/EBITDA Multiple 0% $ 1.55 $ - Forward Price/EBITDA Multiple 0% $ 1.72 $ - Book Value/Share 0% $ 3.44 $ -
Intrinsic Value $ 22.72 Market Price (4/14/2014) $ 20.41 Estimated Upside/(Downside) 11.3%
Valuation and Thesis WWE

Check Point Software
Price (4/14/14): $65.82
Market Cap: $13.3B
One-Year Forward P/E: 20.00
One-Year Forward EPS: $3.80
One Year Price Chart
82
0
1
2
3
4
5
6
7
8
9
10
$-
$10
$20
$30
$40
$50
$60
$70
$80
Apr-13 Jun-13 Aug-13 Oct-13 Dec-13 Feb-14
Mill
ions
of S
hare
s
NASDAQ: CHKP
Source: YahooFinance, AIM/Kitts 2014
Focus – Technical Analysis

Company Overview
• Incorporated in 1993 • HQ: Tel Aviv, Israel • Hardware and software solutions
• Customization & flexibility • Network gateways & endpoints • Channel partner strategy
83
“Inventors of the modern firewall”
Revenue & Margins 2013 Revenue by Region
47%
37%
16%
Americas Europe AMEA
Source: CapitalIQ and Company 20-F
-40%
-20%
0%
20%
40%
60%
80%
100%
$0
$200
$400
$600
$800
$1,000
$1,200
$1,400
$1,600
1999 2001 2003 2005 2007 2009 2011 2013
Rev
enue
(M
illio
ns)
Sales: Products Sales: Services Revenue Growth
GPM NPM

Technical Analysis
Relative Strength: Buy • Examines performance of a stock relative to a market index
Relative Strength (1 Year)
84 Source: StockCharts.com
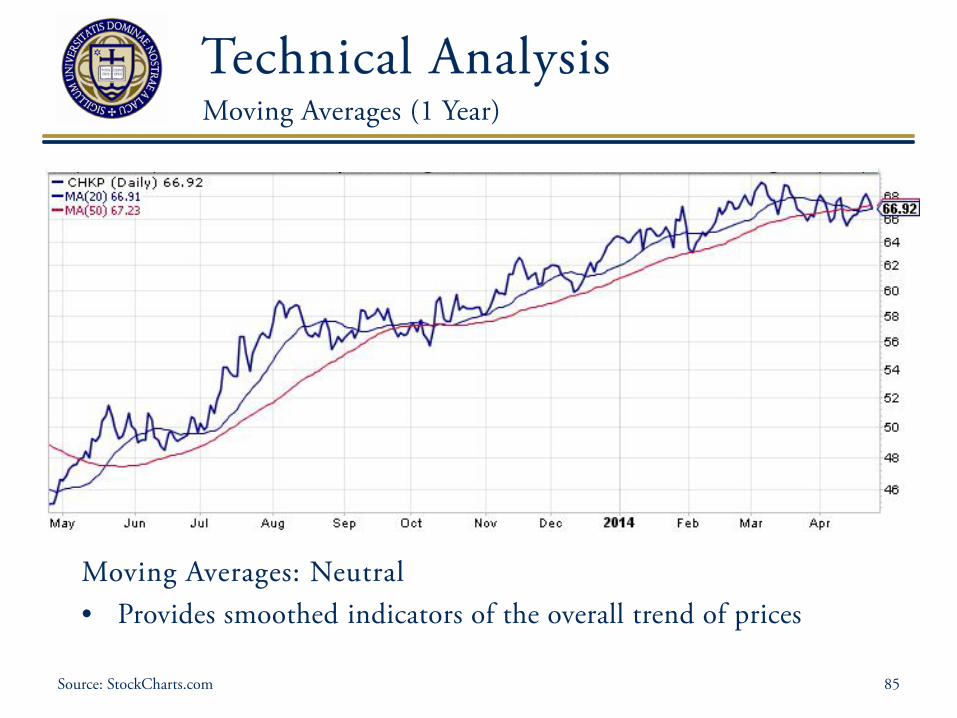
Technical Analysis
Moving Averages: Neutral • Provides smoothed indicators of the overall trend of prices
Moving Averages (1 Year)
85 Source: StockCharts.com

Technical Analysis
Support and Resistance (3 Year)
86
Resistance @ $60
Support @ $52.29
Resistance @ $52.29
Support @ $44.80
Support & Resistance: Neutral • Two different levels of support and resistance before trading
within an upward channel for most of 2013
Source: StockCharts.com

Technical Analysis
Support and Resistance (1 Year)
87
Support & Resistance: Neutral • Recent channel breakout and possible new levels of support and
resistance
Support @ $65.63
Resistance @ $68.10
Source: StockCharts.com
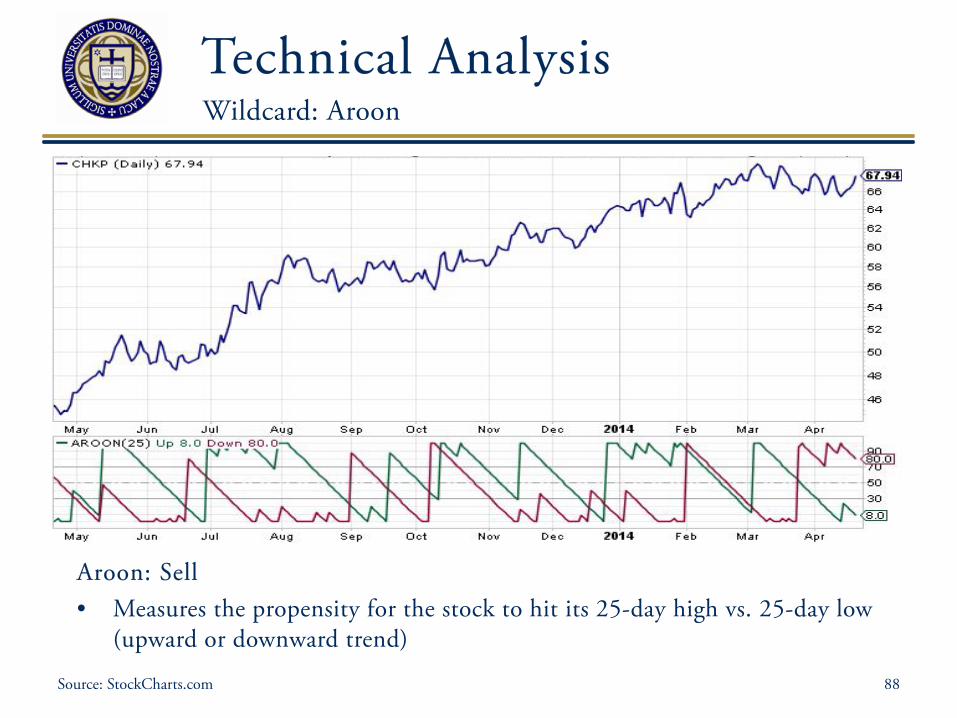
Technical Analysis
Aroon: Sell • Measures the propensity for the stock to hit its 25-day high vs. 25-day low
(upward or downward trend)
Wildcard: Aroon
88 Source: StockCharts.com
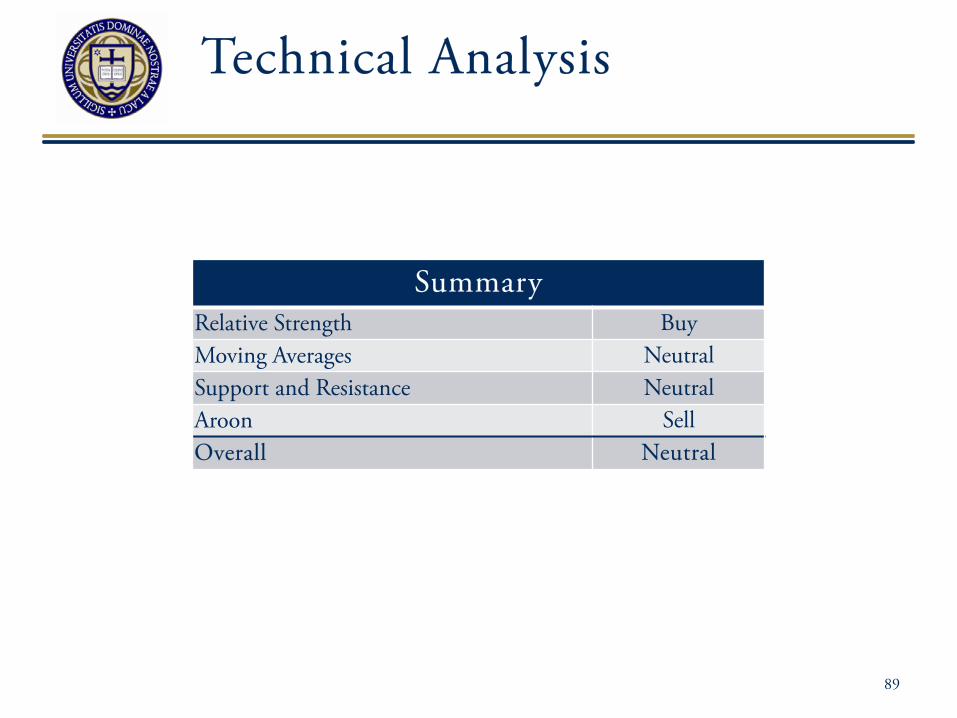
Technical Analysis
89
Summary Relative Strength Buy Moving Averages Neutral Support and Resistance Neutral Aroon Sell Overall Neutral

Investment Thesis: • Strong reputation in the industry; leader in network gateway and endpoint solutions • Healthy balance sheet; ability to take advantage of worthy acquisitions • Internet of things/connectedness amplifies the need for improved and innovative solutions
90
Recommendation - Buy Valuation Method Weight Valuation Contribution
Book Value/Share 0% $ 18.73 $ - DFCF Value / Share 80% $ 72.16 $ 57.73 Forward Price/Earnings Multiple 5% $ 76.01 $ 3.80 Forward EV/EBITDA 5% $ 74.08 $ 3.70 Forward Price/Book Multiple 5% $ 80.50 $ 4.02 Forward Price/Sales 5% $ 77.75 $ 3.89
Intrinsic Value $ 73.14 Market Price (04/14/2014) $ 65.82 Estimated Upside/(Downside) 11.1%
Valuation and Thesis Check Point Software Technologies LTD.
Source: AIM/Kitts 2014
Portfolio Performance Evaluation
Historical Performance
Risk Adjusted Performance Measures
Attribution Analysis
Active Share
Pick Performance
Portfolio Composition
91

Return Comparison Cumulative Return of $1
92
* As of 3/31/2014
Source: BNY Mellon Workbench
$0.00
$1.00
$2.00
$3.00
$4.00
$5.00
$6.00
$7.00
$8.00
1996 1997 1998 1999 2000 2001 2002 2003 2004 2005 2006 2007 2008 2009 2010 2011 2012 2013 2014
AIM HBI Russell 2000 S&P 500

Historical Performance AIM Portfolio Returns vs. Benchmark Returns
93 Source: BNY Mellon Workbench
* As of 3/31/2014
28.8%
19.6%
24.9%
9.5%
11.8%
0%
5%
10%
15%
20%
25%
30%
35%
1-Y 3-Y 5-Y 10-Y Since Inception
AIM HBI Russell 2000 S&P 500

Return Comparison Cumulative Return of $1
94 Source: BNY Mellon Workbench; Yahoo Finance
$0.00
$0.20
$0.40
$0.60
$0.80
$1.00
$1.20
$1.40
$1.60
$1.80
2007 2008 2009 2010 2011 2012 2013 2014
AIM iShares MSCI KLD 400 Social (DSI)* As of 4/1/2014

Performance Measures
• Measure of portfolio return, adjusted for risk • Jensen’s Alpha: α = rp,t - [rF,t +βp x (rm,t – rf,t))]
– Shows average portfolio return beyond that predicted by CAPM
• Sharpe Ratio: (rp - rf) / σp – Shows whether portfolio returns are due to increased risk or smart
investment
Risk-Adjusted
95

Jensen’s Alpha
96
0%
1%
2%
3%
4%
5%
6%
7%
8%
9%
10%
1 Year 3 Year 5 Year Since Inception
AIM vs. HBI AIM vs. S&P

Sharpe Ratio
97
0.0
0.5
1.0
1.5
2.0
2.5
3.0
1 Year 3 Year 5 Year Since Inception
AIM S&P HBI

Attribution Analysis
• Allocation: Ability to effectively allocate assets to various sectors
• Selection: Ability to select securities within a sector relative to a benchmark
• Net Management Effect = Allocation + Selection
98
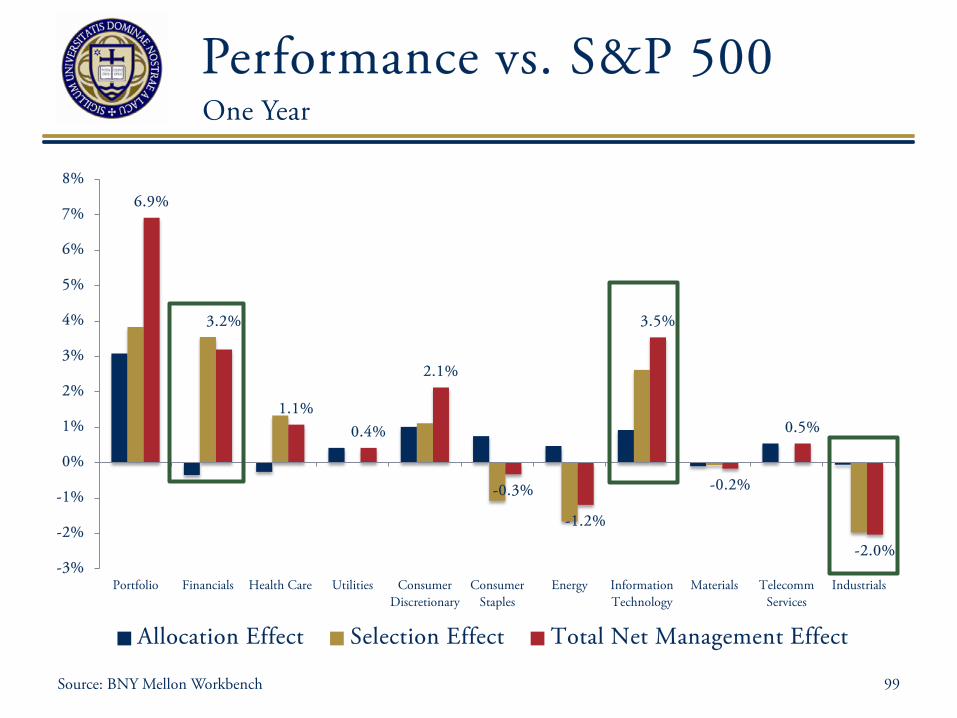
Performance vs. S&P 500 One Year
99
6.9%
3.2%
1.1% 0.4%
2.1%
-0.3%
-1.2%
3.5%
-0.2%
0.5%
-2.0% -3%
-2%
-1%
0%
1%
2%
3%
4%
5%
6%
7%
8%
Portfolio Financials Health Care Utilities ConsumerDiscretionary
ConsumerStaples
Energy InformationTechnology
Materials TelecommServices
Industrials
Allocation Effect Selection Effect Total Net Management Effect
Source: BNY Mellon Workbench
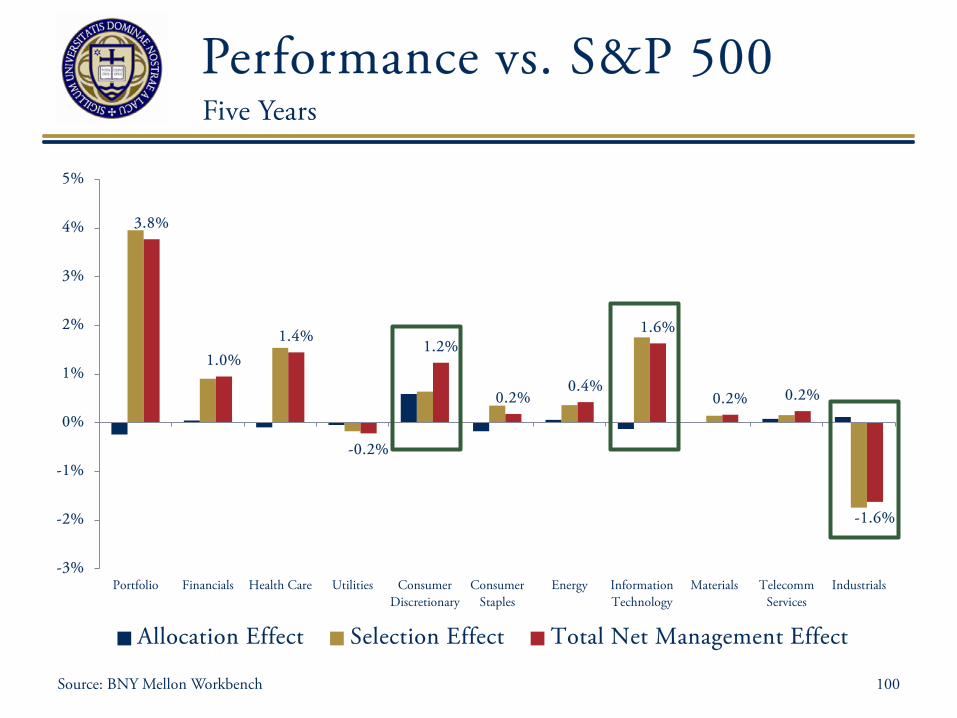
Performance vs. S&P 500 Five Years
100
3.8%
1.0% 1.4%
-0.2%
1.2%
0.2% 0.4%
1.6%
0.2% 0.2%
-1.6%
-3%
-2%
-1%
0%
1%
2%
3%
4%
5%
Portfolio Financials Health Care Utilities ConsumerDiscretionary
ConsumerStaples
Energy InformationTechnology
Materials TelecommServices
Industrials
Allocation Effect Selection Effect Total Net Management Effect
Source: BNY Mellon Workbench

Best & Worst Performers
Top Five Performers Bottom Five Performers Company Return
Dollar Tree* -12.6%
PotashCorp -11.3%
Select Comfort -7.7%
Teradata -7.1%
Apache* -6.0%
101
Company Return
Delphi 57.0%
Jos A. Bank 54.4%
Corning Inc. 52.7%
InterActiveCorp 52.5%
Gilead Sciences 46.1% * Holding Period Returns

Active Share
• Measure of differentiation between a portfolio and the market, helps avoid closet indexing
• Developed by Martijn Cremers from ND Finance Department, and has become widely used in the financial industry
• Function of the weight of each security’s position in a given portfolio compared to that same security’s weight in a market index fund
• Higher percentage indicates more active management • Historically, funds with Active Share above 90%
outperformed benchmark by 1.13% after fees
Introduction
102

Active Share
Inherited Portfolio: 89.51%
103
Ticker Stock AIM Weight S&P Weight Difference AAPL Apple, Inc 4.37% 3.02% 1.35% APA Apache Corp 3.20% 0.21% 2.99% ATVI Activision Blizzard 4.23% 0.00% 4.23% CMI Cummins, Inc 4.05% 0.15% 3.90% COT Cott Corp 3.44% 0.00% 3.44% CVA Covanta Holding Corp 4.27% 0.00% 4.27%
DLPH Delphi Automotive 4.88% 0.11% 4.77% DLTR Dollar Tree 3.26% 0.06% 3.20%
EL Estee Lauder 3.41% 0.11% 3.30% EXPD Expeditors International 3.00% 0.05% 2.95% GILD Gilead Sciences 3.85% 0.68% 3.17% GLW Corning, Inc 4.80% 0.18% 4.62%
GOOG Google 4.51% 1.78% 2.73% IACI Interactive Corp 4.64% 0.00% 4.64% INTC Intel 3.65% 0.79% 2.86% IPGP IPG Photonics 3.58% 0.00% 3.58% JOSB Jos. A. Bank Clothiers, Inc 4.86% 0.00% 4.86% MSFT Microsoft 4.15% 1.80% 2.35% POT PotashCorp 3.83% 0.00% 3.83%
PXLW Pixelworks, Inc 4.73% 0.00% 4.73% RDH Diamondrock Hospitality Co 3.72% 0.00% 3.72% ROK Rockwell Automation 4.45% 0.11% 4.34% SCSS Select Comfort Corp 2.77% 0.00% 2.77% TDC Teradata 3.42% 0.04% 3.38% UNH United Health Group 3.98% 0.45% 3.53%
Active Share as of 4/25/2014 89.51%
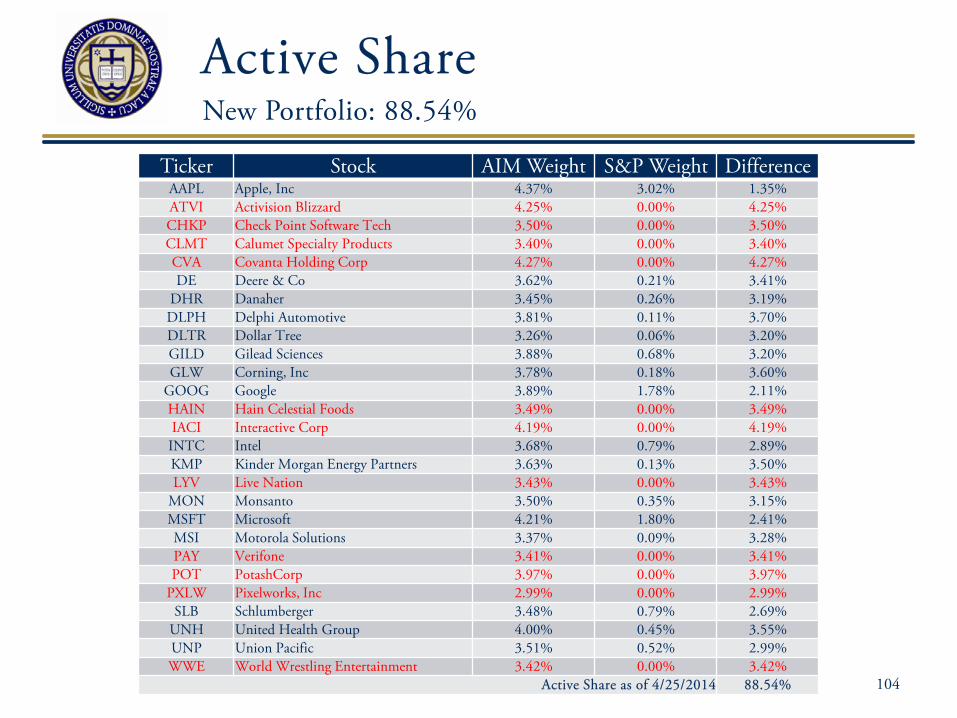
Active Share New Portfolio: 88.54%
104
Ticker Stock AIM Weight S&P Weight Difference AAPL Apple, Inc 4.37% 3.02% 1.35% ATVI Activision Blizzard 4.25% 0.00% 4.25% CHKP Check Point Software Tech 3.50% 0.00% 3.50% CLMT Calumet Specialty Products 3.40% 0.00% 3.40% CVA Covanta Holding Corp 4.27% 0.00% 4.27% DE Deere & Co 3.62% 0.21% 3.41%
DHR Danaher 3.45% 0.26% 3.19% DLPH Delphi Automotive 3.81% 0.11% 3.70% DLTR Dollar Tree 3.26% 0.06% 3.20% GILD Gilead Sciences 3.88% 0.68% 3.20% GLW Corning, Inc 3.78% 0.18% 3.60%
GOOG Google 3.89% 1.78% 2.11% HAIN Hain Celestial Foods 3.49% 0.00% 3.49% IACI Interactive Corp 4.19% 0.00% 4.19% INTC Intel 3.68% 0.79% 2.89% KMP Kinder Morgan Energy Partners 3.63% 0.13% 3.50% LYV Live Nation 3.43% 0.00% 3.43%
MON Monsanto 3.50% 0.35% 3.15% MSFT Microsoft 4.21% 1.80% 2.41% MSI Motorola Solutions 3.37% 0.09% 3.28% PAY Verifone 3.41% 0.00% 3.41% POT PotashCorp 3.97% 0.00% 3.97%
PXLW Pixelworks, Inc 2.99% 0.00% 2.99% SLB Schlumberger 3.48% 0.79% 2.69%
UNH United Health Group 4.00% 0.45% 3.55% UNP Union Pacific 3.51% 0.52% 2.99% WWE World Wrestling Entertainment 3.42% 0.00% 3.42%
Active Share as of 4/25/2014 88.54%

Pick Performance Portfolio Management
105
• AIM XXXVII analysts sold 10 inherited stocks and bought 7 new stocks
• Portfolio decisions made by AIM XXXVII resulted in short-term benefit for the portfolio
• 18% of total return since AIM XXXVII portfolio was finalized is attributable to changes made to the portfolio
Returns Actual Return 3.97% Passive Return (No Changes) 3.24% Improvement 0.73%

Pick Performance
106
• Only 7 of 25 second stocks outperformed S&P 500 • Analysts did well identifying market underperformers to sell or
pass over • Stocks added to portfolio only slightly outperformed S&P 500
benchmark • Stocks replaced considerably underperformed S&P 500
Closer Look
Inherited Stocks Average Inherited Stock Return 3.24% Average Return of Held Stocks 4.37% Average Return of Sold Stocks 0.62%
Second Stocks Average 2nd Stock Return -2.43% Average Return of Bought Stocks 2.08% Average Return of Passed Stocks -3.94%
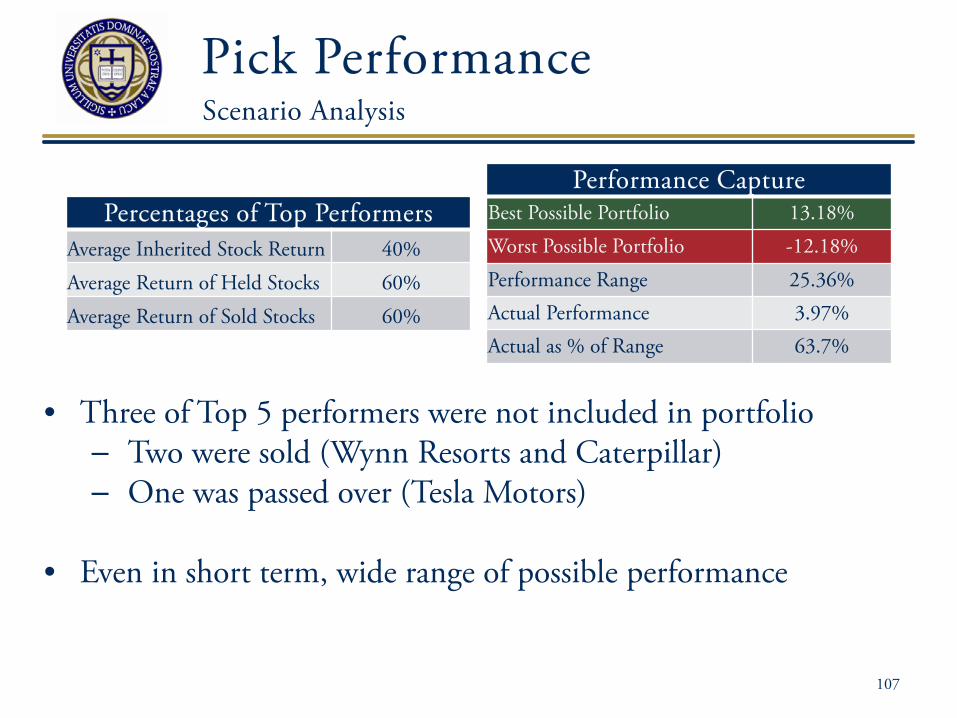
Pick Performance
107
Scenario Analysis
• Three of Top 5 performers were not included in portfolio ─ Two were sold (Wynn Resorts and Caterpillar) ─ One was passed over (Tesla Motors)
• Even in short term, wide range of possible performance
Percentages of Top Performers Average Inherited Stock Return 40% Average Return of Held Stocks 60% Average Return of Sold Stocks 60%
Performance Capture Best Possible Portfolio 13.18% Worst Possible Portfolio -12.18% Performance Range 25.36% Actual Performance 3.97% Actual as % of Range 63.7%

Portfolio Composition Current Portfolio (4/21/14)
108
Stock Ticker Weight Market Value Stock Ticker Weight Market Value
Activision Blizzard ATVI 4.3% $ 417,900 Kinder Morgan* KMP 3.5% $ 338,756 Apple AAPL 4.4% $ 425,359 Live Nation* LYV 3.6% $ 348,168 Calumet* CLMT 3.5% $ 338,924 Microsoft MSFT 4.1% $ 403,899 Check Point Software* CHKP 3.5% $ 341,500 Monsanto* MON 3.4% $ 335,820 Corning GLW 3.8% $ 371,525 Motorola Solutions* MSI 3.2% $ 316,815 Covanta Holding Corp CVA 4.2% $ 413,770 Pixelworks PXLW 3.1% $ 304,110 Danaher* DHR 3.4% $ 330,975 PotashCorp POT 3.9% $ 384,480 Deere & Co.* DE 3.5% $ 345,358 Schlumberger* SLB 3.4% $ 336,699 Delphi Automotive DLPH 3.9% $ 378,565 Union Pacific* UNP 3.5% $ 345,690 Dollar Tree DLTR 3.2% $ 313,296 United Health UNH 3.7% $ 363,648 Gilead Sciences GILD 4.1% $ 400,730 Verifone* PAY 3.7% $ 356,895 Google GOOG 3.9% $ 377,574 WWE* WWE 3.7% $ 361,440 Hain Celestial Group* HAIN 3.5% $ 342,615 Proshares Ultrashort Tech* REW 0.0% $ 4,756 Intel INTC 3.6% $ 351,604 Consumer Discretionary* XLY 0.1% $ 5,095 Interactive Corp IACI 4.3% $ 416,760 Cash 0.3% $ 32,995 * denotes new position Total 100.0% $ 9,805,721

Portfolio Composition New Stock Purchases
109
Stock Ticker Calumet CLMT
Check Point Software CHKP
Danaher DHR
Deere & Co. DE
Hain Celestial Group HAIN
Kinder Morgan KMP
Live Nation LYV
Monsanto MON
Motorola Solutions MSI
Schlumberger SLB
Union Pacific UNP
Verifone PAY
World Wrestling Entertainment WWE

Portfolio Composition Stocks Sold
110
Stock Ticker Apache Corp APA
Cott Corp COT
Cummins CMI
Diamondrock Hospitality DRH
Estee Lauder Companies EL
Expeditors International EXPD
IPG Photonics IPGP
Joseph A Bank JOSB
Rockwell Automation ROK
Select Comfort SCSS
Teradata TDC

Portfolio Composition Stocks Passed
111
Stock Ticker 3D Systems DDD
Amazon AMZN
Baker Hughes Inc. BHI
Cabot Oil & Gas Corp COG
Fabrinet FN
InvenSense INVN
Lionsgate LGF
Salesforce.com CRM
Stratasys SSYS
Tesla TSLA
U.S. Bancorp USB
Under Armour UA
Whole Foods Market, Inc WFM
Yum Brands YUM

General Information
Guest Speakers
Chicago Trip
Website
Newsletter
112

Guest Speakers
113
Ed Trubac Professor Emeritus, Finance
John Russell Relative Value Partners
Brian Wrona Notre Dame Investment Office

Chicago Trip
The Palmer House Hilton Dinner at Maggiano’s
114
March 20-21

Chicago Trip Speakers
Matt Klody - Founder Chris O’Brien – Managing Director
115
March 20-21

Chicago Trip Speakers
Benedict Rocchio - Partner Paul Purcell – Chairman & CEO
116
March 20-21

Chicago Trip
117
CBOT
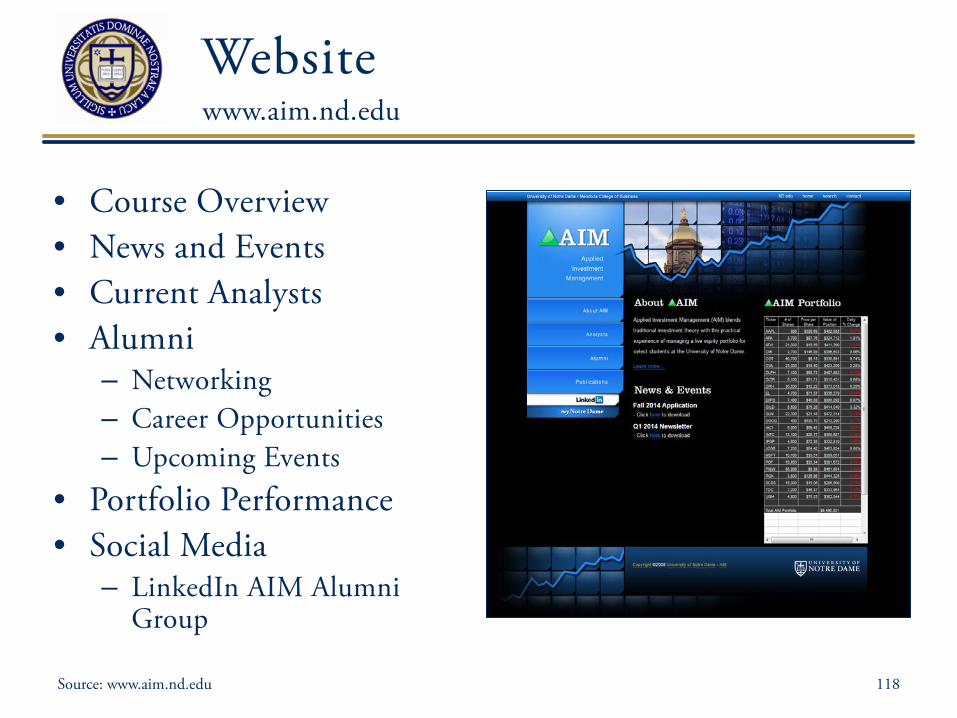
Website
• Course Overview • News and Events • Current Analysts • Alumni
– Networking – Career Opportunities – Upcoming Events
• Portfolio Performance • Social Media
– LinkedIn AIM Alumni Group
www.aim.nd.edu
118 Source: www.aim.nd.edu

AIM Newsletter
• Economic Outlook
• Portfolio Performance
• Portfolio Composition
• Alumni Updates
• Current Class Profile
119
• AIM XXXVIII would like to thank: – The Advisory Board – Scott Malpass – Notre Dame Investment Office – Jerry Langley, Bill McDonald, Frank Reilly – Rachel Karnafel
• Post-Presentation Agenda
– Short Break – Advisory Board panel discussion
120
Closing

AIM XXXVIII
121