ADI FINECHEM - Nirmal Bang Finechem Ltd.pdf · Adi FineChem Ltd 4 Recommendation ... Palmitic and...
15
A LEAP FORWARD ADI FINECHEM
Transcript of ADI FINECHEM - Nirmal Bang Finechem Ltd.pdf · Adi FineChem Ltd 4 Recommendation ... Palmitic and...

A LEAP FORWARDADI FINECHEM
1 | P a g e
Adi FineChem Ltd 4
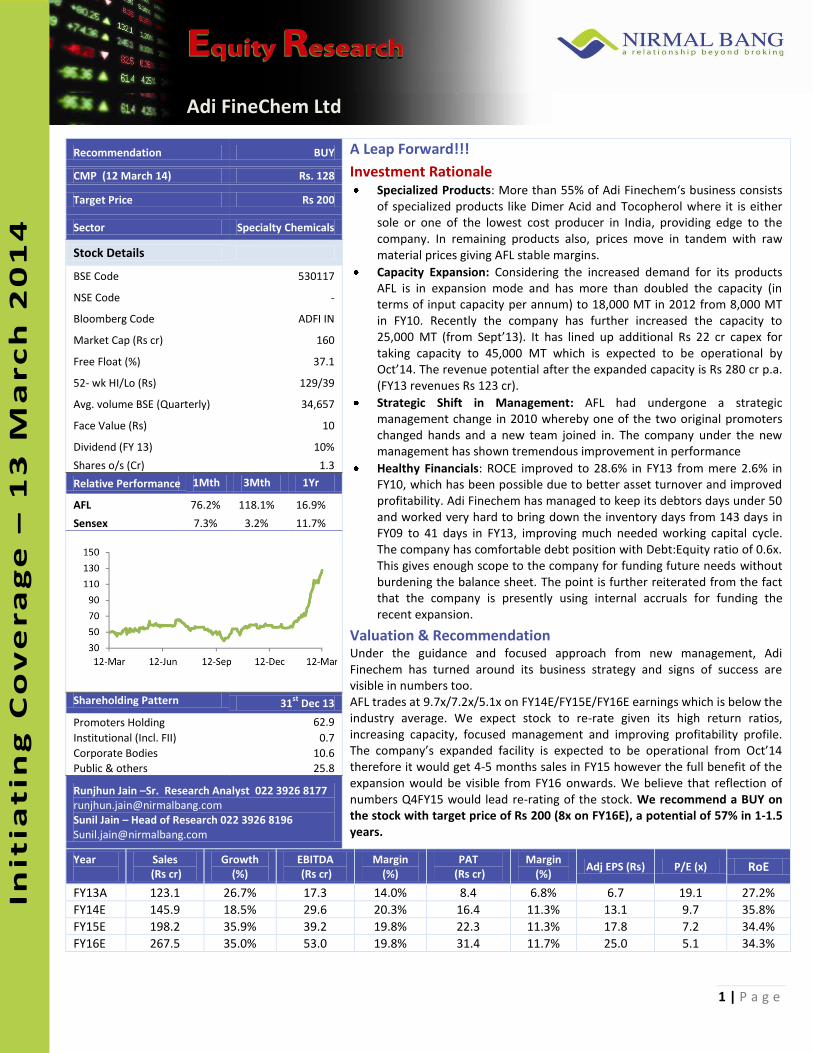
Recommendation BUY A Leap Forward!!!
Investment Rationale Specialized Products: More than 55% of Adi Finechem‘s business consists
of specialized products like Dimer Acid and Tocopherol where it is either sole or one of the lowest cost producer in India, providing edge to the company. In remaining products also, prices move in tandem with raw material prices giving AFL stable margins.
Capacity Expansion: Considering the increased demand for its products AFL is in expansion mode and has more than doubled the capacity (in terms of input capacity per annum) to 18,000 MT in 2012 from 8,000 MT in FY10. Recently the company has further increased the capacity to 25,000 MT (from Sept’13). It has lined up additional Rs 22 cr capex for taking capacity to 45,000 MT which is expected to be operational by Oct’14. The revenue potential after the expanded capacity is Rs 280 cr p.a. (FY13 revenues Rs 123 cr).
Strategic Shift in Management: AFL had undergone a strategic management change in 2010 whereby one of the two original promoters changed hands and a new team joined in. The company under the new management has shown tremendous improvement in performance
Healthy Financials: ROCE improved to 28.6% in FY13 from mere 2.6% in FY10, which has been possible due to better asset turnover and improved profitability. Adi Finechem has managed to keep its debtors days under 50 and worked very hard to bring down the inventory days from 143 days in FY09 to 41 days in FY13, improving much needed working capital cycle. The company has comfortable debt position with Debt:Equity ratio of 0.6x. This gives enough scope to the company for funding future needs without burdening the balance sheet. The point is further reiterated from the fact that the company is presently using internal accruals for funding the recent expansion.
Valuation & Recommendation
Under the guidance and focused approach from new management, Adi Finechem has turned around its business strategy and signs of success are visible in numbers too. AFL trades at 9.7x/7.2x/5.1x on FY14E/FY15E/FY16E earnings which is below the industry average. We expect stock to re-rate given its high return ratios, increasing capacity, focused management and improving profitability profile. The company’s expanded facility is expected to be operational from Oct’14 therefore it would get 4-5 months sales in FY15 however the full benefit of the expansion would be visible from FY16 onwards. We believe that reflection of numbers Q4FY15 would lead re-rating of the stock. We recommend a BUY on the stock with target price of Rs 200 (8x on FY16E), a potential of 57% in 1-1.5 years.
CMP (12 March 14) Rs. 128
Target Price Rs 200
Sector Specialty Chemicals
Stock Details
BSE Code 530117
NSE Code -
Bloomberg Code ADFI IN
Market Cap (Rs cr) 160
Free Float (%) 37.1
52- wk HI/Lo (Rs) 129/39
Avg. volume BSE (Quarterly) 34,657
Face Value (Rs) 10
Dividend (FY 13) 10%
Shares o/s (Cr) 1.3
Relative Performance 1Mth 3Mth 1Yr
AFL 76.2% 118.1% 16.9%
Sensex 7.3% 3.2% 11.7%
Shareholding Pattern 31st
Dec 13
Promoters Holding 62.9
Institutional (Incl. FII) 0.7
Corporate Bodies 10.6
Public & others 25.8
Runjhun Jain –Sr. Research Analyst 022 3926 8177 [email protected] Sunil Jain – Head of Research 022 3926 8196 [email protected]
Year
Sales (Rs cr)
Growth (%)
EBITDA (Rs cr)
Margin (%)
PAT (Rs cr)
Margin (%)
Adj EPS (Rs) P/E (x) RoE
FY13A 123.1 26.7% 17.3 14.0% 8.4 6.8% 6.7 19.1 27.2%
FY14E 145.9 18.5% 29.6 20.3% 16.4 11.3% 13.1 9.7 35.8%
FY15E 198.2 35.9% 39.2 19.8% 22.3 11.3% 17.8 7.2 34.4%
FY16E 267.5 35.0% 53.0 19.8% 31.4 11.7% 25.0 5.1 34.3%

2 | P a g e
Adi FineChem Ltd Company Profile
Adi Finechem Limited (AFL) is a twenty years commercially old company specializing in manufacturing of Oleo Chemical and Neutraceuticals
AFL’s key products are Mixed Tocopherols, Sterols, Dimer Acid, Linoleic Acid, Distilled fatty acids, Palmitic and Monobasic Acid
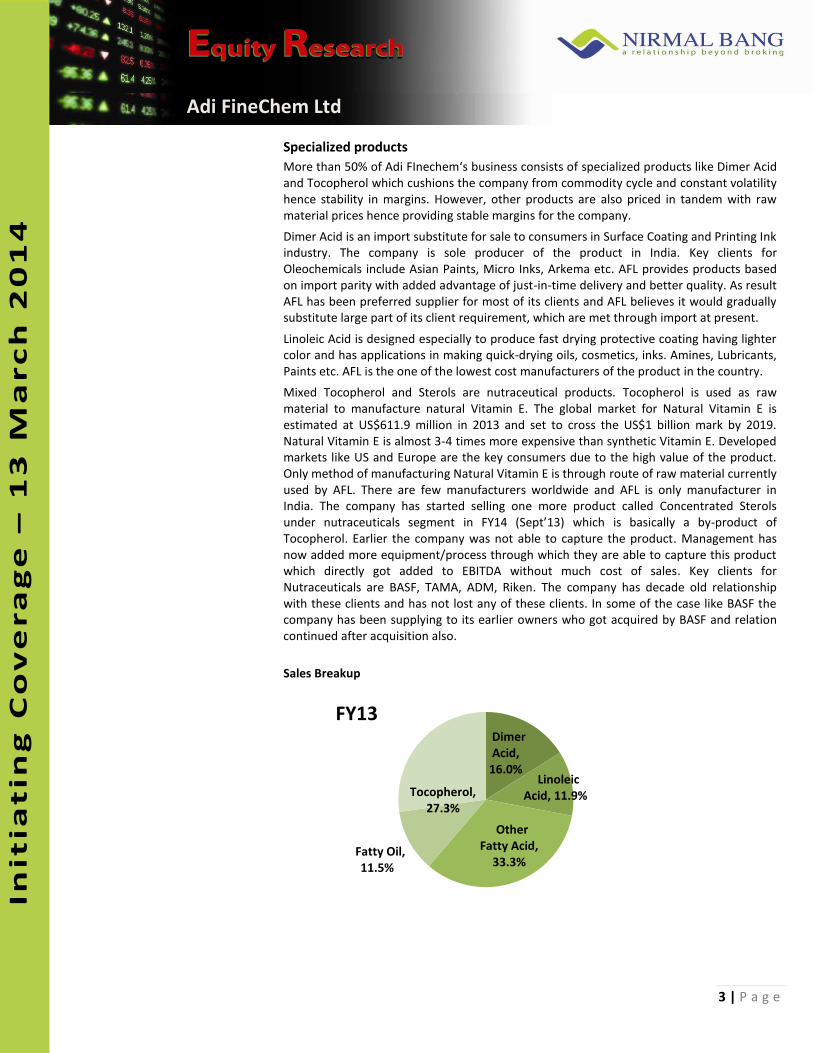
AFL is the only company to manufacture Dimer Acid (Oleo Chemical, 16% of FY13 revenues) and Tocopherol (Neutraceutical, 27% of FY13 revenues) in India
Oleo Chemicals are chemicals derived from Plant and Animal Fats.
Dimer Acid is an import substitute for sale to consumers in Surface Coating and Printing Ink industry. In India, the estimated market size is 8,000 mt and currently AFL is supplying around 20% of that. Key clients include Asian Paints, Micro Inks, Arkema etc.
Linoleic Acid is used in making quick-drying oils, which are useful in oil paints and varnishes.
Mixed Tocopherol concentrate and Sterols concentrate are nutraceutical products. Tocopherol is used as raw material to make natural vitamin E. The global market for Natural Vitamin E is estimated at US$611.9 million in 2013 and set to cross the US$1 billion mark by 2019. AFL exports 100% of its nutraceutical products and key clients are BASF, TAMA, ADM, Riken
AFL has a state -of-the-art Manufacturing unit which was set up in 1995. The company has acquired critical equipment’s from Germany and Switzerland. The existing plant capacity is 25,000MT. A new player to set up similar kind of greenfield facility would require 2.5 years and approx. Rs 100 cr capex (excluding cost of land)
Investment Rationale Source: Company
3 | P a g e
Adi FineChem Ltd
Specialized products
More than 50% of Adi FInechem‘s business consists of specialized products like Dimer Acid and Tocopherol which cushions the company from commodity cycle and constant volatility hence stability in margins. However, other products are also priced in tandem with raw material prices hence providing stable margins for the company.
Dimer Acid is an import substitute for sale to consumers in Surface Coating and Printing Ink industry. The company is sole producer of the product in India. Key clients for Oleochemicals include Asian Paints, Micro Inks, Arkema etc. AFL provides products based on import parity with added advantage of just-in-time delivery and better quality. As result AFL has been preferred supplier for most of its clients and AFL believes it would gradually substitute large part of its client requirement, which are met through import at present.
Linoleic Acid is designed especially to produce fast drying protective coating having lighter color and has applications in making quick-drying oils, cosmetics, inks. Amines, Lubricants, Paints etc. AFL is the one of the lowest cost manufacturers of the product in the country.
Mixed Tocopherol and Sterols are nutraceutical products. Tocopherol is used as raw material to manufacture natural Vitamin E. The global market for Natural Vitamin E is estimated at US$611.9 million in 2013 and set to cross the US$1 billion mark by 2019. Natural Vitamin E is almost 3-4 times more expensive than synthetic Vitamin E. Developed markets like US and Europe are the key consumers due to the high value of the product. Only method of manufacturing Natural Vitamin E is through route of raw material currently used by AFL. There are few manufacturers worldwide and AFL is only manufacturer in India. The company has started selling one more product called Concentrated Sterols under nutraceuticals segment in FY14 (Sept’13) which is basically a by-product of Tocopherol. Earlier the company was not able to capture the product. Management has now added more equipment/process through which they are able to capture this product which directly got added to EBITDA without much cost of sales. Key clients for Nutraceuticals are BASF, TAMA, ADM, Riken. The company has decade old relationship with these clients and has not lost any of these clients. In some of the case like BASF the company has been supplying to its earlier owners who got acquired by BASF and relation continued after acquisition also.
Sales Breakup
Dimer Acid,
16.0% Linoleic
Acid, 11.9%
Other Fatty Acid,
33.3% Fatty Oil,
11.5%
Tocopherol,
27.3%
FY13
4 | P a g e
Adi FineChem Ltd
Capacity Expansion
Key USP of the company is its ability to use Acid Oil (for Dimer and Linoleic Acid) and Deodorizer Distillate (for Tocopherol) – which are by products of vegetable oil processing units. This makes AFL more competitive as other companies directly use vegetable oil which is 30%-40% more expensive. Another benefit of using by-products of vegetable oil is that it is natural which commands premium over that derived from Synthetic route. Apart from this handling varied quality of raw materials is another developed skill of the company. As acid oil and deodorizer distillate are by-products of vegetable oil and its output is very less in the overall manufacturing process, (Acid oil ~1.25% and Deodorizer Distillate ~ 0.25%), hence AFL has to source the material from many suppliers (highest is 30% from one supplier) to meet its requirements. Therefore the quality of raw materials differs drastically which can affect the end products of AFL. In order to maintain the consistency in its product quality, over the years AFL has evolved the process in such a manner that it can manage different qualities of raw material without having much impact on its end products.
The crude soyabean oil processing is increasing in the country enabling the company to procure more by-products as raw material. The Indian economy is witnessing an upsurge in activities of industries like Paint and Surface Coating, Printing Ink and soap making requiring AFL’s finished products as their raw materials.
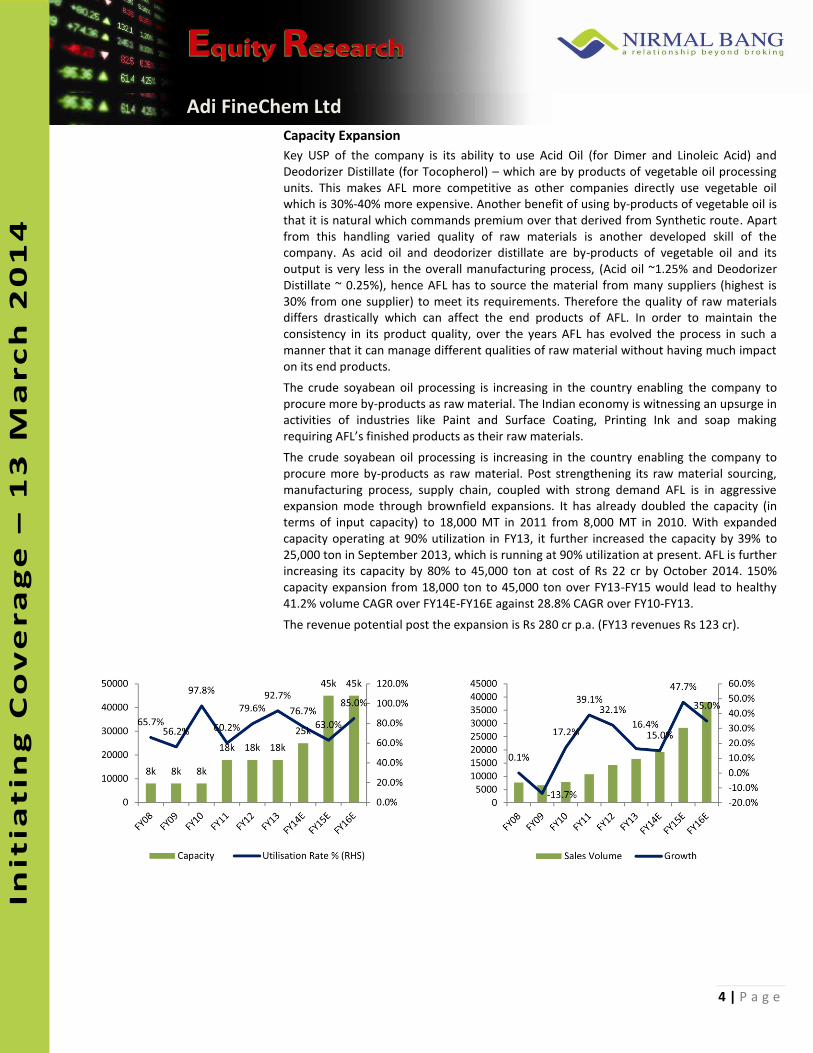
The crude soyabean oil processing is increasing in the country enabling the company to procure more by-products as raw material. Post strengthening its raw material sourcing, manufacturing process, supply chain, coupled with strong demand AFL is in aggressive expansion mode through brownfield expansions. It has already doubled the capacity (in terms of input capacity) to 18,000 MT in 2011 from 8,000 MT in 2010. With expanded capacity operating at 90% utilization in FY13, it further increased the capacity by 39% to 25,000 ton in September 2013, which is running at 90% utilization at present. AFL is further increasing its capacity by 80% to 45,000 ton at cost of Rs 22 cr by October 2014. 150% capacity expansion from 18,000 ton to 45,000 ton over FY13-FY15 would lead to healthy 41.2% volume CAGR over FY14E-FY16E against 28.8% CAGR over FY10-FY13.
The revenue potential post the expansion is Rs 280 cr p.a. (FY13 revenues Rs 123 cr).

5 | P a g e
Adi FineChem Ltd
Efficiency driven growth We can divide future growth of Adi Finechem in two phases – Phase I: Capacity expansion which would drive the topline of the company. The second Phase would witness efficiency driven growth whereby we expect company to better bottom-line growth. Management has identified certain areas which would drive the profitability in future.
Post management changed in 2010 the company made many changes in the processes
which brought down the overall cost and increased efficiency. Economies of scale and
optimization of resources have helped in maintaining the cost at reduced levels despite
increase in per unit levels.
Source: Company, Nirmal Bang Research
Despite volatility in raw material prices profitability is maintained
FY08 FY09 FY10 FY11 FY12 FY13 FY14E FY15E FY16E
Gross Profit (Rs/ton) 19041 21867 19429 20998 20925 21417 27750 25390 25390
Gross Margins (%) 47.1% 42.8% 39.5% 39.7% 30.9% 29.0% 36.5% 36.3% 36.3%
0.0%
5.0%
10.0%
15.0%
20.0%
25.0%
30.0%
35.0%
40.0%
45.0%
50.0%
18500
20000
21500
23000
24500
26000
27500
29000

6 | P a g e
Adi FineChem Ltd
Note: EBITDA/ton is a better measure to understand the profit profile of the company. Apparently its looks that EBITDA margins have declined from 18% in FY11 to 14% in FY13 however on analyzing EBITDA/ton it is clear that profitability has rather improved from Rs 9539 / to Rs 10345/ton, during the same period
Strategic Shift in Management
AFL has undergone a strategic management changed in 2010 whereby one of the promoters changed hands and a new team joined in. The company has shown tremendous improvement in performance since then. Originally Mr. Rajan Harivallabhdas started AFL as key promoter which was assisted by his cousin brother Mr.Nahoosh Jariwala. Mr.Rajan was looking at manufacturing, process optimization and other core activities of the company while role of Mr.Nahoosh was limited to marketing. Mr.Rajan decided to move out of the company in 2010, while Mr.Utarkarsh continues to remain confident on prospects of the company. Stake of Mr.Rajan was bought by Mr.Utkarsh Shah, Mr.Bimal Parikh and Mr.Hemant Shah who were collage friends of Mr.Nahoosh. Post change of ownership, Mr.Nahoosh was given free hand, which lead to turn around of the company. Mr.Nahoosh made various process changes, reduced power cost, improved efficiencies, reduced working capital cycle and as a result it turned AFL into black in FY11 from red in FY10. Mr.Nahoosh installed balancing equipment and increased capacity from 8,000tn in FY10 to 18,000tn in FY11 with minimum capex. As a result operating profit improved from Rs 1.4 cr in FY09 to Rs 17.1 cr in FY13 while net profit improved from negative Rs 1.4 cr to positive Rs 8.4 cr over same period.

7 | P a g e
Adi FineChem Ltd Profile of Board of Directors
Utkarsh Shah Chairman Engaged in Realty Business (Promoter)
Nahoosh Jariwala MD Original Promoter
Bimal Parikh Wholetime Director Promoter
Hemant Shah Director Promoter
Jayesh K. Shah Director Director & CFO of Arvind Ltd
Kalpesh Patel Director Executive Director, Nirma Group
Bhavin Shah Director Promoter of Equirus Capital
Ganapatraj Chawdhary Director MD of Riddhi Siddhi Gluco Biols Ltd
Nitin Patel Director Chairman – Shree Bhagwati Flour Mills Pvt Ltd
Asset Turnover
Margin Profile
1.1 1.1 1.2
1.7
2.3
2.8 2.7
0.0
0.5
1.0
1.5
2.0
2.5
3.0
0.0
20.0
40.0
60.0
80.0
100.0
120.0
140.0
160.0
FY08 FY09 FY10 FY11 FY12 FY13 FY14E
Net Sales (Rs cr) Asset Turnover (x)
10.1
4.2
6.6
18.0
15.1 14.0
20.3
2.6
-4.3
-1.4
8.8 7.6 6.8
11.3
-10.0
-5.0
0.0
5.0
10.0
15.0
20.0
25.0
-5.0
0.0
5.0
10.0
15.0
20.0
25.0
30.0
35.0
FY08 FY09 FY10 FY11 FY12 FY13 FY14E
EBITDA (Rs cr) PAT (Rs cr)
EBITDA margin (%) (RHS) PAT margin (%) (RHS)

8 | P a g e
Adi FineChem Ltd
Healthy Financials
Strong Return ratios: Despite incurring capex (to increase its capacity 3x in last four years
(from 8,000 MT in FY11 to 25,000 MT in FY14)) return ratios of the company have improved
substantially. ROCE improved to 28.6% in FY13 from mere 2.6% in FY10, which has been
possible due to better asset turnover and improved profitability. Although more capex is
lined up for next two years, we believe the company would be able to improve return
ratios further
Source: Nirmal Bang Retail Research
Working Capital Cycle: Availability and access to raw material is a key challenge in the Oleo Chemical industry. Hence AFL has to source raw materials on advance payment basis providing no leverage on payables days. Therefore the company has to efficiently manage its receivables and inventory days also to be able to balance its NWC. Adi Fine chem’s has managed to keep its debtors days under 50 and worked very hard to bring down the inventory days from 143 days in FY09 to 41 days in FY13, realizing much needed working capital Debt:Equity Ratio: Due to efficient management of working capital and systematic use of capital for expansion the company has comfortable debt position with Debt:Equity ratio of 0.6x. This gives enough scope to the company for funding future needs without burdening the balance sheet. Bonus Shares: Till FY10, due to inadequate profitability AFL was not able to distribute dividends to shareholders. It has started giving marginal dividends (of 8-10%) since last three years. However, the company has well awarded the shareholders with two bonus issues. First was in FY12 in the ratio of 1:5 (one bonus share for every five shares held) and second in FY13 in the ratio of 1:10 (one bonus share for every 10 shares held)
FY08 FY09 FY10 FY11 FY12 FY13 FY14E
ROE (%) 5.3 -10.3 -3.9 28.9 31.0 27.2 35.8
ROCE (%) 5.0 -0.8 2.9 24.9 26.2 28.6 35.8
-20.0
-10.0
0.0
10.0
20.0
30.0
40.0

9 | P a g e
Adi FineChem Ltd
RISKS Sourcing of Raw Material: Key risk for the company is availability of raw materials.
Firstly the output of by products is very less (Acid oil ~1.25% and Deodorizer Distillate ~ 0.25%). Hence AFL has to source the material from many suppliers (highest is 30% from one supplier), which in turn affects the quality of end products. In addition, the company has to make advance payment to ensure the constant supply of raw materials.
Quality of raw materials: As the company is sourcing from various manufacturers, the quality of raw material differs drastically. Although over the years AFL has managed to put up process which manages such volatility in quality of inputs.
Competition from imported products: AFL’s few products like Dimer Acid are import substitutable. Hence any increase in imports can impact its prospects.
Good quarterly result
AFL reported good Q3FY14 results reiterating our positive stance. Sales have grown by 34% yoy to Rs 39.6 cr on higher capacity available. EBITDA margins have moved to record high of 24.5% due to favorable product mix and efficieny improvement on account of some balancing equipment installation. We expect company to maintain its 9MFY14 margins of 20% for the full year and for next year too, a substantial improvement from previous years (14% in FY13)
Consolidated (Rs cr) Q3FY14 Q2FY14 qoq Q3FY13 yoy
Net sales 39.6 28.0 41.3 29.5 34.2
Cost of Materials 23.6 18.8 25.9 21.0 12.6
Staff cost 1.3 1.1 25.0 0.7 83.1
Power & Fuel 2.5 2.1 17.0 2.6 -3.7
Other Exps 2.4 1.1 113.9 1.1 114.8
Total Expenses 29.9 23.1 29.3 25.4 17.5
EBITDA 9.7 4.9 98.0 4.1 138.5
margins 24.5% 17.5% 13.8%
Depreciation 0.7 0.6 20.1 0.6 25.1
EBIT 9.0 4.3 108.4 3.5 156.4
Interest 0.7 0.6 11.2 0.7 6.3
Other income 0.0 0.1 -85.6 -0.3 -105.5
PBT 8.3 3.8 117.7 2.5 230.6
Tax 2.8 1.1 157.8 0.8 242.9
Tax rate 34.0% 28.7% 32.8%
EO 0.0 1.5 0.0
PAT 5.5 1.2 345.1 1.7 224.6
Equity Capital 12.5 12.5 12.5
FV 10.0 10.0 10.0
EPS 4.4 1.0 345.1 1.3 224.6

10 | P a g e
Adi FineChem Ltd
Peer Comparison
Valuation and Recommendation
Adi Finechem has turned around its business strategy and signs of success are visible in numbers too. We believe the company is finally moving in the right direction of achieving its true potential. With apparently no competition from organized market, the company has inherent edge and can maintain its leadership position in the industry. During FY10-13 AFL’s revenues have grown at an impressive CAGR of 47.5% v/s 12.8% during FY06-09 while PAT has grown 30.6% during FY11-13. It was negative in FY10. Prices of vegetable oil are very volatile and being by-products of vegetable oil, raw material prices for AFL have been very volatile in past. However going forward, we believe the company would continue its momentum. We expect sales to grow at CAGR of 30.3% from FY13 to FY16E with higher PAT growth of 57.6% over the same period, on back of higher economies of scale on expanded facility. Despite incurring the scheduled capex from internal accurals, we expect the company to maintain its high return ratios. With healthy cash generation AFL is likely to maintain its Net Working Cycle (expected to remain around 70 days) and Debt:Equity ratio (likely to remain at around 0.5x) despite incurring capex from its internal accruals.
*Estimates are from Bloomberg except for Adi Finechem
11 | P a g e
Adi FineChem Ltd
Source: Company data, Nirmal Bang Research
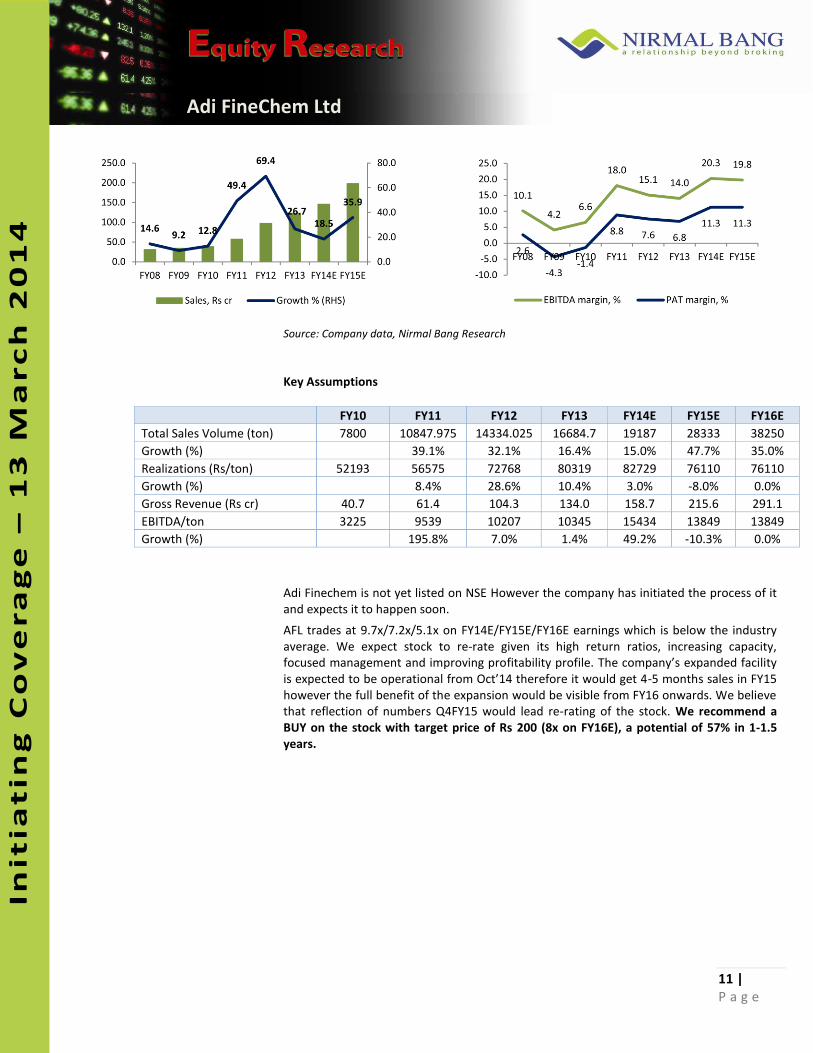
Key Assumptions Adi Finechem is not yet listed on NSE However the company has initiated the process of it and expects it to happen soon.
AFL trades at 9.7x/7.2x/5.1x on FY14E/FY15E/FY16E earnings which is below the industry average. We expect stock to re-rate given its high return ratios, increasing capacity, focused management and improving profitability profile. The company’s expanded facility is expected to be operational from Oct’14 therefore it would get 4-5 months sales in FY15 however the full benefit of the expansion would be visible from FY16 onwards. We believe that reflection of numbers Q4FY15 would lead re-rating of the stock. We recommend a BUY on the stock with target price of Rs 200 (8x on FY16E), a potential of 57% in 1-1.5 years.
FY10 FY11 FY12 FY13 FY14E FY15E FY16E
Total Sales Volume (ton) 7800 10847.975 14334.025 16684.7 19187 28333 38250
Growth (%) 39.1% 32.1% 16.4% 15.0% 47.7% 35.0%
Realizations (Rs/ton) 52193 56575 72768 80319 82729 76110 76110
Growth (%) 8.4% 28.6% 10.4% 3.0% -8.0% 0.0%
Gross Revenue (Rs cr) 40.7 61.4 104.3 134.0 158.7 215.6 291.1
EBITDA/ton 3225 9539 10207 10345 15434 13849 13849
Growth (%) 195.8% 7.0% 1.4% 49.2% -10.3% 0.0%

12 | P a g e
Adi FineChem Ltd
One Year Forward EV/EBITDA Chart
One Year Forward PE Chart
One Year Forward P/BV Chart
0
50
100
150
200
250
Apr
-10
Oct
-10
Apr
-11
Oct
-11
Apr
-12
Oct
-12
Apr
-13
Oct
-13
(Rscr)
4x
2x
6x
3x
5x
0
20
40
60
80
100
120
140
Apr
…
Jun…
Au…
Oct
…
De…
Feb
…
Apr
…
Jun…
Au…
Oct
…
De…
Feb
…
Apr
…
Jun…
Au…
Oct
…
De…
Feb
…
Apr
…
Jun…
Au…
Oct
…
De…
Feb
…
(Rs)
7x
4x
5x
9x
6x
8x
0
20
40
60
80
100
120
140
Apr
-10
Oct
-10
Apr
-11
Oct
-11
Apr
-12
Oct
-12
Apr
-13
Oct
-13
2.0x
1.1x
1.4x
2.3x
1.7x
(Rs)

13 | P a g e
Adi FineChem Ltd
Financials – Consolidated
P&L (Rs. Cr) FY13A FY14E FY15E FY16E Balance Sheet (Rs Cr) FY13A FY14E FY15E FY16E
Net Sales 123.1 145.9 198.2 267.5 Share Capital 11.4 12.5 12.5 12.5
% change 26.7% 18.5% 35.9% 35.0% Reserves & Surplus 19.5 33.4 52.4 79.1
EBITDA 17.3 29.6 39.2 53.0 Net Worth 30.9 46.0 65.0 91.6
EBITDA margin 14.0% 20.3% 19.8% 19.8% Net Deferred Tax Liab 3.6 3.6 3.6 3.6
Depn & Amort 2.3 2.8 3.7 4.5 Total Loans 18.0 25.4 21.9 16.0
Operating income 15.0 26.8 35.5 48.5 Trade Payables 1.9 2.8 3.9 5.2
Interest 2.5 2.8 2.4 1.8 Provis ions 1.9 2.2 3.0 4.0
Other Income 0.4 0.7 0.5 0.5 Other CL 3.4 1.5 1.8 2.2
PBT 12.9 24.7 33.6 47.2 Total Liabilities 59.7 81.5 99.1 122.6
Tax 4.2 8.3 11.3 15.8 Net Fixed Assets 27.1 35.6 52.4 57.8
MI & EO 0.3 0.0 0.0 0.0 Capital WIP 1.3 11.5 2.0 2.0
PAT 8.4 16.4 22.3 31.4 Investments 0.0 0.0 0.0 0.0
PAT margin (%) 6.8% 11.3% 11.3% 11.7% Cash & Bank 0.1 1.6 0.6 3.5
Sh o/s - Diluted 1.3 1.3 1.3 1.3 Inventories 9.9 10.8 14.7 19.9
Adj EPS 6.7 13.1 17.8 25.0 Debtors 15.4 18.2 24.8 33.4
Cash EPS 8.5 15.3 20.8 28.6 Loans & Advances 5.9 3.7 4.6 5.9
Qtrly-Stdalone Mar.13 June.13 Sept.13 Dec.13 Misc Exp 0.0 0.0 0.0 0.0
Revenue 29.5 31.0 36.9 39.6 Total Assets 59.7 81.5 99.1 122.6
EBITDA 3.7 5.2 7.0 9.7 Cash Flow (Rs. Cr) FY13A FY14E FY15E FY16E
Dep & Amorz 0.6 0.6 0.7 0.7 Op CF before tax 17.0 29.6 39.2 53.0
Op Income 3.1 4.6 6.3 9.0 Change in WC -3.1 -2.2 -9.2 -12.4
Interest 0.5 0.6 0.7 0.7 Tax -4.0 -8.3 -11.3 -15.8
Other Inc. -0.3 0.5 0.0 0.0 CF from Operation 9.8 19.2 18.8 24.8
PBT 2.4 4.5 5.7 8.3 Capex -3.2 -21.5 -11.0 -10.0
Tax 1.1 1.6 1.8 2.8 Oth Inc & Investments 0.4 0.7 0.5 0.5
EO -1.3 0.0 0.0 0.0 CF from Investing -2.8 -20.8 -10.5 -9.5
PAT 2.6 2.8 3.9 5.5 Financing
EPS (Rs.) 2.1 2.3 3.1 4.4 Diviend Paid -1.3 -2.5 -3.3 -4.7
Performance Ratio FY13A FY14E FY15E FY16E Share Capital 0.0 0.0 0.0 0.0
EBITDA margin (%) 14.0% 20.3% 19.8% 19.8% Loans -3.1 7.3 -3.5 -5.9
EBIT margin (%) 12.2% 18.4% 17.9% 18.1% Interest -2.5 -2.8 -2.4 -1.8
PAT margin (%) 6.8% 11.3% 11.3% 11.7% Others -0.2 1.1 0.0 0.0
ROE (%) 27.2% 35.8% 34.4% 34.3% CF from Financing -7.1 3.2 -9.3 -12.4
ROCE (%) 28.6% 35.8% 39.3% 43.6% Net Chg. in Cash -0.1 1.6 -1.0 2.9
PAT growth (%) 17.1% 90.4% 35.8% 40.5% Cash at beginning 0.1 0.1 1.6 0.6
Debt/Equity (x) 0.6 0.6 0.3 0.2 Cash at end 0.1 1.6 0.6 3.5
Valuation Ratio FY13A FY14E FY15E FY16E Per Share Data FY13A FY14E FY15E FY16E
Price Earnings (x) 19.1 9.7 7.2 5.1 Adj EPS 6.7 13.1 17.8 25.0
Price/BV (x) 4.1 2.8 2.0 1.4 BV per share 24.6 36.7 51.8 73.1
EV / Sales 1.4 1.3 0.9 0.6 Cash per share 0.0 1.3 0.5 2.8
EV / EBITDA 10.3 6.2 4.6 3.3 Dividend per share 1.1 2.0 2.7 3.8

14 | P a g e
Adi FineChem Ltd
Disclaimer:
This Document has been prepared by Nirmal Bang Research (A Division of Nirmal Bang Securities PVT LTD). The information, analysis and
estimates contained herein are based on Nirmal Bang Research assessment and have been obtained from sources believed to be reliable. This
document is meant for the use of the intended recipient only. This document, at best, represents Nirmal Bang Research opinion and is meant for
general information only. Nirmal Bang Research, its directors, officers or employees shall not in anyway be responsible for the contents stated
herein. Nirmal Bang Research expressly disclaims any and all liabilities that may arise from information, errors or omissions in this connection. This
document is not to be considered as an offer to sell or a solicitation to buy any securities. Nirmal Bang Research, its affiliates and their employees
may from time to time hold positions in securities referred to herein. Nirmal Bang Research or its affiliates may from time to time solicit from or
perform investment banking or other services for any company mentioned in this document.
Nirmal Bang Research (Division of Nirmal Bang Securities Pvt. Ltd.) B-2, 301/302, Marathon Innova, Opp. Peninsula Corporate Park
Off. Ganpatrao Kadam Marg Lower Parel (W), Mumbai-400013 Board No. : 91 22 3926 8000/8001
Fax. : 022 3926 8010