About the lessons - Esri Supportdownloads2.esri.com/ESRIpress/images/180/OW2TB_sample.pdfMapping Our...
31
1 Introduction About the lessons Mapping Our World Using GIS is a book of computer activities, data, and resources that can serve as a valuable supplement to topics you are already teaching in world geography, social studies, or earth science. Students will investigate global patterns of human and physical features, explore issues of concern to millions of people, analyze data from diverse regions, and develop skills essential for understanding a world characterized by vast quantities of raw information. Best of all, it will be fun! The book comes with a one-year trial license of ArcGIS software. This means that your students will be using the same tools as the ones being used by professional planners, emergency response personnel, government agencies around the world, and businesses of all kinds. Where to begin We recommend you do the following before using this book in class: 1. Finish reading this section and skim through the book and the student workbook to locate the lessons, answer sheets, answer keys, worksheets, handouts, assessments, and rubrics. 2. Install and register the software on your computer and the student computers. (Refer to “Setting up the software and data” on page 5, and the detailed software installation guide at the back of the book.) 3. Install the teacher resources and student data on your computer from the Data and Resources CD. Install the data on student computers. (Refer to the detailed data installation guide at the back of the book.) 4. Work through module 1 by yourself. 5. Work through module 1 with your students. The two lessons in this module introduce students to the concept of GIS, basic ArcGIS software skills, and the steps of the geographic inquiry process. Modules After module 1, you and your students are free to explore modules 2 to 7 in any order you wish. You can teach each module or lesson independently of the others, and you can tailor the material to suit the specific needs of your class and curriculum. Each module consists of two lessons: a global perspective and a regional investigation.
Transcript of About the lessons - Esri Supportdownloads2.esri.com/ESRIpress/images/180/OW2TB_sample.pdfMapping Our...

1
IntroductionAbout the lessonsMapping Our World Using GIS is a book of computer activities, data, and resources that can serve as a valuable supplement to topics you are already teaching in world geography, social studies, or earth science. Students will investigate global patterns of human and physical features, explore issues of concern to millions of people, analyze data from diverse regions, and develop skills essential for understanding a world characterized by vast quantities of raw information. Best of all, it will be fun!
The book comes with a one-year trial license of ArcGIS software. This means that your students will be using the same tools as the ones being used by professional planners, emergency response personnel, government agencies around the world, and businesses of all kinds.
Where to beginWe recommend you do the following before using this book in class:
1. Finish reading this section and skim through the book and the student workbook to locate the lessons, answer sheets, answer keys, worksheets, handouts, assessments, and rubrics.
2. Install and register the software on your computer and the student computers. (Refer to “Setting up the software and data” on page 5, and the detailed software installation guide at the back of the book.)
3. Install the teacher resources and student data on your computer from the Data and Resources CD. Install the data on student computers. (Refer to the detailed data installation guide at the back of the book.)
4. Work through module 1 by yourself. 5. Work through module 1 with your students. The two lessons in this module introduce students
to the concept of GIS, basic ArcGIS software skills, and the steps of the geographic inquiry process.
ModulesAfter module 1, you and your students are free to explore modules 2 to 7 in any order you wish. You can teach each module or lesson independently of the others, and you can tailor the material to suit the specific needs of your class and curriculum. Each module consists of two lessons: a global perspective and a regional investigation.

2
Our World GIS Education: Mapping Our World Using GIS
How the materials are organizedThis book contains teacher materials for each lesson, including the following:
• A lesson overview with a summary, materials list, time it will take to complete the lesson, learning objectives, a list of the main GIS tools and functions encountered in the activity, and key cur-riculum standards covered.
• Notes about teaching the lesson, including a “no-tech” activity to introduce lesson, tips on con-ducting the GIS activity, and how to conclude the lesson and give the optional assessment. Ideas for extending the lesson are listed as well.
• A list of the lesson components to be printed or copied for students (or used from the student workbooks).
• Assessment rubrics (see “Rubric-based assessments” on page 3).• Answer keys for the student answer sheets and any supplemental worksheets.
The accompanying student workbook contains the activity sheets, answer sheets, and supplements that students will need to do the lessons. (It does not include the optional assessments.) You have several options for providing these materials to your students: you can order copies of the student workbook for your class; you can photocopy the student workbook pages that come with the book; or you can print them out from the files on the CD.
The Data and Resources CD has two main folders that can be installed separately: a teacher resources folder and a student data folder.
The teacher resources folder (OurWorld2_teacher) includes the following:
• Digital documents (PDF format) of the student activity sheets and supplements required by the lessons.
• Digital documents (Microsoft Word format) of the student answer sheets. These are provided in Word format so that you can add your own questions if desired. Optionally, you can ask students to type their answers. (This option does require screen space for the GIS windows and students will have to navigate back and forth between several programs at once.)
• Digital documents (PDF format) of some of the teacher materials in this book, such as assess-ment rubrics and answer keys.
The student data folder (OurWorld2) includes the lesson data that needs to be installed on student computers or in a network location where students can access (and modify) the data. The data is organized by module.
Curriculum standards Each lesson teaches skills corresponding to National Geography Standards (Geography for Life: The National Geography Standards 1994). The applicable standards for middle school (grades 5–8) and high school (grades 9–12) are listed in each lesson overview. Matrices matching all lessons in the book to the National Geography Standards and to the National Science Education and National Technology Standards are also provided (see table of contents).
Reference handoutsThe handouts “ArcMap Toolbar Reference,” “ArcMap Zoom and Pan Tools,” “Making Quality Maps,” and “GIS Terms” can be used with any of the lessons. Consider giving these handouts to your students with module 1 and having the students save them for use with later lessons. The handouts can be printed from the Data and Resources CD. (They are also located at the back of the student workbooks, if you are using those.)
3
Introduction
Rubric-based assessmentsThe lessons encourage students to explore a variety of geographic concepts and topics. A single letter or number grade won’t be an accurate representation of the depth or completeness of their understanding of all concepts they’ve dealt with. The rubrics included with each lesson will allow you to evaluate student performance in a number of different ways. A learner may show mastery of one particular concept but perform another task at the introductory level. The rubrics will also help you provide specific feedback to your students, showing them exactly where they need additional assistance or practice. The four levels are defined as follows: Exemplary: The student has gone above and beyond the standard. The student has a strong under-standing of the concept and has the ability to mentor other students. Mastery: This is the target level for all students. The student has a good understanding of the concept. Introductory: The student has limited understanding of the standard or shows little evidence of understanding. Does not meet requirements: The student does not show basic understanding of the standard.
The rubrics may be used as follows:
• Distribute a copy of the rubric to students when you return their evaluated work. Circle or highlight the student’s level of achievement for each standard. This provides the greatest amount of feedback for the student on each standard. Use the back of the page to make additional comments.
• Use the rubric as a form of student self-evaluation. Give students an unmarked copy of the rubric and ask them to evaluate their own work.
The companion Web siteThe book’s Web site, www.esri.com/ourworldgiseducation, places a variety of GIS resources and other helpful information at your fingertips. For example, you’ll want to check the Web site’s “Resources by Module” section for specific resources, Web links, or changes when you get ready to use a particular lesson. Solutions to common problems and any significant changes or corrections to the book will also be posted here.
Taking it furtherAfter your students have completed the lessons you have selected, you can do the following:
• Challenge them with lessons from Our World GIS Education: Analyzing Our World Using GIS. • Have them put together a profile of your community and post it on the ESRI Community Atlas
Web site: www.esri.com/communityatlas. Your school may be able to earn software through this program.
• Find out who’s doing what with GIS near you and contact them for ideas. The following resources can help:• ESRIGISEducationCommunity,http://edcommunity.esri.com• ESRIEducationUserConference,www.esri.com/educ• GISDayWebsite,www.gisday.com• GIS.comWebsite,www.gis.com• InviteaGISspecialistfromyourcitygovernmentorotherlocalorganizationtodoapresenta-
tion on GIS for your class.• MakeGISapermanentpartofyourclassroom.Besuretocheckwithyourdistrictorstate
technology coordinator before you purchase an ArcView license for your school or classroom. A districtwide or statewide software license may already cover your school.

4
Our World GIS Education: Mapping Our World Using GIS
About the software and data
ArcGIS Desktop softwareThe lessons in this book use an ArcView license level of ArcGIS Desktop software. ArcGIS Desktop includes two applications: ArcMap and ArcCatalog. ArcMap is used to display and edit geographic data, perform GIS analysis, and create professional-quality maps, graphs, and reports. ArcCatalog is designed for browsing, managing, and documenting geographic data. Students interact only with ArcMap in this book’s lessons, but you may find it useful to browse or preview the data using ArcCatalog as you are preparing to teach the lessons.

5
Introduction
Setting up the software and dataThis book comes with a DVD and a CD. The DVD contains a one-year trial edition of ArcView 9 for Microsoft Windows. The CD contains the data, student activity sheets, and other documents required for the lessons. Refer to the installation guides at the back of the book for detailed instruc-tions on how to install the software and the data. The data license agreement is also found at the back of the book.
If you do not feel comfortable installing programs on your computer or your students’ computers, please be sure to ask your school’s technology specialist for assistance. The software and data on these disks need to be installed on your computer and all computers that the students will use to complete the GIS investigations. You may decide to install the student data on a school network drive. If you do choose this option, be aware that in some lessons (e.g., module 1, lesson 2) students must have their own copy of the data because the lesson requires them to modify it. The teacher resources should be installed on your computer, not on the student computers.
Once ArcView is installed there are a few things to do before the software is ready for students to use in the lessons:
Desktop shortcut. Consider creating an ArcMap shortcut icon on the desktop of each student’s computer so that students can quickly locate and start the ArcMap program. If students will be using ArcCatalog, create an ArcCatalog shortcut icon as well.
Connection to the data. Most exercises instruct students to add data to their map documents at some point. To navigate to the exercise data, a connection to the drive or folder where the data is stored is necessary. You may want to make sure this folder connection is set up in advance on each student’s computer, or you may direct students to create the folder connection themselves during the exercise. If you choose to create the folder connection yourself, “Installing the data and resources” at the back of the book explains how to do this using ArcCatalog. Otherwise, follow the instructions in module 1, lesson 2, step 4 to create the folder connection when students add data for the first time.
Student work folders. For some lessons you will need to set up student work folders where students can save their work. The activity instructions usually suggest that students include their initials in the name of the file they are saving, and advise them to ask their teacher where to save their work. See the “Teaching the lesson” section of individual lessons for more information.
File extensions. Instructions and graphics assume that students can see the file extensions, for example Global1.mxd or Cities.lyr. If your students cannot see file extensions (e.g., they see Global1 or Cities), you can either turn off this preference or have students ignore references to file extensions. Layer files, which sometimes have the same name as their data sources, are stored in separate folders to avoid con-fusion when file names are hidden. (To show file extensions, start ArcCatalog and go to Tools, then Options. Click the General tab and uncheck the Hide file extensions box.)
Moving or deleting data. The installation program installs the data for all modules. If for some reason you decide to remove part of the data, be sure to keep entire module folders intact. For example, if you only plan to teach lesson 1 of module 2, you should keep the entire module 2 folder. Lessons within a module often share some data, and map documents are set up to find data in specific locations within a module folder.

6
Our World GIS Education: Mapping Our World Using GIS
MetadataMetadata (information about the data) describes the GIS data provided on the Data and Resources CD. The metadata includes a description of the data, where it came from, a definition for each attribute field, and other useful information. This metadata can be viewed in ArcMap or in ArcCatalog.
To view metadata using ArcMap, right-click a layer in the table of contents and select Data, then View Metadata. You may view information for each field in the layer by clicking the Attributes tab in the Metadata window and then clicking the field name. The default style sheet, FGDC ESRI, is satisfactory for most purposes, but if you want to view additional metadata detail, select ESRI Classic from the style sheet list.
Troubleshooting ArcGISExercise instructions are written assuming the user interface and user preferences have the default settings. Unless students are working with a fresh installation of the software, however, chances are they will encounter some differences between the instructions and what they see on their screen. This is because ArcMap stores settings from a previous session. This could vary the size of the ArcMap window, the width of the table of contents, which toolbars are visible, where toolbars are located, or whether or not the map scale changes when the window is resized.
Normally such differences will not be a problem, but you should be prepared to help individual students if they question an instruction or want to know why their ArcMap looks different than their neighbor’s. A list of commonly encountered troubles and their solutions can be found on this book’s Web site, www.esri.com/ourworldgiseducation. You may want to print out this list for reference.
If you have questions related to installing the trial software or to report a problem or error with the lesson materials in this book, you can send e-mail to [email protected] with your questions.

7
Introduction
Geographic inquiry and GISGeography is the study of the world and all that is in it: its peoples, its places, its environments, and all the connections among them. Knowing where something is located, how its location influ-ences its characteristics, and how its location influences relationships with other phenomena is the foundation of geographic thinking. Geographic inquiry asks you to see the world and all that is in it in spatial terms. Like other research methods, it also asks you to explore, analyze, and act upon the things you find.
The geographic inquiry process
Step What to do
1. Ask a geographic question Ask a question about spatial relationships in the world around you
2. Acquire geographic resources Identify data and information that you need to answer your question
3. Explore geographic data Turn the data into maps, tables, and graphs, and look for patterns and relationships
4. Analyze geographic information Determine what the patterns and relationships mean with respect to your question
5. Act on geographic knowledge Use the results of your work to educate, make a decision, or solve a problem
The five steps of geographic inquiry are addressed in detail in module 1, lesson 2. In the other lessons, these steps are implicit, and you will naturally integrate geographic inquiry into the process of doing the exercises throughout the book.
What is GIS? Chances are that GIS technology has already touched your life. If you flipped on a light switch today, chances are that GIS was used to help make sure the electricity was there to light up the room. When you drove down a highway, chances are that GIS was used to keep track of the signs and streets along the way. If you received a delivery, chances are that GIS helped the driver find the way to your house. If you bought fresh vegetables, chances are that GIS helped manage the land and calculate the fertilizer needed for the crop. If you looked at a map on the Internet, chances are that GIS had a hand in that too.
A geographic information system (GIS) uses computers and software to organize, develop, and communicate geographic knowledge. In simple terms, GIS takes the numbers and words from the rows and columns in databases and spreadsheets and puts them on a map.

8
Our World GIS Education: Mapping Our World Using GIS
Visualizing informationThe vast amounts of information available today require powerful tools like GIS to help people determine what it all means. GIS can make thematic maps (maps coded by value) to help illustrate patterns. To explore cities at risk for an earthquake, you might first make a map of where earth-quakes have already occurred. You could then code the earthquakes by magnitude. You might use one color for those that were strong and a second color for those that were weak. By analyzing the patterns, you will be able to find an answer to your question about cities at risk. You will pursue this inquiry in module 2.

9
Introduction
Putting it all togetherGIS is a tool that can simplify and accelerate geographic investigations. Like any tool, GIS has no answers packed inside it. Instead, for those who use the tool and the process of geographic inquiry, it provides a means to discover pathways through our remarkable world of unending geographic questions.

10
Our World GIS Education: Mapping Our World Using GIS
Standard
Module 1 Module 2 Module 3 Module 4 Module 5 Module 6 Module 7
L1 L2 L1 L2 L1 L2 L1 L2 L1 L2 L1 L2 L1 L2
1 How to use maps and other geographic representations, tools, and technolo-gies to acquire, process, and report information from a spatial perspective
• • • • • • • • • • • • •
2 How to use mental maps to organize information about people, places, and environments in a spatial context
3 How to analyze the spatial organization of people, places, and environments on Earth’s surface
• •
4 The physical and human characteristics of places • • • • • • •
5 That people create regions to interpret Earth’s complexity •
6 How culture and experience influence people’s perceptions of places and regions
7 The physical processes that shape the patterns of Earth’s surface • • • •
8 The characteristics and spatial distribution of ecosystems on Earth’s surface
9 The characteristics, distribution, and migration of human populations on Earth’s surface
•
10 The characteristics, distribution, and complexity of Earth’s cultural mosaics
11 The patterns and networks of economic interdependence on Earth’s surface
• • •
12 The processes, patterns, and functions of human settlement •
13 How the forces of cooperation and conflict among people influence the division and control of Earth’s surface
• • •
14 How human actions modify the physical environment
15 How physical systems affect human systems • • • •
16 The changes that occur in the meaning, use, distribution, and importance of resources
17 How to apply geography to interpret the past •
18 How to apply geography to interpret the present and plan for the future • • • • • •
Correlation to National Geography Standards
Source: Geography Education Standards Projects. 1994. Geography for Life: National Geography Standards 1994.
Washington, D.C.: National Geographic Research and Exploration.

11
Introduction
Correlation to National Science Education Standards
Standard
Module 1 Module 2 Module 3 Module 4 Module 5 Module 6 Module 7
L1 L2 L1 L2 L1 L2 L1 L2 L1 L2 L1 L2 L1 L2
Unifying Concepts and Processes All All All All All All All All
A Science as Inquiry MH MH MH MH MH MH MH
B Physical Science MH MH M M
C Life Science M H
D Earth and Space Science MH MH MH MH MH
E Science and Technology MH MH
F Science in Personal and Social Perspectives MH MH MH MH MH MH MH
G History and Nature of Science
M = Middle school
H = High school
Standards reprinted with permission from National Science Education Standards. Copyright 1996 by the National Academy
of Sciences. Courtesy of the National Academy Press, Washington, D.C.
Correlation to National Technology Standards
Standard
Module 1 Module 2 Module 3 Module 4 Module 5 Module 6 Module 7
L1 L2 L1 L2 L1 L2 L1 L2 L1 L2 L1 L2 L1 L21 • • • • • • • • • • • • • •2 • • • • • •3 • • • • • • • • • • • • • •4 • • • • • • • • • • • • • •5 • • •6 • • • • • • • • • • • • • •
Sources: National Education Technology Standards for Students. 2007. International Society for Technology in Education.


13
MODULE 1Geographic inquiry in ArcMapLesson 1: The basics of ArcMapThis lesson introduces the basic concepts and tools of GIS. It will guide students in navigating the computer to find ArcMap documents and data and acquiring fundamental GIS skills such as manipulating layers, zooming in and out, and identifying the attributes of geographic features.
Lesson 2: The geographic inquiry processStudents will learn the steps of geographic inquiry: ask, acquire, explore, analyze, and act. To test a geographic hypothesis, they will calculate people/phone line ratios and develop a plan of action based on their findings. They will begin to gain awareness of links between GIS and scientific inquiry, public policy, and economics.
Module 1 introduces basic skills on which the exercises in the rest of the book are based.

This GIS map has two layers: world countries classified by population and cities with populations greater than 100,000.
15
Module 1: Lesson 1
The basics of ArcMap
Lesson overviewThis lesson introduces the basic concepts and tools of GIS. It will guide students in navigating the computer to find ArcMap documents and data and acquiring fundamental GIS skills such as manipulating layers, zooming in and out, and identifying the attributes of geographic features.
Estimated timeTwo 45-minute class periods
MaterialsThe student worksheet files can be found on the Data and Resources CD. Install the teacher resources folder on your computer to access them.
Location: OurWorld_teacher\Module1\Lesson1• Student PDF: M1L1_student.pdf• Student answer sheet: M1L1_student_answer_sheet.doc
Objectives After completing this lesson, a student is able to do the following:
• Understand the basic concept of a GIS• Use a basic ArcMap skill set to build a map• Print maps
GIS tools and functions Identify a selected feature on the map
Zoom in to a desired section of the map or to the center of the map
Zoom to the full extent of the map
Clear selected features

16
Our World GIS Education: Mapping Our World Using GIS
Mo
du
le 1
: Lesson 1
M L
Zoom out to a desired section of the map or to the center of the map
Find a feature in a layer and identify it
Move the map to bring a different portion of it into view
Get help about a button
• Browse information about map features using MapTips• Turn layers on and off• Expand and collapse layers• Use the mouse to zoom and pan• Activate a data frame• Change the order of the table of contents to change the map display• Create a bookmark for a map extent and return to it later
National Geography Standards
Standard Middle school High school
1 How to use maps and other geographic representations, tools, and technologies to acquire, process, and report information from a spatial perspective
The student knows how to make and use maps, globes, charts, models, and databases to analyze spatial distributions and patterns
The student knows how to use technologies to represent and interpret Earth’s physical and human systems
4 The physical and human characteristics of places
The student understands how technology can shape the characteristics of places
The student understands how the physical and human characteristics of place can change
Teaching the lesson
Introducing the lessonBegin by helping students understand that each map in a GIS has database information tied to it. In other words, a GIS map takes the numbers and words from databases and ties them to a loca-tion. The map shows patterns in the data we might not otherwise see. This book’s Data and Resources CD has a 2.5-minute video entitled “What is GIS?” that provides a basic description of GIS.
Student activity We recommend that you complete the activity yourself before presenting the lesson in class. Doing so will allow you to modify the activity to accommodate the specific needs of your students. If they will not be working on individual computers, be sure to explain any necessary modifications.
Explain to students that in this activity they will begin to learn the basic ArcMap skills they will need to explore and navigate GIS maps. As they navigate through the lesson, they will be asked

Mo
du
le 1
: Le
sson
1
17
The basics of ArcMap
questions that will help keep them focused on key concepts. Some questions will have specific answers, while others will require creative thought.
In questions 39, 44, 45, and 48, students are asked to use a calculator to divide two large numbers; some of these have 9 or 10 digits. If your students have handheld calculators that only allow 8-digit numbers, have them use the calculator accessory on their computer.
The following are things to look for while the students are working on this activity:
• Are students thinking spatially?• Are students answering the questions?• Are students using a variety of menus, buttons, and tools to answer the questions?• Are students able to use the legends to interpret the data in the table of contents?• Are students able to print out a map on the printer?
Concluding the lessonConduct a brief discussion on the tools the students used in their investigation of country populations and cell phones. Ask the students if they were surprised by their calculations of people per cell phone. Why or why not? Remind the students that there is a direct connection between the map and the attribute table. Have the students give an example of how that was illustrated in the lesson.
See the “Resources by Module” section of this book’s Web site—www.esri.com/ourworldgiseducation —for print, media, and Internet resources that educate the public on the uses of GIS.

18
Our World GIS Education: Mapping Our World Using GIS
Mo
du
le 1
: Lesson 1
M L
Answer key
Step 3: Work with layersQ1. Which layers are not visible on the map but are turned on in the table of contents?
Rivers, Lakes
Q2. What happened on your map? The lakes show up on the map.
Q3. What happened on your map? The rivers show up on the map.
Q4. What would happen if you dragged Rivers under Land Areas? The rivers will disappear again; or the rivers will be covered up by the Land Areas layer.
Step 4: Change the active data frameQ5. What is the name of the layer that is turned on in the World Population data frame? World
Countries
Step 6: Obtain information about a countryQ6. What is the fourth listing under Field? CNTRY_NAME
Q7. What is the fifth listing in this column? LONG_NAME
Q8. What is the final listing in this column? MOBPHNS_YR
Q9. What do you guess the field SQMI stands for? Square miles
Q10. What is the number to the right of the field SQMI? 2,970,758.75
Step 7: Compare Identify data with table dataQ11. Which row in the table has the attributes for Australia? The tenth row (OBJECTID 240)
Q12. Where are these field names displayed in the table? Across the top of the table; or as column headings in the table
Q13. How many square miles of land does Australia cover? 2,970,758.75
Q14. Give a brief explanation of the relationship between the Identify window and the table. The Identify window has the same items of information that are in the table. The Identify window has information about only one country, while the table has all the countries. (Students may not pick up on the second part just yet.)
Step 8: Explore city data on the world mapQ15. Use the Identify tool to find the names and countries of any two cities.
Answers will vary. Possible answers include:
City Country
Zaragoza Spain
Hamburg Germany
Mo
du
le 1
: Le
sson
1
19
The basics of ArcMap
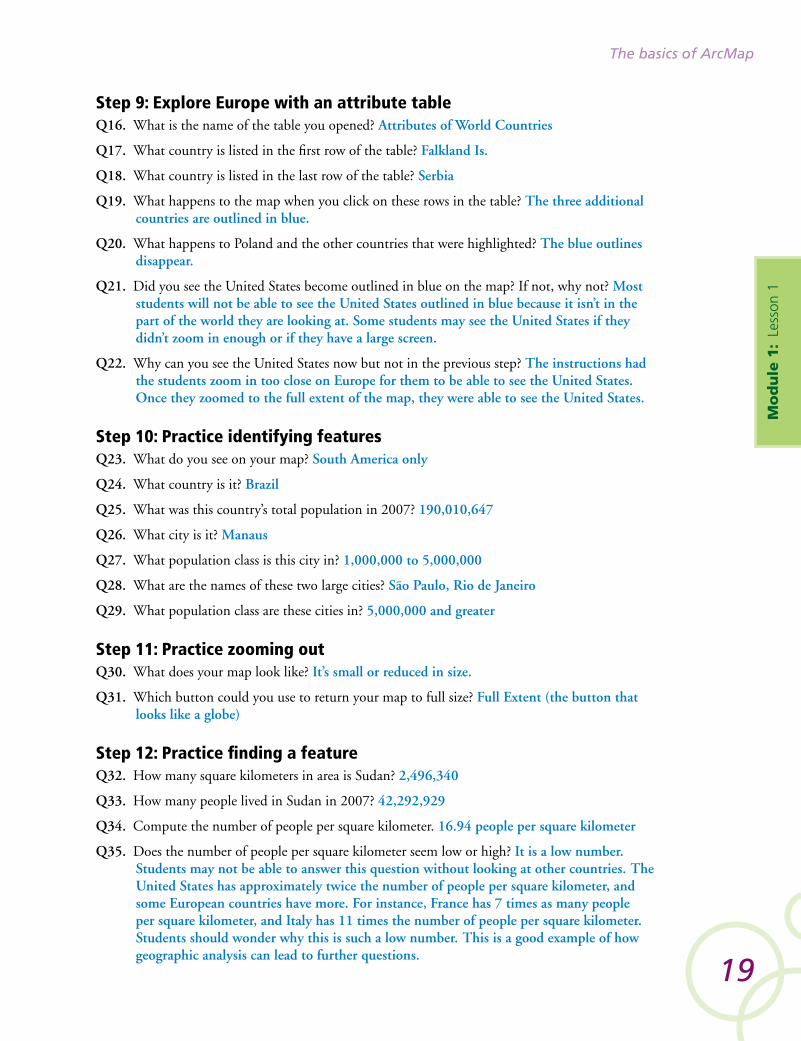
Step 9: Explore Europe with an attribute tableQ16. What is the name of the table you opened? Attributes of World Countries
Q17. What country is listed in the first row of the table? Falkland Is.
Q18. What country is listed in the last row of the table? Serbia
Q19. What happens to the map when you click on these rows in the table? The three additional countries are outlined in blue.
Q20. What happens to Poland and the other countries that were highlighted? The blue outlines disappear.
Q21. Did you see the United States become outlined in blue on the map? If not, why not? Most students will not be able to see the United States outlined in blue because it isn’t in the part of the world they are looking at. Some students may see the United States if they didn’t zoom in enough or if they have a large screen.
Q22. Why can you see the United States now but not in the previous step? The instructions had the students zoom in too close on Europe for them to be able to see the United States. Once they zoomed to the full extent of the map, they were able to see the United States.
Step 10: Practice identifying featuresQ23. What do you see on your map? South America only
Q24. What country is it? Brazil
Q25. What was this country’s total population in 2007? 190,010,647
Q26. What city is it? Manaus
Q27. What population class is this city in? 1,000,000 to 5,000,000
Q28. What are the names of these two large cities? São Paulo, Rio de Janeiro
Q29. What population class are these cities in? 5,000,000 and greater
Step 11: Practice zooming outQ30. What does your map look like? It’s small or reduced in size.
Q31. Which button could you use to return your map to full size? Full Extent (the button that looks like a globe)
Step 12: Practice finding a featureQ32. How many square kilometers in area is Sudan? 2,496,340
Q33. How many people lived in Sudan in 2007? 42,292,929
Q34. Compute the number of people per square kilometer. 16.94 people per square kilometer
Q35. Does the number of people per square kilometer seem low or high? It is a low number. Students may not be able to answer this question without looking at other countries. The United States has approximately twice the number of people per square kilometer, and some European countries have more. For instance, France has 7 times as many people per square kilometer, and Italy has 11 times the number of people per square kilometer. Students should wonder why this is such a low number. This is a good example of how geographic analysis can lead to further questions.

20
Our World GIS Education: Mapping Our World Using GIS
Mo
du
le 1
: Lesson 1
M L
Step 13: Zoom to a feature and create a bookmarkQ36. Is Qatar a large country or a small one? A small one
Q37. How many people lived in Qatar in 2007? 907,229
Q38. How many cell phones did they have? 854,900
Q39. How many people were there for every cell phone in Qatar? 1.06 people per cell phone
Q40. What large country is directly west of Qatar? Saudi Arabia
Step 14: Explore the World Population map furtherQ41. What boot-shaped country do you see on the map? Italy
Q42. What was the 2007 population of that country? 58,147,733
Q43. How many cell phones did that country have? 72,200,000
Q44. How many people were there for every cell phone in that country? 0.8 people per cell phone
Q45. How many cell phones were there per person in that country? 1.24 cell phones per person
Q46. What was the 2007 population of Japan? 127,467,972
Q47. How many cell phones did Japan have? 94,745,000
Q48. How many people were there for every cell phone in Japan? 1.35 people per cell phone
Q49. What happened to Qatar? It is no longer outlined in blue (the blue outline disappeared).
Step 16: Label and print a mapQ50. Where do you think these labels come from? The labels come from the country name
attribute field (CNTRY_NAME) in the World Countries layer.


Data about telephone infrastructure in China is displayed using the Identify tool to access the “information behind the map.”

23
The geographic inquiry process
Lesson overviewStudents will learn the steps of geographic inquiry: ask, acquire, explore, analyze, and act. To test a geographic hypothesis, they will calculate people/phone line ratios and develop a plan of action based on their findings. They will begin to gain awareness of links between GIS and scientific inquiry, public policy, and economics.
Estimated timeTwo 45-minute class periods
MaterialsThe student worksheet files can be found on the Data and Resources CD. Install the teacher resources folder on your computer to access them.
Location: OurWorld_teacher\Module1\Lesson2• Student PDF: M1L2_student.pdf• Student answer sheet: M1L2_student_answer_sheet.doc• Student supplement: M1L2_supplement.pdf• Student assessments: M1L2_assessment.pdf
ObjectivesAfter completing this lesson, a student is able to do the following:
• Understand the basic concept of a GIS• Use a basic ArcMap skill set to build a map• Use the five-step geographic inquiry model• Print maps
GIS tools and functions Add a layer to the map
Connect to a folder containing GIS data
Module 1: Lesson 2

Mo
du
le 1
: Lesson 2
24
Our World GIS Education: Mapping Our World Using GIS
M L
Identify a feature on the map
Zoom to the full extent of all the layers
Clear selected features
Find a feature in a layer and identify it
• Turn layers on and off• Expand and collapse layers• Use the mouse to zoom and pan• Calculate values for a field
National Geography Standards
Standard Middle school High school
1 How to use maps and other geographic representations, tools, and technologies to acquire, process, and report information from a spatial perspective
The student knows how to make and use maps, globes, charts, models, and databases to analyze spatial distributions and patterns
The student knows how to use technologies to represent and interpret Earth’s physical and human systems
3 How to analyze the spatial organization of people, places, and environments on Earth’s surface
The student understands that places and features are distributed spatially across Earth’s surface
The student understands how spatial features influence human behavior
4 The physical and human characteristics of places
The student knows how different human groups alter places in distinctive ways
The student understands how the physical and human characteristics of place can change
Teaching the lesson
Introducing the lessonThis lesson is a continuation of lesson 1, so students should have completed lesson 1 before starting this one. The activity is structured on the geographic inquiry process. Read “Geographic inquiry and GIS” in the front section of the book to become familiar with this process.
Introduce the lesson with “The geographic inquiry process” supplement. Have a brief discussion with your students about thinking geographically.
Student activity We recommend that you complete the activity yourself before presenting the lesson in class. Doing so will allow you to modify the activity to accommodate the specific needs of your students. If they will not be working on individual computers, be sure to explain any necessary modifications.
Explain to students that in this lesson they will practice the ArcMap skills they acquired in the first lesson and be introduced to more advanced skills while exploring the geographic inquiry process.

Mo
du
le 1
: Le
sson
2
25
The geographic inquiry process
Students will be asked to calculate a field in an attribute table, which results in permanent changes to the data. Each student must therefore have their own copy of the module 1 folder.
The last two sections of the lesson do not involve the computer, and you may wish to assign them as homework.
The following are things to look for while the students are working on this activity:
• Are students thinking spatially?• Are students answering the questions?• Are students using a variety of menus, buttons, and tools to answer the questions?• Are students able to use the legends to interpret the data in the table of contents?• Are students able to print out a map on the printer?
Concluding the lesson Conduct a brief discussion in which you ask students to brainstorm ideas about how GIS can be used in everyday life or how they could use GIS in their daily school assignments or classes. Ask them to describe the geographic inquiry process as well as share how comfortable they are with using ArcMap software. This discussion should also include an overview of which buttons they have used, any ArcMap operations that were confusing, and printer operations.
Middle school assessment. Students will have to create and print a map. They will be expected to turn on three layers and zoom in to a location of their choosing, use the Identify tool to obtain three pieces of data about that area, and write a brief paragraph explaining how they created their maps.
High school assessment. Students will have to create and print a map. They will be expected to turn on three layers and zoom in to a location of their choosing, use the Identify tool to obtain three pieces of data about that area, write a brief paragraph explaining how they created their maps, and describe what they learned geographically about the area on their map.
Extending the lesson Challenge students to try the following:
• Create several maps with data from other folders on the data CD to answer a question. Make connections between the data to make sure the maps are meaningful.
• Calculate cell-phone density (the number of people per cell phone) using the World Phone Lines Mobile layer. Use maps and tables to explore how the use of mobile telephone technology may or may not have changed how a country develops its telephone land lines.
• Suggest other layers that might help explain the connections between telephone technology advances and sociopolitical issues like GDP, education, and health care.
• Develop a plan or outline for how to use GIS to fulfill a current class assignment.• Choose a country in the news and use GIS skills to find the country and to study the data
associated with it.
Mo
du
le 1
: Lesson 2
26
Our World GIS Education: Mapping Our World Using GIS
M L
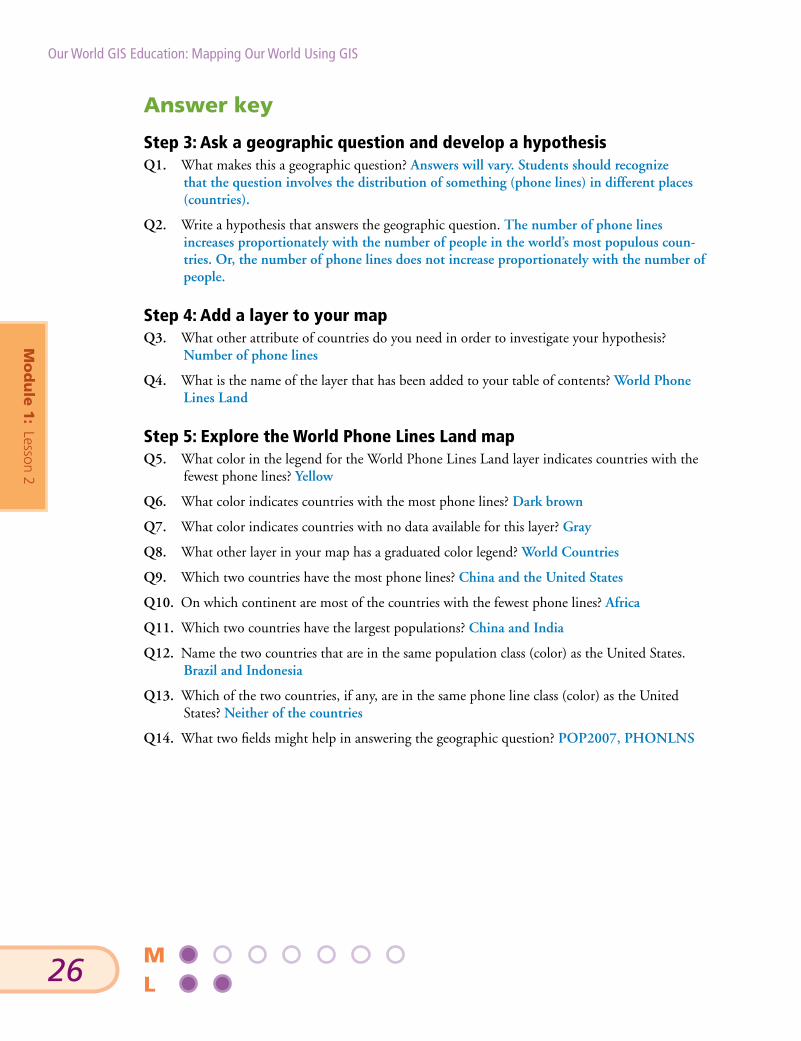
Answer key
Step 3: Ask a geographic question and develop a hypothesisQ1. What makes this a geographic question? Answers will vary. Students should recognize
that the question involves the distribution of something (phone lines) in different places (countries).
Q2. Write a hypothesis that answers the geographic question. The number of phone lines increases proportionately with the number of people in the world’s most populous coun-tries. Or, the number of phone lines does not increase proportionately with the number of people.
Step 4: Add a layer to your mapQ3. What other attribute of countries do you need in order to investigate your hypothesis?
Number of phone lines
Q4. What is the name of the layer that has been added to your table of contents? World Phone Lines Land
Step 5: Explore the World Phone Lines Land mapQ5. What color in the legend for the World Phone Lines Land layer indicates countries with the
fewest phone lines? Yellow
Q6. What color indicates countries with the most phone lines? Dark brown
Q7. What color indicates countries with no data available for this layer? Gray
Q8. What other layer in your map has a graduated color legend? World Countries
Q9. Which two countries have the most phone lines? China and the United States
Q10. On which continent are most of the countries with the fewest phone lines? Africa
Q11. Which two countries have the largest populations? China and India
Q12. Name the two countries that are in the same population class (color) as the United States. Brazil and Indonesia
Q13. Which of the two countries, if any, are in the same phone line class (color) as the United States? Neither of the countries
Q14. What two fields might help in answering the geographic question? POP2007, PHONLNS

Mo
du
le 1
: Le
sson
2
27
The geographic inquiry process
Step 6: Investigate the relationship between phone lines and population in ChinaRecord the answers to questions Q15–Q17 in the table below.
Q15. What was the population of China in 2007? See the table below.
Q16. How many phone lines did China have in 2007? See the table below.
Q17. What was the number of people per phone line in China? See the table below.
Country Population Phone lines People/phone line
China 1,321,851,888 350,433,000 3.77
Step 8: Investigate the relationship between population and phone lines for all countriesQ18. What is the number of people per phone line (PHON_DEN) for China? 3.77
Q19. Does this number agree with the value you calculated in Q17? Yes
Q20. For each country in the table below, what is the population, number of phone lines, and number of people per phone line? The first country, China, is already filled in for you.
Country Population Phone lines People/phone line
China 1,321,851,888 350,433,000 3.77
India 1,129,866,154 49,750,000 22.71
United States 301,139,947 268,000,000 1.12
Indonesia 234,693,997 12,772,000 18.38
Brazil 190,010,647 42,382,000 4.48
Pakistan 169,270,617 5,162,798 32.79
Russia 141,377,752 40,100,000 3.53
Japan 127,467,972 58,780,000 2.17

Mo
du
le 1
: Lesson 2
28
Our World GIS Education: Mapping Our World Using GIS
M L
Step 9: Analyze the results of your researchQ21. In the table below, the column on the left ranks the countries by population from highest to
lowest. In the column on the right, rank the countries from the lowest number of people per phone line to the highest number of people per phone line, using the data from Q20. Then draw lines connecting the name of each country in one column with the name of the same country in the other column.
Ranked by population (highest to lowest)
Ranked by people/phone line (lowest to highest)
China
India
United States
Indonesia
Brazil
Pakistan
Russia
Japan
United States
Japan
Russia
China
Brazil
Indonesia
India
Pakistan
Q22. Which country has the fewest people per phone line? United States What is the number of people per phone line in this country? 1.12
Q23. How does the country in Q22 rank in population size among the eight countries in your table? It’s the third largest in population.
Q24. Which country has the most people per phone line? Pakistan What is the number of people per phone line in this country? 32.79
Q25. How does the country in Q24 rank in population size among the eight countries in your table? It’s the sixth largest.
Q26. What is the population of Japan? 127,467,972 What is the number of people per phone line in Japan? 2.17
Q27. What country has the most phone lines? China How does the number of people per phone line in this country compare with the numbers of people per phone line in the seven other countries in your table? It is fourth.
Q28. Russia and Pakistan have about the same number of people. Why do you suppose these two countries have such different numbers of people per phone line? What factors do you think contribute to this disparity? Possible answer: the countries have different cultures and different levels of economic development.
Q29. What is the answer to the geographic question? The number of phone lines does not vary proportionately with population.
Q30. How does your hypothesis (Q2) compare with your answer to the geographic question (Q29)? Answers will vary.

Mo
du
le 1
: Le
sson
2
29
The geographic inquiry process
Step 10: Develop a plan of actionQ31. Use the information in the table in Q20 to describe the phone line situation in your chosen
country.
Possible answers:
China has the highest number of phone lines of any country in the world, but it has almost four times as many people (over one billion) as phone lines. Brazil also has about four times as many people as phone lines; it ranks fifth among the eight countries, after the United States, Japan, Russia, and China.
Indonesia has 18.38 as many people as phone lines; it falls far behind other countries of similar size such as the United States (1.12 people per phone line) and Brazil (4.48 people per phone line).
The United States has 268 million phone lines—second-highest in the world; it leads the world in access to phone lines, with about as many phone lines as people.
Q32. Do you think that increasing the number of phone lines operating in your chosen country would improve the quality of life there? Why or why not? Answers will vary.
Q33. List three concerns you have about increasing the number of phone lines in your chosen country. Possible answers: cost, difficulty of providing access in rural areas or among the many islands of Indonesia, a preference for expanding more modern cell-phone infrastruc-ture, or greater importance of other issues in the less developed countries (e.g., education, health care).
Q34. List two new geographic questions that you would like to investigate to help you develop a sound plan. Answers will vary but should include a geographic component.

Mo
du
le 1
: Lesson 2
30
Our World GIS Education: Mapping Our World Using GIS
M L
Assessment rubrics
Middle school
Standard Exemplary Mastery IntroductoryDoes not
meet requirements
1 The student knows how to make and use maps, globes, graphs, charts, models, and databases to analyze spatial distributions and patterns
Creates and prints a focused GIS map with more than three themes
Creates and prints a focused GIS map with three themes
Creates and prints a focused GIS map with one or two themes
Has difficulty creating a map without assistance and does not print it out
3 The student understands that places and features are distributed spatially across Earth’s surface
Identifies more than three pieces of information about the area of the world covered by his or her map and develops a geographic question based on that information
Identifies three pieces of information about a particular area of the world and develops a geographic question based on that information
Identifies one or two pieces of information about a particular area of the world and attempts to formulate a geographic question based on that information
Identifies some information about a place but does not create a geographic question based on the information gathered
4 The student knows how different human groups alter places in distinctive ways
Compares a chosen region to China or India using four or more characteristics such as technology, landscape, climate, population, and density
Compares a chosen region to China or India using two or three characteristics
Provides a vague comparison of a chosen region to China or India
Makes an incorrect comparison of a chosen region to China or India
This is a four-point rubric based on the National Standards for Geographic Education. The mastery level meets the target objective for grades 5–8.

Mo
du
le 1
: Le
sson
2
31
The geographic inquiry process
High school
Standard Exemplary Mastery IntroductoryDoes not
meet requirements
1 The student knows how to use technologies to represent and interpret the Earth’s physical and human systems
Creates and prints a focused GIS map with more than three layers
Creates and prints a focused GIS map with three layers
Creates and prints a focused GIS map with one or two layers
Has difficulty creating the map without assistance and does not print it out
3 The student understands how spatial features influence human behavior
Identifies more than three pieces of information about the area of the world covered by his or her map and uses that information to develop a geographic question about the human impact on that place
Identifies three pieces of information about a particular area of the world and uses that information to develop a geographic question about the human impact on that place
Identifies one or two pieces of information about a particular area of the world and attempts to formulate a geographic question based on that information
Identifies some information about a place but does not create a geographic question based on the information gathered
4 The student understands how the physical and human characteristics of place can change
Describes three or four plausible connections between geographic characteristics and the character of a place; writes a clear and concise comparison that takes into account the physical and human characteristics of the two places
Describes one or two plausible connections between a place’s geographic characteristics and its character; writes a clear and concise comparison of the two places
Briefly describes geographic characteristics of a place; identifies some common physical and human characteristics of the two places
Lists one or two characteristics of a chosen region but does not provide a comparison
This is a four-point rubric based on the National Standards for Geographic Education. The mastery level meets the target objective for grades 9–12.