Relativity and Abstract State Machines Edel Sherratt Aberystwyth University Aberystwyth, Wales, UK.

Aberystwyth University
Population genomics of Populus trichocarpa identifies signatures of selectionand adaptive trait associationsEvans, Luke; Slavov, Gancho; Rodgers-Melnick, Eli; Martin, Joel; Ranjan, Priya; Muchero, Wellington; Brunner,Amy M; Schackwitz, Wendy; Gunter, Lee E.; Chen, Jin-Gui; Tuskan, Gerald A.; DiFazio, Stephen P.
Published in:Nature Genetics
DOI:10.1038/ng.3075
Publication date:2014
Citation for published version (APA):Evans, L., Slavov, G., Rodgers-Melnick, E., Martin, J., Ranjan, P., Muchero, W., Brunner, A. M., Schackwitz, W.,Gunter, L. E., Chen, J-G., Tuskan, G. A., & DiFazio, S. P. (2014). Population genomics of Populus trichocarpaidentifies signatures of selection and adaptive trait associations. Nature Genetics, 46, 1089-1096.https://doi.org/10.1038/ng.3075
General rightsCopyright and moral rights for the publications made accessible in the Aberystwyth Research Portal (the Institutional Repository) areretained by the authors and/or other copyright owners and it is a condition of accessing publications that users recognise and abide by thelegal requirements associated with these rights.
• Users may download and print one copy of any publication from the Aberystwyth Research Portal for the purpose of private study orresearch. • You may not further distribute the material or use it for any profit-making activity or commercial gain • You may freely distribute the URL identifying the publication in the Aberystwyth Research Portal
Take down policyIf you believe that this document breaches copyright please contact us providing details, and we will remove access to the work immediatelyand investigate your claim.
tel: +44 1970 62 2400email: [email protected]
Download date: 14. Mar. 2022
1
Population genomics of the model tree Populus trichocarpa identifies signatures of 1
selection and adaptive trait associations 2
Luke M. Evans1, Gancho T. Slavov
2, Eli Rodgers-Melnick
1, Joel Martin
3, Priya Ranjan
4, 3
Wellington Muchero4, Amy M. Brunner
5, Wendy Schackwitz
3, Lee Gunter
4, Jin-Gui 4
Chen4, Gerald A. Tuskan
3,4, Stephen P. DiFazio
1,6 5
6
1 Department of Biology, West Virginia University, Morgantown, WV 26506 7
2 Institute of Biological, Environmental and Rural Sciences, Aberystwyth University, 8
Aberystwyth, SY23 3EB, UK 9
3 The Joint Genome Institute, Walnut Creek, CA 94598 10
4 Plant Systems Biology Group, BioSciences Division, Oak Ridge National Laboratory, 11
Oak Ridge, TN 37831 12
5 Department of Forest Resources and Environmental Conservation, Virginia Tech, 13
Blacksburg, VA 24061 14
6 Corresponding Author: [email protected] 15
16
17
18
19

2
ABTRACT: 20
Forest trees are dominant components of terrestrial ecosystems that have global 21
ecological and economic importance. Despite distributions that span wide 22
environmental gradients, many tree populations are locally adapted, and 23
mechanisms underlying this adaptation are poorly understood. Here we use a 24
combination of whole-genome selection scans and association analyses of 544 25
Populus trichocarpa trees to reveal genomic bases of adaptive variation across a 26
wide latitudinal range. Three hundred ninety-seven genomic regions showed 27
evidence of recent positive and/or divergent selection, and enrichment for 28
associations with adaptive traits that also displayed patterns consistent with natural 29
selection. These regions also provide unexpected insights into the evolutionary 30
dynamics of duplicated genes and their roles in adaptive trait variation. 31
32
A suite of forces and factors, including mutation, recombination, selection, 33
population history, and gene duplication influence patterns of intraspecific genetic 34
variation. Distinguishing which factors have shaped sequence variation across a genome 35
requires extensive whole-genome sequencing of multiple individuals, which has only 36
recently become tractable1. Most large-scale whole-genome resequencing studies have 37
focused on model and domesticated species1–5
. However, large-scale genome sequencing 38
of natural populations holds great promise for advancing our understanding of 39
evolutionary biology, including identifying functional variation and the molecular bases 40
of adaptation. Recent work in a number of species has identified genomic regions that 41
show signatures of positive selection and infer that such regions contain loci that control 42

3
adaptive traits4,6–8
. Relatively few studies, however, have combined genome-wide scans 43
with phenotypic data to determine if computationally-identified selected regions 44
influence adaptive phenotypic variation5,9–13
. Genome-wide studies of large natural 45
populations combined with phenotypic measurements are necessary to determine which 46
factors shape patterns of genetic variation within species, and therefore enhance our 47
understanding of adaptation. 48
With large geographic ranges spanning wide environmental gradients and a long 49
history of research demonstrating local adaptation14
, forest trees are ideal for examining 50
the processes shaping genetic variation in natural populations. Forest trees cover 51
approximately 30% of terrestrial land area15
, provide direct feedback to global climate15
, 52
and are often foundation species that organize entire biotic communities and 53
biogeochemical systems16,17
. Clearly, biotic and abiotic interactions have influenced 54
population sizes and distributions of forest trees, leaving diagnostic signatures in the 55
genomes of present-day populations14,18,19
. A deeper understanding of the evolutionary 56
and ecological forces that shaped these patterns will offer insights and options for 57
ecosystem management, applied tree improvement, and accelerated domestication 58
efforts20
. 59
Black cottonwood, Populus trichocarpa Torr. & Gray, is a dominant riparian tree 60
that has become a model for the advancement of genomic-level insights in forest trees21
. 61
The sequencing of 16 P. trichocarpa genomes revealed widespread patterns of linkage 62
disequilibrium (LD) and population structure22
and extensive genecological studies have 63
revealed a high degree of adaptive phenotypic variation in growth, vegetative phenology 64
and physiological traits such as water use efficiency and photosynthesis23–25
, suggesting 65

4
that local adaptation is prevalent. To date, candidate gene association analyses have 66
revealed loci with significant effects on phenotypic traits26,27
. However, thus far there 67
have been no publications describing whole-genome associations for adaptive traits in P. 68
trichocarpa, and their relationship to signatures of selection in any forest tree species. 69
One of the salient features of the P. trichocarpa genome is a remarkably well-70
conserved whole-genome duplication that is shared by all members of the Salicaceae and 71
near relatives: the Salicoid duplication28,29
. Despite the extensive occurrence of segments 72
of collinear paralogous genes, over two-thirds of the duplicate pairs have been lost since 73
the duplication event and there are substantial functional biases in the remaining gene 74
pairs, in particular, an overabundance of gene categories with large numbers of protein-75
protein interactions30,31
. A major unexplored question is whether the fundamental, 76
diagnostic differences in diversity between retained duplicate pairs and genes lacking 77
paralogs from the Salicoid duplication (singletons) are connected to patterns of natural 78
selection and adaptive phenotypic variation. 79
Here we report the whole-genome resequencing of a collection of 544 P. 80
trichocarpa individuals, spanning much of the species’ natural latitudinal range, that have 81
been clonally replicated in three contrasting environments. We use this resource to detect 82
signatures of recent selection across the Populus genome and on adaptive traits 83
themselves. We also show that the signals of association with adaptive traits are stronger 84
in positively selected regions. Finally, we demonstrate that Salicoid duplicate genes have 85
distinctive patterns of adaptive variation that reveal the evolutionary effects of dosage 86
constraints. 87
88
89
5
RESULTS 90
Polymorphism and population structure 91
From high-coverage whole-genome sequencing of 544 unrelated P. trichocarpa 92
individuals (Fig. 1a, Supplementary Table 1) we collected over 3.2 Tbp of data that 93
aligned to 394 Mbp of the P. trichocarpa genome. Approximately 87.5% of the 3.2 Tbp 94
was accessible for analysis based on median sequencing depth across all samples 95
(Supplementary Fig. 1). From these data, we detected 17,902,740 single nucleotide 96
polymorphisms (SNPs). 97
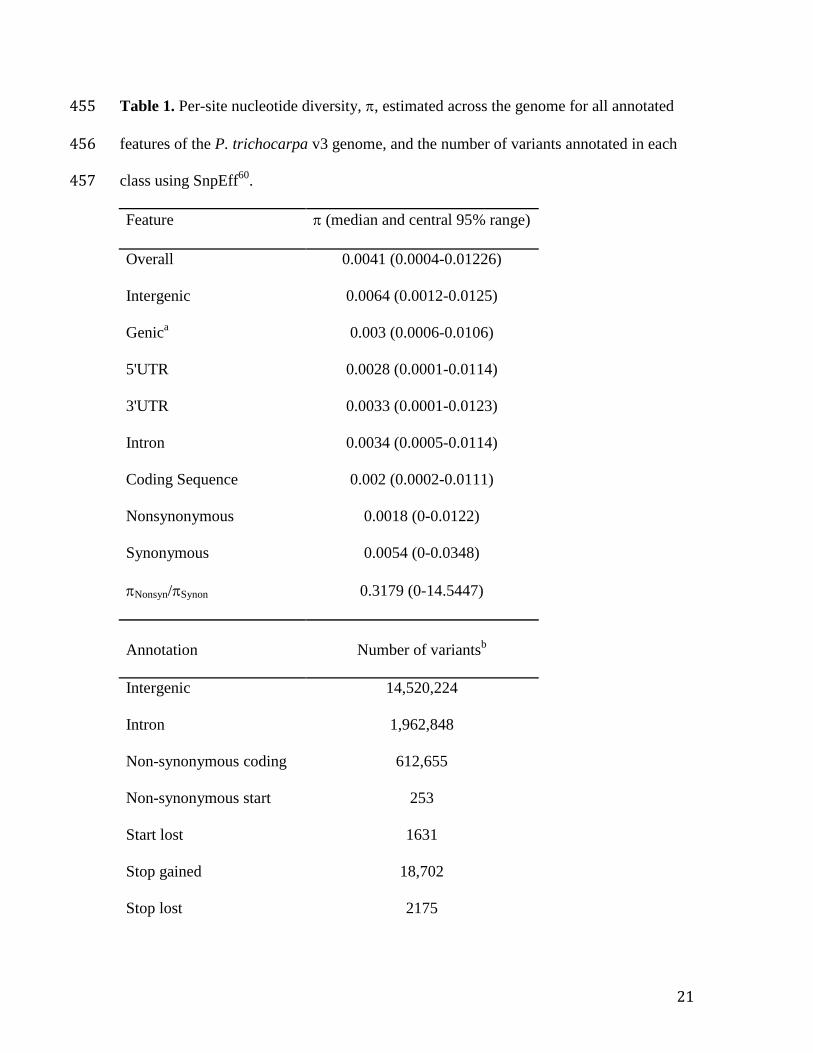
Using this resource, there was a two-fold higher nucleotide diversity in intergenic 98
sequence than in genic sequence, largely consistent with purifying selection (Table 1). 99
Diversity was particularly low in coding sequence, where nonsynonymous diversity was 100
one-third that of synonymous diversity. Most SNPs were rare (MAF≤0.01), particularly 101
those predicted to have major effects (e.g., splice site mutations) (Table 1, Supplementary 102
Fig. 2). We also identified 5,660 large (>100 bp) and 254,464 small (<50bp) 103
insertion/deletion (INDEL) polymorphisms, which will be described in detail in a 104
separate publication. 105
Based on principal components analysis (PCA) of all 17.9 million SNPs, we 106
identified four major regional genetic groups corresponding to geographical origin (Fig. 107
1a). We also found genetic-geographical structure within regional groupings that 108
clustered as separate subgroups within source locations (Fig. 1b). These data indicate that 109
there is genome-wide genetic structure at both broad latitudinal and local spatial scales. 110
111

6
Phenotypic evidence of selection 112
We examined two different indicators of selection using phenotypic data from 113
three clonally replicated plantations representing the center and southern extent of the 114
extant range of P. trichocarpa. We found that quantitative differentiation (QST) in height, 115
spring bud flush, and fall bud set among source rivers was greater than genome-wide 116
marker differentiation (FST) (Fig. 2a), suggestive of spatially divergent selection32
, as is 117
commonly observed in forest trees14,24,25
. Furthermore, at all three plantations, these same 118
adaptive traits show correlations with multivariate climate variables (Fig 2b-d; 119
Supplementary Fig. 3). Warmer climates (negative PC1) are associated with earlier bud 120
flush and later bud set, strongly supporting the hypothesis that climate is a major 121
determinant of adaptive genetic variation throughout the sampled range of P. 122
trichocarpa24,25
. 123
Recent positive and divergent selection 124
We next attempted to relate the strong evidence of climate-driven, divergent 125
selection on adaptive traits to genomic regions that also appear to be affected by natural 126
selection. We examined five distinct metrics of natural selection using 1-kb windows 127
across the genome. These metrics included allele frequency differentiation among 128
subgroups (FST), allele frequency cline steepness across mean annual temperature and 129
precipitation measurements (SPA33
), extended haplotype homozygosity around alleles 130
from rapid allele frequency increase (iHS8), and allele frequency clines with each of the 131
first two climate principal components axes (bayenv34
, PC1 and PC2, respectively). From 132
this data we classified the empirical top 1% of windows/regions as “selection outliers,” 133
i.e., regions with unusually strong polymorphism patterns consistent with recent 134
7
positive/divergent selection (Fig. 3, Supplementary Fig. 4 & 5, Supplementary Tables 2-135
6). Most of the selection outlier regions occurred uniquely among selection scan metrics, 136
suggesting that each metric provides a distinct view of selection and that different 137
selective forces are shaping these genomic regions (Fig. 3a). However, we found 397 138
regions in the top 1% for at least two of the selection scan metrics; we termed these 139
regions “candidate selection regions” (CSRs) (Supplementary Table 7). 140
We tested whether the genes spanning or nearest to these CSRs (452 genes) and 141
the selection outliers (1418, 1718, 1151, 257, and 312 genes for FST, SPA, iHS, 142
bayenvPC1, and bayenvPC2, respectively) were overrepresented among annotation 143
categories, gene families or genes with known involvement in several biological 144
processes (Supplementary Tables 8-11, Fig. 3). Based on Fisher exact tests, certain 145
functional categories were overrepresented, including GO annotations related to: 146
response to stimuli, 1,3--glucan (callose) synthesis, and metabolic processes, as well as 147
panther annotations for leucine-rich repeat receptor-like protein kinase and homeobox 148
protein transcription factors (Supplementary Tables 8-10). 149
Despite some similarities, genes associated with the top 1% of each scan were 150
generally overrepresented in unique categories (Fig. 3). For example, transcription factors 151
(TFs) as a group were overrepresented among FST and SPA outliers; DELLA proteins 152
(PF12041, gibberellin-interacting transcriptional regulators), among FST and bayenvPC2; 153
and phytochromes (PF00360), genes involved in photoperiodic/circadian clock regulation, 154
ATPase activity, and transmembrane movement (e.g., GO:0042626) were only 155
overrepresented in FST (Supplementary Tables 8,9). Heat shock-related annotations were 156
significantly overrepresented only in SPA (PTHR10015, PTHR11528), while proteins 157
8
induced by water stress or abscisic acid (PF02496) were overrepresented in bayenvPC2 158
and SPA outliers. 4-nitrophenylphosphatase, a hydrolase, was overrepresented among 159
bayenvPC1 and weakly in FST (Supplementary Table 9). Class-III aminotransferases 160
(PTHR11986, involved in abiotic stress35
) were overrepresented most strongly in 161
bayenvPC2 (Fig. 3). 162
Intriguingly, while moderate-effect SNPs were underrepresented among genic 163
regions of all selection scan outliers, presumably due to purifying selection, SNPs with 164
predicted high impacts were overrepresented among strong sweep loci implicated by the 165
iHS scans (Supplementary Table 12), potentially because SNPs with major, presumably 166
beneficial effects are more likely to be swept to high frequency. Because different 167
selection processes (e.g., hard sweeps vs. subtle frequency shifts of standing variation) 168
will influence diversity patterns differently, these five metrics reveal an assortment of 169
potential selection pressures acting on P. trichocarpa through the largely non-170
overlapping regions identified in each 171
172
Adaptive trait associations in candidate selected regions 173
If climate is a major force driving the signatures of positive selection, we predict 174
polymorphisms in these regions to be associated with climate-related adaptive traits. In 175
particular, vegetative bud phenology should be a major determinant of fitness in these 176
perennial populations, since timing of the onset and release of dormancy is largely shaped 177
by photoperiod and temperature regimes23,24
. Indeed, genes related to photoperiod, 178
drought, and stress response were overrepresented among the selection outliers 179
(Supplementary Table 11). To more directly test this hypothesis, we performed a 180
9
genome-wide association study (GWAS) with spring bud flush, fall bud set, and tree 181
height measured at the three test sites, accounting for population stratification and 182
background genetic effects in a mixed model framework for both univariate36
and 183
multivariate traits37
(Fig. 1b, Supplementary Tables 1 & 13, Supplementary Fig. 6-10). 184
More specifically, we found that those regions in the top 1% of scans had stronger 185
adaptive trait association signals at all three test sites than expected by chance (i.e., the 186
observed mean association signal was stronger than randomly resampled windows, 187
controlling for gene density; all p<0.00005; Fig. 4, Supplementary Fig. 11). This was the 188
case for all scans, including those based on spatial variation in allele frequency (e.g., FST, 189
bayenv) as well as those based on long haplotypes (iHS). This correspondence is 190
therefore unlikely to be artifactual, supporting the hypothesis that these outlier regions 191
are partly driven by selection on adaptive traits. 192
We found strong associations for both univariate analyses as well as the multi-193
trait GWAS for each trait among test sites (Supplementary Table 13). Though some of 194
the strongest univariate associations were also identified in the multiple-plantation 195
GWAS, many associations were non-overlapping, perhaps due to the strong 196
environmental differences among the locations, which ranged from cool and wet 197
(Clatskanie, OR) to hot and dry (Placerville, CA). Strikingly few individual height-198
associated SNPs overlapped in comparisons between the Placerville, CA plantation and 199
the other two sites. 200
201
202

10
Dormancy-related candidate genes in the selection and GWAS regions 203
A number of dormancy-related genes were near the strongest GWAS and 204
selection signals. A region on chromosome 10, characterized by high LD, was one of the 205
CSRs and was associated with bud flush (p=5.19x10⁻⁶
, Fig. 5). The strongest selection 206
signal occurred near Potri.010G079600, a DNA-damage repair protein, and a number of 207
lipid biosynthesis transferases. A strong bud set association also occurred near this region 208
(Clatskanie and Corvallis, Supplementary Fig. 12). The strongest association signal 209
(p=5.69x10⁻⁷
), within 15 kb of a CSR, was just downstream of the coding region of 210
Potri.010G076100, a ureidoglycolate amidohydrolase (UAH) whose leaf and root 211
expression is down-regulated with short days38
. Ureides are transportable intermediates 212
of purine catabolism, and by catalyzing the final step in ureide catabolism, UAH plays a 213
role in the remobilization of nitrogen39
. The ureide allantoin is also known to influence 214
ABA metabolism and promotes abiotic stress tolerance in Arabidopsis39
. However, to 215
our knowledge, ureides and UAH have not previously been implicated as having 216
important roles in seasonal N cycling or cold tolerance in Populus. 217
Among the photoperiodic and dormancy genes we found an FST outlier, 218
Potri.010G179700 (FT2), which influences growth cessation in Populus40
. This gene had 219
an intronic SNP strongly associated with bud set and height (p<0.00015, Supplementary 220
Table 13) and was near strong SPA and bayenv outliers. A second gene, 221
Potri.008G117700 (similar to PFT1), occurred as an FST outlier region and was within 5 222
kb of several multi-trait association signals (p=7.17x10⁻⁵
). Arabidopsis PFT1 is 223
hypothesized to influence both defense and phytochrome B-mediated FT regulation41
. 224
11
Among the strongest bud flush associations (p=2.72x10⁻¹⁴
) was a nonsynonymous 225
mutation in a 4-NITROPHENYLPHOSPHATASE locus, Potri.008G077400 (Clatskanie 226
and Corvallis, Fig. 6). This mutation is in high LD with many other significantly 227
associated SNPs in the surrounding 40 kb, including Potri.008G076800, (FAR1 228
transcription factor) and Potri.008G077300 (UDP-galactose transporter), and is in an FST 229
and bayenvPC1 outlier region. In this same region there is a bud flush association signal 230
in all three test sites (p=2.01x10⁻⁷
- 1.08x10⁻⁵
) within Potri.008G077700 (FT1), a gene 231
previously implicated in Populus dormancy cycling42
. However, it appears to be an 232
unlinked (r2=0.14), separate association signal from that in Potri.008G077400. 233
In summary, we have detected genomic regions with patterns of diversity that are 234
consistent with divergent and/or recent positive selection on a range of traits, and 235
particularly on climate-related phenological and growth patterns. While our selection 236
scans and GWAS analyses identified genes previously known to influence adaptive traits, 237
they have also identified many loci of unknown function, which would not have been 238
considered in any a priori candidate gene approach. Furthermore, the results and 239
discussion presented above focus primarily on vegetative phenology, but many other 240
traits are likely to be involved in determining fitness in these highly variable 241
environments. In fact, the CSRs contained genes that have been implicated in controlling 242
numerous other adaptive characteristics, including temperature stress tolerance, ion 243
uptake and homeostasis, insect and pathogen defense, and reproduction. These are 244
discussed in more detail in a Supplementary Note. 245
246
247
12
Duplication and Network Connectedness 248
We tested whether genes associated with selection outliers were over- or under-249
represented among the 7,906 identified gene pairs resulting from the Salicoid whole-250
genome duplication29,31
(hereafter referred to as “Salicoid duplicates”), vs. genes that 251
occur as singletons (Table 2). These analyses suggest that recent positive selective 252
sweeps (indicated by iHS) are less likely for retained Salicoid duplicates than for 253
singleton genes, but when one occurs, the sweep tends to occur for both duplicates. We 254
also found that genes nearest to the individual FST, SPA, and iHS outliers had more 255
predicted protein-protein interactions (PPI) than genes in the rest of the genome 256
(Supplementary Fig. 13; p≤0.05). Furthermore, PPI were negatively correlated with 257
nucleotide substitutions (T, S, and Nonsynymous/Synonymous ratio; r <-0.06, p<0.0001). These 258
results suggest that patterns of selection (both purifying and positive) are influenced by 259
genomic context, including past whole-genome duplication events and gene or protein-260
protein interactions. We discuss these analyses further in the Supplementary Note. 261
262
DISCUSSION 263
A primary goal of evolutionary biology is to determine the influences of positive 264
and purifying selection, as well as neutral forces in shaping genetic variation. Natural 265
populations spanning wide climatic gradients offer an ideal opportunity to investigate 266
these patterns. We sequenced over 500 P. trichocarpa individuals from across much of 267
the species range and identified over 17 million SNPs (Table 1, Fig. 2). These 268
polymorphisms revealed significant spatial/geographic structure, even at fine scales. As 269
previously suggested based on small-scale sequencing and genotyping22
, such patterns 270

13
appear to have resulted from a combination of restricted gene flow and complex 271
demographic history. 272
Geographically structured, adaptive phenotypic variation is common among forest 273
trees14,24,43
. Climate is a fundamental driver of such variation14,24,25
, and we identified 274
quantitative trait differentiation and climate-related variation within our sample 275
consistent with this pattern. However, the molecular and evolutionary processes 276
underlying such adaptation often remain unknown. While genome-wide polymorphism 277
patterns suggest strong purifying selection throughout genic space, we also identified 278
regions of the genome with unusually long haplotypes, among population differentiation, 279
and climatic gradients consistent with recent positive or divergent selection. Genes within 280
these regions contain a variety of annotations plausibly related to local biotic and abiotic 281
conditions, including photoperiod-responsive and dormancy-related loci, insect and 282
pathogen defense, abiotic stress tolerance, and phenylpropanoid metabolism. Such genes 283
provide excellent targets for natural selection and for functional studies aimed at 284
elucidating the drivers of local adaptation in black cottonwood and other species. 285
These largely non-overlapping regions also provide insight into the variety of 286
selection pressures and modes of selection acting within and among populations. For 287
instance, classic, recent selective sweeps (iHS) are overrepresented among genes with 288
annotations associated with heavy metal homeostasis and symbiosis. On the other hand, if 289
climate-driven selection primarily acts upon standing variation rather than new mutations, 290
subtle allele frequency shifts among populations for many loci of small effects may be 291
expected rather than hard selective sweeps. This is consistent with relatively little overlap 292
among outlier regions identified with bayenvPC2 and iHS. Adaptation, therefore, likely 293

14
occurs through different process for different mutations, perhaps dependent on mutation 294
age, trait heritability and penetrance, and number of loci involved as has been suggested 295
to occur in human populations44
. 296
Remarkably, the selection outlier loci were also enriched for polymorphisms 297
associated with adaptive traits like bud flush, bud set, and height. While factors such as 298
stratification and linkage may produce erroneous associations45
, mapping traits to 299
computationally identified selection regions lends greater support to their functional 300
significance. Similar patterns have been observed in the model annual plant Arabidopsis, 301
where genomic regions showing signatures of selection are structured by climate 302
variation9,12
and co-located with adaptive trait associations9. Similar examples have been 303
identified in domesticated crops5,11
. However, to our knowledge this is the first report of 304
such concordance in a widespread, ecologically important undomesticated plant species. 305
We recognize that complex peaks of association may also be partially responsible 306
for the overlap between selection scans and GWAS and differences in GWAS signal 307
among gardens. LD combined with spurious patterns of random mutation or neutral 308
stratification may produce synthetic associations45
and/or composite phenotypes driven 309
by multiple causal loci46
. However, there is no reason to expect this correlative effect at 310
high frequency on a genome-wide scale. Therefore, our findings suggest that the outliers 311
contain variation relevant to adaptation based on their statistically stronger than expected 312
adaptive trait association signal. 313
The power of combining selection scans and association analyses is well 314
illustrated by insights gained from our study into winter dormancy control in natural 315
settings. Building upon previous functional studies under highly controlled 316
15
environments40–42,47
, our results support a model of vegetative bud set and spring bud 317
flush timing that centers on regulation of expression and symplastic mobility of the FT1 318
and FT2 proteins. FT1 is known to be transiently induced by chilling during winter and 319
promotes the floral transition40
. However, associations of FT1 with vegetative bud flush 320
suggest an additional function. Prolonged chilling releases endodormancy, the timing of 321
which is correlated with bud flush through subsequent accumulation of warm-322
temperature units24
. Moreover, the timing of the reopening of callose-plugged symplastic 323
paths, endodormancy release, and FT1 upregulation are correlated42
. Based on our 324
association results, we hypothesize that FT1 is also involved in regulating endodormancy 325
release, and hence subsequent bud flush timing. 326
Reported studies of Populus CEN1, a flowering repressor and homolog of the FT 327
antagonist TFL1, also provide support for this model48
. Its winter expression is low when 328
FT1 expression is high, but CEN1 is highly and transiently upregulated shortly before 329
bud flush. However, constitutive overexpression of CEN1 delays endodormancy release 330
and bud flush48
. In Arabidopsis, the balance between FT and TFL1 appears to be central 331
to the transition to flowering versus maintenance of indeterminate meristems49
. Thus, 332
CEN1 might counterbalance FT1 promotion of endodormancy release. In this model, the 333
relative timing of FT1 regulation could influence phenotypic variation observed in bud 334
flush timing. 335
Patterns of adaptive variation are not independent of genomic history, and large-336
scale events such as whole-genome duplications can alter the evolutionary trajectories of 337
certain loci. The deficiency of Salicoid duplicates among iHS outliers indicates that 338
recent hard selective sweeps are less likely for genes retained from genome duplication, 339
16
possibly because of fitness costs associated with altered function and/or stoichiometry of 340
paralogs with large numbers of protein-protein interactions50,51
. Furthermore, selective 341
sweeps tend to affect both paralogs of a duplicated pair when they do occur, providing 342
further support for the role of dosage constraints in duplicate gene evolution. 343
This is not to suggest that dosage constraints are the sole or even the primary 344
drivers of the retention and evolution of duplicate genes. Abundant evidence supports 345
subfunctionalization and neofunctionalization of Salicoid duplicates31
. The case of the FT 346
paralogs is again illustrative. FT1 and FT2 are Salicoid duplicates with divergent 347
functions affecting distinct aspects of phenology, and displaying diametrically opposed 348
expression patterns in Populus40
. While FT1 is primarily expressed during winter in 349
dormant buds, FT2 is mainly expressed during the growing season, maintaining 350
vegetative growth40
. Short days during fall lead to FT2 suppression, in part through 351
phytochrome influence on the transcription factor PFT140,41
. In support of this model, we 352
found bud set associations with FT2 and a PFT1 paralog, and bud flush associations for 353
FT1. This remarkable divergence in function demonstrates the adaptive potential of 354
Salicoid duplicate pairs, consistent with classic models of duplicate gene evolution52,53
. 355
Intriguingly, a Salicoid duplicate pair that occurred in the CSRs are 1,3--glucan 356
[callose] synthase homologs (Potri.002G058700 & Potri.005G203500). Arabidopsis 357
callose synthases, when expressed in the phloem, deposit callose in the plasmodesmata, 358
altering sugar and signaling molecule transport54,55
. Returning to the phenological model 359
outlined above, Rinne et al.42
hypothesized the formation and degradation of callose 360
plugs to be a control point for dormancy onset and release, possibly blocking 361
17
translocation of FT1/FT2. These duplicates may also have divergent functions and 362
expression patterns, similar to those observed for the FT paralogs. 363
Our findings have important implications for understanding mechanisms of 364
adaptation of ecologically dominant plants with widespread distributions. While forestry 365
trials have for over 200 years indicated substantial local adaptation of dominant trees56
, 366
ours is the first to explore the genomic legacy of this selection across the entire genome 367
and highlight both the wide range of selection pressures as well as the climatic influence 368
on phenological systems. These findings also have important implications for the 369
management of natural populations in the face of environmental change. Traditionally 370
seed transfer zone guidelines have required large numbers of plantations to accurately 371
estimate transfer parameters57
. Computationally identifying adaptive variants through 372
selection scans and genome-wide phenotypic prediction could provide information in the 373
absence of extensive plantation trials, maximizing genetic diversity while matching 374
germplasm to current and future environmental pressures. Management and modification 375
of such genetic diversity will undoubtedly impact dependent biotic communities and 376
ecosystem functioning, which are known to be influenced by tree genetic variation17
. 377
The 17.9 million SNPs we identified represent naturally segregating variants 378
found in wild populations, which can be utilized for multiple objectives. Forest tree 379
improvement has traditionally relied upon natural variation in breeding programs through 380
targeted crossing based on superior phenotypes20
. The availability of whole-genome 381
sequences can enable alternative breeding approaches, including genome-wide 382
phenotypic prediction58
and breeding with rare defective alleles, which relies on rare, 383
recessive mutations of large effect that are commonly heterozygous and therefore masked 384
18
from many approaches59
. Most SNPs found here are intergenic and uncommon, but many 385
have predicted major effects in genic regions. Several SNPs of the latter type are in the 386
candidate selection regions, including altered start and stop codons and alternative splice 387
variants, which could represent an immediate set of tractable targets for breeding 388
programs constrained by long generation times. Several occur at high frequency in the 389
isolated southern or northern populations, demonstrating that sampling populations 390
throughout the range, including marginal populations, will yield many more variants of 391
potential utility. 392
Online Methods – see separate document 393
URL 394
http://www.phytozome.net/poplar.php 395
ACKNOWLDGEMENTS 396
This work was supported by funding from the BioEnergy Science Center, a U.S. DOE 397
Bioenergy Research Center supported by the Office of Biological and Environmental 398
Research in the DOE Office of Science. We thank the members of BESC for their varied 399
contributions to this work, and especially those involved in the collection, propagation, 400
and maintenance of the common gardens, including Glenn Howe, Andrew Groover, 401
Reinhard Stettler, Jon Johnson, and the staffs at Mt. Jefferson Farms and Greenwood 402
Resources. We thank the WVU High Performance Computing facility, in particular 403
Nathan Gregg and Mike Carlise. A.M.B acknowledges support from the Virginia 404
Agricultural Experiment Station and the Program McIntire Stennis of the National 405
Institute of Food and Agriculture, U.S. Department of Agriculture. 406
407
19
COMPETING FINANCIAL INTERESTS 408
The authors declare no competing financial interests 409
Author Contributions: 410
G.A.T., S.P.D., G.T.S., & L.M.E. conceived and designed the study. All authors 411 performed measurements. L.G., J.M., & W.S. performed sequencing. L.M.E., S.P.D., 412 G.T.S., E. R.-M., J.M., P.R., W.M., & W.S. performed analyses. L.M.E., S.P.D. and 413 A.M.B. drafted the manuscript. All authors read, revised, and approved the 414 manuscript. 415
FIGURE LEGENDS: 416
Figure 1. Geographic locations and genetic structure of the 544 P. trichocarpa 417
individuals sequenced. a. Map of collection locations of the 544 P. trichocarpa 418
genotypes sampled in this study from along the Northwest coast of North America, with 419
the species range shaded in tan, and PCA of all 544 individuals color-coded by general 420
geographic regions. Yellow diamonds represent plantation locations. b. PCA of the 421
central WA/BC group of individuals (outlined by box in part (a)) color-coded by 422
collection river. The percent of the variance explained by the first two PC axes for both 423
the regional analysis and the WA/BC group is shown. 424
425
Figure 2. Phenotypic evidence of climate-driven selection in P. trichocarpa. a. Patterns 426
of quantitative trait differentiation (QST) are stronger than genome-wide differentiation 427
(FST) among sampled geographic locations. Shaded area represents the 95% confidence 428
interval (CI) of FST, while points and bars represent the point and 95% CI of QST. b-d. 429
Genotypic estimates of best linear unbiased predictors for adaptive traits growing in 430
multiple plantation environments show strong correlations with the first principal 431
component of 20 climate variables measured at the collection location. Negative PC1 432
values are associated with warmer conditions, while more positive bud flush and bud set 433

20
BLUPs indicate more earlier flush or set, respectively. Correlation coefficient and p-434
value are shown above each. 435
436
Figure 3. Unique and shared genomic regions among five selection scans. a. A Venn 437
diagram of the number of regions throughout the genome in the top 1% for each selection 438
scan. b. Overrepresentation p-value for panther annotation categories in selection outliers. 439
Only the 10 most strongly overrepresented categories for each selection scan are shown. 440
441
Figure 4. The selection outliers have a stronger association signal with adaptive traits 442
than expected by chance. a-c. The genome-wide distribution of association signal in 1-kb 443
windows through the genome (blue; left axis) and the association within the selection 444
outliers (green; right axis; red line indicates mean) for three traits in different gardens. 445
446
Figure 5. A region of chromosome 10 that displays an abundance of bud flush 447
association and strong evidence of selection from multiple different selection scans. 448
Dashed lines represent the 1% cutoff mark for selection scans. 449
450
Figure 6. A region of chromosome 8 that displays multiple strong bud flush associations, 451
in addition to evidence of positive selection. Dashed lines represent the 1% cutoff mark 452
for selection scans. 453
454
21
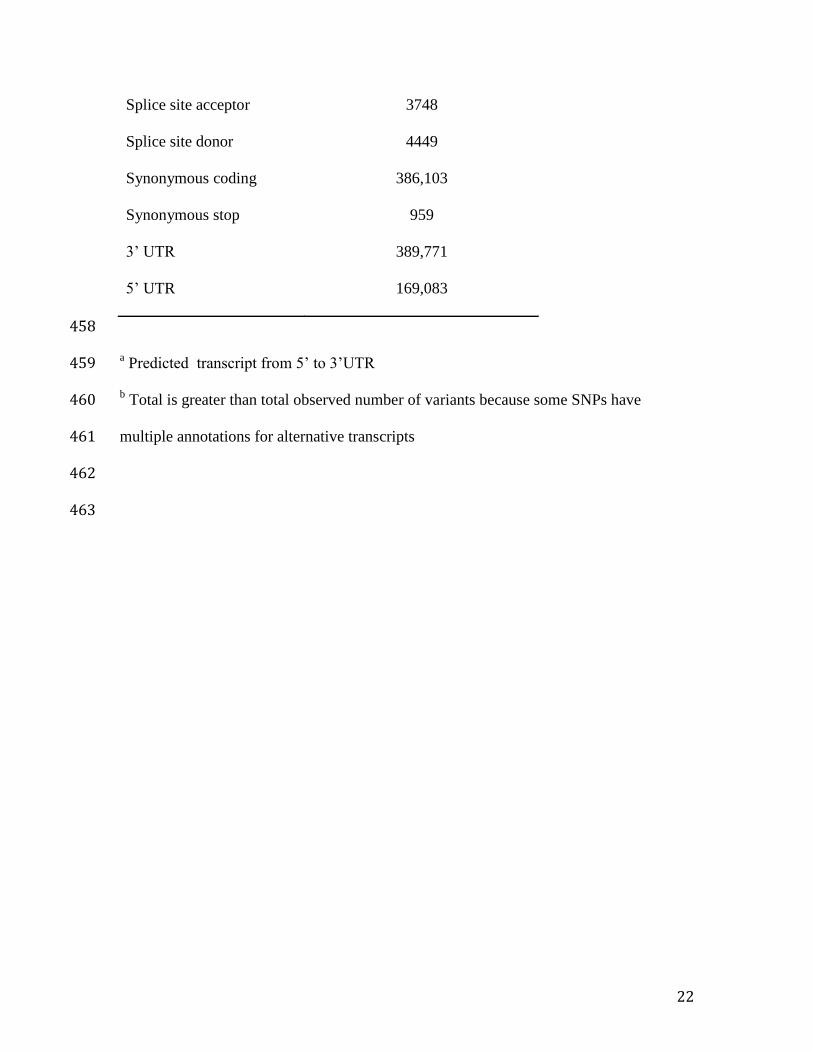
Table 1. Per-site nucleotide diversity, , estimated across the genome for all annotated 455
features of the P. trichocarpa v3 genome, and the number of variants annotated in each 456
class using SnpEff60
. 457
Feature (median and central 95% range)
Overall 0.0041 (0.0004-0.01226)
Intergenic 0.0064 (0.0012-0.0125)
Genica 0.003 (0.0006-0.0106)
5'UTR 0.0028 (0.0001-0.0114)
3'UTR 0.0033 (0.0001-0.0123)
Intron 0.0034 (0.0005-0.0114)
Coding Sequence 0.002 (0.0002-0.0111)
Nonsynonymous 0.0018 (0-0.0122)
Synonymous 0.0054 (0-0.0348)
Nonsyn/Synon 0.3179 (0-14.5447)
Annotation Number of variantsb
Intergenic 14,520,224
Intron 1,962,848
Non-synonymous coding 612,655
Non-synonymous start 253
Start lost 1631
Stop gained 18,702
Stop lost 2175
22
Splice site acceptor 3748
Splice site donor 4449
Synonymous coding 386,103
Synonymous stop 959
3’ UTR 389,771
5’ UTR 169,083
458
a Predicted transcript from 5’ to 3’UTR 459
b Total is greater than total observed number of variants because some SNPs have 460
multiple annotations for alternative transcripts 461
462
463

23
Table 2. Tests of over- and underrepresentation of retained Salicoid duplicate genes and 464
pairs among the selection outliers. Shown are the number of genes in each category and 465
the associated p-value. 39,514 genes are found on the 19 chromosomes, with 7609 pairs 466
from 15,797 genes. 467
468
Selection
Scan
Duplicate
Genes in
Outlier
Regions
Fisher’s Exact
Test (p-value)a
Duplicate
Pairs in
Outlier
Regions
Fisher’s Exact
Test (p-value) a
CSR 178 NS (0.623) 2 NS (0.263)
FST 674 Over (2.8x10⁻⁹
) 27 Over (0.002)
SPA 741 Over (0.004) 24 NS (0.065)
iHS 348 Under (3.0x10⁻¹²
) 8 Over (0.039)
BFPC1 100 NS (0.661) 1 NS (0.263)
BFPC2 134 NS (0.156) 0 NS (1)
469
a NS, not significant; Over or Under, genes or pairs were significantly 470 overrepresented or underrepresented within outlier regions, respectively, 471 compared to genome-wide expectation. 472
473
24
Methods 474 Sequencing, assembly, and variant calling 475
We obtained plant materials from 1100 black cottonwood (Populus trichocarpa 476 Torr & Gray) from wild populations in California, Oregon, Washington, and British 477 Columbia, as previously described
22. We resequenced a set of 649 genotypes to a 478
minimum expected depth of 15x using the Illumina Genome Analyzer, HiSeq 2000, and 479 HiSeq 2500. Sequences were down-sampled for those individuals sequenced at greater 480 depths to ensure even coverage throughout the population (Supplementary Fig. 1a). Short 481 reads were then aligned to the P. trichocarpa version 3 genome using BWA 0.5.9-r16 482 with default parameters
61. We corrected mate pair metadata and marked duplicate 483
molecules using the FixMateInformation and MarkDuplicates methods in the Picard 484 package (http://picard.sourceforge.net). Next, we called SNPs and small indels for the 485 merged dataset using SAMtools mpileup (-E –C 50 –DS –m 2 –F 0.000911 –d 50000) 486 and bcftools (-bcgv –p 0.999089)
62. 487
488 Genotype validation 489
We compared the samtools mpileup genotype calls for 649 individuals to 22,438 490 SNPs assayed on the Populus Illumina Infinium platform, which was designed based on 491 assembly version 2.0
22,63. These were high-quality SNPs that we could confidently place 492
on the v3 reference genome. The 649 individuals had, on average, a 97.9% match rate. 493 SNPs with a minor allele frequency (MAF) ≥ 0.05 had a match rate of 98.1%, while those 494 with MAF ≤ 0.01 (n=159 SNPs) had a match rate of 78.2%, similar to other published 495 studies
4,64,65. Stringent filtering had minimal impact on match rate, though it reduced 496
substantially the number of known SNPs passing the filtering thresholds. For example, 497 requiring an individual minimum depth of 3, minimum mapping quality of 30, minor 498 allele count of 15, and minimum quality score of 30 increased the false negative rate by 499 3.9%, but only increased the match rate by 0.3%. Therefore, no additional filtering after 500 samtools mpileup variant calling was performed. 501
Nisqually-1 was the original individual sequenced by Tuskan et al.29
using Sanger 502 technology, and it was also resequenced during this study using the Illumina platform. 503 716,691 heterozygous polymorphisms found in the v3.0 reference genome assembly 504 (http://www.phytozome.net/poplar.php) had at least three Sanger reads of each allele, and 505 therefore had strong evidence of being heterozygous in the Sanger assembly. In the 506 current study, we correctly identified 557,738 of these (77.82%), including 3,205 of 507 3,220 singleton variants in Nisqually-1 in the Illumina data, suggesting a 22.18 % false 508 negative rate. Conversely, of 1,115,963 heterozygous positions identified in Nisqually-1 509 in the current Illumina genotyping, 972,254 had at least one Sanger read supporting each 510 allele, suggesting a 12.86 % false positive rate. All of these comparisons were done with 511 no filtering of the samtools mpileup genotype calls. It is important to note that errors 512 occur in both the Sanger and Illumina methods, so these are likely to be overestimates of 513 the true error rates in the resequencing SNP data. 514 515 The Accessible Genome 516
Next, we identified the Populus trichocarpa "accessible genome" as those 517 positions that had sufficient read depth across enough individuals to enable genotypes to 518 be accurately determined (similar to the approach used in the 1000 Genomes Project
1). 519
25
We estimated the median and interquartile range of depth for each position in the genome, 520 for all sequenced individuals, using samtools mpileup. With our target of 15X coverage, 521 "accessible" positions were those with median depth between 5 and 45 (inclusive) and 522 with an interquartile range less than or equal to 15 (Supplementary Fig. 1a,b). Of the 523 394,507,732 positions that were sequenced across all individuals, 345,217,484 met these 524 criteria (~87.51%), 17,902,170 of which were single nucleotide polymorphisms (SNPs) 525 (15,454,190 biallelic). We observed a slight deficiency of heterozygotes at lower depth 526 positions; however, these positions cumulatively comprise only between 0.7 and 2.5% of 527 positions at an uncorrected HWE p-value threshold of 0.001 (Supplementary Fig. 1c). 528 Furthermore, these cutoffs did not bias the outcomes of selection scans throughout the 529 genome, as putative selection outliers (see below) had a very similar distribution of depth 530 as the rest of the genome (Supplementary Table 14) and there was no relationship with 531 association p-value (see below; all Pearson |r| < 0.005, Supplementary Fig. 1d). 532 533 Relatedness, Hybridization, and Population Structure 534
We next identified individuals that showed evidence of admixture with other 535 species of Populus because hybridization is common within the genus
66. We used 7 536
additional individuals sequenced to at least 32X depth as above: 3 P. deltoides, 1 P. 537 fremontii, 1 P. angustifolia, 1 P. nigra, and 1 P. tremuloides. These were aligned to the P. 538 trichocarpa v3.0 reference genome using Bowtie2 in local alignment mode and default 539 parameters
67, and variants were called using the samtools mpileup function for each 540
species separately. We then used smartpca68
to identify sampled individuals in this study 541 that were genetically similar to these alternative species. This method identified 3 542 individuals that appear intermediate between the P. trichocarpa cluster and an alternate 543 species (Supplementary Fig. 14). 544
We performed similar analyses using overlapping genomic regions from 32 P. 545 balsamifera transcriptomes (provided courtesy of Dr. Matt Olson, Texas Tech University; 546 Supplementary Fig. 15), and, separately, the Illumina Infinium array data, which 547 contained additional individuals of alternative species
63. These identified an additional 548
three genetically intermediate individuals. These 6 potentially admixed individuals were 549 removed from subsequent analyses. 550
We next identified and removed individuals more related than first cousins using 551 the program GCTA
69. Because this, like most other relatedness estimates, relies on allele 552
frequency estimates within populations, it was necessary to first identify genetic clusters. 553 We iteratively identified genetic clusters using PCA
68, each representing a putative 554
genetic group. We removed related individuals within each from further analyses, leaving 555 a total of 544 individuals, which were used for all subsequent analyses. 556
To assess population structure, we used PCA analyses with these unrelated 544 557 individuals. This identified roughly 4 major groupings (Figure 1a). We then performed 558 PCA analysis using only those individuals from the Washington/British Columbia group 559 to investigate finer-scale structure (Fig. 1b). PCA was performed using all 17.9 million 560 SNPs. 561 562 Phenotypic Evidence of Selection 563 We investigated phenotypic evidence of selection using two methods. First, we 564 compared neutral genetic differentiation among collection rivers/subpopulations (FST, see 565
26
below for details of estimation) to differentiation among rivers for second-year height and 566 fall and spring phenology using data collected from three replicated plantations (QST). 567 Briefly, over 1000 P. trichocarpa genotypes were planted in 2009 in three replicated 568 common gardens (Clatskanie and Corvallis, OR, and Placerville, CA) in a randomized 569 block design with three replicates of each genotype. In 2010, we measured spring bud 570 flush, fall bud set, and total height in each garden. We removed within-garden micro-site 571 variation using thin-plate spline regression (fields R package), then estimated among river, 572
among genotypes within rivers, and residual variance components (2
R, 2G, and
2, 573
respectively) using mixed-model regression (lmer function of the lme4 R package). QST 574 was estimated at the river level as
2R/(
2R +2*
2G)
32. A 95% confidence interval of QST 575
was estimated by resampling rivers, with replacement, 1,000 times and estimating QST for 576 each bootstrapped dataset. We directly compared the 95% CIs for QST and FST. We note 577 that in using clonal replicates
2G includes additive and non-additive genetic effects, 578
rather than the additive genetic variance alone; however, simulations have shown that this 579 approach lowers QST estimates, and is therefore a conservative test of QST > FST
70. 580
Second, we tested for correlations between these adaptive traits and the climate of 581 the source location. We tested correlations with mean annual temperature, mean annual 582 precipitation, and the first two principal components (cumulatively > 85% of variance 583 explained) of 20 climate variables obtained using ClimateWNA
71. We used the genotypic 584
best linear unbiased predictors obtained from mixed model analysis (lmer function of the 585 lme4 R package) as the phenotypic traits. Climate variables were averaged within 586 collection locations prior to correlation analysis. 587 588 Genetic Variation and Signatures of Recent Positive Selection Throughout the 589 Genome 590 We assessed species-wide nucleotide diversity ()
72 using the MLE estimate of 591
allele frequency from the samtools mpileup output62
in all annotated regions (coding 592 sequence, introns, 5’ and 3’ UTRs) of the v3 genome greater than 150 bp long and with at 593 least 95% accessibility. 594
We performed five genome-wide scans of recent positive selection, using four 595 conceptually different approaches. First, we estimated genetic differentiation
72 among 596
collection rivers as FST in 1-kb windows throughout the genome (again, requiring at least 597 95% accessibility and using the accessible positions in a window as the window’s full 598 length). We restricted this analysis to rivers/subpopulations with at least eight individuals, 599 and randomly chose 20 individuals from those that contained > 20 individuals (14 rivers 600 total: Homathko, Skwawka, Lillooet, Squamish, Salmon, Fraser, Columbia, Nisqually, 601 Nooksack, Puyallup, Skagit, Skykomish, Tahoe, Willamette). We estimated nucleotide 602 diversity across all individuals (T) and weighted within-river nucleotide diversity (S), 603 accounting for sequencing error
73. We calculated FST as difference between total and 604
weighted within-river diversity, divided by the total diversity (T-S / T)72
. We took the top 605 1% of the empirical distribution of FST as genomic regions representing unusually strong 606 allele frequency differences among rivers and candidates of divergent selection. 607
The second selection scan quantified the steepness of allele frequency clines 608 across two climate variables, using the program SPA
33. SPA uses a logistic regression-609
based approach to model allele frequency clines, without a priori population assignment 610 and represents a fundamentally different approach than the FST scan described above. We 611
27
used mean annual temperature and mean annual precipitation of the source location for 612 each sample, obtained using ClimateWNA
71, because these variables are significantly 613
correlated with growth and phenological traits. We averaged SPA in non-overlapping 1-614 kb bins throughout the genome, requiring at least 5 SNPs in each window. We identified 615 the top 1% of these windows as regions of the genome with unusually steep allele 616 frequency clines across mean annual temperature and precipitation. 617 Third, we identified regions of the genome with recent, unusually rapid increases 618 in allele frequency across the range. Strong, recent selective sweeps will result in long 619 haplotypes associated with the selected allele
8,74. First, we phased the 544 diploid 620
individuals using SHAPEIT275
. Because we have no reference haplotype panels to test 621 the accuracy of computationally-determined haplotypes, we determined the optimal 622 method by estimating the accuracy of imputed masked loci
76. We used 10 Mb of 623
chromosome 2 (5-15Mb), using only variants with MAF>0.1 (307,123 sites). We 624 randomly masked out 5% of the center 260,000 positions for each individual (avoiding 625 the ends), treating them as missing for phasing. To determine the optimal number of 626 hidden Markov states (K) and the window size (W) used in SHAPEIT2, we phased the 627 data using combinations of parameters from K=50-600 and W=0.1-2Mb (Supplementary 628 Fig. 14), using the default Ne=15K, and run with 4 threads. The genetic position was 629 determined through linear interpolation using a genetic map derived from a P. 630 trichocarpa x P. deltoides pseudo-backcross pedigree and 3,559 Infinium SNP markers
22. 631
Genetic position and recombination rate were estimated using local linear regression with 632 the loess function in R. For comparison, we also phased the same data using the default 633 settings of BEAGLE
77. We then determined the squared correlation coefficient (R
2) 634
between the known allele dosages (0, 1, or 2) and the imputed genotypes for masked 635 positions in each individual. The average R
2 is shown in Supplementary Fig. 16, and 636
peaks at approximately K=350, W=0.1 Mb. We varied Ne from 10,000 – 20,000, and 637 found that Ne=15,000 gave the highest correlation between known and imputed allele 638 dosage for masked missing data. Using the same 10Mb region of chromosome 2, we 639 tested whether the 0.1 MAF cutoff affected accuracy, and found that with no MAF cutoff 640 accuracy was actually increased. We therefore phased all chromosomes using SHAPEIT2 641 with K=350 states, W=0.1 Mb window size, and Ne=15,000 effective population size, 642 using all non-singleton and -private doubleton sites, parallelized using 24 threads. 643 We then estimated the integrated haplotype score (iHS
8) for SNPs. Because the 644
program is computationally intensive, we thinned the dataset to SNPs separated by at 645 least 100bp and with a MAF of at least 0.05, resulting in 1,898,506 SNPs throughout the 646 genome. In calculating iHS, we used the genetic distance as described above. iHS was 647 standardized within allele frequency bins
8, and |iHS| averaged within non-overlapping 1-648
kb windows, again requiring at least 5 SNPs in a window. We took the top 1% of these 649 bins as genomic regions that have experienced an unusually rapid allele frequency change, 650 resulting in extended haplotype homozygosity, and potential targets of positive selection. 651 Finally, we used bayenv2.0
34 to identify regions of the genome with unusually 652
strong allele frequency clines along climatic gradients while controlling for background 653 neutral population structure. We performed this analysis with 13 of the populations used 654 in the FST analysis described above. We excluded the Tahoe population because it was so 655 divergent that the neutral model of bayenv2.0 had difficulty accounting for the 656 covariance in allele frequencies among populations (data not shown). We used the first 657

28
two principle components (PCs) of the climate data from source locations, averaged 658 within populations, which cumulatively explained >85% of the variance in the correlation 659 matrix. Loadings showed that the first PC was strongly related to all climateWNA 660 variables, while the second PC was more strongly related to precipitation, heat-moisture 661 indices, and frost free period metrics (Supplementary Fig. 17). To estimate the covariance 662 matrix of allele frequency among populations, we used 19,420 genome-wide SNPs that 663 were separated by at least 20Kbp and with MAF > 0.01 across the 13 populations using 664 bayenv2.0 with 100,000 steps through the chain, performed three times independently. 665 The three runs were very similar (all Mantel R > 0.985, p<0.001), and the difference in 666 covariances among runs were always less than 3% of the smallest estimated covariance, 667 indicating convergence
78. We assessed the strength of the correlation of allele frequency 668
and the climate variables, as estimated by the Bayes factor (BF) and Spearman 669 correlation, for 9,519,343 SNPS (MAF > 0.01 across the 13 populations). We tested, for 670 20,000 randomly-chosen SNPs, the effect of chain length on the Bayes factors. 671 Correlations of the individual SNPs among the different chain lengths and independent 672 runs for each chain length indicated that 10 chains of 50,000 steps were sufficient to 673 ensure repeatability and accuracy (Supplementary Fig. 18), while tractable for millions of 674 SNPs. For the final analysis of all >9.5million SNPs, we calculated the Bayes factor and 675 Spearman correlation using 50,000 steps in each of 10 independent runs. We averaged 676 the log10(BF) and the posterior Spearman correlation estimate for each SNP, normalized 677 these values within MAF bins (0.05 bin size), and averaged these within 1-kb windows 678 throughout the genome, requiring at least 5 SNPs per 1-kb window. 679
To identify regions of the genome with unusually strong allele frequency-climate 680 correlations, we selected the windows in the top 1% of Spearman climate-allele 681 frequency correlations and top 1% of Bayes Factors as those with unusually strong 682 climate related allele frequency clines. This process was done separately for the first and 683 second PCs, resulting in two separate selection scans. 684 685 Candidate Selection Regions (CSRs) and Annotation Analysis 686 The selection scans represent five different approaches to identifying unusually 687 strong patterns throughout the genome that are consistent with recent positive or 688 divergent selection. Merging nearby windows (5Kb), we found 397 regions that were in 689 the top 1% of at least two of the five scans (the candidate selection regions, or “CSRs”), 690 spanning or adjacent to 452 different genes. We identified the genes spanning or nearest 691 to the CSRs and selection outlier regions. We used Fisher Exact Tests to determine if GO, 692 PANTHER, and PFAM annotations were overrepresented in the genes associated with 693 the CSRs and outlier regions. 694 We also tested whether these genes were overrepresented among lists from known 695 gene families and pathways, and known to be responsive to drought and dormancy 696 cycling. Families of transcription factors were identified using the Plant Transcription 697 Factor Database v3.0 (http://planttfdb.cbi.pku.edu.cn/index.php?sp=Pth
79). Genes in 698
additional pathways and families are listed in Supplementary Table 11. When necessary, 699 we used the best reciprocal BLAST hit between the v1 and v3 genome assemblies to 700 locate the gene models identified by previous studies for each set of published genes. 701 702 Genome Duplication and Network Connectedness 703
29
First, we examined the genes spanning or nearest to the CSRs and the windows of 704 the top 1% of each selection scan in the context of the Salicoid whole-genome 705 duplication using the 7,936 duplicate pairs identified by Rodgers-Melnick et al.
31. We 706
used Fisher Exact Tests (FET) to test whether these selection scan lists were under- or 707 over-represented among the duplicate pairs. To determine if there were more duplicate 708 pairs in which both genes of the pair were associated with the selection outliers than 709 expected by chance, we used a random resampling procedure. For each selection scan, we 710 resampled without replacement the same number of genes observed in that scan that were 711 also retained duplicates from the total number of retained duplicates (15,812) 10,000 712 times and recoded how many complete pairs were resampled each time, meaning how 713 many times both genes of a pair were randomly sampled. We tested whether genes 714 associated with selection outliers had more protein-protein interactions (PPI) than 715 expected. We used the number of connections in protein-protein interaction networks 716 with 65 % confidence determined by the ENTS random forest prediction program
30. We 717
tested whether PPIs of the genes in each scan were different from the genome-wide 718 average using Wilcoxon two-sample tests. These analyses examined patterns of genes 719 associated with the CSRs and the selection outlier regions. 720
We also examined patterns at the whole-gene level, by calculating S, T, and the 721 ratio of nonsynonymous/synonymous polymorphism (Nonsynonymous/Synonymous) for 39,514 722 genes on the 19 chromosomes using the same methods described above. We then 723 calculated the correlation of each statistic between the 7,936 Salicoid duplicate pairs of 724 genes. To determine if the observed correlation was greater than expected by chance, we 725 randomly chose 7,936 pairs of genes from all genes 10,000 times, as a null distribution of 726 correlation between pairs of randomly chosen genes. 727 We also tested whether the mean observed selection statistic differed between 728 Salicoid duplicates and non-duplicate gene using Wilcoxon two sample tests. To test 729 whether the connectedness of genes may influence patterns of selection, we examined 730 correlations between PPI and the observed statistics. We assessed significance using 731 10,000 permutations of connectedness across the test statistic as above. We log10-732 transformed the data as necessary. 733 734 Signal of Association Throughout the Entire Genome and Within the CSRs 735 To determine if loci within the identified regions may have functional 736 significance, we tested for statistical associations with second-year height and fall and 737 spring bud phenology using data collected from three replicated plantations. We 738 estimated genotypic best linear unbiased predictors using mixed-model regression (lmer 739 function of the lme4 R package, see Phenotypic Selection section above) as the 740 phenotypes for GWAS. We used the same set of resequenced, unrelated individuals used 741 described above, excluding the highly differentiated Tahoe, Willamette Valley, and far 742 northern British Columbia samples because strong stratification can lead to spurious 743 associations
80, leaving 498 individuals. We only tested phenotypic association with SNPs 744
having a MAF≥0.05, leaving 5,939,334 SNPs. The analysis was performed for single 745 traits in each plantation using emmax
36, using the IBS kinship matrix to account for 746
background genetic effects. To account for population structure, for each trait we 747 included as covariates the principal components axes that were significant predictors of 748 the trait, chosen using stepwise regression (step function in the R package). We used the 749
30
gemma multi-trait association model37
to test for SNP association with each trait across 750 all three plantations simultaneously, and in a 9-trait model as well (3 traits x 3 751 plantations). We used the mixed-model framework incorporating kinship and principal 752 component axes that were significant (nominal alpha=0.05) in a multivariate multiple 753 linear regression. 754
We estimated alpha values for association p-values by permutation81
. We 755 permuted individual alleles among individuals, randomly generating genotypes while 756 mirroring exactly the true MAF distribution. We then tested for association of these 757 random genotypes with the observed phenotype data using the actual kinship matrix and 758 principal components as above, thereby testing only the effect of randomly assigned 759 genotypes while the structure of population stratification, relatedness, and the phenotypes 760 was held constant. For univariate analyses performed in emmax we performed 10
8 761
permutations. For gemma multi-trait analyses, we used >108 permutations for bud set and 762
height and 8-33x106 permutations for bud flush and the 9-trait model, which were 763
computationally more intensive. For each trait, we then estimated the cutoffs at various 764 alpha levels (Supplementary Table 15). 765 To determine if the observed associations within the selection outliers was greater 766 than expected by chance, we used the –log10(p-value) as the association signal within 767 each selection outlier, and used the average of these values for each trait. We then 768 randomly sampled the same number of 1-kb bins from throughout the genome 20,000 769 times. The number of random samples with a mean equal to or greater than the observed 770 for each trait represents the probability of finding a median association signal in the 771 selection outliers by chance alone. We also calculated the empirical p-value for each CSR 772 using the distribution of average association p-values within 1-kb windows throughout 773 the genome. This was done while controlling for the distribution of gene density within 774 the surrounding 100 kb of the selection scans (Supplementary Figure 11g). We also 775 repeated this with a 50-kb window and without controlling for gene density, and found 776 the same patterns (data not shown). 777 778
References 779
1. Abecasis, G. R. et al. An integrated map of genetic variation from 1,092 human 780 genomes. Nature 491, 56–65 (2012). 781
2. Cao, J. et al. Whole-genome sequencing of multiple Arabidopsis thaliana 782 populations. Nat. Genet. 43, 956–963 (2011). 783
3. Axelsson, E. et al. The genomic signature of dog domestication reveals 784 adaptation to a starch-rich diet. Nature 495, 360–364 (2013). 785
4. Hufford, M. B. et al. Comparative population genomics of maize domestication 786 and improvement. Nat. Genet. 44, 808–811 (2012). 787

31
5. Huang, X. et al. Genome-wide association study of flowering time and grain 788 yield traits in a worldwide collection of rice germplasm. Nat. Genet. 44, 32–39 789 (2012). 790
6. Zhao, S. et al. Whole-genome sequencing of giant pandas provides insights 791 into demographic history and local adaptation. Nat. Genet. 45, 67–71 (2013). 792
7. Miller, W. et al. Polar and brown bear genomes reveal ancient admixture and 793 demographic footprints of past climate change. Proc. Natl. Acad. Sci. U. S. A. 794 109, E2382–2390 (2012). 795
8. Voight, B. F., Kudaravalli, S., Wen, X. & Pritchard, J. K. A map of recent positive 796 selection in the human genome. PLoS Biol. 4, e72 (2006). 797
9. Fournier-Level, a et al. A map of local adaptation in Arabidopsis thaliana. 798 Science 334, 86–89 (2011). 799
10. Tishkoff, S. a et al. Convergent adaptation of human lactase persistence in 800 Africa and Europe. Nat. Genet. 39, 31–40 (2007). 801
11. Jia, G. et al. A haplotype map of genomic variations and genome-wide 802 association studies of agronomic traits in foxtail millet (Setaria italica). Nat. 803 Genet. 45, 957–961 (2013). 804
12. Hancock, A. M. et al. Adaptation to climate across the Arabidopsis thaliana 805 genome. Science 334, 83–86 (2011). 806
13. Grossman, S. R. et al. Identifying recent adaptations in large-scale genomic 807 data. Cell 152, 703–713 (2013). 808
14. Savolainen, O., Pyhäjärvi, T. & Knürr, T. Gene Flow and Local Adaptation in 809 Trees. Annu. Rev. Ecol. Evol. Syst. 38, 595–619 (2007). 810
15. Bonan, G. B. Forests and climate change: forcings, feedbacks, and the climate 811 benefits of forests. Science 320, 1444–1449 (2008). 812
16. Ellison, A. M. et al. Loss of foundation species : consequences for the structure 813 and dynamics of forested ecosystems. Front. Ecol. Environ. 3, 479–486 (2005). 814
17. Whitham, T. G. et al. Extending genomics to natural communities and 815 ecosystems. Science 320, 492–495 (2008). 816
18. Parmesan, C. Ecological and Evolutionary Responses to Recent Climate 817 Change. Annu. Rev. Ecol. Evol. Syst. 37, 637–669 (2006). 818
32
19. Ingvarsson, P. K., García, M. V., Hall, D., Luquez, V. & Jansson, S. Clinal variation 819 in phyB2, a candidate gene for day-length-induced growth cessation and bud 820 set, across a latitudinal gradient in European aspen (Populus tremula). 821 Genetics 172, 1845–1853 (2006). 822
20. Neale, D. B. & Kremer, A. Forest tree genomics: growing resources and 823 applications. Nat. Rev. Genet. 12, 111–122 (2011). 824
21. Jansson, S. & Douglas, C. J. Populus: a model system for plant biology. Annu. 825 Rev. Plant Biol. 58, 435–458 (2007). 826
22. Slavov, G. T. et al. Genome resequencing reveals multiscale geographic 827 structure and extensive linkage disequilibrium in the forest tree Populus 828 trichocarpa. New Phytol. 196, 713–725 (2012). 829
23. Pauley, S. S. & Perry, T. O. Ecotypic variation in the photoperiodic response in 830 Populus. J. Arnold Arbor. 35, 167–188 (1954). 831
24. Howe, G. T. et al. From genotype to phenotype : unraveling the complexities of 832 cold adaptation in forest trees 1. Can. J. Bot. 1266, 1247–1266 (2003). 833
25. McKown, A. D. et al. Geographical and environmental gradients shape 834 phenotypic trait variation and genetic structure in Populus trichocarpa. New 835 Phytol. 201, 1263–1276 (2014). 836
26. Wegrzyn, J. L. et al. Association genetics of traits controlling lignin and 837 cellulose biosynthesis in black cottonwood (Populus trichocarpa, Salicaceae) 838 secondary xylem. New Phytol. 188, 515–532 (2010). 839
27. Porth, I. et al. Genome-wide association mapping for wood characteristics in 840 Populus identifies an array of candidate single nucleotide polymorphisms. 841 New Phytol. 200, 710–726 (2013). 842
28. Tang, H. et al. Unraveling ancient hexaploidy through multiply-aligned 843 angiosperm gene maps. Genome Res. 18, 1944–1954 (2008). 844
29. Tuskan, G. A. et al. The genome of black cottonwood, Populus trichocarpa 845 (Torr. & Gray). Science 313, 1596–1604 (2006). 846
30. Rodgers-Melnick, E., Culp, M. & DiFazio, S. P. Predicting whole genome protein 847 interaction networks from primary sequence data in model and non-model 848 organisms using ENTS. BMC Genomics 14, 608 (2013). 849
31. Rodgers-Melnick, E. et al. Contrasting patterns of evolution following whole 850 genome versus tandem duplication events in Populus. Genome Res. 22, 95–851 105 (2012). 852
33
32. Spitze, K. Population structure in Daphnia obtusa: quantitative genetic and 853 allozymic variation. Genetics 135, 367–374 (1993). 854
33. Yang, W.-Y., Novembre, J., Eskin, E. & Halperin, E. A model-based approach for 855 analysis of spatial structure in genetic data. Nat. Genet. 44, 725–731 (2012). 856
34. Günther, T. & Coop, G. Robust identification of local adaptation from allele 857 frequencies. Genetics 195, 205–220 (2013). 858
35. Sun, J., Xie, D., Zhao, H. & Zou, D. Genome-wide identification of the class III 859 aminotransferase gene family in rice and expression analysis under abiotic 860 stress. Genes Genomics 35, 597–608 (2013). 861
36. Kang, H. M. et al. Variance component model to account for sample structure 862 in genome-wide association studies. Nat. Genet. 42, 348–354 (2010). 863
37. Zhou, X. & Stephens, M. Efficient multivariate linear mixed model algorithms 864 for genome-wide association studies. Nat. Methods 11, 407–409 (2014). 865
38. Ruttink, T. et al. A molecular timetable for apical bud formation and dormancy 866 induction in poplar. Plant Cell 19, 2370–2390 (2007). 867
39. Werner, A. K. et al. The ureide-degrading reactions of purine ring catabolism 868 employ three amidohydrolases and one aminohydrolase in Arabidopsis, 869 soybean, and rice. Plant Physiol 163, 672–681 (2013). 870
40. Hsu, C.-Y. et al. FLOWERING LOCUS T duplication coordinates reproductive 871 and vegetative growth in perennial poplar. Proc. Natl. Acad. Sci. U. S. A. 108, 872 10756–10761 (2011). 873
41. Iñigo, S., Alvarez, M. J., Strasser, B., Califano, A. & Cerdán, P. D. PFT1, the 874 MED25 subunit of the plant Mediator complex, promotes flowering through 875 CONSTANS dependent and independent mechanisms in Arabidopsis. Plant J. 876 69, 601–612 (2012). 877
42. Rinne, P. L. H. et al. Chilling of dormant buds hyperinduces FLOWERING 878 LOCUS T and recruits GA-inducible 1,3-beta-glucanases to reopen signal 879 conduits and release dormancy in Populus. Plant Cell 23, 130–146 (2011). 880
43. Hall, D. et al. Adaptive population differentiation in phenology across a 881 latitudinal gradient in European aspen (Populus tremula, L.): a comparison of 882 neutral markers, candidate genes and phenotypic traits. Evolution 61, 2849–883 2860 (2007). 884
44. Pritchard, J. K. & Di Rienzo, A. Adaptation - not by sweeps alone. Nat. Rev. 885 Genet. 11, 665–667 (2010). 886
34
45. Platt, A., Vilhjálmsson, B. J. & Nordborg, M. Conditions under which genome-887 wide association studies will be positively misleading. Genetics 186, 1045–888 1052 (2010). 889
46. Atwell, S. et al. Genome-wide association study of 107 phenotypes in 890 Arabidopsis thaliana inbred lines. Nature 465, 627–631 (2010). 891
47. Bohlenius, H. et al. CO/FT regulatory module controls timing of flowering and 892 seasonal growth cessation in trees. Science 312, 1040–1043 (2006). 893
48. Mohamed, R. et al. Populus CEN/TFL1 regulates first onset of flowering, 894 axillary meristem identity and dormancy release in Populus. Plant J. 62, 674–895 688 (2010). 896
49. Jaeger, K. E., Pullen, N., Lamzin, S., Morris, R. J. & Wigge, P. A. Interlocking 897 feedback loops govern the dynamic behavior of the floral transition in 898 Arabidopsis. Plant Cell 25, 820–833 (2013). 899
50. Freeling, M. Bias in plant gene content following different sorts of duplication: 900 tandem, whole-genome, segmental, or by transposition. Annu. Rev. Plant Biol. 901 60, 433–53 (2009). 902
51. Birchler, J. A. & Veitia, R. A. The gene balance hypothesis: implications for gene 903 regulation, quantitative traits and evolution. New Phytol. 186, 54–62 (2010). 904
52. Lynch, M. & Force, A. The probability of duplicate gene preservation by 905 subfunctionalization. Genetics 154, 459–473 (2000). 906
53. Taylor, J. S. & Raes, J. Duplication and divergence: the evolution of new genes 907 and old ideas. Annu. Rev. Genet. 38, 615–643 (2004). 908
54. Vatén, A. et al. Callose biosynthesis regulates symplastic trafficking during 909 root development. Dev. Cell 21, 1144–1155 (2011). 910
55. Xie, B., Wang, X., Zhu, M., Zhang, Z. & Hong, Z. CalS7 encodes a callose synthase 911 responsible for callose deposition in the phloem. Plant J. 65, 1–14 (2011). 912
56. Langlet, O. Two hundred years of genecology. Taxon 20, 653–722 (1971). 913
57. Wang, T., O’Neill, G. a & Aitken, S. N. Integrating environmental and genetic 914 effects to predict responses of tree populations to climate. Ecol. Appl. 20, 153–915 163 (2010). 916
58. Grattapaglia, D. & Resende, M. D. V. Genomic selection in forest tree breeding. 917 Tree Genet. Genomes 7, 241–255 (2010). 918
35
59. Vanholme, B. et al. Breeding with rare defective alleles (BRDA): a natural 919 Populus nigra HCT mutant with modified lignin as a case study. New Phytol. 920 198, 765–776 (2013). 921
60. Cingolani, P. et al. A program for annotating and predicting the effects of 922 single nucleotide polymorphisms, SnpEff: SNPs in the genome of Drosophila 923 melanogaster strain w1118; iso-2; iso-3. Fly (Austin). 6, 80–92 (2012). 924
61. Li, H. & Durbin, R. Fast and accurate short read alignment with Burrows-925 Wheeler transform. Bioinformatics 25, 1754–1760 (2009). 926
62. Li, H. A statistical framework for SNP calling, mutation discovery, association 927 mapping and population genetical parameter estimation from sequencing 928 data. Bioinformatics 27, 2987–2993 (2011). 929
63. Geraldes, A. et al. A 34K SNP genotyping array for Populus trichocarpa: design, 930 application to the study of natural populations and transferability to other 931 Populus species. Mol. Ecol. Resour. 13, 306–323 (2013). 932
64. Huang, X. et al. Genome-wide association studies of 14 agronomic traits in rice 933 landraces. Nat. Genet. 42, 961–7 (2010). 934
65. Jiao, Y. et al. Genome-wide genetic changes during modern breeding of maize. 935 Nat. Genet. 44, 812–815 (2012). 936
66. Eckenwalder, J. E. in Biol. Popul. Its Implic. Manag. Conserv. (Stettler, R. F., 937 Bradshaw, H. D. J., Heilman, P. E. & Hinckley, T. M.) 7–32 (NRC Research Press, 938 1996). 939
67. Langmead, B. & Salzberg, S. L. Fast gapped-read alignment with Bowtie 2. Nat. 940 Methods 9, 357–360 (2012). 941
68. Patterson, N., Price, A. L. & Reich, D. Population structure and eigenanalysis. 942 PLoS Genet. 2, e190 (2006). 943
69. Yang, J., Lee, S. H., Goddard, M. E. & Visscher, P. M. GCTA: a tool for genome-944 wide complex trait analysis. Am. J. Hum. Genet. 88, 76–82 (2011). 945
70. Goudet, J. & Büchi, L. The effects of dominance, regular inbreeding and 946 sampling design on Q(ST), an estimator of population differentiation for 947 quantitative traits. Genetics 172, 1337–1347 (2006). 948
71. Wang, T., Hamann, A., Spittlehouse, D. L. & Murdock, T. Q. ClimateWNA—High-949 Resolution Spatial Climate Data for Western North America. J. Appl. Meteorol. 950 Climatol. 51, 16–29 (2012). 951
36
72. Charlesworth, B. Measures of divergence between populations and the effect 952 of forces that reduce variability. Mol. Biol. Evol. 15, 538–543 (1998). 953
73. Johnson, P. L. F. & Slatkin, M. Accounting for bias from sequencing error in 954 population genetic estimates. Mol. Biol. Evol. 25, 199–206 (2008). 955
74. Sabeti, P., Reich, D. & Higgins, J. Detecting recent positive selection in the 956 human genome from haplotype structure. Nature 419, 832–837 (2002). 957
75. Delaneau, O., Zagury, J.-F. & Marchini, J. Improved whole-chromosome 958 phasing for disease and population genetic studies. Nat. Methods 10, 5–6 959 (2013). 960
76. Browning, S. R. & Browning, B. L. Haplotype phasing: existing methods and 961 new developments. Nat. Rev. Genet. 12, 703–14 (2011). 962
77. Browning, B. & Browning, S. A Unified Approach to Genotype Imputation and 963 Haplotype-Phase Inference for Large Data Sets of Trios and Unrelated 964 Individuals. Am. J. Hum. Genet. 210–223 (2009). 965
78. Pyhäjärvi, T., Hufford, M. B., Mezmouk, S. & Ross-Ibarra, J. Complex patterns of 966 local adaptation in teosinte. Genome Biol. Evol. 5, 1594–609 (2013). 967
79. Zhang, H. et al. PlantTFDB 2.0: update and improvement of the comprehensive 968 plant transcription factor database. Nucleic Acids Res. 39, D1114–1117 969 (2011). 970
80. Price, A. L., Zaitlen, N. A., Reich, D. & Patterson, N. New approaches to 971 population stratification in genome-wide association studies. Nat. Rev. Genet. 972 11, 459–463 (2010). 973
81. Dudbridge, F. & Gusnanto, A. Estimation of significance thresholds for 974 genomewide association scans. Genet. Epidemiol. 32, 227–234 (2008). 975
976
977
978
979

Figure 1.
a)
b)
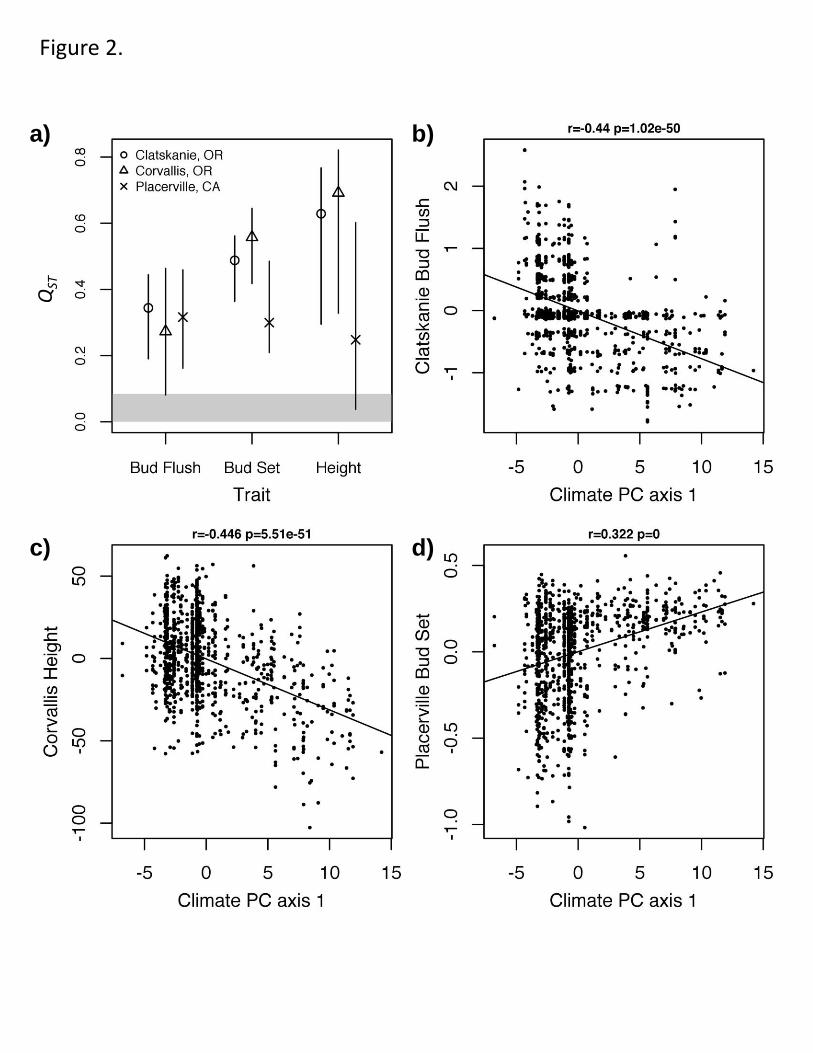
Figure 2. Q
ST
a)
c) d)
b)

Unique and overlapping regions in each selection scan
Figure 3.
b)
FST
SPA
Bayenv PC1
Bayenv PC2
iHS
p-value
FS
T
SP
A
iHS
P
C2
C
SR
P
C1
a)
b)
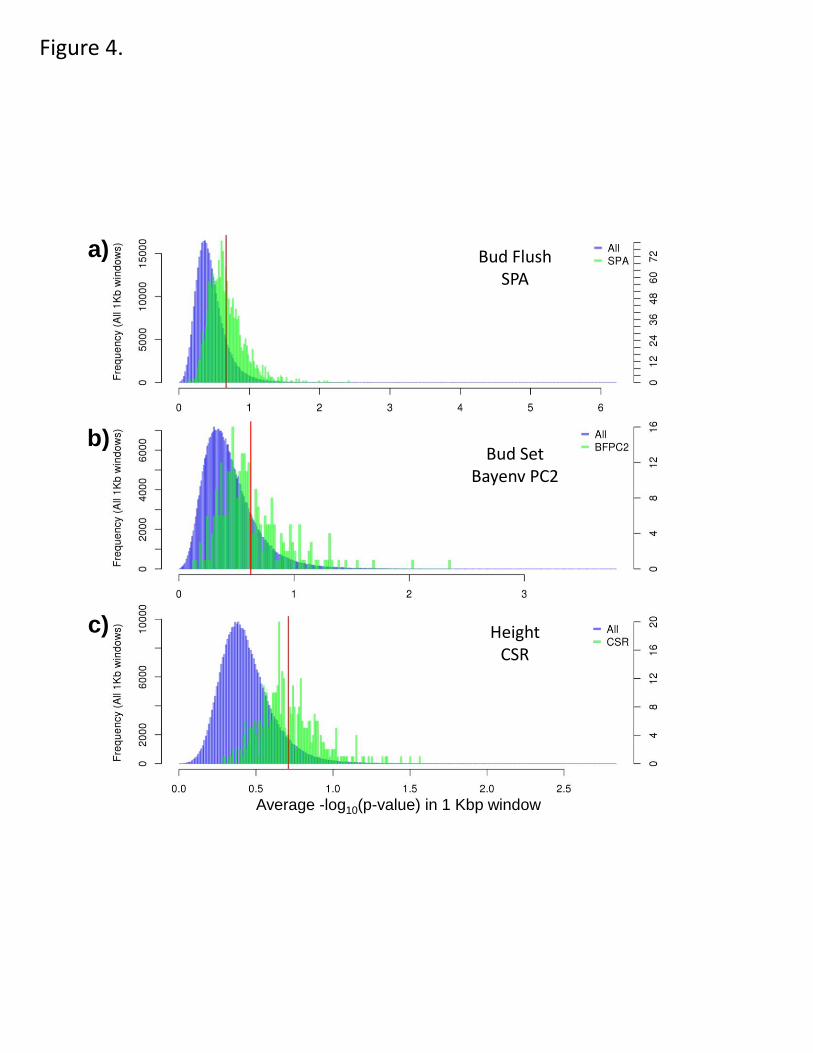
a)
b)
Average -log10(p-value) in 1 Kbp window
Height CSR
Bud Set Bayenv PC2
Bud Flush SPA
c)
Figure 4.

Figure 5.
-lo
g10(p
-va
lue
) F
ST
No
rma
lize
d P
C1
Ba
ye
s F
acto
r
Chromosome position (bp)
No
rma
lize
d P
C2
Ba
ye
s F
acto
r
SP
A
DNA-damage repair DRT111
NADH dehydrogenase
transferases

Figure 6. -lo
g10(p
-va
lue
) F
ST
Chromosome position (bp)
FT1
4-nitrophenylphosphatase UDP-galactose
transporter
FAR1
No
rma
lize
d P
C1
Bayes F
acto
r