
A Near Real-Time GT-POWER Engine Model in Dyno … · · 2016-12-06Harley-Davidson Motor Company...
15
A Near Real-Time GT-POWER Engine Model in Dyno Testing for Residual Gas and Dilution Tolerance Response Modeling Harley-Davidson Motor Company Nathan Haugle, Advanced Combustion, Simulation, and Fuel Preparation GT-USERS CONFERENCE , 14 th November 2016
Transcript of A Near Real-Time GT-POWER Engine Model in Dyno … · · 2016-12-06Harley-Davidson Motor Company...

A Near Real-Time GT-POWER Engine Model in Dyno Testing for Residual Gas and Dilution Tolerance Response Modeling
Harley-Davidson Motor CompanyNathan Haugle, Advanced Combustion, Simulation, and Fuel Preparation
GT-USERS CONFERENCE , 14th
November 2016

Contents• Introduction
– Using a Near Real-Time GT-POWER Model to Supplement Test Cell Measurement for Residual and Dilution Tolerance
• Motivation
– Combustion system development
– Calibration process
– Advanced models and simulation
• Process
– Test engine measurement
– Model preparation
– Implementation
• Results
– Engine load sweeps
– Residual mapping
• Conclusions

Motivation Combustion Performance
– High specific output balanced with good light load run quality
– Strong inner-cycle tuning dynamics
– Residual concentration measurement
In Cylinder Sampling Valve
used in Skip-Fire Residual
Measurements
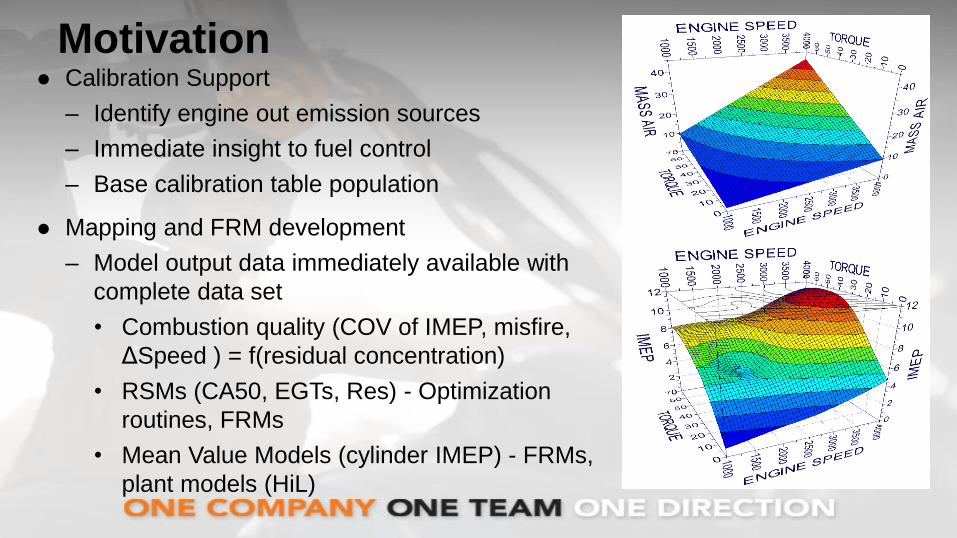
Motivation Calibration Support
– Identify engine out emission sources
– Immediate insight to fuel control
– Base calibration table population
Mapping and FRM development
– Model output data immediately available with
complete data set
• Combustion quality (COV of IMEP, misfire,
ΔSpeed ) = f(residual concentration)
• RSMs (CA50, EGTs, Res) - Optimization
routines, FRMs
• Mean Value Models (cylinder IMEP) - FRMs,
plant models (HiL)

Process Overview Engine Test
– Crank Angle resolved intake, exhaust, and cylinder
pressure
– System temperatures and pressure
1-D gas dynamic model
– Detailed gas dynamics
– Apparent combustion calculation
– Correlate to previously measured data
– Prepare “Three Pressure Analysis” – TPA model
Data management
– Share test cell data to model
– Execute model
– Retrieve data
– Push test cell and model data to database

Process Detail Engine Test
– High speed pressure measurement
• Manifold pressure measured downstream of throttle
• Cylinder pressure measured with best practices
• Exhaust pressure measured downstream of port
– Low speed test condition measurement
• Engine speed, load, head temperatures, EGTs, spark timing, lambda, etc.
• Single values for model inputs
Manifold
Pressure
Exhaust Pressure 2 Exhaust Pressure 1

Process Detail Test Data Handling, Availability, and Real-Time
– Cycle count from few to many
– Buffer fills then creates statistical data and file
– Model execution immediately after – near real-time
– Sampling to running file while executing – real-time (N-1?)
– Without combustion, real-time is easily achieved

Process Detail 1-D Model Preparation
– Detailed / correlated or best practices base model

Process Detail 1-D Model Preparation
– Strip the model beyond the intake
and exhaust pressure measurement
location
– Add TPA end environments - iFiles
and boundary conditions
– Ensure robust burn rate calculations
through correlated thermal
boundaries and heat transfer
coefficients
– Balance gas dynamic detail with
execution speed

Process Detail 1-D Model Preparation
– Prepare Model Input
• External file corresponding to input
parameters
• External file points to iFile name and
location
• Cell to model data manipulation for
units and corrections
– Prepare model output
• Complete model output is available
but time consuming
• Prepare export template with output
of interest
Input File Example
Model Data Accessed from Database

Process Detail Data Handling – Script and Upload
– Creates statistical calculation from low
speed data
– Link statistical calculation of low speed data
to iFile
– Starts GT from a command line passing
model, parameter file, statistical calculation
of low speed data, and path to iFile
– Starts GT export from a command line
passing parameter file, and output file
– Append GT data to test data file
– Upload to database
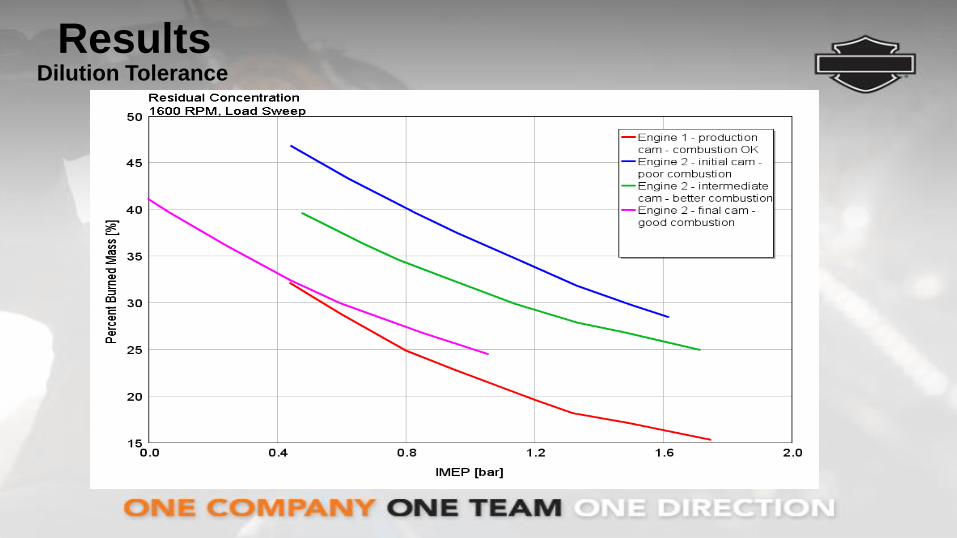
ResultsDilution Tolerance
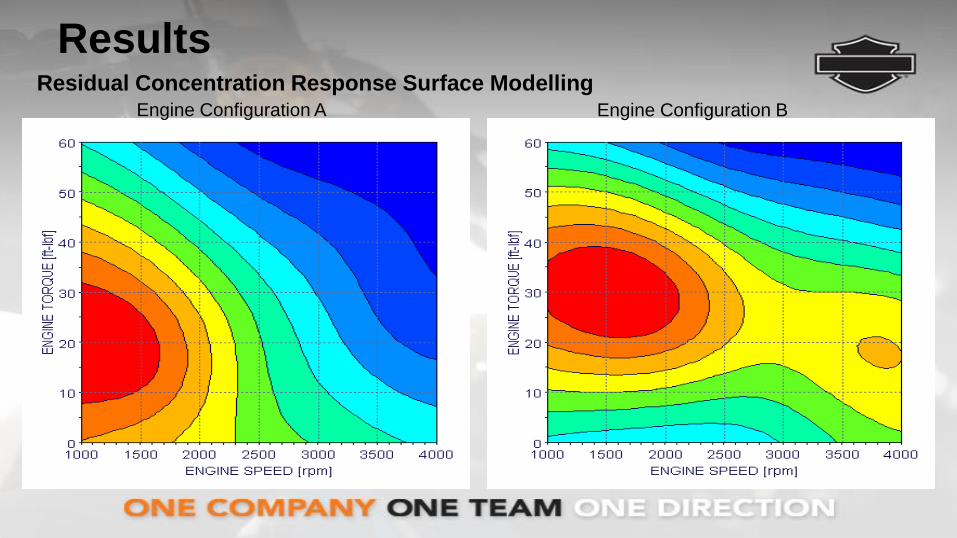
ResultsResidual Concentration Response Surface Modelling
Engine Configuration A Engine Configuration B

Conclusions• A process for quick and robust evaluation, optimization, and calibration
of a performance combustion system was developed
• Fast running GT-POWER model was prepared for and run in the test cell with each test
• The test conditions, along with steady-state results and crank angle resolved system pressures, are passed directly to the model
• A script within the test cell handles the data transfer, model execution, and completes data upload to a database
• Otherwise difficult to measure date is available at the test cell per run and at the engineers desk for correlation development, optimization and engine calibration

Discussion and Questions
Thank You!