
A Methodological Approach - Settore...
21
Reliability Process Management A Methodological Approach Torino March 13, 2011 rpm Reliability Process Management
Transcript of A Methodological Approach - Settore...

Reliability Process Management
A Methodological Approach
Torino March 13, 2011
rpmReliability Process Management

ITI Business Overview
Europe
Tokyo, Japan
Osaka, Japan
Cambridge UK
(Milford, OH)
Cincinnati HQ
Shanghai, China
Beijing, China
Product Data InteroperabilityNew Product Development
Focus on Concept Development to achieve Breakthrough Improvements in
Time To Market, Cost, Reliability & Quality
Torino, Italy
Paris, France
Italia
Munich, Germany

Major Clients

Reliability Process Management
Reliability Process Management (RPM) is a structured reliability approach which
encompasses all the key activities needed, from concept development through
production, to deliver high value & successful products to customers
RPM allows to manage reliability in all life cycle phases, with a systemic approach
and throughout the Extended Enterprise
CUSTOMER PERCEIVED VALUE
SERVICE PERFORMANCE
COST OF OWNERSHIP
PRODUCT PERFORMANCE
INTANGIBLE DRIVERS
RELIABILITY
Reliability is a major driver of Customer Perceived Value

Significantly improve Reliability during Development– Improvement of the starting reliability level of the first available representative
Products
Assure Reliability Growth and Technical Risk Mitigation during all development Phases
by proper management and tracking of proactive and virtual activities before prototype
builds
Achieve the expected reliability levels at Start Of Production
(SOP)– Achieve the reliability targets on production Products
Useful Life & Infant Mortality
– Obtain a significant reduction in warranty cost for the first 24 months of product
life and the overall “customer complaints”
RPM Overall Objectives

Successful RPM Applications
1. Automobiles (Vehicles & Major Subsystems)
2. Diesel Marine Engines (Commercial & Leisure)
3. Diesel Industrial Engines (Gen Sets, Stationary Applications, Industrial
Vehicles)
4. Trucks (Vehicles, Diesel Truck Engines, Major Subsystems, Articulated
Haulers)
5. Agricultural Equipment (Tractors, Combines, Harvesters, Hay Tools,
Planters, Accessory Equipment, etc.)
6. Construction Equipment (Loader Backhoes, Wheel Loaders, Skid Steers,
Crawlers, Drills, Excavators, Components, etc.)
7. Mining Equipment (Trucks and Drills)
8. Locomotives (Vehicle & Major Subsystems)
9. Fork Trucks (Electric, Internal Combustion Engines)
10. Injection Molding Machines
11. High Speed Laser Printers

CCM LWB CVT Without Proactive Credits With Proactive Credits
Total New Content 32.5 18.7
Phase 1 Unique New Content 27.4 14.2
Phase 2 Unique New Content 3.2 3.1
Phase 3 Unique New Content 1.9 1.4
NEW CONTENT SUMMARY
Target = 11.9
NC = 12.1Failures= 25Final MTBF = 543
NC = 15.4Failures= 30Final MTBF = 466
NC = 19.2Failures= 35Final MTBF = 403
NC = 21.3Failures= 38Final MTBF = 377
Target = 11.9
10
12
14
16
18
20
22
10/11/2004 12/28/2004 3/15/2005 6/1/2005 8/17/2005 11/3/2005 1/19/2006
Date
Ne
w C
on
ten
t
New ContentSummary
Starting New Content : 21.3
Target New Content : 11.9
Planned New Content : 20.1
Current New Content : 19.7
Target = 11.9
NC = 12.1Failures= 25Final MTBF = 543
NC = 15.4Failures= 30Final MTBF = 466
NC = 19.2Failures= 35Final MTBF = 403
NC = 21.3Failures= 38Final MTBF = 377
Target = 11.9
10
12
14
16
18
20
22
10/11/2004 12/28/2004 3/15/2005 6/1/2005 8/17/2005 11/3/2005 1/19/2006
Date
Ne
w C
on
ten
t
New ContentSummary
Starting New Content : 21.3
Target New Content : 11.9
Planned New Content : 20.1
Current New Content : 19.7
New ContentSummary
Starting New Content : 21.3
Target New Content : 11.9
Planned New Content : 20.1
Current New Content : 19.7
Target = 11.9
NC = 12.1Failures= 25Final MTBF = 543
NC = 15.4Failures= 30Final MTBF = 466
NC = 19.2Failures= 35Final MTBF = 403
NC = 21.3Failures= 38Final MTBF = 377
Target = 11.9
10
12
14
16
18
20
22
10/11/2004 12/28/2004 3/15/2005 6/1/2005 8/17/2005 11/3/2005 1/19/2006
Date
Ne
w C
on
ten
t
New ContentSummary
Starting New Content : 21.3
Target New Content : 11.9
Planned New Content : 20.1
Current New Content : 19.7
Target = 11.9
NC = 12.1Failures= 25Final MTBF = 543
NC = 15.4Failures= 30Final MTBF = 466
NC = 19.2Failures= 35Final MTBF = 403
NC = 21.3Failures= 38Final MTBF = 377
Target = 11.9
10
12
14
16
18
20
22
10/11/2004 12/28/2004 3/15/2005 6/1/2005 8/17/2005 11/3/2005 1/19/2006
Date
Ne
w C
on
ten
t
New ContentSummary
Starting New Content : 21.3
Target New Content : 11.9
Planned New Content : 20.1
Current New Content : 19.7
New ContentSummary
Starting New Content : 21.3
Target New Content : 11.9
Planned New Content : 20.1
Current New Content : 19.7
RPM Processes, Methods & Tools
RPM Processes are customized for clients
at different maturity levels
Specific Tools are implemented and made
available for different maturity levels
ITI has deployed a Reliability Process
Maturity Model - RPMM which allows to
properly assess current Client capabilities
and define a specific improvement plan
Set
Reliability
Growth
Target
Analyze
Product New
Content
Analyze
Warranty
Data
Develop &
Evaluate
Alternative
RG Plans
Select &
Optimize
Recommended
RG Plan
Approve RG
Plan
Execute RG
Test
Program
Track and
Manage RG
Status vs,
Plan
Adjust RG
Plan as
required
Production
Launch
Planning
Proactive RG Testing
Plan
Detailed RG
Activities
Reliability
Capability
Analysis
RPMM Level 1
RPMM Level 4-5
SE/ALDTM
Basic Tools
Highly Advanced Tools
A
B
C
D
E
F
G
H
I
J
K
L
M
N
O
RELIABILITY GROWTH CHART
Sample Reliability Growth Results - Automobile Phase 2
Target = 0.3107Final Target = 0.3107
0.1000
1.0000
10.0000
100 1000 10000 100000
Total Test Hours
Fa
ilure
s p
er 1
00
Ho
urs
Plan
Actual
RPMMReliability Process Maturity Model
Set LC Growth
Targets
Analyze
Product New
Content
Develop &
Evaluate
Alternative
LCG Plans
Select & Optimize
Recommended RG
Plan
Execute LCG
Test Program
Track and
Manage LCG
Status vs. Plan
Adjust LCG
Plan as required
Infant Mortality
LCG
Dynamically
Plan Detailed
LCG Activities
Execute
Proactive
Activities
Track &
Manage
Proactive Effort
Plan Detailed
Proactive
Activities
Adjust LCG
Plan as required
Final
Evaluation of
Proactive Effort
Analyze
Warranty Data
Capability
Analysis
Carry-Over
Failure Mode
Analysis
Develop Life Cycle Model
Initial Proactive
Activities
LC Tracking
Problem
Solving
LC Measuring
Conduct ROI of LCG Plans
Requirements
Analysis
Perceived
Quality
Analysis
Customer
Usage Profiling
Reliability Target Achieving
Reliability Planning
PlanningPre-Planning
Proactive Tracking
LCG Testing
LC Monitoring

• ITI has deployed a Reliability Process Maturity Model which allows to properly
assess current state capabilities of the client and assist in the definition of a
specific improvement plan
– Each level represents a breakthrough in the effectiveness of the reliability process and the results
achieved
• The higher the RPMM level achieved:
– The lower the product development cost and time to market.
– The more upfront reliability planning and activities are realized
– The fewer prototypes are necessary to achieve reliability targets
– The more accurate the Reliability Predictions
Reliability Process Maturity Model
Simulation Driven
ConventionalRG
1
ManagedRG
2 3
LCRM (1)
4
Ad Hoc
0 6
Mature RPM
5
1: LCRM=Life Cycle Reliability Management
RPMMReliability Process Maturity Model
InitialRPM
Client’s Corporate Objective
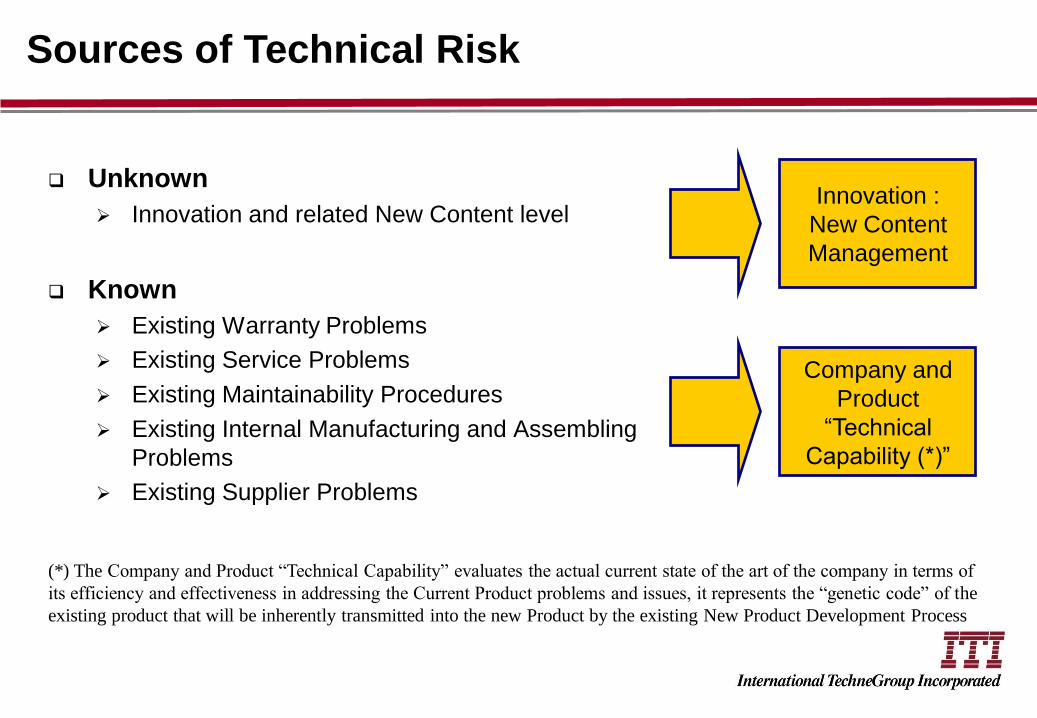
Sources of Technical Risk
Unknown
Innovation and related New Content level
Known
Existing Warranty Problems
Existing Service Problems
Existing Maintainability Procedures
Existing Internal Manufacturing and Assembling
Problems
Existing Supplier Problems
Innovation :
New Content
Management
Company and
Product
“Technical
Capability (*)”
(*) The Company and Product “Technical Capability” evaluates the actual current state of the art of the company in terms of
its efficiency and effectiveness in addressing the Current Product problems and issues, it represents the “genetic code” of the
existing product that will be inherently transmitted into the new Product by the existing New Product Development Process

Sources of Technical Risk for New Product
Elements
Specification
Function
Performance
System (Peripheral Parts)
Structure
Shape
Circuit
Software
Parts
Material
Processing
Assembly
Facility
Environment
Temperature
Humidity
Vibration
Power Source
Noise
Electric Wave
Light
Sound
Water
Aggressive Atmosfera
Changes (from the current design) to any of the following items
will cause an increase in the technical risk

Proactive Reliability: from Failure Elimination to
Failure Avoidance
Technical
Capability
Corrective
Actions
Failure
Elimination
New Content
(1)
Proactive
Activities
(2)
Failure
Avoidance
(1) The New Content parameter is evaluated as the change of the system to the
reference product weighted by the importance to the Warranty Failure rate
(2) Proactive Activities: measurable actions which improve the intrinsic reliability of
the product design before physical representative units are built

Overall Process for Reliability Process
Maturity Level 4-5
Reliability Target Achieving
Reliability Planning PlanningPre-Planning
Proactive Tracking
LCG Testing
LC Monitoring
Analyze Current Product behaviour, Warranty Data, Product Usage,
Market Perception, Product Capability
Analyze New Product, Define Targets, Define Risk
Mitigation and Product Target Achievement Tests
Plan, Execute and Track Failure Avoidance Actions:
Proactive ActivitiesFailure Elimination: Finalize
and Execute Physical Reliability Growth Testing
Failure Elimination, Lyfe
Cycle Monitoring and
Tracking

Overall Process for Reliability Process Maturity
Level 4-5
Set LC Growth
Targets
Analyze
Product New
Content
Develop &
Evaluate
Alternative
LCG Plans
Select & Optimize
Recommended RG
Plan
Execute LCG
Test Program
Track and
Manage LCG
Status vs. Plan
Adjust LCG
Plan as required
Infant Mortality
LCG
Dynamically
Plan Detailed
LCG Activities
Execute
Proactive
Activities
Track &
Manage
Proactive Effort
Plan Detailed
Proactive
Activities
Adjust LCG
Plan as required
Final
Evaluation of
Proactive Effort
Analyze
Warranty Data
Capability
Analysis
Carry-Over
Failure Mode
Analysis
Develop Life
Cycle Model
Initial Proactive
Activities
LC Tracking
Problem
Solving
LC Measuring
Conduct ROI
of LCG Plans
Requirements
Analysis
Perceived
Quality
Analysis
Customer
Usage Profiling
Reliability Target Achieving
Reliability PlanningPlanningPre-Planning
Proactive Tracking
LCG Testing
LC Monitoring

New Content Chart for CT15 C Cab (EC460, EC360, EC330,
EC290, EC240) (3/22/2005)
Target = 11.9
NC = 12.1
Failures = 25
Final MTBF = 543
NC = 15.4
Failures = 30
Final MTBF = 466
NC = 19.2
Failures = 35
Final MTBF = 403
NC = 21.3
Failures = 38
Final MTBF = 377
Target = 11.9
10
12
14
16
18
20
22
10/11/2004 12/28/2004 3/15/2005 6/1/2005 8/17/2005 11/3/2005 1/19/2006
Date
New
Con
ten
t
Planned New Content
Current New Content
Target
New Content Summary
Starting New Content: 21.3
Target New Content: 11.9
Planned New Content: 20.1
Current New Content: 19.7
Fre
qu
ency
Fail
ure
Test Time
Reduced Test
Time
Starting Point
Improvement
Reliability Growth Testing
Proactive Reliability Growth and Tracking
during Concept Engineering & Development
New Content Chart for CT15 C Cab (EC460, EC360, EC330,
EC290, EC240)
Target = 11.9
NC = 11.9
Failures = 25
Final MTBF = 549
NC = 14.9
Failures = 29
Final MTBF = 476
NC = 19.1
Failures = 35
Final MTBF = 404
NC = 21.3
Failures = 38
Final MTBF = 377
Target = 11.9
10
12
14
16
18
20
22
10/11/2004 12/28/2004 3/15/2005 6/1/2005 8/17/2005 11/3/2005 1/19/2006
Date
New
Co
nte
nt
Planned New Content
Current New Content
Target
Risk Assessment,
Proactive Reliability
Planninig and Definition
Proactive ReliabilityFrom Physical to Virtual Reliability Growth
Planning
Demonstration Testing - RG
Proactive Execution &
Tracking
RELIABILITY GROWTH CHART
Sample Reliability Growth Results - Automobile Phase 1
Target = 0.7419
Final Target = 0.3107
0.1000
1.0000
10.0000
100 1000 10000
Total Test Hours
Failure
s per
100 H
ours
Plan
Actual
RELIABILITY GROWTH CHART
Sample Reliability Growth Results - Automobile Phase 2
Target = 0.3107Final Target = 0.3107
0.1000
1.0000
10.0000
100 1000 10000 100000
Total Test Hours
Failure
s per
100 H
ours
Plan
Actual
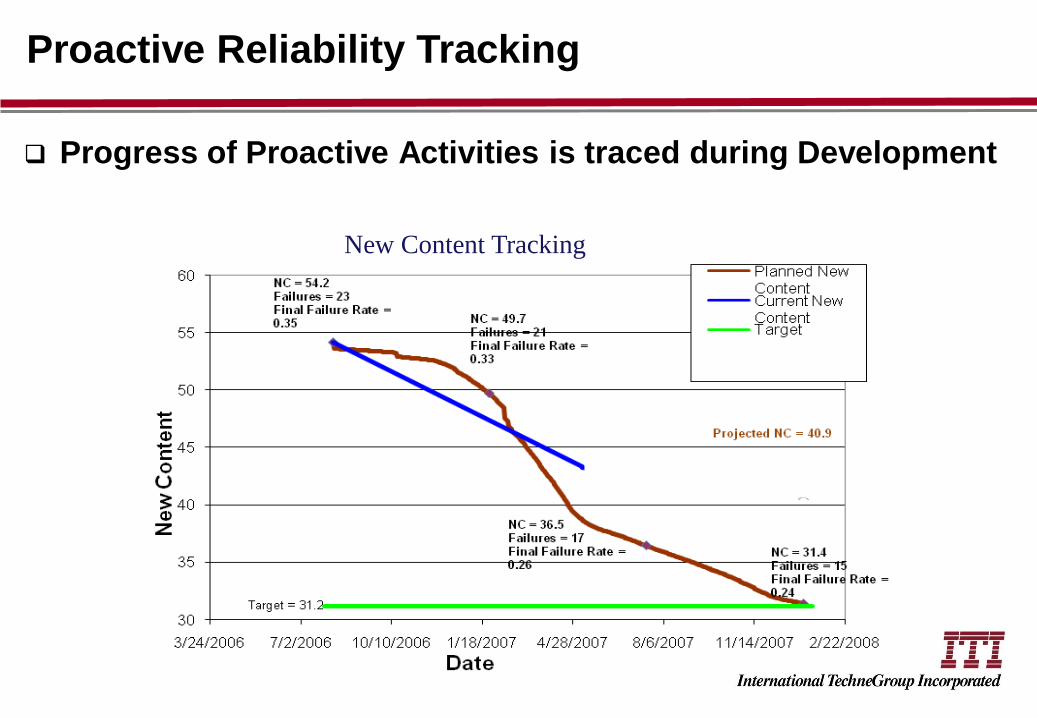
Proactive Reliability Tracking
Progress of Proactive Activities is traced during Development
New Content Tracking

Proactive Reliability Tracking
1 - New Content
GAP at check point
3 - Projected New
Content at Start of RG
Estimated Final Failure Rate = 0,285
4 - Predicted Final
Failure Rate
Achieved with
Current RG Plan
2 - Estimation of
Projected New Content
3 - Projected New
Content GAP at Start of
RG

Impact of Missed Proactive Activities
7,72
1,64
6,60
1,76
5,66
0,90Final Target = 0,9
Phase 1
500000 Kilometers
4 Test Units
21/01/2007 - 15/08/2007
Phase 2
400000 Kilometers
4 Test Units
20/12/2007 - 01/06/2008
Phase 3
1346875 Kilometers
8 Test Units
16/07/2008 - 28/01/2009
0,10
1,00
10,00
Fa
ilu
res
per
12
00
00
Kil
om
eter
s
Test Time
RELIABILITY GROWTH PLANTest Case RG Program Planning - ITI Product
Total Test Time: 2246875 KilometersStatistical Confidence: 75,0%
Baseline Plan
8,79
1,96
7,39
2,08
6,33
1,12
Final Target = 0,9
Phase 1
500000 Kilometers
4 Test Units
21/01/2007 - 15/08/2007
Phase 2
400000 Kilometers
4 Test Units
20/12/2007 - 01/06/2008
Phase 3
1346875 Kilometers
8 Test Units
16/07/2008 - 28/01/2009
0,10
1,00
10,00
Fa
ilu
res
per
12
00
00
Kil
om
eter
s
Test Time
RELIABILITY GROWTH PLANTest Case RG Program Planning - ITI Product
Total Test Time: 2246875 KilometersStatistical Confidence: 75,0%
Baseline Plan
RELIABILITY GROWTH PLANSystem X AT July 13 06 without PR
24
98
32
161
46
297Final Target = 297
Phase 124.3 New Content1307 Hours3 Test Units
8/1/2006 - 12/15/2006
Phase 20 New Content2384 Hours5 Test Units
2/15/2007 - 6/8/2007
Phase 30 New Content2504 Hours5 Test Units
7/23/2007 - 11/1/2007
1
10
100
1000
Test Time
MT
BF
(H
ou
rs)
Total Test Time: 6195 HoursStatistical Confidence: 70.0%
RELIABILITY GROWTH PLANSystem X AT July 13 06 with PR
30
177
47
297Final Target = 297
Phase 114.7 New Content2456 Hours4 Test Units
8/1/2006 - 1/15/2007
Phase 20 New Content2432 Hours5 Test Units
3/15/2007 - 6/8/2007
1
10
100
1000
Test Time
MT
BF
(H
ou
rs)
Total Test Time: 4888 HoursStatistical Confidence: 70.0%
Eu05
Without
Proactive
Credits
With Proactive
Credits
Total New Content 46,0 29,1
Phase 1 Unique New Content 44,1 28,0
Phase 2 Unique New Content 1,9 1,1
Phase 3 Unique New Content 0,0 0,0
NEW CONTENT SUMMARY
Product X
Reliability Risk
Concept A
Reliability Risk
Concept B
Project X
Without
Proactive
Credits
With Proactive
Credits
Total New Content 31,7 22,6
Phase 1 Unique New Content 23,3 17,4
Phase 2 Unique New Content 8,3 5,2
Phase 3 Unique New Content 0,0 0,0
Phase 4 Unique New Content 0,0 0,0
NEW CONTENT SUMMARY
Project X
Without
Proactive
Credits
With Proactive
Credits
Total New Content 67,0 55,0
Phase 1 Unique New Content 67,0 55,0
Phase 2 Unique New Content 0,0 0,0
Phase 3 Unique New Content 0,0 0,0
Phase 4 Unique New Content 0,0 0,0
NEW CONTENT SUMMARY
Reliability Risk
Concept C
24
130
24
137
31
204Final Target = 297
Phase 1
3360 Hours
3 Test Units
Phase 2
8065 Hours
4 Test Units
Phase 3
8960 Hours
6 Test Units
1
10
100
1000
10000
MT
BF
in H
ours
Test Time
RELIABILITY GROWTH PLAN
System X at July 13 2006
Total Test Time: 20385 HoursStatistical Confidence: 75.0%
XToo Risky
New Content Chart for CT15 C Cab (EC460, EC360, EC330,
EC290, EC240)
Tar get = 11. 9
NC = 11. 9Failur es = 25Final M TBF = 549
NC = 14. 9Failur es = 29Final M TBF = 476
NC = 19. 1Failur es = 35Final M TBF = 404
NC = 21. 3Failur es = 38Final M TBF = 377
Tar get = 11. 9
10
12
14
16
18
20
22
10/ 11/ 2004 12/ 28/ 2004 3/ 15/ 2005 6/ 1/ 2005 8/ 17/ 2005 11/ 3/ 2005 1/ 19/ 2006
Da te
New
Co
nte
nt
Planned New Content
Cur r ent New Content
Tar get
Risk Analysis Risk Mitigation Proactive
Reliability Plan
Reliability Growth Plan
New Content Chart for CT15 C Cab (EC460, EC360, EC330,
EC290, EC240)
Tar get = 11. 9
NC = 11. 9Failur es = 25
Final M TBF = 549
NC = 14. 9Failur es = 29Final M TBF = 476
NC = 19. 1Failur es = 35
Final M TBF = 404
NC = 21. 3Failur es = 38
Final M TBF = 377
Tar get = 11. 9
10
12
14
16
18
20
22
10/ 11/ 2004 12/ 28/ 2004 3/ 15/ 2005 6/ 1/ 2005 8/ 17/ 2005 11/ 3/ 2005 1/ 19/ 2006
Da te
New
Co
nte
nt
Planned New Content
Cur r ent New Content
Tar get
Target not Achieved
Within Budget
Target Achieved
with
High Cost
Target Achieved
with
Lower Cost

Useful Life Reliability Growth Monitoring
With effective problem
solving and Reliability
Growth management, the
growth phase target is
achieved as planned.
Target = 0.742
Final Target = 0.311
0.100
1.000
10.000
100 1000 10000
Fa
ilu
res
per
10
0 H
ou
rs
Total Test Time (Hours)
RELIABILITY GROWTH CHART
Sample Reliability Growth Plan - Phase 1
Current Status:
Total Test Time: 8954 Hours
Failures per 100 Hours: 0.726
Statistical Confidence: 75%
Total Failures Reported: 122
Total Failures Resolved: 63
Actual Unresolved Failures: 59
Planned Unresolved Failures: 59

Benefits of the RPM Methodology
• Quickly analyzes trade-offs and risks
• Provides objective, quantitative results to support decision
making.
• Ensures a high level of management priority and
organizational focus on Reliability
• Facilitates communication concerning Reliability plans and
status
• Implements RG techniques in concept development
Understand how many units and how long to test
Understand how much invest in Proactive Activities
Understand reliability risk areas and how to apply proactive activities to
mitigate

Conclusions
• Importance of a structured and rigorous process able to
evolve accordingly with the Company growth
• Applicability to different environments in global market
– To support localized development
– Allowing globalization of the results
• Implemented across the complete extension of the
Product Development Process: from Concept to
Production
• Effective for the Extended Enterprise from Customer to
Suppliers

Thank You