A Google map-based traffic accident reconstruction system · Both traffic accident reconstruction...
11
Vol. 8(37), pp. 1862-1872, 9 October, 2013 DOI: 10.5897/IJPS2013.3965 ISSN 1992 - 1950 © 2013 Academic Journals http://www.academicjournals.org/IJPS International Journal of Physical Sciences Full Length Research Paper A Google map-based traffic accident reconstruction system Chun-Chia Hsu 1 , Chih-Yung Lin 2 and Chin-Ping Fung 3 * 1 Department of Cultural Creativity and Digital Media Design, Lunghwa University of Science and Technology, Gueishan, Taoyuan County, Taiwan, Republic of China. 2 Department of Multi-media and Game Science, Lunghwa University of Science and Technology, Gueishan, Taoyuan County, Taiwan, Republic of China. 3 Department of Mechanical Engineering, Oriental Institute of Technology, Panchiao, New Taipei City, Taiwan, Republic of China. Accepted 26 September, 2013 Both traffic accident reconstruction and responsibility confirmation of traffic accident depend on crash scene diagramming and crash simulation. However, mistakenly recorded road geometry of the crash scene usually causes misunderstandings in the crash scene diagramming and thus the result of accident reconstruction is untrustworthy. Research has thus been continuously done to solve the problem. This study proposed a Google Map-based accident reconstruction system integrating functions of crash scene diagramming and crash simulation. The modulus of crash scene diagramming includes positioning of accident location, Google satellite map and Google Sketch Up to accurately present road geometry and accident vehicle position information. The modulus of crash simulation refers to the vehicle dynamic differential equations generated using the Newton-Euler formulation, and enhances with the calculation of momentum conservation in the collision to predict the vehicle dynamics after collision. The system developed in this study was validated using a real case. The results showed that a crash scene diagramming correctly drawn on the Google satellite map was an ideal platform to present the crush simulation, and help people understand or make a judgment for accident authentication. Key words: Accident reconstruction, Google map, crash scene diagramming, crash simulation. INTRODUCTION The crash scene diagramming is important for making a judgment on accident authentication as it is used to interpret the crash scene and to be frequently contrasted with the police accident record to reconstruct the accident scene. In order to clean up the obstacles on the road after a traffic accident and restore the passage as soon as possible, the police used to make a sketch of crash scene first at the accident site, using paper and pen. Then based on the sketch the police would further draw a crash scene diagramming using computer software for a formal police report. Nowadays the software of crash scene diagramming has developed well to support police and it has been on the market for a period of time. Crash Zone (The CAD Zone, Inc., 2012) is a full-functioned software of crash scene diagramming and crash simulation. It is used to draw a 2-D crash scene diagramming according to the data measured by police from the accident site. The 2-D diagramming can be further transformed to a 3-D scene. With the built-in tools, Crash Zone calculates the sliding speed and angle of each vehicle after crash. Then the traffic accident is reconstructed and showed with an animation after setting *Corresponding author. E-mail: [email protected]. Tel: +886-2-77380145. Fax: +886-2-77386648.
Transcript of A Google map-based traffic accident reconstruction system · Both traffic accident reconstruction...
Vol. 8(37), pp. 1862-1872, 9 October, 2013
DOI: 10.5897/IJPS2013.3965
ISSN 1992 - 1950 © 2013 Academic Journals
http://www.academicjournals.org/IJPS
International Journal of Physical Sciences
Full Length Research Paper
A Google map-based traffic accident reconstruction system
Chun-Chia Hsu1, Chih-Yung Lin2 and Chin-Ping Fung3*
1Department of Cultural Creativity and Digital Media Design, Lunghwa University of Science and Technology, Gueishan,
Taoyuan County, Taiwan, Republic of China. 2Department of Multi-media and Game Science, Lunghwa University of Science and Technology, Gueishan, Taoyuan
County, Taiwan, Republic of China. 3Department of Mechanical Engineering, Oriental Institute of Technology, Panchiao, New Taipei City, Taiwan,
Republic of China.
Accepted 26 September, 2013
Both traffic accident reconstruction and responsibility confirmation of traffic accident depend on crash scene diagramming and crash simulation. However, mistakenly recorded road geometry of the crash scene usually causes misunderstandings in the crash scene diagramming and thus the result of accident reconstruction is untrustworthy. Research has thus been continuously done to solve the problem. This study proposed a Google Map-based accident reconstruction system integrating functions of crash scene diagramming and crash simulation. The modulus of crash scene diagramming includes positioning of accident location, Google satellite map and Google Sketch Up to accurately present road geometry and accident vehicle position information. The modulus of crash simulation refers to the vehicle dynamic differential equations generated using the Newton-Euler formulation, and enhances with the calculation of momentum conservation in the collision to predict the vehicle dynamics after collision. The system developed in this study was validated using a real case. The results showed that a crash scene diagramming correctly drawn on the Google satellite map was an ideal platform to present the crush simulation, and help people understand or make a judgment for accident authentication. Key words: Accident reconstruction, Google map, crash scene diagramming, crash simulation.
INTRODUCTION
The crash scene diagramming is important for making a judgment on accident authentication as it is used to interpret the crash scene and to be frequently contrasted with the police accident record to reconstruct the accident scene. In order to clean up the obstacles on the road after a traffic accident and restore the passage as soon as possible, the police used to make a sketch of crash scene first at the accident site, using paper and pen. Then based on the sketch the police would further draw a crash scene diagramming using computer software for a formal police report. Nowadays the software of crash
scene diagramming has developed well to support police and it has been on the market for a period of time. Crash Zone (The CAD Zone, Inc., 2012) is a full-functioned software of crash scene diagramming and crash simulation. It is used to draw a 2-D crash scene diagramming according to the data measured by police from the accident site. The 2-D diagramming can be further transformed to a 3-D scene. With the built-in tools, Crash Zone calculates the sliding speed and angle of each vehicle after crash. Then the traffic accident is reconstructed and showed with an animation after setting
*Corresponding author. E-mail: [email protected]. Tel: +886-2-77380145. Fax: +886-2-77386648.
specific before-crash driving paths to separate vehicles. Easy Street Draw (A-T Solutions Inc., 2012) can be used to draw a 2-D crash scene diagramming by selecting a pre-drawn street diagram and editing the diagram according to the real road geometry from the accident scene. With the items in its built-in traffic symbol database, the process of crash scene diagramming is speeded. The office of Traffic Accident Management in China developed the traffic accident scene scale map software (2012) that could quickly draw a scale map of crash scene diagramming according to measurements recorded in a crash scene sketch and using built-in objects in the software such as people, vehicle, road, tyre skid mark, and debris. An Hui Keli Information Industry Co., LTD (2012) also developed a crash scene diagramming system with a laser range finder for police officers to quickly manage traffic accident. The system offers functions of zoom-in and zoom-out, symbols of automobile, non-automobile, human body, path, road, and accident type, and geometry database of line, curve, rectangle, circle, and ellipse. The commercially available software has its own characteristics, however, the accuracy of the crash scene diagramming in road geometry done by those software is based on a crash scene sketch and measurements recorded by police officers. In addition, not all package software has the function of CAD to set relations between different dimensions and maintain the same scale when plotting multiple lines and curves, and therefore, the defect usually causes misunderstanding in the relative positions of the human body, vehicle, tyre skid mark, and debris. If the road geometry of the crash scene is not completely or mistakenly recorded, it usually causes scale distortion in the crash scene diagramming. Most of the problems are not easily detected in the process of drawing crash scene diagramming, and the correction of drawing always takes much more time to finish.
The crash scene diagramming can also be made from photographs. Fenton and Kerr (1997) presented a technique that enables the user to create an accurate accident scene diagram from one photograph of the accident scene, by using a combination of processes called Inverse Camera Projection and Photographic Rectification. Chen and Chao (2006) also developed a fast mapping system for road accident by using digital close range photogrammetric technology. The software includes some functions such as reading the accident image, picking up the calibration points, calibrating, picking up the measurement points, computing the measurement points and mapping. In combination with iWitness and Crash Zone software, Hamzah et al. (2010) reconstructed accident scene using close-range photogrammetric technique to accurately map the crash scenes.
It is difficult to come to a decision for traffic accident judgment just from an accident scene and crash scene diagramming. The statements of the parties in inquiry
Hsu et al. 1863 record are therefore always used to help understand the driving path and direction of the party before traffic accident, the reaction behavior of the party handling vehicle to respond to emergency. The accident is then reconstructed with all the relative materials from crash scene and party statements to infer a conclusion. However, the party statements may not be completely trusted and lead to a distorted accident analysis as the party cannot correctly describe his driving path and reaction behavior because he was terrified during an accident, or the party describes a false statement because he intends to flinch his legal responsibility for an accident. To overcome the problem, a crash simulation constructed on crash scene diagramming can offer the requirements on accident reconstruction and responsibility confirmation of traffic accident. The crash simulation programming in commercial software is well developed. PC-Crash (MEA Forensic Engineers and Scientists, 2012) is a collision and trajectory simulation tool that presents 2D or 3D motor vehicle collisions with its own modulus of crash scene diagramming. Kinematics and dynamics moduli are adopted in the software to simulate vehicle dynamic behaviors. The kinematics modulus is used to calculate the average acceleration of the vehicle from the accelerating or braking force acting on tyres. Then the acceleration is integrated to obtain the velocity and displacement of the vehicle. The dynamics modulus is used to calculate the longitudinal and lateral forces acting on tyres according to the tyre slip angle, accelerating or braking force, and reaction force from suspension system. The forces acted on tyres are then transformed to vehicle body to obtain vehicle’s linear and angular acceleration. PC-Crash was first validated by Cliff and Montgomery (1996). The staged collisions were reconstructed using PC-Crash and the trajectories were compared to actual measurements of the skid marks and rest positions. HVE (Engineering Dynamics Corporation, 2012) is a platform for 3D simulation. The EDC’s accident reconstruction packages, EDCRASH and EDSMAC, are operated in HVE. EDCRASH calculates impact velocity and impact gravity based on accident side and vehicle damage measurements. EDCRASH is suited for two-vehicle accidents and collisions with immovable barriers. EDSMAC analyzes vehicle response before, during and after impact. Accident investigators can also determinate impact velocity and impact gravity using EDSMAC. M-smac and M-crash (McHenry Software, 2012) are accident reconstruction packages developed by McHenry software, Inc. using SMAC and CRASH3 model, respectively. The packages can present their simulation results on crash scene diagramming plotted using general CAD software. Johnson et al. (2009) reconstructed delta-V, the vehicle change in velocity, for a series of side impact crash tests using reconstruction code CRASH3, and then compared the reconstructed delta-V with the delta-V recorded by the crash test
1864 Int. J. Phys. Sci. instrumentation to determine the accuracy of the reconstructed value. WinSMAC and WinCRASH (Trantech Corporation, 2012) in ARSoftware are accident reconstruction programs developed by Trantech Corporation improving SMAC and CRASH3 algorithms for Windows version. The programs can predict velocity change before and after collision and display results in a 2D diagram. WinSMAC and WinCRASH are priced at $769 and $469, respectively. Niehoff and Gabler (2006) investigated the accuracy of WinSmash delta-V estimates as a function of crash mode, vehicle body type, and vehicle stiffness. WinSmash, a direct descendant of crash reconstruction software CRASH3, was found to underestimate delta-V by 23% on average. Johnson and Gabler (2012) further used vehicle damage to estimate absorbed energy and applies momentum conservation to estimate ΔV.
The function and feature of the software for crash scene diagramming and accident reconstruction mentioned above are listed in Table 1. The table indicates that only a few packages own both functions of crash scene diagramming and crash simulation, however, these packages are closed systems. Most packages own one function only, and cannot be extended or integrated with other packages. Therefore, this study developed a Google Map-based accident reconstruction system that consisted of crash scene diagramming and crash simulation. With the system, the crash diagramming can be easily and precisely drawn on a Google map by on-duty police officers using built-in objects from database, and the crash simulation is then clearly animated on the Google map for making a judgment of accident authentication.
METHODS
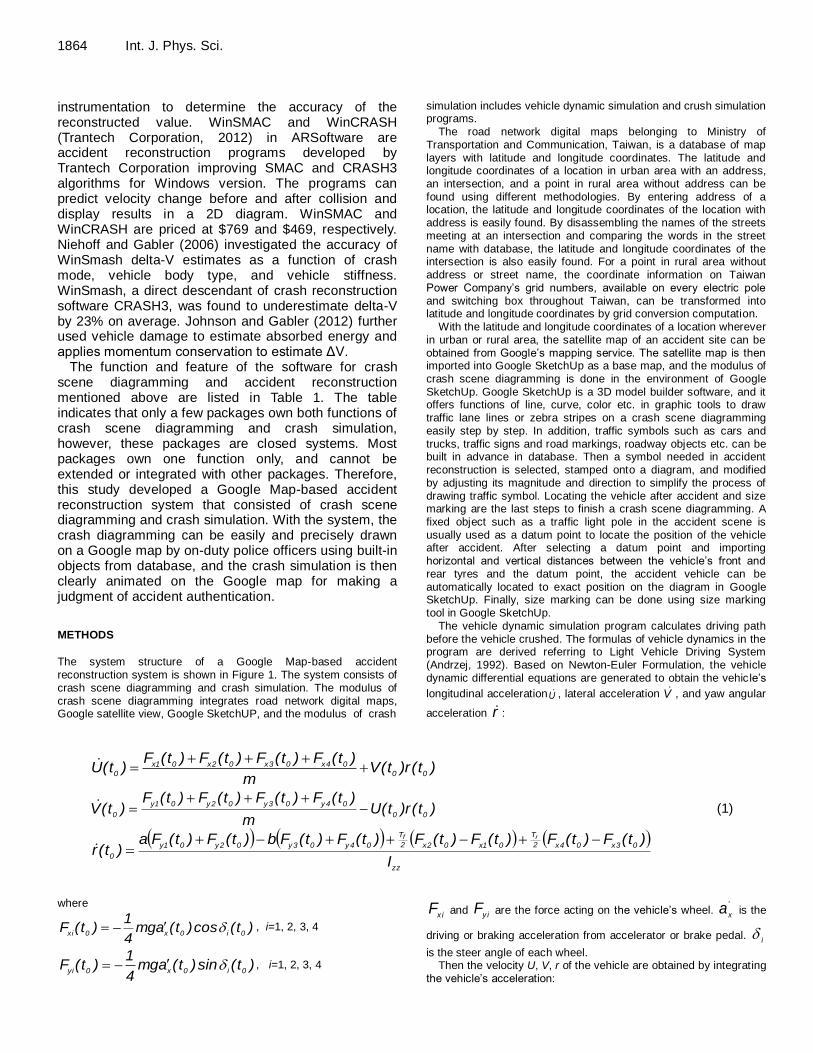
The system structure of a Google Map-based accident reconstruction system is shown in Figure 1. The system consists of crash scene diagramming and crash simulation. The modulus of crash scene diagramming integrates road network digital maps, Google satellite view, Google SketchUP, and the modulus of crash
simulation includes vehicle dynamic simulation and crush simulation programs.
The road network digital maps belonging to Ministry of Transportation and Communication, Taiwan, is a database of map layers with latitude and longitude coordinates. The latitude and longitude coordinates of a location in urban area with an address, an intersection, and a point in rural area without address can be found using different methodologies. By entering address of a location, the latitude and longitude coordinates of the location with address is easily found. By disassembling the names of the streets meeting at an intersection and comparing the words in the street name with database, the latitude and longitude coordinates of the intersection is also easily found. For a point in rural area without
address or street name, the coordinate information on Taiwan Power Company’s grid numbers, available on every electric pole and switching box throughout Taiwan, can be transformed into latitude and longitude coordinates by grid conversion computation.
With the latitude and longitude coordinates of a location wherever in urban or rural area, the satellite map of an accident site can be obtained from Google’s mapping service. The satellite map is then imported into Google SketchUp as a base map, and the modulus of crash scene diagramming is done in the environment of Google
SketchUp. Google SketchUp is a 3D model builder software, and it offers functions of line, curve, color etc. in graphic tools to draw traffic lane lines or zebra stripes on a crash scene diagramming easily step by step. In addition, traffic symbols such as cars and trucks, traffic signs and road markings, roadway objects etc. can be built in advance in database. Then a symbol needed in accident reconstruction is selected, stamped onto a diagram, and modified by adjusting its magnitude and direction to simplify the process of drawing traffic symbol. Locating the vehicle after accident and size marking are the last steps to finish a crash scene diagramming. A fixed object such as a traffic light pole in the accident scene is usually used as a datum point to locate the position of the vehicle after accident. After selecting a datum point and importing horizontal and vertical distances between the vehicle’s front and rear tyres and the datum point, the accident vehicle can be automatically located to exact position on the diagram in Google SketchUp. Finally, size marking can be done using size marking
tool in Google SketchUp. The vehicle dynamic simulation program calculates driving path
before the vehicle crushed. The formulas of vehicle dynamics in the program are derived referring to Light Vehicle Driving System (Andrzej, 1992). Based on Newton-Euler Formulation, the vehicle dynamic differential equations are generated to obtain the vehic le’s
longitudinal accelerationU , lateral acceleration V , and yaw angular
acceleration r :
)t(r)t(Vm
)t(F)t(F)t(F)t(F)t(U
00
04x03x02x01x
0
)t(r)t(Um
)t(F)t(F)t(F)t(F)t(V
00
04y03y02y01y
0
(1)
zz
03x04x2
T
01x02x2
T
04y03y02y01y
0I
)t(F)t(F)t(F)t(F)t(F)t(Fb)t(F)t(Fa)t(r
rf
where
)t(cos)t(amg4
1)t(F
0i0x0xi , i=1, 2, 3, 4
)t(sin)t(amg4
1)t(F
0i0x0yi , i=1, 2, 3, 4
xiF and y i
F are the force acting on the vehicle’s wheel. '
xa is the
driving or braking acceleration from accelerator or brake pedal. i
is the steer angle of each wheel. Then the velocity U, V, r of the vehicle are obtained by integrating
the vehicle’s acceleration:

Hsu et al. 1865 Table 1. The function and feature of the software for crash scene diagramming and accident reconstruction.
Software Crash scene diagramming Crash simulation Database Price
Crash Zone $699
Easy Street Draw — $199
The office of traffic accident management in China —
AnHui Keli Information Industry Co., LTD — —
PC-Crash $4,995
HVE
m-crash/ m-smac — —
WinCRASH/ WinSMAC — — $469/$769
Figure 1. The system structure of a Google Map-based accident reconstruction system.
)t(Udt)t(U)t(U001
)t(Vdt)t(V)t(V001
(2)
)t(rdt)t(r)t(r001
and the position X, Y, of the vehicle are obtained by integrating the vehicle’s velocity:
)t(Xdt)]t(Sin)t(V)t(Cos)t(U[)t(X000001
)t(Ydt)]t(Cos)t(V)t(Sin)t(U[)t(Y000001
(3)
)t(dt)t(r)t(001
The crush simulation program, based on the law of momentum of
conservation, calculates velocity vectors )Y,X(aa and yaw
angular velocity ar of vehicle A after vehicle collision:
))t(Y),t(X(nana
= (abNa
xV +abTa
xV , abNa
yV abTa
yV )
)t(rna
= )t(rna
= ar (4)
Where
NaV =
Nb
ba
b
Na
ba
ba Vmm
m)e1(V
mm
emm
NaV and Na
V are the velocity components of vehicle A in the
normal direction of collision plane after and before collision, respectively. ma and mb are the mass of vehicle A and B, and e is
the coefficient of restitution. )y,x(abab
is the tangent directional
unit vector of collision plane of vehicle A.
The position Xa, Ya, a of the vehicle A after collision are
)t(Xdt)t(X)t(Xnana1na
)t(Ydt)t(Y)t(Ynana1na
(5)
)t(dt)t(r)t(nana1na
The velocity and position of vehicle B after collision are derived in
1866 Int. J. Phys. Sci.
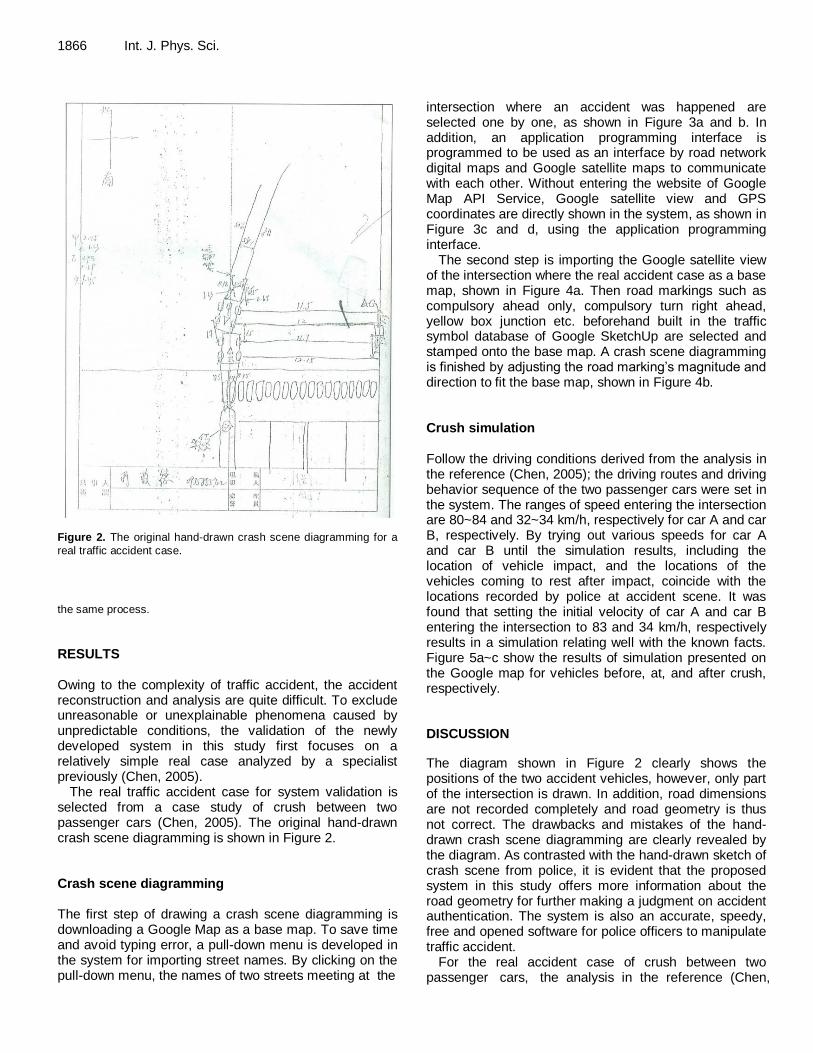
Figure 2. The original hand-drawn crash scene diagramming for a
real traffic accident case.
the same process.
RESULTS Owing to the complexity of traffic accident, the accident reconstruction and analysis are quite difficult. To exclude unreasonable or unexplainable phenomena caused by unpredictable conditions, the validation of the newly developed system in this study first focuses on a relatively simple real case analyzed by a specialist previously (Chen, 2005).
The real traffic accident case for system validation is selected from a case study of crush between two passenger cars (Chen, 2005). The original hand-drawn crash scene diagramming is shown in Figure 2. Crash scene diagramming The first step of drawing a crash scene diagramming is downloading a Google Map as a base map. To save time and avoid typing error, a pull-down menu is developed in the system for importing street names. By clicking on the pull-down menu, the names of two streets meeting at the
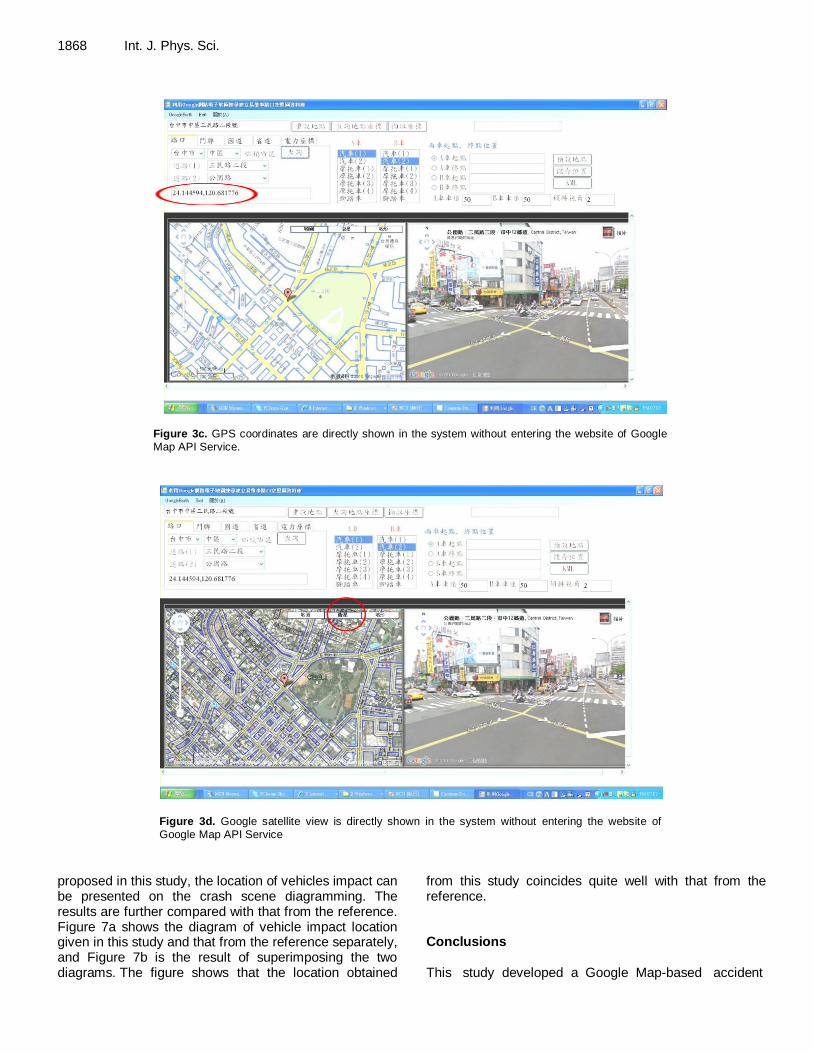
intersection where an accident was happened are selected one by one, as shown in Figure 3a and b. In addition, an application programming interface is programmed to be used as an interface by road network digital maps and Google satellite maps to communicate with each other. Without entering the website of Google Map API Service, Google satellite view and GPS coordinates are directly shown in the system, as shown in Figure 3c and d, using the application programming interface.
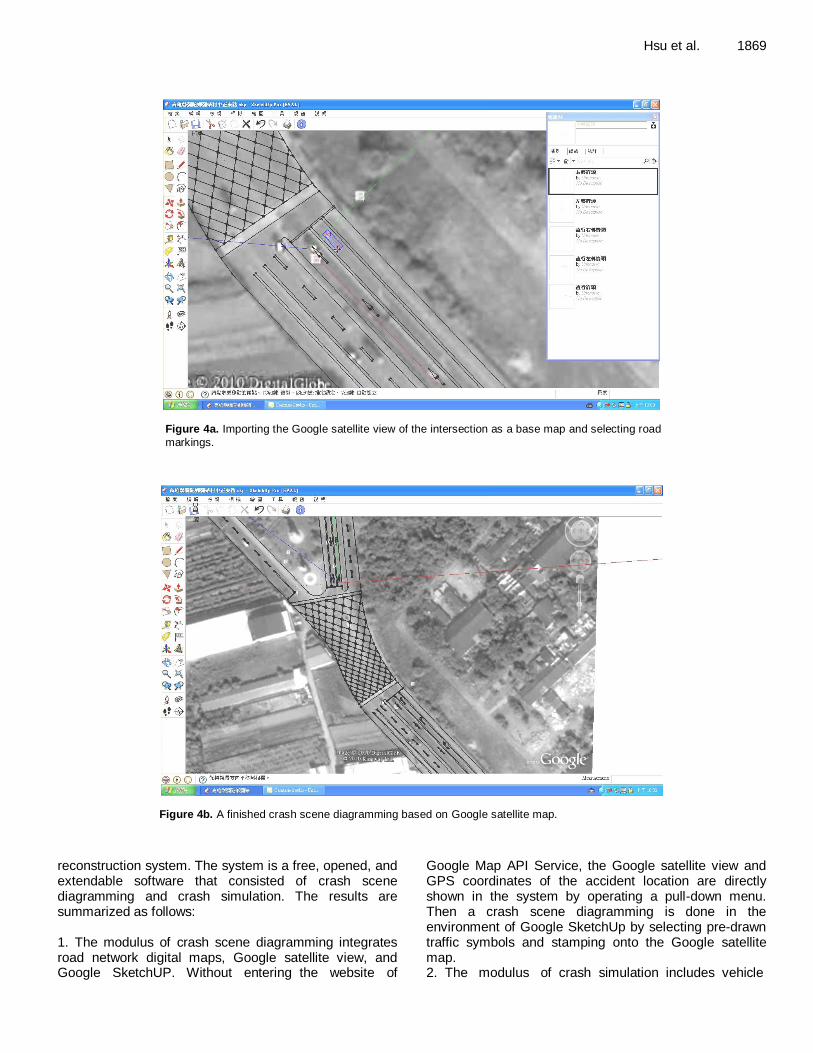
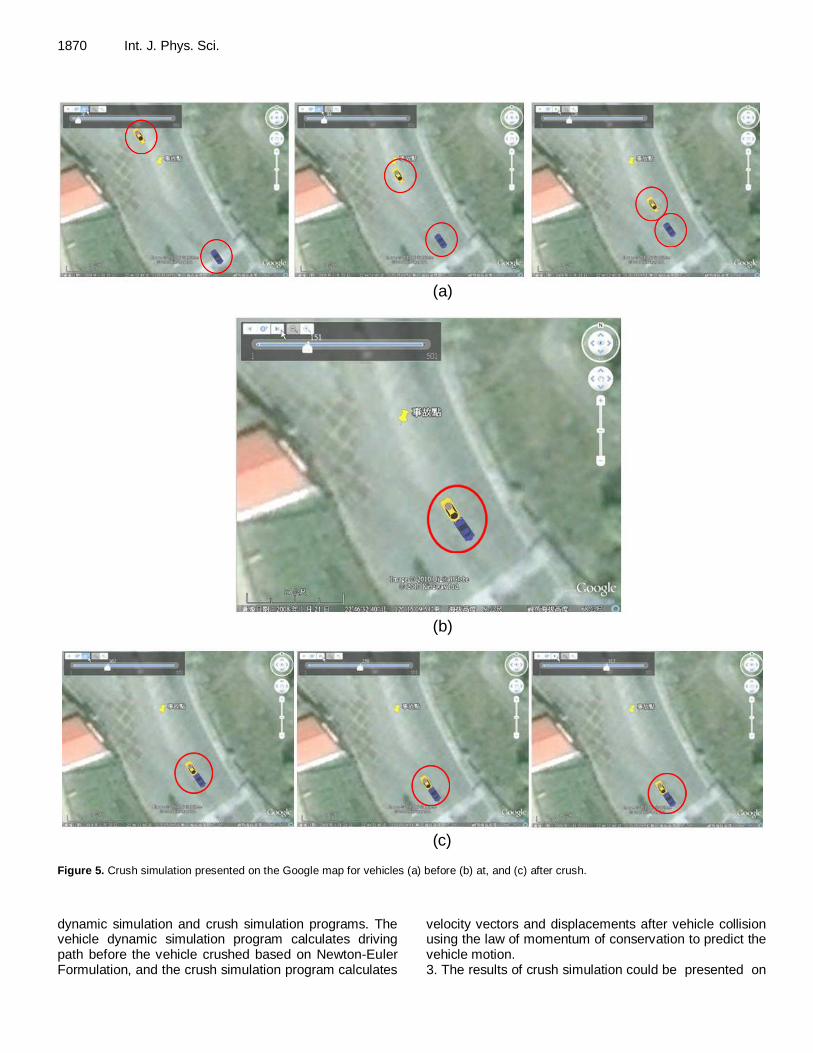
The second step is importing the Google satellite view of the intersection where the real accident case as a base map, shown in Figure 4a. Then road markings such as compulsory ahead only, compulsory turn right ahead, yellow box junction etc. beforehand built in the traffic symbol database of Google SketchUp are selected and stamped onto the base map. A crash scene diagramming is finished by adjusting the road marking’s magnitude and direction to fit the base map, shown in Figure 4b. Crush simulation Follow the driving conditions derived from the analysis in the reference (Chen, 2005); the driving routes and driving behavior sequence of the two passenger cars were set in the system. The ranges of speed entering the intersection are 80~84 and 32~34 km/h, respectively for car A and car B, respectively. By trying out various speeds for car A and car B until the simulation results, including the location of vehicle impact, and the locations of the vehicles coming to rest after impact, coincide with the locations recorded by police at accident scene. It was found that setting the initial velocity of car A and car B entering the intersection to 83 and 34 km/h, respectively results in a simulation relating well with the known facts. Figure 5a~c show the results of simulation presented on the Google map for vehicles before, at, and after crush, respectively. DISCUSSION
The diagram shown in Figure 2 clearly shows the positions of the two accident vehicles, however, only part of the intersection is drawn. In addition, road dimensions are not recorded completely and road geometry is thus not correct. The drawbacks and mistakes of the hand-drawn crash scene diagramming are clearly revealed by the diagram. As contrasted with the hand-drawn sketch of crash scene from police, it is evident that the proposed system in this study offers more information about the road geometry for further making a judgment on accident authentication. The system is also an accurate, speedy, free and opened software for police officers to manipulate traffic accident.
For the real accident case of crush between two passenger cars, the analysis in the reference (Chen,

Hsu et al. 1867
(a)
(b)
Figure 3. To select the (a) first and (b) second street name at the intersection where an accident
happened by clicking on the pull-down menu.
2005) derived the drivers’ behaviors before the crush from reports made by police, and evidences left behind at the accident scene. Car A entered the interaction at the speed of 80~84 km/h, then applied brakes to reduce speed with a deceleration of around 10 m/s
2, and a skid
mark was left around 14 m. On the other hand, car B entered the interaction at the speed of 32~34 km/h, then applied brakes to reduce speed with a deceleration of
around 10 m/s2, and a skid mark was left around 4 m.
When the two cars collided with each other, the speeds of car A and car B were around 53~58 and 10~15 km/h, respectively. The location of vehicles impact, and the location of vehicles coming to rest after impact, analyzed by the reference are shown in Figure 6. As the initial velocities of car A and car B entering the intersection are set to 83 and 34 km/h in a simulation using the system
1868 Int. J. Phys. Sci.
Figure 3c. GPS coordinates are directly shown in the system without entering the website of Google Map API Service.
Figure 3d. Google satellite view is directly shown in the system without entering the website of
Google Map API Service
proposed in this study, the location of vehicles impact can be presented on the crash scene diagramming. The results are further compared with that from the reference. Figure 7a shows the diagram of vehicle impact location given in this study and that from the reference separately, and Figure 7b is the result of superimposing the two diagrams. The figure shows that the location obtained
from this study coincides quite well with that from the reference. Conclusions This study developed a Google Map-based accident
Hsu et al. 1869
Figure 4a. Importing the Google satellite view of the intersection as a base map and selecting road
markings.
Figure 4b. A finished crash scene diagramming based on Google satellite map.
reconstruction system. The system is a free, opened, and extendable software that consisted of crash scene diagramming and crash simulation. The results are summarized as follows: 1. The modulus of crash scene diagramming integrates road network digital maps, Google satellite view, and Google SketchUP. Without entering the website of
Google Map API Service, the Google satellite view and GPS coordinates of the accident location are directly shown in the system by operating a pull-down menu. Then a crash scene diagramming is done in the environment of Google SketchUp by selecting pre-drawn traffic symbols and stamping onto the Google satellite map. 2. The modulus of crash simulation includes vehicle
1870 Int. J. Phys. Sci.
(a)
(b)
(c)
Figure 5. Crush simulation presented on the Google map for vehicles (a) before (b) at, and (c) after crush.
dynamic simulation and crush simulation programs. The vehicle dynamic simulation program calculates driving path before the vehicle crushed based on Newton-Euler Formulation, and the crush simulation program calculates
velocity vectors and displacements after vehicle collision using the law of momentum of conservation to predict the vehicle motion. 3. The results of crush simulation could be presented on

Hsu et al. 1871
Vehicles impact
Vehicles coming to rest after impact
Figure 6. The location of vehicles impact, and the location of vehicles coming to rest after impact,
analyzed by the reference.
Figure 7a. The diagram of vehicle impact location given in this study (left) and that from the reference (right)
separately.
Figure 7b. The result of superimposing the diagram of vehicle
impact location given in this study on that from the reference.
the Google map in the form of animation to help people understand or make a judgment for accident authentication.
REFERENCES
Andrzej NG (1992). Develop and Validation of Light Vehicle Dynamics Simulation (LVDS). SAE Paper No. 920056.
AnHui Keli Information Industry Co., LTD (2012). Crash scene
diagramming system [online]. Avail from: http://www.ahkeli.com/productcontent.aspx?id=59 [Accessed 12 June 2013].
A-T Solutions Inc. (2012). Easy Street Draw [online]. Avail from: http://www.trancite.com/pro_esd.php [Accessed 12 June, 2013].
Chen KT (2005). Management and authentication of traffic accident (in
Chinese). Sun-Wei Press Inc., New Taipei City, Taiwan, pp. 306-329. Chen Q, Chao KN (2006). Research on Fast Surveying and Mapping
System for Road Traffic Accident. J. Shandong Jiaotong Univ. 14:17-
21. Cliff WE, Montgomery DT (1996). Validation of PC-Crash - A
Momentum-Based Accident Reconstruction Program. SAE Paper No.
960885.
1872 Int. J. Phys. Sci. Engineering Dynamics Corporation (2012). HVE [online]. Available from:
http://www.edccorp.com/products/hve.html [Accessed 12 June 2013]. Fenton S, Kerr R (1997). Accident scene diagramming using new
photogrammetric technique. SAE Paper No. 970944. Hamzah NB, Setan H, Majid Z (2010). Reconstruction of traffic accident
scene using close-range photogrammetry technique. Geoinf. Sci. J.
10:17-37. Johnson N, Gabler HC (2012). Accuracy of a damage-based
reconstruction method in NHTSA side crash tests. Traffic Inj. Prev.
13:72-80. Johnson N, Hampton C, Gabler HC (2009). Evaluation of the accuracy
of side impact crash test reconstructions. Biomed. Sci. Instrum.
45:250-255. McHenry Software (2012). M-smac and M-crash [online]. Avail from:
http://www.mchenrysoftware.com/ [Accessed 12 June 2013].
MEA Forensic Engineers and Scientists (2012). PC-Crash [online]. Available from: http://www.pc-crash.com/product_pccrash.php [Accessed 12 June 2013].
Niehoff P, Gabler HC (2006). The accuracy of WinSmash delta-V
estimates: the influence of vehicle type, stiffness, and impact mode. Annu. Proc. Assoc. Adv. Automot. Med. 50:73-89.
Office of Traffic Accident Management in China (2012). The traffic accident scene scale map software [online]. Available from: http://www.e122.com/drawing.htm [Accessed 12 June 2013].
The CAD Zone, Inc. (2012). Crash Zone [online]. Available from: http://www.cadzone.com/products/the-crash-zone [Accessed 12 June 2013].
Trantech Corporation (2012). WinSMAC and WinCRASH [online]. Avail from: http://www.arsoftware.com/products.htm [Accessed 12 June 2013].