An Analysis of the Relationship between Exports and Growth ...
(Revised 04-01-2010)
A DYNAMIC ANALYSIS OF THE RELATIONSHIP AMONG HUMAN DEVELOPMENT, EXPORTS
AND ECONOMIC GROWTH IN PAKISTAN
MUHAMMAD AFZAL Lecturer, Department of Economics, University of the Punjab
Lahore-54590 (Pakistan) (E-mail: [email protected])
A. RAUF BUTT Professor, School of Business and Economics
University of Management and Technology, Lahore
HAFEEZ UR REHMAN Associate Professor/Chairman, Department of Economics
University of the Punjab, Lahore-54590
ABSRACT
This study investigates the econometrically empirical evidence of both the short-run and long-run interrelationships among human development, exports and economic growth in an ARDL framework for Pakistan. This study also examines causal linkages among the said variables by applying the augmented Granger causality test of Toda-Yamamoto (1995). By using data on Pakistan’s real GDP, real exports and human development Index (HDI) for the period 1970-71 to 2008-09, three models have been estimated. The results show cointegration between economic growth, physical capital, real exports and human development when human development is taken as dependent variables. Furthermore, unidirectional Granger causality running from real GDP to real exports has been found in Bivariate, Trivariate and Tetravariate causality framework. The inclusion of HDI as a measure of human development reduces the physical capital share in real GDP whereas it improves the robustness of the regression model. Real GDP seems to provide resources to improve human development in only the long-run while human capital accumulation does not seem to accelerate real GDP both in the SR and the LR. The empirical results of the study do not support ‘export-led growth hypothesis’ and human capital- based endogenous growth theory in case of Pakistan, however, it does support ‘growth-driven exports hypothesis’ in case of Pakistan.
2
I. INTRODUCTION
Human development (HD), being the ultimate objective of each and every human activity, plays a vital role in producing high skilled manpower that leads to economic growth and hence economic development. “HD denotes both the processes of widening people’s choices and level of their achieved well being” (UNDP, 1990, p.10). HD is the enlargement of people’s choices to live more prosperous lives. Economists consider HD as one of the most important ingredients of economic growth. Two periods regarding growth theories are very important in economic literature. In the first period, i.e. in late 1950s and 1960s, physical capital (PC) was given too much role in explaining economic growth but long run economic growth can be explained only by assuming an exogenous technological progress. In the second period, i.e. late 1980s and early 1990s, economic growth models were extended by inclusion of human capital (HC) and thereby endogenous growth theories emerged (Romar, 1986, 1987, 1990; Lucas, 1988; Grossman and Helpman, 1991; Rebelo, 1991). Human capital is endogenous here and growth rate may continue to rise because returns on investments in human capital do not necessarily exhibit diminishing marginal returns. Human capital accumulations as an endogenous factor proved to be the main contributor in explaining sustainable long run economic growth. There are two main approaches through which human capital is likely to affect the long-run economic growth. The first approach known as ‘Lucasian’ (Lucas, 1988) incorporates human capital into growth model as one of the factor of production. The second approach called ‘Romerian’ (Romer, 1990) depends upon the idea that human capital promotes technological advancement. According to Romerian approach, high level of human capital results in more innovation and more efficiency of the work force that, in turn, leads to more growth in aggregate income. While explaining endogenous growth theory, Lucas (1988), Romer (1990) and Grossman and Helpman (1991) have argued that either human capital or trade is main source of economic growth. Exports, being the important part of trade, are considered as important ingredient of progress and prosperity of both developed and developing economies.
A number of studies in literature are available that have examined the ‘export-led economic growth hypothesis’ and ‘growth-driven exports hypothesis’ (e.g. see Shan and Sun, 1998; Ahmad, 2001; Afzal, Rehman and Rehman, 2008, for reference of more recent studies). There also exists a vast literature on the linkage between human capital and economic growth. Economic growth and hence economic development cannot be sustained unless and until preceded by improvements in HD. If HC is a prerequisite for sustainable economic growth, the government as well as private funding must be allocated in such a way that help move a nation above a threshold level of HD. ‘Export-led growth hypothesis’ postulates that export actively leads to economic growth in the following manner. Firstly, export promotion incentives and schemes directly encourage the exporters to produce more exportables. This, in turn, leads to specialization and to get fruits of the economies of scale and country’s comparative advantage. Secondly, increased exports may help the country to import high value inputs, products and technologies that, further, may have a positive impact on economy’s overall productive capacity. ‘Growth-driven export hypothesis’ postulates that growth leads to exports. Economic growth itself promotes trade flows. It also leads to specialization and creates comparative advantage in a certain areas that further facilitates exports. So there may or may not exit a bidirectional linkages between economic growth and exports.
3
Bivariate causality framework between economic growth and exports excludes some other most relevant economic and non-economic variables (such as financial development, macroeconomic stability, energy resources, trade openness, debt, imports, expenditures on R&D, investment share in GDP, FDI, exchange rate, political stability, labour and labour productivity etc.) that may have significant impacts on the two main variables being studied. In spite of a clear conceptual link among HC, economic growth and exports, there exist a few empirical studies like Chuang (2000) for Taiwan and Narayan and Smyth (2004) for China that have examined the causal linkage among economic growth, HD and exports in a multivariate framework. There is hardly any study on Pakistan that examines the linkages among human capital, economic growth and exports. The present study is an attempt to examine the both the SR and LR dynamic analysis of the relationship and causality among economic growth, HD and exports using Pakistan’s data.
The main objectives of this study are:
To empirically examine both the short-run and long-run dynamic relationships among economic growth, human development and exports in Pakistan.
To examine the validity of human capital based-growth driven and export led growth hypotheses.
To check the causal link among the variables being studied.
This study confines to Pakistan’s economy on the dynamic relationships and causal nexus among economic growth, human development and exports. The HDI that is used as a composite measure of HD has been improving since 1970-71. The estimated HDI was 0.24 or 24% in 1970-71. This number increased to 0.34, 0.44, 0.51 and 0.56 in 1980-81, 1990-91, 2000-01 and 2008-09 respectively. This means that the HD has improved more than double from 1970-71 to 2008-09 in Pakistan. The average annual increase in HDI remained at 2.25% from 1970-71 to 2008-09 that needs to be further improved in the coming years to cope with the requirement of latest technology used in Production. The growth of real exports in Pakistan has also been much rapid. It increased from Rs.74000 millions in 1970-71 to Rs. 329086.1 millions and Rs. 871956.9 millions in 1990-91 and 2007-08 respectively. The per annum average increase in real exports has been 6.89% since 1970-71 to 2007-08. The export to GDP ratio has been below 10% since 1970-71 to 1989-90 in Pakistan. It fluctuated between 10 % in 1990-91 to 13 % in 2008-09. The average annual increase in Pakistan’s real GDP has remained 5.25% from 1970-71 to 2008-09.
The remaining study is organized as under: Review of literature is presented in section II. Section III includes specification of model, data sources and methodology. Empirical results are discussed in section IV. Conclusion and recommendations have been given in section V.
II. REVIEW OF LITERATURE
There exist many empirical studies that have examined the linkage between exports and economic growth either by using correlation analysis or by using a bivariate causality analysis. Testing causality in a bivariate framework may not very well free of specification bias. An important variable or variables may be missing or omitted a bivariate causality case. Empirical studies on ‘Export-led economic growth hypothesis’ have supported
4
mixed results in a bivariate causality framework. Empirical support for the validity of ‘export-led growth hypothesis’ in both developing and developed countries was found considerably weak in recent era when analyzed by using cointigration and augmented Granger causality analysis rather than earlier correlation based or simple causality analysis. A few empirical studies also exist that have included other relevant variables (e.g. financial development, trade openness, debt, imports, expenditures on R&D, share of investment in GDP, FDI, energy, exchange rate, labour stock and capital stock, etc.) for causality analysis and try to exert their influence on exports and economic growth. Afzal, Rehman and Rehman (2008) tested the causality among economic growth, external debt servicing and exports in a bivariate and trivariate framework for Pakistan by applying Toda-Yamamoto Augmented Granger Causality analysis and found no support to ‘export-led growth hypothesis’. Their study further supported the ‘growth-driven export hypothesis’. The principal findings of the study by Shan and Sun (1998) cannot give support for the validity of ‘export-led growth hypothesis’. Awokuse (2003) tested the credibility of ‘export-led growth hypothesis’ for Canada and found it to be valid. Applying ARDL approach to cointegration and Toda-Yamamoto non-causality test, Omisakin (2009) supported ‘export-led growth hypothesis’ for Nigeria. A comprehensive list of the studies that directly or indirectly have empirically examined the causality between economic growth and exports is given by Jung and Marshal (1985) for 37 developing countries and found one-way causality running from exports to growth for four countries only, Chow (1987) found causality running from exports to growth for only one country out of eight newly industrialized countries, Al-Yousif (1997) for Arab Gulf countries, Thornton (1996, 1997) for Mexico and Europe, Awokuse (2005) for Korea, Xu (1996) and Riezman et al. (1996) for set of countries including Korea, Hong Kong and Taiwan, Bahmani-Oskooee et al. (1991) for 20 countries, Kwan and Cotsomitis (1991) for China, Marin (1992) for industrialized countries, Shan and Sun (1998) for China, Hetemi and Manuchehr (2000) for Nordic economies, Ahmed and Kwan (1991) for 47 African countries and found no causality running from exports to growth, Lee and Pan (2000) for East Asian countries, Graves et al. (1995) for Korea, Onchoke and In (1994) for selected South Pacific Island Nations, Mah (2005) for China, Hetemi (2003) for Japan, Demirhan, Erdal and Akcay (2005) for selected MENA countries, Ahmad (2001), Kovacic and Djukic (1991) for Yugoslav economy, Jordaan and Eita (2007), Doganlar and Fisunoglu (1999) for Asian countries, Islam (1998), Baharumshah and Rashid (1999), for Malaysian economy, Khalid and Cheng (1997) for Singapore, Din (2004) for five largest economies of South Asia including Pakistan, Afzal (2006) for Pakistan, Ahmed et al. (2000) for South and South-East Asian countries, Wernerheim (2000) for Canada, Reppas and Christopoulas (2005) for African and Asian countries, Amoateng and Adu (1996) for African Countries, Hsiao (1987) for newly Industrialized Asian economies, Ahmad and Harnhirun (1995) for Asian countries, Chuang (2000) for Taiwan, Narayan and Smyth (2004) for China, Liu et al. (1997) for China, Shan and Tian (1998) for Shanghi (China), Konya (2006) for OECD countries, Shirazi and Manap (2004) for Pakistan and Afzal, Rehman and Rehman (2008) for Pakistan.
Doganlar and Fisunoglu (1999) examined the causal linkage for seven Asian countries including Pakistan and found unidirectional causality running from economic growth to export growth in Pakistan. Vohra (2001) investigated linkage between export and economic growth for Pakistan, Philippines, Malaysia, Thailand and India, and found that exports positively affected the economic growth. Din (2004) explored the ‘export-led growth hypothesis’ for five South Asian countries including Pakistan and found cointegration among exports, imports, and output for Pakistan. Afzal (2006) found
5
feedback causality between manufactured exports and GDP. Amoateng and Adu (1996) and Chen (2007) supported both the ‘growth-driven exports’ and ‘Export-led economic growth hypotheses’ in trivariate and tetravariate causality analysis respectively.
The linkages (i) between economic growth (EGr) and human capital (HC), (ii) between HC and trade, and (iii) between EGr and trade have been studied and discussed by Narayan and Smyth (2004). A strong linkage was found between EGr and HD (Ranis, Stewart and Ramitez, 2000). Narayan and Smith (2004) tested Granger causality between HC and real income in a cointegrated VAR processes for China and found unidirectional Granger causality running from HC to real income in the LR while in SR, one-way Granger causality running from real income to HC. On one side, EGr supply the resources to improve HD and on the other side, HD in the form of improvements in quantity and quality of labour force contributes and accelerates EGr. Judson (2002) states that even though conventional wisdom does support a positive correlation between output growth and HC, the empirical results are mixed, i.e. the positive correlation between growth and HC has been found exceptionally rather than as a rule. So, examining the causality between HD and EGr for Pakistan is the need of hour.
The contribution of EGr to HD HD is mainly through activities of households, government, NGOs and other civil society. The same level of income can contribute differently to HD. This depends upon the allocation of the income among households, government activities and on the behavior and priorities of these sectors and institutions. Household disposable income directly contributes to the promotion of HD by making more expenditure on basic food, health and education. Poor households and female’s control over cash income households are found to make more expenditures out of their income on HD related items than those with high income group and of male’s control over cash income groups. Poor families and poor households are seen to spend less on education item of HD.
Birdsall (1985), Behrman and Wolfe (1987a, b), King and Lillard (1987), Deolalikar (1993) and Alderman, Behrman Khan, Ross and Sabot (1996a, b) have empirical proved for many countries including India and Pakistan that family earnings changes exerted a positive impact on child’s schooling. On the other hand, improvements in HD depend upon government’s expenditure on social sector and how much of the total public expenditure goes to HD related items especially on basic education and health. On the other hand, NGOs do contribute to HD by deriving resources from both domestic as well as foreign private and government donations. The effectiveness of NGOs varies from country to country. In some regions of the world, their role is just supplementary, but in other few countries (e.g. BRAC and Grameen Bank in Bangladesh, The Harambee School in Kenya and Peru’s Comedores Populares), NGOs appeared as a major factor in the improvement and enhancement of HD (Riddell, Robinson, deConinck, Muir and White, 1995). Ghazali Education Trust (GET), Beaconhouse education system and Zindagi seem to improve and enhance HD in Pakistan.
High level of HD (in the form of improved health, nutrition and quality education) can contribute more to EGr. High level of HD affects the EGr by enhancing people’s choices, capabilities, creativity and hence productivity. Better health and quality labour force education are the main determinants of exports and output growth. They also help in the proper and better utilization of foreign borrowed technology very effectively. On one hand, quality secondary and tertiary education proved it to facilitate the acquisition of skills and managerial capabilities and on other hand, its contribution towards technological
6
capability and technical change in industries is obvious and very important. The role of better health and quality education cannot be ignored in the exports growth that affects the EGr. So there exists a positive significant correlation between EGr and exports. Ranis, Stewart and Ramirez (1997) explored the linkage between HD and EGr for the time period 1970-92. Their finding implied that, although both EGr and HD should be promoted jointly, but HD be given sequential priority.
According to Narayan and Smyth (2004), exports can promote HC accumulation in developing countries through three main channels. Firstly, exports, being the important component of trade help in facilitating transmission of technology to developing countries from developed countries. Transfer of technology is biased in favour skilled labour and induces investment in HC (Pissarides, 1997). Secondly, export is a source of learning by doing. Thirdly, the diffusion of soft and hard technologies including marketing, production and management expertise can be promoted by exports which in turn accelerate the productivity of factors of production such as labour and capital (Grossman and Helpman, 1991; Kim, 1998). Improvements in HC can Granger cause exports. Improvements in HC stock can increase the quality of workforce that, in turn, raises the labour productivity and accelerates further exports and hence EGr (Chuang, 2000). Gould and Ruffin (1995), Hanson and Harison (1995) and Stokey (1996) conducted studies for different countries and for different time periods and suggested that HC accumulation was accelerated and promoted by trade and vice versa.
Expansion in exports can increase growth through a variety of channels. ‘Export-led growth hypothesis’ is one of them. ‘Export-led hypothesis’ postulates that exports expansion is vital to EGr. It raises investment and employment opportunities, production efficiency, technological advancement, and hence EGr. On the other way, EGr can also increase exports (see Ahmed, 2001; Afzal, Rehman and Rehman, 2008). Jung and Marshall (1985) argued that the internally generated growth better explained exports growth. New trade theories also support growth causing exports hypothesis (e.g. see Helpman and Krugman, 1990). It is concluded from the above discussion that high exports economies also perform well in their growth rate of GDP. Such type of linkages between EGr and exports induce the researchers to examine the causality between the two.
Empirical analysis based on bivariate causality framework on both the hypotheses has provided the diverse results. However, a few studies have been found in literature that tested causality between the HD and EGr. The studies that tested the bivariate causality between HD and EGr include De Meulemuster and Rochat (1995) for six developed countries including Sweden, UK, Japan, France, Italy and Australia, In and Doucouliagos (1997) for US, and Asteriou and Agiomirgianakis (2001) for Greece. All the studies conducted for developed countries provide mix results about unidirectional and bidirectional causality. Lee and Lee (1995) utilized secondary school achievement test score as a direct measures of HC for 17 developed and developing countries including India, Iran and found that the higher initial HC stock per worker led to higher economic growth per worker. A few studies have been carried out for the developing countries. A study conducted for Pakistan by Khan et al. (1991) found one-way Granger causality running from literacy to productivity for Pakistan. Narayan and Smyth (2004) tested temporal bivariate causality between real income and HC in a co-integrated VAR processes for China for the time period 1960 to 1999 and found the evidence of log run Granger causality running from HC to real income while the short run one way causality running from real income to HC was observed.
7
A few studies also exist in literature that have tested the causal link between exports and EGr by including HD as a third variable in a multivariate framework. Chuang (2000) tested the casual linkages among exports, HC and EGr for Taiwan for the period 1952-95. He found the bidirectional casualty between exports and HC accumulation. HC based endogenous growth theory and export-led growth hypothesis were found valid in case of Taiwan. Narayan and Smyth (2004) employed co-integration and error correction techniques to test the casualty among real income, real exports and HC stock for China using annual data over the period 1960 to 1999 and found evidence of co-integration among real income, real exports and HC when real exports served as dependent variable and HC and real income are taken as independent variables. They found (i) the evidence of short run bi-directional Granger causality between HC and real exports, (ii) uni-directional Granger causality running from real income to HC and (iii) no evidence of Granger causality between real exports and real income. Furthermore their results do not support the ‘export-led growth hypothesis’.
In the present study, the validity of ‘growth-driven exports’ and ‘export-led growth hypotheses’ are examined in case of Pakistan by including HD as a third variable. In addition, the validity of human-based endogenous growth theory is also tested for Pakistan.
III. MODEL SPECIFICATION, METHODOLOGY AND DATA SOURCES
This study employs annual time series of real gross domestic product (RGDP), real exports (RX), physical capital (PC) and human development (HD) in Pakistan for the period 1970-71 to 2008-09, drawn from various issues of Pakistan Economic Survey and Annual Reports of State Bank of Pakistan. A time series for HDI for the period 1970-71 to 2008-09 has been constructed by using UNDP methodology developed in 1999-2000. The variables GDP and exports have been converted into real terms by GDP deflator and export prices, respectively. Where as physical capital (PC) has been measured by the real fixed capital formation.
Keeping in view the theoretical postulates of the relationship among RGDP, PC, RX and HD the following models have been specified as:
ln RGDP = f (ln PC, ln RX, ln HD) (1)
ln RX = f (ln PC, ln RGDP, ln HD) (2)
ln HD = f (ln PC, ln RGDP, ln RX) (3)
Where ln stands for natural logarithm, and
RGDP = Real GDP; a measure of economic growth: current GDP at market prices is deflated by GDP deflator.
PC = Since time series data on capital stock is not directly available for Pakistan. Physical capital is proxied by real value of gross fixed capital formation. GFCF deflated by GDP deflator; a proxy used to measure real physical capital. “Fixed capital formation measures both private and public national investment” (Balasubramanyam, Salisu and Sapsford, 1996; Hansen and Rand, 2006). This proxy for real PC has been used by Kohpaiboon (2004) and Mansouri (2005).
8
RX = Real exports; an important component of trade and is considered as important ingredient of progress and prosperity of a nation. Here exports are converted into real exports by using unit value indexes of exports.
HD = HDI; a composite measure of human development
The Model 1 is a kind of production function augmented by RX and HD. The relationship among variables under consideration is expected to be positive.
In literature human capital development was measured by using different proxy variables like labour force employment, average years of schooling, educational attainments, the number of employed workforce with tertiary education, public expenditures on education and health, R&D expenditures, secondary school achievement test scores and literary rates etc., however, these proxy variables cannot fully capture the notion of HD and has been questioned and criticized (e.g. see Judson, 2002). In order to capture the effect of HD on EGr, a direct and more reliable measure of HD is needed. In this study, a composite measure of HD known as HDI is constructed by using UNDP latest methodology for the period 1970-71 to 2008-09.
Several methods such as residual based Engle-Granger (1987) test, Johansen (1988), Johansen-Juselius (1990), Gregory and Hansen (1996), Saikkonen and Lutkepohl (2000), and ARDL approach to cointegration are available in literature. Since this study aims at detecting SR and LR linkages between EGr, HD and exports, it uses a relatively new estimation technique known as Bounds Testing Approach to Cointegration within ARDL framework. A brief description of ARDL approach is given below:
AUTOREGRESSIVE DISTRIBUTIVE LAG (ARDL) APPROACH TO COINTEGRATION
The Proposed ARDL approach to cointegration is developed by Pesaran and Pesaran (1997), Pesaran and Shin (1995 and 1998) and further advanced by Pesaran et al. (2001). It is a unification of autoregressive models and distributed lag models. In an ARDL model, a time series is a function of its lagged values and current and lagged values of one or more explanatory variables. There are several benefits for the use of ARDL approach to cointegration. Bivariate cointegration test and multivariate cointegration techniques given by Stock and Watson (1988), Johansen (1988, 1991) and Johansen and Juselius (1990) perform better for large samples. However, ARDL technique to cointegration is more appropriate for small samples (30 to 80 values). ARDL technique to cointegration not only can distinguish dependent and explanatory variables (i.e. it avoids the problem of endogeneity) but also ARDL method can simultaneously estimate the LR and SR components of the model. This technique also removes the problems related to omitted variables and autocorrelation. The parameter estimates obtained from the ARDL approach are unbiased and efficient because they avoid the problems that may arise due to serial correlation and endogeneity (Pesaran, Shin and Smith, 2001).
A dynamic error correction model (ECM) through linear transformation can be derived from ARDL (Banerjee et al., 1993) that permits to draw inference for LRestimates that is not available in other alternative cointegation procedures (Sezgin and Yildirim, 2002).
ARDL approach to cointegration has some superiority over Engle and Granger (1987) single equation cointegration technique. The ARDL method to cointegration can be
9
applied irrespective of whether the regressors are of I(0), I(1) or mutually integrated but it is still prerequisite that the dependent variable is of I(1) in levels and none of the explanatory variables is I(2) or higher order. In ARDL procedures to cointegration, different variables may have diverse optimal number of lags, which in other standard cointegration techniques like Johansen type approaches, is not possible. Apart from the superiority of ARDL model over other cointegration techniques, this study preferred to apply ARDL approaches to cointegartion because of the following two main reasons:
(i) Bounds test procedure’s results are robust in case of small or finite samples (i.e. 30 to 80 observations as is the case in this study).
(ii) Real income and real exports variables are of I(1), while HDI is I(0) or fractionally integrated.
All these justify the application of ARDL model to determine the relationship among EGr, HD and exports in Pakistan.
BOUNDS TESTING APPROACH TO COINTEGRATION
The 2nd stage procedure of this paper involves the testing of the existence of short-run (SR) and long-run (LR) relationship between real gross domestic product (RGDP), real exports (RX), physical capital (PC) and human capital (HD) within a multivariate framework. To examine the existence of SR and LR relationship the error-correction version of ARDL model of equation 1, 2, and 3 by following Pesaran and Pesaran (1997: 397-9) and Pesaran and Shin, 1999), can be used as:
ln (Y) = a0Y + n
iiYb
1
ln (Y)t–i + n
iiYc
0
ln (PC)t–i + n
iiYd
0
ln (RX)t–i
+ n
iiYe
0
ln (HD)t–i + d1Y ln Yt–1 + d2Y ln PCt–1 + d3Y ln RXt–1
+ d4Y ln (HDt–1) (4)
ln (RX) = a0RX + n
iiRXb
1
ln (RX)t–i + n
iiRXc
1
ln (PC)t–i +
n
iiRXd
0
ln (Y)t–i + n
iiRXe
0
ln (HD)t–i + d1RX ln RXt–1 +
d2RX ln PCt–1 + d3RX ln Yt–1 + d4RX ln HDt–1 (5)
ln (HD) = a0HD + n
iiHDb
1
ln (HD)t–i + n
iiHDc
1
ln (PC)t–i +
n
iiHDd
0
ln (Y)t–i + n
iiHDe
0
ln (RX)t–i + d1HD ln HDt–1 +
d2HD ln PCt–1 + d3HD ln Yt–1 + d4HD ln RXt–1 (6)
The coefficients (a, b, c, d, e) of part first of equations (4, 5 and 6) measure the SR dynamics of the model whereas ds represent the LR relationships.
ARDL model uses a three-step procedure:
(a) Dynamic analysis
(b) Long-run relationship
10
(c) ECM analysis
The 1st step in the ARDL approach to cointegration is to examine LR relationship among the variables by carrying out familiar F-test on the differenced variables components of Unrestricted Error Correction Mechanism (UECM) model for the joint significance of the coefficients of lagged level of the variables. In this first step, the regression equation estimated for the dependent variable RGDP (Y) is defined as
ln (Y) = a0Y + n
iiYb
1
ln (Y)t–i + n
iiYc
1
ln (PC)t–i + n
iiYd
0
ln (RX)t–i
+ n
iiYe
0
ln (HD)t–i (7)
To create error correction mechanism in this step, the first lag of the level of each variable is added to the equation (7) and a variable Addition Test is conducted by calculating F-test on the joint significance of all the added lagged level variables.
ln (Y) = a0Y + n
iiYb
1
ln (Y)t–i + n
iiYc
0
ln (PC)t–i + n
iiYd
0
ln (RX)t–i
+ n
iiYe
0
ln (HD)t–i + d1Y ln Yt–1 + d2Y ln PCt–1 + d3Y ln RXt–1
+ d4Y ln (HDt–1) (8)
The null hypothesis of no cointegration for RGDP against alternative hypothesis is tested by taking into account the UECM model as:
H0: d1Y = d2Y = d3Y = d4Y = 0
H1: None of the coefficients (d1Y, d2Y, d3Y, d4Y) = 0
This is denoted as FY (Y|PC, RX, and HD).
In equation (2) where exports is the regressand, the null hypothesis of no cointegration for exports against alternative hypothesis of cointegration is as under:
H0: d1RX = d2RX = d3RX = d4RX = 0
H1: None of the coefficients (d1RX, d2RX, d3RX, d4RX) = 0
and is denoted as FRX (RX| Y, PC, HD)
In equation (3), where HC is the dependent variable, the null hypothesis of no cointegration against alternative hypothesis of cointegration is as under:
H0: d1HD = d2HD = d3HD = d4HD = 0
H1: None of the coefficients (d1HD, d2HD, d3HD, d4HD) = 0
and is denoted as FHD (HD| Y, PC, RX)
The above hypotheses can be tested by applying standard F-statistic. However, the asymptotic distribution of this F-statistic is non-standard irrespective of whether the variables included in the model are I(0) or I(1). The value of F depends upon (i) number of explanatory variables, (ii) intercept and/or a trend of ARDL, and (iii) sample size. Pesaran et al. (2001) have “tabulated two sets of appropriate critical values. One set assumes all variables are I(1) and another assumes that they are all I(0). This provides a band covering all possible classifications of the variables into I(1) or I(0) or even fractionally integrated.”
11
Critical values of Pesaran et al. (2001) are valid for large sample while Narayan (2005) and Tuener (2006) have provided two sets of critical values for small sample size (30 to 80 observations).
The value of F-statistic found from the data is then compared to the non-standard two sets of critical bound values developed by Pesaran et al. (2001). This comparison is made as follows. If the calculated value of F-statistic lies outside the critical bounds then a conclusive decision about cointegration can be made having no knowledge of order of integration of the regressors. If the calculated value of F-statistic is bigger than the asymptotically upper bound value, cointegration will establish. On the other hand, cointegration is not established if the calculated value of F-statistic is smaller than the critical lower bound value. The F-test becomes inconclusive about cointegration if the value of F-statistic lies between the critical lower and upper bounds values. In such cases, the order of integration of the variables under consideration is checked by following the procedure developed by Johansen and Juselius (1990) for detection of cointegration. When the order of integration of the variables under consideration is known already and the variables are of I(1) upper bounds are used to make the decision. The decision of optimum lag length can be made by using either Akaike Information Criteria or Schwartz-Bayesian criteria or R-bar criteria or Human-Quinn criteria. In case of inclusive situation, use of ECM version of ARDL model is regarded as the efficient way of establishing cointegration by Kremers et al. (1992) and Bannerjee et al. (1998). Cointegration is established if the ECM coefficient is negative and highly significant.
Stability of the model is checked as the second step in ARDL bounds testing procedure. After establishing cointegration, the model based on equation (4) to equation (6) is estimated by using an appropriate lag criterion such as Akaike Information Criterion or Schwarz Bayesian criteria. Completion of second stage gives estimates of LR elasticities as well as enables the use of CUSUM and CUSUM Sum of Squares tests to the residuals of equation (4) to equation (6) for testing the stability of LR elasticities along with SR dynamics.
To establish the stability of SR estimated coefficients of the first differenced variables as well as LR parameters, CUSUM and CUSUM Sum of Squares tests proposed by Brown et al. (1975) were employed by Pesaran and Pesaran (1977). The statistics of CUSUM and CUSUM Sum of Squares are updated recursively and are plotted against the break points after breaking the sample period. The coefficient estimates are called stable if the plot of CUSUM and CUSUM Sum of Squares stay within 5% significance level (portrayed by two straight lines based on equations developed by Brown et al. (1975).
Though the existence of LR relationship among the variables is of very interest, it may be even more relevant to examine the SR dynamics. So the next step of the analysis is the formulation of ECM, as has been done previously in the 2nd stage procedure of the paper. ECM best describes the SR dynamics consistently with the LRrelationship. The coefficient of ECM(–1) term known as adjustment parameter indicates speed of adjustment and the negative sign and its highly statistical significant confirms cointegration and determines the LRcausal effect. The negative sign of the adjustment parameter also ensures stability of the model. The negative and statistical significant sign of the coefficient of ECMt–1 also implies that the series are non-explosive and LR equilibrium is attained.
12
IV. EMPIRICAL RESULTS AND ANALYSIS
UNIT ROOT TESTS
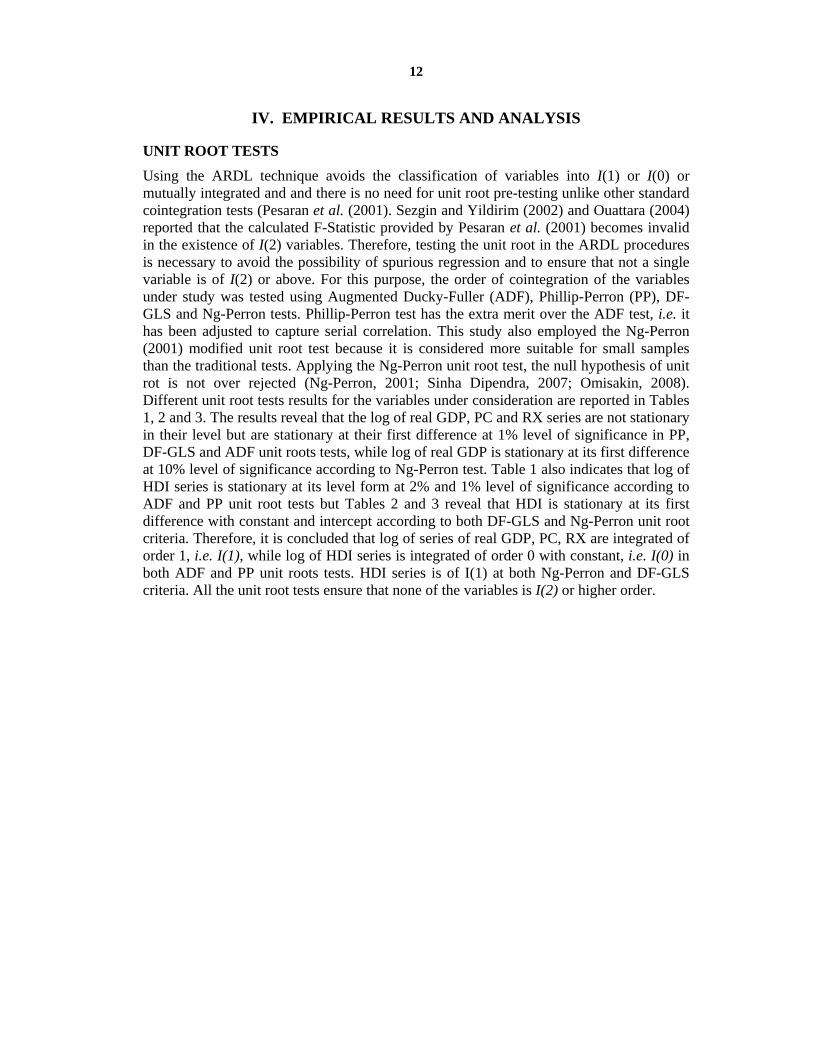
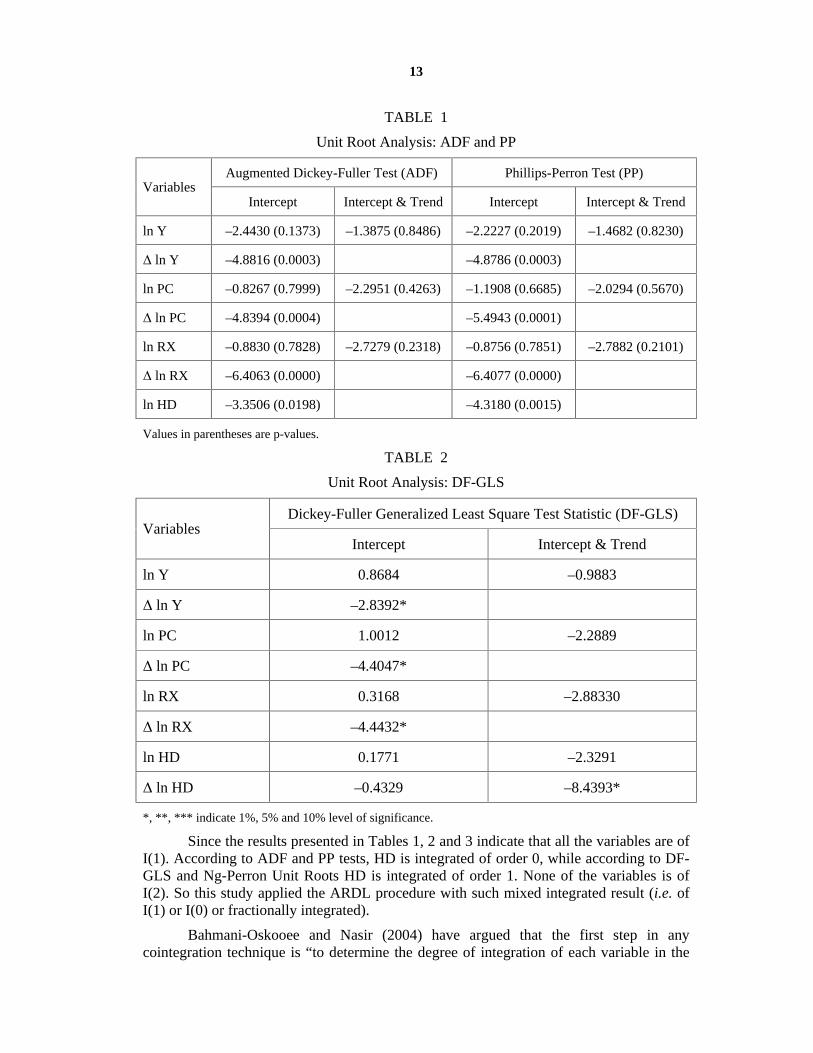
Using the ARDL technique avoids the classification of variables into I(1) or I(0) or mutually integrated and and there is no need for unit root pre-testing unlike other standard cointegration tests (Pesaran et al. (2001). Sezgin and Yildirim (2002) and Ouattara (2004) reported that the calculated F-Statistic provided by Pesaran et al. (2001) becomes invalid in the existence of I(2) variables. Therefore, testing the unit root in the ARDL procedures is necessary to avoid the possibility of spurious regression and to ensure that not a single variable is of I(2) or above. For this purpose, the order of cointegration of the variables under study was tested using Augmented Ducky-Fuller (ADF), Phillip-Perron (PP), DF-GLS and Ng-Perron tests. Phillip-Perron test has the extra merit over the ADF test, i.e. it has been adjusted to capture serial correlation. This study also employed the Ng-Perron (2001) modified unit root test because it is considered more suitable for small samples than the traditional tests. Applying the Ng-Perron unit root test, the null hypothesis of unit rot is not over rejected (Ng-Perron, 2001; Sinha Dipendra, 2007; Omisakin, 2008). Different unit root tests results for the variables under consideration are reported in Tables 1, 2 and 3. The results reveal that the log of real GDP, PC and RX series are not stationary in their level but are stationary at their first difference at 1% level of significance in PP, DF-GLS and ADF unit roots tests, while log of real GDP is stationary at its first difference at 10% level of significance according to Ng-Perron test. Table 1 also indicates that log of HDI series is stationary at its level form at 2% and 1% level of significance according to ADF and PP unit root tests but Tables 2 and 3 reveal that HDI is stationary at its first difference with constant and intercept according to both DF-GLS and Ng-Perron unit root criteria. Therefore, it is concluded that log of series of real GDP, PC, RX are integrated of order 1, i.e. I(1), while log of HDI series is integrated of order 0 with constant, i.e. I(0) in both ADF and PP unit roots tests. HDI series is of I(1) at both Ng-Perron and DF-GLS criteria. All the unit root tests ensure that none of the variables is I(2) or higher order.
13
TABLE 1
Unit Root Analysis: ADF and PP
Augmented Dickey-Fuller Test (ADF) Phillips-Perron Test (PP) Variables
Intercept Intercept & Trend Intercept Intercept & Trend
ln Y –2.4430 (0.1373) –1.3875 (0.8486) –2.2227 (0.2019) –1.4682 (0.8230)
ln Y –4.8816 (0.0003) –4.8786 (0.0003)
ln PC –0.8267 (0.7999) –2.2951 (0.4263) –1.1908 (0.6685) –2.0294 (0.5670)
ln PC –4.8394 (0.0004) –5.4943 (0.0001)
ln RX –0.8830 (0.7828) –2.7279 (0.2318) –0.8756 (0.7851) –2.7882 (0.2101)
ln RX –6.4063 (0.0000) –6.4077 (0.0000)
ln HD –3.3506 (0.0198) –4.3180 (0.0015)
Values in parentheses are p-values.
TABLE 2
Unit Root Analysis: DF-GLS
Dickey-Fuller Generalized Least Square Test Statistic (DF-GLS) Variables
Intercept Intercept & Trend
ln Y 0.8684 –0.9883
ln Y –2.8392*
ln PC 1.0012 –2.2889
ln PC –4.4047*
ln RX 0.3168 –2.88330
ln RX –4.4432*
ln HD 0.1771 –2.3291
ln HD –0.4329 –8.4393*
*, **, *** indicate 1%, 5% and 10% level of significance.
Since the results presented in Tables 1, 2 and 3 indicate that all the variables are of I(1). According to ADF and PP tests, HD is integrated of order 0, while according to DF-GLS and Ng-Perron Unit Roots HD is integrated of order 1. None of the variables is of I(2). So this study applied the ARDL procedure with such mixed integrated result (i.e. of I(1) or I(0) or fractionally integrated).
Bahmani-Oskooee and Nasir (2004) have argued that the first step in any cointegration technique is “to determine the degree of integration of each variable in the
14
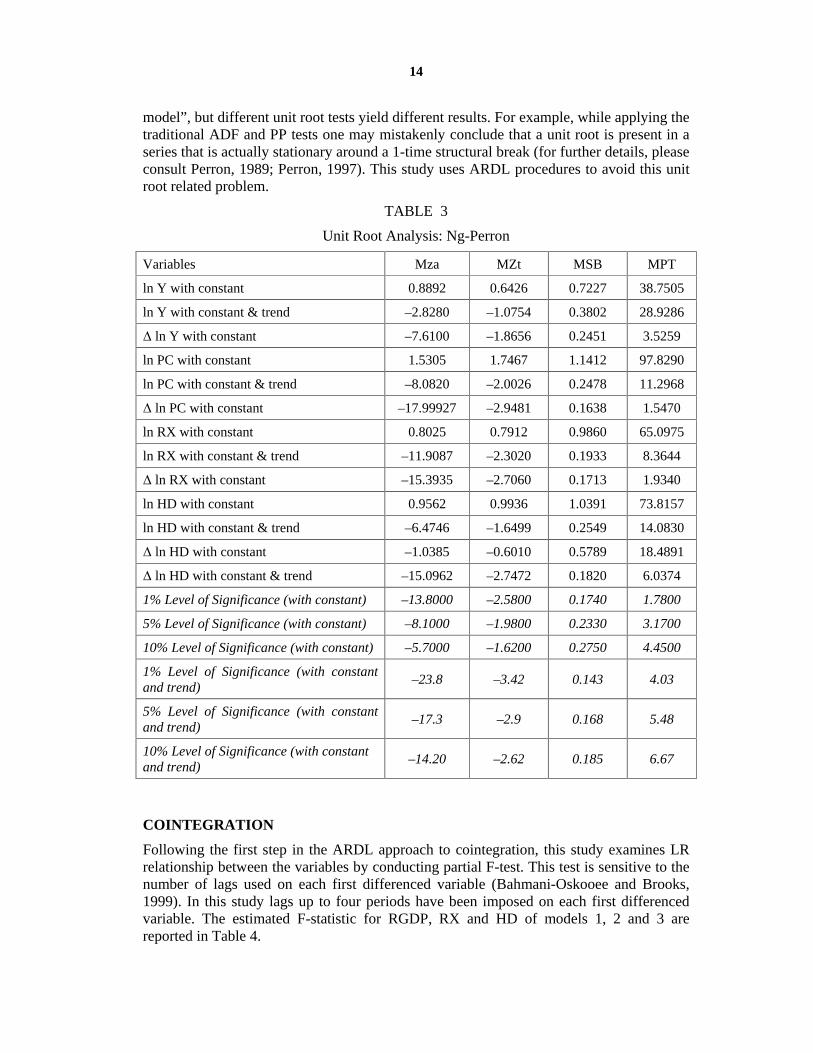
model”, but different unit root tests yield different results. For example, while applying the traditional ADF and PP tests one may mistakenly conclude that a unit root is present in a series that is actually stationary around a 1-time structural break (for further details, please consult Perron, 1989; Perron, 1997). This study uses ARDL procedures to avoid this unit root related problem.
TABLE 3
Unit Root Analysis: Ng-Perron
Variables Mza MZt MSB MPT
ln Y with constant 0.8892 0.6426 0.7227 38.7505
ln Y with constant & trend –2.8280 –1.0754 0.3802 28.9286
ln Y with constant –7.6100 –1.8656 0.2451 3.5259
ln PC with constant 1.5305 1.7467 1.1412 97.8290
ln PC with constant & trend –8.0820 –2.0026 0.2478 11.2968
ln PC with constant –17.99927 –2.9481 0.1638 1.5470
ln RX with constant 0.8025 0.7912 0.9860 65.0975
ln RX with constant & trend –11.9087 –2.3020 0.1933 8.3644
ln RX with constant –15.3935 –2.7060 0.1713 1.9340
ln HD with constant 0.9562 0.9936 1.0391 73.8157
ln HD with constant & trend –6.4746 –1.6499 0.2549 14.0830
ln HD with constant –1.0385 –0.6010 0.5789 18.4891
ln HD with constant & trend –15.0962 –2.7472 0.1820 6.0374
1% Level of Significance (with constant) –13.8000 –2.5800 0.1740 1.7800
5% Level of Significance (with constant) –8.1000 –1.9800 0.2330 3.1700
10% Level of Significance (with constant) –5.7000 –1.6200 0.2750 4.4500
1% Level of Significance (with constant and trend)
–23.8 –3.42 0.143 4.03
5% Level of Significance (with constant and trend)
–17.3 –2.9 0.168 5.48
10% Level of Significance (with constant and trend)
–14.20 –2.62 0.185 6.67
COINTEGRATION
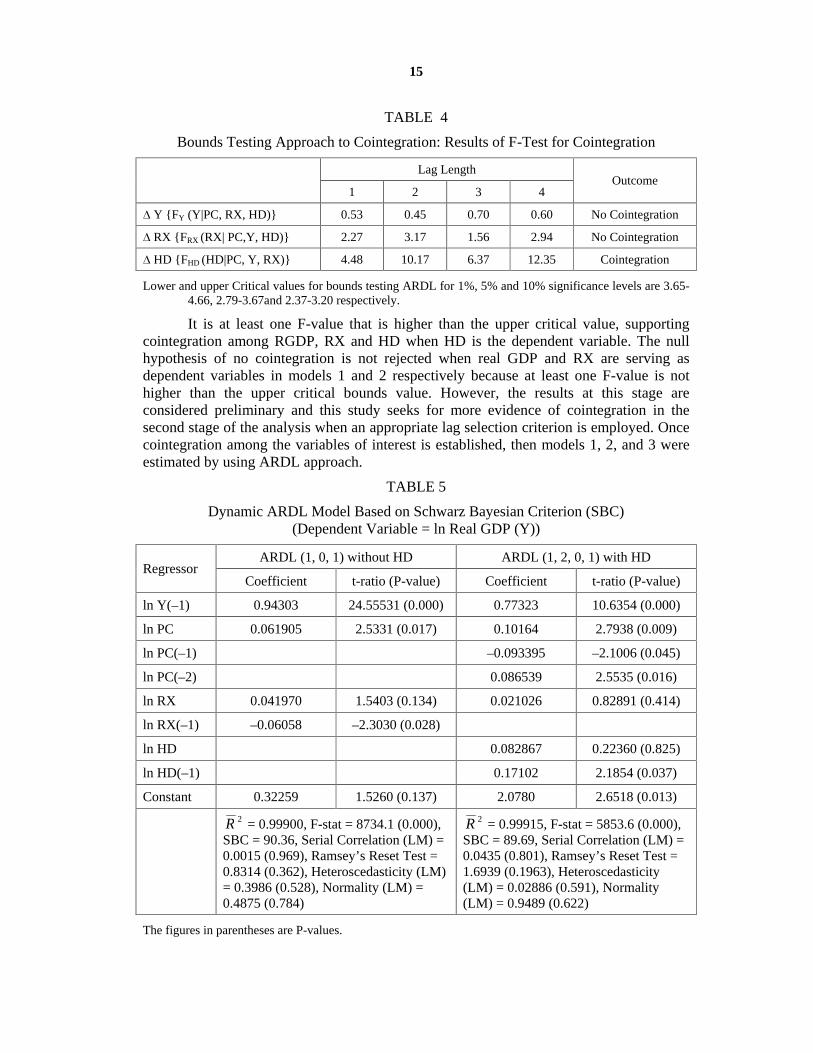
Following the first step in the ARDL approach to cointegration, this study examines LR relationship between the variables by conducting partial F-test. This test is sensitive to the number of lags used on each first differenced variable (Bahmani-Oskooee and Brooks, 1999). In this study lags up to four periods have been imposed on each first differenced variable. The estimated F-statistic for RGDP, RX and HD of models 1, 2 and 3 are reported in Table 4.
15
TABLE 4
Bounds Testing Approach to Cointegration: Results of F-Test for Cointegration
Lag Length
1 2 3 4
Outcome
Y {FY (Y|PC, RX, HD)} 0.53 0.45 0.70 0.60 No Cointegration
RX {FRX (RX| PC,Y, HD)} 2.27 3.17 1.56 2.94 No Cointegration
HD {FHD (HD|PC, Y, RX)} 4.48 10.17 6.37 12.35 Cointegration
Lower and upper Critical values for bounds testing ARDL for 1%, 5% and 10% significance levels are 3.65-4.66, 2.79-3.67and 2.37-3.20 respectively.
It is at least one F-value that is higher than the upper critical value, supporting cointegration among RGDP, RX and HD when HD is the dependent variable. The null hypothesis of no cointegration is not rejected when real GDP and RX are serving as dependent variables in models 1 and 2 respectively because at least one F-value is not higher than the upper critical bounds value. However, the results at this stage are considered preliminary and this study seeks for more evidence of cointegration in the second stage of the analysis when an appropriate lag selection criterion is employed. Once cointegration among the variables of interest is established, then models 1, 2, and 3 were estimated by using ARDL approach.
TABLE 5
Dynamic ARDL Model Based on Schwarz Bayesian Criterion (SBC) (Dependent Variable = ln Real GDP (Y))
ARDL (1, 0, 1) without HD ARDL (1, 2, 0, 1) with HD Regressor
Coefficient t-ratio (P-value) Coefficient t-ratio (P-value)
ln Y(–1) 0.94303 24.55531 (0.000) 0.77323 10.6354 (0.000)
ln PC 0.061905 2.5331 (0.017) 0.10164 2.7938 (0.009)
ln PC(–1) –0.093395 –2.1006 (0.045)
ln PC(–2) 0.086539 2.5535 (0.016)
ln RX 0.041970 1.5403 (0.134) 0.021026 0.82891 (0.414)
ln RX(–1) –0.06058 –2.3030 (0.028)
ln HD 0.082867 0.22360 (0.825)
ln HD(–1) 0.17102 2.1854 (0.037)
Constant 0.32259 1.5260 (0.137) 2.0780 2.6518 (0.013)
2R = 0.99900, F-stat = 8734.1 (0.000), SBC = 90.36, Serial Correlation (LM) = 0.0015 (0.969), Ramsey’s Reset Test = 0.8314 (0.362), Heteroscedasticity (LM) = 0.3986 (0.528), Normality (LM) = 0.4875 (0.784)
2R = 0.99915, F-stat = 5853.6 (0.000), SBC = 89.69, Serial Correlation (LM) = 0.0435 (0.801), Ramsey’s Reset Test = 1.6939 (0.1963), Heteroscedasticity (LM) = 0.02886 (0.591), Normality (LM) = 0.9489 (0.622)
The figures in parentheses are P-values.
16
By using ARDL approach, equation (4) was estimated with and without HD variable in addition to PC and RX. The estimated results are presented in Table 5.
The results of estimated dynamic ARDL models presented in Table 5 clearly support the fact that the RX is not significant in explaining the real GDP in Pakistan. This also seems to refute the ‘export-led growth hypothesis’ in Pakistan.
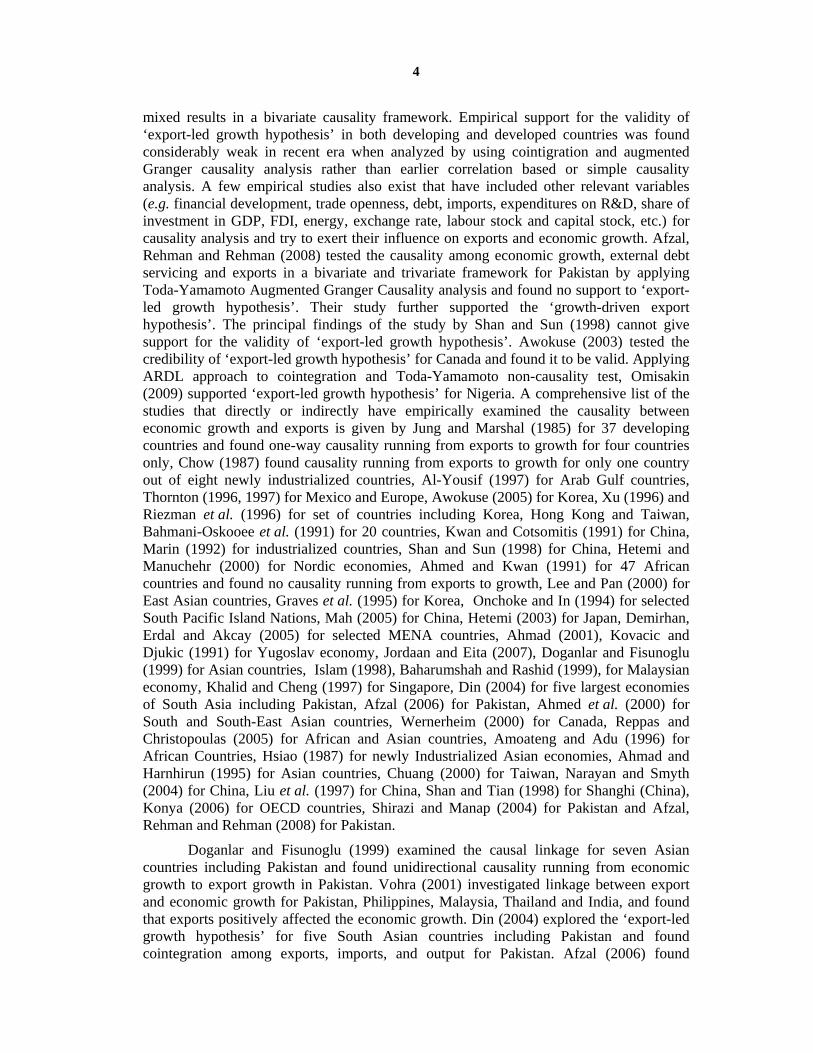
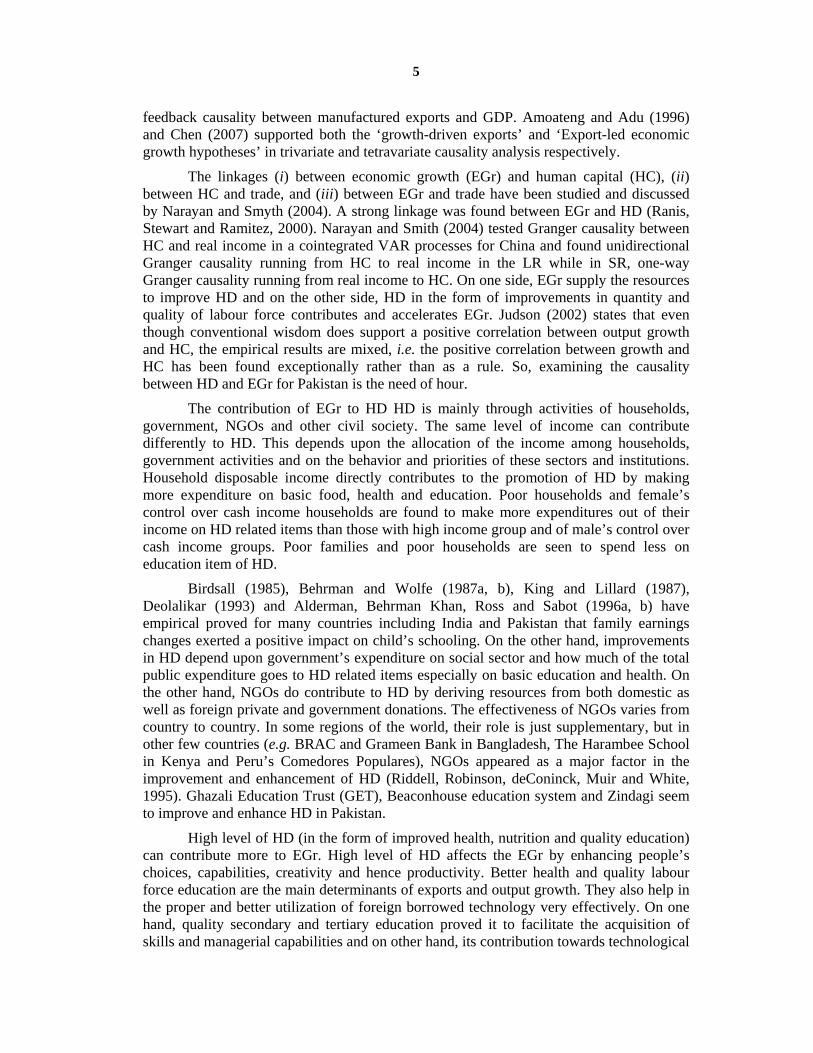
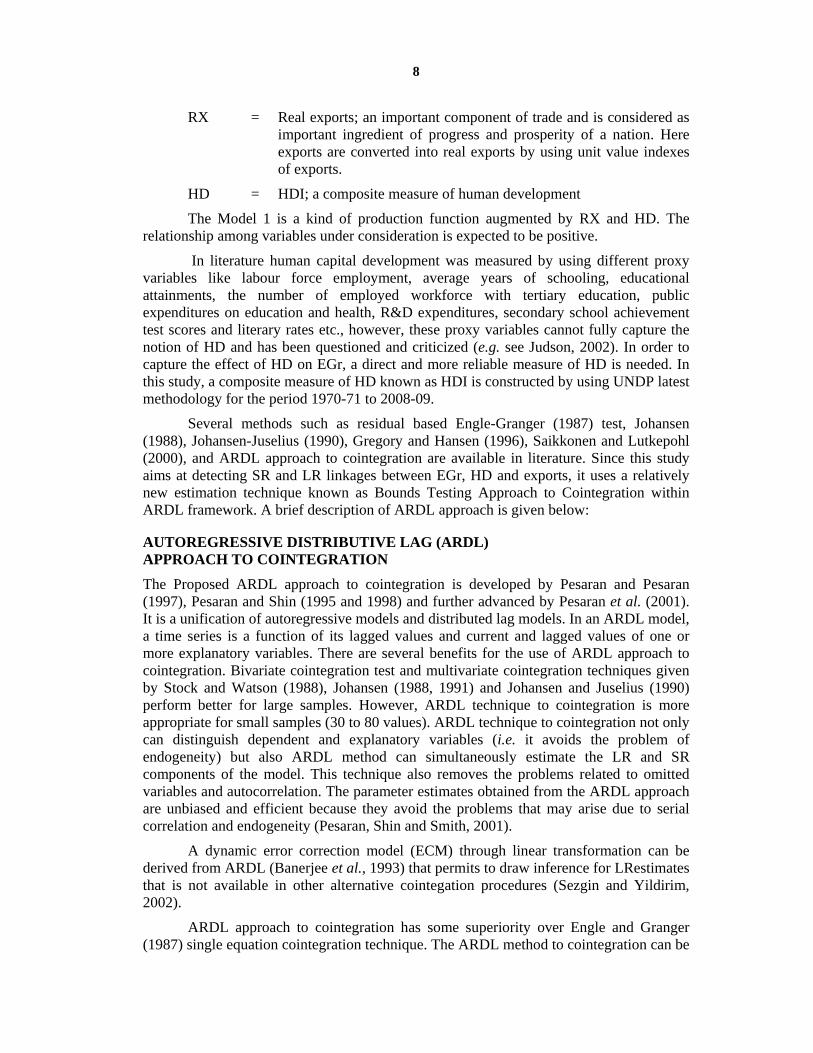
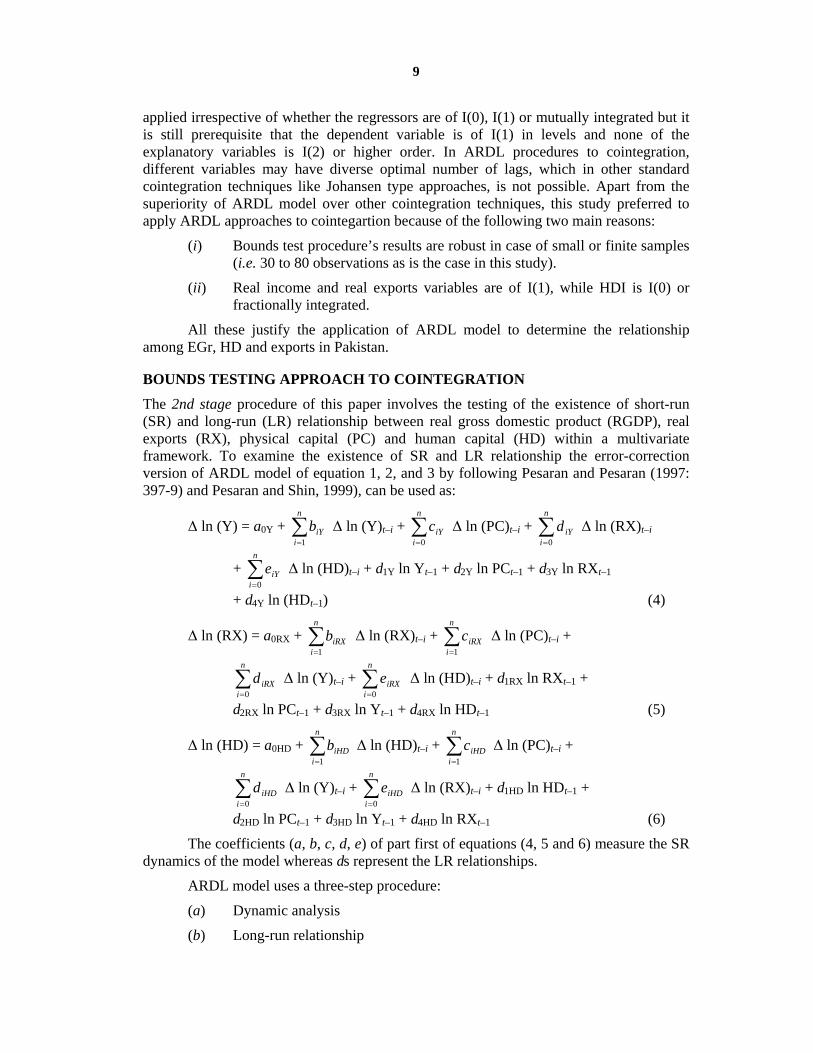
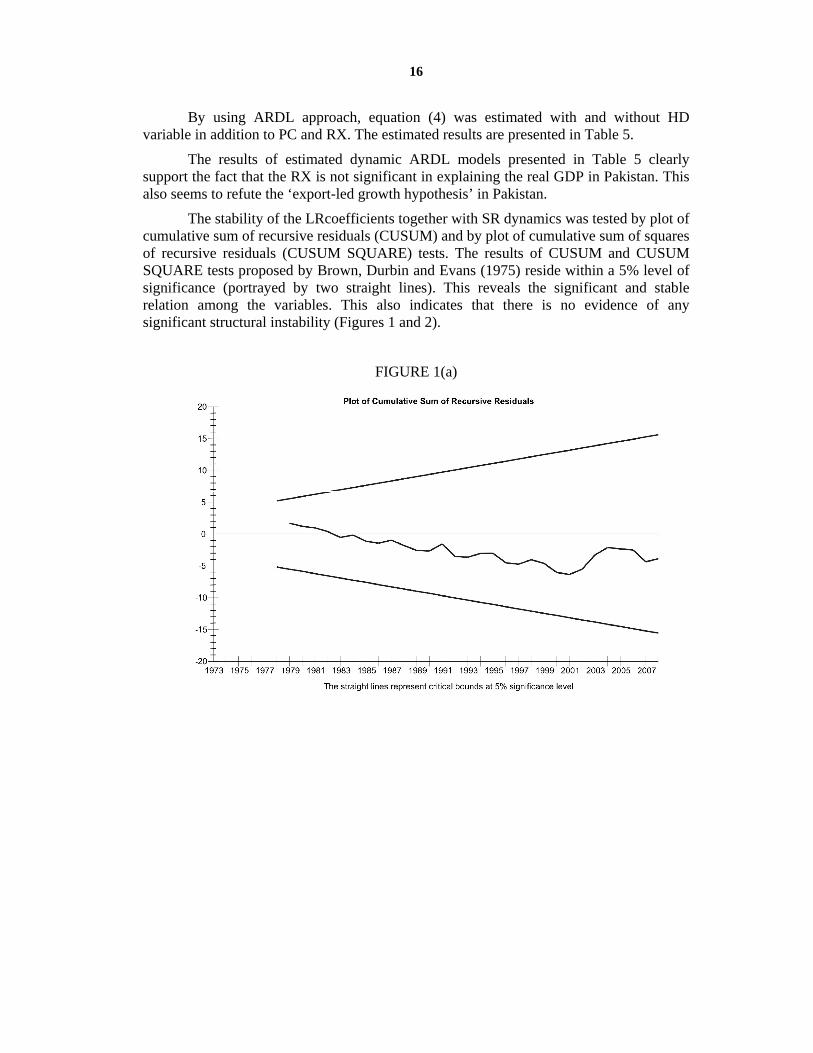
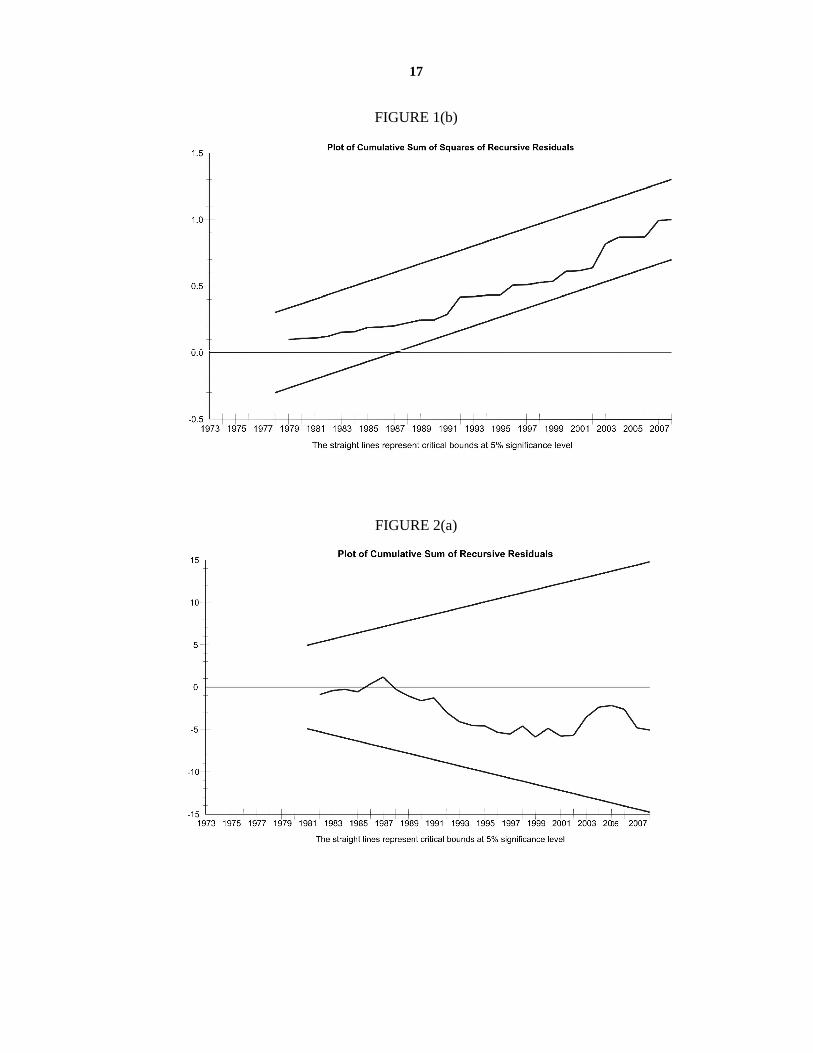
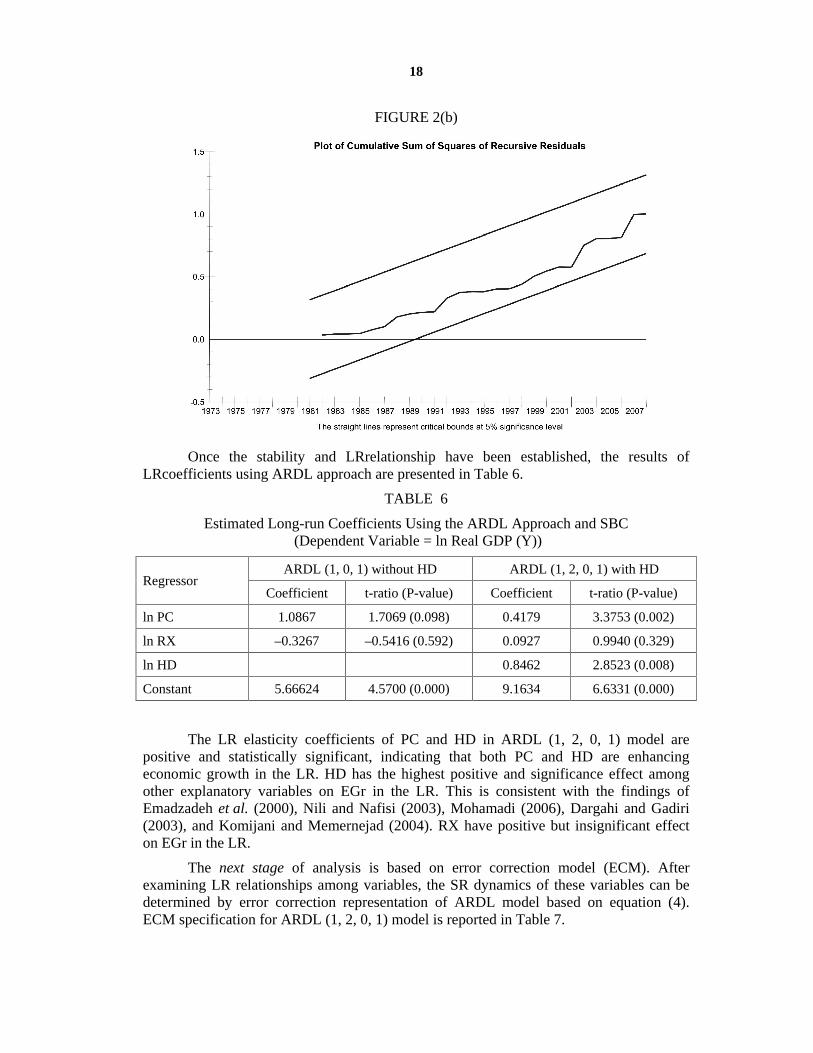
The stability of the LRcoefficients together with SR dynamics was tested by plot of cumulative sum of recursive residuals (CUSUM) and by plot of cumulative sum of squares of recursive residuals (CUSUM SQUARE) tests. The results of CUSUM and CUSUM SQUARE tests proposed by Brown, Durbin and Evans (1975) reside within a 5% level of significance (portrayed by two straight lines). This reveals the significant and stable relation among the variables. This also indicates that there is no evidence of any significant structural instability (Figures 1 and 2).
FIGURE 1(a)
17
FIGURE 1(b)
FIGURE 2(a)
18
FIGURE 2(b)
Once the stability and LRrelationship have been established, the results of LRcoefficients using ARDL approach are presented in Table 6.
TABLE 6
Estimated Long-run Coefficients Using the ARDL Approach and SBC (Dependent Variable = ln Real GDP (Y))
ARDL (1, 0, 1) without HD ARDL (1, 2, 0, 1) with HD Regressor
Coefficient t-ratio (P-value) Coefficient t-ratio (P-value)
ln PC 1.0867 1.7069 (0.098) 0.4179 3.3753 (0.002)
ln RX –0.3267 –0.5416 (0.592) 0.0927 0.9940 (0.329)
ln HD 0.8462 2.8523 (0.008)
Constant 5.66624 4.5700 (0.000) 9.1634 6.6331 (0.000)
The LR elasticity coefficients of PC and HD in ARDL (1, 2, 0, 1) model are positive and statistically significant, indicating that both PC and HD are enhancing economic growth in the LR. HD has the highest positive and significance effect among other explanatory variables on EGr in the LR. This is consistent with the findings of Emadzadeh et al. (2000), Nili and Nafisi (2003), Mohamadi (2006), Dargahi and Gadiri (2003), and Komijani and Memernejad (2004). RX have positive but insignificant effect on EGr in the LR.
The next stage of analysis is based on error correction model (ECM). After examining LR relationships among variables, the SR dynamics of these variables can be determined by error correction representation of ARDL model based on equation (4). ECM specification for ARDL (1, 2, 0, 1) model is reported in Table 7.
19
TABLE 7
ECM Representation for Selected ARDL Model Based on SBC (Dependent Variable = ln Real GDP (Y))
ARDL (1, 0, 1) without HD ARDL (1, 2, 0, 1) with HD
Lag Order Lag Order Variable
0 1 2 0 1 2
ln PC 0.0619
(0.016)** 0.1016
(0.009)*
ln PC(–1)
–0.0865 (0.016)**
ln RX 0.0419 (0.133)
0.0210 (0.414)
ln HD 0.0209 (0.825)
ECM(–1): –0.05697 t-ratio = –1.4833 (0.148) ECM = ln Y – 1.0867 ln (PC) – 0.3267 ln RX – 5.6624
2R = 0.25, F = 5.21 (0.005) DW-statistic = 1.99
ECM(–1): –0.2268 t-ratio = –3.1190 (0.004) ECM = ln Y – 0.4179 ln (PC) – 0.0927 ln RX – 0.8462 ln HD –9.1634
2R = 0.36, F = 5.34 (0.001) DW-statistic = 1.90
Values in parentheses are P-values, and *, **, *** indicate 1%, 5% and 10% level of significance respectively.
The coefficient of lagged error correction term reveals how much rapidly variable returns to equilibrium and it must be statistically significant with negative sign. The absolute value of ECM(–1) indicates speed of adjustment to return to equilibrium and the negative sign shows convergence in the SR dynamic model. The negative and highly significant sign of lagged error correction term (ECM(–1)) is also a more efficient way of establishing cointegration and LR causality. The coefficient of ECM(–1) for ARDL (1,2,0,1) in Table 7 is –0.227 and this means that in each period, 22.7% of shocks can be justified as a LR trend. 22.7% of the deviation from equilibrium is eliminated within one year. The small absolute value of coefficient of ECM(–1), i.e. 22.7%, implies that RGDP is not rapidly adjusted to changes in the LR equilibrium component. This coefficient of ECt–1 in this model is negative and significant at 99% level of confidence. It implies that, in Pakistan, EGr, PC, exports and HD are cointegrated, which is not in line of results presented in Table 4 for cointegration. Moreover, the results presented in Table 7 refute any SR significant of the RX and HD in explaining real GDP. The significant effect of PC on EGr is found in the both SR and LR. The effect of HC is more pivotal in explaining real GDP than both RX and PC in LR as had been expected. So it is recommended that the Government of Pakistan should continue its quest for HC promotion policies. HC-based endogenous growth theory seems valid only in LR. The effect of RX on RGDP is positive both in the LR and SR but not statistically significant. This finding does not seem to support the validity of ‘export-led growth hypothesis’ in case of Pakistan. As a conclusion LR elasticity of PC, RX and HD on RGDP are found to be bigger and more significant
20
than SR counterparts. Tables 5, 6 and 7 also reveal that with the inclusion of HDI as a measure of HD reduces the PC share in real GDP (i.e. from 109% to 42% in LR and from 6.2% to 1.5% in SR) and boosts up over all share of capital (both PC and HC) in determining real GDP in the LR (i.e. from 109% to 126.4%) whereas it improves the robustness of the regression model. The negative LR effect of RX on RGDP also became positive with the inclusion of HD variable.
To assess equation (5), concerning the effects of RGDP, HD, PC and RX, it was estimated by using ARDL approach. The results of dynamic ARDL (1, 1, 0, 0) of model 2 are reported in Table 8.
TABLE 8
Dynamic ARDL Model: ARDL (1, 1, 0, 0) Based on SBC (Dependent Variable = ln Real Exports (RX))
Regressor Coefficient t-ratio (P-value)
ln RX(–1) 0.55473 3.8810 (0.001)
ln PC 0.50768 2.4015 (0.032)
ln PC (–1) –0.59512 –3.1839 (0.003)
ln Y 0.84767 2.0615 (0.048)
ln HD –0.28173 –0.48380 (0.632)
Constant –6.0669 –1.3403 (0.191)
R2 = 0.986, F-stat = 398.07 (0.000), SBC = 25.56, Serial Correlation (LM) = 0.4192 (0.517), Ramsey’s Reset Test = 0.4214 (0.516), Heteroscedasticity (LM) = 0.093 (0.923), Normality (LM) = 1.5869 (0.452)
The figures in parentheses are P-values.
The results of the dynamic ARDL (1, 1, 0, 0) model for RX presented in Table 8 support the hypothesis that both PC and RGDP are significant in the explanation of RX in Pakistan. The results in Table 8 also seem to support the ‘growth-driven hypothesis’ in case of Pakistan.
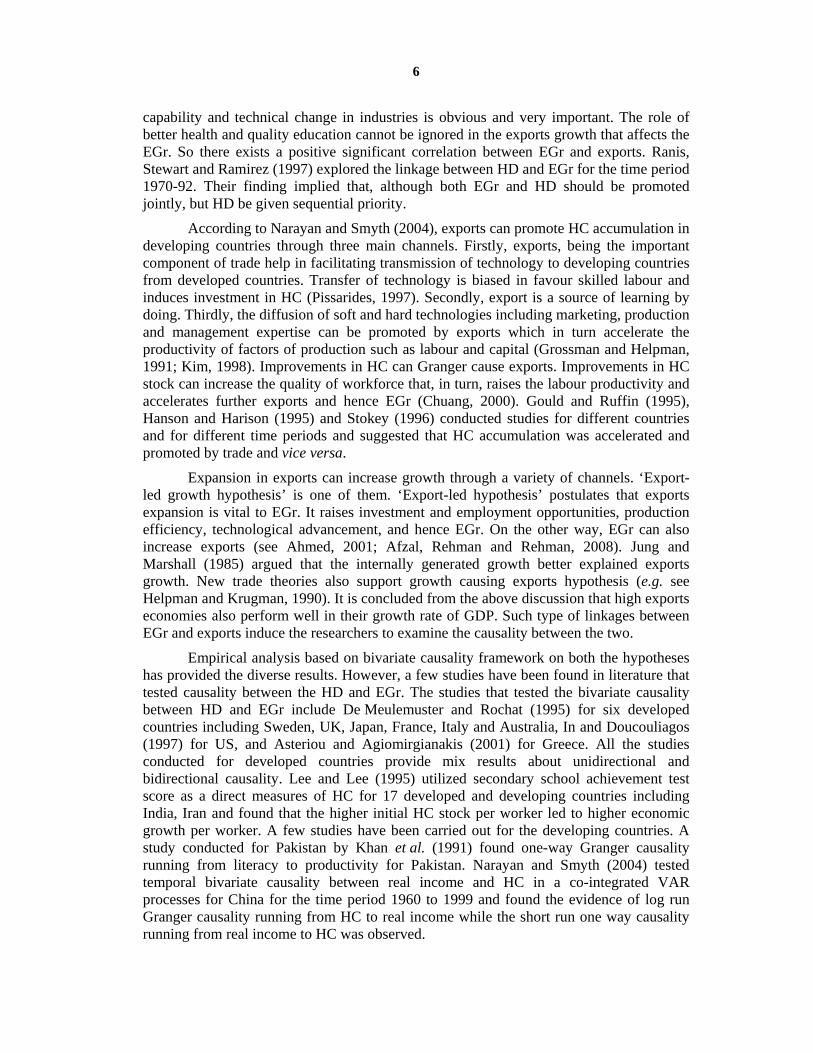
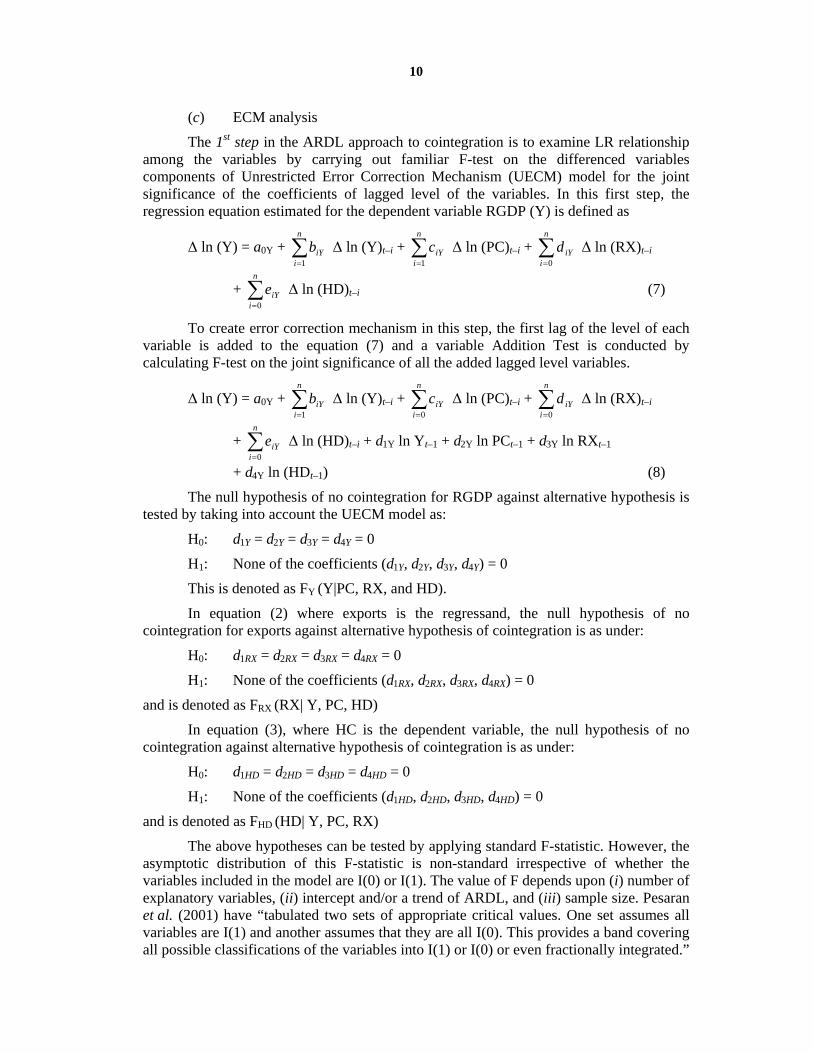
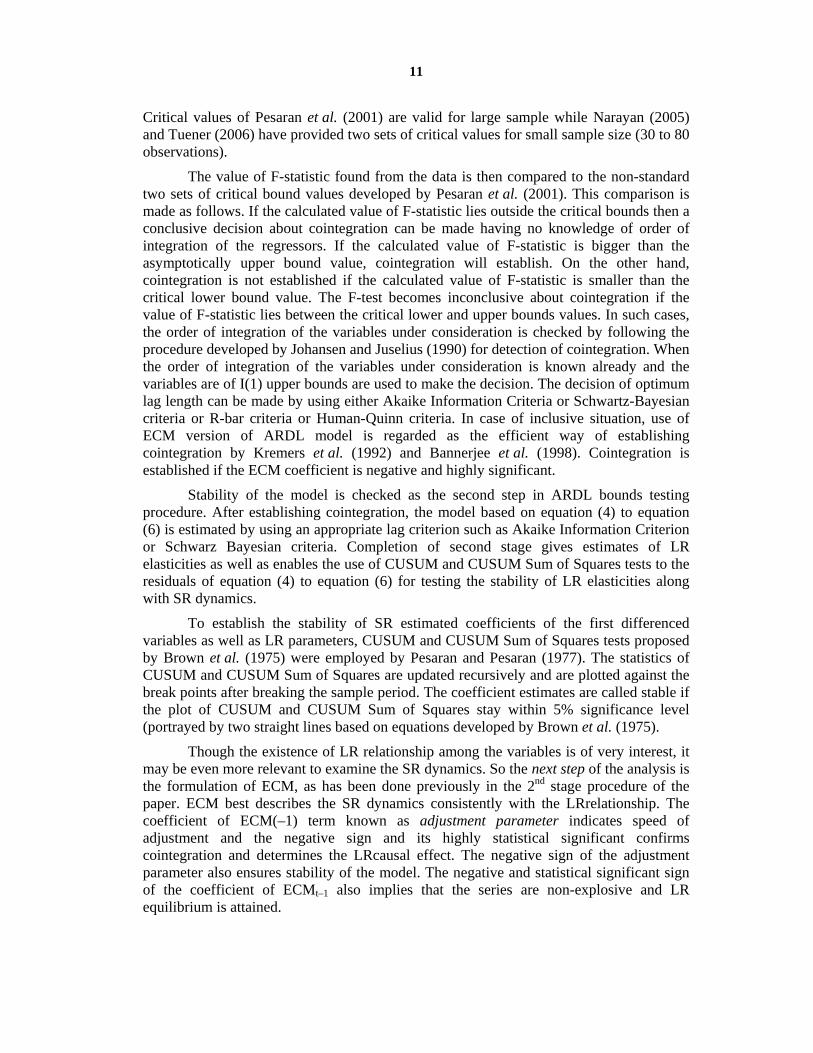
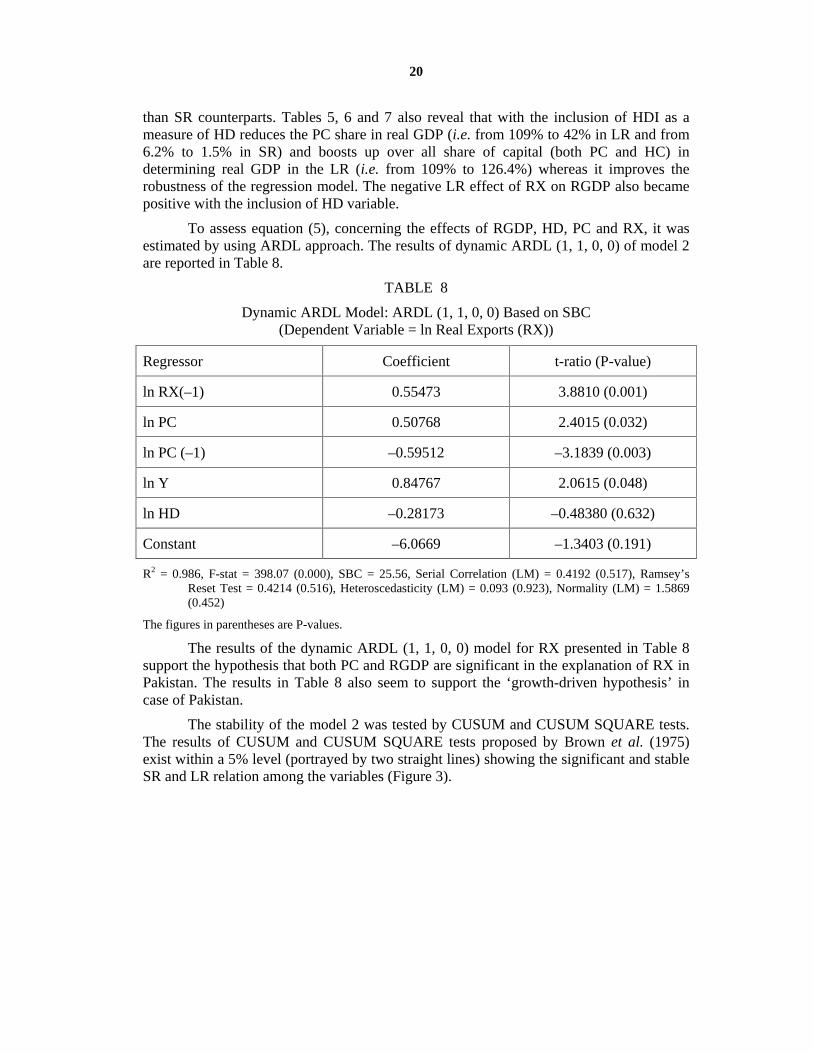
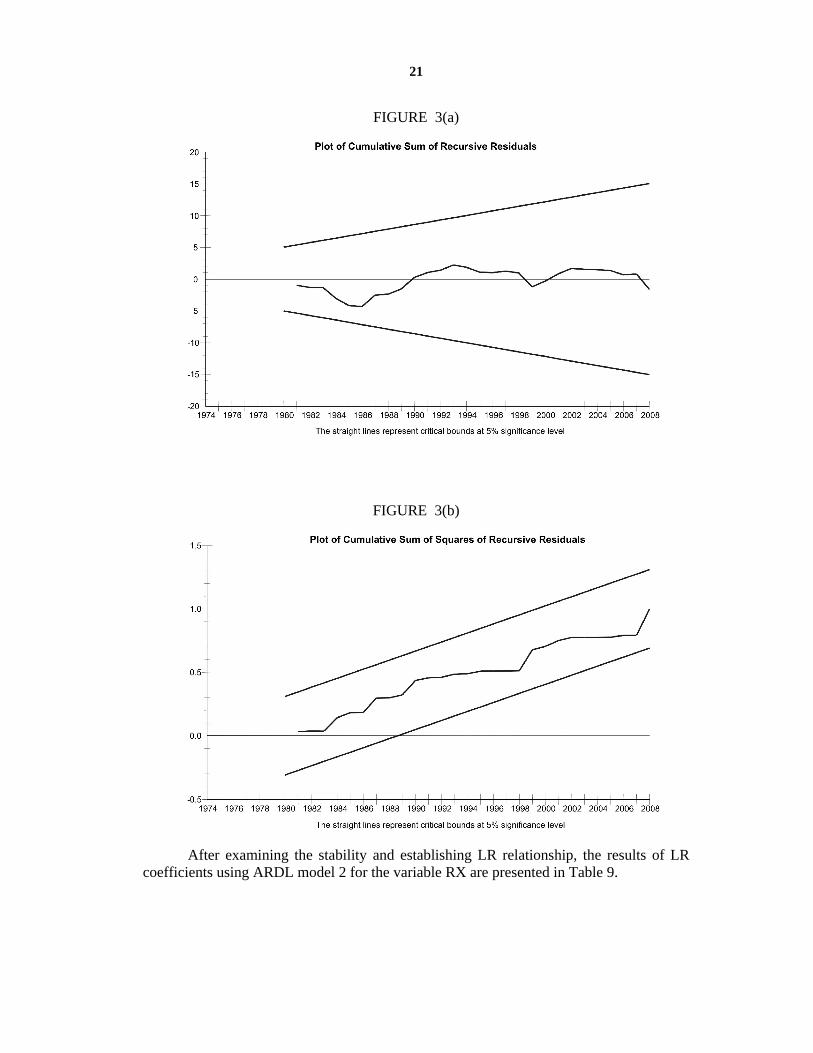
The stability of the model 2 was tested by CUSUM and CUSUM SQUARE tests. The results of CUSUM and CUSUM SQUARE tests proposed by Brown et al. (1975) exist within a 5% level (portrayed by two straight lines) showing the significant and stable SR and LR relation among the variables (Figure 3).
21
FIGURE 3(a)
FIGURE 3(b)
After examining the stability and establishing LR relationship, the results of LR coefficients using ARDL model 2 for the variable RX are presented in Table 9.
22
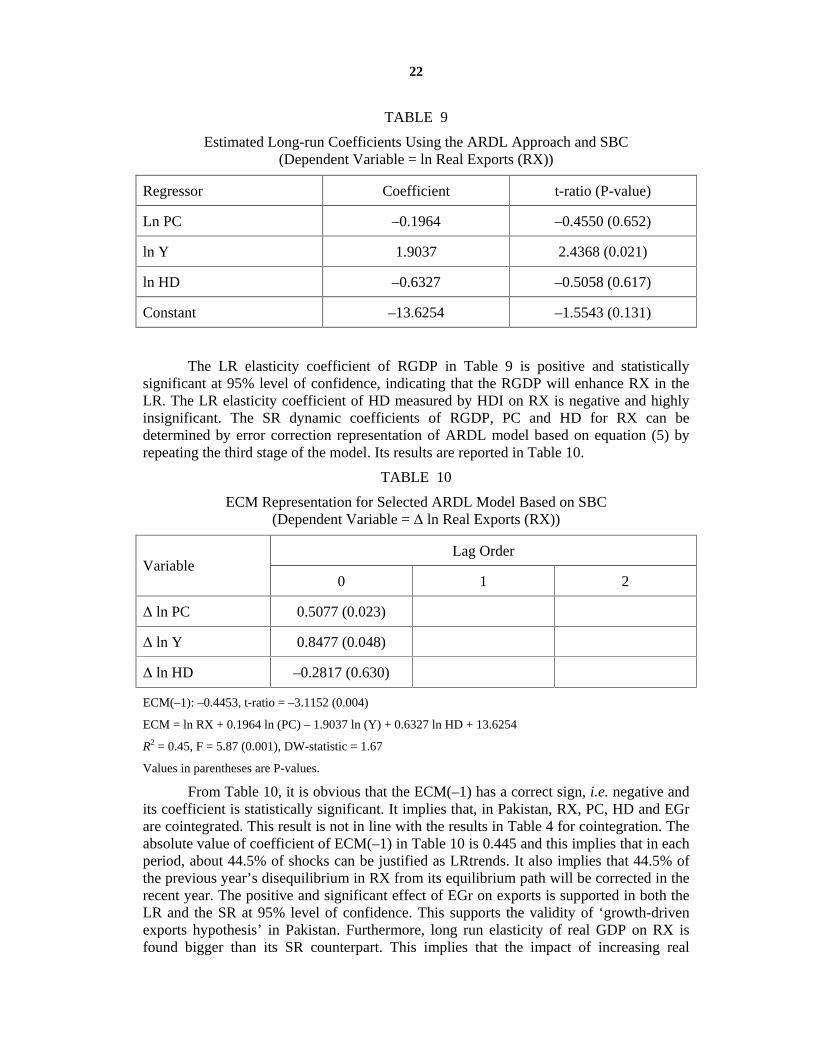
TABLE 9
Estimated Long-run Coefficients Using the ARDL Approach and SBC (Dependent Variable = ln Real Exports (RX))
Regressor Coefficient t-ratio (P-value)
Ln PC –0.1964 –0.4550 (0.652)
ln Y 1.9037 2.4368 (0.021)
ln HD –0.6327 –0.5058 (0.617)
Constant –13.6254 –1.5543 (0.131)
The LR elasticity coefficient of RGDP in Table 9 is positive and statistically significant at 95% level of confidence, indicating that the RGDP will enhance RX in the LR. The LR elasticity coefficient of HD measured by HDI on RX is negative and highly insignificant. The SR dynamic coefficients of RGDP, PC and HD for RX can be determined by error correction representation of ARDL model based on equation (5) by repeating the third stage of the model. Its results are reported in Table 10.
TABLE 10
ECM Representation for Selected ARDL Model Based on SBC (Dependent Variable = ln Real Exports (RX))
Lag Order Variable
0 1 2
ln PC 0.5077 (0.023)
ln Y 0.8477 (0.048)
ln HD –0.2817 (0.630)
ECM(–1): –0.4453, t-ratio = –3.1152 (0.004)
ECM = ln RX + 0.1964 ln (PC) – 1.9037 ln (Y) + 0.6327 ln HD + 13.6254
R2 = 0.45, F = 5.87 (0.001), DW-statistic = 1.67
Values in parentheses are P-values.
From Table 10, it is obvious that the ECM(–1) has a correct sign, i.e. negative and its coefficient is statistically significant. It implies that, in Pakistan, RX, PC, HD and EGr are cointegrated. This result is not in line with the results in Table 4 for cointegration. The absolute value of coefficient of ECM(–1) in Table 10 is 0.445 and this implies that in each period, about 44.5% of shocks can be justified as LRtrends. It also implies that 44.5% of the previous year’s disequilibrium in RX from its equilibrium path will be corrected in the recent year. The positive and significant effect of EGr on exports is supported in both the LR and the SR at 95% level of confidence. This supports the validity of ‘growth-driven exports hypothesis’ in Pakistan. Furthermore, long run elasticity of real GDP on RX is found bigger than its SR counterpart. This implies that the impact of increasing real
23
income on RX is higher in the LR than in the SR. The highly insignificant and negative effect of HD on exports is found both in LR and SR dynamic models. This might be the outcome that exiting stock of knowledge and skill do not match with desired technology for enhancing RX. This also might be the result that large portion of Pakistan’s exports still constituted primary and semi-manufactured commodities.
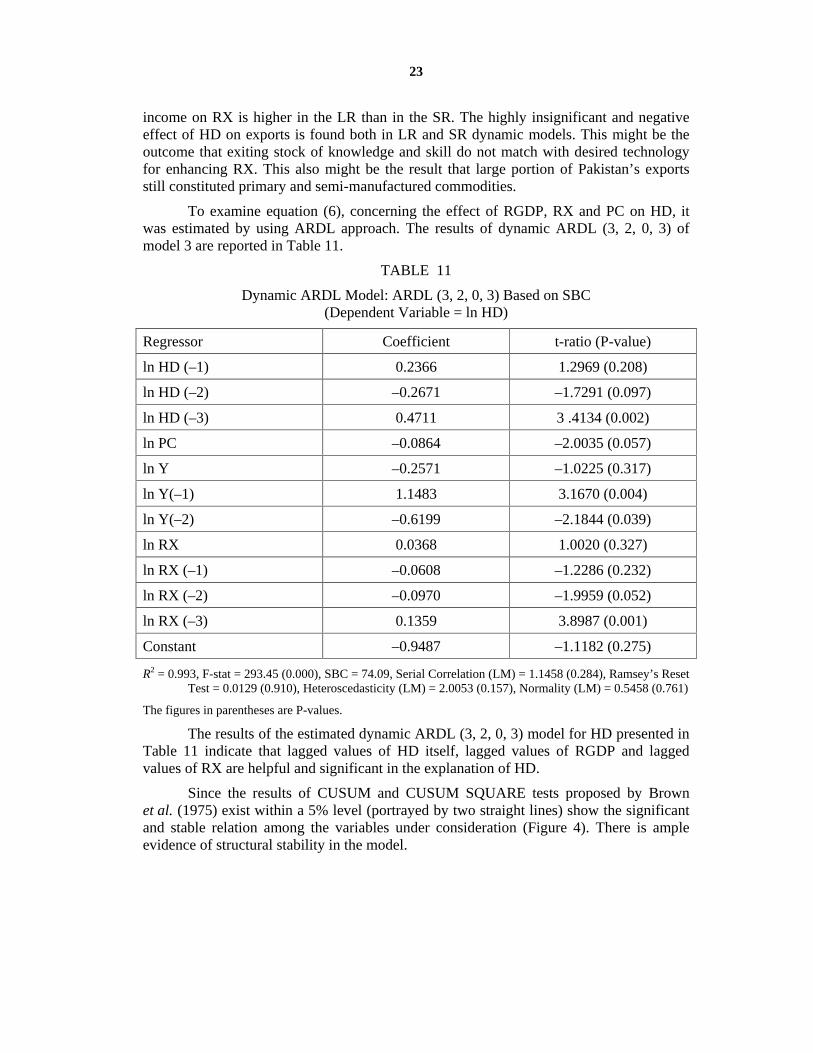
To examine equation (6), concerning the effect of RGDP, RX and PC on HD, it was estimated by using ARDL approach. The results of dynamic ARDL (3, 2, 0, 3) of model 3 are reported in Table 11.
TABLE 11
Dynamic ARDL Model: ARDL (3, 2, 0, 3) Based on SBC (Dependent Variable = ln HD)
Regressor Coefficient t-ratio (P-value)
ln HD (–1) 0.2366 1.2969 (0.208)
ln HD (–2) –0.2671 –1.7291 (0.097)
ln HD (–3) 0.4711 3 .4134 (0.002)
ln PC –0.0864 –2.0035 (0.057)
ln Y –0.2571 –1.0225 (0.317)
ln Y(–1) 1.1483 3.1670 (0.004)
ln Y(–2) –0.6199 –2.1844 (0.039)
ln RX 0.0368 1.0020 (0.327)
ln RX (–1) –0.0608 –1.2286 (0.232)
ln RX (–2) –0.0970 –1.9959 (0.052)
ln RX (–3) 0.1359 3.8987 (0.001)
Constant –0.9487 –1.1182 (0.275)
R2 = 0.993, F-stat = 293.45 (0.000), SBC = 74.09, Serial Correlation (LM) = 1.1458 (0.284), Ramsey’s Reset Test = 0.0129 (0.910), Heteroscedasticity (LM) = 2.0053 (0.157), Normality (LM) = 0.5458 (0.761)
The figures in parentheses are P-values.
The results of the estimated dynamic ARDL (3, 2, 0, 3) model for HD presented in Table 11 indicate that lagged values of HD itself, lagged values of RGDP and lagged values of RX are helpful and significant in the explanation of HD.
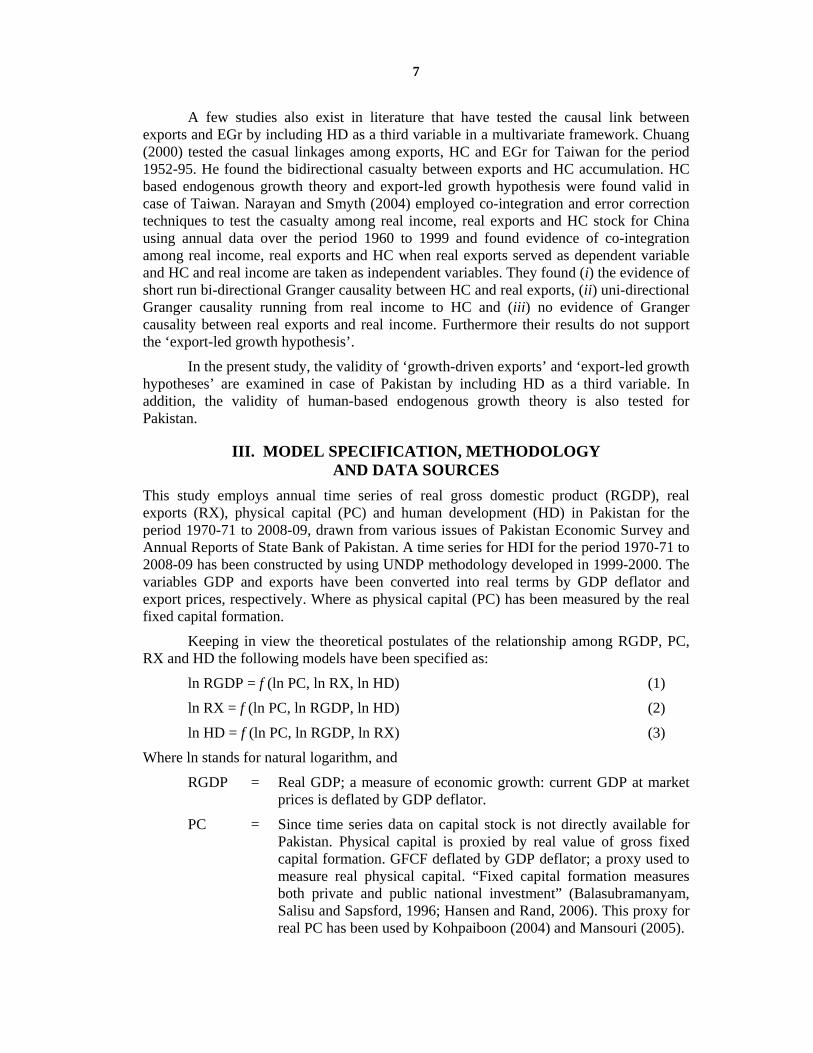
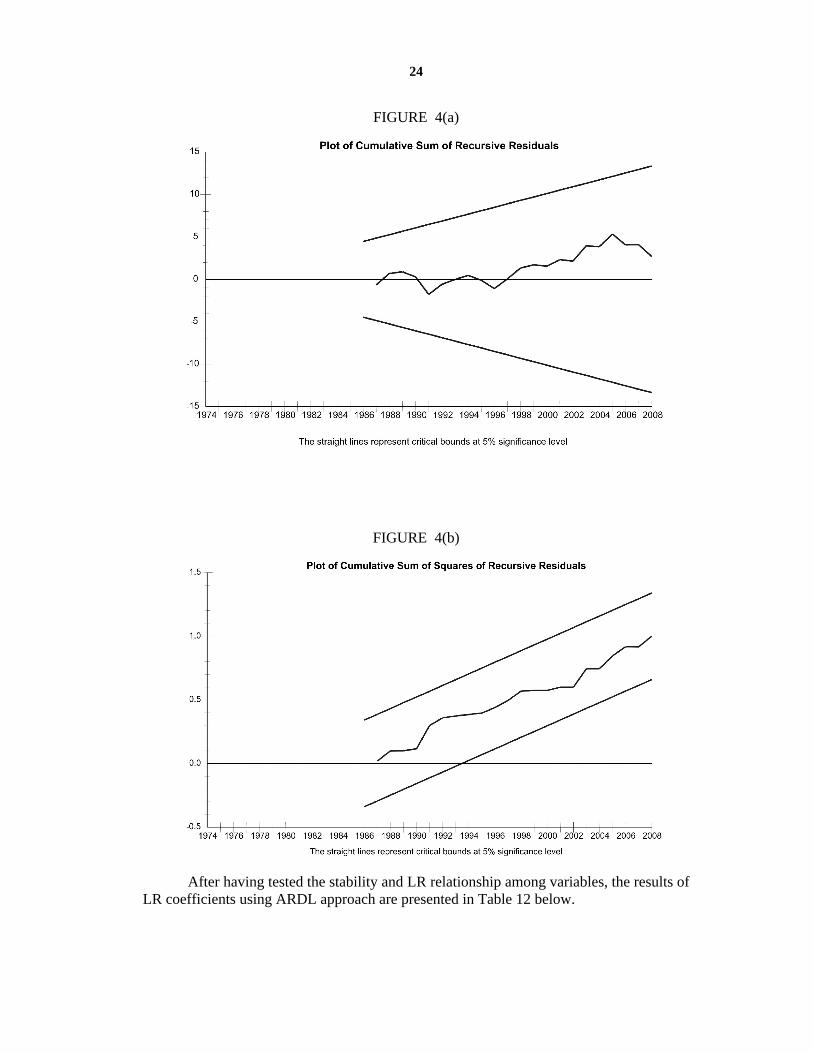
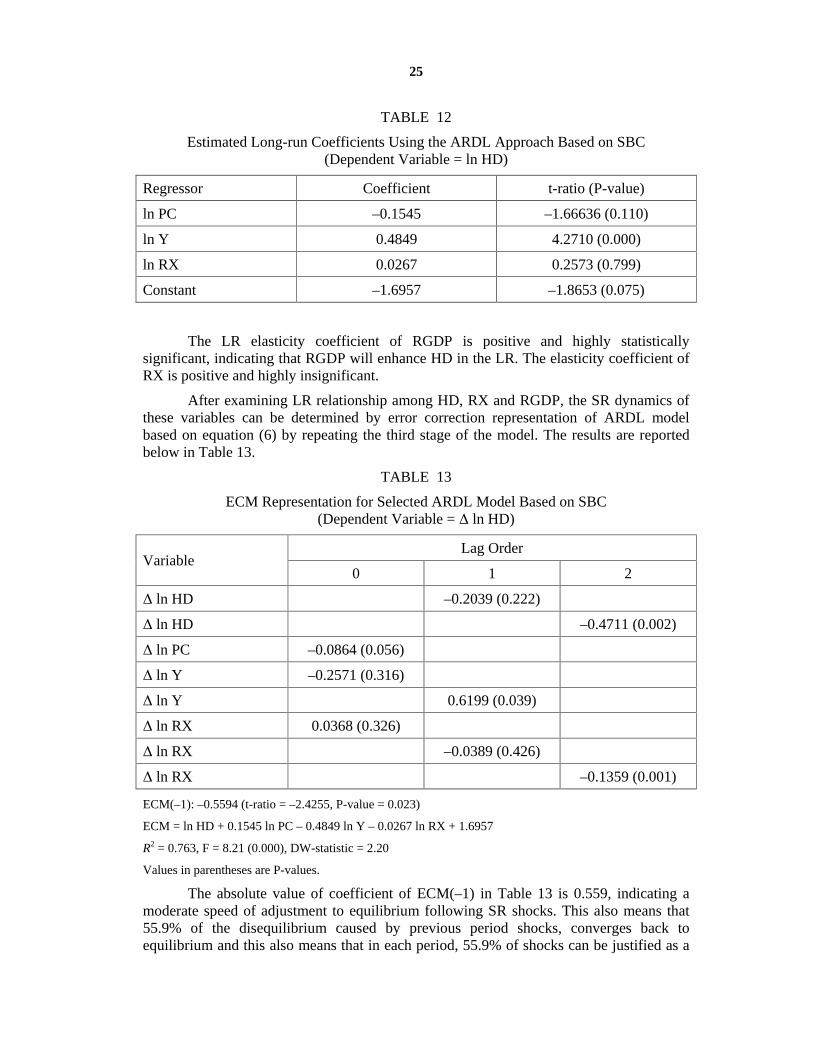
Since the results of CUSUM and CUSUM SQUARE tests proposed by Brown et al. (1975) exist within a 5% level (portrayed by two straight lines) show the significant and stable relation among the variables under consideration (Figure 4). There is ample evidence of structural stability in the model.
24
FIGURE 4(a)
FIGURE 4(b)
After having tested the stability and LR relationship among variables, the results of LR coefficients using ARDL approach are presented in Table 12 below.
25
TABLE 12
Estimated Long-run Coefficients Using the ARDL Approach Based on SBC (Dependent Variable = ln HD)
Regressor Coefficient t-ratio (P-value)
ln PC –0.1545 –1.66636 (0.110)
ln Y 0.4849 4.2710 (0.000)
ln RX 0.0267 0.2573 (0.799)
Constant –1.6957 –1.8653 (0.075)
The LR elasticity coefficient of RGDP is positive and highly statistically significant, indicating that RGDP will enhance HD in the LR. The elasticity coefficient of RX is positive and highly insignificant.
After examining LR relationship among HD, RX and RGDP, the SR dynamics of these variables can be determined by error correction representation of ARDL model based on equation (6) by repeating the third stage of the model. The results are reported below in Table 13.
TABLE 13
ECM Representation for Selected ARDL Model Based on SBC (Dependent Variable = ln HD)
Lag Order Variable
0 1 2
ln HD –0.2039 (0.222)
ln HD –0.4711 (0.002)
ln PC –0.0864 (0.056)
ln Y –0.2571 (0.316)
ln Y 0.6199 (0.039)
ln RX 0.0368 (0.326)
ln RX –0.0389 (0.426)
ln RX –0.1359 (0.001)
ECM(–1): –0.5594 (t-ratio = –2.4255, P-value = 0.023)
ECM = ln HD + 0.1545 ln PC – 0.4849 ln Y – 0.0267 ln RX + 1.6957
R2 = 0.763, F = 8.21 (0.000), DW-statistic = 2.20
Values in parentheses are P-values.
The absolute value of coefficient of ECM(–1) in Table 13 is 0.559, indicating a moderate speed of adjustment to equilibrium following SR shocks. This also means that 55.9% of the disequilibrium caused by previous period shocks, converges back to equilibrium and this also means that in each period, 55.9% of shocks can be justified as a
26
LR trend. The coefficient of ECt–1 in the model is negative and significant at 97% level of confidence. It implies that, in Pakistan, exports, PC, EGr, and HC are cointegrated. This finding about cointegration among the variables, when HD is the dependent variable is in accordance with the results presented in Table 4 for cointegration. The positive and significant effect of real GDP on HD is supported both in LR (confidence at 99%) and SR (confidence at 96%). The effect of two period lagged RX on HD is negative and highly significant indicating the reverse trend and behavior of both the labour force and exporters about improving their HC stock in the SR.
In short, the ARDL results indicate that (i) the inclusion of HD as an explanatory variable in addition to PC, RX in augmented growth function raises the robustness of the model; (ii) cointegration among real GDP, PC, RX and HD raises their significance when HD serves as a dependent variable; (iii) RX do not support and promote both the real GDP and HD both in SR and LR; (iv) HD promotes real GDP only in the LR and at the same time it does not explain RX in Pakistan; and (v) real GDP proves itself to be a significant source of explaining and promoting both the RX and HD both in SR and LR.
DIAGNOSTIC TESTS
Some other diagnostic tests were used for serial correlation, model specification, heteroskedasticity and conflict to normality that is based on a test of skewness and kurtosis of residuals. All the models satisfied and qualify all the above diagnostic tests.
TODA-YAMAMOTO AUGMENTED GRANGER CAUSALITY TESTS
The causal linkages among real GDP, PC, RX and HD are being investigated by following the Granger causality procedures adopted by Toda and Yamamoto (1995) and interpreted and further expanded by Rambaldi and Doran (1996) and Zapata and Rambaldi (1997). Zapata and Rambaldi (1997) argue that this test needs no prior knowledge of the cointegration among the variables and the usual lag selection scheme to the systems can still be applied in a case where there exists no cointegration or the rank conditions and stability are not satisfied “so long as the order of integration of the process does not exceed the true lag length of the model” (Toda and Yamamoto, 1995, p. 225). The attractiveness of applying Toda and Yamamoto (1995) technique to test Granger causality lies in its simplicity to apply and ability to overcome many a shortcomings of other alternative cumbersome econometric procedures such as developed by Toda and Phillips (1993) and Mosconi and Giannini (1992). Toda-Yamamoto Augmented Granger Causality Test applied Modified WALD test (MWALD) for restrictions on the parameters of a VAR(k), where k is the lag length in the system of equations. This test statistic follows a
2-distribution when VAR (k + dmax) is estimated. Here, dmax shows the maximum order of integration likely to happen in the system of equations. Here, we utilize Seemingly Unrelated Regression (SUR) because it has been proved by Rambaldi and Doran (1996) that MWALD test for testing Granger causality can be easily applied by using SUR. One of the advantages of utilizing SUR is that it also takes care of the possible simultaneity bias in the system of equations. One of the characteristics of VAR model is that it permits the researcher to test the direction of causality. Use of VAR can also overcome the problem of simultaneity bias. In VAR, all the variables are taken as endogenous variables.
To examine the causality between real GDP, PC, RX and HD, this study utilized the Toda-Yamamoto Augmented Granger Causality Test. The following system of equations is being estimated to investigate the Augmented Granger causality test:
27
3
111
3
111
ititi
iitit uPCYY
(9)
3
122
3
122
ititi
iitit uPCYPC
(10)
3
133
3
133
ititi
iitit uRXYY
(11)
3
144
3
144
ititi
iitit uRXYRX
(12)
3
155
3
155
ititi
iitit uHDYY
(13)
3
166
3
166
ititi
iitit uHDYHD
(14)
The above three systems of two equations each is estimated by SUR method. To explore that PC does not Granger cause GDP, the null hypothesis will be H0: i1
= 0
where i1
are the coefficients of itPC , i = 1, 2, 3 (H0: 0131211 ) in the first
equation of the system. Likewise the other null hypothesis for second equation is H0: i2
= 0 where i2
are the coefficients of itGDP , i = 1, 2, 3 (H0: 0232221 ) that is
the GDP does not Granger cause PC. This was carried out by means of a Wald test with the null hypothesis that the values of the estimated coefficients ( i2
and i2 ) are zero.
The other hypothesis for remaining system of two equations was also formulated in the same manner. The results of the Toda-Yamamoto test of augmented Granger causality are given in Table 14.
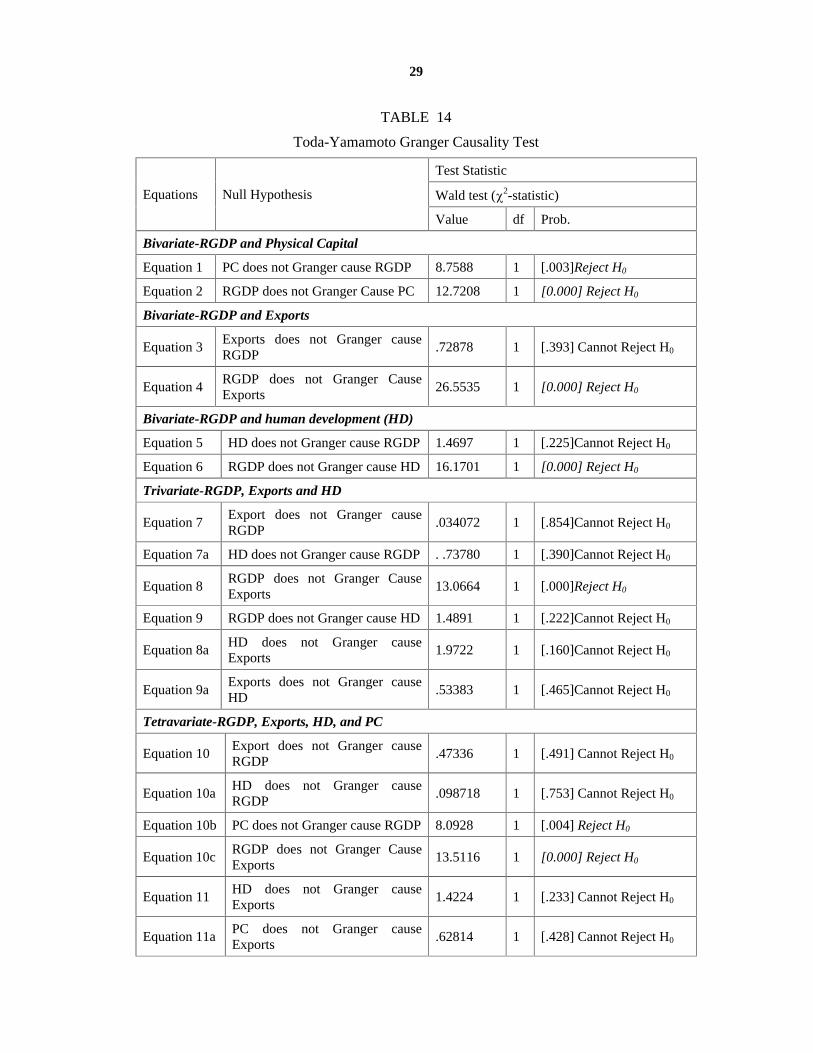
The statistical results of bivariate causality indicate that the null hypothesis of no Granger causality between PC and real GDP is rejected at 1% level of significance. Similar hypothesis regarding no Granger causality between real GDP and PC is rejected at 1% level of significance. These results support the presence of bidirectional causality between real GDP and PC. To test causality between real exports (RX) and real GDP (RGDP), the system of equations (11) and (12) has been estimated by SUR. The null hypothesis that RX do not Granger cause RGDP cannot be rejected at 95% level of confidence. On the other hand, the hypothesis that RGDP does not Granger cause exports can be rejected at 95% level of confidence. It was found that there is one way causality running from RGDP to RX in a bivariate case. The causal flow from real output to real export is termed as ‘growth-driven exports’. Exports are thus not seen as the significant source of EGr in Pakistan. Similarly another bivariate analysis between RGDP and HD (equations (13) and (14)) also indicates a unidirectional causality running only from RGDP to HD. In conclusion, in case of bivariate analysis, ‘export-led growth hypothesis’ is not seen to be valid while bivariate results support the validity of ‘growth-driven hypothesis’. Human capital-based endogenous growth theory does not seem to be valid in case of bivariate causality analysis.
Now moving to trivariate system of equations (equations (15), (16) and (17)) to analyze the Augmented Granger Causality for the variables RX, real GDP and HD. As
28
found above in bivariate analysis, RX do not Granger cause RGDP at 95% level of confidence, whereas RGDP does Granger cause RX at 99% level of confidence in case of trivariate analysis. Similarly no Granger causality between HD and RGDP and between HD and RX was established in trivariate analysis. In conclusion, in case of trivariate analysis, ‘export-led growth hypothesis’ is not valid whereas ‘growth-driven exports hypothesis’ found valid. The ‘human based-endogenous growth theory’ still found not valid in case of trivariate analysis.
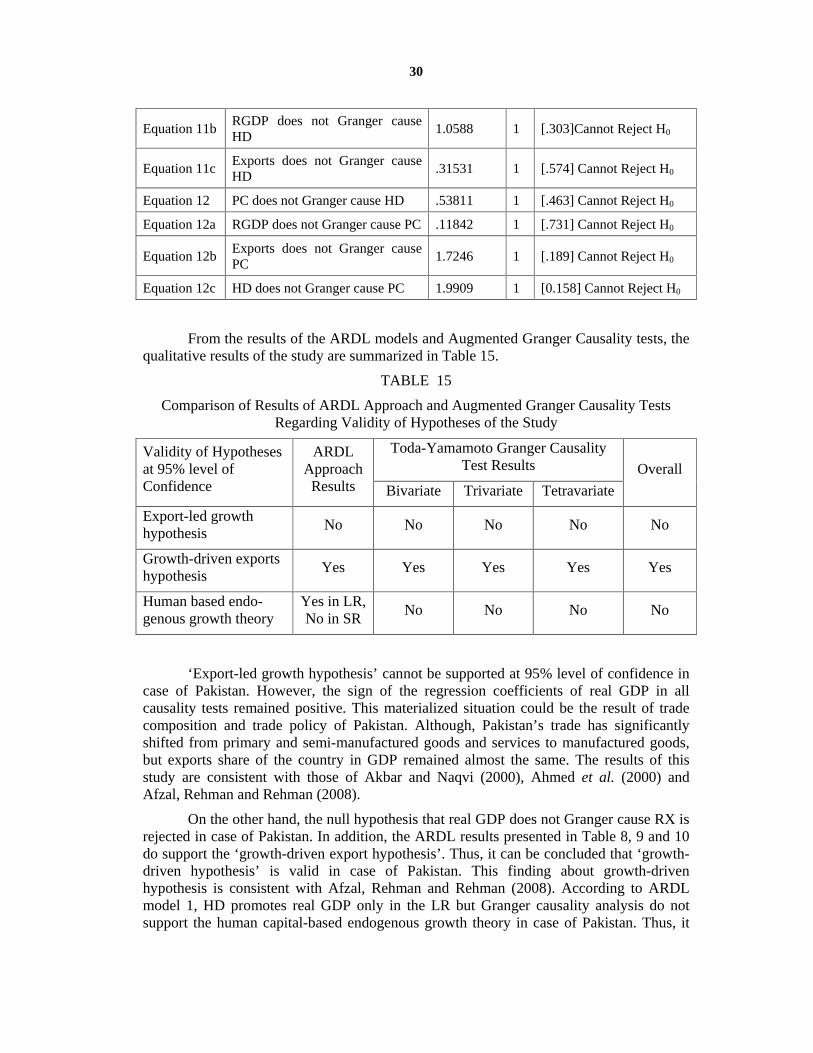
To test the tetravariate causality between RGDP, RX, HD and PC, again use of SUR was made. It was found that RGDP does Granger cause RX while exports do not Granger cause real GDP. It was also found that PC does Granger cause RGDP.
Regarding causality running from HD to real GDP in all cases (bivariate, trivariate and tetravariate analyses) the null hypothesis that HD does not Granger cause real GDP cannot be rejected. Thus, it can be concluded that ‘human capital based-endogenous growth theory’ is not valid in case of Pakistan. In sum, only ‘growth-driven exports hypothesis’ was found valid in case of Pakistan.
The statistical results also reveal that causality running from real GDP to HD does Granger cause only in bivariate analysis. This can be explained as: when people get richer because of EGr they prefer to send their children for higher education, knowledge and skills instead of sending them in the labour market. Similarly, because of increase in EGr, R&D expenditure will also grow. Finally, the statistical results do not support the presence of Granger causality between HD and RX. Thus, it could be the result of mismatch between existing HC stock and the required HC to produce exportables.
3
1
3
1777
3
177
i ititiiti
iitit uRXHDYY
(15)
3
1
3
1888
3
188
i ititiiti
iitit uRXHDYRX
(16)
3
1
3
1999
3
199
i ititiiti
iitit uRXHDYHD
(17)
3
1
3
1101010
3
110
3
11010
i ititiiti
iiti
iitit uRXHDPCYY
(18)
3
1
3
1111111
3
111
3
11111
i ititiiti
iiti
iitit uRXHDPCYRX
(19)
3
1
3
1121212
3
112
3
11212
i ititiiti
iiti
iitit uRXHDPCYHD
(20)
29
TABLE 14
Toda-Yamamoto Granger Causality Test
Test Statistic
Wald test ( 2-statistic) Equations Null Hypothesis
Value df Prob.
Bivariate-RGDP and Physical Capital
Equation 1 PC does not Granger cause RGDP 8.7588 1 [.003]Reject H0
Equation 2 RGDP does not Granger Cause PC 12.7208 1 [0.000] Reject H0
Bivariate-RGDP and Exports
Equation 3 Exports does not Granger cause RGDP
.72878 1 [.393] Cannot Reject H0
Equation 4 RGDP does not Granger Cause Exports
26.5535 1 [0.000] Reject H0
Bivariate-RGDP and human development (HD)
Equation 5 HD does not Granger cause RGDP 1.4697 1 [.225]Cannot Reject H0
Equation 6 RGDP does not Granger cause HD 16.1701 1 [0.000] Reject H0
Trivariate-RGDP, Exports and HD
Equation 7 Export does not Granger cause RGDP
.034072 1 [.854]Cannot Reject H0
Equation 7a HD does not Granger cause RGDP . .73780 1 [.390]Cannot Reject H0
Equation 8 RGDP does not Granger Cause Exports
13.0664 1 [.000]Reject H0
Equation 9 RGDP does not Granger cause HD 1.4891 1 [.222]Cannot Reject H0
Equation 8a HD does not Granger cause Exports
1.9722 1 [.160]Cannot Reject H0
Equation 9a Exports does not Granger cause HD
.53383 1 [.465]Cannot Reject H0
Tetravariate-RGDP, Exports, HD, and PC
Equation 10 Export does not Granger cause RGDP
.47336 1 [.491] Cannot Reject H0
Equation 10a HD does not Granger cause RGDP
.098718 1 [.753] Cannot Reject H0
Equation 10b PC does not Granger cause RGDP 8.0928 1 [.004] Reject H0
Equation 10c RGDP does not Granger Cause Exports
13.5116 1 [0.000] Reject H0
Equation 11 HD does not Granger cause Exports
1.4224 1 [.233] Cannot Reject H0
Equation 11a PC does not Granger cause Exports
.62814 1 [.428] Cannot Reject H0
30
Equation 11b RGDP does not Granger cause HD
1.0588 1 [.303]Cannot Reject H0
Equation 11c Exports does not Granger cause HD
.31531 1 [.574] Cannot Reject H0
Equation 12 PC does not Granger cause HD .53811 1 [.463] Cannot Reject H0
Equation 12a RGDP does not Granger cause PC .11842 1 [.731] Cannot Reject H0
Equation 12b Exports does not Granger cause PC
1.7246 1 [.189] Cannot Reject H0
Equation 12c HD does not Granger cause PC 1.9909 1 [0.158] Cannot Reject H0
From the results of the ARDL models and Augmented Granger Causality tests, the qualitative results of the study are summarized in Table 15.
TABLE 15
Comparison of Results of ARDL Approach and Augmented Granger Causality Tests Regarding Validity of Hypotheses of the Study
Toda-Yamamoto Granger Causality Test Results
Validity of Hypotheses at 95% level of Confidence
ARDL Approach
Results Bivariate Trivariate Tetravariate
Overall
Export-led growth hypothesis
No No No No No
Growth-driven exports hypothesis
Yes Yes Yes Yes Yes
Human based endo-genous growth theory
Yes in LR, No in SR
No No No No
‘Export-led growth hypothesis’ cannot be supported at 95% level of confidence in case of Pakistan. However, the sign of the regression coefficients of real GDP in all causality tests remained positive. This materialized situation could be the result of trade composition and trade policy of Pakistan. Although, Pakistan’s trade has significantly shifted from primary and semi-manufactured goods and services to manufactured goods, but exports share of the country in GDP remained almost the same. The results of this study are consistent with those of Akbar and Naqvi (2000), Ahmed et al. (2000) and Afzal, Rehman and Rehman (2008).
On the other hand, the null hypothesis that real GDP does not Granger cause RX is rejected in case of Pakistan. In addition, the ARDL results presented in Table 8, 9 and 10 do support the ‘growth-driven export hypothesis’. Thus, it can be concluded that ‘growth-driven hypothesis’ is valid in case of Pakistan. This finding about growth-driven hypothesis is consistent with Afzal, Rehman and Rehman (2008). According to ARDL model 1, HD promotes real GDP only in the LR but Granger causality analysis do not support the human capital-based endogenous growth theory in case of Pakistan. Thus, it
31
can be concluded that ‘human capital-based endogenous growth theory’ is not valid in case of Pakistan.
V. CONCLUSION AND RECOMMENDATIONS
The ARDL Approach to Cointegration results show cointegration between economic growth, PC, RX and HD when real GDP, RX and HD are taken as dependent variables. The statistical results and their analysis support the ‘growth-driven exports hypothesis’. However, the hypotheses of export-led growth and human capital based endogenous growth are not found valid for Pakistan. The invalidity of export-led growth is also supported by the existing data on exports to GDP ratio (Pakistan Economic Survey 2008-09, p. 61). It might be because of the two main reasons: firstly, the result of brain drain of highly skilled labour force and, secondly, the outcome of mismatch between existing HC stock and required HC stock to produce and enhance real GDP. Real GDP seems to provide resources to improve HD in both SR and LR, while HC accumulations do not seem to accelerate RGDP only in the LR. It is, therefore, recommended that Government of Pakistan should allocate more resources for the promotion of HC. Furthermore, there is a need to take initiatives by Government of Pakistan in formulating new policy in discouraging brain drain. There is a need for serious effort on the part of the Government to revise its export promotion policies. The goal of export promotion can be achieved by restructuring export composition and by exploring new markets. The ‘export-led growth hypothesis’, ‘growth-driven exports hypothesis’ and ‘human capital-based endogenous growth theory’ may further be tested and generalized in case of Pakistan by including other economic and non-economic variables like foreign direct investment, terms of trade, imports, financial development, energy, debt and debt servicing and political turmoil etc.
32
REFERENCES
Afzal, Mohammad (2006), Causality between exports, world income and economic growth in Pakistan. International Economic Journal, 20(1), pp. 63-77.
Afzal, Muhammad, Hafeez ur Rehman and Jamshaid ur Rehman (2008), Causal nexus between economic growth, export and external debt servicing: The case of Pakistan. Retrieved December 14, 2009 from http://www.pide.org.pk/PSDE/pdf/ 32.pdf.
Ahmad, J. and S. Harnhirun (1995), Unit roots and cointegration in estimating causality between exports and economic growth: Empirical evidence from the ASEAN countries. Economics Letters, 49, pp. 329-334.
Ahmad, Jaleel (2001), Causality between exports and economic growth: What do the econometric studies tell us? Pacific Economic Review, 6(1), pp. 147-67.
Ahmad, Jaleel, Somchai Harnhirun and Jing Yang (1997), Exports and economic growth in the ASEAN countries: Cointegration and causality tests. International Review of Economics and Business, 44(2), p. 419.
Ahmed, J. and A. C. C. Kwan (1991), Causality between exports and economic growth. Economic Letters, 37, pp. 243-248.
Ahmed, Qazi Massod, M. Sabihuddin Butt and Shaista Alam (2000), Economic growth, export and external debt causality: The case of Asian countries. The Pakistan Development Review, Volume 34, No. 4, Part II, pp. 591-608.
Akbar, M. and Z. F. Naqvi (2000), Export diversification and structural dynamic growth process: The case of Pakistan. The Pakistan Development Review, Volume 39, No. 4, pp. 573-589.
Alderman, H., J. Behrman, S. Khan, D. Ross and R. Sabot (1996a), The income gap in cognitive skills in rural Pakistan. Economic Development and Cultural Change, 44.
Alderman, H., J. Behrman, S. Khan, D. Ross and R. Sabot (1996b), The returns to endogenous human capital in Pakistan's rural wage market. Oxford Bulletin of Economics and Statistics.
Al-Yousif, Yousif Khalifa (1997), Exports and economic growth: Some empirical evidence from Arab Gulf countries. Applied Economics, 29, pp. 693-697.
Amoateng, K. and B. Amoako-Adu (1996), Economic growth, export and external debt causality: The case of African countries. Applied Economics, 28, pp. 21-27.
Asteriou, D. and G. M. Agiomirgianakis (2001), Human capital and economic growth: Time series evidence from Greece. Journal of Policy Modeling, 23(5), pp. 481-489.
Awokuse, Titus O. (2003), Is the export-led growth hypothesis valid for Canada? Canadian Journal of Economics, Volume 36, No. 1, pp. 126-136.
Awokuse, Titus O. (2005), Exports, economic growth and causality in Korea. Applied Economics Letters, 12(11), pp. 693-96.
Bahmani-Oskooee, M. and A. Nasir (2004), ARDL approach to test the productivity bias hypothesis. Rev. Development Econ. J., 8, pp. 483-488.
33
Bahmani-Oskooee, M. and T. J. Brooks (1999), Bilateral J curve between US and her trading partners. Welwirtschaftliches Archiv, Band 135, Heft I, pp. 156-165.
Bahmani-Oskooee, M., H. Mohtadi and G. Shabsigh (1991), Exports, growth and causality in LDCs: A re-examination. Journal of Development Economics, Volume 36, pp. 405-415.
Balasubarmanyam, V. N., M. Salisu and D. Sapsford (1996), Foreign direct investment and growth in EP and IS countries. The Economic Journal, 106, pp. 92-105.
Banerjee, A., J. W. Dolado, Galbraith and D. F. Hendry (1993), Cointegration, Error Correction and the Econometrics Analysis of Non-Stationary Data. Oxford University Press, Oxford.
Bannerjee, A., J. W. Dolado and R. Mestre (1998), Error-correction mechanism tests for cointegration in single equation framework. Journal of Time Series Analysis, 19, pp. 267-283.
Behrman, J. R. and B. L. Wolfe (1987a), How does mother’s schooling affect the family’s health nutrition medical care usage and household? Journal of Econometrics, 36.
Behrman, J. R. and B. L. Wolfe (1987b). Investments in schooling in two generations in pre-revolutionary Nicaragua: the roles of family background and school supply. Journal of Development Economics, 27.
Birdsall, N. (1985), Public inputs and child schooling in Brazil. Journal of Development Economics, 18.
Brown, R. L., J. Durbin and J. M. Evans (1975), Techniques for testing the constancy of regression relationships over time. Journal of the Royal Statistical Society, Series B, 37, pp. 149-192.
Chen, Shyh-Wei (2007), Exactly what is the link between export and growth in Taiwan? New evidence from the Granger causality test. Economics Bulletin, 6(7), pp. 1-10.
Chow, P. C. Y. (1987), Causality between export growth and industrial development: Empirical evidence from the NICS. Journal of Development Economics, 26(1), pp. 55-63.
Chuang, Y. C. (2000), Human capital, exports and economic growth: A causality analysis for Taiwan, 1952-1995. Review of International Economics, 8(4), pp. 712-720.
Dargahi, J. (2003). Analyses of economic growth elements in Iran. Journal of Research in Economics, p. 26.
De Meulemeester, J. L. and D. Rochat (1995), A causality analysis of the link between higher education and development. Economics of Education Review, 14(4), pp. 351-361.
Demirhan, Erdal and Selcuk Akcay (2005), The causality relationship between export growth and economic growth: Empirical evidence from selected MENA countries. Iktisat Isletme ve Finans, May, 20(230), pp. 124-131.
Deolalikar, A. B. (1993), Gender differences in the returns to schooling and school enrollment rates in Indonesia. Journal of Human Resources, 28.
34
Din, Musleh ud (2004), Exports, imports, and economic growth in South Asia: Evidence using a multivariate time-series framework. The Pakistan Development Review, 43(2), pp. 105-124.
Doganlar, Murat and Mahir Fisunoglu (1999), Causality between exports and economic growth in Asian countries. Yapi Kredi Economic Review, 10(1), pp. 3-11.
Emadzadeh et al. (2000), The role of human capital in economic growth. Journal of Planning and Development, 5(1), p. 21.
Engle, R. F. and C. W. J. Granger (1987), Co-integration and error correction: Representation, estimation, and testing. Econometrica, 55, pp. 251-276.
Gould, D. and R. Ruffin (1995), Human capital, trade and economic growth. Weltwirtschaftliches Archiv, 131(3), pp. 425-445.
Government of Pakistan, Pakistan Economic Survey, various issues. Finance Division, Economic Advisor’s Wing, Islamabad, Pakistan.
Graves, Philip E. and J. A. Holman (1995), Korean exports economic growth: An econometric reassessment. Journal of Economic Development, 20(2), pp. 45-56.
Gregory, A. W. and B. E. Hansen (1996), Residual-based tests for cointegration in models with Regime Shifts. Journal of Econometrics, Volume 70, pp. 99-126.
Grossman, G. and E. Helpman (1991), Innovation and Growth in the Global Economy. Cambridge MA: MIT Press.
Hansen, H. and J. Rand (2006), On the causal links between FDI and growth in developing countries. The World Economy, 29(1), pp. 21-41.
Hatemi, J. Abdulnasser (2002), Export performance and economic growth nexus in Japan: A Bootstrap approach. Japan and the World Economy, 14(1), pp. 25-33.
Hatemi, J. Abdulnasser and Manuchehr Irandoust (2000), Export Performance and Economic Growth Causality: An Empirical Analysis. Atlantic Economic Journal, 28(4), pp. 412-426.
Heller, P. and R. Porter (1978), Exports and growth: An empirical investigation. Journal of Development Studies, 5(2), pp. 191-193.
Helpman, E. and P. Krugman (1990), Market Structure and Foreign Trade. Cambridge MA: MIT Press.
Hsiao, M. C. W. (1987), Tests of causality and exogeneity between exports and economic growth: The case of the Asian NICs. Journal of Economic Development, 12, pp. 143-159.
In, F. and C. Doucouliagos (1997), Human capital formation and US economic growth: A causality analysis. Applied Economics Letters, Volume 4, Issue 5, pp. 329-331.
Islam, Muhammed N. (1998), Export Expansion and Economic Growth: Testing for Cointegration and Causality. Applied-Economics, 30(3), pp. 415-425.
Johansen, S. (1988), Statistical analysis of cointegration vectors. Journal of Economic Dynamics and Control, Volume 12, pp. 231-254.
Johansen, S. (1991), Estimation and hypothesis testing of co-integration vectors in Gaussian vector autoregressive models. Econometrica, 59, pp. 1551-1580.
35
Johansen, S. and K. Juselius (1990), Maximum Likelihood Estimation and Inference on Cointegration with Applications to the Demand for Money. Oxford Bulletin of Economics and Statistics, 52, pp. 169-210.
Jones, Jonathan D. (1989), A comparison of lag-length selection techniques in tests of Granger causality between money growth and inflation: Evidence for the US, 1959-86. Applied Economics, 21, pp. 809-822.
Jordaan, André C. and Joel Hinaunye Eita (2007), Testing the export-led growth hypothesis for Botswana: A causality analysis. Working Papers 200720, University of Pretoria, Department of Economics.
Judson, R. (2002), Measuring human capital like physical capital: What does it tell us? Bulletin of Economic Research, 54, pp. 209-231.
Jung, W. S. and P. J. Marshall (1985), Exports, growth and causality in developing countries. Journal of Development Economics, 18(2), pp. 1-12.
Khalid, Ahmed M. and Bay Teck Cheng (1997), Imports, Exports and Economic Growth: Cointegration and Causality Tests for Singapore. Singapore Economic Review, October, 42(2), pp. 32-39.
Khan, S., W. D. Shaw and F. Hussain (1991), Causality between Literacy and Labour Productivity in Pakistan. Economics of Education Review, 10(3), pp. 245-251.
Kim, J. (1998), Economic Analysis of Foreign Education and Students Abroad. Journal of Development Economics, 56(2), pp. 337-356.
King, E. M. and L. A. Lillard (1987), Education policy and schooling attainment in Malaysia and the Philippines. Economics of Education Review, 6.
Kohpaiboon, A. (2004), Foreign trade regime and FDI-growth nexus: A case study of Thailand. Working Paper, Australian National University.
Komijani and Memernejad (2004). Impotence of human capital and R&D in economic growth of Iran. Journal of Research in Economics, 31.
Konya, L. (2006), Exports and growth: Granger causality analysis on OECD countries with a panel data approach. Economic Modeling, 23, pp. 978-992.
Kovacic, Zlatko J. and Djordje Djukic (1991), Export Expansion and Economic Growth in Yugoslavia: Some Empirical Evidence. Economic Analysis and Workers’ Management, 25(2), pp. 95-113.
Kremers, J. J. M., Neil R. Ericsson and Juan J. Dolado (1992), The power of cointegration tests. Oxford Bulletin of Economics and Statistics, 54, pp. 325-343.
Kwan, A. C. C. and J. Cotsomotis (1991), Economic growth and expanding export sector: China 1952-1985. International Economic Review, 5, pp. 105-117.
Lee, D. W. and T. H. Lee (1995), Human capital and economic growth: Tests based on international evaluation of educational achievement. Economic Letters, 47, pp. 219-225.
Lee, Daniel Y. and Ming Shiun Pan (2000), On exports and economic growth in East Asian countries: Linear and nonlinear causality analyses. Pennsylvania Economic Review Fall, 9(2), pp. 66-78.
36
Liu, X., C. Wang and Y. Wei (2001), Causal links between foreign direct investment and trade in China. China Economic Review, 12(2-3), pp. 190-202.
Liu, X., H. Song and P. Romilly (1997), An empirical investigation of the causal relationship between openness and economic growth in China. Applied Economics, 29(12), pp. 1679-1686.
Liu, X., P. Burridge and P. J. N. Sinclair (2002), Relationships between economic growth, foreign direct investment and trade: Evidence from China. Applied Economics, 34(11), pp. 1433-1440.
Lucas, R. (1988), On the mechanics of economic development. Journal of Monetary Economics, 22, pp. 3-42.
MacKinnon, J. G. (1996), Numerical distribution functions for unit root and co-integration tests. Journal of Applied Econometrics, 11, pp. 601-618.
Mah, Jai S. (2005), Export expansion, economic growth and causality in China. Applied Economics Letters, 12(2), pp. 105-107.
Mansouri, B. (2005), The interactive impact of FDI and trade openness on economic growth: Evidence from Morocco. Paper presented on the 12th Econ. Research Forum (ERF) Conf., Cairo.
Marin, D. (1992), Is the export-led growth hypothesis valid for industrialized countries? The Review of Economics and Statistics, 74, pp. 678-688.
Mohamadi, A. (2006), Role of education in Iran economic growth-Fars Province. Education, 22(4), pp. 57-84.
Mosconi, R. and C. Giannini (1992), No-causality in cointegrated systems: Representation, estimation and testing. Oxford Bulletin of Economics and Statistics, 54, pp. 399-417.
Narayan, P. K. (2005), The saving and investment nexus for China: Evidence from cointegration tests. Applied Economics, 37, pp. 1979-1990.
Narayan, P. K. and R. Smyth (2004), Temporal causality between human capital and real income in cointgrated VAR processes, empirical evidence from China, 1960-1999. International Journal of Business and Economics, 3(1), pp. 1-11.
Narayan, Paresh Kumar and Russell Smyth (2004), Temporal causality and the dynamics of exports, human capital and real income in China. International Journal of Applied Economics, 1(1), pp. 24-45.
Ng, S. and P. Perron (2001), Lag length selection and the construction of unit root tests with good size and power. Econometrica, 69, pp. 1519-1554.
Nili, M. and S. H. Nafisi (2003), Relationship between human capital and economic growth. Quarterly Journal of Economic Researches of Iran, p. 17.
Omisakin, Ohusegun A. (2009), Export-led growth hypothesis: Further econometric evidence from Nigeria. Pakistan Journal of Social Sciences, 6(4), pp. 219-223.
Onchoke, S. N. and F. In (1994), An empirical investigation of LR relationship between export revenues and economic growth in the South Pacific Island Nations. The Singapore Economic Review, 38:2, pp. 213-228.
Pacific Island Countries. Economic Papers (Economic Society of Australia).
37
Perron, P. (1989), The great crash: The oil price shock and the unit root hypothesis. Econometrica, 57, pp. 1361-1401.
Perron, P. (1997), Further evidence on breaking trend functions in macroeconomic variables. J. Econometrica, 80, pp. 355-385.
Pesaran, M. H. and B. Pesaran (1997), Working with Microfit 4.0: Interactive Econometric Analysis. Oxford: Oxford University Press.
Pesaran, M. H. and Y. Shin (1995), An autoregressive distributed lag modeling approach to cointegration analysis. In Centennial Volume of Ranger Frisch edited by S. Storm, A. Holly and P. Diamond. Cambridge: Cambridge University Press.
Pesaran, M. H. and Y. Shin (1999), An autoregressive distributed lag modeling approach to cointegration analysis. In Strom, S. (ed.), Econometrics and Economic Theory in the 20th Century: The Ragnar Frisch Centennial Symposium. Cambridge: Cambridge University Press.
Pesaran, M. H., Y. Shin and R. J. Smith (1996), Testing for the existence of a long-run relationship. DAE Working Paper No. 9622, Department of Applied Economics, University of Cambridge, Cambridge.
Pesaran, M. H., Y. Shin and R. J. Smith (2001), Bounds testing approaches to the analysis of level relationships. Journal of Applied Econometrics, 16, pp. 289-326.
Pissarides, C. (1997), Learning by trading and the returns to human capital in developing countries. World Bank Economic Review, 11(1), pp. 17-32.
Rambaldi, A. N. and H. E. Doran (1996), Testing for Granger non-causality in cointegrated systems made easy. Working Papers in Econometrics and Applied Statistics No. 88, Department of Econometrics, University of New England, pp. 1-22.
Ramiret, A., G. Ranis and F. Steward (1997), Economic growth and human development. Economic Growth Center, Yale University, Center Discussion Paper No. 787.
Ranis, G., F. Stewart and A. Ramirez (2000), Economic growth and human development. World Development, 28, 2, pp. 197-219.
Rebelo, Sergio T. (1991), Long-run policy analysis and long-run growth. Journal of Political Economy, 99(3), pp. 500-521.
Reppas, P. A. and D. K. Christopoulos (2005), The export-output growth nexus: Evidence from African and Asian countries. Journal of Policy Modeling, 27, pp. 929-940.
Riddell, R., M. Robinson, J. deConinck, A. Muir and S. White (1995), Nongovernmental Organizations and Rural Poverty Alleviation. New York: Oxford University Press.
Romer, P. (1987), Endogenous technical change. Journal of Political Economy, 89, pp. 71-102.
Romer, P. (1990), Human capital and growth: Theory and evidence. Carnegie-Rochester Conference Series on Public Policy, 32, pp. 251-285.
Romer, Paul M. (1986), Increasing returns and long-run growth. Journal of Political Economy, 94(5), pp. 1002-1037.
38
Saikkonen, Pentti and Helmut Lutkepohl (2000), Testing for the cointegrating rank of a VAR process with structural shifts. Journal of Business and Economic Statistics (American Statistical Association), 18(4), pp. 451-464.
Sezgin, Selami and Tulide Yildirim (2002), The demand for Turkish defense expenditure, defense and peace economies. Taylor and Francis Journals, 13(2).
Shan, J. and F. Sun (1995), on the export-led growth hypothesis for the little Dragons: An empirical reinvestigation. AEJ, 26(4), pp. 353-369.
Shan, J. and F. Sun (1998), On the export-led growth hypothesis: The econometric evidence from China. Applied Economics, 30, pp. 1055-1065.
Shan, J. and G. G. Tian (1998), Causality between exports and economic growth: The empirical evidence from Shanghai. Australian Economic Papers, 37(2), 195-202.
Sharma, S. C., M. Norris and D. W. W. Cheung (1991), Exports and economic growth in industrialized countries. Applied Economics, 23, pp. 697-708.
Shirazi, Nasim Shah and Turkhan Ali Abdul Manap (2004), Exports and economic growth nexus: The case of Pakistan. The Pakistan Development Review, 43(4), pp. 563-579.
Stock, J. H. and M. Watson (1993), A simple estimator of cointegrating vectors in higher order integrated systems. Econometrica, 61, pp. 783-820.
Stock, J. H. and M. W. Watson (1988). Testing for common trend. Journal of the American Statistical Association, 83, pp. 1097-1107.
Stokey, N. (1996), Free trade, factor returns and factor accumulation. Journal of Economic Growth, 1(4), pp. 255-271.
Thornton, J. (1996), Cointegration, causality and export-led growth in Mexico, 1895-1992. Economic Letters, 50, pp. 413-416.
Toda, H. Y. and P. C. B. Phillips (1993), Vector autoregressions and causality. Econometrica, 61, pp. 1367-1393.
Toda, H. Y. and T. Yamamoto (1995), Statistical Inference in Vector Autoregressive with Possible Integrated Processes. Journal of Econometrics, 66, pp. 225-250.
Turner, P. (2006), Response surfaces for an F-test for cointegration. Applied Economics Letters, 13, pp. 479-482.
UNDP, Human Development Report, various issues. New York: Oxford University Press.
Vohra, Rubina (2001), Export and economic growth: Further time series evidence from less-developed countries. International Advances in Economic Research, 7(3), pp. 345-350.
Wernerheim, C. M. (2000), Cointegration and causality in the exports-GDP nexus: The post-war evidence for Canada. Empirical Economics, 25, pp. 111-125.
Xu, Z. (1996), On the causality between export growth and GDP growth: An empirical reinvestigation. Review of International Economics, 4, pp. 172-184.
Zapata, H. O. and A. N. Rambaldi (1997), Monte Carlo evidence on cointegration and causation. Oxford Bulletin of Economics and Statistics, 59, pp. 285-298.