The Dynamic Relationship between TFP and Human Capital ...2)/jeko_52(2)-14.pdf · The Dynamic...
14
Jurnal Ekonomi Malaysia 52(2) 2018 175 - 188 http://dx.doi.org/10.17576/JEM-2018-5202-14 The Dynamic Relationship between TFP and Human Capital Inequality: Evidence from ASEAN Countries (Hubungan Dinamik antara TFP dan Ketidakseragaman Modal Manusia: Bukti dari Negara ASEAN) Du Yu Hong Universiti Kebangsaan Abu Hassan Shaari Md. Nor Universiti Kebangsaan Malaysia Tamat Sarmidi Universiti Kebangsaan Malaysia ABSTRACT The study investigates the long-run equilibrium relationship between human capital inequality and cumulative TFP growth rate using data for a panel of 5 selected ASEAN countries over the period of 1990 to 2014. Both the first-generation and second-generation panel unit root tests are involved and the long-run equilibrium relationships among variables are confirmed by using the Pedroni-type panel cointegration tests and the Westerlund-type panel cointegration estimator. Using the FMOLS and DOLS estimators, the results for the whole panel, human capital inequality is negatively affecting the cumulative TFP growth rate suggesting that the unequal distribution of human capital is harmful to regional TFP growth and an improvement in human capital inequality will promote TFP growth. However, homogenous effects of all individual countries are impractical and the results of the relationship between human capital inequality and TFP growth rate for individual countries present heterogeneity. Keywords: Human capital inequality; TFP growth rate; long-run equilibrium ABSTRAK Kajian ini menyelidik hubungan keseimbangan jangka panjang antara ketidaksamaan modal insan dan kadar pertumbuhan TFP kumulatif menggunakan data untuk panel 5 negara ASEAN terpilih sepanjang tempoh 1990 hingga 2014. Ujian punca unit generasi pertama menggunakan ujian panel kointegrasi Pedroni dan generasi kedua mengaplikasikan ujian panel Westerlund mengesahkan hubungan keseimbangan jangka panjang antara pembolehubah. Dengan menggunakan penganggar FMOLS dan DOLS, keputusan untuk keseluruhan panel, ketidaksamaan modal insan memberi kesan negatif terhadap kadar pertumbuhan TFP kumulatif yang menunjukkan bahawa pengagihan modal manusia yang tidak seimbang membahayakan pertumbuhan TFP serantau dan peningkatan ketidaksamaan modal insan akan menggalakkan pertumbuhan TFP. Walau bagaimanapun, kesan homogen dari semua negara adalah tidak praktikal dan hasil hubungan antara ketidaksamaan modal manusia dan kadar pertumbuhan TFP bagi negara masing-masing adalah heterogen. Kata kunci: Ketidakseragaman modal manusia; kadar pertumbuhan TFP; keseimbangan jangka panjang INTRODUCTION Since the 1960s, as witnessed by the world some Southeast Asian countries have shown a surprising spur in their economic growths. From Figure 1, it is obvious to detect the rapid growth trend and the influence of Asian Financial crisis during the considered period. The crisis caused slight economic recession in 1997 and 1998. Nonetheless, the majority of Southeast Asian countries recovered quite soon and remained at the previous or higher level of economic growth. Currently, the Association of Southeast Asian Nations ( ASEAN) community has set-up three main pillars, i.e. ASEAN Political and Security Community, ASEAN Economic Community (AEC), and ASEAN Socio-Culture Community, to establish a single market and an integrated economic entity within the whole ASEAN area. Regional integration and rapid growth within ASEAN countries have been compelling regional economic growth so far. The AEC is further projected to be the world’s fifth biggest economic entity by 2020. For sustainable and inclusive growth of the ASEAN economy, total factor productivity (TFP), as the main tool of exploring the source of economic growth and measuring the quality of
Transcript of The Dynamic Relationship between TFP and Human Capital ...2)/jeko_52(2)-14.pdf · The Dynamic...
Jurnal Ekonomi Malaysia 52(2) 2018 175 - 188http://dx.doi.org/10.17576/JEM-2018-5202-14
The Dynamic Relationship between TFP and Human Capital Inequality: Evidence from ASEAN Countries
(Hubungan Dinamik antara TFP dan Ketidakseragaman Modal Manusia: Bukti dari Negara ASEAN)
Du Yu HongUniversiti Kebangsaan
Abu Hassan Shaari Md. NorUniversiti Kebangsaan Malaysia
Tamat SarmidiUniversiti Kebangsaan Malaysia
ABSTRACT
The study investigates the long-run equilibrium relationship between human capital inequality and cumulative TFP growth rate using data for a panel of 5 selected ASEAN countries over the period of 1990 to 2014. Both the first-generation and second-generation panel unit root tests are involved and the long-run equilibrium relationships among variables are confirmed by using the Pedroni-type panel cointegration tests and the Westerlund-type panel cointegration estimator. Using the FMOLS and DOLS estimators, the results for the whole panel, human capital inequality is negatively affecting the cumulative TFP growth rate suggesting that the unequal distribution of human capital is harmful to regional TFP growth and an improvement in human capital inequality will promote TFP growth. However, homogenous effects of all individual countries are impractical and the results of the relationship between human capital inequality and TFP growth rate for individual countries present heterogeneity.
Keywords: Human capital inequality; TFP growth rate; long-run equilibrium
ABSTRAK
Kajian ini menyelidik hubungan keseimbangan jangka panjang antara ketidaksamaan modal insan dan kadar pertumbuhan TFP kumulatif menggunakan data untuk panel 5 negara ASEAN terpilih sepanjang tempoh 1990 hingga 2014. Ujian punca unit generasi pertama menggunakan ujian panel kointegrasi Pedroni dan generasi kedua mengaplikasikan ujian panel Westerlund mengesahkan hubungan keseimbangan jangka panjang antara pembolehubah. Dengan menggunakan penganggar FMOLS dan DOLS, keputusan untuk keseluruhan panel, ketidaksamaan modal insan memberi kesan negatif terhadap kadar pertumbuhan TFP kumulatif yang menunjukkan bahawa pengagihan modal manusia yang tidak seimbang membahayakan pertumbuhan TFP serantau dan peningkatan ketidaksamaan modal insan akan menggalakkan pertumbuhan TFP. Walau bagaimanapun, kesan homogen dari semua negara adalah tidak praktikal dan hasil hubungan antara ketidaksamaan modal manusia dan kadar pertumbuhan TFP bagi negara masing-masing adalah heterogen.
Kata kunci: Ketidakseragaman modal manusia; kadar pertumbuhan TFP; keseimbangan jangka panjang
INTRoDUCTIoN
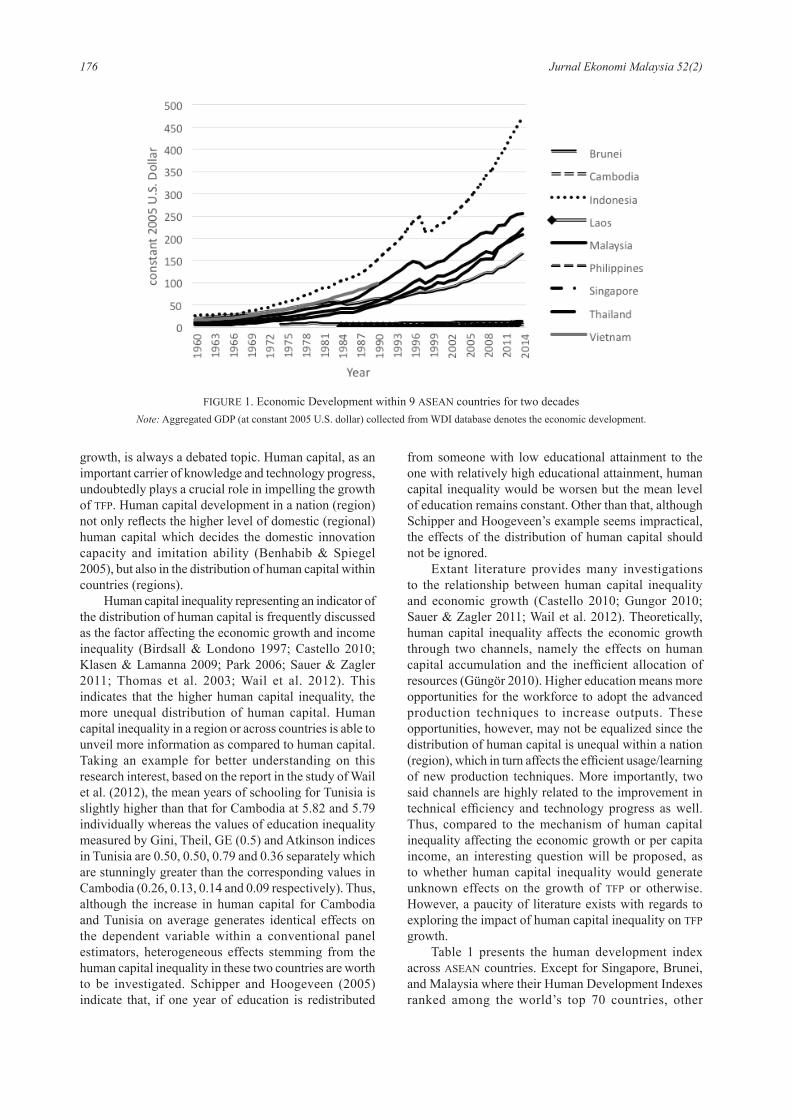
Since the 1960s, as witnessed by the world some Southeast Asian countries have shown a surprising spur in their economic growths. From Figure 1, it is obvious to detect the rapid growth trend and the influence of Asian Financial crisis during the considered period. The crisis caused slight economic recession in 1997 and 1998. Nonetheless, the majority of Southeast Asian countries recovered quite soon and remained at the previous or higher level of economic growth. Currently, the Association of Southeast Asian Nations
(ASEAN) community has set-up three main pillars, i.e. ASEAN Political and Security Community, ASEAN Economic Community (AEC), and ASEAN Socio-Culture Community, to establish a single market and an integrated economic entity within the whole ASEAN area. Regional integration and rapid growth within ASEAN countries have been compelling regional economic growth so far. The AEC is further projected to be the world’s fifth biggest economic entity by 2020. For sustainable and inclusive growth of the ASEAN economy, total factor productivity (TFP), as the main tool of exploring the source of economic growth and measuring the quality of
176 Jurnal Ekonomi Malaysia 52(2)
growth, is always a debated topic. Human capital, as an important carrier of knowledge and technology progress, undoubtedly plays a crucial role in impelling the growth of TFP. Human capital development in a nation (region) not only refl ects the higher level of domestic (regional) human capital which decides the domestic innovation capacity and imitation ability (Benhabib & Spiegel 2005), but also in the distribution of human capital within countries (regions).
Human capital inequality representing an indicator of the distribution of human capital is frequently discussed as the factor affecting the economic growth and income inequality (Birdsall & Londono 1997; Castello 2010; Klasen & Lamanna 2009; Park 2006; Sauer & Zagler 2011; Thomas et al. 2003; Wail et al. 2012). This indicates that the higher human capital inequality, the more unequal distribution of human capital. Human capital inequality in a region or across countries is able to unveil more information as compared to human capital. Taking an example for better understanding on this research interest, based on the report in the study of Wail et al. (2012), the mean years of schooling for Tunisia is slightly higher than that for Cambodia at 5.82 and 5.79 individually whereas the values of education inequality measured by Gini, Theil, GE (0.5) and Atkinson indices in Tunisia are 0.50, 0.50, 0.79 and 0.36 separately which are stunningly greater than the corresponding values in Cambodia (0.26, 0.13, 0.14 and 0.09 respectively). Thus, although the increase in human capital for Cambodia and Tunisia on average generates identical effects on the dependent variable within a conventional panel estimators, heterogeneous effects stemming from the human capital inequality in these two countries are worth to be investigated. Schipper and Hoogeveen (2005) indicate that, if one year of education is redistributed
from someone with low educational attainment to the one with relatively high educational attainment, human capital inequality would be worsen but the mean level of education remains constant. other than that, although Schipper and Hoogeveen’s example seems impractical, the effects of the distribution of human capital should not be ignored.
Extant literature provides many investigations to the relationship between human capital inequality and economic growth (Castello 2010; Gungor 2010; Sauer & Zagler 2011; Wail et al. 2012). Theoretically, human capital inequality affects the economic growth through two channels, namely the effects on human capital accumulation and the ineffi cient allocation of resources (Güngör 2010). Higher education means more opportunities for the workforce to adopt the advanced production techniques to increase outputs. These opportunities, however, may not be equalized since the distribution of human capital is unequal within a nation (region), which in turn affects the effi cient usage/learning of new production techniques. More importantly, two said channels are highly related to the improvement in technical effi ciency and technology progress as well. Thus, compared to the mechanism of human capital inequality affecting the economic growth or per capita income, an interesting question will be proposed, as to whether human capital inequality would generate unknown effects on the growth of TFP or otherwise. However, a paucity of literature exists with regards to exploring the impact of human capital inequality on TFP growth.
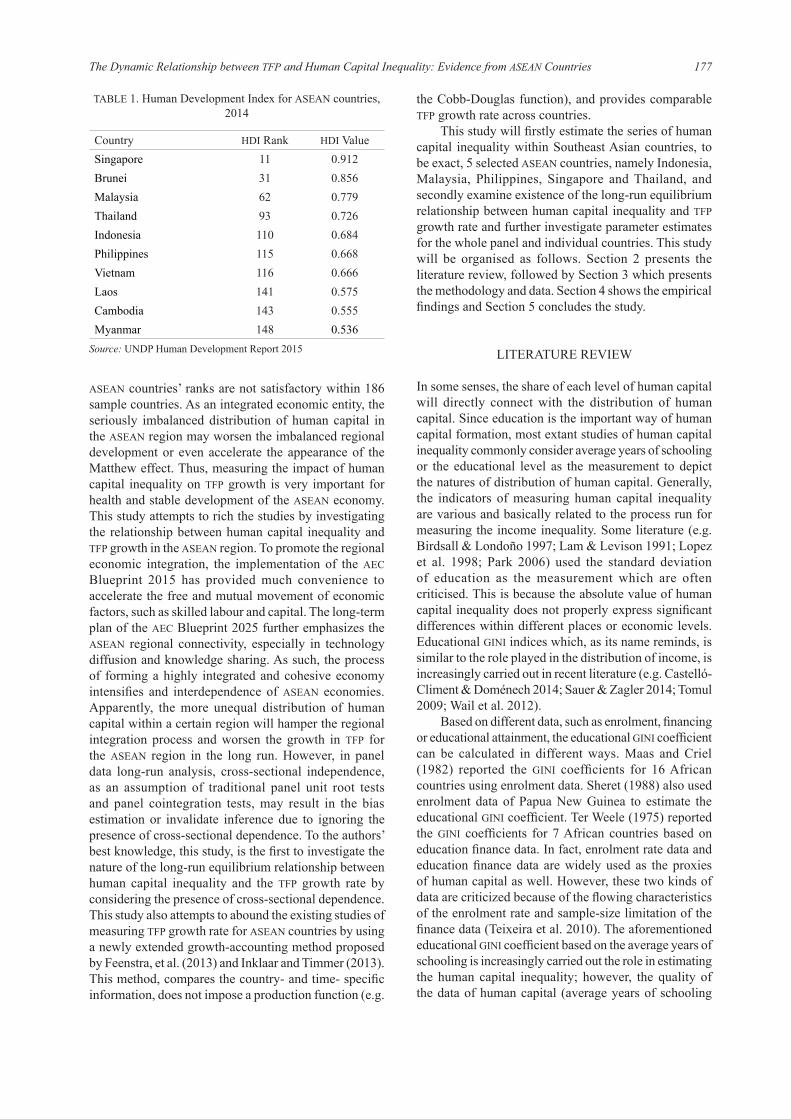
Table 1 presents the human development index across ASEAN countries. Except for Singapore, Brunei, and Malaysia where their Human Development Indexes ranked among the world’s top 70 countries, other
FIGURE 1. Economic Development within 9 ASEAN countries for two decadesNote: Aggregated GDP (at constant 2005 U.S. dollar) collected from WDI database denotes the economic development.
177The Dynamic Relationship between TFP and Human Capital Inequality: Evidence from ASEAN Countries
ASEAN countries’ ranks are not satisfactory within 186 sample countries. As an integrated economic entity, the seriously imbalanced distribution of human capital in the ASEAN region may worsen the imbalanced regional development or even accelerate the appearance of the Matthew effect. Thus, measuring the impact of human capital inequality on TFP growth is very important for health and stable development of the ASEAN economy. This study attempts to rich the studies by investigating the relationship between human capital inequality and TFP growth in the ASEAN region. To promote the regional economic integration, the implementation of the AEC Blueprint 2015 has provided much convenience to accelerate the free and mutual movement of economic factors, such as skilled labour and capital. The long-term plan of the AEC Blueprint 2025 further emphasizes the ASEAN regional connectivity, especially in technology diffusion and knowledge sharing. As such, the process of forming a highly integrated and cohesive economy intensifies and interdependence of ASEAN economies. Apparently, the more unequal distribution of human capital within a certain region will hamper the regional integration process and worsen the growth in TFP for the ASEAN region in the long run. However, in panel data long-run analysis, cross-sectional independence, as an assumption of traditional panel unit root tests and panel cointegration tests, may result in the bias estimation or invalidate inference due to ignoring the presence of cross-sectional dependence. To the authors’ best knowledge, this study, is the first to investigate the nature of the long-run equilibrium relationship between human capital inequality and the TFP growth rate by considering the presence of cross-sectional dependence. This study also attempts to abound the existing studies of measuring TFP growth rate for ASEAN countries by using a newly extended growth-accounting method proposed by Feenstra, et al. (2013) and Inklaar and Timmer (2013). This method, compares the country- and time- specific information, does not impose a production function (e.g.
the Cobb-Douglas function), and provides comparable TFP growth rate across countries.
This study will firstly estimate the series of human capital inequality within Southeast Asian countries, to be exact, 5 selected ASEAN countries, namely Indonesia, Malaysia, Philippines, Singapore and Thailand, and secondly examine existence of the long-run equilibrium relationship between human capital inequality and TFP growth rate and further investigate parameter estimates for the whole panel and individual countries. This study will be organised as follows. Section 2 presents the literature review, followed by Section 3 which presents the methodology and data. Section 4 shows the empirical findings and Section 5 concludes the study.
LITERATURE REVIEW
In some senses, the share of each level of human capital will directly connect with the distribution of human capital. Since education is the important way of human capital formation, most extant studies of human capital inequality commonly consider average years of schooling or the educational level as the measurement to depict the natures of distribution of human capital. Generally, the indicators of measuring human capital inequality are various and basically related to the process run for measuring the income inequality. Some literature (e.g. Birdsall & Londoño 1997; Lam & Levison 1991; Lopez et al. 1998; Park 2006) used the standard deviation of education as the measurement which are often criticised. This is because the absolute value of human capital inequality does not properly express significant differences within different places or economic levels. Educational GINI indices which, as its name reminds, is similar to the role played in the distribution of income, is increasingly carried out in recent literature (e.g. Castelló-Climent & Doménech 2014; Sauer & Zagler 2014; Tomul 2009; Wail et al. 2012).
Based on different data, such as enrolment, financing or educational attainment, the educational GINI coefficient can be calculated in different ways. Maas and Criel (1982) reported the GINI coefficients for 16 African countries using enrolment data. Sheret (1988) also used enrolment data of Papua New Guinea to estimate the educational GINI coefficient. Ter Weele (1975) reported the GINI coefficients for 7 African countries based on education finance data. In fact, enrolment rate data and education finance data are widely used as the proxies of human capital as well. However, these two kinds of data are criticized because of the flowing characteristics of the enrolment rate and sample-size limitation of the finance data (Teixeira et al. 2010). The aforementioned educational GINI coefficient based on the average years of schooling is increasingly carried out the role in estimating the human capital inequality; however, the quality of the data of human capital (average years of schooling
TABLE 1. Human Development Index for ASEAN countries, 2014
Country HDI Rank HDI ValueSingapore 11 0.912Brunei 31 0.856Malaysia 62 0.779Thailand 93 0.726Indonesia 110 0.684Philippines 115 0.668Vietnam 116 0.666Laos 141 0.575Cambodia 143 0.555Myanmar 148 0.536
Source: UNDP Human Development Report 2015
178 Jurnal Ekonomi Malaysia 52(2)
in Barro and Lee’s (2001) dataset) is questioned by many researchers such as de la Fuente and Domenech (2006), Cohen and Soto (2007) and Castelló-Climent and Doménech (2014). Fortunately, Barro and Lee’s (2013) educational attainment data have further improved those drawbacks and therefore provided a more reliable basis (Castelló-Climent & Doménech 2014). This study will use the educational GINI coefficient based on the educational attainment data.
With regard to the relationship between human capital inequality and income inequality, recent studies have provided various empirical evidence. Chani et al. (2014) found that there is a positive relationship between human capital inequality and income inequality in the long run using the time series data of Pakistan. They also used Granger Causality tests but found that human capital inequality does not cause income inequality. Mahmooda and Zaleha (2015) used the two-step system-GMM to investigate the human capital inequality on income inequality for 92 industrialised and less-developed countries from 1970 to 2010. Authors emphasised that equalizing the distribution of human capital within developing countries is important for policymakers to reduce income inequality. on the other hand, Castelló-Climent and Doménech (2014) used the educational attainment data modified by Barro and Lee (2013) to rebuild up the dataset of human capital inequality. They pointed out that income inequality could not be well improved through shrinking inequality in human capital since their findings show that income inequality is hardly changed within a sample of 146 countries over the period of 1950-2010, even though reduction in human capital inequality indeed occurs.
Previous literature also provides empirical evidence of the relationship between human capital inequality and economic growth. Sauer and Zagler (2011) assemble data on 137 countries for the period of 1950 to 2010 and found that human capital inequality positively affects the GDP per capita growth rate for countries with low average educational levels whereas, for countries with high average levels of education, the effects become negative but insignificant. In contrast, Castelló-Climent (2010) obtained a negative relationship between human capital inequality and economic growth using data for a panel of 102 countries over the period of 1965 to 2005. Studies using cross-countries data (e.g. Birdsall & Londoño 1997; Klasen & Lamanna 2009; López et al. 1998; Thomas et al. 2003) found the negative effects generated by human capital inequality on GDP per capita growth rate. For studies using intra-country data, Güngör (2010) adopted the educational GINI coefficient and standard deviation of education as the human capital inequality respectively and found the existence of non-linear relationship between distribution of education and economic growth. More specifically, Güngör indicates that, before reaching a certain point, the improvement in education inequality brings negative effects on economic growth;
once crossing this turning point, these effects become positive. Wail et al. (2012) identified the non-linearity in human capital inequality and economic growth by using nonparametric and semiparametric models.
Compared to the studies on the relationship between human capital inequality and economic growth, scarce studies focus on the effects generated by inequality in human capital on TFP. To our best knowledge, there is only Gong’s (2016) study investigating the dynamic relationship between human capital inequality and TFP using a panel of 29 provinces in China from 1996 to 2013. The author adopted GMM estimation methods to present that human capital inequality (Educational GINI coefficient) significantly and negatively affects TFP growth. However, Gong’s (2016) results implicitly assume homogenous effects of human capital inequality on TFP for all provinces. In fact, since human capital development in western China lags far behind that in eastern China, homogenous effects are not practical. This present study will not only provide an insight on the human capital inequality on TFP growth rate for the whole panel, but also examine the heterogeneous effects across individual countries.
METHoDoLoGY AND DATA
MoDEL SPECIFICATIoN
To investigate the long-run equilibrium relationship between TFP growth rate and human capital inequality, this study follows the approach of modelling the effect of human capital inequality on economic growth utilized in extant research (e.g. Castelló-Climent 2004; Güngör 2010). The general model specification is expressed as follows:
∆logCAit = αit + βit HCIit + Xitγ'it + εit (1)
where ∆logCAit denotes the cumulative TFP growth rate in the ith country respectively at the tth period. represents human capital inequality. The variable vector contains relative control variables, denoted as Xit. Correspondingly, γ'it is a vector of coefficients of control variables.
PANEL UNIT RooT TEST
Panel unit root tests are widely used in various analyses of dynamic panel estimation for boosting the statistical power. Panel unit root tests are currently classified into two types, namely first-generation and second-generation, according to whether or not there is the assumption of cross-sectional independence.
The first-generation panel unit root tests which include the LLC test (Levin et al. 2002), the Breitung test (Breitung 2000), the IPS test (Im et al. 2003), the Fisher-ADF and PP-Fisher tests (Choi 2001; Maddala & Wu 1999), and so on, assume that cross-sectional series are
179The Dynamic Relationship between TFP and Human Capital Inequality: Evidence from ASEAN Countries
independent. However, the cross-sectional dependence (CD) will result in size distortion and make the first-generation panel unit root tests inefficient. The second-generation panel unit root tests do not hold the assumption of cross-sectional independence and will be more reliable if cross-sectional dependence is detected. Following the assumption of cross-sectional independence, this study firstly presents the results of a series of first-generation panel unit root tests aforementioned. Furthermore, the assumption of cross-sectional independence is checked by a series of tests, namely Pesaran’s CD test (Pesaran 2004), Friedman’s test (Friedman 1937) and Free’s test (Frees 1995; 2004). This study will make use of the Pesaran test (Pesaran 2003) to give testing statistics of the second-generation panel unit root test, and the Pesaran test’s testing statistics are obtained using a regression form which is expressed as:
∆yit = ai + ρiyit–1 + ciy-t–1 + ∑pj=0dij∆y-t–j
+ ∑pj=0dij∆yt–j + εit (2)
where, ∆yit = yit – yit–1 is the first difference of the dependent variable y. ρi denotes the coefficient of the lagged autoregressive dependent variable and varies across cross sections. p is the number of lagged first differences. The subscripts i and t denote the cross section and the period. εit is the error term. In addition, y-t–1 = N–1ΣN
i=1 and ∆y-t = N–1ΣNi=1. The Pesaran test’s testing
statistic is similar to the IPS test and based on the average of each cross-section’s ADF (or DF) t-statistics. Thus, the testing statistic is commonly denoted by CIPS and CIPS = N–1ΣN
i=1ti(N,T), where ti(N,T) is referring to the t-ratio of the oLS estimate of ρi.
PANEL CoNINTEGRATIoN TESTS
Panel cointegration tests widely used in extant studies are generally categorised into two types, namely residual-based and maximum-likelihood-based (ML-based) tests. The main idea of the residual-based tests is to examine if there is a unit root in the residuals obtained by modelling a cointegrated equation. The existence of a unit root in the residuals indicates that there is no cointegration among variables. In contrast, the existence of cointegration is supported by the absence of a unit root in the residuals. The ML-based tests for panel data are extensions based on the rank trace statistics of Johansen (1988) for time series data. This study uses the residual-based tests to present the testing statistics of panel cointegration relationship among variables.
The popular residual-based tests include the Pedroni tests (Pedroni 1999; 2004), the Kao tests (McCoskey & Kao 1998; Kao 1999) and the Westerlund tests (Westerlund 2007). This study adopts the Pedroni tests and the Westerlund tests to examine the cointegrated relationship among variables, brief descriptions of two-type tests will be given. The Pedroni-type panel cointegration regression is expressed as:
yit = δ1i + δ2it + x'itβi + εit (3)
where, the subscripts i and t index the cross section and the period in the panel. x'it denotes the M-dimensional vector of independent variables which are supposed to be I(1). Correspondingly, βi is the M-dimensional vector of coefficients. δ1i and δ2i respectively denote the individual specific term and the deterministic trend term. Pedroni (1999, 2004) provided two types of statistics, namely within-dimension statistics (Panel v; Panel Rho; Panel PP and Panel ADF), and between-dimension statistics (Group Rho; Group PP and Group ADF). The null hypothesis for within-dimension and between-dimension statistics is H0: λi = 1 for all i where λi is the coefficient of the lagged autoregressive residual. The alternative hypothesis for within-dimension statistics is H1:λi = λ < 1, assuming that λis is homogenous. Instead, the heterogeneous alternative hypothesis is set for between-dimension statistics.
The Westerlund-type panel conintegration test is based on the error correction model, which is expressed as:
∆yit = ϕ'idt + αiyit–1 +φ'ixit–1 + ∑pij=1αijΔyit–j
+ ∑pij=0θijΔxit–j + εit (4)
where, The term of ϕ'idt, where ϕi = (ϕ0i, ϕ1i)', dt = (1,t)', indexes the individual specific term and the trend term. pi is the lag order. αi is called the error correction parameter indicating the existence of long-run equilibrium relationship among variables. The Westerlund panel cointegration test provides four statistics, namely Pt , Pα, Gt and Gα. The null hypothesis for the first two Pt and Pα is H0: αi=0 for all i, and the corresponding alternative hypothesis is H1: αi = α < 0 for all i. Pt and Pα indicate that the whole panel is cointegrated if the null hypothesis is rejected. The alternative hypothesis for the latter two (Gt and Gα) is the difference from the first two statistics, showing that H1: αi=0 for at least one i. Gt and Gα indicate that the cointegration relationship among variables is verified for at least one cross section if the null hypothesis is rejected.
PANEL CoNINTEGRATIoN ESTIMATIoN
Since the estimator of the conventional oLS regression is second-order asymptotically biased with invalid standard errors (Kao & Chen 1995), the Fully Modified oLS (FMoLS) and Dynamic oLS (DoLS) are widely adopted to provide the alternative oLS estimators for panel cointegration estimation. In this study, both estimators will be used for panel cointegration estimation and briefly introduced.
FMoLS ESTIMAToR
Given a panel cointegrated system with the fixed effects,
yit = αi + x'itβ + uit,∆xit = ϵit (5)
180 Jurnal Ekonomi Malaysia 52(2)
where, x'it ~ I(1) and ωit = (uit, ϵit)' ~ I(0). x'it denotes the M-dimensional vector of independent variables and, correspondingly, β is the M-dimensional vector of coefficients. The ωit’s long-run covariance matrix is Ωi which is expressed as:
Ωi = [Ω11i Ω'21i
Ω21i Ω22i ]where, Ωi here is assumed to be heterogeneous, which means that variances are varying across the individual units. Ω11i is the long-run variance of uit and Ω22i is the M × M matrix of the long-run covariance of ϵit. Ω21i is the M × 1 vector of the long-run covariance between uit and ϵit. The lower triangular matrix, Li, is defined as a component of Ωi:
Ωi = LiL'i (6)
where, L11i = (Ω11i – Ω221i/Ω22i)1/2, L21i = Ω21i/Ω1/2
22i and L22i = Ω1/2
22i. Thus, the coefficient for the group-mean panel FMoLS estimator is expressed as:
βgmFM = N–1∑Ni=1(∑T
i=1(xit – xi)2)–1
(∑Ti=1(xit – xi)yit – TΥ i) (7)
where, yit = (yit – yi) – L21i–––L22i
∆xit and Υ i ≡ Γ 21i + Ω 21i – L21i–––L22i
(Γ 22i + Ω 022i). N and T denote the number of cross
sections and periods. xi means the mean of the specific individual. Eq. 7 can be simplified as:
βgmFM = N–1 ∑Ni=1βFMi (8)
where, βFMi is the coefficient for the pooled FMoLS estimator. The above procedures of obtaining the FMoLS estimator consider the heterogeneous cointegrating relationships. The pooled FMoLS estimator imposes an identical value on coefficients for all individual units, which is described as ‘unrealistic’ since, in reality, the panel data show a difference across countries. This study will present both the pooled and group mean FMoLS estimators. Meanwhile, the results for individual countries will also be presented under the mean group FMoLS framework.
DoLS ESTIMAToR
The DoLS estimator can be obtained by a dynamic panel model which is expressed as:
yit = αi + x'it β + ∑qij=–qi cij ∆xit+j + vit (9)
The difference from the FMoLS estimator’s cointegrated system (Eq. 5) is uit = ∑qi
j=-qi cij ∆xit+j + vit, where qi is the order of lag and lead which is to eliminate possible problems caused by serial correlation and endogeneity. The coefficient, βgmDoLS for the group mean panel DoLS estimator can be constructed by:
βgmDoLS = [N–1∑Ni=1(∑T
t=1 zitz'it)–1(∑Tt=1zit yit)]1 (10)
where, zit = (∆xit–qi, ...∆xit, ...∆xit+qi). yit = yit – yi. zit is the 2(q + 1)-dimensional vector of regressors. The subscript 1 outside the brackets means that the first element of the vector for calculating the pooled slope coefficient is considered. Again, similar to the group-mean panel FMoLS estimator, βgmDoLS can be simplified as:
βgmDoLS = N–1∑Ni=1βDoLSi (11)
where, βDoLSi is the coefficient for the pooled DoLS estimator. Similarly, it imposes the homogenous alternative hypothesis indicating the coefficient for all individual units equal a constant value. This study will illustrate the group-mean and pooled DoLS estimators; the results for individual countries under the mean group DoLS framework for comparing to the FMoLS’s counterparts.
SEEMINGLY UNRELATED REGRESSIoN
Seemingly Unrelated Regression (SUR) is used as robustness checking for the results of individual countries obtained using group-mean FMoLS and DoLS estimators. SUR estimation proposed by Zellner (1962) forms a system of linear equations. Unlike another type of the system of equations (Simultaneous Equations System) which is related to the endogeneity problem within the system of equation (i.e., one independent variable in an equation is a dependent variable in another equation), equations in SUR with their own dependent and independent variables are linked by correlation across the errors of equations. A panel of 5 countries over 24 years is good for the SUR estimator (T > N) for cross section units and not feasible for those estimators, like instrumental variable (IV) and GMM, based on the circumstance of (T < N). Thus, SUR allowing correlation across cross-section errors provides a good comparison of testing results across individual countries.
VARIABLE SELECTIoN AND CALCULATIoN
THE MEASUREMENT oF TFP GRoWTH RATE
The representation of TFP growth rate is given by the following algebraic identities:
A.i(t)––––
Ai(t) =
dlogA i(t)–––––––dt
= Ai(t + 1) – Ai(t)––––––––––––
Ai(t) =
Ai(t + 1)–––––––
Ai(t) – 1
TFP growth rate is an interest in this study. Its measurement will follow the way of partly being used to measure the TFP level across countries or over time in Penn World Table (PWT) 8.1. Algebraic identities above
show that the TFP level, Ai(t + 1)–––––––
Ai(t), is the focal point.
181The Dynamic Relationship between TFP and Human Capital Inequality: Evidence from ASEAN Countries
According to Inklaar and Timmer (2013) and Feenstra et al. (2013), firstly, the TFP level is defined as:
TFPit–––––
TFPjt–1 =
GDPit––––––GDPjt–1
/Qj,t,t–1 (12)
where, TFPit–––––
TFPjt–1 means the TFP level obtained by
calculating the combination of inputs in real terms such as real gross domestic product (GDP) and real capital stock1 at constant national price (2005 = 1) over observed periods. More importantly, Qj,t,t–1 is the Törnqvist index of factor endowments, which is given by:
Qj,t,t–1 = 1–2
(αt + αt–1)( Ljt–––Ljt–1
Hjt–––
Hjt–1)
+ [1 – 1–2
(αt + αt–1)( Kjt–––Kjt–1
)] (13)
where, Ljt, Hjt and Kjt are respectively representing the number of employed labour, human capital and real capital stock. The labour share is denoted by αt or αt–1. It is worth noting that TFP level (Eq. 12) is based on the previous year as a base. This study employs the cumulative TFP growth rate which use the starting period as the base for picturing the growth trends and cumulative changes throughout the entire period. Thus, these variables (e.g. α0 Lj0 Hj0 Kj0 GDPj0) in specification of the cumulative TFP (Eqs. 14 and 15.) are initial values at the starting period and other variables behave the same in Eqs. 12 and 13.
TFPjt––––TFPj0
= GDPjt–––––GDPj0
/Qj,t,0 (14)
Qj,t,0 = 1–2
(αt + α0)(Ljt––Lj0
Hjt––Hj0
) + [1 – 1–2
(αt + α0)(Kjt––Kj0
)] (15)
THE MEASUREMENT oF HUMAN CAPITAL INEQUALITY
According to the method of measuring the human capital inequality by Thomas et al. (2003), the expression of the educational GINI coefficient carried out in this study can be shown as follows:
HCI = (1–E)Σξ
ψ=2Σψ–1ψ=1pψ|yψ – pω|yω (16)
E = Σξψ=1pψyψ (17)
where, the term of denotes the educational GINI coefficient. denotes the number of the educational levels, which, according to the Barro-Lee classification of educational levels, is 4, namely no schooling, primary schooling, secondary schooling and tertiary schooling. The basic schooling years for each educational level are denoted by the terms of yψ and yω .The basic schooling year for each education tier will be defined as 0, 6, 12
and 18 years respectively. The terms of and respectively denote the percentages of population with the ψth and ωth educational levels2. E means the mean years of schooling which is measured using Eq. 17 for consistency of the Thomas et al.’s (2003) measurement.
Data Description Data for parameters estimation and the model specification are mainly sourced from two database, namely PWT 8.1 and the World Development Indicator (WDI) 2016. The labour share, , and the depreciation rate, , are collected from PWT 8.1. Both are time- and country- specific. Data for educational attainments are sourced from Barro and Lee (2013) database. Since the number of variables in Westerlund-type panel cointegration test is subject to the data size, government expenditure, which is calculated using the share of government consumption in real GDP, is the only one control variable in the model for consistency.
The panel data used in this study consist of 5 cross sections, namely Indonesia, Malaysia, Philippines, Singapore and Thailand in 24 years spanning from 1990 to 2014. Human capital development in the three countries (Cambodia, Laos and Vietnam) still lags far behind that of 5 selected ASEAN countries. Therefore, the means of human capital inequality of these three countries are much higher over the whole period. In addition, cross-border labour movement is, as mentioned, becoming easier within the whole ASEAN area. The main direction of labour movement is from relatively-less-developed countries to relatively-more-developed countries. Two types of population, Unskilled-uneducated and skilled-educated, are more likely to immigrate out of their hometown for job opportunities and higher salaries. Human capital inequality of these three countries may not influence TFP growth significantly to a certain extent. Thus, including these outlier-type data will cause inaccuracy of long-run equilibrium relationship between human capital inequality and TFP growth.
EMPIRICAL FINDINGS
The results section generally includes two parts. The first part presents the descriptive statistics of variables and a series of tests which have been introduced in previous section. The second part contains the results for the whole panel and for individual countries obtained using the FMoLS and DoLS estimators and the robustness analysis obtained using SUR estimation.
DESCRIPTIVE STATISTICS
Table 2 describes the summary statistics in terms of the number of observations, the mean value and standard deviation and so on. The cumulative TFP growth rate uses the initial period as the basis and therefore data for the starting period are not available. Table 3 presents the
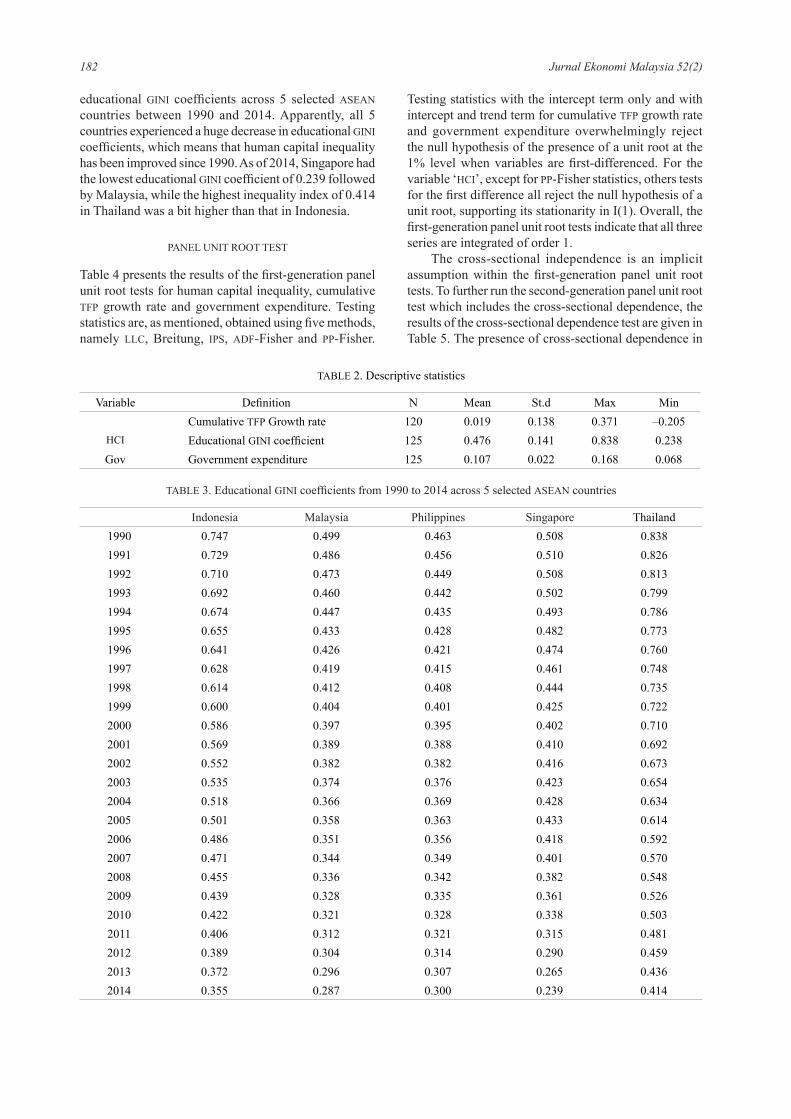
182 Jurnal Ekonomi Malaysia 52(2)
educational GINI coefficients across 5 selected ASEAN countries between 1990 and 2014. Apparently, all 5 countries experienced a huge decrease in educational GINI coefficients, which means that human capital inequality has been improved since 1990. As of 2014, Singapore had the lowest educational GINI coefficient of 0.239 followed by Malaysia, while the highest inequality index of 0.414 in Thailand was a bit higher than that in Indonesia.
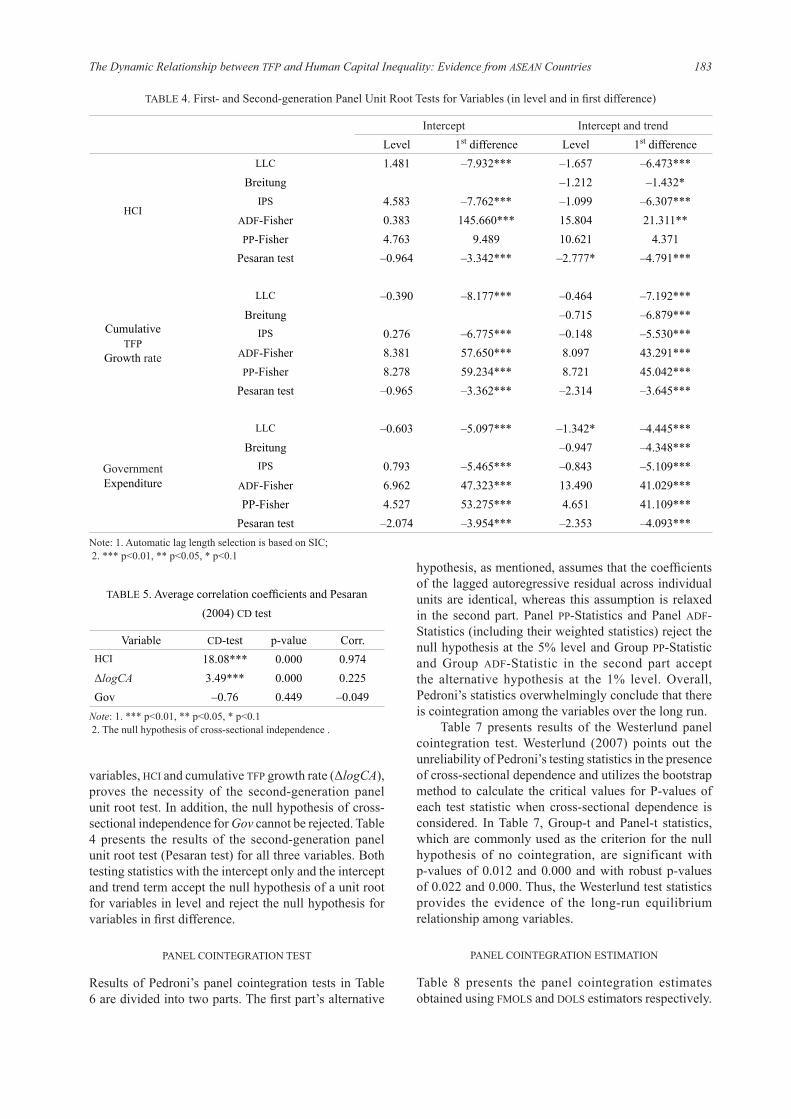
PANEL UNIT RooT TEST
Table 4 presents the results of the first-generation panel unit root tests for human capital inequality, cumulative TFP growth rate and government expenditure. Testing statistics are, as mentioned, obtained using five methods, namely LLC, Breitung, IPS, ADF-Fisher and PP-Fisher.
Testing statistics with the intercept term only and with intercept and trend term for cumulative TFP growth rate and government expenditure overwhelmingly reject the null hypothesis of the presence of a unit root at the 1% level when variables are first-differenced. For the variable ‘HCI’, except for PP-Fisher statistics, others tests for the first difference all reject the null hypothesis of a unit root, supporting its stationarity in I(1). overall, the first-generation panel unit root tests indicate that all three series are integrated of order 1.
The cross-sectional independence is an implicit assumption within the first-generation panel unit root tests. To further run the second-generation panel unit root test which includes the cross-sectional dependence, the results of the cross-sectional dependence test are given in Table 5. The presence of cross-sectional dependence in
TABLE 2. Descriptive statistics
Variable Definition N Mean St.d Max MinCumulative TFP Growth rate 120 0.019 0.138 0.371 –0.205
HCI Educational GINI coefficient 125 0.476 0.141 0.838 0.238Gov Government expenditure 125 0.107 0.022 0.168 0.068
TABLE 3. Educational GINI coefficients from 1990 to 2014 across 5 selected ASEAN countries
Indonesia Malaysia Philippines Singapore Thailand1990 0.747 0.499 0.463 0.508 0.8381991 0.729 0.486 0.456 0.510 0.8261992 0.710 0.473 0.449 0.508 0.8131993 0.692 0.460 0.442 0.502 0.7991994 0.674 0.447 0.435 0.493 0.7861995 0.655 0.433 0.428 0.482 0.7731996 0.641 0.426 0.421 0.474 0.7601997 0.628 0.419 0.415 0.461 0.7481998 0.614 0.412 0.408 0.444 0.7351999 0.600 0.404 0.401 0.425 0.7222000 0.586 0.397 0.395 0.402 0.7102001 0.569 0.389 0.388 0.410 0.6922002 0.552 0.382 0.382 0.416 0.6732003 0.535 0.374 0.376 0.423 0.6542004 0.518 0.366 0.369 0.428 0.6342005 0.501 0.358 0.363 0.433 0.6142006 0.486 0.351 0.356 0.418 0.5922007 0.471 0.344 0.349 0.401 0.5702008 0.455 0.336 0.342 0.382 0.5482009 0.439 0.328 0.335 0.361 0.5262010 0.422 0.321 0.328 0.338 0.5032011 0.406 0.312 0.321 0.315 0.4812012 0.389 0.304 0.314 0.290 0.4592013 0.372 0.296 0.307 0.265 0.4362014 0.355 0.287 0.300 0.239 0.414
183The Dynamic Relationship between TFP and Human Capital Inequality: Evidence from ASEAN Countries
hypothesis, as mentioned, assumes that the coefficients of the lagged autoregressive residual across individual units are identical, whereas this assumption is relaxed in the second part. Panel PP-Statistics and Panel ADF-Statistics (including their weighted statistics) reject the null hypothesis at the 5% level and Group PP-Statistic and Group ADF-Statistic in the second part accept the alternative hypothesis at the 1% level. overall, Pedroni’s statistics overwhelmingly conclude that there is cointegration among the variables over the long run.
Table 7 presents results of the Westerlund panel cointegration test. Westerlund (2007) points out the unreliability of Pedroni’s testing statistics in the presence of cross-sectional dependence and utilizes the bootstrap method to calculate the critical values for P-values of each test statistic when cross-sectional dependence is considered. In Table 7, Group-t and Panel-t statistics, which are commonly used as the criterion for the null hypothesis of no cointegration, are significant with p-values of 0.012 and 0.000 and with robust p-values of 0.022 and 0.000. Thus, the Westerlund test statistics provides the evidence of the long-run equilibrium relationship among variables.
PANEL CoINTEGRATIoN ESTIMATIoN
Table 8 presents the panel cointegration estimates obtained using FMoLS and DoLS estimators respectively.
TABLE 4. First- and Second-generation Panel Unit Root Tests for Variables (in level and in first difference)
Intercept Intercept and trendLevel 1st difference Level 1st difference
HCI
LLC 1.481 –7.932*** –1.657 –6.473***Breitung –1.212 –1.432*
IPS 4.583 –7.762*** –1.099 –6.307***ADF-Fisher 0.383 145.660*** 15.804 21.311**PP-Fisher 4.763 9.489 10.621 4.371
Pesaran test –0.964 –3.342*** –2.777* –4.791***
CumulativeTFP
Growth rate
LLC –0.390 –8.177*** –0.464 –7.192***Breitung –0.715 –6.879***
IPS 0.276 –6.775*** –0.148 –5.530***ADF-Fisher 8.381 57.650*** 8.097 43.291***PP-Fisher 8.278 59.234*** 8.721 45.042***
Pesaran test –0.965 –3.362*** –2.314 –3.645***
GovernmentExpenditure
LLC –0.603 –5.097*** –1.342* –4.445***Breitung –0.947 –4.348***
IPS 0.793 –5.465*** –0.843 –5.109***ADF-Fisher 6.962 47.323*** 13.490 41.029***PP-Fisher 4.527 53.275*** 4.651 41.109***
Pesaran test –2.074 –3.954*** –2.353 –4.093***Note: 1. Automatic lag length selection is based on SIC; 2. *** p<0.01, ** p<0.05, * p<0.1
TABLE 5. Average correlation coefficients and Pesaran (2004) CD test
Variable CD-test p-value Corr.HCI 18.08*** 0.000 0.974ΔlogCA 3.49*** 0.000 0.225Gov –0.76 0.449 –0.049
Note: 1. *** p<0.01, ** p<0.05, * p<0.1 2. The null hypothesis of cross-sectional independence .
variables, HCI and cumulative TFP growth rate (ΔlogCA), proves the necessity of the second-generation panel unit root test. In addition, the null hypothesis of cross-sectional independence for Gov cannot be rejected. Table 4 presents the results of the second-generation panel unit root test (Pesaran test) for all three variables. Both testing statistics with the intercept only and the intercept and trend term accept the null hypothesis of a unit root for variables in level and reject the null hypothesis for variables in first difference.
PANEL CoINTEGRATIoN TEST
Results of Pedroni’s panel cointegration tests in Table 6 are divided into two parts. The first part’s alternative
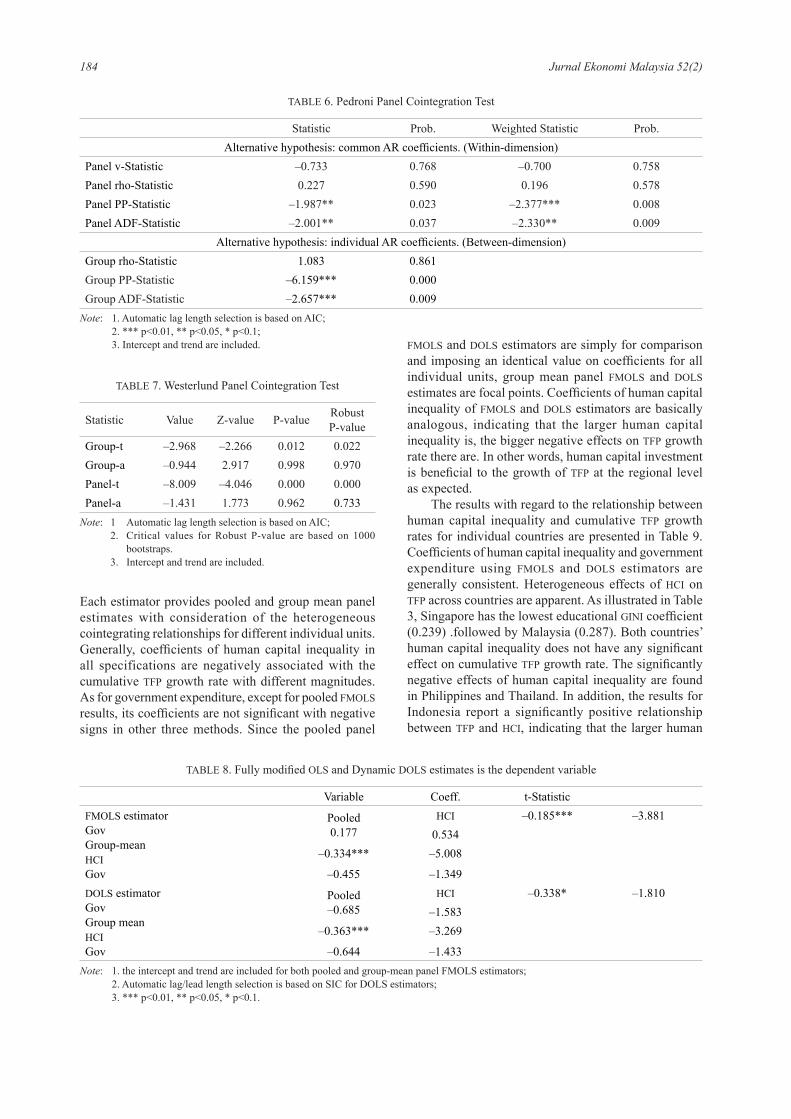
184 Jurnal Ekonomi Malaysia 52(2)
Each estimator provides pooled and group mean panel estimates with consideration of the heterogeneous cointegrating relationships for different individual units. Generally, coefficients of human capital inequality in all specifications are negatively associated with the cumulative TFP growth rate with different magnitudes. As for government expenditure, except for pooled FMoLS results, its coefficients are not significant with negative signs in other three methods. Since the pooled panel
TABLE 7. Westerlund Panel Cointegration Test
Statistic Value Z-value P-value Robust P-value
Group-t –2.968 –2.266 0.012 0.022Group-a –0.944 2.917 0.998 0.970Panel-t –8.009 –4.046 0.000 0.000Panel-a –1.431 1.773 0.962 0.733
Note: 1 Automatic lag length selection is based on AIC; 2. Critical values for Robust P-value are based on 1000
bootstraps. 3. Intercept and trend are included.
FMoLS and DoLS estimators are simply for comparison and imposing an identical value on coefficients for all individual units, group mean panel FMoLS and DoLS estimates are focal points. Coefficients of human capital inequality of FMoLS and DoLS estimators are basically analogous, indicating that the larger human capital inequality is, the bigger negative effects on TFP growth rate there are. In other words, human capital investment is beneficial to the growth of TFP at the regional level as expected.
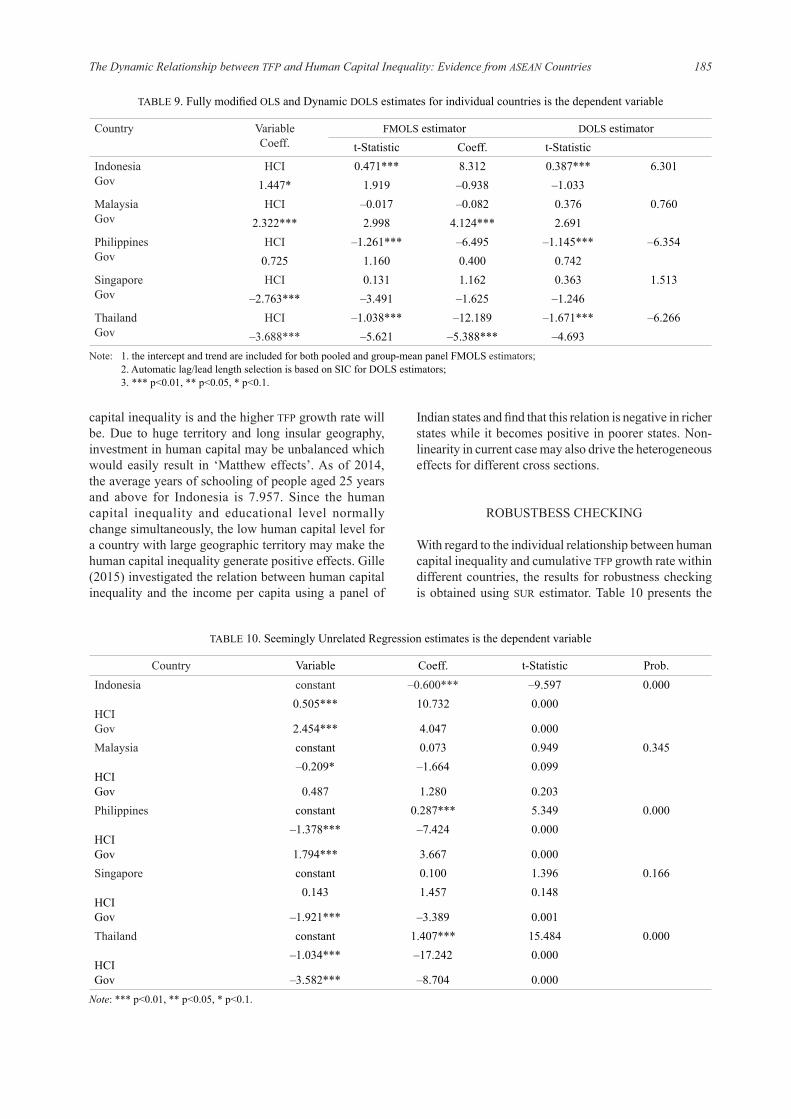
The results with regard to the relationship between human capital inequality and cumulative TFP growth rates for individual countries are presented in Table 9. Coefficients of human capital inequality and government expenditure using FMoLS and DoLS estimators are generally consistent. Heterogeneous effects of HCI on TFP across countries are apparent. As illustrated in Table 3, Singapore has the lowest educational GINI coefficient (0.239) .followed by Malaysia (0.287). Both countries’ human capital inequality does not have any significant effect on cumulative TFP growth rate. The significantly negative effects of human capital inequality are found in Philippines and Thailand. In addition, the results for Indonesia report a significantly positive relationship between TFP and HCI, indicating that the larger human
TABLE 8. Fully modified oLS and Dynamic DoLS estimates is the dependent variable
Variable Coeff. t-StatisticFMoLS estimatorGovGroup-meanHCIGov
Pooled0.177
HCI –0.185*** –3.8810.534
–0.334*** –5.008
–0.455 –1.349DoLS estimatorGovGroup meanHCIGov
Pooled–0.685
HCI –0.338* –1.810–1.583
–0.363*** –3.269
–0.644 –1.433Note: 1. the intercept and trend are included for both pooled and group-mean panel FMoLS estimators; 2. Automatic lag/lead length selection is based on SIC for DOLS estimators; 3. *** p<0.01, ** p<0.05, * p<0.1.
TABLE 6. Pedroni Panel Cointegration Test
Statistic Prob. Weighted Statistic Prob.Alternative hypothesis: common AR coefficients. (Within-dimension)
Panel v-Statistic –0.733 0.768 –0.700 0.758Panel rho-Statistic 0.227 0.590 0.196 0.578Panel PP-Statistic –1.987** 0.023 –2.377*** 0.008Panel ADF-Statistic –2.001** 0.037 –2.330** 0.009
Alternative hypothesis: individual AR coefficients. (Between-dimension)Group rho-Statistic 1.083 0.861Group PP-Statistic –6.159*** 0.000Group ADF-Statistic –2.657*** 0.009
Note: 1. Automatic lag length selection is based on AIC; 2. *** p<0.01, ** p<0.05, * p<0.1; 3. Intercept and trend are included.
185The Dynamic Relationship between TFP and Human Capital Inequality: Evidence from ASEAN Countries
capital inequality is and the higher TFP growth rate will be. Due to huge territory and long insular geography, investment in human capital may be unbalanced which would easily result in ‘Matthew effects’. As of 2014, the average years of schooling of people aged 25 years and above for Indonesia is 7.957. Since the human capital inequality and educational level normally change simultaneously, the low human capital level for a country with large geographic territory may make the human capital inequality generate positive effects. Gille (2015) investigated the relation between human capital inequality and the income per capita using a panel of
Indian states and find that this relation is negative in richer states while it becomes positive in poorer states. Non-linearity in current case may also drive the heterogeneous effects for different cross sections.
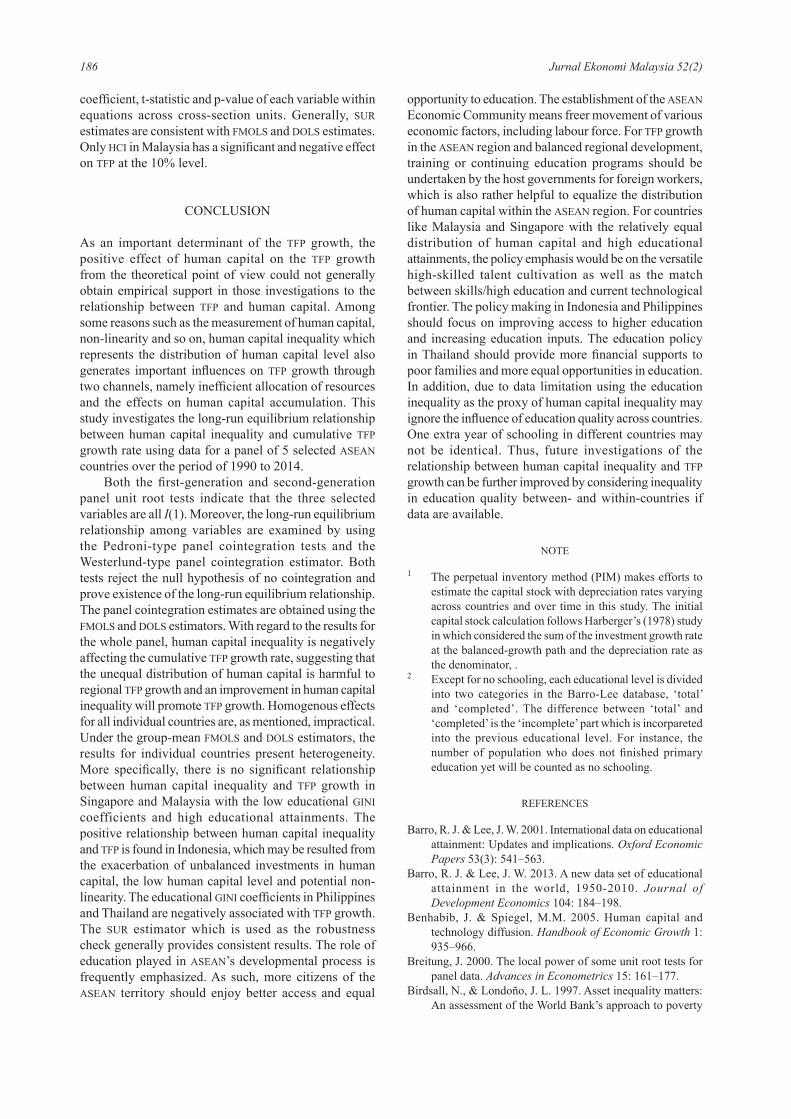
RoBUSTBESS CHECKING
With regard to the individual relationship between human capital inequality and cumulative TFP growth rate within different countries, the results for robustness checking is obtained using SUR estimator. Table 10 presents the
TABLE 9. Fully modified oLS and Dynamic DoLS estimates for individual countries is the dependent variable
Country VariableCoeff.
FMoLS estimator DoLS estimatort-Statistic Coeff. t-Statistic
IndonesiaGov
HCI 0.471*** 8.312 0.387*** 6.301 1.447* 1.919 –0.938 –1.033
MalaysiaGov
HCI –0.017 –0.082 0.376 0.760 2.322*** 2.998 4.124*** 2.691
PhilippinesGov
HCI –1.261*** –6.495 –1.145*** –6.354 0.725 1.160 0.400 0.742
SingaporeGov
HCI 0.131 1.162 0.363 1.513 –2.763*** –3.491 –1.625 –1.246
ThailandGov
HCI –1.038*** –12.189 –1.671*** –6.266 –3.688*** –5.621 –5.388*** –4.693
Note: 1. the intercept and trend are included for both pooled and group-mean panel FMoLS estimators; 2. Automatic lag/lead length selection is based on SIC for DOLS estimators; 3. *** p<0.01, ** p<0.05, * p<0.1.
TABLE 10. Seemingly Unrelated Regression estimates is the dependent variable
Country Variable Coeff. t-Statistic Prob.Indonesia
HCIGov
constant –0.600*** –9.597 0.0000.505*** 10.732 0.000
2.454*** 4.047 0.000Malaysia
HCIGov
constant 0.073 0.949 0.345–0.209* –1.664 0.099
0.487 1.280 0.203Philippines
HCIGov
constant 0.287*** 5.349 0.000–1.378*** –7.424 0.000
1.794*** 3.667 0.000Singapore
HCIGov
constant 0.100 1.396 0.1660.143 1.457 0.148
–1.921*** –3.389 0.001Thailand
HCIGov
constant 1.407*** 15.484 0.000–1.034*** –17.242 0.000
–3.582*** –8.704 0.000Note: *** p<0.01, ** p<0.05, * p<0.1.
186 Jurnal Ekonomi Malaysia 52(2)
coefficient, t-statistic and p-value of each variable within equations across cross-section units. Generally, SUR estimates are consistent with FMoLS and DoLS estimates. only HCI in Malaysia has a significant and negative effect on TFP at the 10% level.
CoNCLUSIoN
As an important determinant of the TFP growth, the positive effect of human capital on the TFP growth from the theoretical point of view could not generally obtain empirical support in those investigations to the relationship between TFP and human capital. Among some reasons such as the measurement of human capital, non-linearity and so on, human capital inequality which represents the distribution of human capital level also generates important influences on TFP growth through two channels, namely inefficient allocation of resources and the effects on human capital accumulation. This study investigates the long-run equilibrium relationship between human capital inequality and cumulative TFP growth rate using data for a panel of 5 selected ASEAN countries over the period of 1990 to 2014.
Both the first-generation and second-generation panel unit root tests indicate that the three selected variables are all I(1). Moreover, the long-run equilibrium relationship among variables are examined by using the Pedroni-type panel cointegration tests and the Westerlund-type panel cointegration estimator. Both tests reject the null hypothesis of no cointegration and prove existence of the long-run equilibrium relationship. The panel cointegration estimates are obtained using the FMoLS and DoLS estimators. With regard to the results for the whole panel, human capital inequality is negatively affecting the cumulative TFP growth rate, suggesting that the unequal distribution of human capital is harmful to regional TFP growth and an improvement in human capital inequality will promote TFP growth. Homogenous effects for all individual countries are, as mentioned, impractical. Under the group-mean FMoLS and DoLS estimators, the results for individual countries present heterogeneity. More specifically, there is no significant relationship between human capital inequality and TFP growth in Singapore and Malaysia with the low educational GINI coefficients and high educational attainments. The positive relationship between human capital inequality and TFP is found in Indonesia, which may be resulted from the exacerbation of unbalanced investments in human capital, the low human capital level and potential non-linearity. The educational GINI coefficients in Philippines and Thailand are negatively associated with TFP growth. The SUR estimator which is used as the robustness check generally provides consistent results. The role of education played in ASEAN’s developmental process is frequently emphasized. As such, more citizens of the ASEAN territory should enjoy better access and equal
opportunity to education. The establishment of the ASEAN Economic Community means freer movement of various economic factors, including labour force. For TFP growth in the ASEAN region and balanced regional development, training or continuing education programs should be undertaken by the host governments for foreign workers, which is also rather helpful to equalize the distribution of human capital within the ASEAN region. For countries like Malaysia and Singapore with the relatively equal distribution of human capital and high educational attainments, the policy emphasis would be on the versatile high-skilled talent cultivation as well as the match between skills/high education and current technological frontier. The policy making in Indonesia and Philippines should focus on improving access to higher education and increasing education inputs. The education policy in Thailand should provide more financial supports to poor families and more equal opportunities in education. In addition, due to data limitation using the education inequality as the proxy of human capital inequality may ignore the influence of education quality across countries. one extra year of schooling in different countries may not be identical. Thus, future investigations of the relationship between human capital inequality and TFP growth can be further improved by considering inequality in education quality between- and within-countries if data are available.
NoTE
1 The perpetual inventory method (PIM) makes efforts to estimate the capital stock with depreciation rates varying across countries and over time in this study. The initial capital stock calculation follows Harberger’s (1978) study in which considered the sum of the investment growth rate at the balanced-growth path and the depreciation rate as the denominator, .
2 Except for no schooling, each educational level is divided into two categories in the Barro-Lee database, ‘total’ and ‘completed’. The difference between ‘total’ and ‘completed’ is the ‘incomplete’ part which is incorpareted into the previous educational level. For instance, the number of population who does not finished primary education yet will be counted as no schooling.
REFERENCES
Barro, R. J. & Lee, J. W. 2001. International data on educational attainment: Updates and implications. Oxford Economic Papers 53(3): 541–563.
Barro, R. J. & Lee, J. W. 2013. A new data set of educational attainment in the world, 1950-2010. Journal of Development Economics 104: 184–198.
Benhabib, J. & Spiegel, M.M. 2005. Human capital and technology diffusion. Handbook of Economic Growth 1: 935–966.
Breitung, J. 2000. The local power of some unit root tests for panel data. Advances in Econometrics 15: 161–177.
Birdsall, N., & Londoño, J. L. 1997. Asset inequality matters: An assessment of the World Bank’s approach to poverty
187The Dynamic Relationship between TFP and Human Capital Inequality: Evidence from ASEAN Countries
reduction. The American Economic Review 87(2): 32–37.
Castello-Climent, A. 2004. A Reassessment of the Relationship between Inequality and Growth: What Human Capital Inequality Data Say? IVIE Working Paper WP-EC 2004-15.
Castelló-Climent, A. 2010. Channels through which human capital inequality influences economic growth. Journal of Human Capital 4(4): 394–450.
Castelló-Climent, A. & Doménech, R. 2014. Human Capital and Income Inequality: Some Facts And Some Puzzles. Retrieved from BBVA Research: https://www. bbvaresearch.com/wp-content/uploads/migrados/WP_ 1228_tcm348-430101.pdf.
Chani, M. I., Jan, S. A., Pervaiz, Z. & Chaudhary, A. R. 2014. Human capital inequality and income inequality: Testing for causality. Quality & Quantity 48(1): 1–8.
Choi, I. 2001. Unit root tests for panel data. Journal of International Money and Finance 20: 249–272.
Cohen, D. & Soto, M. 2007. Growth and human capital: Good data, good results. Journal of Economic Growth 12(1): 51–76.
de la Fuente, A. & Domenech, R. 2006. Human capital in growth regressions: How much difference does data quality make? Journal of the European Economic Association 4(1): 1–36.
Delpachitra, S. & Dai, P.V. 2012. The determinants of TFP growth in middle income economies in ASEAN: Implication of financial crises. International Journal of Business and Economics 11(1): 63–88.
Feenstra, R. C., Inklaar R. & Timmer, M. P. 2013. The Next Generation of the Penn World Table. mimeo, available at: www.ggdc.net/pwt.
Frees, E.W. 1995. Assessing cross-sectional correlation in panel data. Journal of Econometrics 69: 393–414.
Frees, E. W. 2004. Longitudinal and Panel Data: Analysis and Applications in the Social Sciences. Cambridge University Press.
Friedman, M. 1937. The use of ranks to avoid the assumption of normality implicit in the analysis of variance. Journal of the American Statistical Association 32: 675–701.
Gille, V. 2015. Distribution of human capital and income: An empirical study on Indian States. Journal of Macroeconomics 43: 239–256.
Gong, C. 2016. Impact of human capital inequality on total factor productivity in China. Modern Economy 7(05): 561.
Güngör, N.D. 2010. Education, human capital inequality and economic growth: Evidence from Turkey. Regional and Sectoral Economic Studies 10(2): 53–71.
Im, K.S., Pesaran, M.H. & Shin, Y. 2003. Testing for unit roots in heterogeneous panels. Journal of Econometrics 115: 53–74.
Inklaar, R. & Timmer, M. 2013. Capital, labor, and TFP in PWT8.0. Working Paper, Groningen Growth and Development Centre.
Harberger, A. 1978. Perspectives on capital and technology in less developed countries. Contemporary Economic Analysis, edited by In Michael J. Artis and Avelino R. Nobay. London: Croom Helm.
Johansen, S. 1988. Statistical analysis of cointegrating vectors. Journal of Economic Dynamics and Control 12: 231–254.
Kao, C. 1999. Spurious regression and residual-based tests for cointegration in panel data. Journal of Econometrics 90(1): 1–44.
Kao C. & Chen B. 1995. On the Estimation and Inference of a Cointegrated Regression in Panel Data When the Cross-Section and Time-Series Dimensions Are Comparable in Magnitude. Department of Economics.
Kao, C., & Chiang, M. H. 2000. on the estimation and in-ference of a cointegrated regression in panel Da-Ta. Advances of Econometrics 15: 7–51.
Kim, J. I. & Lau, L. 1994. The sources of economic growth of the East Asian newly industrialized countries. Journal of the Japanese and International Economies 8: 235–271.
Klasen, S. & Lamanna, F. 2009. The impact of gender inequality in education and employment on economic growth: New evidence for a panel of countries. Feminist Economics 15(3): 91–132.
Lam, D. & Levison, D. 1991. Declining inequality in schooling in Brazil and its effects on inequality in earnings. Journal of Development Economics 37(1-2): 199–225.
Lopez, R., Thomas, V. & Wang Y. 1998. Addressing the Education Puzzle. The Distribution of Education and Economic Reform. World Bank Policy Research Working Paper no.2031.
Maas, J. L. & Criel, C. 1982. Distribution of primary school Enrolments in Eastern Africa. World Bank Staff Working Papers No. 511. The World Bank, Washington D. C.
Maddala, G.S. & Wu, S. 1999. A comparative study of unit root tests with panel data and a new simple test. Oxford Bulletin of Economics and Statistics 61: 631–652.
Mahmooda, S., & Noorb, Z. M. 2015. Effect of human capital inequality and income inequality, estimated by Generalized Method of Moment (GMM). Asia Pacific Journal of Advanced Business and Social Studies 1(1): 62–71.
McCoskey, S. & Kao, C. 1998. A residual-based test of the null of cointegration in panel data. Econometric Reviews 17(1): 57–84.
Nelson, R. R. & Phelps, E. S. 1966. Investment in humans, technological diffusion, and economic growth. The American Economic Review 56(1/2): 69–75.
Park, J. 2006. Dispersion of human capital and economic growth. Journal of Macroeconomics 28(3): 520–539.
Pedroni, P. 1999. Critical values for cointegration tests in heterogeneous panels with multiple regressors. Oxford Bulletin of Economics and Statistics 61: 653–670.
Pedroni, P. 2000. Fully Modified oLS for heterogeneous Cointegrated Panels. In Nonstationary Panels, Panel Cointegration and Dynamic Panels, edited by B. H. Baltagi. Amsterdam: Elsevier.
Pedroni, P. 2004. Panel cointegration: Asymptotic and finite sample properties of pooled time series tests with an application to the PPP Hypothesis: New Results. Econometric Theory 20: 597–627.
Pesaran, H.M. 2004. General Diagnostic Tests for Cross Section Dependence in Panels. Cambridge Working Papers in Economics No. 435, University of Cambridge, and CESifo Working Paper Series No. 1229.
Romer, P. 1990. Endogenous technical change. Journal of Political Economy 98: 71–102.
Sauer, P. & M. Zagler, M. 2011. (In) equality in education and economic development. Presented at the Seventh Annual Conference on Development Economics and Policy of the Verein für Socialpolitic, Research Committee Development Economics, Berlin, Germany.
Schipper, Y. & Hoogeveen, J. G. 2005. Which inequality matters? Growth evidence based on small area welfare
188 Jurnal Ekonomi Malaysia 52(2)
estimates in Uganda. The World Bank Working Paper Series No. 3592.
Sheret, M. 1988. Equality trends and comparisons for the education system of Papua New Guinea. Studie sin Educational Evaluation 14(1): 91–112.
Teixeira, A. A. & Fortuna, N. 2010. Human capital, R&D, trade and long-run productivity. Testing the technological absorption hypothesis for the Portuguese economy, 1960–2001. Research Policy 39(3): 335–350.
Thomas, V., Yan Wang, Y. & Fan, X.B. 2003. Measuring education inequality: Gini coefficients of education for 140 countries 1960-2000. Journal of Education Planning and Administration 17: 5–13
Tomul, E. 2009. Measuring regional inequality of education in Turkey: An evaluation by Gini Index. Procedia–Social and Behavioral Sciences 1(1): 949–952.
Wail, B., Said, H. & Abdelhak, K. 2012. Human capital inequality and economic development: new evidence from nonparametric and semiparametric panel data models, 1955–2010. The 4th Development Conference of the GREThA/ GRES. Available at: http://jourdev.gretha.u-bordeaux4.fr/sites/jourdev.gretha/ IMG/pdf/5d_benaabdelaali_hanchane_kamal.pdf (accessed 05.05.14).
Westerlund, J. 2007. Testing for error correction in panel data. Oxford Bulletin of Economics and Statistics 69(6): 709–748.
Zellner, A. 1962. An efficient method of estimating seemingly unrelated regressions and tests for aggregation bias. Journal of the American Statistical Association 57(298): 348–368.
Du Yu Hong*Fakulti Ekonomi dan PengurusanUniversiti Kebangsaan Malaysia43600 UKM Bangi Selangor MALAYSIAE-mail : [email protected]
Abu Hassan Shaari Md. NorFakulti Ekonomi dan PengurusanUniversiti Kebangsaan Malaysia43600 UKM Bangi Selangor MALAYSIAE-mail : [email protected],my
Tamat SarmidiFakulti Ekonomi dan PengurusanUniversiti Kebangsaan Malaysia43600 UKM Bangi Selangor MALAYSIAE-mail : [email protected]
*Corresponding author