A deep ATCA 20cm radio survey of the AKARI Deep Field ...
48
Open Research Online The Open University’s repository of research publications and other research outputs A deep ATCA 20cm radio survey of the AKARI Deep Field South near the South Ecliptic Pole Journal Article How to cite: White, Glenn J.; Hatsukade, Bunyo; Pearson, Chris; Takagi, Toshinobu; Sedgwick, Chris; Matsuura, Shuji; Matsuhara, Hideo; Serjeant, Stephen; Nakagawa, Takao; Lee, Hyung Mok; Oyabu, Shinki; Jeong, Woong-Seob; Shirahata, Mai; Kohno, Kotaro; Yammamura, Issei; Hanami, Hitoshi; Goto, Tomotsugu; Mak- iuti, Sin’itirou; Clements, David L.; Malek, K. and Khan, Sophia A. (2012). A deep ATCA 20cm radio survey of the AKARI Deep Field South near the South Ecliptic Pole. Monthly Notices of the Royal Astronomical Society, 427 pp. 1830–1846. For guidance on citations see FAQs . c 2012 The Authors Version: Accepted Manuscript Link(s) to article on publisher’s website: http://dx.doi.org/doi:10.1111/j.1365-2966.2012.21684.x http://mnras.oxfordjournals.org/content/427/3/1830.full.pdf+html Copyright and Moral Rights for the articles on this site are retained by the individual authors and/or other copy- right owners. For more information on Open Research Online’s data policy on reuse of materials please consult the policies page. oro.open.ac.uk
Transcript of A deep ATCA 20cm radio survey of the AKARI Deep Field ...

Open Research OnlineThe Open University’s repository of research publicationsand other research outputs
A deep ATCA 20cm radio survey of the AKARI DeepField South near the South Ecliptic Pole
Journal ArticleHow to cite:
White, Glenn J.; Hatsukade, Bunyo; Pearson, Chris; Takagi, Toshinobu; Sedgwick, Chris; Matsuura,Shuji; Matsuhara, Hideo; Serjeant, Stephen; Nakagawa, Takao; Lee, Hyung Mok; Oyabu, Shinki; Jeong,Woong-Seob; Shirahata, Mai; Kohno, Kotaro; Yammamura, Issei; Hanami, Hitoshi; Goto, Tomotsugu; Mak-iuti, Sin’itirou; Clements, David L.; Malek, K. and Khan, Sophia A. (2012). A deep ATCA 20cm radio surveyof the AKARI Deep Field South near the South Ecliptic Pole. Monthly Notices of the Royal AstronomicalSociety, 427 pp. 1830–1846.
For guidance on citations see FAQs.
c© 2012 The Authors
Version: Accepted Manuscript
Link(s) to article on publisher’s website:http://dx.doi.org/doi:10.1111/j.1365-2966.2012.21684.xhttp://mnras.oxfordjournals.org/content/427/3/1830.full.pdf+html
Copyright and Moral Rights for the articles on this site are retained by the individual authors and/or other copy-right owners. For more information on Open Research Online’s data policy on reuse of materials please consultthe policies page.
oro.open.ac.uk

Mon. Not. R. Astron. Soc. 000, 000–000 (0000) Printed 31 October 2012 (MN LATEX style file v2.2)
A deep ATCA 20cm radio survey of the AKARI Deep Field
South near the South Ecliptic Pole
Glenn J. White1,2, Bunyo Hatsukade3, Chris Pearson2,1,6,Toshinobu Takagi4,
Chris Sedgwick1, Shuji Matsuura4, Hideo Matsuhara4, Stephen Serjeant1,
Takao Nakagawa4, Hyung Mok Lee5, Shinki Oyabu13, Woong-Seob Jeong10,
Mai Shirahata4,12, Kotaro Kohno7,8, Issei Yamamura4, Hitoshi Hanami9,
Tomotsugu Goto11, Sin’itirou Makiuti4, David L. Clements14, Malek, K.15,
Sophia A. Khan16
1 Department of Physics and Astronomy, The Open University, Walton Hall, Milton Keynes, MK7 6AA, UK
2 RAL Space, STFC Rutherford Appleton Laboratory, Chilton, Didcot, Oxfordshire, OX11 0QX, UK
3 Department of Astronomy, Kyoto University, Kyoto 606-8502, Japan
4 Institute of Space and Astronautical Science, JAXA, 3-1-1 Yoshinodai, Chuo, Sagamihara, Kanagawa 252-5210, Japan,
5 Astronomy Program, Department of Physics and Astronomy, Seoul National, University, Seoul 151-747, Korea
6 Institute for Space Imaging Science, University of Lethbridge,, Lethbridge, Alberta T1K 3M4, Canada
7 Institute of Astronomy, the University of Tokyo, 2-21-1 Osawa, Mitaka, Tokyo 181-0015, Japan
8 Research Center for the Early Universe, University of Tokyo, 7-3-1 Hongo, Bunkyo, Tokyo 113-0033, Japan
9Physics Section, Faculty of Humanities and Social Sciences, Iwate University, Morioka 020-8550, Japan
10KASI, 61-1, Whaam-dong, Yuseong-gu, Deajeon, 305-348, South Korea
11Institute for Astronomy, University of Hawaii, 2680 Woodlawn Drive, Honolulu, HI, 96822, USA
12Subaru Telescope, National Astronomical Observatory of Japan, 650 North A’ohoku Place, Hilo, HI, 96720, U.S.A
13Graduate School of Science, Nagoya University, Furo-cho, Chikusa-ku, Nagoya, Aichi 464-8602, Japan
14Imperial College, London, Blackett Lab, Prince Consort Road, London SW7 2AZ, UK
15Center for Theoretical Physics of the Polish Academy of Sciences, Al. Lotnikow 32/46, 02-668 Warsaw, Poland
16Shanghai Key Lab for Astrophysics, Shanghai Normal University, Shanghai 200234, China
31 October 2012
ABSTRACT
The results of a deep radio survey at 20 cm wavelength are reported for a region con-
c� 0000 RAS

2 Glenn J. White et al.
taining the AKARI Deep Field South (ADF-S) near the South Ecliptic Pole (SEP),
using the Australia Telescope Compact Array telescope, ATCA. The survey (here-
after referred to as the ATCA-ADFS survey) has 1� detection limits ranging from
18.7–50 µJy beam�1 over an area of ⇠ 1.1 degree2, and ⇠ 2.5 degree2 to lower sen-
sitivity. The observations, data reduction and source count analysis are presented,
along with a description of the overall scientific objectives, and a catalogue con-
taining 530 radio sources detected with a resolution of 6.200 ⇥ 4.900. The derived
differential source counts show a pronounced excess of sources fainter than ⇠ 1 mJy,
consistent with an emerging population of star forming galaxies. Cross-correlating
the radio with AKARI sources and archival data we find 95 cross matches, with most
galaxies having optical R-magnitudes in the range 18-24 magnitudes, similar to that
found in other optical deep field identifications, and 52 components lying within
100 of a radio position in at least one further catalogue (either IR or optical). We have
reported redshifts for a sub-sample of our catalogue finding that they vary between
galaxies in the local universe to those having redshifts of up to 0.825. Associating the
radio sources with the Spitzer catalogue at 24 µm, we find 173 matches within one
Spitzer pixel, of which a small sample of the identifications are clearly radio loud
compared to the bulk of the galaxies. The radio luminosity plot and a colour-colour
analysis suggest that the majority of the radio sources are in fact luminous star form-
ing galaxies, rather than radio-loud AGN. There are additionally five cross matches
between ASTE or BLAST submillimetre galaxies and radio sources from this survey,
two of which are also detected at 90 µm, and 41 cross-matches with submillimetre
sources detected in the Herschel HerMES survey Public Data release.
radio continuum: galaxies; surveys
1 INTRODUCTION
A fundamental challenge in contemporary astrophysics is to understand how the galaxies have
evolved to their current form. To address this issue, wide area surveys are required to accumulate
large statistical samples of galaxies. To study this question, the Japanese AKARI infrared satel-
lite (Murakami et al. 2007) carried out two deep infrared legacy surveys close to the North and
South Ecliptic Poles (Matsuhara et al. 2006, Matsuura et al. 2011), which are notable because
their sight-lines to the distant Universe have the advantages of low extinction and correspondingly
small Hydrogen column densities. To support the two AKARI Deep Fields, sensitive radio surveys
have been made of both ecliptic pole regions to study and compare the global properties of the ex-
tragalactic source populations (White et al. 2009, White et al. 2010a [hereafter ’Paper 1’]). In the
c� 0000 RAS, MNRAS 000, 000–000

A deep ATCA 20cm radio survey of the AKARI Deep Field South near the South Ecliptic Pole 3
present paper the results are reported of a sensitive radio survey at 1.4 GHz using the Australia
Telescope Compact Array (ATCA) of a region that includes both the ADF-S field (Matsuhara et
al. 2006, Wada et al. 2008, Shirahata et al. 2009, White et al. 2009, Matsuura et al. 2009, 2011),
as well as a more extended region around it. The ADF-S is the focus of a major multi-wavelength
observing campaign conducted across the entire spectral region. The combination of these far-
infrared data and the depth of the radio observations will allow unique studies of a wide range of
topics including the redshift evolution of the luminosity function of radio sources, the clustering
environment of radio galaxies, the nature of obscured radio-loud Active Galactic Nuclei (AGN),
and the radio/far-infrared correlation for distant galaxies.
2 MULTI-WAVELENGTH OBSERVATIONS
The AKARI ADF-S field is a region located close to the South Ecliptic Pole (Matsuura et al. 2009,
2011) with a very low cirrus level 0.5 MJy sr�1 (Schlegel et al. 1998, Bracco et al. 2011),
and correspondingly low Hydrogen column density ⇠ 5⇥1019 cm�2. This field is similar to the
well known Lockman Hole and Chandra Deep-Field South regions, and has half of the cirrus
emission of the well studied COSMOS field at 24µm. The ADF-S field is therefore one of the best
’cosmological windows’ through which to study the distant Universe (Malek et al. 2009, Matsuura
et al. 2011, Hajian et al. 2012), and is now of high priority for astronomers to build ancillary data
sets that can be compared with the AKARI data, and to prepare lead on to the next set of deep
cosmological surveys, such as those that will be provided by Herschel (Pilbratt et al. 2010) and
SPICA (Eales et al. 2009, Swinyard et al. 2009).
The AKARI ADF-S survey was primarily made in the far-infrared at wavelengths of 65, 90,
140, 160 µm over a 12 deg2 area with the AKARI Far-Infrared Surveyor (FIS) instrument (Kawada
et al. 2007), with shallower mid-infrared coverage at 9, 18µm using the AKARI Infrared Camera
(IRC) instrument (Onaka et al. 2007). In addition to the wide survey, deeper mid-infrared pointed
observations, using the IRC, covering ⇠ 0.8 deg2 and reaching 5� sensitivities of 16, 16, 74, 132,
280 and 580 µJy at 3.2, 4.6, 7, 11, 15, 24 µm were also carried out. At other wavelengths, the
region has recently been mapped by Spitzer’s Multi-band imaging photometer (MIPS) at 24 and
70 µm (Scott et al. 2010, Clements et al. 2011); by the Balloon-borne Large Aperture Submil-
limeter Telescope (BLAST) at 250, 350 and 500 µm (Valiante et al. 2010), the latter revealing
⇠200 sub-millimetre galaxies over an 8.5 deg2 field; and in the ground-based submillimetre band
by Hatsukade et al. (2011) revealing 198 potential sub-millimetre galaxies in an ⇠0.25 square de-
c� 0000 RAS, MNRAS 000, 000–000

4 Glenn J. White et al.
Table 1. Summary of ancillary observations available for the ATCA-ADFS deep field
Wavelength Telescope Area Beam size Depth(1) (2) (3) (4) (5)
FUV, NUV GALEX Central 1 degree2 600 25.5-26.5 mag (AB)R CTIO MOSAIC-II 7.2 degree2 100 R 25 magU, B, V, I CTIO / MOSAIC Central 1 degree2 100 U 25, B 26, V 26, I 25 mag3-24 µm (6 bands) AKARI / IRC Central 0.8 degree2 4.2 - 5.500 10 µJy @3.5µm
300uJy @15m24 µm & 70 µm Spitzer-MIPS 11 degree2 600 -1800 200 µJy @24µm
20 mJy @70µm65 µm, 90 µm, 140 µm, 160 µm AKARI / FIS 12 degree2 3700 – 5000 30mJy (3�) @90µm110-500 µm Herschel (HerMES GT) 7 degree2 800 – 3600 30 mJy (5�)250 µm, 350 µm, 500 µm BLAST 9 degree2 3600 – 6000 45mJy (3�) all bands870 µm APEX / LABOCA Central 200⇥200 1900 6 mJy (3�)1.1 mm ASTE / AzTEC Central 0.25 degree2 3000 1.2-2.4 mJy (3�)20 cm ATCA Central 1 degree2 1000 17 µJySpectroscopy AAT AAOmega Central 3.14 degree2 - R⇠21 magSpectroscopy IMACS Magellan Central 0.2 degree2 - I⇠22 mag
gree area. The ancillary data sets summarised in Table 1 will be used in calibration of the radio
positional reference frame, and for cross-identifications later in this paper. The AKARI sensitiv-
ity limits correspond approximately to being able to detect starburst galaxies and AGN with a
luminosity of 1012 L� at z = 0.5, or ultraluminous infrared galaxies (ULIRGS) with luminosities
1012�13 L� at z = 1–2 respectively. Note that the ADF-S has also been observed by the Herschel
Space Observatory (HSO) (Pilbratt et al. 2010) as part of the Herschel Multi-tiered Extragalactic
Survey (HerMES) guaranteed time key program (Oliver et al. 2010).
Optical, radio, X-ray and infrared surveys provide essential support to the interpretation of
deep extragalactic radio surveys. The ADF-S has been the focus of recent multi-wavelength survey
coverage by our team, with optical imaging with the CTIO 4m telescope (MOSIAC-II detector) to
an R-band sensitivity of 25 magnitudes, and at near-IR wavelengths to K ⇠18.5 magnitudes with
the IRSF/SIRIUS instrument already completed. To support the ADF-S and ATCA surveys, we
have separately obtained wide field imaging in the optical and near-IR at ESO (using WFI and
SOFI), at the AAT (using WFI and IRIS2), for fields of 0.5 - 1 square degree, and spectroscopic
observations using AAOmega on the AAT (Sedgwick et al. 2009, 2011).
3 RADIO OBSERVATIONS
3.1 ATCA observations
The radio observations were collected over a 13 day period in July 2007 using the ATCA operated
at 1.344 and 1.432 GHz. The total integration time for the 2007 observations was 120 h, spread
between 26 overlapping pointing positions to maximise the uv coverage and to mitigate the effects
c� 0000 RAS, MNRAS 000, 000–000

A deep ATCA 20cm radio survey of the AKARI Deep Field South near the South Ecliptic Pole 5
of sidelobes from nearby radio-bright sources. Two of the pointing positions were observed on
each night, by taking one five minute integration at each of the two target fields, followed by
a two minute integration on the nearby secondary calibrator 0407-658. This cycle was repeated
for the different pointing positions, which were observed over ⇠10 hour tracks each night, giving
similar uv-coverage for each target field. The amplitude scaling was bootstrapped from the primary
calibrator PKS 1934-638, which was observed for 10 min at the start of each observing night, and
which was assumed to have a flux density of 15.012 Jy at 1.344 GHz and 14.838 Jy at 1.432 GHz
respectively. The 2007 data were augmented with a further deep observation made in December
2008 over 5 nights toward a single pointing position at the ADF-S, which lay just off centre of
the larger ATCA-ADFS field reported here. This added a further 50 hours of integration time. The
data were processed in exactly the same way as that from the 2007 observing sessions.
3.2 Calibration
In the following sub-sections the calibration and data reduction methodology are presented. Since
much of this is in common with our recent North Ecliptic Pole (NEP) radio survey with the West-
erbork Synthesis Radio Telescope (WSRT) telescope discussed in Paper 1, we will not repeat the
detailed discussion of this earlier paper, but instead just focus on those parts of the calibration
methodology that differed from Paper 1.
The data were calibrated using the ATNF data reduction package MIRIAD (Sault et al. 1995)
using standard procedures. The raw data come in RPFITS format, and were converted into the
native MIRIAD format using ATLOD. ATLOD discards every other frequency channel (since they
are not independent from one another, hence no information is lost), and additionally flagged out
one channel in the higher frequency sideband which contained a multiple of 128 MHz, and thus
was affected by self-interference at the ATCA. Channels at either end of the sidebands where
the sensitivity dropped significantly were also not used. The resulting data set contained two side-
bands, with 13 and 12 channels respectively, each 8 MHz wide, which resulted in a total bandwidth
of 200 MHz. The lower frequency sideband was mostly free of RFI and required little editing apart
from flagging of bad data. However, the higher frequency sideband suffered from occasional local
RF interference, and the affected data were flagged out using the ATNF automated noise flag-
ger PIEFLAG (Middelberg 2006), which eliminated virtually all of the RFI-affected data which
would have been flagged in a visual inspection. A visual inspection of the visibilities after using
PIEFLAG, led to the removal of a few other small sections of RFI-affected data. In total, approxi-
c� 0000 RAS, MNRAS 000, 000–000

6 Glenn J. White et al.
mately 3% and 15% of the data were flagged out in the lower and higher bands respectively. Phase
and amplitude fluctuations throughout the observing run were then corrected using the interleaved
secondary calibrator data, and the amplitudes were scaled by bootstrapping to the primary calibra-
tor. The data were then split by pointing position and each field was individually imaged, before
mosaicing to form a master image, sensitivity and noise maps.
3.3 Imaging
The data for each of the target pointings were imaged separately using uniform weighting and
gridded to a pixel size of 2.000 to a common reference frame (to minimise geometrical issues
in the mosaicing process). The twenty-five 8 MHz wide frequency channels across the ATCA
passband were reduced using MIRIAD’s implementation of multi-frequency clean, MFCLEAN,
which accounts for variation in the spectral index of the calibration sources across the observed
bandwidth. After a first iteration of MFCLEAN, model components with flux densities � 1 mJy
beam�1 were used to phase self-calibrate, and to correct residual phase errors. The data were
then re-imaged and CLEANED for 5000 iterations, at which point the sidelobes of strong sources
were generally found to be comparable with the thermal noise, except for a few cases adjacent
to bright sources. The individual pointings were then mosaiced together using the MIRIAD task
LINMOS, which additionally divides each image by a model of the primary beam attenuation,
and uses a weighted average of positions contained in more than one pointing. As a result, pixels
at the mosaic edges have a higher noise level. Regions beyond the point where the primary beam
response drops below 50% (this occurs at a radius of 35.060 from the centre of a pointing) were
blanked, which resulted in a total survey area of 1.04 deg.2 (to the limit of the half power beam
width at the edges of the master image). The synthesised beam size in the final mosaiced image
was 6.200 ⇥ 4.900 at a position angle of 0 degrees. The sensitivity varies across the image due to
primary beam attenuation and the mosaicing strategy as shown in Figure 1, although the noise
level achieved across the map is ⇠35% higher than expected for a thermal noise limited survey,
which is due to difficulties in removing the sidelobes of strong sources at the edge of the survey
field. This is a well known situation that has previously been seen both for ATCA and WSRT
radio surveys, and probably results from both the non-circularity of the telescope beam, and small
movements of the primary beam on the sky caused by random single dish pointing errors (i.e. due
to wind/thermal loading) that cause the intensity of bright sources near the edge of the primary
c� 0000 RAS, MNRAS 000, 000–000

A deep ATCA 20cm radio survey of the AKARI Deep Field South near the South Ecliptic Pole 7
Figure 1. The central area of the ATCA 20 cm map, corrected for the primary beam of the antenna. The contours show the rms noise levels in µJybeam�1 estimated locally from the noise map by binning the data into 40⇥40 pixel regions.
beam to vary significantly during an integration, making it difficult to efficiently CLEAN those
areas.
4 SOURCE COMPONENT CATALOGUE
The mosaiced region achieves wide-field coverage and good sensitivity at the price of having
an unavoidably non-uniform noise distribution. Statistical characterisation of the completeness of
detection at various flux levels is therefore a complex procedure that requires accounting for the
observing time, mosaic overlap, and primary beam attenuation. Our source detection was made
using locally determined noise levels derived from the noise map (Figure 2) - an approach that has
already been used in other studies to improve the efficacy of their source detection catalogues (e.g.
c� 0000 RAS, MNRAS 000, 000–000

8 Glenn J. White et al.
Figure 2. The horizontal axis shows the SFIND detection threshold as a function of areal coverage. The area used for the differential source countestimation in Section 5 is shown as a solid line, and has a maximum value of 1.04 degree2, whereas that of the full image (whose radio componentsare listed in Table 2) is indicated by the dot-dash line and has a maximum value of 2.55 degree2.
Hopkins et al. 1998, Morganti et al. 2004, Paper 1, and the associated NEP component catalogue
presented in White et al. 2010b).
The component catalogue in this paper was built using the MIRIAD task SFIND in a sim-
ilar way to that described in Paper 1. However, briefly SFIND uses a statistical technique, the
false discovery rate (FDR), which assigns a threshold based on an acceptable rate of false detec-
tions (Hopkins et al. 2002). For the ATCA-ADFS data the approach of Hopkins et al. (2002) was
followed by adopting an FDR value of 2%. The components identified by SFIND were visually
inspected to remove any obvious mis-identifications (e.g. a few residual sidelobe structures imme-
c� 0000 RAS, MNRAS 000, 000–000

A deep ATCA 20cm radio survey of the AKARI Deep Field South near the South Ecliptic Pole 9
Table 2. The component catalogue (the full version is available as Supplementary Material in the on-line version of this article). The componentparameters listed in the catalog are: (1) a short form running number (components that are believed to be parts of multi-component sources arelisted with a † sign next to the running number (for example 47†), with more details about these multi-component sources being presented in Table3, (2) the component name, referred to in this paper as ATCA-ADFS followed by the RA/Dec encoding (e.g. ATCA-ADFS J045243-533127), (3,4)the component Right Ascension and Declination (J2000) referenced from the self-calibrated reference frame, (5,6) the RA and Dec errors in arcseconds, (7,8) the peak flux density, Speak, and its associated rms error, (9,10) the integrated flux densities, Stotal and their associated errors, (11, 12,13) the size along the major and minor axes of the fitted Gaussian component profile and its orientation (the major and minor axes refer to the fullwidth at half maximum component size deconvolved from the synthesised beam, and position angle was measured east of north. Component sizesare shown in columns 11 or 12 only for the cases where Stotal/Speak � 1.3, as an indicator of a resolved component. Components where Stotal/Speak <1.3 were considered to be unresolved, and therefore component sizes are not individually reported for these here. All components were additionallychecked visually to mitigate against artefacts that might have slipped through the various checks.
No Component name RA DEC �RA �DEC Speak �Speak Stotal �Stotal ✓ma j ✓min PAh:m:s.s d:m:s.s 00 00 mJy mJy mJy mJy 00 00 �
beam�1 beam�1
(1) (2) (3) (4) (5) (6) (7) (8) (9) (10) (11) (12) (13)
1 ATCA-ADFS J044041-534043 4:40:41.5 -53:40:43.5 0.14 0.03 2.951 0.286 7.392 0.368 12.1 2.7 -84.02 ATCA-ADFS J044116-532554 4:41:16.4 -53:25:54.0 0.00 0.00 1.498 0.153 4.427 0.206 8.7 6.6 -48.13 ATCA-ADFS J044116-531845 4:41:16.9 -53:18:45.8 0.07 0.31 1.568 0.260 5.310 0.317 13.5 3.5 -9.34 ATCA-ADFS J044117-531853 4:41:17.9 -53:18:53.5 0.03 0.02 1.866 0.260 2.632 0.274 6.7 -40.65 ATCA-ADFS J044120-533214 4:41:20.1 -53:32:14.9 0.03 0.02 1.603 0.116 5.893 0.137 14.1 4.9 -53.86 ATCA-ADFS J044120-531626 4:41:20.7 -53:16:26.3 0.79 0.16 1.626 0.260 6.553 0.359 14.8 5.8 -87.57 ATCA-ADFS J044121-531637 4:41:21.9 -53:16:37.9 0.17 0.05 1.966 0.260 7.431 0.361 12.6 6.6 -88.18 ATCA-ADFS J044122-534349 4:41:22.0 -53:43:49.1 0.01 0.01 0.686 0.096 1.051 0.1009 ATCA-ADFS J044123-534402 4:41:23.8 -53:44:02.8 0.07 0.01 0.932 0.096 2.413 0.121 10.3 4.4 -86.010 ATCA-ADFS J044124-531600 4:41:24.1 -53:16:00.1 0.32 0.13 1.677 0.260 4.353 0.340 8.6 5.5 86.111 ATCA-ADFS J044141-533707 4:41:41.9 -53:37:07.6 0.00 0.00 6.011 0.116 11.775 0.178 7.5 3.6 -80.412 ATCA-ADFS J044145-535304 4:41:45.5 -53:53:04.4 0.00 0.00 11.728 0.187 23.327 0.210 8.7 2.0 59.213 ATCA-ADFS J044156-531452 4:41:56.5 -53:14:52.4 0.00 0.01 4.390 0.507 10.187 0.521 9.8 2.5 -38.714 ATCA-ADFS J044203-534302 4:42:03.9 -53:43:02.1 0.00 0.00 0.639 0.050 0.726 0.05015 ATCA-ADFS J044205-533253 4:42:05.0 -53:32:53.3 0.25 0.02 0.356 0.071 1.363 0.074 20.9 -79.416 ATCA-ADFS J044208-535941 4:42:08.4 -53:59:41.2 0.41 0.04 0.584 0.080 0.923 0.095 12.2 -73.917 ATCA-ADFS J044212-531047 4:42:12.6 -53:10:47.9 0.01 0.03 1.184 0.190 1.974 0.197 6.6 -18.218 ATCA-ADFS J044212-535551 4:42:12.6 -53:55:51.6 0.01 0.01 1.374 0.080 2.291 0.087 7.8 47.619 ATCA-ADFS J044212-530209 4:42:13.0 -53:02:09.8 0.04 0.11 2.977 0.399 3.947 0.484 6.6 3.720 ATCA-ADFS J044213-530802 4:42:13.6 -53:08:02.5 0.06 0.11 1.166 0.190 2.322 0.216 9.4 -23.0
diately adjacent to the brightest components in the mapped region). Comparison with independent
catalogues derived using the MIRIAD task IMSAD (with a 7 � clip), and with one derived using
SExtractor (Bertin & Arnouts 1996) with a locally defined background rms were almost identical
with the SFIND catalogue. Hopkins et al. (1998) show that using SFIND in this way provides a
very robust estimate of the noise level above which there are almost no spurious positive candi-
dates, with the completeness being robustly set by the choice of FDR, and the locally determined
background noise level. An understanding of source confusion, spurious components, sensitivity
and completeness are important in any survey that is analysed to its limit, but as this becomes dif-
ficult to rigorously establish for mosaiced images with non-uniform noise properties of our mosaic
and the fact that some but not all of the components are resolved, it was decided for the source
counts analysis in Section 5 to stop the calculation at the very conservative level of 200 µJy, which
corresponds to in excess of 10� signal to noise in the most sensitive parts of the mapped region.
A sample from the final component catalogue is presented in Table 2, and the entire catalogue
is included in the electronic on-line version of this paper.
c� 0000 RAS, MNRAS 000, 000–000
10 Glenn J. White et al.
59
57
56
102
99
251
250
227
228
436
434 446
440
241
238
240
224
223
268
265
261
260
274
273
141
140
Figure 3. Regions showing complex or extended structure. The vertical scale is Declination. The contours are at 0.0001, 0.0003, 0.0005, 0.001,0.003, 0.006, 0.012, 0.024, 0.048 and 0.096 Jy beam�1 respectively. The Right Ascension/Declination scales can de derived using the componentlocations in Table 2.
The positional accuracy listed in the Table 2 is relative to the self-calibrated and bootstrapped
reference frame described in Section 3. Other effects that bias the positions or sizes of sources in
radio surveys have already been presented in Paper 1, to which the reader is referred. An estimate
of component dimensions calculated by deconvolving the measured sizes from the synthesised
beam is also presented, with Table 2 reporting only those more than double the synthesised beam
size.
4.1 Component extraction
In the terminology of this paper, a radio component is described as a region of radio emission
represented by a Gaussian shaped object in the map. Close radio doubles are represented by two
Gaussians and are deemed to consist of two components, which make up a single source. A selec-
tion of radio sources with multiple components is shown in Figure 3.
c� 0000 RAS, MNRAS 000, 000–000

A deep ATCA 20cm radio survey of the AKARI Deep Field South near the South Ecliptic Pole 11
4.2 Complex sources
Radio sources are often made up of multiple components, as seen in Figure 3. The source counts
need to be corrected for the multi-component sorces, so that the fluxes of physically related
components are summed together, rather than being treated as separate sources. Magliocchetti
et al. (1998) have proposed criteria to identify the double and compact source populations, by
plotting the separation of the nearest neighbour of a component against the summed flux of the
two components, and selecting components where the ratio of their fluxes, f1 and f2 is in the range
0.25 f1/ f2 4. In Figure 4 the sum of the fluxes of nearest neighbours are plotted against their
separation.
The dashed line marks the boundary satisfying the separation criterion defined by Maglioc-
chetti et al. (1998):
✓ = 100"S total(mJy)
10
#0.5
(1)
where ✓ is in arc seconds. Therefore 53 radio sources in the present survey (i.e. 10% of the
530 catalogued entries) should be considered to be a part of double or multiple sources according
to the Magliocchetti et al. (1998) criterion, and this will be taken account of in the source counts
discussed later. These components, and their suggested associations are listed in Table 3.
4.3 Flux density and positional accuracy
The flux density and positional accuracy are presented in Table 2, and the method for calculating
the positional accuracy are described in Hopkins et al. (2002), and the intensity scales are derived
and fully described in Equations 1–5 of Hopkins et al. (2003). Since the methods for measuring the
positional and intensity scale accuracy form part of the methodology of the SFIND technique, the
reader is referred to the papers presenting this technique, rather than repeating them here. However,
to check the positional accuracy, the ATCA data were cross correlated against the SUMSS survey
(Mauch et al. 2003), where 8 of the bright ATCA sources were found to be within 1000 of a SUMSS
source (the SUMSS half-power beam width is 4500 ⇥ 5700 ). After eliminating three components
which are resolved and appear as double radio sources in the ATCA data, the average offset be-
tween the positions in the two catalogues (ATCA-SUMSS) was (�RA,�Dec) = (+0.4300 ± 2.3100 ,
-2.5700 ±2.5600 ), which are consistent with the absolute and systematic errors reported in the
SUMSS Catalogue. The ATCA component catalogue was also cross-correlated with the positions
of bright compact optical galaxies from our CTIO MOSAIC-II survey (see Table 1), which was
astrometrically referenced against HST guide stars, and sources from the DENIS database. The
c� 0000 RAS, MNRAS 000, 000–000

12 Glenn J. White et al.
Figure 4. This Figure shows the sum of the flux densities of the nearest neighbours between components in the detection catalogue. FollowingMagliocchetti et al. (1998) points to the left of the dashed line are possible double sources. The likelihood that two sources in a pair are related isfurther constrained (Magliocchetti et al. 1998) by requiring that the fluxes of the two components f1 and f2 should be in the range 0.25 f1/ f2 4. Sources in the Figure whose components satisfying this additional criterion are shown as bold circles.
mean of the offsets to the 166 bright galaxies shown in Figure 5 was � RA = -0.1600 ± 0.3700 and
� Dec = -0.0500 ± 0.4600 , which is also consistent with the SUMSS result.
4.4 Summary of flux density corrections for systematic effects
There are two main systematic effects which have been taken into account to estimate the ATCA
flux densities, specifically clean bias and bandwidth smearing effects. Bandwidth smearing is the
radio analog of optical chromatic aberration, resulting from the finite width of the receiver chan-
c� 0000 RAS, MNRAS 000, 000–000
A deep ATCA 20cm radio survey of the AKARI Deep Field South near the South Ecliptic Pole 13
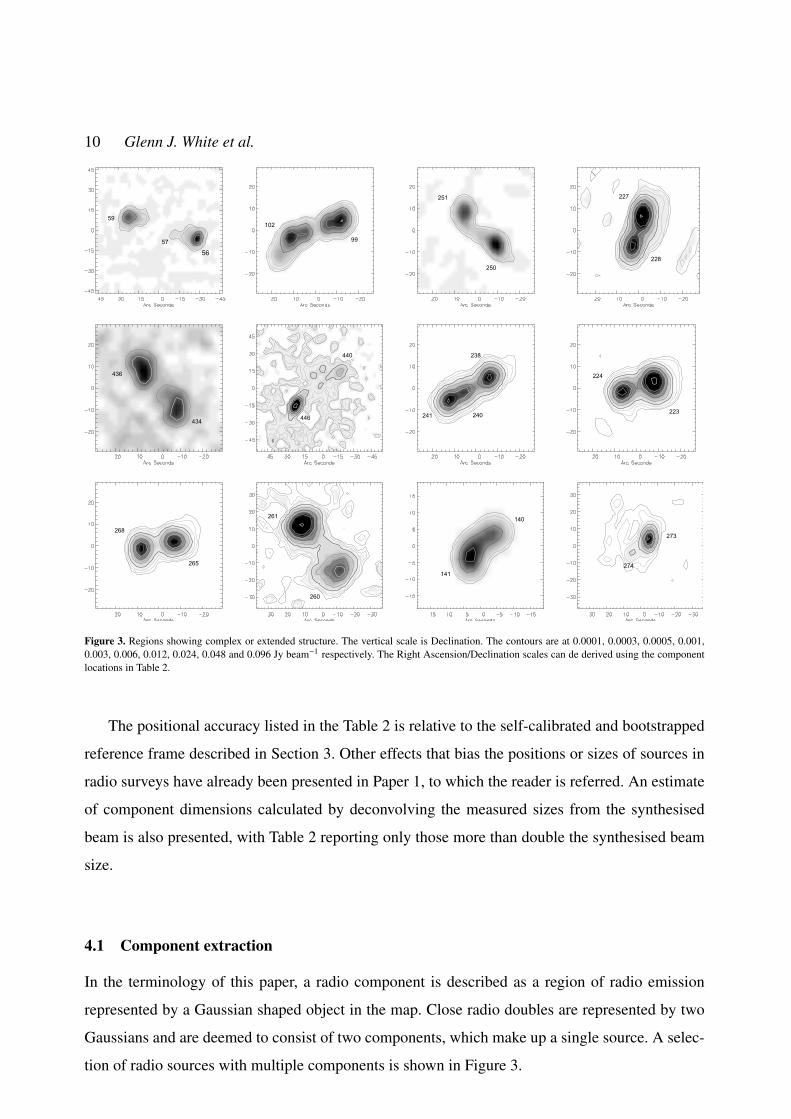
Table 3. The multi-component source catalogue for components satisfying the Magliocchetti et al. (1998) criterion. The proposed multi-componentsources listed in this Table are: (1) the components identified according to their Running Numbers in the main catalogue, (2,3) mean Right Ascensionand Declination (J2000) taken and the average of the positions of the individual components, (4) the distance between the components (rounded upto the nearest arc second), (5) the sum of the total flux density of the individual components, (6) the error on this, estimated by adding the total fluxerrors in quadrature.
Components RA Dec Dist Sc �Sch:m:s.s d:m:s.s 00 mJy mJy
(1) (2) (3) (4) (5) (6)
47+49 4:43:09.2 -53:39:30.0 9 1.651 0.02965+67 4:43:38.8 -53:47:24.1 17 0.521 0.02669+70 4:43:43.3 -53:22:18.1 11 1.050 0.034
99+102 4:44:18.9 -53:24:38.8 20 18.617 0.241122+123 4:44:35.9 -53:36:01.4 8 1.515 0.031140+141 4:44:53.1 -53:41:00.4 8 6.949 0.058166+169 4:45:19.3 -53:12:26.2 16 1.075 0.028
171+172+175 4:45:22.6 -53:09:09.4 20 1.450 0.021179+180 4:45:25.8 -53:06:08.2 16 0.593 0.042212+213 4:46:03.1 -53:44:41.6 17 0.469 0.026223+224 4:46:16.6 -53:39:21.9 15 67.264 0.431227+228 4:46:20.4 -52:56:23.8 13 65.058 0.445
238+240+241 4:46:32.6 -53:47:00.4 18 71.759 0.172250+251 4:46:43.7 -53:17:59.8 20 6.669 0.062248+253 4:46:46.0 -53:01:00.5 110 20.188 0.141265+268 4:47:03.2 -53:35:39.4 15 37.415 0.181284+286 4:47:16.2 -52:59:27.8 17 0.935 0.399305+306 4:47:32.2 -53:20:22.8 10 1.102 0.020318+320 4:47:44.0 -53:10:37.4 20 3.771 0.052336+337 4:48:02.5 -53:26:14.4 7 0.635 0.031371+373 4:48:40.6 -52:59:31.5 33 1.073 0.399
378+379+380 4:48:44.9 -53:00:04.8 30 3.712 0.043410+411 4:49:28.5 -53:26:05.0 11 0.572 0.026425+428 4:49:53.7 -53:12:02.8 28 0.854 0.036434+436 4:50:14.7 -53:25:08.6 23 6.499 0.049
nels compared to the observing frequency. It reduces the peak flux density of a source while cor-
respondingly increasing, or blurring, the source size in the radial direction such that the total
integrated flux density is conserved, but the peak flux is reduced.
From Condon et al. (1998) the reduction in the peak flux from a compact radio source as a
result of bandwidth smearing is given by:S peak
S 0peak
�1
q1 +
h2 ln 2
3
i h⇣�⌫⌫
⌘ ⇣d✓b
⌘i2(2)
where S peak and S 0peak refer to the off-axis peak flux and the peak flux at the centre of axis of the
primary beam,�⌫ and ⌫ are the bandwidth and observing frequency respectively, d is the off-axis
distance, and ✓b is the synthesised beamwidth. Prandoni et al. (2000a) have made a detailed study
of this for the ATCA telescope, finding similar behaviour.
Fortunately, the closely spaced mosaicing strategy used for the ATCA SEP observations allows
the smearing effect to be measured directly, by monitoring peak and integrated flux densities of
four bright compact sources that were present in virtually every one of the observed fields, but at
different distances from the centre of the beam. Figure 6 shows the measured smearing factor k,
c� 0000 RAS, MNRAS 000, 000–000

14 Glenn J. White et al.
Figure 5. Positional offsets between bright (R-magnitude 22 mag) galaxies from the CTIO MOSAIC-II images and the DENIS database, and asample of ATCA radio components detected at � 10� levels in Table 2.
which we define as the ratio of the peak flux of a compact source normalised to that which it has
when at the centre of a beam, as a function of distance from the beam centre.
This Figure shows that the experimental data points are reasonably well fit by the theoretical
relationship of Condon et al. (1998), which is overlaid as a solid line on Figure 6. This correction
was taken into account when estimating the peak fluxes listed in Table 2.
It is well known that as well as needing to consider this effect for single pointings, large
mosaiced fields and chromatic aberration, it can also act to reduce point source fluxes in a complex
way (e.g. Bondi et al. 2008, White et al. 2010). We have empirically examined the effect of
bandwidth smearing on our mosaiced data by following the approach adopted by Bondi
et al. (2008) to compare the fluxes of bright sources observed close to the centres of individual
pointings, with their fluxes determined after mosaicing together to form a merged image. Although
c� 0000 RAS, MNRAS 000, 000–000

A deep ATCA 20cm radio survey of the AKARI Deep Field South near the South Ecliptic Pole 15
Figure 6. Variation of the smearing factor with distance from the centre of an individual field for a sample of components in common to many ofthe individual fields. The solid curve is the expected theoretical curve from Condon et al. (1998). which matches closely to that shown by Huynh etal. (2005) in their ATCA observation of the Hubble Deep Field South, and the squares show the .
the bandwidth smearing can be accounted for using the above equation from Condon et al. (1998),
as Bondi et al. (2008) discuss, the contribution of this to measurements of the peak fluxes in
radio surveys is more difficult to rigorously quantify for mosaiced data, where the smearing would
need to be modelled with a more complicated function that represents the spacing pattern of the
individual pointings. Due to the difficulty in rigorously calculating this, we have therefore followed
the Bondi et al. (2008) approach to estimate the most probable reduction to the peak flux densities,
as this correction will slightly modify estimates of the estimated source sizes.
Therefore, we ran the same procedure that was used to produce the final radio catalogue, on
each of the individual pointings. For the strongest unresolved sources (>⇠ 1 mJy) the peak and total
flux densities measured from the final mosaiced image, were compared with the corresponding
peak and total flux densities from the individual pointings, using sources that were no further than
50 away from an individual pointing (this is consistent with the Bondi et al. 2008 approach for the
VLA, which is supported for ATCA from our own results shown in Fig. 7). The total flux densities
of each source in the mosaic were in good agreement (the median value was measured to be 1.01
c� 0000 RAS, MNRAS 000, 000–000
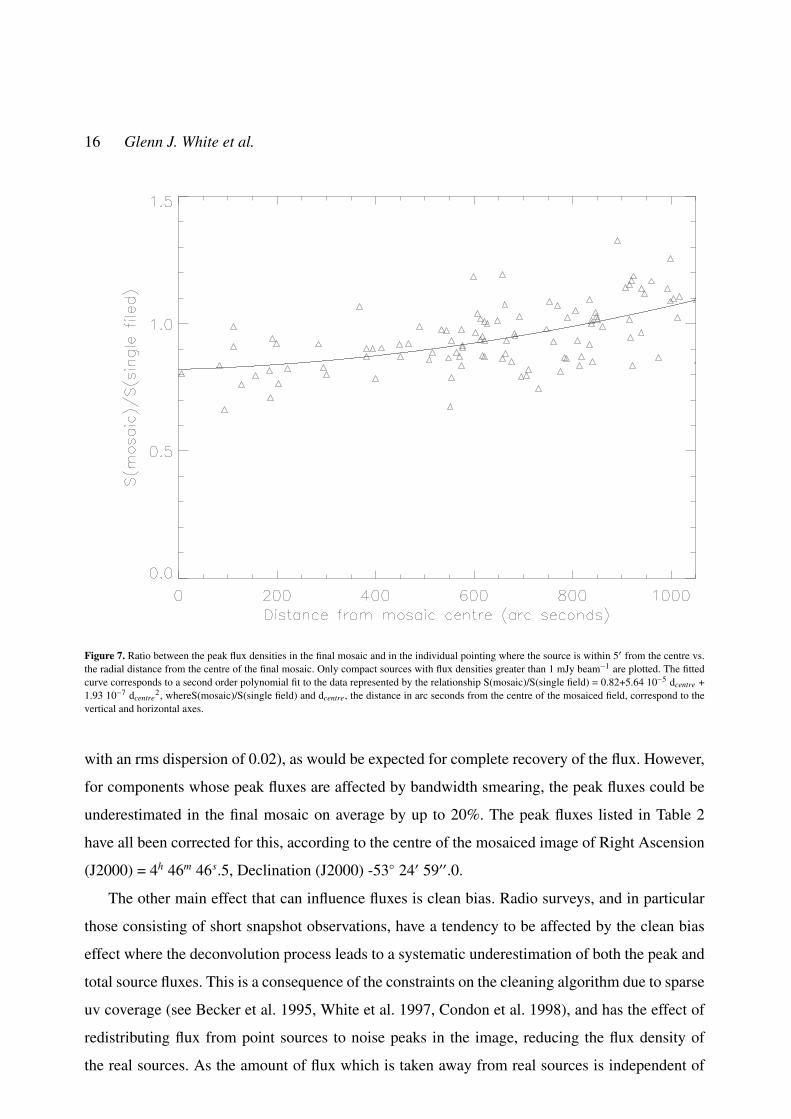
16 Glenn J. White et al.
Figure 7. Ratio between the peak flux densities in the final mosaic and in the individual pointing where the source is within 50 from the centre vs.the radial distance from the centre of the final mosaic. Only compact sources with flux densities greater than 1 mJy beam�1 are plotted. The fittedcurve corresponds to a second order polynomial fit to the data represented by the relationship S(mosaic)/S(single field) = 0.82+5.64 10�5 dcentre +1.93 10�7 dcentre
2, whereS(mosaic)/S(single field) and dcentre, the distance in arc seconds from the centre of the mosaiced field, correspond to thevertical and horizontal axes.
with an rms dispersion of 0.02), as would be expected for complete recovery of the flux. However,
for components whose peak fluxes are affected by bandwidth smearing, the peak fluxes could be
underestimated in the final mosaic on average by up to 20%. The peak fluxes listed in Table 2
have all been corrected for this, according to the centre of the mosaiced image of Right Ascension
(J2000) = 4h 46m 46s.5, Declination (J2000) -53� 240 5900.0.
The other main effect that can influence fluxes is clean bias. Radio surveys, and in particular
those consisting of short snapshot observations, have a tendency to be affected by the clean bias
effect where the deconvolution process leads to a systematic underestimation of both the peak and
total source fluxes. This is a consequence of the constraints on the cleaning algorithm due to sparse
uv coverage (see Becker et al. 1995, White et al. 1997, Condon et al. 1998), and has the effect of
redistributing flux from point sources to noise peaks in the image, reducing the flux density of
the real sources. As the amount of flux which is taken away from real sources is independent of
c� 0000 RAS, MNRAS 000, 000–000
A deep ATCA 20cm radio survey of the AKARI Deep Field South near the South Ecliptic Pole 17
the source flux densities, the fractional error this causes is most pronounced for weak sources.
Prandoni et al. (2000a, b) have shown that it is possible to mitigate clean bias if the CLEANing
process is stopped well before the maximum residual flux has reached the theoretical noise level.
Consequently the cleaning limit was set at 5 times the theoretical noise, to ensure that the clean
bias does not significantly affect the source fluxes in the present survey (Garrett et al. 2000).
Gruppioni et al. (1999) adopted a similar strategy in an ATCA survey of the ELAIS N1 field, and
found the effect to be insignificant (less than 2.5%) for the faintest sources (5� detections) but had
no effect on sources brighter than 10� for similar numbers of CLEAN cycles as those performed
on the present ATCA data. We therefore conclude that clean bias will have a negligible affect on
the present data.
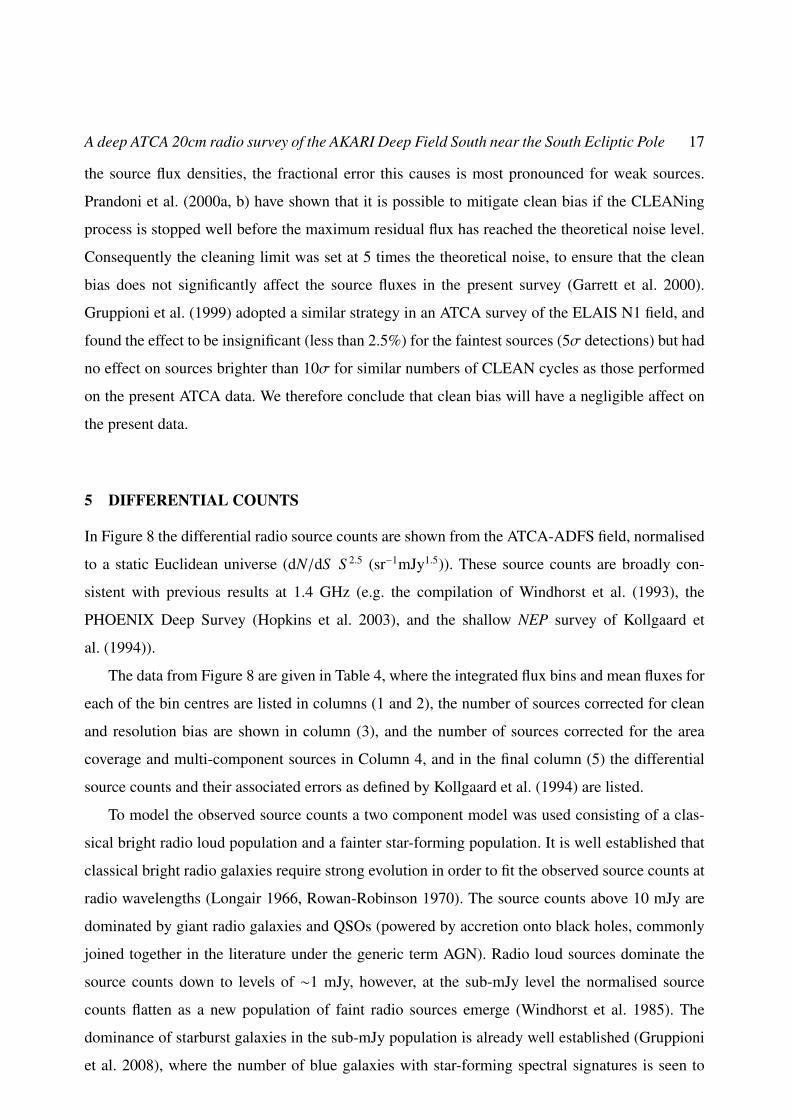
5 DIFFERENTIAL COUNTS
In Figure 8 the differential radio source counts are shown from the ATCA-ADFS field, normalised
to a static Euclidean universe (dN/dS S 2.5 (sr�1mJy1.5)). These source counts are broadly con-
sistent with previous results at 1.4 GHz (e.g. the compilation of Windhorst et al. (1993), the
PHOENIX Deep Survey (Hopkins et al. 2003), and the shallow NEP survey of Kollgaard et
al. (1994)).
The data from Figure 8 are given in Table 4, where the integrated flux bins and mean fluxes for
each of the bin centres are listed in columns (1 and 2), the number of sources corrected for clean
and resolution bias are shown in column (3), and the number of sources corrected for the area
coverage and multi-component sources in Column 4, and in the final column (5) the differential
source counts and their associated errors as defined by Kollgaard et al. (1994) are listed.
To model the observed source counts a two component model was used consisting of a clas-
sical bright radio loud population and a fainter star-forming population. It is well established that
classical bright radio galaxies require strong evolution in order to fit the observed source counts at
radio wavelengths (Longair 1966, Rowan-Robinson 1970). The source counts above 10 mJy are
dominated by giant radio galaxies and QSOs (powered by accretion onto black holes, commonly
joined together in the literature under the generic term AGN). Radio loud sources dominate the
source counts down to levels of ⇠1 mJy, however, at the sub-mJy level the normalised source
counts flatten as a new population of faint radio sources emerge (Windhorst et al. 1985). The
dominance of starburst galaxies in the sub-mJy population is already well established (Gruppioni
et al. 2008), where the number of blue galaxies with star-forming spectral signatures is seen to
c� 0000 RAS, MNRAS 000, 000–000

18 Glenn J. White et al.
Figure 8. Differential counts determined from the AKARI ATCA-ADFS 20 cm deep field. The relationship for calculating the numbers in this plotand in Table 4 is the same as that used by Kollgaard et al. (1994).
increase strongly. Rowan-Robinson et al. (1980, 1993), Hopkins et al. (1998), and others have
concluded that the source counts at these faintest levels require two populations, AGNs and star-
burst galaxies. This latter population can best be modelled as a dusty star-forming population,
under the assumption that it is the higher redshift analogue of the IRAS star-forming population
(Rowan-Robinson et al. 1993, Pearson & Rowan-Robinson 1996). In this scenario, the radio emis-
sion originates from the non-thermal synchrotron emission from relativistic electrons accelerated
by supernovae remnants in the host galaxies.
To represent the radio loud population the luminosity function of Dunlop & Peacock (1990)
c� 0000 RAS, MNRAS 000, 000–000

A deep ATCA 20cm radio survey of the AKARI Deep Field South near the South Ecliptic Pole 19
Table 4. 20 cm differential source counts for the ATCA-ADFS survey
flux bin mean flux N0 Nc dN/dSmJy mJy sr�1 Jy1.5
(1) (2) (3) (4) (5)
0.21–0.23 0.22 16 25.45 2.35±0.470.23–0.25 0.24 14 19.50 2.24±0.510.25–0.28 0.265 23 30.30 2.96±0.540.28–0.315 0.298 20 24.24 2.72±0.55
0.315–0.413 0.364 51 48.01 3.11±0.450.413–0.566 0.490 49 50.72 4.37±0.610.566–0.813 0.690 49 50.72 6.30±0.880.813–1.21 1.011 32 37.77 7.54±1.231.21–1.70 1.455 11 18.36 7.47±1.751.70–3.151 2.425 17 22.66 10.18±2.14
3.151–5.416 4.283 10 12.95 15.93±4.435.416–9.742 7.579 9 10.79 28.41±8.659.742–18.33 14.036 4 8.63 52.41±17.8418.33–36.08 27.205 7 7.55 113.7±41.3536.08–74.32 55.200 2 3.24 129.7±72.07
was used (parameters in Table C3 in their paper) to model the local space density with an assump-
tion that the population evolves in luminosity with increasing redshift. The luminosity evolution
follows a power law with redshift of (1 + z)3.0, broadly consistent with both optically and X-ray
selected quasars (Boyle et al. 1987). The spectrum of the radio loud population was obtained from
Elvis, Lockman & Fassnacht (1994), assuming a steep radio spectrum source of (S ⌫ / ⌫�↵, ↵=1).
To model the faint sub-mJy population we use the IRAS 60 µm luminosity function of Saunders
et al. (2000), with the parameters for the star-forming population, defined by warmer 100 µm / 60 µm
IRAS colours, given in Pearson (2001, 2005), and Sedgwick et al. (2012).
To convert the infrared luminosity function to radio wavelengths, we derive below the ratio
of the 60 µm luminosity to the radio luminosity, from the well established correlation between
the far-IR and radio flux (e.g. Helou, Soifer & Rowan-Robinson (1985), Yun, Reddy & Condon
(2001), Appleton et al. (2004)).
Helou et al. (1985) defined this relation between the far-infrared flux, FIR/Wm�2 and the 1.4
GHz radio emission, S 1.4GHz/Wm�2Hz�1 in terms of the q factor given by,
q = log✓ FIR3.75 ⇥ 1012Hz
◆� log
✓ S 1.4 GHz
Wm�2 Hz�1
◆(3)
The far-infrared flux defined by Condon (1991) in terms of the 60 µm and 100 µm emission
can be written as,✓ FIRWm�2
◆= 1.26 ⇥ 1012
2.58 S 60 + S 100
Wm�2 Hz�1
!(4)
where the spectrum between 60 µm and 100 µm is defined by a spectral index ↵,
S 100
S 60=
⌫100
⌫60
!�↵) S 100 = 1.67↵ S 60 (5)
c� 0000 RAS, MNRAS 000, 000–000

20 Glenn J. White et al.
such that,
✓ FIRWm�2
◆= 1.26 ⇥ 1012
2.58 + 1.67↵
Wm�2 Hz�1
!S 60 (6)
substituting the above relation into Equation 3, assuming a value of q=2.3 (Condon 1991,1992)
and a value of ↵=2.7 (Hacking et al. 1987), it is then easy to show that:
S 60 ⇡ 90 S 1.4 GHz (7)
To convert the infrared luminosity function to radio wavelengths we adopt the above S 60 µm/S 1.4 GHz
ratio. We utilise the spectral template of the archetypical starburst galaxy of M82 from the models
of Efstathiou, Rowan-Robinson & Siebenmorgen (2000) for the spectral energy distribution of the
star-forming population. The radio and far-infrared fluxes are correlated due to the presence of hot
OB stars in giant molecular clouds that heat the surrounding dust producing the infrared emission.
These stars subsequently end their lives as supernovae with the radio emission powered by the
synchrotron emission from their remnants. The radio spectrum is characterised by a power law of
(S ⌫ / ⌫�↵, ↵=0.8).
Pure luminosity evolution for the star-forming population is assumed with a best fit power law
/ (1 + z)3.2. This infrared representation of the star-forming population was preferred over using
the radio luminosity function directly, since it creates a phenomenological link between the radio
emission and the infrared which is responsible for the bulk of the emission in the star-forming
population. The observed number counts at fainter fluxes (<1mJy) vary widely from survey to
survey resulting in a distribution of the best fitting evolution parameterisation. Huynh et al. (2005)
used the radio luminosity function of Condon et al. (2002) and derived a best fitting evolution
parameterisation / (1 + z)2.7, slightly lower than the work presented here. Hopkins (2004) and
Hopkins et al. (1998) used radio and infrared luminosity functions respectively obtaining evolution
in the sub-mJy population / (1+z)2.7 and / (1+z)3.3 respectively. Comparing our observations and
assumed evolution with the results of our survey in the AKARI deep field at the North Ecliptic Pole
(Paper 1) we find that our derived evolution for the AGN and star forming components ((1 + z)3.0,
(1 + z)3.2 respectively) are consistent with the values arrived at for the survey at the North Ecliptic
Pole ((1 + z)3.0 for both components). Both of our surveys at both ecliptic poles (each covering
areas of >⇠ 1 deg2, similar to the VLA-COSMOS survey of Bondi et al. (2008) and larger than
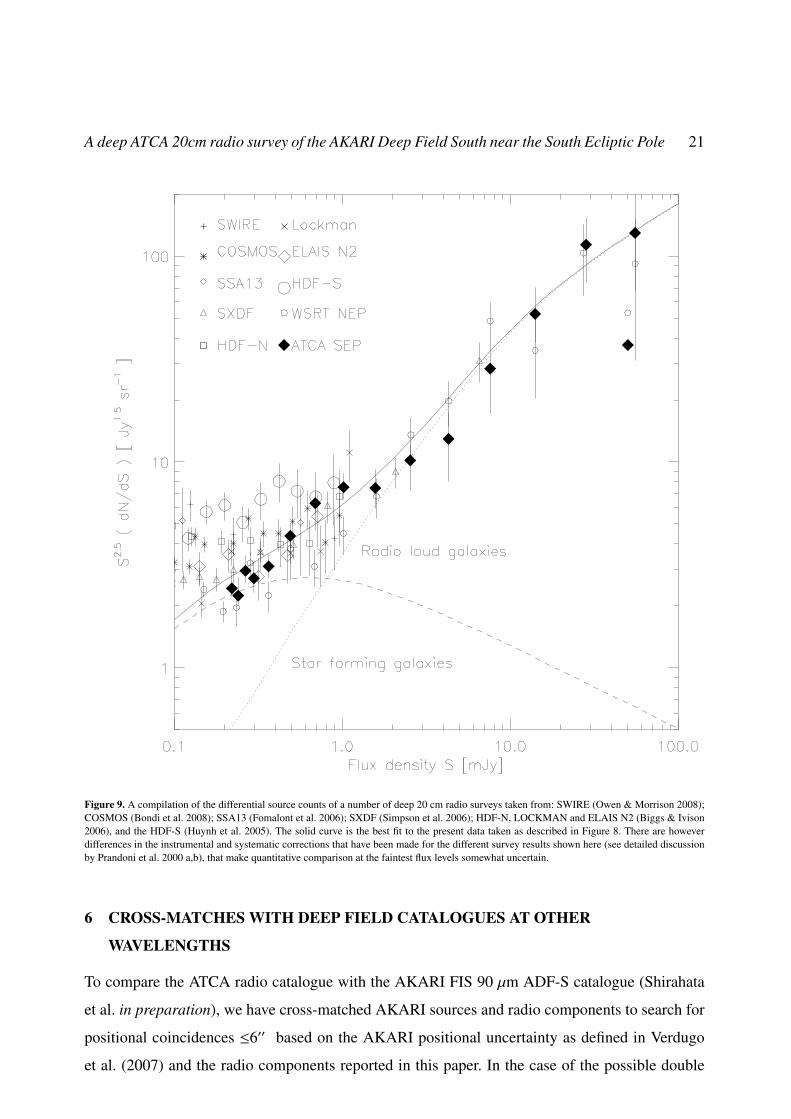
the other surveys depicted in Figure 9) result in number counts at the lower end of the emerging
picture on excess sub-mJy radio counts, as shown in Figure 9.
c� 0000 RAS, MNRAS 000, 000–000
A deep ATCA 20cm radio survey of the AKARI Deep Field South near the South Ecliptic Pole 21
Figure 9. A compilation of the differential source counts of a number of deep 20 cm radio surveys taken from: SWIRE (Owen & Morrison 2008);COSMOS (Bondi et al. 2008); SSA13 (Fomalont et al. 2006); SXDF (Simpson et al. 2006); HDF-N, LOCKMAN and ELAIS N2 (Biggs & Ivison2006), and the HDF-S (Huynh et al. 2005). The solid curve is the best fit to the present data taken as described in Figure 8. There are howeverdifferences in the instrumental and systematic corrections that have been made for the different survey results shown here (see detailed discussionby Prandoni et al. 2000 a,b), that make quantitative comparison at the faintest flux levels somewhat uncertain.
6 CROSS-MATCHES WITH DEEP FIELD CATALOGUES AT OTHER
WAVELENGTHS
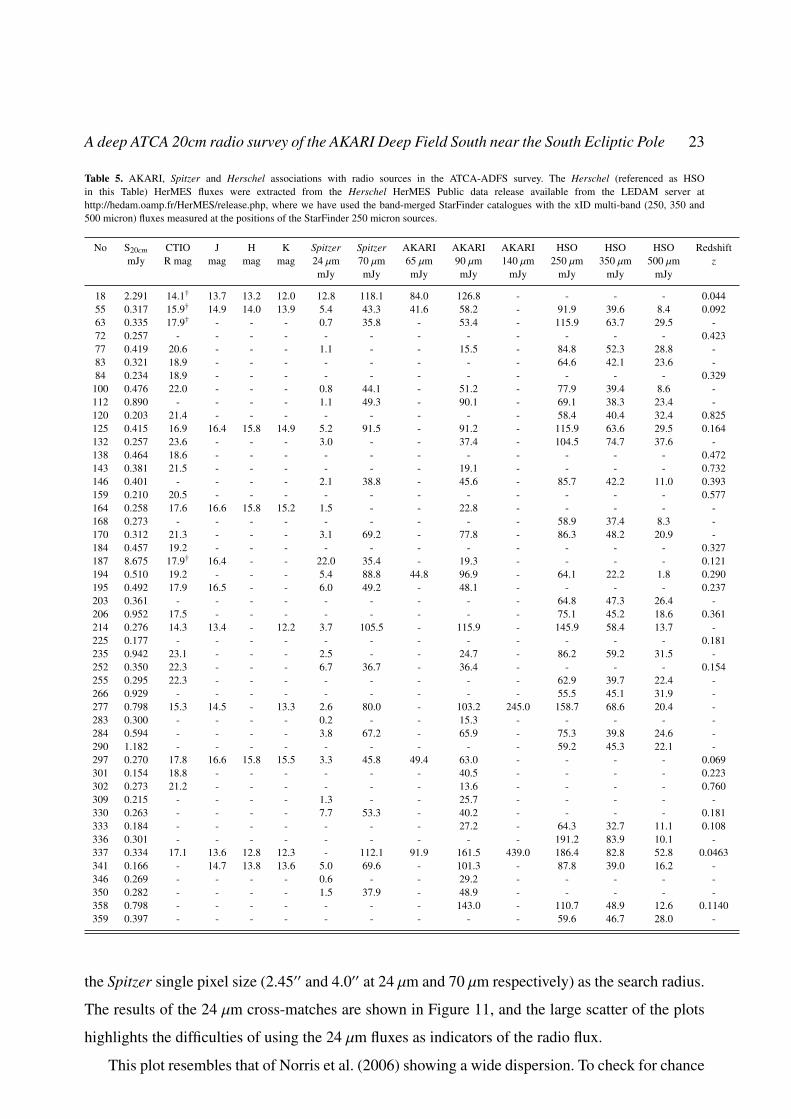
To compare the ATCA radio catalogue with the AKARI FIS 90 µm ADF-S catalogue (Shirahata
et al. in preparation), we have cross-matched AKARI sources and radio components to search for
positional coincidences 600 based on the AKARI positional uncertainty as defined in Verdugo
et al. (2007) and the radio components reported in this paper. In the case of the possible double
c� 0000 RAS, MNRAS 000, 000–000

22 Glenn J. White et al.
or complex radio sources (see Figures 4 and 3) we have also searched for candidate identifica-
tion along a line joining the presumed associated radio components. The AKARI FIS catalogue
covers the entire 12 deg2 of the ADF-S and contains 391, 2282, 315 and 216 sources at 65 µm,
90 µm, 140 µm, 160 µm above 5� detection sensitivities of 28.47 mJy, 12.81 mJy, 121.03 mJy and
372.68 mJy respectively. From this cross matching we recovered 35 sources in common to both
catalogues, twenty-five of which are also reported in the Spitzer 70 µm catalogue (Clements et
al. 2011). We list the ATCA-AKARI cross-matched sources in Table 5, along with R-band detec-
tions from our CTIO MOSAIC-II survey (or in a few cases that are marked with a dagger symbol
from DENIS R-band fluxes), and redshifts from the AAT/AAOmega redshift survey. The Herschel
data are described in the Figure caption of Table 5. The 41 cross matched sources, all of which
lay within a 500 error circle, the mean positional agreement was 1.93±1.2500, showing very good
agreement of the coordinate systems.
6.1 Infrared cross matches (AKARI, Spitzer)
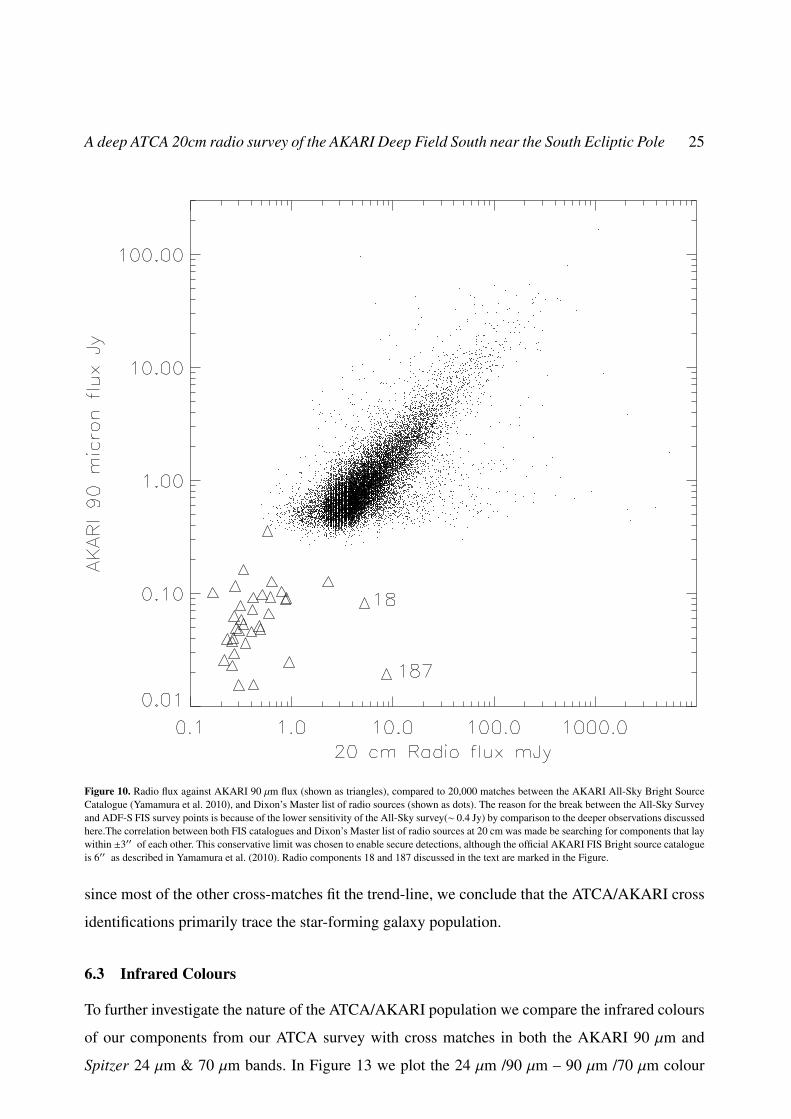
Figure 10 shows the comparison between the fluxes of matched ATCA radio – 90 µm sources de-
tected in our survey as well as a larger sample of radio and 90 µm fluxes taken by cross-correlating
with the AKARI All-Sky Survey FIS catalogue (Yamamura et al. 2010, Oyabu et al. 2009, 2010)
with the compilation of radio sources given by Dixon (1970). Although this Figure does not apply
a K-correction to the measured fluxes, it does show us that although many of the ATCA-ADFS
sources fall on an extrapolation of sources from Dixon’s list to lower fluxes, several of them may
be radio loud compared to the majority (in other words lie significantly to the right of the trend
line), and which therefore may have active nuclei. Of these, the two most extreme are the fol-
lowing. Firstly, ATCA component 18 (J04421266-5355520) at redshift 0.044 appears on the NED
extragalactic database as a bright edge-on spiral galaxy with DENIS Blue and Red magnitudes of
14.6 and 14.1 respectively, and in the GALEX FUV and NUV bands with 22.39 and 21.03 mag
respectively. Secondly, ATCA component 187 is a bright radio source previously detected in the
SUMSS survey (SUMSS J044532-540211) with a radio flux of 1.22 mJy at 834 MHz, suggest-
ing that it may have brightened considerably (assuming a normal spectral index), and associated
with an object having DENIS Blue and Red magnitudes of 18.4 and 17.7 mag respectively and a
magnitude of 21.68 in the GALEX NUV band.
The radio identifications in Table 2 were cross-correlated with the Spitzer 24 µm and 70 µm
catalogues (Scott et al. 2010), finding 173 and 31 matches at 24 µm and 70 µm respectively, using
c� 0000 RAS, MNRAS 000, 000–000
A deep ATCA 20cm radio survey of the AKARI Deep Field South near the South Ecliptic Pole 23
Table 5. AKARI, Spitzer and Herschel associations with radio sources in the ATCA-ADFS survey. The Herschel (referenced as HSOin this Table) HerMES fluxes were extracted from the Herschel HerMES Public data release available from the LEDAM server athttp://hedam.oamp.fr/HerMES/release.php, where we have used the band-merged StarFinder catalogues with the xID multi-band (250, 350 and500 micron) fluxes measured at the positions of the StarFinder 250 micron sources.
No S20cm CTIO J H K Spitzer Spitzer AKARI AKARI AKARI HSO HSO HSO RedshiftmJy R mag mag mag mag 24 µm 70 µm 65 µm 90 µm 140 µm 250 µm 350 µm 500 µm z
mJy mJy mJy mJy mJy mJy mJy mJy
18 2.291 14.1† 13.7 13.2 12.0 12.8 118.1 84.0 126.8 - - - - 0.04455 0.317 15.9† 14.9 14.0 13.9 5.4 43.3 41.6 58.2 - 91.9 39.6 8.4 0.09263 0.335 17.9† - - - 0.7 35.8 - 53.4 - 115.9 63.7 29.5 -72 0.257 - - - - - - - - - - - - 0.42377 0.419 20.6 - - - 1.1 - - 15.5 - 84.8 52.3 28.8 -83 0.321 18.9 - - - - - - - - 64.6 42.1 23.6 -84 0.234 18.9 - - - - - - - - - - - 0.329100 0.476 22.0 - - - 0.8 44.1 - 51.2 - 77.9 39.4 8.6 -112 0.890 - - - - 1.1 49.3 - 90.1 - 69.1 38.3 23.4 -120 0.203 21.4 - - - - - - - - 58.4 40.4 32.4 0.825125 0.415 16.9 16.4 15.8 14.9 5.2 91.5 - 91.2 - 115.9 63.6 29.5 0.164132 0.257 23.6 - - - 3.0 - - 37.4 - 104.5 74.7 37.6 -138 0.464 18.6 - - - - - - - - - - - 0.472143 0.381 21.5 - - - - - - 19.1 - - - - 0.732146 0.401 - - - - 2.1 38.8 - 45.6 - 85.7 42.2 11.0 0.393159 0.210 20.5 - - - - - - - - - - - 0.577164 0.258 17.6 16.6 15.8 15.2 1.5 - - 22.8 - - - - -168 0.273 - - - - - - - - - 58.9 37.4 8.3 -170 0.312 21.3 - - - 3.1 69.2 - 77.8 - 86.3 48.2 20.9 -184 0.457 19.2 - - - - - - - - - - - 0.327187 8.675 17.9† 16.4 - - 22.0 35.4 - 19.3 - - - - 0.121194 0.510 19.2 - - - 5.4 88.8 44.8 96.9 - 64.1 22.2 1.8 0.290195 0.492 17.9 16.5 - - 6.0 49.2 - 48.1 - - - - 0.237203 0.361 - - - - - - - - - 64.8 47.3 26.4 -206 0.952 17.5 - - - - - - - - 75.1 45.2 18.6 0.361214 0.276 14.3 13.4 - 12.2 3.7 105.5 - 115.9 - 145.9 58.4 13.7 -225 0.177 - - - - - - - - - - - - 0.181235 0.942 23.1 - - - 2.5 - - 24.7 - 86.2 59.2 31.5 -252 0.350 22.3 - - - 6.7 36.7 - 36.4 - - - - 0.154255 0.295 22.3 - - - - - - - - 62.9 39.7 22.4 -266 0.929 - - - - - - - - - 55.5 45.1 31.9 -277 0.798 15.3 14.5 - 13.3 2.6 80.0 - 103.2 245.0 158.7 68.6 20.4 -283 0.300 - - - - 0.2 - - 15.3 - - - - -284 0.594 - - - - 3.8 67.2 - 65.9 - 75.3 39.8 24.6 -290 1.182 - - - - - - - - - 59.2 45.3 22.1 -297 0.270 17.8 16.6 15.8 15.5 3.3 45.8 49.4 63.0 - - - - 0.069301 0.154 18.8 - - - - - - 40.5 - - - - 0.223302 0.273 21.2 - - - - - - 13.6 - - - - 0.760309 0.215 - - - - 1.3 - - 25.7 - - - - -330 0.263 - - - - 7.7 53.3 - 40.2 - - - - 0.181333 0.184 - - - - - - - 27.2 - 64.3 32.7 11.1 0.108336 0.301 - - - - - - - - - 191.2 83.9 10.1 -337 0.334 17.1 13.6 12.8 12.3 - 112.1 91.9 161.5 439.0 186.4 82.8 52.8 0.0463341 0.166 - 14.7 13.8 13.6 5.0 69.6 - 101.3 - 87.8 39.0 16.2 -346 0.269 - - - - 0.6 - - 29.2 - - - - -350 0.282 - - - - 1.5 37.9 - 48.9 - - - - -358 0.798 - - - - - - - 143.0 - 110.7 48.9 12.6 0.1140359 0.397 - - - - - - - - - 59.6 46.7 28.0 -
the Spitzer single pixel size (2.4500 and 4.000 at 24 µm and 70 µm respectively) as the search radius.
The results of the 24 µm cross-matches are shown in Figure 11, and the large scatter of the plots
highlights the difficulties of using the 24 µm fluxes as indicators of the radio flux.
This plot resembles that of Norris et al. (2006) showing a wide dispersion. To check for chance
c� 0000 RAS, MNRAS 000, 000–000

24 Glenn J. White et al.
Table 6. Table continues from above: AKARI, Spitzer and Herschel associations with radio sources in the ATCA-ADFS survey. The Herschel fluxeswere extracted from the Herschel HerMES Public data release available from the LEDAM server at http://hedam.oamp.fr/HerMES/release.php,where we have used the band-merged StarFinder catalogues with xID multi-band (250 µm, 350 µm and 500 µm) fluxes measured at the positionsof the StarFinder 250 µm sources.
No S20cm CTIO J H K Spitzer Spitzer AKARI AKARI AKARI HSO HSO HSO RedshiftmJy R mag mag mag mag 24 µm 70 µm 65 µm 90 µm 140 µm 250 µm 350 µm 500 µm z
mJy mJy mJy mJy mJy mJy mJy mJy
410 0.301 16.3† 16.5 16.0 15.3 2.2 45.2 - 46.8 - 88.7 35.4 25.1 0.413419 0.409 17.7† - - - 3.6 66.7 48.9 71.7 - 72.7 34.1 - 0.346421 0.617 16.5† 15.9 15.3 14.5 5.0 79.3 62.1 92.1 - 64.5 32.3 12.3 0.145426 0.370 - - - - - - - 30.1 - 65.3 33.2 16.9 0.159452 0.578 10.3† 12.4 11.6 11.4 - - 20.8 355.9 618.9 101.9 78.8 - 0.0393482 3.386 - - - - 0.7 - - 39.1 - 55.9 62.5 54.5 -487 5.249 17.2† 16.8 15.9 15.1 8.1 70.5 - 81.9 - 62.4 33.8 16.7 0.064491 14.68 - - - - 0.7 - - 39.3 - 71.4 31.2 - -
associations, the radio coordinates were incremented by 6000 in both RA and Dec, and this new
list of positions was cross-correlated with the Spitzer data to simulate what should be blank fields,
resulting in 5 matches. Assuming that these are chance associations, the majority of the matched
components (� 97%) are likely to be real associations. The brightest Spitzer source shown in
Figure 11 is ATCA component 187, which is associated with an R = 17.7 magnitude galaxy, and
has a redshift of 0.121 (see Table 5). The ATCA components with Spitzer detections which have
flux densities � 10 mJy are 11, 12, 155, 160, 236, 446, 448, 458, 530.
6.2 Radio luminosity
The radio luminosity of the sources listed in Table 5 was calculated, assuming a cosmology of H0
= 70 km s�1 Mpc�1, with matter and cosmological constant density parameters of ⌦M = 0.3, ⌦⇤ =
0.7. The redshifts were measured using AAOmega, the fibre-fed optical spectrograph at the Anglo
Australian Observatory as described by Sedgwick et al. (2011), and the resultant plot of the radio
luminosity against redshift is shown in Figure 12, where we assume a mean radio spectral index of
↵ = -0.7 (where S/ ⌫↵) and apply the usual form of the k-correction (z) = (1+z)�(1+↵) at redshift z.
From studies of the local 1.4 GHz luminosity function, Sadler et al. (2002) and Mauch & Sadler
(2007) have shown that the low luminosity population with radio luminosity ⇠ 1023 W Hz�1 will
mostly be luminous star-forming galaxies rather than radio-loud AGN (Eales et al. 2009, Jarvis
et al. 2010, Hardcastle et al. 2010). Although most of the cross-matched ATCA/AKARI sources
shown in Fig. 10 fall on the trend shown from the wider sample of cross matches between AKARI
and Dixon’s catalogue, ATCA components 18 and 187 appear to be radio-loud, although at the
lower end of the luminosities reported from the local luminosity function for this class. However,
c� 0000 RAS, MNRAS 000, 000–000
A deep ATCA 20cm radio survey of the AKARI Deep Field South near the South Ecliptic Pole 25
Figure 10. Radio flux against AKARI 90 µm flux (shown as triangles), compared to 20,000 matches between the AKARI All-Sky Bright SourceCatalogue (Yamamura et al. 2010), and Dixon’s Master list of radio sources (shown as dots). The reason for the break between the All-Sky Surveyand ADF-S FIS survey points is because of the lower sensitivity of the All-Sky survey(⇠ 0.4 Jy) by comparison to the deeper observations discussedhere.The correlation between both FIS catalogues and Dixon’s Master list of radio sources at 20 cm was made be searching for components that laywithin ±300 of each other. This conservative limit was chosen to enable secure detections, although the official AKARI FIS Bright source catalogueis 600 as described in Yamamura et al. (2010). Radio components 18 and 187 discussed in the text are marked in the Figure.
since most of the other cross-matches fit the trend-line, we conclude that the ATCA/AKARI cross
identifications primarily trace the star-forming galaxy population.
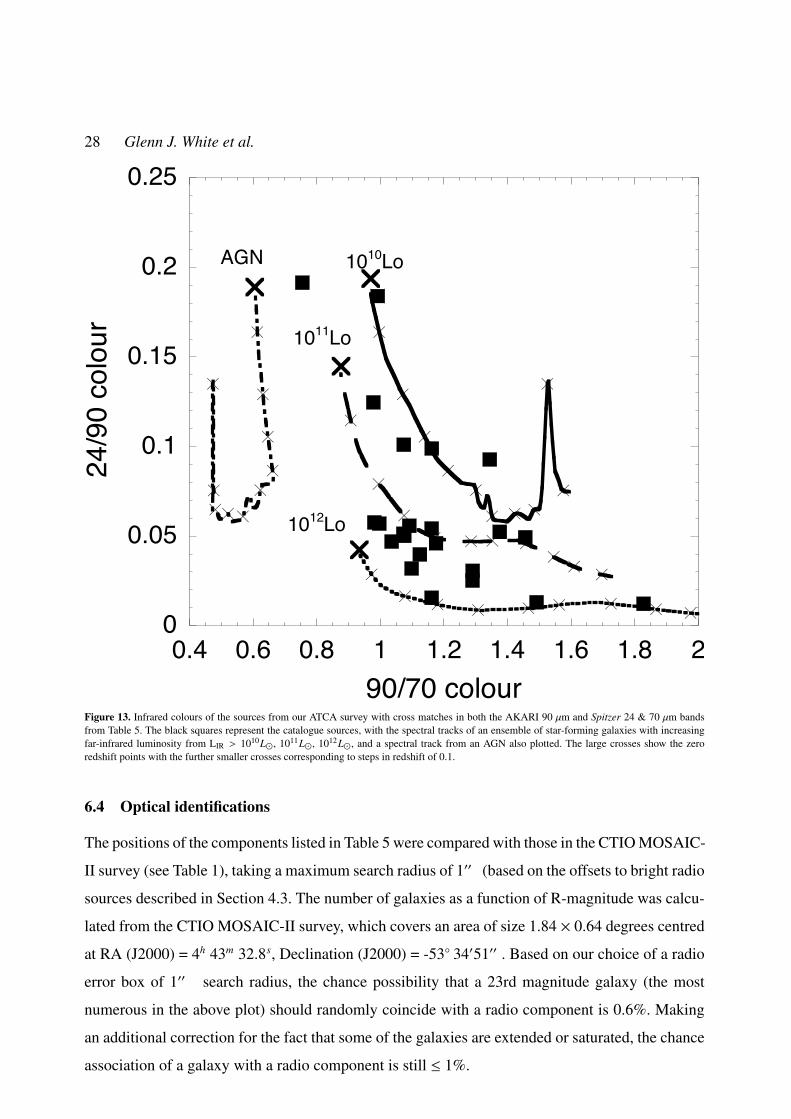
6.3 Infrared Colours
To further investigate the nature of the ATCA/AKARI population we compare the infrared colours
of our components from our ATCA survey with cross matches in both the AKARI 90 µm and
Spitzer 24 µm & 70 µm bands. In Figure 13 we plot the 24 µm /90 µm – 90 µm /70 µm colour
c� 0000 RAS, MNRAS 000, 000–000

26 Glenn J. White et al.
Figure 11. Radio components (shown as triangles) with matching Spitzer 24 µm sources within one Spitzer pixel. The Spitzer fluxes are the pointresponse function fitted fluxes from Scott et al. (2010). The dots are matches between AKARI FIS 65 µm survey detections of bright radio sourcestaken from Dixon’s Master radio catalogue (1970), for confirmed (i.e. quality flag 3) AKARI sources lying more than 10 degrees from the GalacticPlane as described in the caption of Figure 10.
.
distribution of our sources. The models were derived from the SEDs smoothed by the filter bands,
and are overlaid onto the spectral tracks of an ensemble of star-forming galaxies from the models
of Efstathiou et al. (2000) with increasing far-infrared luminosity from LIR > 1010L�, 1011L�,
1012L�, together with the spectral track of an AGN torus from the models of Efstathiou & Rowan-
Robinson (1995). From Figure 13 the infrared colours of the ATCA/AKARI population are con-
sistent with those of star-forming galaxies, although there are selection effects (the requirement
c� 0000 RAS, MNRAS 000, 000–000

A deep ATCA 20cm radio survey of the AKARI Deep Field South near the South Ecliptic Pole 27
Figure 12. Radio luminosity as a function of the radio sources with measured spectroscopic redshifts listed in Table 5.
to have a 90 µm cross-match) which may bias this, and which would need to be tested with more
sensitive infrared observations.
As a further check, the line ratios of [OIII]/H-� (lines at wavelengths of 486.1, 495.8, 500.7nm)
and [OIII]/[OII] (OII doublet at 372.7 nm) were checked from the AAOmega spectra for the
sources with redshifts >0.1, with the result that only one component (ATCA 302) shows ratios
that are close to typical AGN values (Sedgwick et al. in preparation). Therefore the radio lumi-
nosities (Figure 12), infrared colour-colour plots (Figure 13) and AAOmega spectra all show a
consistent picture, suggesting that the ATCA/AKARI cross-identifications predominantly trace a
star-bursting population.
c� 0000 RAS, MNRAS 000, 000–000
28 Glenn J. White et al.
0
0.05
0.1
0.15
0.2
0.25
0.4 0.6 0.8 1 1.2 1.4 1.6 1.8 2
24/9
0 c
olo
ur
90/70 colour
1010
Lo
1011
Lo
1012
Lo
AGN
Figure 13. Infrared colours of the sources from our ATCA survey with cross matches in both the AKARI 90 µm and Spitzer 24 & 70 µm bandsfrom Table 5. The black squares represent the catalogue sources, with the spectral tracks of an ensemble of star-forming galaxies with increasingfar-infrared luminosity from LIR > 1010L�, 1011L�, 1012L�, and a spectral track from an AGN also plotted. The large crosses show the zeroredshift points with the further smaller crosses corresponding to steps in redshift of 0.1.
6.4 Optical identifications
The positions of the components listed in Table 5 were compared with those in the CTIO MOSAIC-
II survey (see Table 1), taking a maximum search radius of 100 (based on the offsets to bright radio
sources described in Section 4.3. The number of galaxies as a function of R-magnitude was calcu-
lated from the CTIO MOSAIC-II survey, which covers an area of size 1.84 ⇥ 0.64 degrees centred
at RA (J2000) = 4h 43m 32.8s, Declination (J2000) = -53� 3405100 . Based on our choice of a radio
error box of 100 search radius, the chance possibility that a 23rd magnitude galaxy (the most
numerous in the above plot) should randomly coincide with a radio component is 0.6%. Making
an additional correction for the fact that some of the galaxies are extended or saturated, the chance
association of a galaxy with a radio component is still 1%.
c� 0000 RAS, MNRAS 000, 000–000

A deep ATCA 20cm radio survey of the AKARI Deep Field South near the South Ecliptic Pole 29
Postage stamp cutouts for 1800⇥1800 regions around the sources with CTIO MOSAIC-II matches
in Table 5 are shown in Figure 14, where the radio component is located at the centre of each box.
The full radio catalogue (Table 2) was then cross-correlated against the CTIO MOSAIC-II sur-
vey, resulting in 95 matches within a search radius of 100 . To test the false identification rate, arbi-
trary 6000 offsets were again added to both the RA and Dec coordinates of the radio components,
and the cross-match was repeated, resulting in only two galaxies as probably false identifications,
which is roughly consistent with out estimate of the likely false detection rate discussed previ-
ously. We can therefore be confident to a high degree of the efficacy of our cross identifications.
These are shown, along with the (probably false) detections arbitrarily shifting the radio pointing
positions, in Figure 15.
The distribution of associated galaxies with magnitude is similar to that found in the CDFS
field by Simpson et al. (2006) and Mainieri et al. (2008), with the majority of the number of
detections rising from an R-magnitude ⇠ 17.
6.5 Sub-millimetre cross matches
The ATCA radio catalogue was searched for matches with the ASTE/AzTEC 1.1 mm deep survey
(Hatsukade et al. 2011) which contains the locations of 198 potential sub-millimetre galaxies over
a ⇠0.25 degree2 area. We find one credible match that is consistent with the positional errors, lying
5.500 from ATCA component 120 with AzTEC J044435.35-534346.6. This has a de-boosted 1.1
mm flux of 2.8±0.5 mJy; a 20 cm radio flux 0.203 mJy; an R-magnitude of 21.4 from our CTIO
imaging survey; and is at the highest redshift of 0.825 amongst the ATCA/AKARI detections
detected in the AAT AAOmega redshift survey (Sedgwick et al. 2011).
We have also cross-correlated the ATCA catalogue with the BLAST South Ecliptic Pole cata-
logue (Valiante et al. 2010) finding five cross matched associations within 1000 of a radio position
(i.e. searching to one third of the BLAST beam width). These sources, and their 250 µm fluxes
are ATCA component numbers 112, 125, 168, 316 and 409 with 250 µm fluxes of 205 mJy, 119
mJy, 177 mJy, 467 mJy and 130 mJy respectively. The first two of these are also listed in Ta-
ble 5 as having AKARI cross-matches. We have also cross-correlated the ATCA radio sources
with the Herschel-HerMES Public Data release catalogue, finding 41 cross-matches, the majority
confirming our AKARI detections.
c� 0000 RAS, MNRAS 000, 000–000

30 Glenn J. White et al.
Figure 14. Optically identified radio components from the CTIO MOSAIC-II images. The number on top of each image is the running number ofthe radio component listed in Table 5. The scaling of each optical image has been adjusted to show the optical galaxy.
c� 0000 RAS, MNRAS 000, 000–000

A deep ATCA 20cm radio survey of the AKARI Deep Field South near the South Ecliptic Pole 31
Figure 15. Cross correlation between the ATCA radio components and CTIO MOSAIC-II R-band galaxies within a 100 search radius. Theequivalent counts after arbitrarily shifting the radio coordinates by +6000 in both RA and Dec are shown as the solid filled bars at the bottomright of the Figure, as an indication of the likely false identification rate, which is clearly in line with that expected from the observed density ofgalaxies in the CTIO MOSAIC-II images.
7 CONCLUSIONS
(i) A deep radio survey has been made of a ⇠ 1.1 degree2 area around the ATCA-ADF-S field
using the ATCA telescope at 20 cm wavelength, and ⇠ 2.5 degree2 to lower sensitivity. The best
sensitivity of the survey was 21 µJy beam�1, achieved with a synthesised beam of 6.200 ⇥ 4.900.
The analysis methodology was carefully chosen to mitigate the various effects that can affect the
efficacy of radio synthesis array observations, resulting in a final catalogue of 530 radio com-
ponents, with the faintest integrated fluxes at about the 100 µJy level. The present catalogue of
radio components will form the basis of a further paper reporting cross correlation against extant
c� 0000 RAS, MNRAS 000, 000–000

32 Glenn J. White et al.
AKARI and deep optical imaging. Our derived sub-mJy number counts are consistent with, but lie
at the lower end of the emerging picture for the excess in the radio counts below 1 mJy. Fitting an
evolving galaxy model to our derived counts, we find a consistent picture of radio-loud dominated
sources at bright fluxes and an emerging population of star-forming galaxies at radio flux levels
<1 mJy.
(ii) Cross-correlating these with far-infrared sources from AKARI, archival optical photometry,
Spitzer and BLAST data, we find 51 components lying within 100 of a radio position in at least one
further catalogue. From optical identifications of a small segment of the radio image, we find 95
cross matches, with most galaxies having R-magnitudes in the range 18-24 magnitudes, similar to
that found in other optical deep field identifications. The redshifts of these vary between the local
universe and redshifts of up to 0.825. Associating with the Spitzer catalogue, we find 173 matches
at 24 µm, within one Spitzer pixel, of which a small sample are clearly radio loud compared to the
bulk of the galaxies.
(iii) The radio luminosity plot suggests that the majority of the radio sources with 90 µm coun-
terparts are luminous star forming galaxies. This conclusion is supported by a comparison of the
infrared colours of our matched sources which are well described by the colours expected from
star-forming galaxies.
(iv) There is one cross match with an ASTE source, and five cross matches with BLAST sub-
millimetre galaxies from the radio sources detected in the present this survey, two of which are
also detected also detected at by AKARI at 90 µm, and 41 detections with Herschel, of which 12
had not previously been identified by AKARI.
8 ACKNOWLEDGEMENTS
This work is based on observations with AKARI, a JAXA project with the participation of ESA.
We also express our thanks to The Australia Telescope Compact Array for the substantial allo-
cation of observing time; to the staff of the Narrabri Observatory for technical support; and the
UK Science and Technology Facilities Council, STFC for support. The UK-Japan AKARI Con-
sortium has also received funding awards from the Sasakawa Foundation, The British Council,
and the DAIWA Foundation, which facilitated travel and exchange activities, for which we are
very grateful. This work was supported by KAKENHI (19540250 and 21111004). KM has been
supported by the Japan Society for the Promotion of Science (JSPS) Postdoctoral Fellowship for
c� 0000 RAS, MNRAS 000, 000–000

A deep ATCA 20cm radio survey of the AKARI Deep Field South near the South Ecliptic Pole 33
Foreign Researchers (P11802), and the research grant of the Polish National Science Centre N
N203 512938.
REFERENCES
Appleton, P. N., et al., 2004, ApJS, 154, 147
Bertin E. Arnouts S., 1996, AAS, 117, 393
Bondi, M., Ciliegi, P., Zamorani, G., 2003, A&A, 403, 857
Boyle B.J., Fong R., Shanks T. Peterson, B.A., 1987, MNRAS, 227, 717
Bracco, A., et al., 2011, MNRAS, 412, 1151
Clements, D., Bendo, G., Pearson, C., Khan, Sophia A., Matsuura, S., Shirahata, M., 2011, MN-
RAS, 411, 373
Condon, J. J., 1991, in ’The interpretation of modern synthesis observations of spiral galaxies;
Proceedings of the Workshop, Albuquerque’, ASPC, 115, 1693
Condon, J. J., 1992, ARA&A, 30, 575
Condon, J. J., Cotton, W. D., Greisen, E. W., Yin, Q.F., Perley, R. A.,Taylor, G. B., Broderick, J.
J., 1998, AJ, 115, 1693
Condon, J.J., Cotton, W.D., Broderick, J.J., 2002, AJ, 124, 675
Dixon, R.S. 1970, ApJS., 20, 1 (using on-line version 43 from the HEASARC archive http:
//heasarc.gsfc.nasa.gov/W3Browse/master-catalog/radio.html)
Dunlop J.S., Peacock J.A., 1990, MNRAS, 247, 19
Eales, S. et al., 2010, PASP, 122, 499
Efstathiou A., Rowan-Robinson M., Siebenmorgen R., 2000, MNRAS, 313, 734
Efstathiou A., Rowan-Robinson M., 1995, MNRAS, 273, 649
Elvis M., Lockman, F.J., Fassnacht, C., 1994, ApJS, 95, 413
Fomalont, E. B., Kellermann, K. I., Cowie, L. L. Capak, P., Barger, A. J., Partridge, R. B., Wind-
horst, R. A., Richards, E. A., 2006, ApJS, 167, 103.
Gruppioni, C. et al., 2008, MNRAS, 684, 136
Hajian, A. et al., 2012, ApJ., 744, 40
Hardcastle, M.J., Alexander, P., Pooley, G. G., Riley, J. M., 1998, MNRAS, 296, 445
Hatsukade, B. et al., 2011, MNRAS, 411, 102
Helou G., Soifer T.T., Rowan-Robinson M., 1985, ApJ, 298, 7
Hopkins A.M., Mobasher B., Cram L., Rowan-Robinson, M., 1998, MNRAS, 296, 839
c� 0000 RAS, MNRAS 000, 000–000

34 Glenn J. White et al.
Hopkins, A.M., Miller, C.J., Connolly, A.J., Genovese, C., Nichol, R. C., Wasserman, L., 2002,
AJ, 123,1086
Hopkins A.M., Afonso J., Chan B., Cram, L. E., Georgakakis, A., Mobasher, B., 2003, AJ, 125,
465
Hopkins, A. M., 2004, ApJ, 615, 209
Huynh M.T., Jackson C.A., Norris R.P., Prandoni, Isabella., 2005, AJ, 130, 1388
Jarvis, Matt J. et al., 2010, MNRAS, 409, 92
Kawada M., et al., 2007, PASJ, 59, 389
Kollgaard, R.I., Brinkmann, W., Chester, M.M. Margaret Mcmath, Feigelson, Eric D., Hertz,
Paul, Reich, Patricia, Wielebinski, Richard., 1994, ApJS, 93, 145
Longair M.S., 1966, MNRAS, 133, 421
Magliocchetti, M., Maddox, S.J., Lahav, O., Wall, J. V., 1998. MNRAS, 300, 257
Mainieri, V., Kellermann, K. I., Fomalont, E. B., Miller, N., 2008, ApJ., 179, 95
Malek, K., Pollo, A., Shirahata, M., Matsuura, S., Kawada, M., Takeuchi, T. T., 2009, 418, 519.,
AKARI, a Light to Illuminate the Misty Universe ASP Conference Series, Vol. 418, proceed-
ings of a conference held 16-19 February 2009 at the University of Tokyo, Tokyo, Japan. Edited
by Takashi Onaka, Glenn J. White, Takao Nakagawa, and Issei Yamamura. San Francisco: As-
tronomical Society of the Pacific
Malek, K., Pollo, A., Takeuchi, T. T., Bienias, P. Shirahata, M., Matsuura, S., Kawada, M., 2010,
A&A, 514, A11
Matsuhara, H. et al., 2006, PASJ, 58, 673
Matsuura, S. et al. 2009, 418, 347., AKARI, a Light to Illuminate the Misty Universe ASP Con-
ference Series, Vol. 418, proceedings of a conference held 16-19 February 2009 at the University
of Tokyo, Tokyo, Japan. Edited by Takashi Onaka, Glenn J. White, Takao Nakagawa, and Issei
Yamamura. San Francisco: Astronomical Society of the Pacific
Matsuura, S., et al., 2011. ApJ., 737, 2
Mauch,T., Murphy, T., Buttery, H. J., Curran, J., Hunstead, R. W., Piestrzynski, B., Robertson, J.
G., Sadler, E. M., 2003. MNRAS, 342, 1117
Mauch, T., Sadler, E., 2007, MNRAS, 375, 931
Middleberg, E., 2006, Pub. Astr. Soc. Australia, 2006, 23, 64
Morganti, R., Garrett, M. A., Chapman, S. Baan, W., Helou, G., Soifer, T., 2004. A&A, 424, 371
Murakami, H., et al., 2007, PASJ, 59, 389
Norris,R.P., et al., 2006, AJ, 132, 2409
c� 0000 RAS, MNRAS 000, 000–000

A deep ATCA 20cm radio survey of the AKARI Deep Field South near the South Ecliptic Pole 35
Oliver, S. J., Wang, L., Smith, A. J., Altieri, B., 2010. A&A, 518, L21
Owen, F.R. & Morrison, G.E., 2008. AJ, 136, 1889
Oyabu, S., Kawara, K., Tsuzuki, Y., Matsuoka, Y., Sameshima, H., Asami, N., Ohyama, Y., 2009,
ApJ., 697, 492
Oyabu, S., et al. 2010. Proc. SPIE 7731, 77312P
Pilbratt, G. L., et al. 2010, A&A, 518, 1
Pearson C.P., 2001, MNRAS, 325, 1511
Pearson C.P., 2005, MNRAS, 358, 1417
Pearson C.P. & Rowan-Robinson M., 1996, MNRAS, 283, 174
Prandoni, I., Gregorini, L., Parma, P. de Ruiter, H. R., Vettolani, G., Wieringa, M. H., Ekers, R.
D., 2000a, A&A Suppl, 146, 31
Prandoni, I., Gregorini, L., Parma, P. de Ruiter, H. R., Vettolani, G., Wieringa, M. H., Ekers, R.
D., 2000b, A&A Suppl, 146, 41
Rowan-Robinson, M., Phillips, T. G., White, G.J., 1980, MNRAS, 82, 381
Rowan-Robinson M., 1970, MNRAS, 149, 365
Rowan-Robinson, M., Phillips, T. G., White, G.,1980, A&A, 82, 381
Rowan-Robinson M., Benn C.R., Lawrence A. McMahon, R. G., Broadhurst, T. J., 1993, MN-
RAS, 263, 123
Sadler,E.M., et al., 2002, MNRAS 329, 227
Sault R.J., Teuben P.J., Wright M.C.H., 1995, Astronomical Data Analysis Software and Systems IV ,
ed. R. Shaw, H.E. Payne, J.J.E. Hayes, ASP Conf. Ser., 77, 433-436
Saunders W., et al., 2000, MNRAS, 317, 55
Schlegel,D.P., Finkbeiner, M., Douglas, P. & Davis, M., 1998, ApJ., 500, 525
Scott, K.S., et al., 2010, ApJS, 191, 212
Sedgwick,C. et al. 2009, 418, 519., AKARI, a Light to Illuminate the Misty Universe ASP Con-
ference Series, Vol. 418, proceedings of a conference held 16-19 February 2009 at the University
of Tokyo, Tokyo, Japan. Edited by Takashi Onaka, Glenn J. White, Takao Nakagawa, and Issei
Yamamura. San Francisco: Astronomical Society of the Pacific
Sedgwick, C., et al., 2011, MNRAS, 416, 1862
Sedgwick, C. et al. 2012, The Spectral Energy Distribution of Galaxies, Proceedings of the Inter-
national astronomical Union Symposium, Publishers Cambridge University Press, 284, 289.
Shirahata, M. et al. 2009, 418, 301. AKARI, a Light to Illuminate the Misty Universe ASP Con-
ference Series, Vol. 418, proceedings of a conference held 16-19 February 2009 at the University
c� 0000 RAS, MNRAS 000, 000–000

36 Glenn J. White et al.
of Tokyo, Tokyo, Japan. Edited by Takashi Onaka, Glenn J. White, Takao Nakagawa, and Issei
Yamamura. San Francisco: Astronomical Society of the Pacific
Simpson, C., et al., 2006, MNRAS, 372, 741
Swinyard, B.M., Nakagawa, T., Merken, P., Royer, P., et al. 2009, Experimental Astronomy, 23,
193
Valiante, E., et al., 2010, ApJ Suppl, 191, 222
Verdugo, E., et al., 2007, AKARI FIS data user manual, ver. 1.3: (http://www.sciops.
esa.int/SA/ASTROF/docs/FIS\_IDUM\_1.3.pdf)
Wada, T., et al., 2008, PASJ, 60,517
White, R. L., Becker, R. H., Helfand, D. J., Gregg, Michael D., 1997, ApJ, 475, 479
White, G.J. et al. 2009, 418, 313. AKARI, a Light to Illuminate the Misty Universe ASP Confer-
ence Series, Vol. 418, proceedings of a conference held 16-19 February 2009 at the University
of Tokyo, Tokyo, Japan. Edited by Takashi Onaka, Glenn J. White, Takao Nakagawa, and Issei
Yamamura. San Francisco: Astronomical Society of the Pacific
White, G. J., et al., 2010a, A&A, 517, A54 (Paper 1)
White, G. J., et al., 2010b, CDS source catalogue: J/A+A/517/A54
Windhorst, R.A., Miley G.K., Owen, F.N. Kron, R. G., Koo, D. C., 1985, ApJ, 289, 494
Windhorst R.A., Fomalont E.B., Partridge R.B., Lowenthal, James D., 1993, ApJ, 405, 498
Yamamura, I., Makiuti, S., Ikeda, N., Fukuda, Y, Oyabu, S, Koga, T., White, G. J., 2010, VizieR
On-line Data Catalog: 2298, 0.
Yun, M.S., Reddy, N.A., Condon, J.J., 2001, ApJ, 554, 803
c� 0000 RAS, MNRAS 000, 000–000
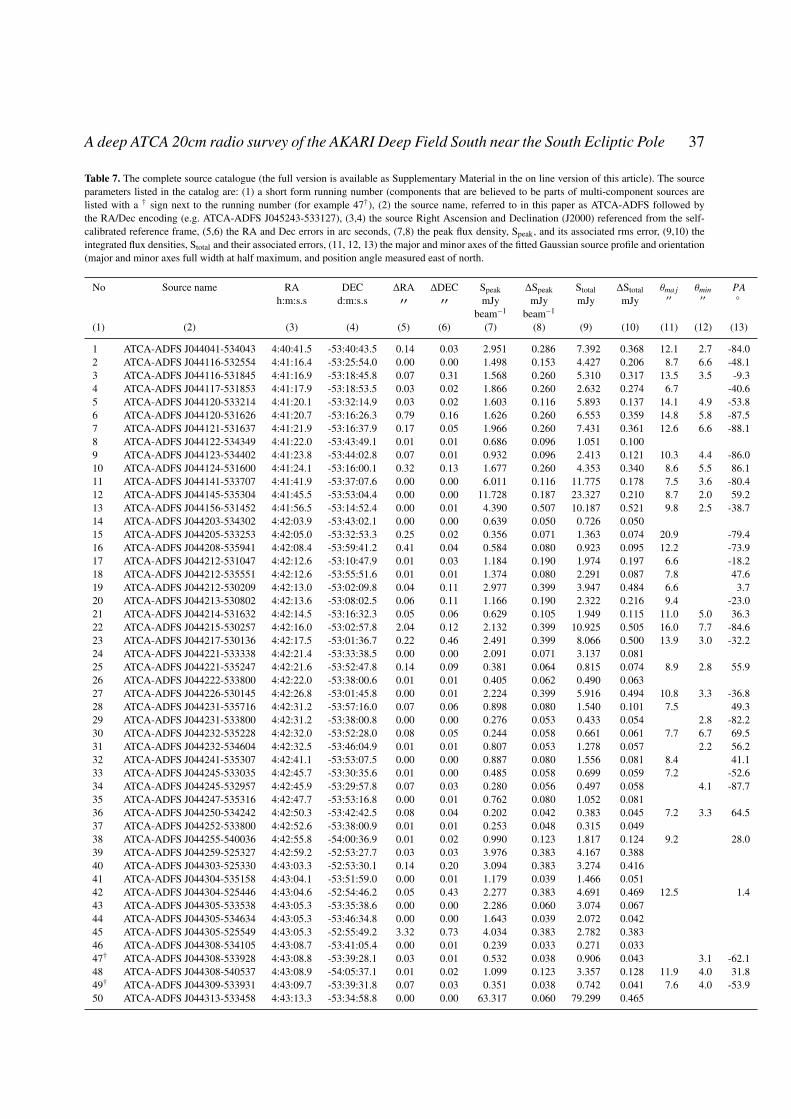
A deep ATCA 20cm radio survey of the AKARI Deep Field South near the South Ecliptic Pole 37
Table 7. The complete source catalogue (the full version is available as Supplementary Material in the on line version of this article). The sourceparameters listed in the catalog are: (1) a short form running number (components that are believed to be parts of multi-component sources arelisted with a † sign next to the running number (for example 47†), (2) the source name, referred to in this paper as ATCA-ADFS followed bythe RA/Dec encoding (e.g. ATCA-ADFS J045243-533127), (3,4) the source Right Ascension and Declination (J2000) referenced from the self-calibrated reference frame, (5,6) the RA and Dec errors in arc seconds, (7,8) the peak flux density, Speak, and its associated rms error, (9,10) theintegrated flux densities, Stotal and their associated errors, (11, 12, 13) the major and minor axes of the fitted Gaussian source profile and orientation(major and minor axes full width at half maximum, and position angle measured east of north.
No Source name RA DEC �RA �DEC Speak �Speak Stotal �Stotal ✓ma j ✓min PAh:m:s.s d:m:s.s 00 00 mJy mJy mJy mJy 00 00 �
beam�1 beam�1
(1) (2) (3) (4) (5) (6) (7) (8) (9) (10) (11) (12) (13)
1 ATCA-ADFS J044041-534043 4:40:41.5 -53:40:43.5 0.14 0.03 2.951 0.286 7.392 0.368 12.1 2.7 -84.02 ATCA-ADFS J044116-532554 4:41:16.4 -53:25:54.0 0.00 0.00 1.498 0.153 4.427 0.206 8.7 6.6 -48.13 ATCA-ADFS J044116-531845 4:41:16.9 -53:18:45.8 0.07 0.31 1.568 0.260 5.310 0.317 13.5 3.5 -9.34 ATCA-ADFS J044117-531853 4:41:17.9 -53:18:53.5 0.03 0.02 1.866 0.260 2.632 0.274 6.7 -40.65 ATCA-ADFS J044120-533214 4:41:20.1 -53:32:14.9 0.03 0.02 1.603 0.116 5.893 0.137 14.1 4.9 -53.86 ATCA-ADFS J044120-531626 4:41:20.7 -53:16:26.3 0.79 0.16 1.626 0.260 6.553 0.359 14.8 5.8 -87.57 ATCA-ADFS J044121-531637 4:41:21.9 -53:16:37.9 0.17 0.05 1.966 0.260 7.431 0.361 12.6 6.6 -88.18 ATCA-ADFS J044122-534349 4:41:22.0 -53:43:49.1 0.01 0.01 0.686 0.096 1.051 0.1009 ATCA-ADFS J044123-534402 4:41:23.8 -53:44:02.8 0.07 0.01 0.932 0.096 2.413 0.121 10.3 4.4 -86.010 ATCA-ADFS J044124-531600 4:41:24.1 -53:16:00.1 0.32 0.13 1.677 0.260 4.353 0.340 8.6 5.5 86.111 ATCA-ADFS J044141-533707 4:41:41.9 -53:37:07.6 0.00 0.00 6.011 0.116 11.775 0.178 7.5 3.6 -80.412 ATCA-ADFS J044145-535304 4:41:45.5 -53:53:04.4 0.00 0.00 11.728 0.187 23.327 0.210 8.7 2.0 59.213 ATCA-ADFS J044156-531452 4:41:56.5 -53:14:52.4 0.00 0.01 4.390 0.507 10.187 0.521 9.8 2.5 -38.714 ATCA-ADFS J044203-534302 4:42:03.9 -53:43:02.1 0.00 0.00 0.639 0.050 0.726 0.05015 ATCA-ADFS J044205-533253 4:42:05.0 -53:32:53.3 0.25 0.02 0.356 0.071 1.363 0.074 20.9 -79.416 ATCA-ADFS J044208-535941 4:42:08.4 -53:59:41.2 0.41 0.04 0.584 0.080 0.923 0.095 12.2 -73.917 ATCA-ADFS J044212-531047 4:42:12.6 -53:10:47.9 0.01 0.03 1.184 0.190 1.974 0.197 6.6 -18.218 ATCA-ADFS J044212-535551 4:42:12.6 -53:55:51.6 0.01 0.01 1.374 0.080 2.291 0.087 7.8 47.619 ATCA-ADFS J044212-530209 4:42:13.0 -53:02:09.8 0.04 0.11 2.977 0.399 3.947 0.484 6.6 3.720 ATCA-ADFS J044213-530802 4:42:13.6 -53:08:02.5 0.06 0.11 1.166 0.190 2.322 0.216 9.4 -23.021 ATCA-ADFS J044214-531632 4:42:14.5 -53:16:32.3 0.05 0.06 0.629 0.105 1.949 0.115 11.0 5.0 36.322 ATCA-ADFS J044215-530257 4:42:16.0 -53:02:57.8 2.04 0.12 2.132 0.399 10.925 0.505 16.0 7.7 -84.623 ATCA-ADFS J044217-530136 4:42:17.5 -53:01:36.7 0.22 0.46 2.491 0.399 8.066 0.500 13.9 3.0 -32.224 ATCA-ADFS J044221-533338 4:42:21.4 -53:33:38.5 0.00 0.00 2.091 0.071 3.137 0.08125 ATCA-ADFS J044221-535247 4:42:21.6 -53:52:47.8 0.14 0.09 0.381 0.064 0.815 0.074 8.9 2.8 55.926 ATCA-ADFS J044222-533800 4:42:22.0 -53:38:00.6 0.01 0.01 0.405 0.062 0.490 0.06327 ATCA-ADFS J044226-530145 4:42:26.8 -53:01:45.8 0.00 0.01 2.224 0.399 5.916 0.494 10.8 3.3 -36.828 ATCA-ADFS J044231-535716 4:42:31.2 -53:57:16.0 0.07 0.06 0.898 0.080 1.540 0.101 7.5 49.329 ATCA-ADFS J044231-533800 4:42:31.2 -53:38:00.8 0.00 0.00 0.276 0.053 0.433 0.054 2.8 -82.230 ATCA-ADFS J044232-535228 4:42:32.0 -53:52:28.0 0.08 0.05 0.244 0.058 0.661 0.061 7.7 6.7 69.531 ATCA-ADFS J044232-534604 4:42:32.5 -53:46:04.9 0.01 0.01 0.807 0.053 1.278 0.057 2.2 56.232 ATCA-ADFS J044241-535307 4:42:41.1 -53:53:07.5 0.00 0.00 0.887 0.080 1.556 0.081 8.4 41.133 ATCA-ADFS J044245-533035 4:42:45.7 -53:30:35.6 0.01 0.00 0.485 0.058 0.699 0.059 7.2 -52.634 ATCA-ADFS J044245-532957 4:42:45.9 -53:29:57.8 0.07 0.03 0.280 0.056 0.497 0.058 4.1 -87.735 ATCA-ADFS J044247-535316 4:42:47.7 -53:53:16.8 0.00 0.01 0.762 0.080 1.052 0.08136 ATCA-ADFS J044250-534242 4:42:50.3 -53:42:42.5 0.08 0.04 0.202 0.042 0.383 0.045 7.2 3.3 64.537 ATCA-ADFS J044252-533800 4:42:52.6 -53:38:00.9 0.01 0.01 0.253 0.048 0.315 0.04938 ATCA-ADFS J044255-540036 4:42:55.8 -54:00:36.9 0.01 0.02 0.990 0.123 1.817 0.124 9.2 28.039 ATCA-ADFS J044259-525327 4:42:59.2 -52:53:27.7 0.03 0.03 3.976 0.383 4.167 0.38840 ATCA-ADFS J044303-525330 4:43:03.3 -52:53:30.1 0.14 0.20 3.094 0.383 3.274 0.41641 ATCA-ADFS J044304-535158 4:43:04.1 -53:51:59.0 0.00 0.01 1.179 0.039 1.466 0.05142 ATCA-ADFS J044304-525446 4:43:04.6 -52:54:46.2 0.05 0.43 2.277 0.383 4.691 0.469 12.5 1.443 ATCA-ADFS J044305-533538 4:43:05.3 -53:35:38.6 0.00 0.00 2.286 0.060 3.074 0.06744 ATCA-ADFS J044305-534634 4:43:05.3 -53:46:34.8 0.00 0.00 1.643 0.039 2.072 0.04245 ATCA-ADFS J044305-525549 4:43:05.3 -52:55:49.2 3.32 0.73 4.034 0.383 2.782 0.38346 ATCA-ADFS J044308-534105 4:43:08.7 -53:41:05.4 0.00 0.01 0.239 0.033 0.271 0.03347† ATCA-ADFS J044308-533928 4:43:08.8 -53:39:28.1 0.03 0.01 0.532 0.038 0.906 0.043 3.1 -62.148 ATCA-ADFS J044308-540537 4:43:08.9 -54:05:37.1 0.01 0.02 1.099 0.123 3.357 0.128 11.9 4.0 31.849† ATCA-ADFS J044309-533931 4:43:09.7 -53:39:31.8 0.07 0.03 0.351 0.038 0.742 0.041 7.6 4.0 -53.950 ATCA-ADFS J044313-533458 4:43:13.3 -53:34:58.8 0.00 0.00 63.317 0.060 79.299 0.465
c� 0000 RAS, MNRAS 000, 000–000

38 Glenn J. White et al.
Table 8. Continuation of the source catalogue
No Source name RA DEC �RA �DEC Speak �Speak Stotal �Stotal ✓ma j ✓min PAh:m:s.s d:m:s.s 00 00 mJy mJy mJy mJy 00 00 �
beam�1 beam�1
(1) (2) (3) (4) (5) (6) (7) (8) (9) (10) (11) (12) (13)
51 ATCA-ADFS J044316-534148 4:43:16.6 -53:41:48.4 0.00 0.00 2.265 0.038 3.040 0.05952 ATCA-ADFS J044317-524701 4:43:17.1 -52:47:01.5 0.01 0.01 8.447 1.066 8.516 1.11353 ATCA-ADFS J044317-533807 4:43:17.9 -53:38:07.7 0.00 0.00 0.641 0.038 0.851 0.04054 ATCA-ADFS J044319-533910 4:43:19.7 -53:39:10.7 0.00 0.00 0.285 0.045 0.352 0.04555 ATCA-ADFS J044321-533932 4:43:21.5 -53:39:32.3 0.00 0.00 0.281 0.042 0.317 0.04256 ATCA-ADFS J044321-532404 4:43:21.7 -53:24:04.3 0.02 0.02 2.578 0.045 5.960 0.187 7.6 4.7 -23.757 ATCA-ADFS J044323-532401 4:43:23.5 -53:24:01.5 0.25 0.04 0.263 0.045 1.325 0.050 14.0 8.6 -72.358 ATCA-ADFS J044326-535437 4:43:26.5 -53:54:37.5 0.00 0.00 1.937 0.055 3.137 0.062 6.4 28.259 ATCA-ADFS J044327-532350 4:43:27.3 -53:23:50.2 0.04 0.02 1.663 0.045 6.763 0.134 10.7 8.6 -85.060 ATCA-ADFS J044330-535405 4:43:30.3 -53:54:05.7 0.01 0.01 0.496 0.055 0.551 0.05861 ATCA-ADFS J044331-531822 4:43:31.2 -53:18:22.6 0.04 0.09 0.215 0.060 0.714 0.064 10.7 6.0 9.362 ATCA-ADFS J044332-532000 4:43:32.5 -53:20:00.9 0.00 0.01 0.735 0.059 0.962 0.06163 ATCA-ADFS J044334-535743 4:43:34.6 -53:57:44.0 0.00 0.00 0.477 0.054 0.335 0.05464 ATCA-ADFS J044334-533414 4:43:34.9 -53:34:14.1 0.00 0.00 0.443 0.062 0.459 0.06265† ATCA-ADFS J044338-534715 4:43:38.6 -53:47:15.6 0.00 0.00 0.296 0.040 0.344 0.04066 ATCA-ADFS J044338-525935 4:43:38.7 -52:59:35.8 0.00 0.00 1.794 0.228 2.174 0.23267† ATCA-ADFS J044338-534732 4:43:39.0 -53:47:32.5 0.00 0.00 0.203 0.035 0.177 0.03568 ATCA-ADFS J044340-535000 4:43:40.9 -53:50:00.9 0.03 0.06 1.834 0.039 4.059 0.155 9.1 2.3 -29.069† ATCA-ADFS J044343-532222 4:43:43.0 -53:22:22.7 0.01 0.03 0.295 0.047 0.511 0.050 8.1 -7.070† ATCA-ADFS J044343-532213 4:43:43.7 -53:22:13.6 0.00 0.00 0.398 0.047 0.540 0.047 6.8 -5.371 ATCA-ADFS J044344-535722 4:43:44.7 -53:57:22.6 0.02 0.07 0.278 0.041 0.578 0.044 10.0 7.272 ATCA-ADFS J044345-533535 4:43:45.4 -53:35:35.3 0.01 0.01 0.201 0.030 0.257 0.03173 ATCA-ADFS J044352-524820 4:43:52.2 -52:48:21.0 0.00 0.00 3.735 0.401 2.878 0.40274 ATCA-ADFS J044352-525142 4:43:53.0 -52:51:42.5 0.02 0.02 2.607 0.401 4.701 0.416 6.8 2.6 -43.875 ATCA-ADFS J044353-530240 4:43:53.6 -53:02:40.2 0.02 0.04 2.697 0.093 9.588 0.176 15.1 3.1 -27.976 ATCA-ADFS J044354-533829 4:43:54.2 -53:38:29.4 0.00 0.00 0.259 0.030 0.332 0.03077 ATCA-ADFS J044354-532112 4:43:54.9 -53:21:12.8 0.02 0.03 0.277 0.040 0.419 0.04378 ATCA-ADFS J044355-534527 4:43:55.2 -53:45:27.8 0.00 0.00 0.195 0.029 0.229 0.02979 ATCA-ADFS J044355-531626 4:43:55.3 -53:16:26.1 0.00 0.01 0.433 0.040 0.636 0.04180 ATCA-ADFS J044355-535634 4:43:55.7 -53:56:34.1 0.00 0.00 1.577 0.041 2.031 0.04981 ATCA-ADFS J044356-524739 4:43:56.0 -52:47:39.5 0.05 0.06 2.453 0.401 4.143 0.434 6.9 -24.482 ATCA-ADFS J044356-532307 4:43:56.6 -53:23:07.7 0.00 0.00 0.412 0.040 0.469 0.04083 ATCA-ADFS J044357-533739 4:43:57.8 -53:37:39.3 0.01 0.02 0.207 0.030 0.321 0.03284 ATCA-ADFS J044359-533034 4:43:59.7 -53:30:34.6 0.02 0.04 0.228 0.031 0.234 0.03285 ATCA-ADFS J040440-525110 4:044:0.5 -52:51:10.4 0.00 0.00 44.456 0.401 86.987 0.606 8.5 -36.786 ATCA-ADFS J044405-533315 4:44:05.8 -53:33:15.7 0.00 0.00 0.392 0.030 0.396 0.03087 ATCA-ADFS J044406-533927 4:44:06.3 -53:39:27.1 0.00 0.00 0.350 0.030 0.394 0.03088 ATCA-ADFS J044406-533400 4:44:06.4 -53:34:00.1 0.00 0.01 0.255 0.029 0.144 0.02989 ATCA-ADFS J044407-534637 4:44:07.2 -53:46:37.8 0.01 0.02 0.170 0.027 0.208 0.02790 ATCA-ADFS J044408-530643 4:44:08.4 -53:06:43.2 0.01 0.01 1.327 0.093 2.691 0.103 9.2 -18.491 ATCA-ADFS J044408-534044 4:44:08.7 -53:40:44.1 0.00 0.00 0.448 0.030 0.421 0.03092 ATCA-ADFS J044409-532858 4:44:09.5 -53:28:58.2 0.00 0.00 0.260 0.031 0.334 0.03193 ATCA-ADFS J044410-533325 4:44:10.3 -53:33:25.5 0.00 0.00 0.293 0.029 0.129 0.02994 ATCA-ADFS J044412-533708 4:44:12.8 -53:37:08.9 0.00 0.00 2.848 0.030 3.378 0.04195 ATCA-ADFS J044413-525347 4:44:13.0 -52:53:47.8 6.18 2.08 1.617 0.168 1.250 0.16996 ATCA-ADFS J044413-534507 4:44:13.9 -53:45:07.8 0.00 0.00 0.319 0.030 0.360 0.03097 ATCA-ADFS J044415-530531 4:44:15.5 -53:05:31.0 0.01 0.04 0.884 0.093 1.521 0.109 8.9 -20.098 ATCA-ADFS J044417-533833 4:44:17.3 -53:38:33.4 0.00 0.01 0.219 0.030 0.215 0.03099† ATCA-ADFS J044417-532435 4:44:17.8 -53:24:35.1 0.02 0.01 2.996 0.031 9.352 0.185 10.5 5.8 -65.8100 ATCA-ADFS J044418-534632 4:44:18.4 -53:46:32.6 0.00 0.00 0.421 0.030 0.476 0.030
c� 0000 RAS, MNRAS 000, 000–000

A deep ATCA 20cm radio survey of the AKARI Deep Field South near the South Ecliptic Pole 39
Table 9. Continuation of the source catalogue
No Source name RA DEC �RA �DEC Speak �Speak Stotal �Stotal ✓ma j ✓min PAh:m:s.s d:m:s.s 00 00 mJy mJy mJy mJy 00 00 �
beam�1 beam�1
(1) (2) (3) (4) (5) (6) (7) (8) (9) (10) (11) (12) (13)
101 ATCA-ADFS J044419-535132 4:44:19.3 -53:51:32.7 0.00 0.01 0.224 0.032 0.239 0.032102† ATCA-ADFS J044419-532442 4:44:19.9 -53:24:42.7 0.07 0.04 2.513 0.031 9.265 0.241 12.9 5.9 -55.1103 ATCA-ADFS J044420-534032 4:44:20.8 -53:40:32.8 0.01 0.01 0.178 0.030 0.197 0.030104 ATCA-ADFS J044421-534006 4:44:21.2 -53:40:06.6 0.09 0.05 0.129 0.030 0.312 0.032 8.8 4.8 -79.0105 ATCA-ADFS J044421-534135 4:44:21.4 -53:41:35.4 0.02 0.06 0.420 0.030 0.674 0.040 7.7 13.2106 ATCA-ADFS J044422-531407 4:44:22.1 -53:14:07.1 0.00 0.01 0.553 0.056 0.789 0.057107 ATCA-ADFS J044422-534251 4:44:22.2 -53:42:51.6 0.05 0.06 0.144 0.030 0.148 0.032108 ATCA-ADFS J044425-533732 4:44:25.9 -53:37:32.2 0.00 0.00 0.193 0.034 0.235 0.034109 ATCA-ADFS J044428-534728 4:44:28.4 -53:47:28.5 0.00 0.00 0.208 0.031 0.248 0.031110 ATCA-ADFS J044430-540457 4:44:30.9 -54:04:57.5 0.00 0.00 1.971 0.080 3.529 0.090 9.3 -7.0111 ATCA-ADFS J044431-535420 4:44:32.0 -53:54:20.2 0.00 0.00 0.261 0.034 0.319 0.034112 ATCA-ADFS J044432-540544 4:44:32.0 -54:05:44.8 0.02 0.04 0.681 0.083 0.890 0.094113 ATCA-ADFS J044432-530604 4:44:32.1 -53:06:04.9 0.00 0.00 0.847 0.093 1.332 0.093 6.2 -19.3114 ATCA-ADFS J044432-532237 4:44:32.5 -53:22:37.5 0.01 0.02 0.178 0.035 0.197 0.035115 ATCA-ADFS J044433-535234 4:44:33.0 -53:52:34.1 0.00 0.00 1.431 0.030 1.600 0.034116 ATCA-ADFS J044433-524317 4:44:33.7 -52:43:17.1 0.02 0.04 6.883 1.151 16.162 1.196 10.3 -35.7117 ATCA-ADFS J044433-535036 4:44:33.7 -53:50:36.8 0.00 0.00 7.727 0.030 9.242 0.095118 ATCA-ADFS J044434-535516 4:44:34.5 -53:55:16.2 0.00 0.00 2.096 0.044 2.565 0.049119 ATCA-ADFS J044434-534949 4:44:34.6 -53:49:49.5 0.01 0.01 0.160 0.030 0.181 0.030120 ATCA-ADFS J044434-534346 4:44:34.7 -53:43:46.3 0.01 0.01 0.213 0.033 0.203 0.033121 ATCA-ADFS J044435-530533 4:44:35.2 -53:05:33.5 0.00 0.00 1.169 0.093 2.333 0.098 9.9 -13.1122† ATCA-ADFS J044435-533604 4:44:35.6 -53:36:04.3 0.05 0.11 0.449 0.027 0.834 0.043 8.2 10.0123† ATCA-ADFS J044436-533558 4:44:36.2 -53:35:58.4 0.05 0.04 0.303 0.027 0.681 0.030 7.5 4.4 21.6124 ATCA-ADFS J044436-534522 4:44:36.7 -53:45:22.2 0.00 0.00 1.734 0.027 1.638 0.033125 ATCA-ADFS J044436-534632 4:44:36.7 -53:46:32.2 0.00 0.00 0.302 0.030 0.415 0.030126 ATCA-ADFS J044437-524346 4:44:37.3 -52:43:47.0 0.00 0.00 12.943 1.151 34.043 1.242 11.1 2.6 -29.2127 ATCA-ADFS J044437-533655 4:44:37.7 -53:36:55.3 0.00 0.00 0.244 0.033 0.230 0.033128 ATCA-ADFS J044437-533325 4:44:37.7 -53:33:25.9 0.00 0.00 0.343 0.027 0.365 0.027129 ATCA-ADFS J044439-540524 4:44:39.1 -54:05:24.3 0.00 0.01 1.356 0.083 2.549 0.093 10.2 -5.7130 ATCA-ADFS J044439-530617 4:44:39.7 -53:06:17.3 0.00 0.01 0.510 0.023 0.510 0.023131 ATCA-ADFS J044441-530441 4:44:41.3 -53:04:41.3 0.02 0.06 0.459 0.027 0.459 0.027132 ATCA-ADFS J044441-532112 4:44:41.9 -53:21:12.7 0.06 0.08 0.289 0.033 0.257 0.033133 ATCA-ADFS J044443-533859 4:44:43.3 -53:38:59.3 0.00 0.00 0.126 0.031 0.154 0.031134 ATCA-ADFS J044445-533858 4:44:45.8 -53:38:58.0 3.21 0.00 0.130 0.030 0.114 0.030135 ATCA-ADFS J044446-532244 4:44:46.0 -53:22:44.4 0.00 0.01 0.160 0.034 0.234 0.034136 ATCA-ADFS J044446-524619 4:44:46.3 -52:46:19.9 0.02 0.02 1.612 0.204 2.271 0.207 6.5 -30.5137 ATCA-ADFS J044450-533856 4:44:50.4 -53:38:56.3 0.00 0.00 2.972 0.027 3.047 0.035138 ATCA-ADFS J044451-532713 4:44:51.4 -53:27:13.9 0.00 0.00 0.285 0.028 0.464 0.028 7.3 8.6139 ATCA-ADFS J044451-535751 4:44:51.6 -53:57:51.3 0.01 0.01 0.329 0.049 0.383 0.050140† ATCA-ADFS J044453-534057 4:44:53.1 -53:40:57.6 0.01 0.00 1.467 0.027 2.338 0.033 3.3 -60.8141† ATCA-ADFS J044453-534103 4:44:53.7 -53:41:03.2 0.01 0.02 2.376 0.027 4.611 0.113 8.7 -20.2142 ATCA-ADFS J044455-531423 4:44:55.2 -53:14:23.4 0.00 0.02 0.183 0.027 0.183 0.027143 ATCA-ADFS J044455-533405 4:44:55.4 -53:34:05.7 0.00 0.00 0.285 0.027 0.381 0.027144 ATCA-ADFS J044456-532346 4:44:56.1 -53:23:46.9 0.02 0.02 0.139 0.028 0.164 0.029145 ATCA-ADFS J044456-532608 4:44:56.3 -53:26:08.1 0.00 0.00 0.255 0.028 0.283 0.028146 ATCA-ADFS J044456-531530 4:44:56.8 -53:15:30.7 0.02 0.02 0.199 0.037 0.401 0.038 6.3 4.4 16.2147 ATCA-ADFS J044457-535549 4:44:57.7 -53:55:49.9 0.00 0.00 0.520 0.044 0.630 0.046148 ATCA-ADFS J044459-535457 4:44:59.0 -53:54:57.2 0.00 0.00 0.246 0.036 0.273 0.036149 ATCA-ADFS J040450-533449 4:045:0.8 -53:34:49.4 0.00 0.00 1.079 0.027 1.237 0.029150 ATCA-ADFS J044503-525332 4:45:03.9 -52:53:32.1 0.01 0.01 1.804 0.204 3.678 0.209 8.6 -20.6
c� 0000 RAS, MNRAS 000, 000–000

40 Glenn J. White et al.
Table 10. Continuation of the source catalogue
No Source name RA DEC �RA �DEC Speak �Speak Stotal �Stotal ✓ma j ✓min PAh:m:s.s d:m:s.s 00 00 mJy mJy mJy mJy 00 00 �
beam�1 beam�1
(1) (2) (3) (4) (5) (6) (7) (8) (9) (10) (11) (12) (13)
151 ATCA-ADFS J044504-531756 4:45:04.6 -53:17:56.5 1.11 0.08 0.211 0.032 0.133 0.032152 ATCA-ADFS J044504-525431 4:45:04.9 -52:54:31.9 0.01 0.02 0.629 0.100 1.304 0.103 7.8 2.8 0.3153 ATCA-ADFS J044506-531726 4:45:06.9 -53:17:26.8 0.00 0.01 0.191 0.032 0.265 0.032 7.5 -4.6154 ATCA-ADFS J044507-525423 4:45:07.6 -52:54:23.8 0.00 0.00 6.554 0.100 10.806 0.126 6.8 -24.2155 ATCA-ADFS J044508-541153 4:45:08.1 -54:11:53.3 0.00 0.01 11.230 0.274 25.146 0.396 11.7 -13.0156 ATCA-ADFS J044508-533835 4:45:08.6 -53:38:35.7 0.00 0.02 0.205 0.027 0.205 0.027157 ATCA-ADFS J044508-525818 4:45:08.7 -52:58:18.6 0.01 0.01 1.106 0.100 2.262 0.105 9.2 -25.3158 ATCA-ADFS J044508-535021 4:45:08.9 -53:50:21.9 0.01 0.04 0.147 0.031 0.271 0.031 9.4 -10.3159 ATCA-ADFS J044509-533751 4:45:09.7 -53:37:51.4 0.00 0.00 0.156 0.023 0.210 0.023160 ATCA-ADFS J044512-540511 4:45:12.6 -54:05:11.4 0.00 0.00 6.211 0.083 10.826 0.161 9.1 -16.7161 ATCA-ADFS J044513-530633 4:45:13.7 -53:06:33.9 0.00 0.00 0.600 0.063 0.825 0.063162 ATCA-ADFS J044516-540332 4:45:16.9 -54:03:32.4 0.05 0.13 0.342 0.080 0.727 0.085 9.2 -3.8163 ATCA-ADFS J044518-531643 4:45:18.1 -53:16:43.4 0.00 0.00 0.912 0.033 1.099 0.037164 ATCA-ADFS J044518-535119 4:45:18.3 -53:51:19.8 0.01 0.01 0.155 0.033 0.258 0.034 7.6 -31.6165 ATCA-ADFS J044518-540631 4:45:18.5 -54:06:31.1 0.02 0.07 1.650 0.083 2.999 0.137 10.1 -18.4166† ATCA-ADFS J044518-531231 4:45:18.5 -53:12:31.0 0.00 0.00 0.492 0.042 0.705 0.042 6.3 -1.4167 ATCA-ADFS J044518-523853 4:45:18.7 -52:38:53.4 0.01 0.01 4.669 0.581 7.379 0.598 8.8 -34.6168 ATCA-ADFS J044519-531045 4:45:19.5 -53:10:45.6 0.00 0.00 0.215 0.038 0.273 0.038169† ATCA-ADFS J044520-531221 4:45:20.0 -53:12:21.4 0.01 0.06 0.178 0.035 0.370 0.036 9.9 -13.2170 ATCA-ADFS J044520-532010 4:45:20.1 -53:20:10.3 0.01 0.02 0.262 0.033 0.312 0.033171† ATCA-ADFS J044521-530918 4:45:21.1 -53:09:18.6 0.01 0.01 0.155 0.041 0.246 0.041 7.0 -14.6172† ATCA-ADFS J044522-530853 4:45:22.2 -53:08:53.4 0.00 0.00 0.379 0.042 0.588 0.042 6.7 -18.4173 ATCA-ADFS J044522-532644 4:45:22.8 -53:26:44.5 0.00 0.00 0.164 0.025 0.180 0.025174 ATCA-ADFS J044523-530910 4:45:23.1 -53:09:10.4 0.31 0.15 0.160 0.041 0.335 0.046 7.6 4.0 63.2175† ATCA-ADFS J044523-530430 4:45:23.5 -53:04:30.8 0.00 0.00 0.280 0.053 0.386 0.053176 ATCA-ADFS J044523-530914 4:45:23.9 -53:09:14.9 0.00 0.01 0.258 0.041 0.284 0.041177 ATCA-ADFS J044524-531844 4:45:24.2 -53:18:44.2 0.00 0.00 0.752 0.033 0.943 0.034178 ATCA-ADFS J044524-530609 4:45:24.9 -53:06:09.4 0.00 0.02 0.171 0.026 0.171 0.026179† ATCA-ADFS J044525-530509 4:45:25.8 -53:05:10.0 0.00 0.00 0.616 0.063 0.742 0.063180† ATCA-ADFS J044526-530607 4:45:26.6 -53:06:07.1 0.00 0.00 0.261 0.056 0.422 0.057 6.3 35.7181 ATCA-ADFS J044527-535318 4:45:27.3 -53:53:18.5 0.03 0.03 0.253 0.041 0.318 0.044182 ATCA-ADFS J044527-531153 4:45:27.6 -53:11:53.7 0.00 0.00 0.388 0.036 0.581 0.036183 ATCA-ADFS J044527-533930 4:45:28.0 -53:39:30.3 0.00 0.00 10.459 0.035 15.530 0.194184 ATCA-ADFS J044530-532131 4:45:30.4 -53:21:31.5 0.00 0.00 0.307 0.034 0.457 0.034 6.4 -1.2185 ATCA-ADFS J044531-524044 4:45:31.4 -52:40:45.0 0.10 0.21 2.332 0.392 4.700 0.468 10.1 -23.5186 ATCA-ADFS J044532-540422 4:45:32.1 -54:04:22.6 0.01 0.03 0.866 0.123 1.551 0.132 8.3 -20.2187 ATCA-ADFS J044532-540210 4:45:32.6 -54:02:10.1 0.00 0.00 5.219 0.123 8.675 0.159 8.7 -24.9188 ATCA-ADFS J044533-540429 4:45:33.6 -54:04:29.3 0.01 0.02 1.946 0.123 3.921 0.149 9.5 -27.3189 ATCA-ADFS J044534-532414 4:45:34.3 -53:24:14.9 0.01 0.01 0.145 0.031 0.247 0.031 6.4 2.9 11.4190 ATCA-ADFS J044535-533850 4:45:35.7 -53:38:50.3 0.00 0.00 0.176 0.033 0.362 0.033 6.5 4.6 52.4191 ATCA-ADFS J044536-535557 4:45:36.6 -53:55:57.0 0.01 0.02 0.341 0.058 0.491 0.059 7.3 -32.9192 ATCA-ADFS J044537-534939 4:45:37.2 -53:49:39.5 0.00 0.00 0.418 0.038 0.552 0.038193 ATCA-ADFS J044537-533829 4:45:37.5 -53:38:29.8 0.00 0.00 0.219 0.033 0.296 0.033194 ATCA-ADFS J044538-534726 4:45:38.6 -53:47:26.8 0.00 0.00 0.380 0.038 0.510 0.038195 ATCA-ADFS J044541-535246 4:45:41.1 -53:52:46.1 0.01 0.02 0.364 0.038 0.492 0.039196 ATCA-ADFS J044541-531132 4:45:41.8 -53:11:32.8 0.00 0.01 0.231 0.027 0.304 0.027197 ATCA-ADFS J044544-534430 4:45:44.6 -53:44:30.7 0.00 0.00 1.167 0.035 1.428 0.036198 ATCA-ADFS J044547-530108 4:45:47.7 -53:01:08.1 0.00 0.00 0.667 0.077 1.158 0.077 6.5 2.0 -23.5199 ATCA-ADFS J044549-533916 4:45:49.8 -53:39:16.2 0.00 0.00 0.320 0.035 0.402 0.035200 ATCA-ADFS J044553-531231 4:45:53.7 -53:12:32.0 0.19 0.48 0.107 0.037 0.609 0.039 18.9 6.4 23.7
c� 0000 RAS, MNRAS 000, 000–000

A deep ATCA 20cm radio survey of the AKARI Deep Field South near the South Ecliptic Pole 41
Table 11. Continuation of the source catalogue
No Source name RA DEC �RA �DEC Speak �Speak Stotal �Stotal ✓ma j ✓min PAh:m:s.s d:m:s.s 00 00 mJy mJy mJy mJy 00 00 �
beam�1 beam�1
(1) (2) (3) (4) (5) (6) (7) (8) (9) (10) (11) (12) (13)
200 ATCA-ADFS J044553-531231 4:45:53.7 -53:12:32.0 0.19 0.48 0.107 0.037 0.609 0.039 18.9 6.4 23.7201 ATCA-ADFS J044554-533522 4:45:54.1 -53:35:22.4 0.00 0.00 2.729 0.031 3.294 0.038202 ATCA-ADFS J044554-534203 4:45:54.4 -53:42:03.6 0.01 0.01 0.150 0.036 0.293 0.036 7.6 2.7 -45.5203 ATCA-ADFS J044554-533817 4:45:54.7 -53:38:17.9 0.00 0.00 0.359 0.031 0.361 0.031204 ATCA-ADFS J044555-535951 4:45:55.4 -53:59:51.2 0.00 0.00 0.813 0.058 1.091 0.059205 ATCA-ADFS J044555-534001 4:45:55.4 -53:40:01.7 0.00 0.03 0.201 0.031 0.201 0.031206 ATCA-ADFS J044556-531633 4:45:56.0 -53:16:33.8 0.00 0.00 0.773 0.034 0.952 0.035207 ATCA-ADFS J044557-531304 4:45:57.9 -53:13:04.6 0.02 0.05 0.145 0.037 0.395 0.038 10.0 4.1 -14.3208 ATCA-ADFS J044558-532101 4:45:58.5 -53:21:01.3 0.00 0.00 0.390 0.034 0.505 0.035209 ATCA-ADFS J040460-533624 4:046:0.4 -53:36:24.5 0.00 0.00 0.707 0.031 0.841 0.033210 ATCA-ADFS J044601-531837 4:46:01.1 -53:18:37.1 0.00 0.02 0.189 0.028 0.172 0.028211 ATCA-ADFS J044601-525350 4:46:01.3 -52:53:50.4 0.00 0.00 1.032 0.103 0.541 0.104212† ATCA-ADFS J044602-534438 4:46:02.3 -53:44:38.3 0.02 0.03 0.150 0.036 0.258 0.037 3.4 43.4213† ATCA-ADFS J044604-534444 4:46:04.0 -53:44:44.9 0.01 0.01 0.152 0.036 0.211 0.036214 ATCA-ADFS J044605-534955 4:46:05.3 -53:49:55.9 0.00 0.00 0.546 0.043 0.276 0.043215 ATCA-ADFS J044606-525438 4:46:06.1 -52:54:38.9 0.00 0.00 0.976 0.077 1.373 0.078216 ATCA-ADFS J044606-535634 4:46:06.4 -53:56:34.7 0.00 0.01 0.354 0.062 0.506 0.063 6.7 -17.4217 ATCA-ADFS J044607-530442 4:46:07.9 -53:04:42.0 0.00 0.00 0.443 0.048 0.594 0.048218 ATCA-ADFS J044608-535811 4:46:08.8 -53:58:11.8 0.00 0.00 0.588 0.058 0.731 0.058219 ATCA-ADFS J044610-533716 4:46:10.0 -53:37:16.9 0.00 0.00 0.400 0.031 0.505 0.031220 ATCA-ADFS J044614-530741 4:46:14.2 -53:07:42.0 0.00 0.00 0.195 0.036 0.216 0.036221 ATCA-ADFS J044614-532319 4:46:14.3 -53:23:19.1 0.00 0.00 0.905 0.034 0.839 0.036222 ATCA-ADFS J044614-535407 4:46:14.8 -53:54:07.3 0.00 0.00 2.780 0.096 5.077 0.102 7.6 -40.5223† ATCA-ADFS J044615-533919 4:46:15.8 -53:39:19.6 0.00 0.00 22.492 0.051 45.194 0.652 6.7 4.1 9.6224† ATCA-ADFS J044617-533924 4:46:17.3 -53:39:24.2 0.01 0.01 11.846 0.051 22.070 0.562 4.0 -49.5225 ATCA-ADFS J044617-531156 4:46:17.5 -53:11:56.5 0.00 0.01 0.154 0.029 0.177 0.029226 ATCA-ADFS J044617-531919 4:46:18.0 -53:19:19.6 0.00 0.00 0.297 0.041 0.305 0.041227† ATCA-ADFS J044620-525617 4:46:20.0 -52:56:17.5 0.00 0.00 20.759 0.064 40.815 0.559 8.5 -8.1228† ATCA-ADFS J044620-525630 4:46:20.5 -52:56:30.1 0.01 0.04 11.333 0.064 24.243 0.693 9.1 -15.6229 ATCA-ADFS J044621-531244 4:46:21.3 -53:12:44.5 0.01 0.01 0.270 0.032 0.279 0.033230 ATCA-ADFS J044621-535001 4:46:21.9 -53:50:01.6 0.01 0.01 0.292 0.049 0.322 0.050231 ATCA-ADFS J044622-524104 4:46:22.1 -52:41:04.3 8.27 1.67 2.601 0.324 3.619 0.329 13.9 0.8232 ATCA-ADFS J044622-532725 4:46:22.7 -53:27:25.7 0.00 0.00 0.571 0.034 0.586 0.035233 ATCA-ADFS J044623-532549 4:46:23.2 -53:25:49.5 0.00 0.00 5.402 0.034 7.158 0.081234 ATCA-ADFS J044623-535123 4:46:23.4 -53:51:23.3 0.00 0.01 0.450 0.061 0.670 0.062235 ATCA-ADFS J044626-534942 4:46:26.6 -53:49:42.9 0.00 0.01 0.572 0.061 0.942 0.062 6.6 -20.9236 ATCA-ADFS J044629-532004 4:46:29.5 -53:20:04.2 0.00 0.00 27.077 0.042 28.928 0.241237 ATCA-ADFS J044630-532854 4:46:30.3 -53:28:54.0 0.00 0.00 0.908 0.034 0.958 0.035238† ATCA-ADFS J044631-534655 4:46:31.6 -53:46:55.4 0.00 0.00 10.910 0.061 20.590 0.249 6.7 3.4 -41.9239 ATCA-ADFS J044632-530332 4:46:32.5 -53:03:32.6 0.00 0.02 0.197 0.031 0.197 0.031240† ATCA-ADFS J044632-534702 4:46:33.0 -53:47:02.2 0.00 0.00 7.419 0.061 28.037 0.421 14.7 5.1 -68.3241† ATCA-ADFS J044633-534704 4:46:33.5 -53:47:05.0 0.02 0.01 10.250 0.061 23.175 0.500 8.0 4.4 -55.2242 ATCA-ADFS J044634-531115 4:46:34.1 -53:11:15.7 0.00 0.00 0.306 0.033 0.366 0.033243 ATCA-ADFS J044637-531026 4:46:37.3 -53:10:26.7 0.00 0.00 3.340 0.033 4.117 0.042244 ATCA-ADFS J044638-533251 4:46:38.8 -53:32:51.0 0.00 0.00 0.349 0.040 0.450 0.040245 ATCA-ADFS J044639-525544 4:46:39.5 -52:55:44.8 0.00 0.00 0.557 0.064 0.702 0.064246 ATCA-ADFS J044641-540925 4:46:41.1 -54:09:25.9 0.01 0.02 12.401 0.564 32.397 0.690 13.7 -33.2247 ATCA-ADFS J044641-534716 4:46:41.4 -53:47:16.2 0.00 0.00 0.732 0.061 1.002 0.061248† ATCA-ADFS J044642-530146 4:46:42.6 -53:01:46.4 0.00 0.00 4.213 0.037 5.786 0.054249 ATCA-ADFS J044642-532614 4:46:42.7 -53:26:14.8 0.00 0.00 0.476 0.034 0.441 0.034250† ATCA-ADFS J044642-531806 4:46:42.9 -53:18:06.9 0.01 0.01 2.176 0.042 3.662 0.106 7.6 2.2 33.8
c� 0000 RAS, MNRAS 000, 000–000
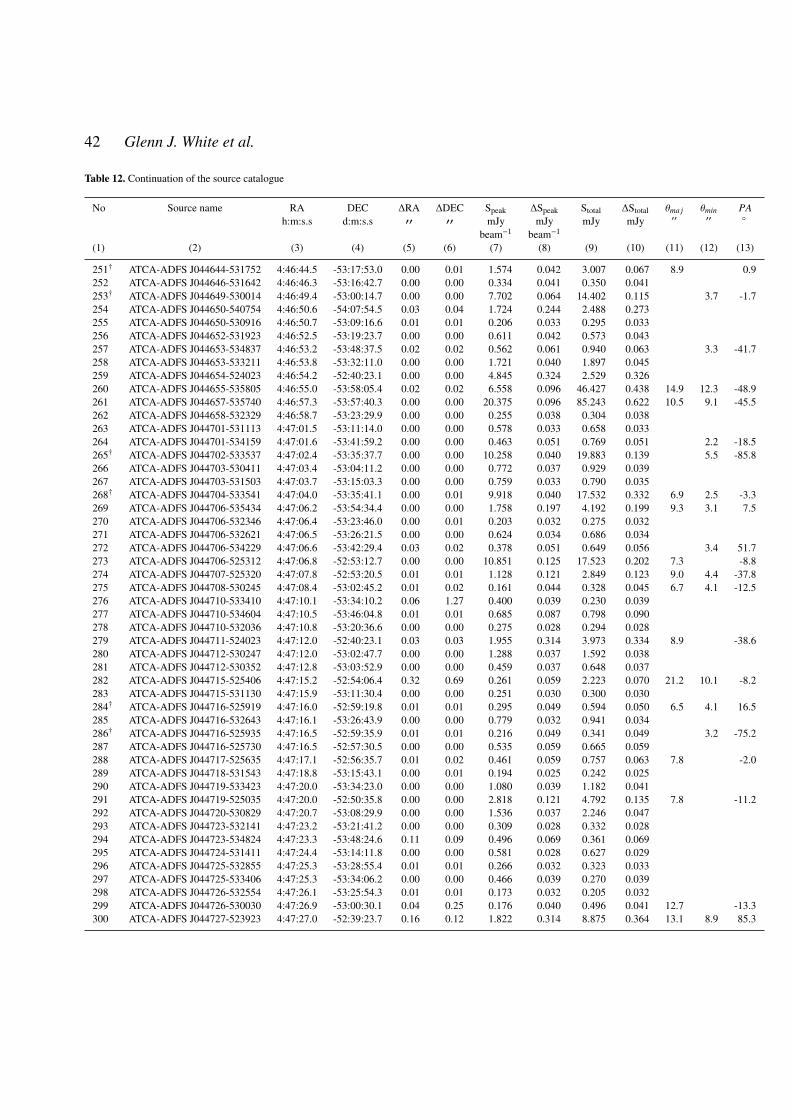
42 Glenn J. White et al.
Table 12. Continuation of the source catalogue
No Source name RA DEC �RA �DEC Speak �Speak Stotal �Stotal ✓ma j ✓min PAh:m:s.s d:m:s.s 00 00 mJy mJy mJy mJy 00 00 �
beam�1 beam�1
(1) (2) (3) (4) (5) (6) (7) (8) (9) (10) (11) (12) (13)
251† ATCA-ADFS J044644-531752 4:46:44.5 -53:17:53.0 0.00 0.01 1.574 0.042 3.007 0.067 8.9 0.9252 ATCA-ADFS J044646-531642 4:46:46.3 -53:16:42.7 0.00 0.00 0.334 0.041 0.350 0.041253† ATCA-ADFS J044649-530014 4:46:49.4 -53:00:14.7 0.00 0.00 7.702 0.064 14.402 0.115 3.7 -1.7254 ATCA-ADFS J044650-540754 4:46:50.6 -54:07:54.5 0.03 0.04 1.724 0.244 2.488 0.273255 ATCA-ADFS J044650-530916 4:46:50.7 -53:09:16.6 0.01 0.01 0.206 0.033 0.295 0.033256 ATCA-ADFS J044652-531923 4:46:52.5 -53:19:23.7 0.00 0.00 0.611 0.042 0.573 0.043257 ATCA-ADFS J044653-534837 4:46:53.2 -53:48:37.5 0.02 0.02 0.562 0.061 0.940 0.063 3.3 -41.7258 ATCA-ADFS J044653-533211 4:46:53.8 -53:32:11.0 0.00 0.00 1.721 0.040 1.897 0.045259 ATCA-ADFS J044654-524023 4:46:54.2 -52:40:23.1 0.00 0.00 4.845 0.324 2.529 0.326260 ATCA-ADFS J044655-535805 4:46:55.0 -53:58:05.4 0.02 0.02 6.558 0.096 46.427 0.438 14.9 12.3 -48.9261 ATCA-ADFS J044657-535740 4:46:57.3 -53:57:40.3 0.00 0.00 20.375 0.096 85.243 0.622 10.5 9.1 -45.5262 ATCA-ADFS J044658-532329 4:46:58.7 -53:23:29.9 0.00 0.00 0.255 0.038 0.304 0.038263 ATCA-ADFS J044701-531113 4:47:01.5 -53:11:14.0 0.00 0.00 0.578 0.033 0.658 0.033264 ATCA-ADFS J044701-534159 4:47:01.6 -53:41:59.2 0.00 0.00 0.463 0.051 0.769 0.051 2.2 -18.5265† ATCA-ADFS J044702-533537 4:47:02.4 -53:35:37.7 0.00 0.00 10.258 0.040 19.883 0.139 5.5 -85.8266 ATCA-ADFS J044703-530411 4:47:03.4 -53:04:11.2 0.00 0.00 0.772 0.037 0.929 0.039267 ATCA-ADFS J044703-531503 4:47:03.7 -53:15:03.3 0.00 0.00 0.759 0.033 0.790 0.035268† ATCA-ADFS J044704-533541 4:47:04.0 -53:35:41.1 0.00 0.01 9.918 0.040 17.532 0.332 6.9 2.5 -3.3269 ATCA-ADFS J044706-535434 4:47:06.2 -53:54:34.4 0.00 0.00 1.758 0.197 4.192 0.199 9.3 3.1 7.5270 ATCA-ADFS J044706-532346 4:47:06.4 -53:23:46.0 0.00 0.01 0.203 0.032 0.275 0.032271 ATCA-ADFS J044706-532621 4:47:06.5 -53:26:21.5 0.00 0.00 0.624 0.034 0.686 0.034272 ATCA-ADFS J044706-534229 4:47:06.6 -53:42:29.4 0.03 0.02 0.378 0.051 0.649 0.056 3.4 51.7273 ATCA-ADFS J044706-525312 4:47:06.8 -52:53:12.7 0.00 0.00 10.851 0.125 17.523 0.202 7.3 -8.8274 ATCA-ADFS J044707-525320 4:47:07.8 -52:53:20.5 0.01 0.01 1.128 0.121 2.849 0.123 9.0 4.4 -37.8275 ATCA-ADFS J044708-530245 4:47:08.4 -53:02:45.2 0.01 0.02 0.161 0.044 0.328 0.045 6.7 4.1 -12.5276 ATCA-ADFS J044710-533410 4:47:10.1 -53:34:10.2 0.06 1.27 0.400 0.039 0.230 0.039277 ATCA-ADFS J044710-534604 4:47:10.5 -53:46:04.8 0.01 0.01 0.685 0.087 0.798 0.090278 ATCA-ADFS J044710-532036 4:47:10.8 -53:20:36.6 0.00 0.00 0.275 0.028 0.294 0.028279 ATCA-ADFS J044711-524023 4:47:12.0 -52:40:23.1 0.03 0.03 1.955 0.314 3.973 0.334 8.9 -38.6280 ATCA-ADFS J044712-530247 4:47:12.0 -53:02:47.7 0.00 0.00 1.288 0.037 1.592 0.038281 ATCA-ADFS J044712-530352 4:47:12.8 -53:03:52.9 0.00 0.00 0.459 0.037 0.648 0.037282 ATCA-ADFS J044715-525406 4:47:15.2 -52:54:06.4 0.32 0.69 0.261 0.059 2.223 0.070 21.2 10.1 -8.2283 ATCA-ADFS J044715-531130 4:47:15.9 -53:11:30.4 0.00 0.00 0.251 0.030 0.300 0.030284† ATCA-ADFS J044716-525919 4:47:16.0 -52:59:19.8 0.01 0.01 0.295 0.049 0.594 0.050 6.5 4.1 16.5285 ATCA-ADFS J044716-532643 4:47:16.1 -53:26:43.9 0.00 0.00 0.779 0.032 0.941 0.034286† ATCA-ADFS J044716-525935 4:47:16.5 -52:59:35.9 0.01 0.01 0.216 0.049 0.341 0.049 3.2 -75.2287 ATCA-ADFS J044716-525730 4:47:16.5 -52:57:30.5 0.00 0.00 0.535 0.059 0.665 0.059288 ATCA-ADFS J044717-525635 4:47:17.1 -52:56:35.7 0.01 0.02 0.461 0.059 0.757 0.063 7.8 -2.0289 ATCA-ADFS J044718-531543 4:47:18.8 -53:15:43.1 0.00 0.01 0.194 0.025 0.242 0.025290 ATCA-ADFS J044719-533423 4:47:20.0 -53:34:23.0 0.00 0.00 1.080 0.039 1.182 0.041291 ATCA-ADFS J044719-525035 4:47:20.0 -52:50:35.8 0.00 0.00 2.818 0.121 4.792 0.135 7.8 -11.2292 ATCA-ADFS J044720-530829 4:47:20.7 -53:08:29.9 0.00 0.00 1.536 0.037 2.246 0.047293 ATCA-ADFS J044723-532141 4:47:23.2 -53:21:41.2 0.00 0.00 0.309 0.028 0.332 0.028294 ATCA-ADFS J044723-534824 4:47:23.3 -53:48:24.6 0.11 0.09 0.496 0.069 0.361 0.069295 ATCA-ADFS J044724-531411 4:47:24.4 -53:14:11.8 0.00 0.00 0.581 0.028 0.627 0.029296 ATCA-ADFS J044725-532855 4:47:25.3 -53:28:55.4 0.01 0.01 0.266 0.032 0.323 0.033297 ATCA-ADFS J044725-533406 4:47:25.3 -53:34:06.2 0.00 0.00 0.466 0.039 0.270 0.039298 ATCA-ADFS J044726-532554 4:47:26.1 -53:25:54.3 0.01 0.01 0.173 0.032 0.205 0.032299 ATCA-ADFS J044726-530030 4:47:26.9 -53:00:30.1 0.04 0.25 0.176 0.040 0.496 0.041 12.7 -13.3300 ATCA-ADFS J044727-523923 4:47:27.0 -52:39:23.7 0.16 0.12 1.822 0.314 8.875 0.364 13.1 8.9 85.3
c� 0000 RAS, MNRAS 000, 000–000

A deep ATCA 20cm radio survey of the AKARI Deep Field South near the South Ecliptic Pole 43
Table 13. Continuation of the source catalogue
No Source name RA DEC �RA �DEC Speak �Speak Stotal �Stotal ✓ma j ✓min PAh:m:s.s d:m:s.s 00 00 mJy mJy mJy mJy 00 00 �
beam�1 beam�1
(1) (2) (3) (4) (5) (6) (7) (8) (9) (10) (11) (12) (13)
301 ATCA-ADFS J044727-532626 4:47:27.3 -53:26:26.6 0.00 0.00 0.304 0.032 0.154 0.032302 ATCA-ADFS J044728-532955 4:47:28.4 -53:29:55.9 0.01 0.01 0.281 0.034 0.273 0.035303 ATCA-ADFS J044730-530654 4:47:30.7 -53:06:54.7 0.10 0.41 0.076 0.025 0.230 0.027 12.6 2.8 4.8304 ATCA-ADFS J044731-531828 4:47:31.8 -53:18:28.3 0.00 0.00 0.208 0.025 0.224 0.025305† ATCA-ADFS J044731-532018 4:47:31.9 -53:20:18.3 0.00 0.00 0.370 0.028 0.452 0.028306† ATCA-ADFS J044732-532027 4:47:32.5 -53:20:27.3 0.00 0.00 0.454 0.028 0.550 0.029307 ATCA-ADFS J044732-530121 4:47:33.0 -53:01:21.9 0.00 0.00 1.015 0.059 1.306 0.060308 ATCA-ADFS J044733-531409 4:47:33.5 -53:14:09.4 0.00 0.00 0.223 0.028 0.327 0.028309 ATCA-ADFS J044734-530621 4:47:34.0 -53:06:21.8 0.01 0.01 0.139 0.025 0.215 0.025 2.2 25.3310 ATCA-ADFS J044734-530543 4:47:34.5 -53:05:43.9 0.03 0.03 0.101 0.025 0.133 0.025311 ATCA-ADFS J044735-530416 4:47:35.5 -53:04:16.2 0.00 0.01 0.274 0.037 0.351 0.038312 ATCA-ADFS J044736-534457 4:47:36.1 -53:44:57.3 0.01 0.01 0.314 0.057 0.457 0.057313 ATCA-ADFS J044736-523953 4:47:36.3 -52:39:53.9 0.06 0.06 2.132 0.314 4.857 0.355 9.5 2.6 -40.5314 ATCA-ADFS J044738-533904 4:47:38.3 -53:39:04.9 0.00 0.02 0.259 0.028 0.259 0.028315 ATCA-ADFS J044741-533316 4:47:41.6 -53:33:16.7 0.00 0.00 0.402 0.039 0.473 0.039316 ATCA-ADFS J044742-531923 4:47:42.2 -53:19:23.7 0.00 0.00 1.308 0.028 1.344 0.033317 ATCA-ADFS J044742-524002 4:47:42.2 -52:40:02.2 0.06 0.12 1.598 0.314 4.906 0.338 11.4 4.5 26.7318† ATCA-ADFS J044743-531028 4:47:43.5 -53:10:28.9 0.01 0.03 1.502 0.028 2.907 0.097 9.0 -10.7319 ATCA-ADFS J044744-530526 4:47:44.1 -53:05:26.5 0.00 0.00 0.268 0.035 0.365 0.035320† ATCA-ADFS J044744-531045 4:47:44.6 -53:10:45.9 0.09 0.06 0.286 0.028 0.864 0.036 10.0 5.8 -51.5321 ATCA-ADFS J044745-533401 4:47:45.1 -53:34:01.5 0.00 0.00 0.285 0.037 0.322 0.037322 ATCA-ADFS J044745-530343 4:47:46.0 -53:03:43.2 0.01 0.02 0.161 0.034 0.286 0.035 6.3 2.6 -12.3323 ATCA-ADFS J044750-532343 4:47:50.7 -53:23:43.7 0.01 0.00 0.171 0.027 0.224 0.027324 ATCA-ADFS J044750-540516 4:47:50.9 -54:05:16.1 0.17 0.09 4.030 0.590 4.886 0.728325 ATCA-ADFS J044751-540037 4:47:51.6 -54:00:37.4 0.10 0.07 1.514 0.197 2.510 0.219 9.6 -52.1326 ATCA-ADFS J044752-530706 4:47:52.1 -53:07:06.3 0.00 0.00 1.970 0.037 2.405 0.038327 ATCA-ADFS J044752-533309 4:47:52.9 -53:33:09.8 0.00 0.00 0.762 0.039 0.967 0.039328 ATCA-ADFS J044753-534808 4:47:53.3 -53:48:08.9 0.00 0.00 1.142 0.087 1.457 0.087329 ATCA-ADFS J044756-532424 4:47:56.5 -53:24:24.4 0.00 0.00 0.279 0.032 0.341 0.032330 ATCA-ADFS J044756-531334 4:47:56.8 -53:13:34.6 0.00 0.00 0.167 0.028 0.263 0.028 2.1 18.1331 ATCA-ADFS J044757-533032 4:47:57.5 -53:30:32.9 0.00 0.00 1.034 0.031 1.243 0.032332 ATCA-ADFS J044758-533605 4:47:58.8 -53:36:05.4 0.00 0.00 0.789 0.039 0.983 0.041333 ATCA-ADFS J044759-533140 4:47:59.4 -53:31:40.2 0.00 0.00 0.175 0.030 0.184 0.030334 ATCA-ADFS J044759-530504 4:47:59.4 -53:05:04.9 0.00 0.00 0.187 0.032 0.217 0.032335 ATCA-ADFS J044759-530003 4:47:59.5 -53:00:03.4 0.00 0.00 0.643 0.055 0.328 0.055336† ATCA-ADFS J044802-532611 4:48:02.4 -53:26:11.7 0.03 0.07 0.143 0.029 0.301 0.030 10.1 -6.4337† ATCA-ADFS J044802-532617 4:48:02.7 -53:26:17.4 0.02 0.04 0.176 0.029 0.334 0.030 10.8 -39.1338 ATCA-ADFS J044804-533855 4:48:04.3 -53:38:55.2 0.12 0.34 0.699 0.061 0.421 0.061339 ATCA-ADFS J044805-532010 4:48:05.2 -53:20:10.8 0.00 0.00 0.949 0.029 1.082 0.030340 ATCA-ADFS J044805-531658 4:48:05.4 -53:16:58.4 0.01 0.03 0.424 0.029 0.856 0.035 10.2 -18.2341 ATCA-ADFS J044808-532540 4:48:08.3 -53:25:40.4 0.35 2.75 0.266 0.028 0.166 0.028342 ATCA-ADFS J044808-531128 4:48:08.4 -53:11:28.9 0.00 0.00 0.820 0.030 0.974 0.032343 ATCA-ADFS J044810-532450 4:48:10.9 -53:24:50.7 0.00 0.00 0.475 0.031 0.530 0.031344 ATCA-ADFS J044812-531629 4:48:12.1 -53:16:29.1 0.00 0.00 0.705 0.029 0.809 0.031345 ATCA-ADFS J044812-531745 4:48:12.2 -53:17:45.2 0.00 0.00 0.471 0.029 0.213 0.029346 ATCA-ADFS J044813-531927 4:48:13.8 -53:19:27.2 0.00 0.00 0.191 0.029 0.269 0.029347 ATCA-ADFS J044813-533804 4:48:13.9 -53:38:04.3 0.00 0.00 0.374 0.039 0.470 0.039348 ATCA-ADFS J044817-530733 4:48:17.5 -53:07:33.1 0.00 0.01 0.316 0.037 0.687 0.037 6.7 5.1 56.0349 ATCA-ADFS J044818-533753 4:48:18.7 -53:37:53.1 0.00 0.00 0.350 0.039 0.283 0.039350 ATCA-ADFS J044820-531012 4:48:20.2 -53:10:12.5 0.00 0.00 0.200 0.028 0.282 0.028
c� 0000 RAS, MNRAS 000, 000–000
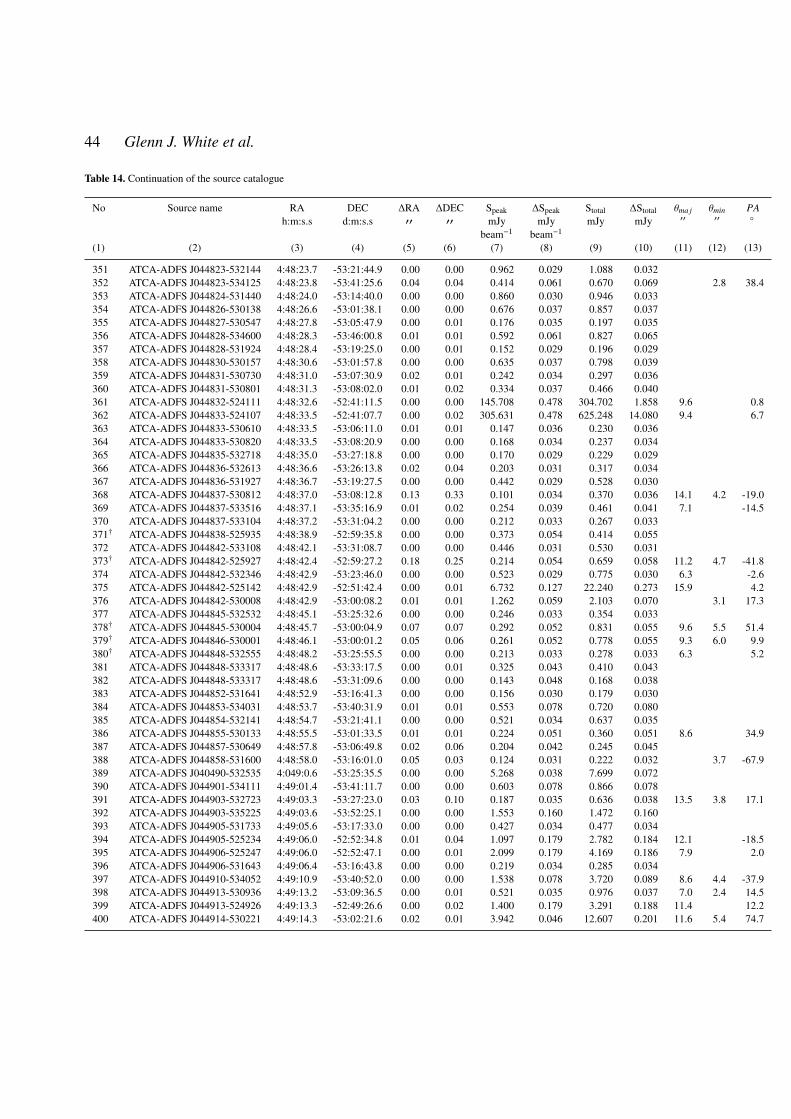
44 Glenn J. White et al.
Table 14. Continuation of the source catalogue
No Source name RA DEC �RA �DEC Speak �Speak Stotal �Stotal ✓ma j ✓min PAh:m:s.s d:m:s.s 00 00 mJy mJy mJy mJy 00 00 �
beam�1 beam�1
(1) (2) (3) (4) (5) (6) (7) (8) (9) (10) (11) (12) (13)
351 ATCA-ADFS J044823-532144 4:48:23.7 -53:21:44.9 0.00 0.00 0.962 0.029 1.088 0.032352 ATCA-ADFS J044823-534125 4:48:23.8 -53:41:25.6 0.04 0.04 0.414 0.061 0.670 0.069 2.8 38.4353 ATCA-ADFS J044824-531440 4:48:24.0 -53:14:40.0 0.00 0.00 0.860 0.030 0.946 0.033354 ATCA-ADFS J044826-530138 4:48:26.6 -53:01:38.1 0.00 0.00 0.676 0.037 0.857 0.037355 ATCA-ADFS J044827-530547 4:48:27.8 -53:05:47.9 0.00 0.01 0.176 0.035 0.197 0.035356 ATCA-ADFS J044828-534600 4:48:28.3 -53:46:00.8 0.01 0.01 0.592 0.061 0.827 0.065357 ATCA-ADFS J044828-531924 4:48:28.4 -53:19:25.0 0.00 0.01 0.152 0.029 0.196 0.029358 ATCA-ADFS J044830-530157 4:48:30.6 -53:01:57.8 0.00 0.00 0.635 0.037 0.798 0.039359 ATCA-ADFS J044831-530730 4:48:31.0 -53:07:30.9 0.02 0.01 0.242 0.034 0.297 0.036360 ATCA-ADFS J044831-530801 4:48:31.3 -53:08:02.0 0.01 0.02 0.334 0.037 0.466 0.040361 ATCA-ADFS J044832-524111 4:48:32.6 -52:41:11.5 0.00 0.00 145.708 0.478 304.702 1.858 9.6 0.8362 ATCA-ADFS J044833-524107 4:48:33.5 -52:41:07.7 0.00 0.02 305.631 0.478 625.248 14.080 9.4 6.7363 ATCA-ADFS J044833-530610 4:48:33.5 -53:06:11.0 0.01 0.01 0.147 0.036 0.230 0.036364 ATCA-ADFS J044833-530820 4:48:33.5 -53:08:20.9 0.00 0.00 0.168 0.034 0.237 0.034365 ATCA-ADFS J044835-532718 4:48:35.0 -53:27:18.8 0.00 0.00 0.170 0.029 0.229 0.029366 ATCA-ADFS J044836-532613 4:48:36.6 -53:26:13.8 0.02 0.04 0.203 0.031 0.317 0.034367 ATCA-ADFS J044836-531927 4:48:36.7 -53:19:27.5 0.00 0.00 0.442 0.029 0.528 0.030368 ATCA-ADFS J044837-530812 4:48:37.0 -53:08:12.8 0.13 0.33 0.101 0.034 0.370 0.036 14.1 4.2 -19.0369 ATCA-ADFS J044837-533516 4:48:37.1 -53:35:16.9 0.01 0.02 0.254 0.039 0.461 0.041 7.1 -14.5370 ATCA-ADFS J044837-533104 4:48:37.2 -53:31:04.2 0.00 0.00 0.212 0.033 0.267 0.033371† ATCA-ADFS J044838-525935 4:48:38.9 -52:59:35.8 0.00 0.00 0.373 0.054 0.414 0.055372 ATCA-ADFS J044842-533108 4:48:42.1 -53:31:08.7 0.00 0.00 0.446 0.031 0.530 0.031373† ATCA-ADFS J044842-525927 4:48:42.4 -52:59:27.2 0.18 0.25 0.214 0.054 0.659 0.058 11.2 4.7 -41.8374 ATCA-ADFS J044842-532346 4:48:42.9 -53:23:46.0 0.00 0.00 0.523 0.029 0.775 0.030 6.3 -2.6375 ATCA-ADFS J044842-525142 4:48:42.9 -52:51:42.4 0.00 0.01 6.732 0.127 22.240 0.273 15.9 4.2376 ATCA-ADFS J044842-530008 4:48:42.9 -53:00:08.2 0.01 0.01 1.262 0.059 2.103 0.070 3.1 17.3377 ATCA-ADFS J044845-532532 4:48:45.1 -53:25:32.6 0.00 0.00 0.246 0.033 0.354 0.033378† ATCA-ADFS J044845-530004 4:48:45.7 -53:00:04.9 0.07 0.07 0.292 0.052 0.831 0.055 9.6 5.5 51.4379† ATCA-ADFS J044846-530001 4:48:46.1 -53:00:01.2 0.05 0.06 0.261 0.052 0.778 0.055 9.3 6.0 9.9380† ATCA-ADFS J044848-532555 4:48:48.2 -53:25:55.5 0.00 0.00 0.213 0.033 0.278 0.033 6.3 5.2381 ATCA-ADFS J044848-533317 4:48:48.6 -53:33:17.5 0.00 0.01 0.325 0.043 0.410 0.043382 ATCA-ADFS J044848-533317 4:48:48.6 -53:31:09.6 0.00 0.00 0.143 0.048 0.168 0.038383 ATCA-ADFS J044852-531641 4:48:52.9 -53:16:41.3 0.00 0.00 0.156 0.030 0.179 0.030384 ATCA-ADFS J044853-534031 4:48:53.7 -53:40:31.9 0.01 0.01 0.553 0.078 0.720 0.080385 ATCA-ADFS J044854-532141 4:48:54.7 -53:21:41.1 0.00 0.00 0.521 0.034 0.637 0.035386 ATCA-ADFS J044855-530133 4:48:55.5 -53:01:33.5 0.01 0.01 0.224 0.051 0.360 0.051 8.6 34.9387 ATCA-ADFS J044857-530649 4:48:57.8 -53:06:49.8 0.02 0.06 0.204 0.042 0.245 0.045388 ATCA-ADFS J044858-531600 4:48:58.0 -53:16:01.0 0.05 0.03 0.124 0.031 0.222 0.032 3.7 -67.9389 ATCA-ADFS J040490-532535 4:049:0.6 -53:25:35.5 0.00 0.00 5.268 0.038 7.699 0.072390 ATCA-ADFS J044901-534111 4:49:01.4 -53:41:11.7 0.00 0.00 0.603 0.078 0.866 0.078391 ATCA-ADFS J044903-532723 4:49:03.3 -53:27:23.0 0.03 0.10 0.187 0.035 0.636 0.038 13.5 3.8 17.1392 ATCA-ADFS J044903-535225 4:49:03.6 -53:52:25.1 0.00 0.00 1.553 0.160 1.472 0.160393 ATCA-ADFS J044905-531733 4:49:05.6 -53:17:33.0 0.00 0.00 0.427 0.034 0.477 0.034394 ATCA-ADFS J044905-525234 4:49:06.0 -52:52:34.8 0.01 0.04 1.097 0.179 2.782 0.184 12.1 -18.5395 ATCA-ADFS J044906-525247 4:49:06.0 -52:52:47.1 0.00 0.01 2.099 0.179 4.169 0.186 7.9 2.0396 ATCA-ADFS J044906-531643 4:49:06.4 -53:16:43.8 0.00 0.00 0.219 0.034 0.285 0.034397 ATCA-ADFS J044910-534052 4:49:10.9 -53:40:52.0 0.00 0.00 1.538 0.078 3.720 0.089 8.6 4.4 -37.9398 ATCA-ADFS J044913-530936 4:49:13.2 -53:09:36.5 0.00 0.01 0.521 0.035 0.976 0.037 7.0 2.4 14.5399 ATCA-ADFS J044913-524926 4:49:13.3 -52:49:26.6 0.00 0.02 1.400 0.179 3.291 0.188 11.4 12.2400 ATCA-ADFS J044914-530221 4:49:14.3 -53:02:21.6 0.02 0.01 3.942 0.046 12.607 0.201 11.6 5.4 74.7
c� 0000 RAS, MNRAS 000, 000–000
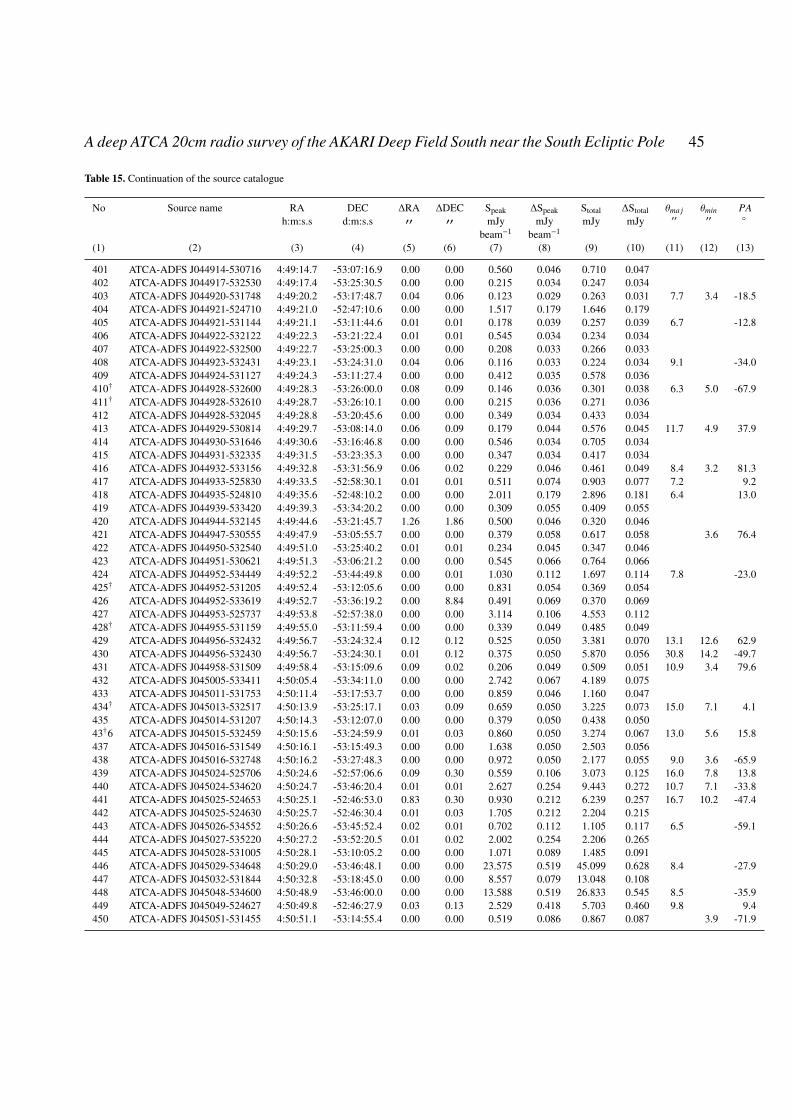
A deep ATCA 20cm radio survey of the AKARI Deep Field South near the South Ecliptic Pole 45
Table 15. Continuation of the source catalogue
No Source name RA DEC �RA �DEC Speak �Speak Stotal �Stotal ✓ma j ✓min PAh:m:s.s d:m:s.s 00 00 mJy mJy mJy mJy 00 00 �
beam�1 beam�1
(1) (2) (3) (4) (5) (6) (7) (8) (9) (10) (11) (12) (13)
401 ATCA-ADFS J044914-530716 4:49:14.7 -53:07:16.9 0.00 0.00 0.560 0.046 0.710 0.047402 ATCA-ADFS J044917-532530 4:49:17.4 -53:25:30.5 0.00 0.00 0.215 0.034 0.247 0.034403 ATCA-ADFS J044920-531748 4:49:20.2 -53:17:48.7 0.04 0.06 0.123 0.029 0.263 0.031 7.7 3.4 -18.5404 ATCA-ADFS J044921-524710 4:49:21.0 -52:47:10.6 0.00 0.00 1.517 0.179 1.646 0.179405 ATCA-ADFS J044921-531144 4:49:21.1 -53:11:44.6 0.01 0.01 0.178 0.039 0.257 0.039 6.7 -12.8406 ATCA-ADFS J044922-532122 4:49:22.3 -53:21:22.4 0.01 0.01 0.545 0.034 0.234 0.034407 ATCA-ADFS J044922-532500 4:49:22.7 -53:25:00.3 0.00 0.00 0.208 0.033 0.266 0.033408 ATCA-ADFS J044923-532431 4:49:23.1 -53:24:31.0 0.04 0.06 0.116 0.033 0.224 0.034 9.1 -34.0409 ATCA-ADFS J044924-531127 4:49:24.3 -53:11:27.4 0.00 0.00 0.412 0.035 0.578 0.036410† ATCA-ADFS J044928-532600 4:49:28.3 -53:26:00.0 0.08 0.09 0.146 0.036 0.301 0.038 6.3 5.0 -67.9411† ATCA-ADFS J044928-532610 4:49:28.7 -53:26:10.1 0.00 0.00 0.215 0.036 0.271 0.036412 ATCA-ADFS J044928-532045 4:49:28.8 -53:20:45.6 0.00 0.00 0.349 0.034 0.433 0.034413 ATCA-ADFS J044929-530814 4:49:29.7 -53:08:14.0 0.06 0.09 0.179 0.044 0.576 0.045 11.7 4.9 37.9414 ATCA-ADFS J044930-531646 4:49:30.6 -53:16:46.8 0.00 0.00 0.546 0.034 0.705 0.034415 ATCA-ADFS J044931-532335 4:49:31.5 -53:23:35.3 0.00 0.00 0.347 0.034 0.417 0.034416 ATCA-ADFS J044932-533156 4:49:32.8 -53:31:56.9 0.06 0.02 0.229 0.046 0.461 0.049 8.4 3.2 81.3417 ATCA-ADFS J044933-525830 4:49:33.5 -52:58:30.1 0.01 0.01 0.511 0.074 0.903 0.077 7.2 9.2418 ATCA-ADFS J044935-524810 4:49:35.6 -52:48:10.2 0.00 0.00 2.011 0.179 2.896 0.181 6.4 13.0419 ATCA-ADFS J044939-533420 4:49:39.3 -53:34:20.2 0.00 0.00 0.309 0.055 0.409 0.055420 ATCA-ADFS J044944-532145 4:49:44.6 -53:21:45.7 1.26 1.86 0.500 0.046 0.320 0.046421 ATCA-ADFS J044947-530555 4:49:47.9 -53:05:55.7 0.00 0.00 0.379 0.058 0.617 0.058 3.6 76.4422 ATCA-ADFS J044950-532540 4:49:51.0 -53:25:40.2 0.01 0.01 0.234 0.045 0.347 0.046423 ATCA-ADFS J044951-530621 4:49:51.3 -53:06:21.2 0.00 0.00 0.545 0.066 0.764 0.066424 ATCA-ADFS J044952-534449 4:49:52.2 -53:44:49.8 0.00 0.01 1.030 0.112 1.697 0.114 7.8 -23.0425† ATCA-ADFS J044952-531205 4:49:52.4 -53:12:05.6 0.00 0.00 0.831 0.054 0.369 0.054426 ATCA-ADFS J044952-533619 4:49:52.7 -53:36:19.2 0.00 8.84 0.491 0.069 0.370 0.069427 ATCA-ADFS J044953-525737 4:49:53.8 -52:57:38.0 0.00 0.00 3.114 0.106 4.553 0.112428† ATCA-ADFS J044955-531159 4:49:55.0 -53:11:59.4 0.00 0.00 0.339 0.049 0.485 0.049429 ATCA-ADFS J044956-532432 4:49:56.7 -53:24:32.4 0.12 0.12 0.525 0.050 3.381 0.070 13.1 12.6 62.9430 ATCA-ADFS J044956-532430 4:49:56.7 -53:24:30.1 0.01 0.12 0.375 0.050 5.870 0.056 30.8 14.2 -49.7431 ATCA-ADFS J044958-531509 4:49:58.4 -53:15:09.6 0.09 0.02 0.206 0.049 0.509 0.051 10.9 3.4 79.6432 ATCA-ADFS J045005-533411 4:50:05.4 -53:34:11.0 0.00 0.00 2.742 0.067 4.189 0.075433 ATCA-ADFS J045011-531753 4:50:11.4 -53:17:53.7 0.00 0.00 0.859 0.046 1.160 0.047434† ATCA-ADFS J045013-532517 4:50:13.9 -53:25:17.1 0.03 0.09 0.659 0.050 3.225 0.073 15.0 7.1 4.1435 ATCA-ADFS J045014-531207 4:50:14.3 -53:12:07.0 0.00 0.00 0.379 0.050 0.438 0.05043†6 ATCA-ADFS J045015-532459 4:50:15.6 -53:24:59.9 0.01 0.03 0.860 0.050 3.274 0.067 13.0 5.6 15.8437 ATCA-ADFS J045016-531549 4:50:16.1 -53:15:49.3 0.00 0.00 1.638 0.050 2.503 0.056438 ATCA-ADFS J045016-532748 4:50:16.2 -53:27:48.3 0.00 0.00 0.972 0.050 2.177 0.055 9.0 3.6 -65.9439 ATCA-ADFS J045024-525706 4:50:24.6 -52:57:06.6 0.09 0.30 0.559 0.106 3.073 0.125 16.0 7.8 13.8440 ATCA-ADFS J045024-534620 4:50:24.7 -53:46:20.4 0.01 0.01 2.627 0.254 9.443 0.272 10.7 7.1 -33.8441 ATCA-ADFS J045025-524653 4:50:25.1 -52:46:53.0 0.83 0.30 0.930 0.212 6.239 0.257 16.7 10.2 -47.4442 ATCA-ADFS J045025-524630 4:50:25.7 -52:46:30.4 0.01 0.03 1.705 0.212 2.204 0.215443 ATCA-ADFS J045026-534552 4:50:26.6 -53:45:52.4 0.02 0.01 0.702 0.112 1.105 0.117 6.5 -59.1444 ATCA-ADFS J045027-535220 4:50:27.2 -53:52:20.5 0.01 0.02 2.002 0.254 2.206 0.265445 ATCA-ADFS J045028-531005 4:50:28.1 -53:10:05.2 0.00 0.00 1.071 0.089 1.485 0.091446 ATCA-ADFS J045029-534648 4:50:29.0 -53:46:48.1 0.00 0.00 23.575 0.519 45.099 0.628 8.4 -27.9447 ATCA-ADFS J045032-531844 4:50:32.8 -53:18:45.0 0.00 0.00 8.557 0.079 13.048 0.108448 ATCA-ADFS J045048-534600 4:50:48.9 -53:46:00.0 0.00 0.00 13.588 0.519 26.833 0.545 8.5 -35.9449 ATCA-ADFS J045049-524627 4:50:49.8 -52:46:27.9 0.03 0.13 2.529 0.418 5.703 0.460 9.8 9.4450 ATCA-ADFS J045051-531455 4:50:51.1 -53:14:55.4 0.00 0.00 0.519 0.086 0.867 0.087 3.9 -71.9
c� 0000 RAS, MNRAS 000, 000–000
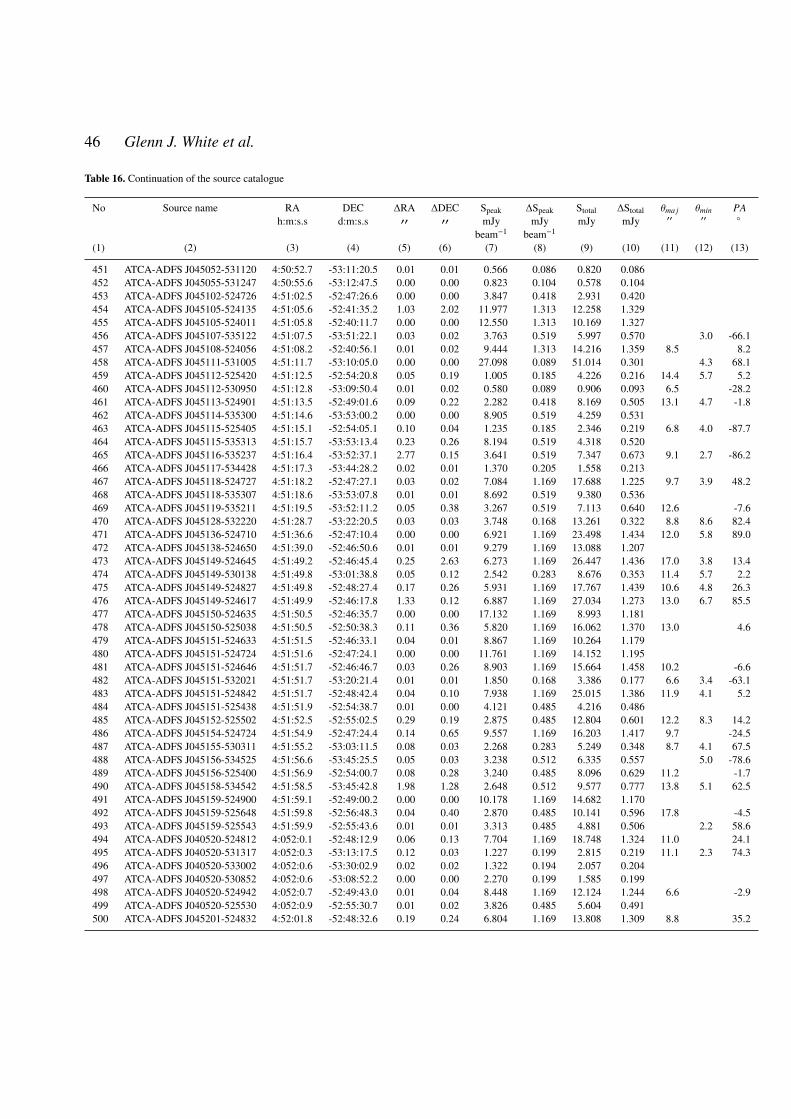
46 Glenn J. White et al.
Table 16. Continuation of the source catalogue
No Source name RA DEC �RA �DEC Speak �Speak Stotal �Stotal ✓ma j ✓min PAh:m:s.s d:m:s.s 00 00 mJy mJy mJy mJy 00 00 �
beam�1 beam�1
(1) (2) (3) (4) (5) (6) (7) (8) (9) (10) (11) (12) (13)
451 ATCA-ADFS J045052-531120 4:50:52.7 -53:11:20.5 0.01 0.01 0.566 0.086 0.820 0.086452 ATCA-ADFS J045055-531247 4:50:55.6 -53:12:47.5 0.00 0.00 0.823 0.104 0.578 0.104453 ATCA-ADFS J045102-524726 4:51:02.5 -52:47:26.6 0.00 0.00 3.847 0.418 2.931 0.420454 ATCA-ADFS J045105-524135 4:51:05.6 -52:41:35.2 1.03 2.02 11.977 1.313 12.258 1.329455 ATCA-ADFS J045105-524011 4:51:05.8 -52:40:11.7 0.00 0.00 12.550 1.313 10.169 1.327456 ATCA-ADFS J045107-535122 4:51:07.5 -53:51:22.1 0.03 0.02 3.763 0.519 5.997 0.570 3.0 -66.1457 ATCA-ADFS J045108-524056 4:51:08.2 -52:40:56.1 0.01 0.02 9.444 1.313 14.216 1.359 8.5 8.2458 ATCA-ADFS J045111-531005 4:51:11.7 -53:10:05.0 0.00 0.00 27.098 0.089 51.014 0.301 4.3 68.1459 ATCA-ADFS J045112-525420 4:51:12.5 -52:54:20.8 0.05 0.19 1.005 0.185 4.226 0.216 14.4 5.7 5.2460 ATCA-ADFS J045112-530950 4:51:12.8 -53:09:50.4 0.01 0.02 0.580 0.089 0.906 0.093 6.5 -28.2461 ATCA-ADFS J045113-524901 4:51:13.5 -52:49:01.6 0.09 0.22 2.282 0.418 8.169 0.505 13.1 4.7 -1.8462 ATCA-ADFS J045114-535300 4:51:14.6 -53:53:00.2 0.00 0.00 8.905 0.519 4.259 0.531463 ATCA-ADFS J045115-525405 4:51:15.1 -52:54:05.1 0.10 0.04 1.235 0.185 2.346 0.219 6.8 4.0 -87.7464 ATCA-ADFS J045115-535313 4:51:15.7 -53:53:13.4 0.23 0.26 8.194 0.519 4.318 0.520465 ATCA-ADFS J045116-535237 4:51:16.4 -53:52:37.1 2.77 0.15 3.641 0.519 7.347 0.673 9.1 2.7 -86.2466 ATCA-ADFS J045117-534428 4:51:17.3 -53:44:28.2 0.02 0.01 1.370 0.205 1.558 0.213467 ATCA-ADFS J045118-524727 4:51:18.2 -52:47:27.1 0.03 0.02 7.084 1.169 17.688 1.225 9.7 3.9 48.2468 ATCA-ADFS J045118-535307 4:51:18.6 -53:53:07.8 0.01 0.01 8.692 0.519 9.380 0.536469 ATCA-ADFS J045119-535211 4:51:19.5 -53:52:11.2 0.05 0.38 3.267 0.519 7.113 0.640 12.6 -7.6470 ATCA-ADFS J045128-532220 4:51:28.7 -53:22:20.5 0.03 0.03 3.748 0.168 13.261 0.322 8.8 8.6 82.4471 ATCA-ADFS J045136-524710 4:51:36.6 -52:47:10.4 0.00 0.00 6.921 1.169 23.498 1.434 12.0 5.8 89.0472 ATCA-ADFS J045138-524650 4:51:39.0 -52:46:50.6 0.01 0.01 9.279 1.169 13.088 1.207473 ATCA-ADFS J045149-524645 4:51:49.2 -52:46:45.4 0.25 2.63 6.273 1.169 26.447 1.436 17.0 3.8 13.4474 ATCA-ADFS J045149-530138 4:51:49.8 -53:01:38.8 0.05 0.12 2.542 0.283 8.676 0.353 11.4 5.7 2.2475 ATCA-ADFS J045149-524827 4:51:49.8 -52:48:27.4 0.17 0.26 5.931 1.169 17.767 1.439 10.6 4.8 26.3476 ATCA-ADFS J045149-524617 4:51:49.9 -52:46:17.8 1.33 0.12 6.887 1.169 27.034 1.273 13.0 6.7 85.5477 ATCA-ADFS J045150-524635 4:51:50.5 -52:46:35.7 0.00 0.00 17.132 1.169 8.993 1.181478 ATCA-ADFS J045150-525038 4:51:50.5 -52:50:38.3 0.11 0.36 5.820 1.169 16.062 1.370 13.0 4.6479 ATCA-ADFS J045151-524633 4:51:51.5 -52:46:33.1 0.04 0.01 8.867 1.169 10.264 1.179480 ATCA-ADFS J045151-524724 4:51:51.6 -52:47:24.1 0.00 0.00 11.761 1.169 14.152 1.195481 ATCA-ADFS J045151-524646 4:51:51.7 -52:46:46.7 0.03 0.26 8.903 1.169 15.664 1.458 10.2 -6.6482 ATCA-ADFS J045151-532021 4:51:51.7 -53:20:21.4 0.01 0.01 1.850 0.168 3.386 0.177 6.6 3.4 -63.1483 ATCA-ADFS J045151-524842 4:51:51.7 -52:48:42.4 0.04 0.10 7.938 1.169 25.015 1.386 11.9 4.1 5.2484 ATCA-ADFS J045151-525438 4:51:51.9 -52:54:38.7 0.01 0.00 4.121 0.485 4.216 0.486485 ATCA-ADFS J045152-525502 4:51:52.5 -52:55:02.5 0.29 0.19 2.875 0.485 12.804 0.601 12.2 8.3 14.2486 ATCA-ADFS J045154-524724 4:51:54.9 -52:47:24.4 0.14 0.65 9.557 1.169 16.203 1.417 9.7 -24.5487 ATCA-ADFS J045155-530311 4:51:55.2 -53:03:11.5 0.08 0.03 2.268 0.283 5.249 0.348 8.7 4.1 67.5488 ATCA-ADFS J045156-534525 4:51:56.6 -53:45:25.5 0.05 0.03 3.238 0.512 6.335 0.557 5.0 -78.6489 ATCA-ADFS J045156-525400 4:51:56.9 -52:54:00.7 0.08 0.28 3.240 0.485 8.096 0.629 11.2 -1.7490 ATCA-ADFS J045158-534542 4:51:58.5 -53:45:42.8 1.98 1.28 2.648 0.512 9.577 0.777 13.8 5.1 62.5491 ATCA-ADFS J045159-524900 4:51:59.1 -52:49:00.2 0.00 0.00 10.178 1.169 14.682 1.170492 ATCA-ADFS J045159-525648 4:51:59.8 -52:56:48.3 0.04 0.40 2.870 0.485 10.141 0.596 17.8 -4.5493 ATCA-ADFS J045159-525543 4:51:59.9 -52:55:43.6 0.01 0.01 3.313 0.485 4.881 0.506 2.2 58.6494 ATCA-ADFS J040520-524812 4:052:0.1 -52:48:12.9 0.06 0.13 7.704 1.169 18.748 1.324 11.0 24.1495 ATCA-ADFS J040520-531317 4:052:0.3 -53:13:17.5 0.12 0.03 1.227 0.199 2.815 0.219 11.1 2.3 74.3496 ATCA-ADFS J040520-533002 4:052:0.6 -53:30:02.9 0.02 0.02 1.322 0.194 2.057 0.204497 ATCA-ADFS J040520-530852 4:052:0.6 -53:08:52.2 0.00 0.00 2.270 0.199 1.585 0.199498 ATCA-ADFS J040520-524942 4:052:0.7 -52:49:43.0 0.01 0.04 8.448 1.169 12.124 1.244 6.6 -2.9499 ATCA-ADFS J040520-525530 4:052:0.9 -52:55:30.7 0.01 0.02 3.826 0.485 5.604 0.491500 ATCA-ADFS J045201-524832 4:52:01.8 -52:48:32.6 0.19 0.24 6.804 1.169 13.808 1.309 8.8 35.2
c� 0000 RAS, MNRAS 000, 000–000

A deep ATCA 20cm radio survey of the AKARI Deep Field South near the South Ecliptic Pole 47
Table 17. Continuation of the source catalogue
No Source name RA DEC �RA �DEC Speak �Speak Stotal �Stotal ✓ma j ✓min PAh:m:s.s d:m:s.s 00 00 mJy mJy mJy mJy 00 00 �
beam�1 beam�1
(1) (2) (3) (4) (5) (6) (7) (8) (9) (10) (11) (12) (13)
501 ATCA-ADFS J045202-524914 4:52:02.2 -52:49:14.8 0.02 0.03 7.654 1.169 18.004 1.257 7.2 5.4 3.1502 ATCA-ADFS J045203-525035 4:52:03.1 -52:50:35.2 0.00 0.00 15.911 1.169 9.492 1.184503 ATCA-ADFS J045203-525347 4:52:03.2 -52:53:47.6 0.04 0.10 3.673 0.485 5.336 0.556 7.8 22.8504 ATCA-ADFS J045203-525647 4:52:03.7 -52:56:47.0 0.01 0.02 3.972 0.485 4.655 0.504505 ATCA-ADFS J045203-525429 4:52:03.9 -52:54:29.1 0.32 0.46 14.003 0.485 6.400 0.525506 ATCA-ADFS J045203-524959 4:52:04.0 -52:49:59.9 0.00 0.00 14.626 1.169 19.753 1.254 18.4 -0.1507 ATCA-ADFS J045204-534456 4:52:04.4 -53:44:56.3 0.00 0.00 6.034 0.512 4.865 0.523508 ATCA-ADFS J045204-533750 4:52:04.7 -53:37:50.4 0.00 0.00 2.550 0.264 2.467 0.264509 ATCA-ADFS J045205-525442 4:52:05.3 -52:54:42.0 0.05 0.04 3.959 0.485 5.402 0.572 6.8 48.9510 ATCA-ADFS J045205-525422 4:52:05.4 -52:54:22.2 0.41 0.03 2.996 0.485 9.247 0.515 11.0 5.5 -77.8511 ATCA-ADFS J045205-530208 4:52:05.8 -53:02:09.0 0.00 0.00 2.563 0.283 1.913 0.289512 ATCA-ADFS J045205-534448 4:52:05.9 -53:44:48.4 0.01 0.04 3.722 0.512 6.822 0.535 11.3 9.2513 ATCA-ADFS J045205-533724 4:52:05.9 -53:37:24.5 0.12 0.41 1.728 0.264 3.676 0.308 13.6 -21.9514 ATCA-ADFS J045206-534418 4:52:06.7 -53:44:18.2 0.04 0.03 4.627 0.512 8.802 0.539 8.2 37.8515 ATCA-ADFS J045206-534449 4:52:06.8 -53:44:49.5 0.01 0.16 3.419 0.512 5.640 0.549 11.6 3.9516 ATCA-ADFS J045206-533804 4:52:07.0 -53:38:04.0 0.00 0.00 3.112 0.264 1.544 0.267517 ATCA-ADFS J045207-532938 4:52:07.3 -53:29:38.5 0.39 0.03 1.101 0.194 2.354 0.223 12.0 -88.5518 ATCA-ADFS J045207-531730 4:52:07.5 -53:17:30.1 0.00 0.00 5.073 0.168 18.320 0.209 10.7 7.2 -57.9519 ATCA-ADFS J045208-534433 4:52:08.3 -53:44:33.3 0.09 0.51 3.130 0.512 9.209 0.654 13.8 -19.0520 ATCA-ADFS J045208-531740 4:52:08.5 -53:17:41.0 0.02 0.01 3.071 0.579 10.839 0.593 10.4 7.3 -87.1521 ATCA-ADFS J045208-533736 4:52:08.6 -53:37:36.8 0.03 0.02 1.982 0.264 3.515 0.274 7.8 38.9522 ATCA-ADFS J045209-534512 4:52:09.4 -53:45:12.3 2.19 4.54 7.233 0.512 4.924 0.540523 ATCA-ADFS J045209-534441 4:52:09.5 -53:44:41.9 0.66 1.02 3.376 0.512 9.260 0.705 15.2 35.0524 ATCA-ADFS J045227-530208 4:52:27.4 -53:02:08.5 0.03 0.06 5.782 0.916 10.416 0.996 7.2 -17.6525 ATCA-ADFS J045227-534005 4:52:27.8 -53:40:05.5 0.05 0.06 11.733 1.362 37.255 1.712 10.5 5.8 -38.8526 ATCA-ADFS J045229-525651 4:52:29.8 -52:56:51.2 0.10 0.07 8.503 1.502 18.082 1.666 7.7 4.0 57.5527 ATCA-ADFS J045232-530216 4:52:32.4 -53:02:16.4 0.02 0.01 7.840 0.916 9.879 0.941528 ATCA-ADFS J045236-530120 4:52:36.7 -53:01:20.2 0.00 0.00 9.904 0.916 11.882 0.920529 ATCA-ADFS J045239-530219 4:52:39.0 -53:02:19.5 0.20 0.07 6.015 0.916 8.138 1.123 6.3 75.7530 ATCA-ADFS J045240-531548 4:52:40.6 -53:15:48.7 0.02 0.02 5.478 0.672 18.272 0.761 9.7 7.0 39.5
c� 0000 RAS, MNRAS 000, 000–000