A bioregional analysis of the distribution of rainforest … bioregional analysis of the...
22
A bioregional analysis of the distribution of rainforest cover, deforestation and degradation in Papua New GuineaPHIL SHEARMAN 1,2 * AND JANE BRYAN 1,3 1 UPNG Remote Sensing Centre. P.O. Box 320, Biology Department, University of Papua New Guinea, Waigani, Port Moresby, Papua New Guinea (Email: [email protected]); and 2 School of Biology,The Australian National University, Canberra, Australian Capital Territory, and 3 School of Geography and Environmental Studies, University of Tasmania, Hobart,Tasmania,Australia Abstract Papua New Guinea (PNG) is an extensively forested country. Recent research suggests that despite commencing a trajectory of deforestation and degradation later than many counties in the Asia–Pacific region, PNG is now undergoing comparable rates of forest change. Here we explore the bioregional distribution of changes in the forest estate over the period 1972–2002 and examine their implications for forest protection. This is undertaken through the development of a novel bioregional classification of the country based on biogeographic regions and climatic zones, and its application to existing forest cover and forest-cover change data.We found that degradation and deforestation varied considerably across the 11 defined biogeographic regions. We report that the majority of deforestation and degradation has occurred within all the lowland forests, and that it is these forests that have the greatest potential for further losses in the near term. The largest percentage of total change occurred in the east of PNG, in the islands and lowlands of the Bismarck, D’Entrecasteaux, East Papuan Islands and in the South-East Papua–Oro region. The only region with a significant highlands component to undergo deforestation at a compa- rable magnitude to the islands and lowland regions was the Huon Peninsula and Adelbert region. Significant changes have also occurred at higher elevations, especially at the interface of subalpine grasslands and upper montane forests. Lower montane forests have experienced proportionally less change, yet it is these forests that constitute the majority of forests enclosed within the protected area system. We find that protected areas are not convincingly protecting either representative areas of PNG’s ecosystems, nor the forests within their borders.We conclude by suggesting a more expansive and integrated approach to managing the national forest estate. Key words: bioregional classification, conservation, deforestation, degradation, forest-cover change, Papua New Guinea, protected area. INTRODUCTION The forests of the island of New Guinea (Papua New Guinea (PNG) and West Papua together) constitute the third largest expanse of tropical rainforest on the planet after the Amazon and Congo forests (Brooks et al. 2006). Papua New Guinea comprises the eastern half of the island of New Guinea. Papua New Guinea’s forests are a vital natural resource for the human popu- lation that they sustain, the wide biological diversity they contain, the ecological services they provide and their global role in maintaining climatic stability (Hunt 2006). These forests provide food and building mate- rials for a large proportion of PNG’s six million people. They also provide an important safety net when crops fail, in times of economic crisis or conflict, and when natural disasters strike.They provide a range of both local and global environmental benefits that are often overlooked and remain economically undervalued. These services include carbon sequestra- tion, watershed protection, water filtration, coastal and reef protection, preservation of fish stocks, and soil stability and fertility. They also provide commercial timber – approximately 2.5 million cubic metres of raw logs were exported in 2008, with a FOB value of US$184 million (SGS 2008). Rapid and substantial deforestation and logging- related degradation has occurred in PNG’s forests over the past 30 years (Shearman et al. 2009). Between 1972 and 2002, a net 15% of PNG’s tropical forests were cleared and 8.8% were degraded through logging. While Shearman et al. (2009) focused on the distribution of this change according to measures of accessibility and within three altitudinal classes (lowland, lower montane and upper montane), the *Corresponding author. Accepted for publication November 2009. Austral Ecology (2010) ••, ••–•• © 2010 The Authors doi:10.1111/j.1442-9993.2010.02111.x Journal compilation © 2010 Ecological Society of Australia
Transcript of A bioregional analysis of the distribution of rainforest … bioregional analysis of the...

A bioregional analysis of the distribution of rainforestcover, deforestation and degradation in PapuaNew Guineaaec_2111 1..17
PHIL SHEARMAN1,2* AND JANE BRYAN1,3
1UPNG Remote Sensing Centre. P.O. Box 320, Biology Department, University of Papua New Guinea,Waigani, Port Moresby, Papua New Guinea (Email: [email protected]); and 2School ofBiology,The Australian National University, Canberra, Australian Capital Territory, and 3School ofGeography and Environmental Studies, University of Tasmania, Hobart,Tasmania, Australia
Abstract Papua New Guinea (PNG) is an extensively forested country. Recent research suggests that despitecommencing a trajectory of deforestation and degradation later than many counties in the Asia–Pacific region, PNGis now undergoing comparable rates of forest change. Here we explore the bioregional distribution of changes in theforest estate over the period 1972–2002 and examine their implications for forest protection. This is undertakenthrough the development of a novel bioregional classification of the country based on biogeographic regions andclimatic zones, and its application to existing forest cover and forest-cover change data.We found that degradationand deforestation varied considerably across the 11 defined biogeographic regions. We report that the majority ofdeforestation and degradation has occurred within all the lowland forests, and that it is these forests that have thegreatest potential for further losses in the near term.The largest percentage of total change occurred in the east ofPNG, in the islands and lowlands of the Bismarck, D’Entrecasteaux, East Papuan Islands and in the South-EastPapua–Oro region. The only region with a significant highlands component to undergo deforestation at a compa-rable magnitude to the islands and lowland regions was the Huon Peninsula and Adelbert region. Significantchanges have also occurred at higher elevations, especially at the interface of subalpine grasslands and uppermontane forests. Lower montane forests have experienced proportionally less change, yet it is these forests thatconstitute the majority of forests enclosed within the protected area system. We find that protected areas are notconvincingly protecting either representative areas of PNG’s ecosystems, nor the forests within their borders. Weconclude by suggesting a more expansive and integrated approach to managing the national forest estate.
Key words: bioregional classification, conservation, deforestation, degradation, forest-cover change, Papua NewGuinea, protected area.
INTRODUCTION
The forests of the island of New Guinea (Papua NewGuinea (PNG) and West Papua together) constitutethe third largest expanse of tropical rainforest on theplanet after the Amazon and Congo forests (Brookset al. 2006). Papua New Guinea comprises the easternhalf of the island of New Guinea. Papua New Guinea’sforests are a vital natural resource for the human popu-lation that they sustain, the wide biological diversitythey contain, the ecological services they provide andtheir global role in maintaining climatic stability (Hunt2006). These forests provide food and building mate-rials for a large proportion of PNG’s six millionpeople. They also provide an important safety netwhen crops fail, in times of economic crisis or conflict,
and when natural disasters strike.They provide a rangeof both local and global environmental benefits thatare often overlooked and remain economicallyundervalued.These services include carbon sequestra-tion, watershed protection, water filtration, coastal andreef protection, preservation of fish stocks, and soilstability and fertility. They also provide commercialtimber – approximately 2.5 million cubic metres of rawlogs were exported in 2008, with a FOB value ofUS$184 million (SGS 2008).
Rapid and substantial deforestation and logging-related degradation has occurred in PNG’s forestsover the past 30 years (Shearman et al. 2009).Between 1972 and 2002, a net 15% of PNG’s tropicalforests were cleared and 8.8% were degraded throughlogging. While Shearman et al. (2009) focused on thedistribution of this change according to measures ofaccessibility and within three altitudinal classes(lowland, lower montane and upper montane), the
*Corresponding author.Accepted for publication November 2009.
Austral Ecology (2010) ••, ••–••
© 2010 The Authors doi:10.1111/j.1442-9993.2010.02111.xJournal compilation © 2010 Ecological Society of Australia

manner in which it has impacted on the different flo-ristically, climatically and geologically distinct land-scapes of PNG is yet to be examined and is the focusof this study.
Bioregional classification of PNG’sforest ecosystems
The forests of PNG are some of the most biologicallydiverse ecosystems in the world (Davis et al. 1995;Myers et al. 2000).The country has over 2000 speciesof orchids, the second highest of any country behindEcuador and a comparable number of fern species(Papua New Guinea National Assessment Report2006).These forests provide the habitat for the major-ity of PNG’s birds (733 species), mammals (304species) and herpetofauna (612 species) (Sekhran &Miller 1994; Allison 2007; Bishop Museum 2009).The forests, and more broadly the flora of NewGuinea, is more closely allied to the flora of East Asiathan to that of the Australian continent. For thisreason it has been termed ‘Malesian’, part Asian andpart Melanesian. The predominantly Gondwanicmontane flora of New Guinea is the most significantexception to this derivation (Linder & Crisp 1995).
Papua New Guinea possesses a range of forest com-munities that vary both structurally and floristically aswell as in the fauna they support. These geographicaland floristic differences allow the landscape to beviewed as a series of ‘bioregions’. Bioregionalizationaims to reduce the Earth’s ecosystems into a numberof smaller subsystems that are internally relativelymore homogeneous with respect to characteristics ofinterest (Mackey et al. 2008). Division into suchsubsystems allows the provision of national levelinformation relevant to systematic planning for theconservation of biodiversity (Olson & Dinerstein1998; Margules & Pressey 2000; Olson et al. 2001;Whittaker et al. 2005) and related natural ecologicalprocesses (Mackey et al. 2001; Land and Water Aus-tralia 2002). Biogeographical regions are also consid-ered useful for identifying areas that can be subject tosimilar natural resource management prescriptionsand for extrapolating the results of site-scale experi-ments (Hobbs & McIntyre 2005).
Various approaches have been developed formapping the distribution of biological and ecologicalphenomena. According to Mackey et al. (2008), a landsurface can be geographically delineated biotopicallyon the basis of discontinuities in abiotic environmentalfactors, such as climate or geology, bioconoticallyusing discontinuities in the distribution of biota (Clif-ford & Stephenson 1975), or some combination orintegration of the two. At larger cartographic scales,mapped units are referred to as regional ecosystems,land systems or landscape ecosystems. At smaller geo-
graphical scales, the stated aim of such exercises isusually to map geographic entities referred to as biore-gions, biomes, or, more recently, ecoregions.
In PNG, the principle biotopic factors influencingthe distribution of biota are climate and geologicalhistory. It has long been observed that vegetation, interms of its structure and floristics, changes continu-ously across the landscape in response to climatic gra-dients (Gleason 1939). Two of the most significantenvironmental gradients that drive these vegetationchanges are temperature and rainfall and the interac-tion between them (Gleason 1939; Specht 1970, 1981;Woodward 1987; Box et al. 1993; Hoffman & Parsons1997; Walther et al. 2002; Rehfeldt et al. 2006). Theflora of PNG varies considerably with temperature,which is itself strongly correlated with elevation(McAlpine et al. 1983). Consequently, the broadestand most commonly used vegetation classification hasbeen its division into lowland, lower montane, uppermontane and alpine elevational zones (Paijmans1976). Rainfall, particularly rainfall seasonality, alsohas a strong influence of the geographic distribution ofplant and animal communities in PNG (Paijmans1976; Johns 1982). For these reasons, both tempera-ture and rainfall were incorporated into our division offorest cover into climatic domains.
The considerable complexity of PNG’s geologicalhistory is of paramount importance in the distributionof plant and animal communities. By the early 1970sthe principle geological structures of PNG had beenrecognized (Ollier & Bain 1972). These boundarieswere later used both as the basis for the assessment ofsoil types (Bleeker 1983) and regional geomorphology(Loffler 1977). These basic regions are presented inFigure S1.While the existence of these general regionsis still accepted and forms the basis of the bioregionalclassification used in this study, the understanding oftheir tectonic history was revised by Pigram andDavies (1987), with major ecological implications.Prior to this work, the mountainous belt forming thespine of the island of New Guinea was regarded as theresult of a simple continent–island arc collision.Pigram and Davies (1987) described the orogeny asconsisting of a southern part (the Australian craton)and a northern part made up of at least 32 tectonos-tratigraphic terranes – fault-bounded geologicalprovinces with histories independent from theirsurrounding geologic features. The New Guinea ter-ranes, including intrusive and metamorphic rocks,formed and sometimes amalgamated with others somedistance from their present position and subsequentlyaccreted to the craton margin during different periodsover the last 40 million years. Figure S2 presents astylized map of the location of the different terranesacross the island of New Guinea derived from Heads(2001a). Each terrane presumably possessed a differ-ent biota from the ‘mainland’ to which it docked,
2 P. SHEARMAN AND J. BRYAN
© 2010 The Authorsdoi:10.1111/j.1442-9993.2010.02111.xJournal compilation © 2010 Ecological Society of Australia

resulting in the introduction and inclusion of new floraand fauna to the mainland, and providing new isolatedhabitats and opportunities for speciation. In addition,the uplifting and downwarping activity associated ofdocking would have had indirect impacts on climatethat would have in turn, had impacts on speciation andbiota distribution (Van Welzen 1997).
Over recent decades there has been a growing rec-ognition that the current distribution of PNG’s biotaoften correlate with tectonic patterns associated withgroups of terranes, with breaks in ranges often coin-ciding with the craton margins (Van Welzen 1997;Heads 2001a,b), although recent analyses of biogeo-graphic distributions in other regions of the SouthWest Pacific suggest that some species associationsare far more complex than simple correlations withtectonic patterns (Murienne et al. 2005; Ladiges &Cantrill 2007). Nevertheless, in the absence of a moresystematic biogeographic regionalization of the flora ofPNG (Heads 2001a), tectonic and geological historyof the island of New Guinea has been used to explainthe observed patterns of biodiversity of birds (Heads2001b), reptiles (Allison 1993; Heads 2001b),mammals (Flannery 1990; Heads 2002), freshwaterfauna (Polhemus 1996; Polhemus & Allen 2004) and avariety of plants (Van Welzen 1997) including orchidsand rhododendrons (Heads 2001b). The approachused in this study is a synthesis of these works, result-ing in a geologically based regionalization that is usedto distinguish between assemblages of various plantand animal groups.
The only previous assessment of forest types inPNG that possessed some biogeographical distinctionswas the Forest Inventory Mapping System (FIMS)analysis (Hammermaster & Saunders 1995) thatdivided the country into 42 zones. These zones, dis-played in Figure S3, are essentially subdivisions ofcadastral provincial boundaries and were based ondominant species type. Hammermaster and Saunders(1995) recognized that these divisions were quitesubjective. Given that FIMS was aimed at the com-mercial assessment of the forest estate, the zones wereheavily influenced by the location of timber inventorydata. The FIMS mapping of forest boundaries wascoarse, often consisting of ‘forest complexes’ contain-ing a mixture of forest and other land types. For thisand a variety of related reasons, FIMS cannot be usedfor accurate change detection. A more recent spatiallyexplicit forest-cover map of PNG created using wall-to-wall high-resolution imagery has since beencreated, in part, to overcome the limitations of theFIMS forest mapping (Shearman et al. 2009).
A more recent compilation of biogeographical infor-mation for PNG was synthesized by Olson et al.(2001) in the designation of the World Wildlife Fund‘ecoregions’. Olson et al. (2001) defined an ecoregionas a ‘large unit of land or water containing a geographi-
cally distinct assemblage of species, natural communi-ties, and environmental conditions’.The boundaries ofan ecoregion are not fixed and sharp, but ratherencompass an area within which important ecologicaland evolutionary processes most strongly interact. Inthe case of PNG, these ecoregions were separated onthe basis of biological data, paleoenvironments andexpert opinion. The ecoregion analysis of Olson et al.(2001) for PNG does not possess a sufficiently fineresolution of climatic variables to adequately describevariation in forest communities, and its boundarydelineation is relatively coarse. In addition, recentwork on the beta diversity of lowland forests both inPNG (Novotny et al. 2007) and the Western Amazon(Condit et al. 2002) suggested that it is often compara-tively low and that therefore little variation can beexpected in species composition across the largelowland forest expanses of the Sepik–Ramu basins andthe Western/Gulf areas.There is therefore a need for arefined map of bioregions in PNG that incorporatesbetter resolution climatic information, and a morecomprehensive mapping of geologic and tectonic fea-tures of PNG.
Here we adopt a biotopic division of the countryinto biogeographic regions on the basis of its geologi-cal history of accretion, followed by a division of thesebiogeographic regions into ‘biomes’ on the basis of theclimatic zones that they encompass. These climaticzones are based on temperature and rainfall domains.We then incorporate this bioregional classification withthe results of a long-term forest mapping and forestchange analysis (Shearman et al. 2009) to:1. Produce a map of ecologically and biotically dis-
tinct forested zones;2. Measure long-term deforestation and degradation
in each identified forest zone and examine theimplications of these data;
3. Assess the representativeness and success ofPNG’s protected area system within each forestzone and across the forest estate in general.
METHODS
Summary
A new regionalization was defined through the juxta-position of two surfaces; one identifying 11 biogeo-graphical zones and the other identifying 11 climaticdomains. The combination of both datasets allowedassessment of long-term forest change in 81 separateregions or ‘biomes’ of the country. Note that whilethere were 121 possible combinations of biogeographi-cal zones and climatic domains, only 81 biomes actu-ally exist – the difference due to the biogeographicalzones not actually containing some of the climaticdomains.
BIOREGIONAL FOREST CHANGE IN PNG 3
© 2010 The Authors doi:10.1111/j.1442-9993.2010.02111.xJournal compilation © 2010 Ecological Society of Australia

We conducted a biogeographical classification ofPNG by dividing the landscape into tectonically andgeologically distinct regions through the synthesis ofpast tectonic and geological mapping studies. Our cli-matic classification was synthesized by dividing thelandscape into distinct, biologically relevant, rainfalland temperature zones using Worldclim grided tem-perature and rainfall surfaces (Hijmans et al. 2005).We then combined our biogeographic and climaticclassifications into a single map showing distinctbiogeographic–climatic zones that we refer to as‘biomes’. We then combined our biome map with the2002 forest map and change analysis of PNG (Shear-man et al. 2009) to produce a map of ecologicallydistinct forest biomes and to examine long-termchange within these biomes. We also examined therepresentation of forest, forest-cover change and forestbiomes in PNG’s protected area system. The 2002forest map defines ‘forest’ as natural woody vegetationthat has a contiguous tree canopy and a canopy height>5 m.These forests are also known as tropical rainfor-est and are distinguished from open sclerophyll forest,woodland, savanna, mangrove and swamp vegetation.The change analysis was confined to rainforest.
Our methodology is therefore divided into four sec-tions: (i) biogeographic classification; (ii) climatic clas-sification; (iii) forest biome area and change; and (iv)forest area and change in protected areas.
Biogeographical classification
Our biogeographical classification was conducted bysynthesizing previous mapping of tectonic boundaries,primarily following the boundaries of terrane groupsfirst described by Ollier and Bain (1972) andexplained by Pigram and Davies (1987). Where pos-sible, existing gaps in forest cover were used as thelocation of a zone boundary, such as the MarkhamValley or the Watut-Tauri Gap, the boundary betweenthe Central Ranges and the Owen Stanley terrane(Flannery 1990).
A 90-m resolution digital elevation model (DEM)derived from the shuttle radar topography missiondata (Farr et al. 2007) was used to demarcate altitu-dinal zones. The separation of the lowland zonesfrom highland zones, such as the boundary betweenthe Sepik–Ramu and the Central Ranges, wasdefined as occurring at 1000 m altitude: the bound-ary between ‘low altitude forest’ and ‘lower montaneforest’ (Paijmans 1976; Hammermaster & Saunders1995).
The D’Entrecasteaux Islands were separated fromNormanby Island (and the rest of the Papua islands)on the basis of the distribution of freshwater fauna(Polhemus & Allen 2004) and amphibians (Allison1993) that both suggested that these islands possess a
fauna radically distinct from the neighbouring islandsand the mainland, thus representing a distinct evolu-tionary history. The distinct ultramafic zone in Oro/Morobe was defined as a separate zone because of itsdistinct assemblage of plant and animal species. Theboundaries of these 11 biogeographical zones are dis-played in Figure 1 and each is described below. Theboundaries can be obtained in geographic informationsystem format (ESRI Shapefile) from the authors.
Biogeographical zone descriptions
1. Sepik–Ramu–Markham Basins. These large struc-tural basins lie to the north of the Central Rangesand are predominantly drained by the Sepik,Ramu and Markham rivers. They also contain theTorricelli and Bewani coastal ranges. While it couldbe argued that these coastal ranges should be treatedas a distinct region on the basis of their relativelyrecent accretion history and upland endemics, theycontain a relatively small montane region. While it istempting to create many more zones for the numer-ous small mountainous outliers that exist throughoutthe country, to do so would reduce the utility of anational classification.
2. Fly–Gulf. The Fly, Strickland, Purari and Kikoririvers drain this huge series of connected lowlandbasins. Created by the collision of the Central High-lands terrane with the Australia craton, this region
Fig. 1. Boundaries of biogeographical zones used in thisstudy. These are categorized as follows: 1 = Sepik–Ramu–Markham Basins; 2 = Fly–Gulf; 3 = Central Highlands;4 = Huon Peninsula and Adelbert Ranges; 5 = Owen StanleyRanges; 6 = South-East Papua Lowlands; 7 = Bowutu Ultra-mafic Belt; 8 = East Papua Islands; 9 = D’EntrecasteauxIslands; 10 = Southern Bismarck Island Arc; 11 = NorthernBismarck Island Arc.
4 P. SHEARMAN AND J. BRYAN
© 2010 The Authorsdoi:10.1111/j.1442-9993.2010.02111.xJournal compilation © 2010 Ecological Society of Australia

supports the largest extent of contiguous lowlandforests in the country.
3. Central Highlands. This area includes the CentralDividing Range between the upper Sepik and Flyrivers in the west and the Bulolo River in the east,containing the headwaters of the Kikori and Puraririvers at elevations above 1000 m. This is a complexuplift, with several well-separated areas of extremelyhigh terrain centred around peaks, such as MtWilhelm(4509 m) and Mt Giluwe (4367 m), and contains anextensive exposure of uplifted Palaeozoic basement inthe Kubor Anticline (Hill & Hall 2003).
4. Huon Peninsula and Adelbert Ranges. The HuonPeninsula contains the Finisterre and SaruwagedMountains, and probably docked to the mainland atapproximately the same time as the Adelbert Rangesin Madang Province. This northern coastal mountainblock, running from east of the Sepik River delta tothe tip of the Huon Peninsula, corresponds to theAdelbert–Finisterre Terrane of tectonic geologistsand is considered to be an accreted sector of aformerly separate island that was sutured to NewGuinea in the Late Miocene to Pliocene (Hill & Hall2003).
5. Owen Stanley Ranges. The central mountain chainof the Papuan Peninsula, comprised of uplifted ophio-lites and subduction melange, is an area of rich ende-mism in all groups.
6. South-East Papua Lowlands. Flannery (1990)observed that South-East New Guinea (south-east of aline: Kerema-Garaina) is biogeographically distinctfrom the central PNG highlands. This area extendsfrom the Watut-Tauri Gap all the way to Milne Bayand Normanby Island in the east, including the low-lands of the Popondetta plains and the southern coastof Central Province. Flannery (1990) first used theterm ‘Watut-Tauri Gap’ to describe the biogeographi-cal boundary between the birds of the Papuan Penin-sula and those of the central Highlands of PNG. Thisboundary correlates with the craton margin (Heads2001b).
7. Bowutu Ultramafic Belt. Allison (1993) observedthat the Bowutu Mountains/eastern Kuper Range(Bowutu terrane, consisting of the Papuan UltramaficBelt) form a major centre of diversity for frogs andlizards, with 20 frogs and 10 lizards endemic. Thepresence of ultramafics on the Earth’s surface is ofgreat tectonic significance as they are sections ofoceanic crust and upper mantle that have been upliftedand obducted onto land (rather than subducted belowit). This has occurred at plate margins during islandarc collision, and accreted arc terranes and orogenic
belts frequently include ophiolites.Vegetation commu-nities found on ultramafic rock types often contain aconsiderable degree of endemicity. Soils derived fromthese rocks contain large concentrations of some ele-ments (e.g. iron, magnesium, nickel) and are deficientin others (e.g. calcium). For plants to survive on thesesubstrates adaptations are needed to cope with toxiclevels of some abundant elements and deficiencies inothers. Botanists have long recognized that thesenorthern New Guinea ultramafics were strong foci ofendemism (e.g. Airy Shaw 1980; Prance & Campbell1988), and it was considered that much of this ende-mism was the result of edaphic rather than historicalfactors. Polhemus (1996) pointed out that althoughmany animals (e.g. Parotia lawesii helenae) show similardistributions, this might reflect biogeographic ratherthan edaphic factors.
8. East Papua Islands. This vast maritime region con-tains the relatively less diverse, but faunally distinctislands of Misima, the Trobriands, Woodlark Island,the Louisiade Archipelago, east to Sudest and RosselIslands.
9. D’Entrecasteaux Islands. This is a chain of highislands with predominantly metamorphic geology, andlies immediately north of the eastern PapuanPeninsula. Recent collections have demonstrated thepresence of endemic mammals, fishes, Heteropteraand Zygoptera (Polhemus & Allen 2004), but have alsoshown that this endemism is confined to Goodenoughand Ferguson islands, with Normanby Island forminginstead part of the Cloudy Mountains area of ende-mism (South-East Papua Lowlands).
10. Southern Bismarck Island Arc. This area containsthe island of New Britain as well as its surroundingislands. Despite its proximity, 70% of the bird specieson the New Guinean mainland adjacent to NewBritain are not represented there (Heads 2001b).Gressitt (1982) considered that the absence of manyNew Guinea animals from the Bismarck Archipelagois ‘puzzling’.
11. Northern Bismarck Island Arc. Extending fromManus in the west, through the New Ireland chain toBougainville in the east, this series of terranes arebroadly related to each other in possessing a relativelylower flora diversity and affiliations with the mainland.
A bioclimatic domain classification of PNG
Our bioclimatic classification was based on rainfalland temperature. Rainfall in PNG is generally high(McAlpine et al. 1983). A critical factor for plantgrowth, and therefore a feature of rainfall patterns that
BIOREGIONAL FOREST CHANGE IN PNG 5
© 2010 The Authors doi:10.1111/j.1442-9993.2010.02111.xJournal compilation © 2010 Ecological Society of Australia
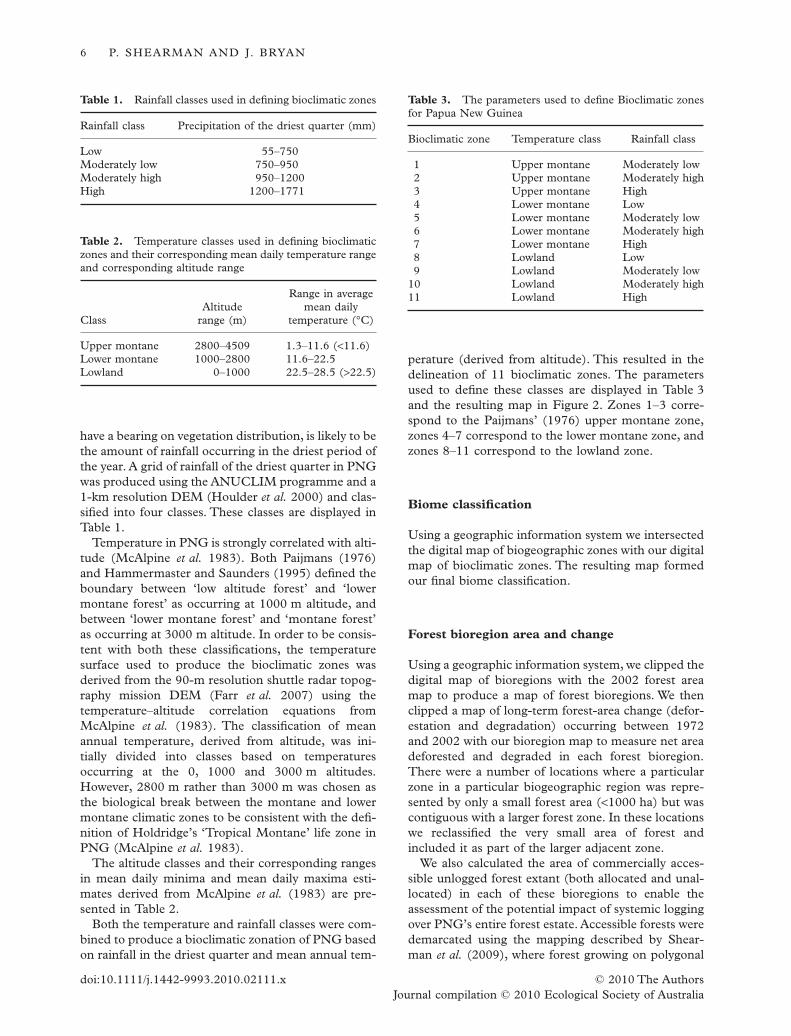
have a bearing on vegetation distribution, is likely to bethe amount of rainfall occurring in the driest period ofthe year. A grid of rainfall of the driest quarter in PNGwas produced using the ANUCLIM programme and a1-km resolution DEM (Houlder et al. 2000) and clas-sified into four classes. These classes are displayed inTable 1.
Temperature in PNG is strongly correlated with alti-tude (McAlpine et al. 1983). Both Paijmans (1976)and Hammermaster and Saunders (1995) defined theboundary between ‘low altitude forest’ and ‘lowermontane forest’ as occurring at 1000 m altitude, andbetween ‘lower montane forest’ and ‘montane forest’as occurring at 3000 m altitude. In order to be consis-tent with both these classifications, the temperaturesurface used to produce the bioclimatic zones wasderived from the 90-m resolution shuttle radar topog-raphy mission DEM (Farr et al. 2007) using thetemperature–altitude correlation equations fromMcAlpine et al. (1983). The classification of meanannual temperature, derived from altitude, was ini-tially divided into classes based on temperaturesoccurring at the 0, 1000 and 3000 m altitudes.However, 2800 m rather than 3000 m was chosen asthe biological break between the montane and lowermontane climatic zones to be consistent with the defi-nition of Holdridge’s ‘Tropical Montane’ life zone inPNG (McAlpine et al. 1983).
The altitude classes and their corresponding rangesin mean daily minima and mean daily maxima esti-mates derived from McAlpine et al. (1983) are pre-sented in Table 2.
Both the temperature and rainfall classes were com-bined to produce a bioclimatic zonation of PNG basedon rainfall in the driest quarter and mean annual tem-
perature (derived from altitude). This resulted in thedelineation of 11 bioclimatic zones. The parametersused to define these classes are displayed in Table 3and the resulting map in Figure 2. Zones 1–3 corre-spond to the Paijmans’ (1976) upper montane zone,zones 4–7 correspond to the lower montane zone, andzones 8–11 correspond to the lowland zone.
Biome classification
Using a geographic information system we intersectedthe digital map of biogeographic zones with our digitalmap of bioclimatic zones. The resulting map formedour final biome classification.
Forest bioregion area and change
Using a geographic information system, we clipped thedigital map of bioregions with the 2002 forest areamap to produce a map of forest bioregions. We thenclipped a map of long-term forest-area change (defor-estation and degradation) occurring between 1972and 2002 with our bioregion map to measure net areadeforested and degraded in each forest bioregion.There were a number of locations where a particularzone in a particular biogeographic region was repre-sented by only a small forest area (<1000 ha) but wascontiguous with a larger forest zone. In these locationswe reclassified the very small area of forest andincluded it as part of the larger adjacent zone.
We also calculated the area of commercially acces-sible unlogged forest extant (both allocated and unal-located) in each of these bioregions to enable theassessment of the potential impact of systemic loggingover PNG’s entire forest estate. Accessible forests weredemarcated using the mapping described by Shear-man et al. (2009), where forest growing on polygonal
Table 1. Rainfall classes used in defining bioclimatic zones
Rainfall class Precipitation of the driest quarter (mm)
Low 55–750Moderately low 750–950Moderately high 950–1200High 1200–1771
Table 2. Temperature classes used in defining bioclimaticzones and their corresponding mean daily temperature rangeand corresponding altitude range
ClassAltitude
range (m)
Range in averagemean daily
temperature (°C)
Upper montane 2800–4509 1.3–11.6 (<11.6)Lower montane 1000–2800 11.6–22.5Lowland 0–1000 22.5–28.5 (>22.5)
Table 3. The parameters used to define Bioclimatic zonesfor Papua New Guinea
Bioclimatic zone Temperature class Rainfall class
1 Upper montane Moderately low2 Upper montane Moderately high3 Upper montane High4 Lower montane Low5 Lower montane Moderately low6 Lower montane Moderately high7 Lower montane High8 Lowland Low9 Lowland Moderately low
10 Lowland Moderately high11 Lowland High
6 P. SHEARMAN AND J. BRYAN
© 2010 The Authorsdoi:10.1111/j.1442-9993.2010.02111.xJournal compilation © 2010 Ecological Society of Australia

karst, slopes greater than 25° and forested areassmaller than 50 000 ha were deemed commerciallyinaccessible.
Using a geographic information system we clippedour 2002 forest bioregion and 1972–2002 forestchange map with a digital map of protected areaboundaries in PNG. The area of forest cover, degra-dation and net deforestation within each of the PNGprotected areas was also calculated.The locations andnames of these protected areas are displayed inFigure S4.
The term ‘forest change’ is used to refer to the totalarea of rainforest deforestation and degradation thatoccurred between 1972 and 2002.The term ‘potentialchange’ refers to the per cent of 1972 rainforest areathat was deforested or degraded by 2002, in additionthe area of unlogged commercially accessible forestlocated inside designated logging concession areas. Inturn, those areas of loggable, but unlogged forest indesignated concessions were separated into two cat-egories, termed allocated and unallocated, on the basisof whether they were already inside active loggingconcessions. In this regard, potential change estimatesthe possible outcome of current Government of PNG
forestry policies (Overseas Development Institute2006), but does not include estimates of future non-forestry-related change nor the impact of new forestconcessions.
RESULTS AND DISCUSSION
Overview of rainforest change in biogeographicregions and climatic zones
The distribution of total forest change, degradation,net deforestation and potential change across climaticzones and biogeographic regions is presented inFigure 3. Statistics describing these parameters ineach of the bioregions and bioclimatic zones are pre-sented in Tables 4 and 5, respectively. A full break-down of these statistics described via biogeographicregion and bioclimatic zone and their intersection intothe 81 biomes is available in Table S1.
The greatest per cent of degradation and deforesta-tion has occurred in the lowland forests of coastalregions.The lowlands of New Britain and New Ireland
Fig. 2. Bioclimatic zones of Papua New Guinea based on mean annual temperature and rainfall in the driest quarter.
BIOREGIONAL FOREST CHANGE IN PNG 7
© 2010 The Authors doi:10.1111/j.1442-9993.2010.02111.xJournal compilation © 2010 Ecological Society of Australia

Fig. 3. A.Total rainforest change (deforestation and degradation); B Deforestation; C. Degradation; D. Potential forest change.Each climatic zone in each biogeographic region is coloured by the percentage of forest that was either cleared or degraded1972–2002, or that was unlogged accessible forest allocated to the forest industry. Shades of green represent 0% potential forestchange (dark green) to <10% change (pale green).The yellow to red colour range represents 10% (pale yellow) to 20% (mediumorange) to 30% (red) change.The red to purple colour range represents 30% change (red) to 60% (medium purple) change.Thepurple to grey colour range represents 60% (purple) to 70% (light grey) to 90% (dark grey) change. Areas that were not rainforestin 1972 are shown in white.
Table 4. Areas of primary rainforest in 2002, secondary forest in 2002 (degraded), net deforestation 1972–2002 (Defor.),allocated and unallocated, unlogged primary forest in 2002 (Log. Pot. Unall.) are listed according to their presence in eachbioregion
BioregionRainforestarea (ha)
% oftotal
Degraded(ha)
%Degraded
Defor.(ha)
%Defor.
Log. Pot.Tot. (ha)
% Log.Pot. Tot.
Sepik–Markham 5 199 008 18.32 354 597 12.13 963 702 18.18 1 996 100 22.85Fly–Gulf 6 673 524 23.51 893 485 30.57 755 627 14.25 4 103 553 46.98Central Highlands 5 178 012 18.25 7 337 0.25 860 971 16.24 211 745 2.42Huon Peninsula and Adelbert 1 658 340 5.84 66 349 2.27 468 700 8.84 114 547 1.31Owen Stanley Ranges 2 031 684 7.16 15 184 0.52 314 630 5.93 46 150 0.53South-East Papua–Oro 2 422 205 8.53 329 513 11.27 650 934 12.28 877 097 10.04Ultrabasic Belt 901 793 3.18 23 234 0.79 124 183 2.34 226 952 2.60East Papua Islands 174 299 0.61 26 464 0.91 42 604 0.80 56 905 0.65D’Entrecasteaux Group 124 440 0.44 7 305 0.25 48 769 0.92 0 0.00Southern Bismarck Island Arc 2 746 664 9.68 917 108 31.38 610 643 11.52 756 674 8.66Northern Bismarck Island Arc 1 270 267 4.48 282 468 9.66 460 868 8.69 344 594 3.95Total 28 380 236 100.00 2 923 044 100.00 5 301 631 100.00 8 734 317 100.00
8 P. SHEARMAN AND J. BRYAN
© 2010 The Authorsdoi:10.1111/j.1442-9993.2010.02111.xJournal compilation © 2010 Ecological Society of Australia

have been particularly heavily degraded throughlogging, while the upland regions in these provinces, aswell as some upland locations in the Owen StanleyRanges and Mt Bosavi underwent the least deforesta-tion and degradation. The northern lowlands inMadang, Morobe and the East Sepik provinces havebeen heavily deforested or degraded, as have thesouthern lowland and low-rainfall rainforests inWestern Province. Lowland forests across the countryhave the greatest potential change, with 80–90% oflowland rainforest area in New Britain and NewIreland provinces in the Southern and Northern Bis-marck regions potentially deforested or degraded.
Forest change in temperature/altitude zones
Lowland rainforests underwent the greatest amount ofchange, with 30.1% of their area cleared or degradedbetween 1972 and 2002 (Fig. 4). Lowland forests alsohave the highest per cent of potential change, approxi-mately 67%, with most of this occurring in the Fly–Gulf and Sepik–Markham regions. The largedifference between potential change in the lowlandforests (67%) and that in the lower montane forests(17.5%) and upper montane forests (12.9%), as wellas the disproportionately large per cent of actualchange in the lowland forest, indicates that the lowlandforests have been and will continue to be preferentiallytargeted for commercial logging, plantation develop-ment as well as undergoing substantial subsistence-related clearance.
The large per cent of change due to degradation(51%) that has occurred in the lowland forests issimply a consequence of their appeal to the loggingTa
ble
5.A
reas
ofpr
imar
yra
info
rest
in20
02,s
econ
dary
fore
stin
2002
(deg
rade
d),n
etde
fore
stat
ion
1972
–200
2(D
efor
.),t
otal
area
ofch
ange
(Def
or.+
deg.
)an
dpo
tent
ial
chan
geif
allo
cate
dan
dun
allo
cate
d,un
logg
edpr
imar
yfo
rest
in20
02(L
og.P
ot.U
nall.
)ar
elo
gged
Bio
clim
.zo
neT
empe
ratu
rezo
neR
ainf
all
zone
Tot
alfo
rest
area
(ha)
Pro
port
ion
ofto
tal
(%)
Tot
alde
grad
ed(h
a)T
otal
unlo
gged
(ha)
Tot
alD
efor
.(ha
)C
hang
eto
tal
(ha)
%lo
gged
%D
efor
.%
chan
geP
ot.
chan
ge(%
)
1U
pper
mon
tane
Mod
erat
ely
low
134
848
0.5
013
484
88
516
851
60
5.9
5.9
5.9
2M
oder
atel
yhi
gh37
671
61.
31
047
375
669
6852
469
571
0.3
15.4
15.6
15.6
3H
igh
175
552
0.6
017
555
223
378
2337
80
11.8
11.8
11.8
Tot
al68
711
62.
41
047
686
069
100
418
101
465
0.2
12.8
12.9
12.9
4L
ower
mon
tane
Low
126
956
0.4
012
695
626
393
2639
30
17.2
17.2
17.2
5M
oder
atel
ylo
w1
836
582
6.5
171
41
834
868
278
661
280
375
0.1
13.2
13.3
18.4
6M
oder
atel
yhi
gh3
026
220
10.7
2474
93
001
471
512
077
536
826
0.8
14.5
15.2
197
Hig
h3
923
876
13.9
820
73
915
669
437
789
445
996
0.2
1010
.216
Tot
al8
913
634
31.6
3467
08
878
964
125
492
01
289
590
0.4
12.3
12.7
17.6
8L
owla
ndL
ow27
959
61
1229
526
730
127
294
428
523
94.
449
.451
.662
.69
Mod
erat
ely
low
211
167
37.
513
365
51
978
018
767
233
900
888
6.3
26.7
31.3
62.1
10M
oder
atel
yhi
gh5
754
139
20.4
876
403
487
773
61
343
726
222
012
915
.218
.931
.370
11H
igh
1050
580
937
.21
861
644
864
416
51
518
740
338
038
417
.712
.628
.166
.2T
otal
1865
121
766
288
399
715
767
220
390
264
36
786
640
15.5
17.3
30.1
66.8
Tot
al28
251
967
100
291
971
425
332
253
525
798
18
177
695
10.3
15.7
24.4
50.6
The
para
met
ers
used
tode
fine
each
ofth
ebi
oclim
atic
zone
sar
ede
scri
bed
inT
able
3.
Fig. 4. Summary of rainforest change in altitude zones. Percent of 1972 forest area in each zone that was deforested,degraded, deforested or degraded (total change) by 2002 andthe per cent potentially changed.
BIOREGIONAL FOREST CHANGE IN PNG 9
© 2010 The Authors doi:10.1111/j.1442-9993.2010.02111.xJournal compilation © 2010 Ecological Society of Australia

industry. The largest per cent of degradation andoverall change in lowland rainforest has occurred inthe North and South Bismarck regions.These regionscontain the island provinces of East and West NewBritain and New Ireland, where the oldest loggingconcessions are located and where timber resourcesare close to being fully exploited (Shearman et al.2009).
The magnitude of the change occurring withinlowland forests is of concern given that it is thelowland forests that comprise the majority (65%) ofPNG’s forest estate. Our estimate that 67% of thelargest forest area in PNG could potentially bedegraded or cleared, and the estimate that 30% hasalready been deforested or degraded, underlines themagnitude of the forest management issues facing thecountry.
In total, 12.7% of lower montane forests werecleared (12.3%) or degraded (0.4%); however, therewas considerable variation across biogeographicregions. Lower montane forests in those regions thatachieve higher altitudes or contain a more substantialhighlands component – the Owen Stanley Ranges, theHuon Peninsula and the Central Highlands – under-went greater change compared with lower montaneforests in the islands or less densely populated Fly–Gulf or Sepik–Markham regions. Lower montaneforests generally occur in rugged mountains surround-ing intensively settled valleys, and the provinces withthe highest population densities occur in the highlandsrather than the islands and lowland coastal regions.Lower montane forests underwent less degradationthan lowland forests because of the smaller area avail-able for logging activity. High population densitieswere associated with the largest subsistence clearances(Shearman et al. 2009).Thus lower montane forests inthe provinces with higher population densities, theCentral Highlands, Huon Peninsula and Owen StanleyRanges, underwent the greatest change compared withless densely populated Fly–Gulf, Sepik–Markham andisland regions, largely as a consequence of their higherhuman population.
Upper montane forests are found in four biogeo-graphic regions: the Central Highlands, Huon Penin-sula and Adelbert, Owen Stanley Ranges and theBowutu Ultrabasic Belt. Although upper montaneforests are relatively free from high-intensity land usepractices they have not escaped substantial change.Nationally, between 1972 and 2002, 12.7% of uppermontane forests were deforested.This result was unex-pected because, unlike the lower montane and lowlandforests, the upper montane forests are not used forsubsistence agriculture or logging (with the exceptionof some logging on Mt Giluwe) – the two largestdrivers of deforestation and degradation (Shearmanet al. 2009). From a conservation perspective thisresult is important. As the area of upper montane
forests is small, it suggests that these forests are undergreater absolute threat than those at lower altitude. Anexample of this loss in the Finisterre Ranges is pre-sented in Figure 5.
High-altitude forests and grasslands are sources ofwild food, especially when crops fail because ofdrought and associated upland frosts. High-altitudegrasslands in PNG are relatively flammable and espe-cially during droughts, fires ignited by humans orlightning have been recorded spreading into adjacentforests, causing the death of trees (Paijmans & Loffler1972). In many areas loss of upper montane forest wasclearly associated with fire, and it is apparent that firelit by people, especially during El Niño years, was themajor cause of this change.We conclude that fire in theupper montane zone, especially during El Niño years,such as 1997–1998, but also during 2002, has resultedin the encroachment of grassland and scrub into manypreviously forested areas.
Rainforest change in rainfall zones
Deforestation was negatively correlated to rainfall inthat a greater proportion of low-rainfall forest wascleared compared with moderate- and high-rainfallforests, and a greater proportion of moderate-rainfall forests were cleared compared with high-rainfall forests. This may reflect a higher regenerativecapacity of high-rainfall forests, or that these areasoccur in more rugged mountainous areas so are moreresistant to human incursion for secondary reasons.It is also likely that low-rainfall forests are morevulnerable to conversion as a consequence of fire thanare wetter forests (Lewis 2006). As dry weather greatlyincreases the risk of fire, it is low-rainfall rainforeststhat are at most risk of conversion especially whenthey undergo disturbance from logging or gardeningactivity. Indeed the largest area of deforestation due tofire occurred in Western Province in low- and moder-ately low-rainfall zones.
Degradation from logging activities was positivelycorrelated to rainfall reflecting the concentration oflogging activity in the forests of New Ireland, East andWest New Britain and Manus that are located prima-rily in the highest-rainfall zones. High-rainfall lowlandforests tend to yield a higher timber volume perhectare (Vanclay 1992; Bruijnzeel & Veneklaas 1998)and the island provinces of New Britain, New Irelandand Manus have also been readily accessible to thelogging industry compared with mainland or highlandforests. Both accessibility and profitability may havetherefore contributed to the targeting of lowland high-rainfall forests in the island provinces for logging,resulting in the increased per cent of degradation withincreased rainfall. The high-rainfall montane forests
10 P. SHEARMAN AND J. BRYAN
© 2010 The Authorsdoi:10.1111/j.1442-9993.2010.02111.xJournal compilation © 2010 Ecological Society of Australia

have been too inaccessible to sustain significant com-mercial logging.
Rainforest change in biogeographic regions
Both degradation and deforestation varied consider-ably across and sometimes within the biogeographicregions of PNG. The largest per cent of total changetended to be in the east of PNG in the islands andlowlands in the Bismarck, D’Entrecasteaux, EastPapuan Islands and South-East Papua–Oro region.The only region with a significant highlands compo-nent to undergo deforestation at a comparable magni-tude to the islands and lowland regions was the HuonPeninsula and Adelbert region.
Southern and Northern Bismarck Island Arc. Theforests in the Southern and Northern Bismarck IslandArc regions had by far the largest per cent of change
with 45.5% and 42.9% of forests cleared or degradedbetween 1972 and 2002, respectively. Logging hasbeen the major driver of change in this region with themajority occurring in lowland areas. This is becausethe coastal lowland forests in the Bismarck Islands areaccessible to commercial logging, whereas uplandforests, mostly restricted to the karstic Whiteman andNakanai Ranges, are not.
D’Entrecasteaux Islands. The D’Entrecasteaux regionpossesses only a very small per cent of PNG’s forestcover (0.4%) but had the highest proportion of defor-estation (28%) of all the biogeographic regions. Theloss of these forests could impact heavily on theendemic species found in this region. There was verylittle difference between potential forest change andactual forest change indicating that little, if anyunlogged forest has the potential to be allocated to thelogging industry.
Fig. 5. The upper Nankin catchment in the Finisterre Ranges (3400 m). This area was almost entirely forested as recently as1995. Fires, probably during the 1997–1998 El Niño period, deforested a large area in this mountain range. Some remnant forestcan be seen in the wetter gulleys. Dead trees can be seen on some of the ridgelines and foreground. Regeneration of woodyvegetation is largely absent.
BIOREGIONAL FOREST CHANGE IN PNG 11
© 2010 The Authors doi:10.1111/j.1442-9993.2010.02111.xJournal compilation © 2010 Ecological Society of Australia

As was the case across PNG, most forest change anddeforestation in the D’Entrecasteaux Islands occurredin the lowland forests. Within the lowlands, low-rainfall forests underwent both the most change andthe most deforestation. This is because higher-rainfallareas in these islands tend to be steep and compara-tively inaccessible.
Huon Peninsula and Adelbert Ranges. The Huon Pen-insula and Adelbert region had the third highest pro-portion of forest cleared (22%) of all biogeographicregions. In the montane forests there was little deg-radation because of logging, and in the lowlandforests the per cent of forests degraded because for-estry was relatively small. However, as was the overallpattern of forest change, the highest per cent of deg-radation due to logging occurred in the high-rainfallforests.
East Papua Islands. The East Papua Islands had thefifth largest proportion of forest cleared or degradedbetween 1972 and 2002. Logging has been an impor-tant driver of change in the East Papua Islands region.Over half of the entire area of Woodlark Island, whichmakes up most of this region, has been allocated to thelogging industry.
Sepik–Markham, Fly–Gulf and South-East Papua–Oro. Consistent with the overall pattern of forestchange, the South-East Papua–Oro, Fly–Gulf andSepik–Markham regions showed increasing degrada-tion with increased rainfall and increasing deforesta-tion with decreasing rainfall.
The South-East Papua region, unlike the Sepik–Markham and Fly–Gulf regions, had comparativelyhigh proportions of forest cleared. The South-EastPapua–Oro region had a greater proportion of totalforest change as a result of logging-related forest deg-radation than did the Sepik–Markham and Fly–Gulfregions.This is because the forests have a much greaterproportion of forests within logging concessions andhave a larger number of logging concessions that havebeen operating over a longer time period (NationalForest Service 2000).Thus the South-East Papua–Orohas undergone proportionally more clearance and deg-radation as a result of logging than have the Sepik orGulf biogeographic regions.
Ultrabasic Belt, Central Highlands and Owen StanleyRanges. The regions with the lowest proportion offorest change were the Ultrabasic Belt, the OwenStanley Ranges and the Central Highlands and allthree regions suffered only a very small amount ofcommercial logging. As both the Central Highlandsand the Owen Stanley Ranges are located in the mostrugged and mountainous terrain, the comparativelylow per cent of forest degradation in these regions is
due to their inaccessibility. In the case of the UltrabasicBelt, this region has relatively low forest biomass andproductivity and may therefore be of less value forboth forestry and agricultural purposes, and henceunderwent relatively little change despite being rela-tively accessible.
The Owen Stanley Ranges biogeographic region isdistinctive in the high per cent of change that hasoccurred in the lower montane, high-rainfall forests.These forests have been particularly affected by high-altitude burning.The lower montane rather than uppermontane forests in this region may have undergone agreater proportion of deforestation as a result of firebecause mountains in this region are isolated andcoastal. Altitudinal zonation of vegetation has beenshown to occur at lower altitudes in isolated coastalmountains, a phenomenon known as the ‘Massener-hebung Effect’ (Richards 1952). Thus the ‘uppermontane’ vegetation may be located at a lower altitudein the Owen Stanley Ranges, and hence was stronglyimpacted by grassland burning.
Both the Central Highlands and Owen StanleyRanges had the lowest potential forest change,reflecting the large per cent of forests in this regionthat are inaccessible and therefore unlikely to be allo-cated to the logging industry. The Ultrabasic Belt incontrast, had a much higher proportion of potentialforest loss because of the comparative accessibilityof forests in this region. Despite being relativelyunattractive for logging because of the low timberbiomass, the comparative accessibility of forests inthe Ultrabasic Belt may lead to future clearance anddegradation.
Rainforest change in protected areas
The current national protected area system comprisesa total of 34 terrestrial wildlife management areas(WMAs) and National Parks that have been formallygazetted, covering just 1.29 million hectares or 2.8%of PNG’s total land area. In 2002, these protectedareas included a total of 542 166 ha of rainforest,54 332 ha of swamp forest and 8892 ha of mangroves.This area of forest represents 1.9% of the total rain-forest estate as well as 1.6% of the swamp forest and1.5% of the mangroves. As these low numbers indi-cate, establishment of protected areas has not been asmooth process. Over a third of existing protectedareas were gazetted in the first 4 years of Indepen-dence (1975–1979). In the subsequent 23 years only15 more were declared. A comprehensive review in1992 found that, even without any promotion or pub-licity of the scheme, a backlog of 120 proposals fromlandowners for assistance from Department of Envi-ronment and Conservation (DEC) to establish WMAshad accumulated (Hunnam 1992). In the past
12 P. SHEARMAN AND J. BRYAN
© 2010 The Authorsdoi:10.1111/j.1442-9993.2010.02111.xJournal compilation © 2010 Ecological Society of Australia

13 years, only seven newWMAs have been establishedand all have come about through major efforts bynon-government organizations, with little supportfrom government. It is also relevant to note that thenational government recently imposed a moratoriumon the ratification of new protected areas in order tonegate the potential for conflict with the allocation ofpotential logging areas to the timber industry, underthe government’s ‘export-driven’ economic policy(Shearman et al. 2008)
Over the 1972–2002 period, a total of 11 951 ha(2.2%) of the gazetted rainforest has been degradedthrough logging, and an additional 38 927 ha (6.7%)was cleared, mostly by subsistence activities. It wasfound therefore that rainforests within protected areashad experienced an overall change of 8.9% during thestudy period. While this suggests that forests withinprotected areas are better protected than forestsoverall, which had a country average of 24% change(Shearman et al. 2009), the wide variation in thechange that occurred in WMAs indicates this is mis-leading: six protected areas had no forest change butanother six had more than 50% of their 1972 forestarea cleared or degraded, and four had 99% of theirextent deforested or degraded by 2002 (Table S2). Afurther 16.0% of rainforest within protected areas hasbeen allocated for logging.
The majority (77%) of forest in the protected areasystem is enclosed within two WMAs: Hunstein WMAin East Sepik Province (160 850 ha) and CraterMountain WMA that straddles East Highlands,Chimbu and Gulf Provinces (255 306 ha). Onaccount of their low population density and inaccessi-bility, both WMAs experienced relatively little forestloss (2% in Hunstein and 3% in Crater Mountain). Ifall other 32 WMAs are considered separately fromHunstein and Crater, then the results of the changeanalysis present a radically different picture of theeffectiveness of conservation designation. In these 32WMAs, a total of 126 010 ha (77%) of forest remain,while 23% of their 1972 extent has been cleared ordegraded within the study period. This indicates thatfor the majority of WMAs, there is no discernabledifference in the rate of change because of their con-servation status.
With regard to the bioregional distribution of pro-tected areas, it was found that only one biogeographi-cal region had more than 5% of its forests within aprotected area. This occurred in the D’EntrecasteauxIslands where the total forested area, both within andoutside of protected areas, represents only 0.4% ofPNG’s forests. The East Papua Islands region had noforests in protected areas, and the Owen Stanley(0.03%) and South-East Papua–Oro (0.07%) regionshad virtually no rainforests within protected areas.
Further underlining the inadequacy of WMAs as ameans of conserving forest in PNG is the finding that
only 37 of PNG’s 73 forested biomes were representedin protected areas. Only 6 out of the 73 biomes had10% or more of their area contained in a protectedarea. In addition, the protected area network containsalmost no upper montane forests.The lowland forests,which underwent the most deforestation and degrada-tion also have little representation in protected areas.
Several forest areas within WMAs have been almostcompletely deforested. These include the low-rainfalllowland forests contained in WMAs in the South-EastPapua–Oro region, and the high-rainfall lowlandforests contained inWMAs in the Huon Peninsula andAdelbert region. Similarly, seven of the lowland foresttypes contained in WMAs within the South-EastPapua–Oro, Huon Peninsula and Adelbert, CentralHighlands, Sepik–Markham and Southern BismarckIslands regions had more than 65% of their extentdeforested or degraded. This pattern of change, withlowland forests in WMAs generally undergoing thehighest proportion of deforestation or degradation, isconsistent with the overall forest change pattern inPNG.
It is also apparent from these results that commerciallogging has been occurring within protected areas.Three of theWMAs in New Britain have been partiallylogged as has Mojirau WMA in East Sepik. MojirauWMA was the first protected area to be designated inthe country. In addition, large areas of existing pro-tected areas have been allocated to the logging industry– approximately 18.4% of their total area in 2002 –much of which is potentially loggable forest (16%).
The network of protected areas, according to theUnited Nations Convention on Biological Diversity, towhich PNG is a signatory, was intended to be ‘repre-sentative of biological diversity’ (Prescott et al. 2000).The results of this analysis strongly suggest that thecurrent system of protected areas is ineffective on anumber of levels.TheWMAs contain only a very smallproportion of PNG’s forest estate, and this area isdisproportionately located in the lower montane forestzone, a zone that has been least affected by logging andsubsistence clearance. The WMA network does notcontain representative examples of forest types in thevarious bioclimatic and bioregional zones. Further-more, outside of the Crater and Hunstein WMAs, theother 32 WMAs are experiencing clearance and deg-radation at rates comparable with the rest of thecountry.The fact that large areas of some WMAs havebeen logged and much has been allocated to thelogging industry, serves to emphasize the point thatmanagement of these areas has not been taken seri-ously by the Government of PNG. Given that the lastdecade has seen little expenditure of Governmentfunds on the site management of these areas (Chatter-ton et al. 2006), while in some cases actively promot-ing their degradation through their allocation to thelogging industry, this can hardly come as a surprise.
BIOREGIONAL FOREST CHANGE IN PNG 13
© 2010 The Authors doi:10.1111/j.1442-9993.2010.02111.xJournal compilation © 2010 Ecological Society of Australia

CONCLUSION
Despite the fundamental significance of PNG’s foreststo the country’s ecology and the future of the greatmajority of its citizens, our findings of substantialdeforestation and degradation across biomes and bothin and outside of protected areas, indicate that therehave been no coherent efforts to protect or sustainablymanage the country’s forest estate.
For many, the integrity of its diverse forests, ecology,tribal cultures and endemic flora and fauna make con-servation an imperative. As ecological knowledge hasimproved and been shared over recent decades, theessential grounds for conservation have been increas-ingly recognized both internationally and locally(Brooks et al. 2006; European Union 2006; Rudel2008; Grainger 2009). There has, however, been littleprogress in PNG over the past decades towards avision that might be shared between the major stake-holders involved – governments, landowners, resourcedevelopers, conservationists and local communities.
Those seeking or advocating conservation and a sus-tainable future need to be much clearer about theirvision and objectives: to what extent should naturalvalues be conserved and at what constraints to devel-opment? What limits should be imposed on logging,forest clearing, plantation development, quarrying andmining minerals? What resource-based industrieswould best support the rapidly increasing rural popu-lation and their economic and social development? Fortheir part, resource developers appear unwilling toaccept limits to access to resources. Many new minesare planned and despite PNG’s international calls forsupport to protect its forests, forestry concessions con-tinue to be allocated (Shearman et al. 2008). In therecent past approximately one million hectares offorest have been allocated to agriculture developmentprojects, meaning that they can now be clear felled.Our findings show that all parts of the country havebeen considered open to exploitation, even withingazetted nature reserves. Achieving a balance betweenconservation and development has been challenging.It is questionable that the increased revenue fromnatural resource extraction has produced equivalentincreases in health, education services and infrastruc-ture development. If it has not, what measures can beput in place to guarantee that further natural resourceextraction will result in positive outcomes for themajority of Papua New Guineans?
Clearly, current forest conservation efforts areneither adequate or effective. Conservationists havebeen driven too much by the conventional approach ofprotected areas, funding fads and a narrow determi-nation to safeguard ‘the best bits’ (Kaimowitz & Sheil2007; Cameron et al. 2008). The past 30 years haveshown that management of natural resources for con-servation and development has to be comprehensive
and integrated if it is to achieve its multiple balancedaims effectively in the long term (Grainger & Konteh2007; Kaimowitz & Sheil 2007; Rudel 2008). Site-based conservation of nature is an important strategybut one that that remains to be properly implementedand supported in PNG. Strengthening the WMAsystem and then providing appropriate support for themany hundreds of applications from groups of cus-tomary landowners could be done immediately, easilyand at modest cost. This should be given the highestpriority. Despite the system’s neglect, the WMAremains a suitable starting point for creating localresource management areas dedicated to multiple sus-tainable uses. Such a scheme could be developedcountrywide, readily and rapidly, to create an effectivesystem that is applicable and accessible to virtually alllandowner groups across the country.
Fundamentally however, it is doubtful that thenotion of ‘setting aside’ 10% or 20% of the land areafor conservation is a useful or desirable objective forPNG, despite its appeal to prioritization exercises andindeed industrial developers (Kaimowitz & Sheil2007; Cameron et al. 2008). The outcome of the past30 years of conservation and development efforts sug-gests that an inverse target may be more meaningfuland appropriate: to zone 90% of the land for conser-vation, in the sense of judicious and integrated use ofthe country’s natural resources. Inverse zoning wouldindicate that with additional safeguards the countrymight be able to afford to degrade up to 10% of itsterrestrial ecosystems without reducing the naturalvalues and ecosystem functions of the remainingmajority. The principal value of such a target wouldbe to stress that much more attention needs to begiven to the management of resource uses – for for-estry, agriculture, mining, fishing, urban settlementsand infrastructure – to ensure that their impacts onnatural values are reasonable and acceptable. Theneed to adequately prescribe and build institutionalcapacity to govern ecologically sustainable develop-ment and integrated use of natural resources is there-fore major area in which both conservationists andthe PNG Government need to concentrate theirefforts.
As a country that is by all standards heavily forested,possessing a low population and huge mineral depos-its, if it is not possible for the PNG, with the assistanceof the international community, to achieve long-termprotection of large areas of forest, then it seemsunlikely that it can be achieved anywhere on theplanet.
ACKNOWLEDGEMENTS
We would like to acknowledge Julian Ash, PeterHunnam and Brendan Mackey for their comments
14 P. SHEARMAN AND J. BRYAN
© 2010 The Authorsdoi:10.1111/j.1442-9993.2010.02111.xJournal compilation © 2010 Ecological Society of Australia

and counsel over the many years it took to concludethis work, as well as the contributions from the review-ers that substantially improved the manuscript.
REFERENCES
Airy Shaw H. K. (1980) The Euphorbiaceae of New Guinea. RoyalBotanic Gardens, Kew.
Allison A. (1993) Biodiversity of the fishes, amphibians, andreptiles of Papua New Guinea. In: Papua New Guinea Con-servation Needs Assessment,Vol. 2. A Biodiversity Analysis forPapua New Guinea (ed. B. M. Beehler) pp. 57–226. Biodi-versity Support Program, Washington, DC and Departmentof Environment and Conservation, Boroko.
Allison A. (2007) The herpetofauna of Indonesia’s Papua Prov-ince, New Guinea. In: The Ecology of Papua (eds B. M.Beehler & Andrew Marshall) pp. 564–616. Periplus Edi-tions, Hong Kong.
Bishop Museum (2009) Papuan Herpetofauna. [Cited October2009.] Available from URL: http://www.bishopmuseum.org/research/pbs/papuanherps/
Bleeker P. (1983) Soils of Papua New Guinea. The AustralianNational University Press, Canberra.
Box E. O., Crumpacker D.W. & Hardin E. D. (1993) A climaticmodel for location of plant species in Florida, USA. J.Biogeogr. 20, 629–44.
Brooks T. M., Mittermeier R. A., da Fonseca G. A. B. et al.(2006) Global biodiversity conservation priorities. Science313, 58–61.
Bruijnzeel L. A. & Veneklaas E. J. (1998) Climatic conditionsand tropical montane forest productivity: the fog has notlifted yet. Ecology 79, 3–9.
Cameron S. E., Williams K. J. & Mitchell D. K. (2008) Effi-ciency and concordance of alternative methods for minimiz-ing opportunity costs in conservation planning. Conserv.Biol. 22, 886–96.
Chatterton P., Ramuna R., Higgins-Zogib L., Mitchell N., SabiJ. & Jano W. (2006) An Assessment of the Effectiveness PapuaNew Guinea’s Protected Areas Using WWF’s RAPPAMMethodology. World Wildlife Fund, WWF, Port Moresby,Papua New Guinea.
Clifford H. T. & Stephenson W. (1975) An Introduction toNumerical Classification. Academic Press, New York.
Condit R., Pitman N., Leigh E. G. Jr et al. (2002) Beta-diversityin tropical forest trees. Science 295, 666–9.
Davis S. D., Heywood V. H. & Hamilton A. C. (1995) Centers ofPlant Diversity:Vol. 2 Asia, Australasia and the Pacific. WWF/IUCN, Gland.
European Union (2006) Country environmental profile, PapuaNew Guinea. Framework Contract AMS/451 Lot no. 6Request for Services N 2005/108511.
Farr T. G., Rosen P. A., Caro E. et al. (2007) The shuttle radartopography mission. Rev. Geophys. 45, RG2004.
Flannery T. (1990) The Mammals of New Guinea. Robert Brownand Associates, Carina, Queensland, Australia.
Gleason H. A. (1939) The individualistic concept of the plantassociation. Am. Midl. Nat. 21, 92–110.
Grainger A. (2009) Towards a new global forest science. Int.Forest. Rev. 11, 126–33.
Grainger A. & Konteh W. (2007) Ambiguity, autonomy andsymbolism in African politics: the development offorest policy in Sierra Leone. Land Use Policy 24, 42–61.
Gressitt J. L. (1982) Biogeography and Ecology of New Guinea,Vols I and II. Junk Publishers, London.
Hammermaster E. T. & Saunders J. C. (1995) Forest ResourcesandVegetation Mapping of Papua New Guinea. PNGRIS Pub-lication No. 4. Commonwealth Scientific and IndustrialResearch Organisation, Canberra.
Heads M. (2001a) Regional patterns of biodiversity in NewGuinea plants. Bot. J. Linn. Soc. 136, 67–73.
Heads M. (2001b) Birds of paradise, biogeography and ecologyin New Guinea: a review. J. Biogeogr. 28, 893–925.
Heads M. (2002) Regional patterns of biodiversity in NewGuinea animals. J. Biogeogr. 29, 285–94.
Hijmans R. J., Cameron S. E., Parra J. L., Jones P. G. & Jarvis A.(2005) Very high resolution interpolated climate surfaces forglobal land areas. Int. J. Climatol. 25, 1965–78.
Hill K. C. & Hall R. (2003) Mesozoic-Cenozoic evolution ofAustralia’s New Guinea margin in a west Pacific context. In:Evolution and Dynamics of the Australian Plate (eds R. R.Hillis & R. D. Mueller) pp. 265–90. Geological Society ofAmerica, Boulder Colorado. Geological Society of AustraliaSpecial Publication 22 and Geological Society of AmericaSpecial Paper 372.
Hobbs R. J. & McIntyre S. (2005) Categorizing Australian land-scapes as an aid to assessing the generality of landscapemanagement guidelines. Glob. Ecol. Biogeogr. 14, 1–5.
Hoffman A. A. & Parsons P. A. (1997) Extreme EnvironmentalChange and Evolution. Cambridge University Press,Cambridge.
Houlder D. J., Hutchinson M. F., Nix H. A. & McMahon J. P.(2000) ANUCLIM User Guide, Version 5.1. Centre forResource and Environmental Studies, Australian NationalUniversity, Canberra.
Hunnam P. (1992) Papua New Guinea Protected Areas Programme:Register of Protected Areas. WWF South Pacific Program,Port Moresby.
Hunt C. (2006) Wasting Our Heritage. PNG Eco-ForestryForum, Port Moresby.
Johns R. J. (1982) Plant Znation. In: Biogeography and Ecology ofNew Guinea (ed. J. L. Gressitt) pp. 309–330, Vol I and II.Junk Publishers, London.
Kaimowitz D. & Sheil D. (2007) Conserving what and forwhom? Why conservation should help meet basic humanneeds in the tropics. Biotropica 39, 567–74.
Ladiges P.Y. & Cantrill D. (2007) New Caledonia – Australianconnections: biogeographic patterns and geology. Aust. Syst.Bot. 20, 383–9.
Land andWater Australia (2002) AustralianTerrestrial BiodiversityAssessment 2002. National Land and Water Resources Audit,Commonwealth of Australia, Canberra. [Cited 1 December2009.] Available from URL: http://lwa.gov.au/products/pr020457
Lewis S. L. (2006) Tropical forest and the changingearth system. Philos. Trans. R. Soc. Lond. B 361, 195–210.
Linder P. H. & Crisp M. D. (1995) Nothofagus and PacificBiogeography. Cladistics 11, 5–32.
Loffler E. (1977) Geomorphology of Papua New Guinea. CSIRO &The Australian National University Press, Canberra.
McAlpine J. R., Keig G. & Falls R. (1983) Climate of Papua NewGuinea. CSIRO &The Australian National University Press,Canberra.
Mackey B., Berry S. & Brown T. (2008) Reconciling approachesto biogeographical regionalization: a systematic and genericframework examined with a case study of the Australiancontinent. J. Biogeogr. 35, 213–29.
BIOREGIONAL FOREST CHANGE IN PNG 15
© 2010 The Authors doi:10.1111/j.1442-9993.2010.02111.xJournal compilation © 2010 Ecological Society of Australia

Mackey B. G., Nix H. & Hitchcock P. (2001) The Natural Heri-tage Significance of CapeYork Peninsula. ANU Tech Pty Ltd,Environment Protection Agency, Queensland Government,Canberra. [Cited 1 December 2009.] Available from URL:http://www.epa.qld.gov.au/register/p00582aj.pdf
Margules C. R. & Pressey R. L. (2000) Systematic conservationplanning. Nature 405, 243–53.
Murienne J., Grandcolas P., Piulachs M. D. et al. (2005) Evolu-tion on a shaky piece of Gondwana: is local endemismrecent in New Caledonia. Cladistics 21, 2–7.
Myers N., Mittermeier R., Mittermeier C. G., da Fonseca G. A.B. & Kent J. (2000) Biodiversity hotspots for conservationpriorities. Nature 403, 853–8.
National Forest Service (2000) Timber Permits, Local Forest Areasand Timber Licences as of February 2000. National ForestService, Boroko, Port Moresby.
Novotny V., Miller S. E., Hulcr J. et al. (2007) Low beta diversityof herbivorous insects in tropical forests. Nature 448, 692–7.
Ollier C. D. & Bain J. H. C. (1972) Geology of Papua NewGuinea. In: Encyclopaedia of Papua New Guinea, Vol. 1 (ed.P. Ryan) pp. 479–85. Melbourne University Press & theUniversity of Papua New Guinea, Carlton.
Olson D. M. & Dinerstein E. (1998) The global 200: a repre-sentation approach to conserving the earth’s most biologi-cally valuable ecoregions. Conserv. Biol. 12, 502–15.
Olson D. M., Loucks C. J., Dinerstein E. et al. (2001) Terrestrialecoregions of the world: a new map of life on earth. Bio-Science 51, 933–8.
Overseas Development Institute (2006) Papua New Guinea ForestStudies, Part 1–3. Overseas Development Institute, London.[Cited 1 December 2009.] Available from URL: http://www.odi.org.uk/themes/forests/default.asp
Paijmans K. (1976) New Guinea Vegetation. CSIRO & The Aus-tralian National University Press, Canberra.
Paijmans K. & Loffler E. (1972) High Altitude forests and grass-lands on Mt Albert Edward, New Guinea. J.Trop. Geogr. 34,58–64.
Papua New Guinea National Assessment Report (2006) UnitedNational Department of Economic and Social Affairs. Commis-sion for Sustainable Development, New York.
Pigram C.J. & Davies H.L. (1987) Terranes and the accretionhistory of the New Guinea orogen. J.Aust.Geol.Geophys. 10,193–211.
Polhemus D. A. (1996) Island arcs, and their influence on Indo-Pacific biogeography. In: The Origin and Evolution of PacificIsland Biotas, New Guinea to Eastern Polynesia: Patterns andProcesses (eds A. Keast & S. Miller) pp. 51–66. SPB Pub-lishing, Amsterdam.
Polhemus D. A. & Allen G. (2004) Freshwater biotas of NewGuinea and nearby islands: analysis of endemism, richness andthreats. Contribution No. 2004-004 to the Pacific BiologicalSurvey. Final Report Prepared For Conservation Interna-tional, Washington, DC.
Prance G. T. & Campbell D. G. (1988) The present state oftropical floristics. Taxon 37, 519–48.
Prescott J., Gauthier B., Nagahuedi J. & Mbongu S. (2000)Guide to Developing A Biodiversity Strategy from A SustainableDevelopment Perspective. Institut de l’énergie et del’environnement de la Francophonie (IEPF), Ministère del’Environnement du Québec, United Nations DevelopmentProgramme (UNDP) and United Nations EnvironmentProgramme (UNEP), Québec, Canada.
Rehfeldt G. R., Crookston N. L., Warwell M. V. & Evans J. S.(2006) Empirical analyses of plant-climate relationships
for the western United States. Int. J. Plant Sci. 167, 1123–50.
Richards P. W. (1952) The Tropical Rain Forest: An EcologicalStudy. Cambridge University Press, Cambridge.
Rudel T. (2008) Forest policy changes in the tropics: an emerg-ing research priority. Glob. Environ. Change 18, 253–5.
Sekhran N. & Miller S. (1994) Papua New Guinea Country Studyon Biological Diversity. Department of Environment andConservation, Port Moresby.
SGS (2008) SGS Log Export Monitoring Monthly Reports for 2008.SGS, Port Moresby.
Shearman P. L., Bryan J. E., Ash J., Hunnam P., Mackey B. &Lokes B. (2008) The State of the Forests of Papua New Guinea.Mapping the Extent and Condition of Forest Cover and Mea-suring the Drivers of Forest Change in the Period 1972–2002.University of Papua New Guinea, Port Moresby, PapuaNew Guinea.
Shearman P. L., Ash J., Mackey B., Bryan J. E. & Lokes B.(2009) Forest conversion and degradation in Papua NewGuinea 1972–2002. Biotropica 41, 379–90.
Specht R. L. (1970) Vegetation. In: The Australian Environment,4th edn (ed. G.W. Leeper) pp. 44–67. CSIRO & MelbourneUniversity Press, Melbourne.
Specht R. L. (1981) Major vegetation formations in Australia.In: Ecological Biogeography of Australia (ed. A. Keast)pp. 163–298. The Hague, Junk.
Van Welzen P. C. (1997) Increased speciation in New Guinea:tectonic causes. In: Plant Diversity in Malesia III: Proceedingsof the Third International Flora Malesiana Symposium 1995(eds J. Dransfield, M. J. E. Coode & D. A. Simpson)pp. 363–87. Royal Botanic Gardens Kew, Kew.
Vanclay J. (1992) Assessing site productivity in moist tropicalforests: a review. For. Ecol. Manage. 54, 257–87.
Walther G. R., Post E., Convey P. et al. (2002) Ecologicalresponses to recent climate change. Nature 416, 389–95.
Whittaker R. J., Araujo M. B., Jepson P., Ladle R. J., Watson J. M.E. & Willis K. J. (2005) Conservation biogeography: assess-ment and prospect. Divers. Distrib. 11, 3–23.
Woodward F. I. (1987) Climate and Plant Distribution. CambridgeUniversity Press, Cambridge.
SUPPORTING INFORMATION
Additional Supporting Information may be found inthe online version of this article:
Fig. S1. Principle structural geological features ofPapua New Guinea (derived from Ollier & Bain1972).Fig. S2. Geological map showing the Australiancraton (grey), the New Guinean orogen (between theheavy broken lines) and the accreted New Guineanterranes (black). The islands north of New Guinea(Manus, New Ireland, New Britain and Bougainville)comprise Palaeogene and Quaternary volcanic arcs(Heads 2001a).Fig. S3. Forest zones as defined in the Forest Inven-tory Mapping System (Hammermaster & Saunders1995).Fig. S4. The location of designated wildlife manage-ment areas (WMAs) and National Parks (NPs) inPapua New Guinea (PNG).
16 P. SHEARMAN AND J. BRYAN
© 2010 The Authorsdoi:10.1111/j.1442-9993.2010.02111.xJournal compilation © 2010 Ecological Society of Australia
Table S1. Forest extent, change and logging potentialin biogeographical regions and bioclimatic zones.1972–2002 summary statistics.Table S2. The area of vegetation types and forestchange (1972–2002) in PNG’s WMAs and NPs,ranked by size.
Please note: Wiley-Blackwell are not responsible forthe content or functionality of any supporting materi-als supplied by the authors. Any queries (other thanmissing material) should be directed to the corre-sponding author for the article.
BIOREGIONAL FOREST CHANGE IN PNG 17
© 2010 The Authors doi:10.1111/j.1442-9993.2010.02111.xJournal compilation © 2010 Ecological Society of Australia

SUPPLEMENTARY FIGURES
Supplementary Figure 1. Principle structural geological features of Papua New Guinea (derived from Ollier and Bain, 1972)
Supplementary Figure 2. Geological map showing the Australian craton (grey), the New Guinean orogen (between the heavy broken lines) and the accreted New Guinean terranes (black). The islands north of new Guinea (Manus, New Ireland, New Britain and Bougainville) comprise Palaeogene and Quaternary volcanic arcs (Heads, 2001a).

Supplementary Figure 3. Forest zones as defined in the Forest Inventory Mapping System (Hammermaster and Saunders, 1995).

Supplementary Figure 4. The location of designated WMAs and National Parks (NPs) in PNG. 1 = Tonda WMA; 2 = Crater Mt WMA; 3 = Hunstein WMA; 4 = Kamiali WMA; 5 = Oia Mada Wara WMA; 6 = Lake Kutubu WMA; 7 = Lihir WMA; 8 = Bagiai WMA; 9 = Ranba WMA; 10 = Siwi Utame WMA; 11 = Poliki WMA; 12 = Garu WMA; 13 = Mojirau WMA; 14 = Ndrolowa WMA; 15 = Klampun WMA; 16 = Jimi Valley WMA; 17 = Iomare WMA; 18 = Lake Lavu WMA; 19 = Neiru WMA; 20 = McAdams NP; 21 = Crown Island WMA; 22 = Varirata NP; 23 = Mt. Nuserang WMA; 24 = Zo-Iomage WMA; 25 = Tavalo WMA; 26 = Mt Kaindi WMA; 27 = Sawataetae WMA; 28 = Mt Wilhelm NP; 29 = Balek WMA; 30 = Mt. Gahvisuka WMA; 31 = Hombareta WMA; 32 = Mt Susu WMA; 33 = Namanatabu WMA; 34 = Nanuk WMA
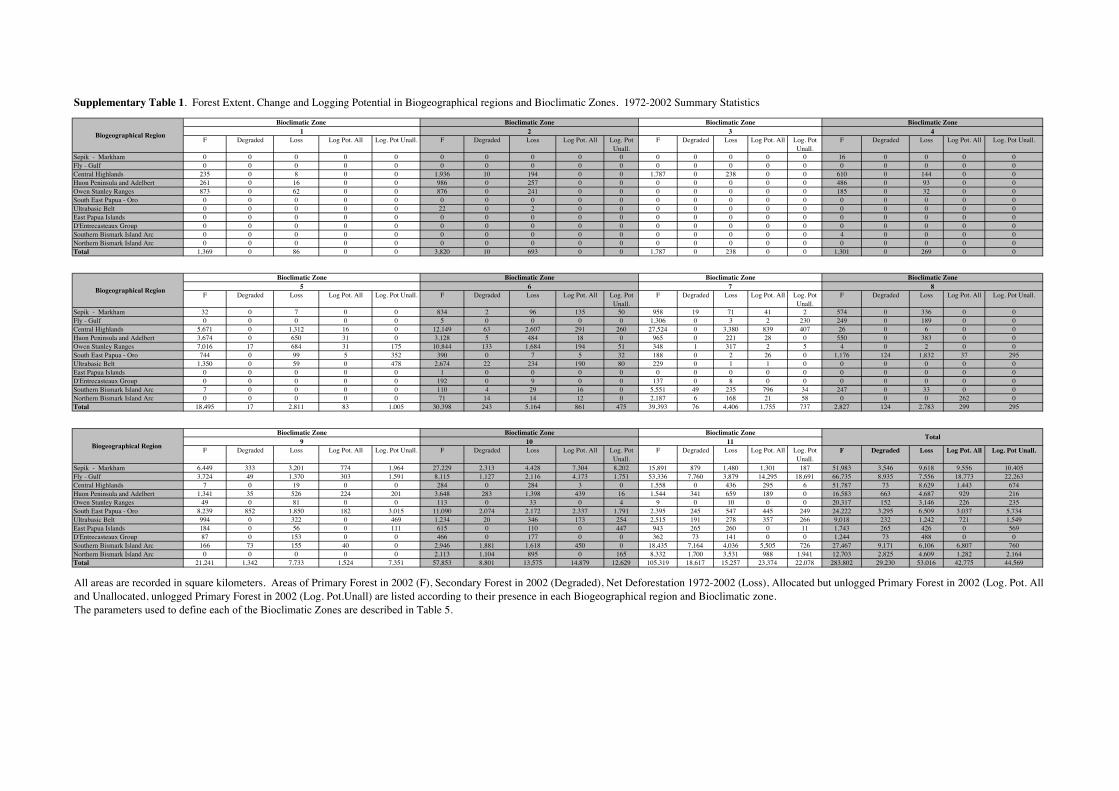
F Degraded Loss Log Pot. All Log. Pot Unall. F Degraded Loss Log Pot. All Log. Pot Unall.
F Degraded Loss Log Pot. All Log. Pot Unall.
F Degraded Loss Log Pot. All Log. Pot Unall.
Sepik - Markham 0 0 0 0 0 0 0 0 0 0 0 0 0 0 0 16 0 0 0 0Fly - Gulf 0 0 0 0 0 0 0 0 0 0 0 0 0 0 0 0 0 0 0 0Central Highlands 235 0 8 0 0 1,936 10 194 0 0 1,787 0 238 0 0 610 0 144 0 0Huon Peninsula and Adelbert 261 0 16 0 0 986 0 257 0 0 0 0 0 0 0 486 0 93 0 0Owen Stanley Ranges 873 0 62 0 0 876 0 241 0 0 0 0 0 0 0 185 0 32 0 0South East Papua - Oro 0 0 0 0 0 0 0 0 0 0 0 0 0 0 0 0 0 0 0 0Ultrabasic Belt 0 0 0 0 0 22 0 2 0 0 0 0 0 0 0 0 0 0 0 0East Papua Islands 0 0 0 0 0 0 0 0 0 0 0 0 0 0 0 0 0 0 0 0D'Entrecasteaux Group 0 0 0 0 0 0 0 0 0 0 0 0 0 0 0 0 0 0 0 0Southern Bismark Island Arc 0 0 0 0 0 0 0 0 0 0 0 0 0 0 0 4 0 0 0 0Northern Bismark Island Arc 0 0 0 0 0 0 0 0 0 0 0 0 0 0 0 0 0 0 0 0Total 1,369 0 86 0 0 3,820 10 693 0 0 1,787 0 238 0 0 1,301 0 269 0 0
F Degraded Loss Log Pot. All Log. Pot Unall. F Degraded Loss Log Pot. All Log. Pot Unall.
F Degraded Loss Log Pot. All Log. Pot Unall.
F Degraded Loss Log Pot. All Log. Pot Unall.
Sepik - Markham 32 0 7 0 0 834 2 96 135 50 958 19 71 41 2 574 0 336 0 0Fly - Gulf 0 0 0 0 0 5 0 0 0 0 1,306 0 3 2 230 249 0 189 0 0Central Highlands 5,671 0 1,312 16 0 12,149 63 2,607 291 260 27,524 0 3,380 839 407 26 0 6 0 0Huon Peninsula and Adelbert 3,674 0 650 31 0 3,128 5 484 18 0 965 0 221 28 0 550 0 383 0 0Owen Stanley Ranges 7,016 17 684 31 175 10,844 133 1,684 194 51 348 1 317 2 5 4 0 2 0 0South East Papua - Oro 744 0 99 5 352 390 0 7 5 32 188 0 2 26 0 1,176 124 1,832 37 295Ultrabasic Belt 1,350 0 59 0 478 2,674 22 234 190 80 229 0 1 1 0 0 0 0 0 0East Papua Islands 0 0 0 0 0 1 0 0 0 0 0 0 0 0 0 0 0 0 0 0D'Entrecasteaux Group 0 0 0 0 0 192 0 9 0 0 137 0 8 0 0 0 0 0 0 0Southern Bismark Island Arc 7 0 0 0 0 110 4 29 16 0 5,551 49 235 796 34 247 0 33 0 0Northern Bismark Island Arc 0 0 0 0 0 71 14 14 12 0 2,187 6 168 21 58 0 0 0 262 0Total 18,495 17 2,811 83 1,005 30,398 243 5,164 861 475 39,393 76 4,406 1,755 737 2,827 124 2,783 299 295
F Degraded Loss Log Pot. All Log. Pot Unall. F Degraded Loss Log Pot. All Log. Pot Unall.
F Degraded Loss Log Pot. All Log. Pot Unall.
F Degraded Loss Log Pot. All Log. Pot Unall.
Sepik - Markham 6,449 333 3,201 774 1,964 27,229 2,313 4,428 7,304 8,202 15,891 879 1,480 1,301 187 51,983 3,546 9,618 9,556 10,405Fly - Gulf 3,724 49 1,370 303 1,591 8,115 1,127 2,116 4,173 1,751 53,336 7,760 3,879 14,295 18,691 66,735 8,935 7,556 18,773 22,263Central Highlands 7 0 19 0 0 284 0 284 3 0 1,558 0 436 295 6 51,787 73 8,629 1,443 674Huon Peninsula and Adelbert 1,341 35 526 224 201 3,648 283 1,398 439 16 1,544 341 659 189 0 16,583 663 4,687 929 216Owen Stanley Ranges 49 0 81 0 0 113 0 33 0 4 9 0 10 0 0 20,317 152 3,146 226 235South East Papua - Oro 8,239 852 1,850 182 3,015 11,090 2,074 2,172 2,337 1,791 2,395 245 547 445 249 24,222 3,295 6,509 3,037 5,734Ultrabasic Belt 994 0 322 0 469 1,234 20 346 173 254 2,515 191 278 357 266 9,018 232 1,242 721 1,549East Papua Islands 184 0 56 0 111 615 0 110 0 447 943 265 260 0 11 1,743 265 426 0 569D'Entrecasteaux Group 87 0 153 0 0 466 0 177 0 0 362 73 141 0 0 1,244 73 488 0 0Southern Bismark Island Arc 166 73 155 40 0 2,946 1,881 1,618 450 0 18,435 7,164 4,036 5,505 726 27,467 9,171 6,106 6,807 760Northern Bismark Island Arc 0 0 0 0 0 2,113 1,104 895 0 165 8,332 1,700 3,531 988 1,941 12,703 2,825 4,609 1,282 2,164Total 21,241 1,342 7,733 1,524 7,351 57,853 8,801 13,575 14,879 12,629 105,319 18,617 15,257 23,374 22,078 283,802 29,230 53,016 42,775 44,569
Bioclimatic Zone Bioclimatic Zone Total9 10 11
Bioclimatic Zone Bioclimatic Zone Bioclimatic Zone5 6 7 8
Bioclimatic Zone Bioclimatic Zone1 2 3 4Biogeographical Region
Bioclimatic Zone
Biogeographical Region
Bioclimatic Zone
Biogeographical Region
Bioclimatic Zone
All areas are recorded in square kilometers. Areas of Primary Forest in 2002 (F), Secondary Forest in 2002 (Degraded), Net Deforestation 1972-2002 (Loss), Allocated but unlogged Primary Forest in 2002 (Log. Pot. Alland Unallocated, unlogged Primary Forest in 2002 (Log. Pot.Unall) are listed according to their presence in each Biogeographical region and Bioclimatic zone. The parameters used to define each of the Bioclimatic Zones are described in Table 5.
Bioclimatic Zone
Supplementary Table 1. Forest Extent, Change and Logging Potential in Biogeographical regions and Bioclimatic Zones. 1972-2002 Summary Statistics

Supplementary Table 2. The area of vegetation types and forest change (1972-2002) in PNG’s WMAs and NPs, ranked by size.
Name Total area (ha)
Total Rainforest area 2002
(ha)
Area of Rainforest
logged (ha) by 2002
Swamp Forest (ha)
2002
Mangrove (ha) 2002
Area converted
1972-2002(ha)
Rainforest change
%
Tonda WMA 608,505 0 0 0 6,477 0 0.0 Crater Mt WMA 269,020 255,306 0 0 0 8,860 3.4 Hunstein WMA 219,929 160,850 0 48,195 0 2,964 1.8 Kamiali WMA 28,353 23,064 0 1,539 49 2,393 9.4 Oia Mada Wara WMA 22,984 18,980 0 0 0 2,653 12.3 Lake Kutubu WMA 21,322 13,117 0 1,445 0 1,117 7.8 Lihir WMA 19,973 10,170 0 0 15 5,904 36.7 Bagiai WMA 17,001 11,966 0 0 0 3,259 21.4 Ranba WMA 13,612 5,144 0 0 0 14 0.3 Siwi Utame WMA 12,528 5,781 0 0 0 2,522 30.4 Poliki WMA 11,952 7,456 7,373 469 5 2,437 99.2 Garu WMA 7,798 5,357 3,251 974 0 898 66.3 Mojirau WMA 6,826 6,468 1,234 0 0 197 21.5 Ndrolowa WMA 5,690 1,689 0 1,277 745 573 25.3 Klampun WMA 5,121 4,311 0 0 0 320 6.9 Jimi Valley WMA 4,360 3,940 0 0 0 343 8.0 Iomare WMA 3,943 26 0 0 0 3,291 99.2 Lake Lavu WMA 2,711 2,009 0 163 0 190 8.6 Neiru WMA 2,414 525 0 8 1,531 0 0.0 McAdams NP 2,117 280 0 0 0 0 0.0 Crown Island WMA 1,395 1,324 0 0 0 0 0.0 Varirata NP 1,033 943 0 0 0 37 3.8 Mt. Nuserang WMA 1,024 900 0 0 0 112 11.1 Zo-Iomage WMA 942 600 0 0 0 161 21.2 Tavalo WMA 926 604 41 0 0 232 32.7 Mt Kaindi WMA 866 394 0 0 0 27 6.4 Sawataetae WMA 790 129 0 262 72 112 46.5 Mt Wilhelm NP 703 215 0 0 0 43 16.7 Balek WMA 577 406 0 0 0 137 25.2 Mt. Gahvisuka WMA 199 154 0 0 0 42 21.4 Hombareta WMA 149 52 52 0 0 63 100.0 Mt Susu WMA 119 0 0 0 0 0 0.0 Namanatabu WMA 55 5 0 0 0 17 77.3 Nanuk WMA 36 0 0 0 0 8 100.0 TOTAL AREA 1,294,969 542,166 11,951 54,332 8,892 38,927 8.8