Local productive systems planning tools for bioregional development
14
Gianni Scudo, Matteo Clementi, “Local productive systems planning tools for bioregional development”, In: Localizing urban food strategies. Farming cities and performing rurality. 7 th International Aesop Sustainable Food Planning Conference Proceedings, Torino, 7‐9 October 2015, edited by Giuseppe Cinà and Egidio Dansero, Torino, Politecnico di Torino, 2015, pp 526‐539. ISBN 978‐88‐8202‐060‐6 526 LOCAL PRODUCTIVE SYSTEMS PLANNING TOOLS FOR BIOREGIONAL DEVELOPMENT Gianni Scudo 1 , Matteo Clementi 2 Keywords: bioregion, food and energy integrated planning, renewable energies, energy efficiency. Abstract: The paper introduces to bioregion concept and describes territorial metabolic flows tools usefull to identify and evaluate strategies and appropriate actions to increase the eco‐efficiency of local productive systems. Bioregion concept recently re‐emerged involves also better eco‐efficiency conditions by directing production and consumption flows towards locally available resources use and therefore contributing to basic resources cycles closure. Tools presented support the application of the methodology Elar (Ecodynamic Land Register). In accordance with the bioregional paradigm, this methodology is used to assess the self‐sufficiency achievement of trans scalar territorial systems. This approach requires integrated measures effectiveness assessment, particularly with regard to energy use and food consumption categories. Therefore Elar can be considered one of the effective tools to support Food and Energy Integrated Plans (FEIP) development. Energy and material flows related to residential sector, food consumption, and private transport are considered. The method uses open‐source Geographic Information Systems (GIS) and is articulated in the following processing phases: 1) Locally defined territorial boundaries identification. 2) Renewable Local Energy Potential assessment ‐ Analysis of contextual conditions and local renewable energy potential. 3) Local Energy‐Matter Demand and Supply assessment for residential, agricultural, food and private transport activities. Aggregated impacts evaluation with environmental impact indicators ( NRE non‐renewable primary energy, Local Productive Land). 4) Local self‐sufficiency scenarios assessment based on best practices transfer, filtered on the basis of local factors mapped on the GIS (climate, use, existing buildings shape and technology). 1. Introduction Global agro‐food system contributes to about 30% of GHG ‐ Global Heating Gasses‐ emission (Tim Lang 2009), due mainly to long distance transport and detail purchasing by car. Bioregional approach (Sale K. 1985; Fanfani D. e Saragosa C. 2011), promotes transcalar Regional supply and demand chains where food and energy are grown, produced, sold and consumed within a certain territorial unit. In this paper we define a “bioregion” as the land required to achieve food and energy supply self‐ sufficiency over the long term and we describe how to use support tools to plan locally appropriate self –sufficiency strategies. The intensive use of locally available renewable resources reduces drastically the use of non renewable resources increasing eco efficiency of local systems in term of Non Renewable primary Energy/Renewable primary Energy ratio ( NRE/RE in MJ) and reducing environmental impact (for instance CO 2 eq emissions). The tools presented here promote an experimental tool for territorial metabolism planning called FEIP, (Food and Energy Integrated Plan). 1 Department of Architecture and Urban Studies, Politecnico di Milano, Milan, Italy, [email protected] 2 Department of Architecture and Urban Studies, Politecnico di Milano, Milan, Italy, [email protected]
Transcript of Local productive systems planning tools for bioregional development

Gianni Scudo, Matteo Clementi, “Local productive systems planning tools for bioregional development”, In: Localizing urban food strategies. Farming cities and performing rurality. 7th International Aesop Sustainable Food Planning Conference Proceedings, Torino, 7‐9 October 2015, edited by Giuseppe Cinà and Egidio Dansero, Torino, Politecnico di Torino, 2015, pp 526‐539. ISBN 978‐88‐8202‐060‐6
526
LOCAL PRODUCTIVE SYSTEMS PLANNING TOOLS FOR BIOREGIONAL DEVELOPMENT
Gianni Scudo1, Matteo Clementi2 Keywords: bioregion, food and energy integrated planning, renewable energies, energy efficiency.
Abstract: The paper introduces to bioregion concept and describes territorial metabolic flows tools usefull to identify and evaluate strategies and appropriate actions to increase the eco‐efficiency of local productive systems. Bioregion concept recently re‐emerged involves also better eco‐efficiency conditions by directing production and consumption flows towards locally available resources use and therefore contributing to basic resources cycles closure. Tools presented support the application of the methodology Elar (Ecodynamic Land Register). In accordance with the bioregional paradigm, this methodology is used to assess the self‐sufficiency achievement of trans scalar territorial systems. This approach requires integrated measures effectiveness assessment, particularly with regard to energy use and food consumption categories. Therefore Elar can be considered one of the effective tools to support Food and Energy Integrated Plans (FEIP) development. Energy and material flows related to residential sector, food consumption, and private transport are considered. The method uses open‐source Geographic Information Systems (GIS) and is articulated in the following processing phases: 1) Locally defined territorial boundaries identification. 2) Renewable Local Energy Potential assessment ‐ Analysis of contextual conditions and local
renewable energy potential. 3) Local Energy‐Matter Demand and Supply assessment for residential, agricultural, food and
private transport activities. Aggregated impacts evaluation with environmental impact indicators ( NRE non‐renewable primary energy, Local Productive Land).
4) Local self‐sufficiency scenarios assessment based on best practices transfer, filtered on the basis of local factors mapped on the GIS (climate, use, existing buildings shape and technology).
1. Introduction
Global agro‐food system contributes to about 30% of GHG ‐ Global Heating Gasses‐ emission (Tim Lang 2009), due mainly to long distance transport and detail purchasing by car. Bioregional approach (Sale K. 1985; Fanfani D. e Saragosa C. 2011), promotes transcalar Regional supply and demand chains where food and energy are grown, produced, sold and consumed within a certain territorial unit. In this paper we define a “bioregion” as the land required to achieve food and energy supply self‐sufficiency over the long term and we describe how to use support tools to plan locally appropriate self –sufficiency strategies. The intensive use of locally available renewable resources reduces drastically the use of non renewable resources increasing eco efficiency of local systems in term of Non Renewable primary Energy/Renewable primary Energy ratio ( NRE/RE in MJ) and reducing environmental impact (for instance CO2eq emissions). The tools presented here promote an experimental tool for territorial metabolism planning called FEIP, (Food and Energy Integrated Plan).
1 Department of Architecture and Urban Studies, Politecnico di Milano, Milan, Italy, [email protected] 2 Department of Architecture and Urban Studies, Politecnico di Milano, Milan, Italy, [email protected]

Gianni Scudo, Matteo Clementi, “Local productive systems planning tools for bioregional development”
7th International Aesop Sustainable Food Planning Conference Proceedings, Torino, 7‐9 October 2015 527
2. FEIP ‐ Food and Energy Integrated Plans
FEIP is an experimental (“ad hoc” defined) planning tool. The aim of FEIP is to promote integrated local agro‐food and energy systems able to give self sufficiency in food and a contribution to meet the energy demand for housing, transport and services, while providing anyway an adequate income from agriculture practices. FEIP stands for Food and Energy Integrated Plan. The fact that the term Food precedes that of Energy, has a specific meaning. It means that in self‐sufficiency scenarios, food sovereignty has to be guaranteed; namely strategies are oriented primarily to cover the local demand for food, the rest of the territory and wastes from agricultural production are used to cover the demand of the other categories, in particular housing and transport. FEIP is proposed as a tool which complements food planning in the energy oriented planning tools developed by Covenant of Mayors. The massive participation in the Covenant of Mayors has encouraged the development of initiatives towards energy efficiency and use of local renewable resources, directly involving individual mimunicipalities. The tools adopted in the covenant such as SEAP ‐ Sustainable Energy Action Plan ‐ are promoting GHG (Global Heating Gasses) emissions reductions activities in housing, transportation, and public facilities (at least 20%) (www.covenantofmayors.eu). The FEIP is proposed as a possible planning tool based on the data collected and the strategies adopted in the SEAP, that aims to achieve higher targets to reduce greenhouse gas emissions, integrating food consumption in the considered categories. It allows an integrated assessment of adoptable solutions starting from the need to ensure local self‐sufficiency for food and housing. It offers solutions to increase energy efficiency and the use of local renewables resources to achieve high levels of environmental sustainability and to increase the use of local workforce. In this experimental phase, which focuses on territory analysis and scenarios development tools implementation, a small territorial system has been chosen: the Albairate municipality in Milan County, within the South Milan Agricultural Park (PASM). Nevertheless the optimum scale for local self‐sufficiency effective strategies is generally more extensive, (Metropolitan Area, County, Region). FEIP is supported by the methodology Elar (Ecodynamic Land Register) (Clementi 2008) (Clementi, Scudo, 2009) (Scudo et al. 2014).
2.1 ELaR – Ecodynamic Land Register
In accordance with the bioregional paradigm, this methodology is used to assess the self‐sufficiency achievement of trans scalar territorial systems ‐ from the municipal to larger areas scales. This approach requires measures effectiveness integrated assessment, particularly with regard to energy use and food consumption categories. Therefore Elar can be considered one of the effective tools to support integrated food and energy plans development. Energy and material flows related to residential sector, food consumption, and private transport are considered. ELaR aims to highlight and rethink energy and materials flows which feed people activities through analysis carried out by open‐source Geographic Information Systems. It highlights the dynamic relations between energy and matter demand and local renewable potential which, in a self‐sufficient system, should necessarily be maintained in equilibrium. The local demand for energy and materials analyzes the consumption categories of housing, food and marginally of private transport; data are expressed in terms of general amount referred to the local context or in terms of per capita data. As already mentioned in the abstract the method is articulated in the following processing phases:
Gianni Scudo, Matteo Clementi, “Local productive systems planning tools for bioregional development”
7th International Aesop Sustainable Food Planning Conference Proceedings, Torino, 7‐9 October 2015 528
1) locally defined territorial boundaries identification. 2) Renewable Local Energy Potential assessment ‐ Analysis of contextual conditions and local
renewable energy potential. 3) Local Energy‐Matter Demand for residential, agricultural/food consumption and private
transport activities assessment. Aggregated impacts quantification through environmental impact indicators (Local productive land, NRE MJ non‐renewable primary energy).
4) Local self‐sufficiency scenarios assessment based on best practices transfer, filtered on the basis of local factors mapped on the GIS (climate, use, existing buildings shape and technology, and local agriculture practices).
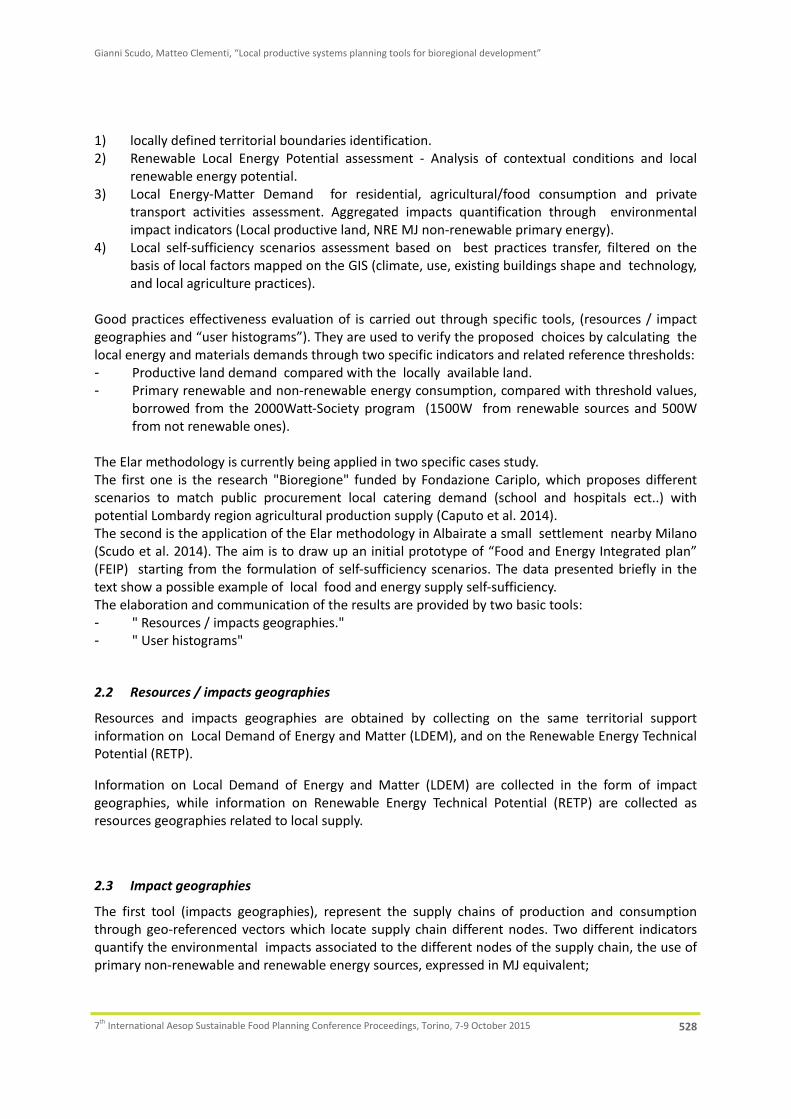
Good practices effectiveness evaluation of is carried out through specific tools, (resources / impact geographies and “user histograms”). They are used to verify the proposed choices by calculating the local energy and materials demands through two specific indicators and related reference thresholds: - Productive land demand compared with the locally available land. - Primary renewable and non‐renewable energy consumption, compared with threshold values,
borrowed from the 2000Watt‐Society program (1500W from renewable sources and 500W from not renewable ones).
The Elar methodology is currently being applied in two specific cases study. The first one is the research "Bioregione" funded by Fondazione Cariplo, which proposes different scenarios to match public procurement local catering demand (school and hospitals ect..) with potential Lombardy region agricultural production supply (Caputo et al. 2014). The second is the application of the Elar methodology in Albairate a small settlement nearby Milano (Scudo et al. 2014). The aim is to draw up an initial prototype of “Food and Energy Integrated plan” (FEIP) starting from the formulation of self‐sufficiency scenarios. The data presented briefly in the text show a possible example of local food and energy supply self‐sufficiency. The elaboration and communication of the results are provided by two basic tools: - " Resources / impacts geographies." - " User histograms"
2.2 Resources / impacts geographies
Resources and impacts geographies are obtained by collecting on the same territorial support information on Local Demand of Energy and Matter (LDEM), and on the Renewable Energy Technical Potential (RETP).
Information on Local Demand of Energy and Matter (LDEM) are collected in the form of impact geographies, while information on Renewable Energy Technical Potential (RETP) are collected as resources geographies related to local supply.
2.3 Impact geographies
The first tool (impacts geographies), represent the supply chains of production and consumption through geo‐referenced vectors which locate supply chain different nodes. Two different indicators quantify the environmental impacts associated to the different nodes of the supply chain, the use of primary non‐renewable and renewable energy sources, expressed in MJ equivalent;

Gianni Scudo, Matteo Clementi, “Local productive systems planning tools for bioregional development”
7th International Aesop Sustainable Food Planning Conference Proceedings, Torino, 7‐9 October 2015 529
Figure 1. Impact Geographies associated with the consumption of primary energy, concerning the Local Demand of Energy and Matter (LDEM) in Albairate. Mapped supply chains are representative of the scenario
1 presented in the results of this paper.
As example the following text presents the data associated with the supply chain of the bread , including the related accounting of non‐renewable energy sources.
Description of the supply chain Here is the brief description of the supply chain of bread. The mode for cultivation of wheat for flour is conventional (non‐organic). The territorial reference is international (intercontinental supply chains were not taken into account). The main steps of the supply chain can be summarized as follows: 1. wheat production in field ; 2. wheat transport to the mill; 3. flour grinded from wheat; 4. flour transport to the bakery ; 5. bread production; 6. bread transport to store or canteen.

Gianni Scudo, Matteo Clementi, “Local productive systems planning tools for bioregional development”
7th International Aesop Sustainable Food Planning Conference Proceedings, Torino, 7‐9 October 2015 530
Figure 2. Impact Geography concerning the consumption of non‐renewable primary energy for the
production of 1 kg of bread from wheat conventional agriculture.
Figure 3. Extract of the Impact Geography concerning the consumption of non‐renewable primary energy for the production of 1 kg of bread from wheat conventional agriculture.
Gianni Scudo, Matteo Clementi, “Local productive systems planning tools for bioregional development”
7th International Aesop Sustainable Food Planning Conference Proceedings, Torino, 7‐9 October 2015 531
2.4 Resources Geographies
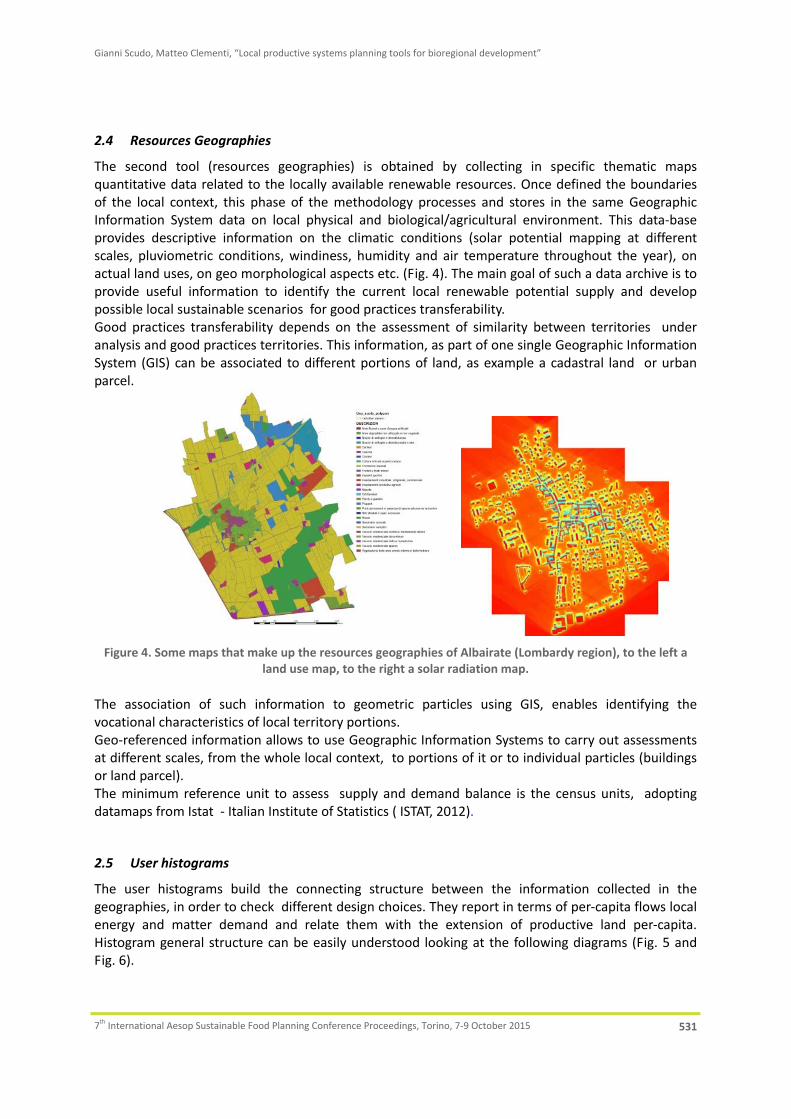
The second tool (resources geographies) is obtained by collecting in specific thematic maps quantitative data related to the locally available renewable resources. Once defined the boundaries of the local context, this phase of the methodology processes and stores in the same Geographic Information System data on local physical and biological/agricultural environment. This data‐base provides descriptive information on the climatic conditions (solar potential mapping at different scales, pluviometric conditions, windiness, humidity and air temperature throughout the year), on actual land uses, on geo morphological aspects etc. (Fig. 4). The main goal of such a data archive is to provide useful information to identify the current local renewable potential supply and develop possible local sustainable scenarios for good practices transferability. Good practices transferability depends on the assessment of similarity between territories under analysis and good practices territories. This information, as part of one single Geographic Information System (GIS) can be associated to different portions of land, as example a cadastral land or urban parcel.
Figure 4. Some maps that make up the resources geographies of Albairate (Lombardy region), to the left a
land use map, to the right a solar radiation map.
The association of such information to geometric particles using GIS, enables identifying the vocational characteristics of local territory portions. Geo‐referenced information allows to use Geographic Information Systems to carry out assessments at different scales, from the whole local context, to portions of it or to individual particles (buildings or land parcel). The minimum reference unit to assess supply and demand balance is the census units, adopting datamaps from Istat ‐ Italian Institute of Statistics ( ISTAT, 2012).
2.5 User histograms
The user histograms build the connecting structure between the information collected in the geographies, in order to check different design choices. They report in terms of per‐capita flows local energy and matter demand and relate them with the extension of productive land per‐capita. Histogram general structure can be easily understood looking at the following diagrams (Fig. 5 and Fig. 6).

Gianni Scudo, Matteo Clementi, “Local productive systems planning tools for bioregional development”
7th International Aesop Sustainable Food Planning Conference Proceedings, Torino, 7‐9 October 2015 532
Figure 5. General synthetic structure of a user histogram.
As shown by the arrows, the histogram describes energy and matter flows direction from the right to the left. Consequently, the right side of the histogram contains information on the resources supply (RETP Renewable Technical Potential, locally available), where information on local renewable supplies are given. The left side shows information about Local Demand of Energy and Matter (LDEM). The central part houses strategies as possible design choices in between local renewable energy/matter supply and demand (LSS Local Self‐sufficiency Scenario). They perform the main function to connect local demand and supply. The image below shows an example of user histogram describing the main components.
Figure 6. Example of user histogram describing the main components
The extreme left of the graph shows data of energy and matter demand expressed in terms of the adopted indicators, in this case the CO2 equivalent emissions. The quantities of energy and materials are aggregated into the consumption categories of housing, food and, marginally, of private transport, to compose the total amount of energy and impact per person (on the extreme left) (Fig. 6). Such option gives the possibility to compare the data with reference threshold values per person (15800MJ of primary non‐renewable energy ‐ NRE per year as sustainability goal suggested by the 2000W Society program (www.2000watt.ch), and between 1000 and 2000 kg of CO2 per year ).

Gianni Scudo, Matteo Clementi, “Local productive systems planning tools for bioregional development”
7th International Aesop Sustainable Food Planning Conference Proceedings, Torino, 7‐9 October 2015 533
The right part of the graph represents the local renewable supply; it shows the extension of the productive surfaces in the local context, expressed in square meters per person . The productive surfaces are intended to be the productive portions of land for agriculture and forestry, as well as the built‐up portions showing relevant features such as high solar vocation surfaces. The far right part of the histogram brings together the extensions of productive land per capita identifying the amount of productive land available. The different colors refer to the extension of productive land available per person (darker color) and the extension of the available productive land interested by the application of good practices assumed in the scenario (Fig. 6). The structure of information allows in the design phase to operate a useful and immediate comparison between productive land necessary for local self‐sufficiency and land actually available. Such condition of immediate comparison drives the design choices among the good practices, in order to find out the ones more suitable to the real conditions of the territory.
3. Scenarios
In this part the data for the entire municipal area are briefly reported; they are related to housing, food and private transport. The structure of the information in Elar enable further scaling. Indeed evaluation can be made for each census section, so as to take better account of buildings geometry and age. The cost of reducing the energy in existing buildings may vary depending on the geometry and age of the buildings (this information is mapped in the resources geographies database). To assess food requirements, age and number of persons per census section are considered. (ISTAT, 2012). To assess different inhabitants mobility attitudes Istat data on daily moves inside and outside the municipal boundaries are used. The results proposed in this text refer to the following scenarios: 1. Current status, no use of local renewable sources, full import of all resources. 2. Current demand of energy and materials, exclusive use of local resources. 3. Strategies for energy and material efficiency and exclusive use of locally available resources.
3.1 Scenario 1: Current state
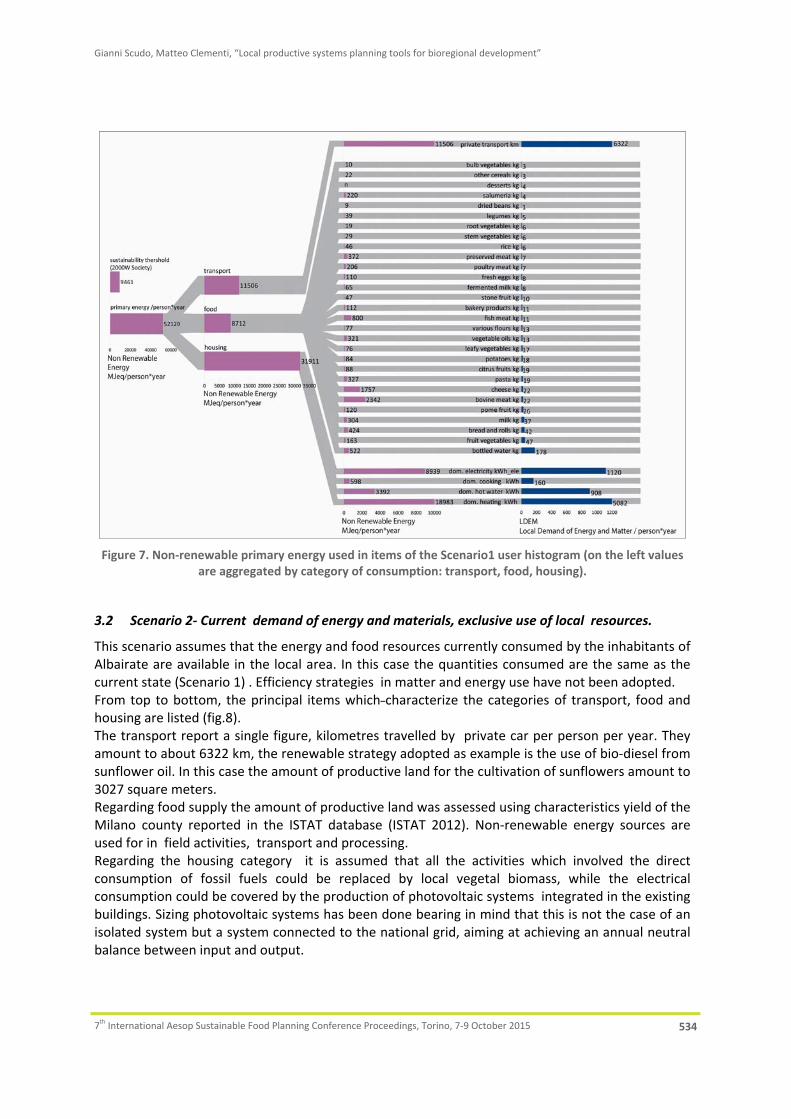
The histogram presented in the diagram shows the non‐renewable primary energy concerning the main items considered by the user‐histogram. The graph shows from top to bottom the categories of private transport, food and housing. When the data in the user histogram are associated with a single indicator, (as in fig.7 the primary non‐renewable energy) the values of different items can be added up for each category (middle graph), and then aggregated to constitute the total value per person. This option allows to check how much the values emerged in the case study differ from the bench mark sustainability values. In this case, the total amount of non‐renewable primary energy consumed per person annually measures 52129MJeq, more than five times the sustainability value proposed by the Swiss community research project 2000 Watt‐Society. In particular, housing is the mainly responsible of this very high value by weighing 61.2% of the total, followed by private transport (22.1%) and food consumption (16.7%).
Gianni Scudo, Matteo Clementi, “Local productive systems planning tools for bioregional development”
7th International Aesop Sustainable Food Planning Conference Proceedings, Torino, 7‐9 October 2015 534
Figure 7. Non‐renewable primary energy used in items of the Scenario1 user histogram (on the left values are aggregated by category of consumption: transport, food, housing).
3.2 Scenario 2‐ Current demand of energy and materials, exclusive use of local resources.
This scenario assumes that the energy and food resources currently consumed by the inhabitants of Albairate are available in the local area. In this case the quantities consumed are the same as the current state (Scenario 1) . Efficiency strategies in matter and energy use have not been adopted. From top to bottom, the principal items which characterize the categories of transport, food and housing are listed (fig.8). The transport report a single figure, kilometres travelled by private car per person per year. They amount to about 6322 km, the renewable strategy adopted as example is the use of bio‐diesel from sunflower oil. In this case the amount of productive land for the cultivation of sunflowers amount to 3027 square meters. Regarding food supply the amount of productive land was assessed using characteristics yield of the Milano county reported in the ISTAT database (ISTAT 2012). Non‐renewable energy sources are used for in field activities, transport and processing. Regarding the housing category it is assumed that all the activities which involved the direct consumption of fossil fuels could be replaced by local vegetal biomass, while the electrical consumption could be covered by the production of photovoltaic systems integrated in the existing buildings. Sizing photovoltaic systems has been done bearing in mind that this is not the case of an isolated system but a system connected to the national grid, aiming at achieving an annual neutral balance between input and output.

Gianni Scudo, Matteo Clementi, “Local productive systems planning tools for bioregional development”
7th International Aesop Sustainable Food Planning Conference Proceedings, Torino, 7‐9 October 2015 535
In this case the total extent of productive land would amount to 8852m2, of which 3624 m2 relative to housing (41%), 3027m2 to transport (34%) and 2200 m2 to food supply (25%). In the standpoint of a possible Food and Energy Integrated Plan the productive land locally available, (3047 m2/per person) would be able to cover the total food requirements and a part of the energy needs of dwellings. The amount of the productive land required exceed about 2.5 times the extension of the available land. Taking as bioregional area of reference the Lombardy region, the extension of productive land per capita would amount to 1243 m2 of productive land / person. In this case the amount of needed productive land in Scenario 2 would exceed 7.12 times the size of the available land per person. In Italy the amount of productive land per person amounts to 2810 m2 (ISTAT, 2012).
Figure 8. Extension of productive land per person (in orange) associated with the various items in the user histogram of Scenario2 (on the right values are aggregated by consumption category : transport, food and
housing).
3.3 Scenarios 3 ‐ Strategies for energy and material efficiency and exclusive use of locally available resources.
This paragraph on efficiency strategies lists strategies for each groups. It shows the impact on the extension of the productive land needed for each set of solutions ( house, feeding and transport). Housing The solutions concerning the heating item include strategies related to the energy upgrading of the existing buildings get an average consumption for heating around 30kwh /m². Whereas the per

Gianni Scudo, Matteo Clementi, “Local productive systems planning tools for bioregional development”
7th International Aesop Sustainable Food Planning Conference Proceedings, Torino, 7‐9 October 2015 536
capita housing area amounts to 37,66m², consumption per square meter would amount to 5082KWh / 37,66 = 135kWh / m², the reduction scenario to 30 kWh per m² would involve a consumption per capita of 30 * 37, 66 = 1130kWh, less than four times the actual consumption. The use of water flow reducers would lead to a reduction of 10% of the amount of energy for hot water. The amount of energy for cooking is left unchanged. Concerning electricity a consumption reduction by about 40% is assumed, due to the use of more efficient appliances and artificial LED Lighting. The electricity consumption per capita would decrease from 1,120 kWh to 672kWh / person. The amount of productive needed land would be reduced in total by 29.3% (6258mq) and considering the housing category by 71.57% (1030mq). The extension of the land needed would exceed 2,05 times the productive land actually available.
Figure 9. Annual energy consumption per person and the relative amount of productive land associated with the housing category in Scenario 3 – housing.
Private Transportation The second most impacting category is the private mobility. Incentives for carpooling have been chosen to reduce fuel consumption, a reduction by about 30% of equivalent kilometres per person has been assumed. A value of 6322km / person*year has decreased to 4425km. In the case of productive land accounting, using the same technology assumed in scenario 2 (biodiesel from sunflower oil), the total value relative to productive land needed exceeds 1.75 times the amount of land available.
Figure 10. Kilometers traveled annually per person and relative amount of productive land associated with
the category of private transport in Scenario 3. Feeding 1

Gianni Scudo, Matteo Clementi, “Local productive systems planning tools for bioregional development”
7th International Aesop Sustainable Food Planning Conference Proceedings, Torino, 7‐9 October 2015 537
This strategy assumes a change in meat diet with exclusive use of poultry meat. Elimination of bottled water consumption (recording a reduction of 5.99% of the primary non‐renewable energy related to feeding), this strategy does not affect on the amount of productive land. Changing the amount of red meat (beef and pork) with a similar amount of legumes in terms of protein content. This contribution, combined with the previous strategy, leads to a reduction of productive land of 17.42% on the total extent and 42.38% on the extension related to food; the amount of productive land is reduced from 2200 m2 per person to 1268 m2. Halving protein intake by dairy products, and compensating with legumes , leads to a reduction of primary energy use of feeding equal to 49.63%. As it regards the productive land, the total extent is reduced by 21.09%, equal to 4221 m2 / person. The productive land useful to produce the food consumed in a year amounts to 1,072 square meters against the previous 2200, leading to a partial reduction of 51.27%. In this case, the distance from the reference edge or 3047 m2 is reduced , the value exceeds 1.39 times the amount of available productive land.
Figure 11. Annual food consumption per person and the relative amount of productive land associated with the category of feeding in Scenario 3 – Feeding 1.
Feeding 2. Nearly Vegan diet In case of nearly vegan diet, the replacement of all protein intake from animal‐derived foods with vegetable derived foods (legumes) is assumed, while maintaining the same protein intake. To compensate the caloric intake the amount of cereal products was increased (the consumption of fish has remained unchanged, it involves 3.4% of primary energy consumption). Compared to the previous scenario, the partial reduction of primary non‐renewable energy on the single category of Food amounts to 24.72% (from 4388 to 3303MJeq / person). The area of productive land is further reduced by 4.94% from 4221 m2 to 4013 m2
, (the productive land related to food category decreases from 1072 m2 to 864 m2
, 19.45% reduction of productive land). In this

Gianni Scudo, Matteo Clementi, “Local productive systems planning tools for bioregional development”
7th International Aesop Sustainable Food Planning Conference Proceedings, Torino, 7‐9 October 2015 538
last case, the distance from the reference limit value is reduced to 131.7%. The amount of land associated with each category is 1031 m2 for housing, 864 for food and 2119 for transport.
Figure 12. Annual food consumption per person and the relative amount of productive land associated with the category of feeding in Scenario 3 ‐ Feeding 2.
4. Conclusions
The results presented in this paper as an example, demonstrates the suitability of the methodology for the integrated assessment of the main consumption categories (housing, feeding and transport) in a limited area, a small sample of territory. Future developments of the work will include the application of Elar in wider areas, and the integration of new categories such as public services. It will be necessary to expand the set of best practices, enriching it with various case studies related to different climatic conditions and to refine the procedure of the mobility assessment. Further investigation will concern the integration of economic indicators such as local workforce to compare the amount of productive land and use of non‐renewable energy sources with the amount of man‐hours locally activated.
5. References
Caputo P., Ducoli C., Clementi M., 2014. Strategies and Tools for Eco‐Efficient Local Food Supply Scenarios. In: Sustainability 6, pp 631‐651, MDPI.
Clementi M. , 2008. ELaR, Ecodynamic Land Register. A proposal to assess the “strong sustainability” of design alternatives according to the local context condition. In: World Renewable Energy Congress X and Exhibition ‐ Conference, Proceeding, pp. 861/866, Glasgow.

Gianni Scudo, Matteo Clementi, “Local productive systems planning tools for bioregional development”
7th International Aesop Sustainable Food Planning Conference Proceedings, Torino, 7‐9 October 2015 539
Clementi M., Scudo G., 2009. Ecodynamic Land Register ‐ Current development level of the tool in Renewables in a changing climate. From nano to urban scale. CISBAT 2009‐ Conference Proceedings, Editor EPFL, 2009, pp. 415/420, Lausanne.
Fanfani D., Saragosa C., 2011. Il bioregionalismo nelle esperienze italiane ed europee. In: Il Progetto Sostenibile, n.29, September.
ISTAT, Italian National Institute of Statistics, 2012. Data warehouse del 6° Censimento generale dell’agricoltura. Available at <http://dati‐censimentoagricoltura.istat.it>.
Lang T., Barling D., Caraher M., 2009. Food Policy – Integrating Health, Environment & Society. Oxford Univ. Press.
Scudo G., Caputo P, Clementi M., 2014. Metodi e strumenti per l'elaborazione di scenari di autosostenibilità nel progetto locale. In: Il progetto di territorio, oltre la città diffusa verso la bioregione, edited by Giorgio Ferraresi, Maggioli Editore.
Sale K., 1985. Dwellers in the Land. The Bioregional Vision. Sierra Club Books.