85th Annual Conference of the Agricultural Economics...
22
1 85th Annual Conference of the Agricultural Economics Society Warwick University 18 ‐ 20 April 2011 On‐Farm and Off‐Farm Returns to Education among Farm Operators in Northern Ireland Michael T Wallace School of Agriculture, Food Science and Veterinary Medicine University College Dublin Belfield Dublin 4 Email: [email protected] Claire G Jack Agricultural and Food Economics Division Agri‐Food and Biosciences Institute Newforge Lane Belfast BT9 5PX Email: [email protected] Copyright 2011 by M. Wallace and C Jack. All rights reserved. Readers may make verbatim copies of this document for non‐commercial purposes by any means, provided that this copyright notice appears on all such copies. Abstract This paper estimates returns to education for a sample of farm operators in Northern Ireland. The analysis examines the relationship between education and on-farm and off-farm labour incomes. Human capital earnings functions are estimated to identify the marginal return to education measured as years of schooling as well as the qualification level attained. Extending to a structural model, the methodology controls for the endogeneity of education in the earnings function and potential selection bias associated with off-farm labour market participation. In off-farm employment, the analysis shows that returns to education are of the order of between 6% and 9% for each additional year of schooling. However, on-farm earnings were not found to be significantly related to years of education, although the analysis does identify a significant on-farm return to an agricultural qualification. Keywords and JEL codes : J24 ‐ Human Capital; J22 ‐ Time Allocation and Labor Supply; J43 ‐ Agricultural Labor Markets; J31 ‐ Wage Level
Transcript of 85th Annual Conference of the Agricultural Economics...
1
85th Annual Conference of the Agricultural Economics Society
Warwick University
18 ‐ 20 April 2011
On‐Farm and Off‐Farm Returns to Education among Farm Operators in Northern Ireland
Michael T Wallace School of Agriculture, Food Science and Veterinary Medicine
University College Dublin Belfield Dublin 4
Email: [email protected]
Claire G Jack Agricultural and Food Economics Division
Agri‐Food and Biosciences Institute Newforge Lane
Belfast BT9 5PX
Email: [email protected]
Copyright 2011 by M. Wallace and C Jack. All rights reserved. Readers may make verbatim copies of this document for non‐commercial purposes by any means, provided that this copyright notice appears on all such copies.
Abstract This paper estimates returns to education for a sample of farm operators in Northern Ireland. The analysis examines the relationship between education and on-farm and off-farm labour incomes. Human capital earnings functions are estimated to identify the marginal return to education measured as years of schooling as well as the qualification level attained. Extending to a structural model, the methodology controls for the endogeneity of education in the earnings function and potential selection bias associated with off-farm labour market participation. In off-farm employment, the analysis shows that returns to education are of the order of between 6% and 9% for each additional year of schooling. However, on-farm earnings were not found to be significantly related to years of education, although the analysis does identify a significant on-farm return to an agricultural qualification.
Keywords and JEL codes: J24 ‐ Human Capital; J22 ‐ Time Allocation and Labor Supply; J43 ‐ Agricultural Labor Markets; J31 ‐ Wage Level
2
On-Farm and Off-Farm Returns to Education among Farm Operators in Northern Ireland
Michael T Wallace and Claire G Jack
1. Introduction Education is central to the formation of human capital (Schultz, 1960) and the accumulation of human capital is considered to be an essential contributor to the long-run economic growth of countries (Romer, 1994). Accordingly, advanced economies have implemented policies to increase levels of educational attainment of their populations and this has been reflected, most notably, in the continued expansion of higher education systems. Within the UK, since the early 1970s, there has been a significant increase in the number of people obtaining third level educational qualifications. In more recent times, government policies, (including the White Paper issued in early 2003), have pushed for continued expansion of the further and higher education sectors in order to meet rising skill needs; this drive was reiterated in the UK government’s goal of fifty per cent participation in higher education among the 18-30 age cohort by 2010 (Department of Education and Skills, 2003).
However, in contrast with this wider picture, males from farming backgrounds have tended to have fewer secondary and tertiary qualifications compared to the wider male population (Gasson, 1998). The relatively low levels of educational attainment among farm operators may be a concern to policymakers. Firstly, the changing nature of global agriculture, from a market and policy perspective, increasingly requires farm families to adopt new technologies and integrate them into their farm businesses (Huffman and Orazem, 2004). Those with higher levels of skills may be better equipped to succeed in the globally competitive and volatile environment that characterises modern commercial agriculture. Secondly faced with declining real farm incomes, many farm operators are actively seeking off-farm employment. In this context, educational attainment is important for individuals in determining their potential labour market participation and ultimately their wage levels.
Card (1999) provides a review of international studies on returns to education among individuals in employee jobs. He concludes that the research evidence for investing in education appears decisive: better educated individuals in the labour force earn higher wages and experience less unemployment than their less educated counterparts thus demonstrating strong financial returns to investing in education. General population studies are useful but they do not indicate the possible variation in returns to schooling among different groups within the population. For example, the thinness of rural labour markets (in terms of the range and diversity of jobs) when coupled with spatial mobility constraints may contribute to a rural/urban pay gap (Vera-Toscano et al. 2004; LeClere, 1991) and spatial heterogeneity in returns to schooling. However, there are very few studies that specifically estimate returns to education for farm or rural households. Rare examples include Goetz and Rupasingha (2004) who compared returns to education in rural and urban areas in the USA, and Taylor and Yunez-Naude (2000) and Jolliffe (2004) who examined on-farm and off-farm returns to schooling in Mexico and Ghana, respectively.
3
The educational choices of future farm operators are a function of their expectations about labour allocation to farm and non-farm activities. For example, it is likely that farm successors make their educational choices at the same time as choosing to enter farming as a full-time or part-time career. If it is perceived that returns to education are lower in farming than in the labour market, the equilibrium will be one where those planning to farm full-time acquire less education than those who envisage working off-farm. From a policy perspective, research into these decision making processes should enhance understanding of farm household behaviour and the processes of structural adjustment in agriculture.
The objective of this paper is to estimate the on-farm and off-farm (labour market) returns to education and qualifications for a sample of farm operators in Northern Ireland (NI). The key education choice variable is ‘years of schooling’ and the analysis will attempt to estimate the marginal gain in earnings (on-farm and off-farm) associated with additional schooling. Recognising that certification is often more important than years of education, the analysis also explores the returns to specific qualifications (e.g. degree level, agricultural qualification, etc). The final part of the analysis extends to a structural model that explicitly recognises the joint nature of education and labour supply decisions.
The structure of the remainder of the paper is as follows. A review of the literature is presented in section 2. Section 3 outlines the theoretical framework underpinning the analysis. Section 4 describes the data sources and the empirical specifications employed. The results of the analysis are presented in section 5, with the principal conclusions reported in section 6.
2. Background The contemporary theory of human capital has its origins in the work of Schultz, (1960) and Becker (1964) and postulates that the positive correlation between education and earnings is to due to productivity enhancing effect of education. Better trained workers are considered to be more skilled and productive than less trained workers justifying their higher wages. Becker (1964) presents a model where individuals choose their level of education within the context of an optimisation framework. The return to an incremental year of education comprises the expected additional earnings attributable to that extra schooling less the pecuniary and non-pecuniary costs associated with the extra schooling.
Using US Census data, Mincer (1974) conducted one of the first empirical analyses of Becker’s theory. Mincer’s human capital earnings function (HCEF) incorporates post-schooling human capital accumulation through job experience. The natural log of individual wage rate is expressed as a function of years of schooling and quadratic terms in years of experience. The estimated regression coefficient for the schooling variable provides a measure of the marginal internal rate of return to education. The Mincer HCEF has provided the framework for a large number of studies on returns to education. Reviews of this literature are provided by Trostel et al. (2002) and Card (1999) In one often cited study using data for the United Kingdom, Harmon and Walker (1995) estimated returns to education of between 6% and 15% per year of schooling for male employees.
An alternative theory of the correlation between education and earnings was proposed by Spence (1973). This theory, known as job market signaling, suggests
4
that earnings may increase in response to education not just because of the effect on productivity but also because education may act as a signal of productivity. In the presence of asymmetric information, employers, believing that education is associated with productivity, may screen workers based on their education and pay higher wage rates to the more educated. Consequently, the labour market will be characterised by a separating equilibrium where higher productivity individuals choose higher levels of education than lower productivity workers and earn correspondingly higher wages (Chevalier et al. 2004).
One test of the signaling theory compares levels of education and returns to education for employees and self-employed. Under the signaling theory, individuals who plan to become self-employed have less incentive to invest in education as they will not benefit from any signaling value of education. Hence, the return to education for this group should only reflect productivity while the returns for employees reflect both the human capital and signaling values of education. Using this approach, Brown and Sessions (1999) find evidence to support the signaling theory, with higher levels of education and returns for employees than for the self-employed in Italy. Similarly, using UK data Chevalier et al. (2004) found that the signaling value of education was of the order of 1.4% for men and 2.5% for women. This equated to between 20% and 25% of the overall return to education estimated for employees in their data sample.
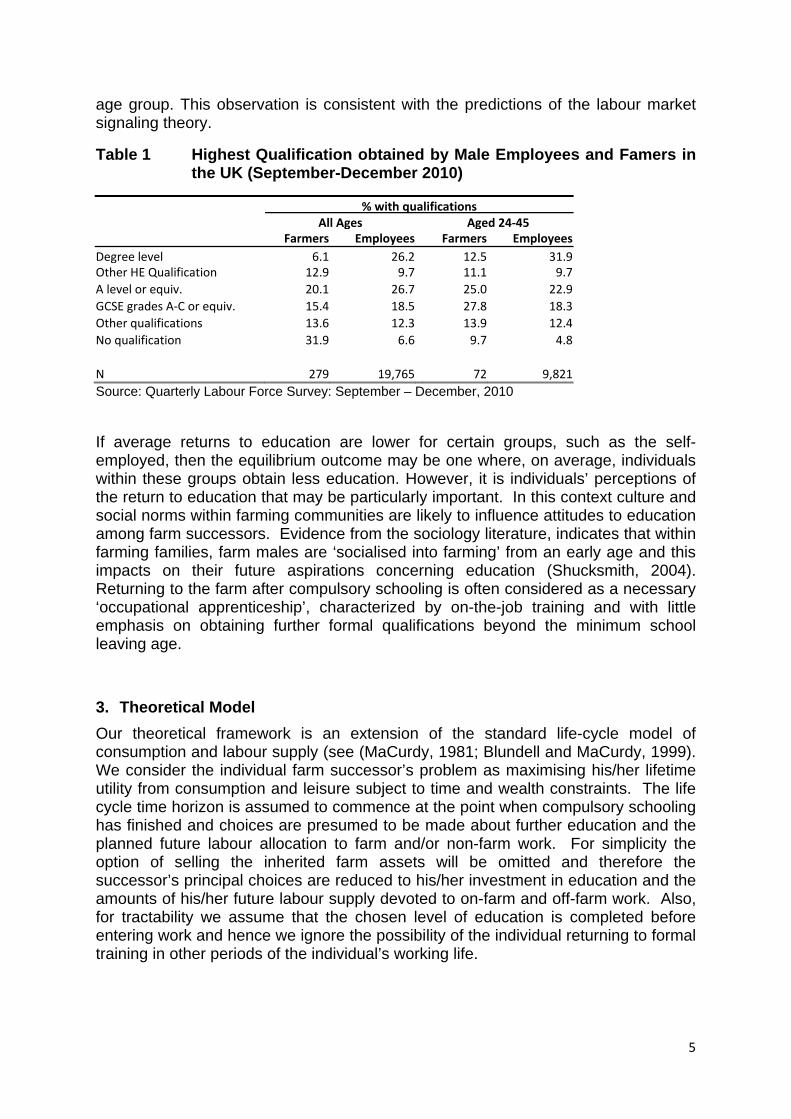
Most of the research evidence on returns to education of farmers has been obtained from production efficiency studies (Huffman, 2001). Welch (1970) concluded that education contributes to production efficiency through an ‘allocative effect’ and a ‘worker effect’. The worker effect comprised the effect of education on technical efficiency, where a more educated worker has a higher level of productivity; producing more output from a given bundle of resources. The allocative effect is concerned with the ability of individuals to assimilate and analyse information in order to make profit maximising choices among alternative courses of action. Thus, farmers’ education has the potential to enhance agricultural production as reflected in production and/or profit functions. Huffman (2001) and Lockheed et al. (1980) provide reviews of the research evidence on the relationship between education and farm efficiency. They conclude that most studies have found a positive and usually significant correlation between education and production efficiency. However, Huffman (2001) argues that in a static environment (political, economic, technical), accumulated experience may be a better investment than schooling, while in a more rapidly changing environment formal schooling is more valuable since it may facilitate improved skills in information assimilation and analysis that are needed in more dynamic business setting. Gasson (1998) in a review of survey evidence commented that farmers, on average, have lower levels of educational attainment than other groups in the UK population. This conclusion appears to be confirmed in more recent UK Labour Force Survey data (see Table 1). Compared to males in employee jobs, farmers, as a group, are much less likely to have a degree and much more likely to have no qualifications. There may of course be differences in the age distribution of both groups and for this reason data are also provided for the sample cohort aged between 24 and 45 years. A lower proportion of farmers in this younger age cohort are without qualifications, however, the attainment gap still remains compared to male employees in the same
5
age group. This observation is consistent with the predictions of the labour market signaling theory.
If average returns to education are lower for certain groups, such as the self-employed, then the equilibrium outcome may be one where, on average, individuals within these groups obtain less education. However, it is individuals’ perceptions of the return to education that may be particularly important. In this context culture and social norms within farming communities are likely to influence attitudes to education among farm successors. Evidence from the sociology literature, indicates that within farming families, farm males are ‘socialised into farming’ from an early age and this impacts on their future aspirations concerning education (Shucksmith, 2004). Returning to the farm after compulsory schooling is often considered as a necessary ‘occupational apprenticeship’, characterized by on-the-job training and with little emphasis on obtaining further formal qualifications beyond the minimum school leaving age.
3. Theoretical Model Our theoretical framework is an extension of the standard life-cycle model of consumption and labour supply (see (MaCurdy, 1981; Blundell and MaCurdy, 1999). We consider the individual farm successor’s problem as maximising his/her lifetime utility from consumption and leisure subject to time and wealth constraints. The life cycle time horizon is assumed to commence at the point when compulsory schooling has finished and choices are presumed to be made about further education and the planned future labour allocation to farm and/or non-farm work. For simplicity the option of selling the inherited farm assets will be omitted and therefore the successor’s principal choices are reduced to his/her investment in education and the amounts of his/her future labour supply devoted to on-farm and off-farm work. Also, for tractability we assume that the chosen level of education is completed before entering work and hence we ignore the possibility of the individual returning to formal training in other periods of the individual’s working life.
Table 1 Highest Qualification obtained by Male Employees and Famers in the UK (September-December 2010)
% with qualificationsAll Ages Aged 24‐45
Farmers Employees Farmers Employees Degree level 6.1 26.2 12.5 31.9 Other HE Qualification 12.9 9.7 11.1 9.7 A level or equiv. 20.1 26.7 25.0 22.9 GCSE grades A‐C or equiv. 15.4 18.5 27.8 18.3 Other qualifications 13.6 12.3 13.9 12.4 No qualification 31.9 6.6 9.7 4.8
N 279 19,765 72 9,821 Source: Quarterly Labour Force Survey: September – December, 2010
6
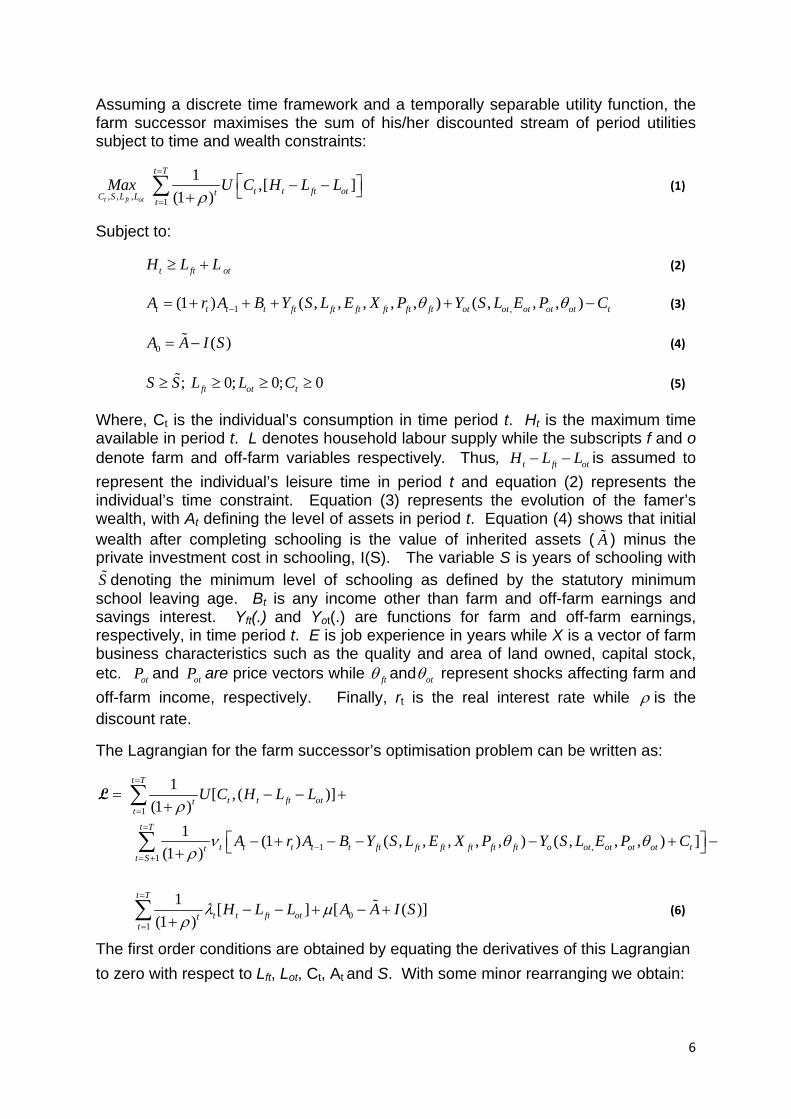
Assuming a discrete time framework and a temporally separable utility function, the farm successor maximises the sum of his/her discounted stream of period utilities subject to time and wealth constraints:
, , , 1
1 ,[ ](1 )t ft ot
t T
t t ft ottC S L L tMax U C H L L
ρ
=
=
⎡ ⎤− − ⎦⎣+∑ (1)
Subject to:
t ft otH L L≥ + (2)
1 ,(1 ) ( , , , , , ) ( , , , ) t t t t ft ft ft ft ft ft ot ot ot ot ot tA r A B Y S L E X P Y S L E P Cθ θ−= + + + + − (3)
0 ( ) A A I S= − (4)
; 0; 0; 0ft ot tS S L L C≥ ≥ ≥ ≥ (5)
Where, Ct is the individual’s consumption in time period t. Ht is the maximum time available in period t. L denotes household labour supply while the subscripts f and o denote farm and off-farm variables respectively. Thus, t ft otH L L− − is assumed to represent the individual’s leisure time in period t and equation (2) represents the individual’s time constraint. Equation (3) represents the evolution of the famer’s wealth, with At defining the level of assets in period t. Equation (4) shows that initial wealth after completing schooling is the value of inherited assets ( A ) minus the private investment cost in schooling, I(S). The variable S is years of schooling with S denoting the minimum level of schooling as defined by the statutory minimum school leaving age. Bt is any income other than farm and off-farm earnings and savings interest. Yft(.) and Yot(.) are functions for farm and off-farm earnings, respectively, in time period t. E is job experience in years while X is a vector of farm business characteristics such as the quality and area of land owned, capital stock, etc. otP and otP are price vectors while ftθ and otθ represent shocks affecting farm and off-farm income, respectively. Finally, rt is the real interest rate while ρ is the discount rate.
The Lagrangian for the farm successor’s optimisation problem can be written as:
1
1 ,1
1 [ , ( )](1 )
1 (1 ) ( , , , , , ) ( , , , ) ](1 )
t T
t t ft ottt
t T
t t t t t ft ft ft ft ft ft o ot ot ot ot ttt S
U C H L L
A r A B Y S L E X P Y S L E P C
ρ
ν θ θρ
=
=
=
−= +
= − − ++
⎡ ⎤− + − − − + −⎣ ⎦+
∑
∑
L
01
1 [ ] [ ( )](1 )
t T
t t ft ottt
H L L A A I Sλ μρ
=
=
− − + − ++∑
(6)
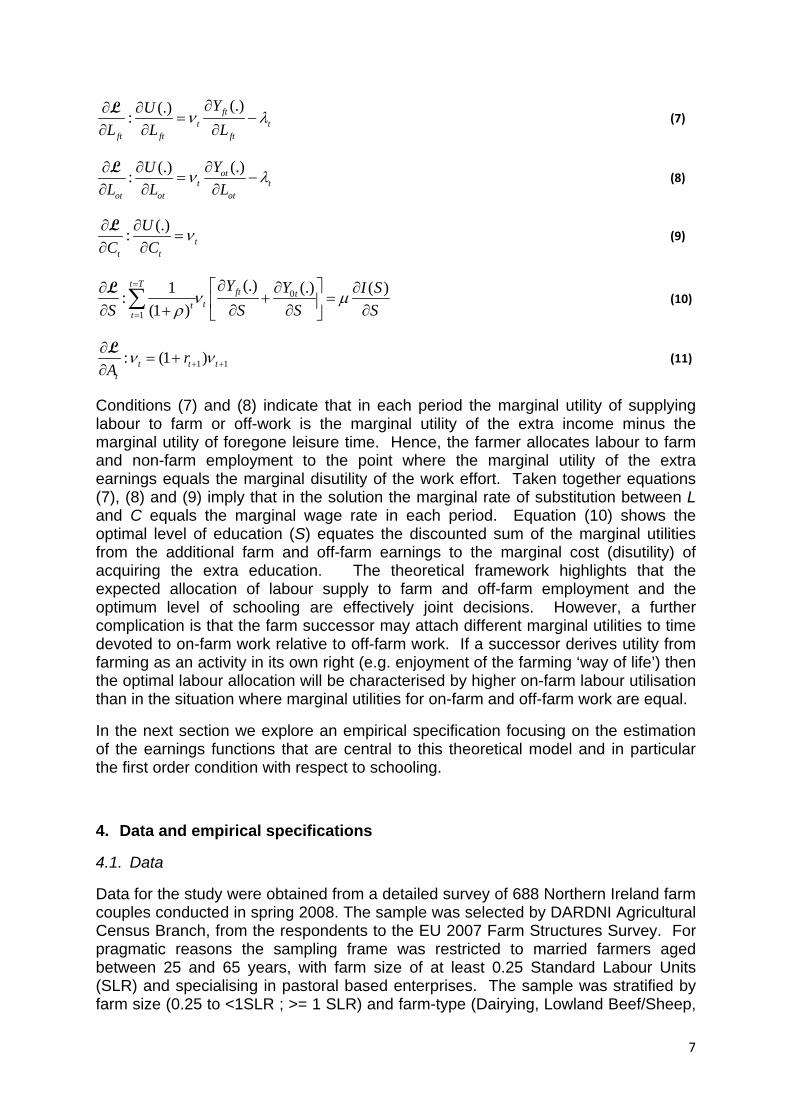
The first order conditions are obtained by equating the derivatives of this Lagrangian to zero with respect to Lft, Lot, Ct, At and S. With some minor rearranging we obtain:
7
(.)(.): ftt t
ft ft ft
YUL L L
ν λ∂∂ ∂
= −∂ ∂ ∂L
(7)
(.)(.): ott t
ot ot ot
YUL L L
ν λ∂∂ ∂= −
∂ ∂ ∂L
(8)
(.): tt t
UC C
ν∂ ∂=
∂ ∂L
(9)
0
1
(.) (.)1 ( ):(1 )
t Tft t
ttt
Y Y I SS S S S
ν μρ
=
=
∂⎡ ⎤∂∂ ∂+ =⎢ ⎥∂ + ∂ ∂ ∂⎣ ⎦
∑L
(10)
1 1: (1 )t t tt
rA
ν ν+ +
∂= +
∂L
(11)
Conditions (7) and (8) indicate that in each period the marginal utility of supplying labour to farm or off-work is the marginal utility of the extra income minus the marginal utility of foregone leisure time. Hence, the farmer allocates labour to farm and non-farm employment to the point where the marginal utility of the extra earnings equals the marginal disutility of the work effort. Taken together equations (7), (8) and (9) imply that in the solution the marginal rate of substitution between L and C equals the marginal wage rate in each period. Equation (10) shows the optimal level of education (S) equates the discounted sum of the marginal utilities from the additional farm and off-farm earnings to the marginal cost (disutility) of acquiring the extra education. The theoretical framework highlights that the expected allocation of labour supply to farm and off-farm employment and the optimum level of schooling are effectively joint decisions. However, a further complication is that the farm successor may attach different marginal utilities to time devoted to on-farm work relative to off-farm work. If a successor derives utility from farming as an activity in its own right (e.g. enjoyment of the farming ‘way of life’) then the optimal labour allocation will be characterised by higher on-farm labour utilisation than in the situation where marginal utilities for on-farm and off-farm work are equal.
In the next section we explore an empirical specification focusing on the estimation of the earnings functions that are central to this theoretical model and in particular the first order condition with respect to schooling.
4. Data and empirical specifications
4.1. Data
Data for the study were obtained from a detailed survey of 688 Northern Ireland farm couples conducted in spring 2008. The sample was selected by DARDNI Agricultural Census Branch, from the respondents to the EU 2007 Farm Structures Survey. For pragmatic reasons the sampling frame was restricted to married farmers aged between 25 and 65 years, with farm size of at least 0.25 Standard Labour Units (SLR) and specialising in pastoral based enterprises. The sample was stratified by farm size (0.25 to <1SLR ; >= 1 SLR) and farm-type (Dairying, Lowland Beef/Sheep,
8
LFA Beef/Sheep). The stratification ensured adequate representation of both ‘full-time’ and ‘part-time’ farm businesses. Sampled farms were randomly selected within each strata.
Separate face-to-face interviews were conducted with farm operators and their spouses. The survey obtained detailed information on farm production and individual time allocation to farm and off-farm work activities. Respondents were asked to identify their hours devoted to each activity in the week prior to the survey and also to indicate their average working hours per week in each activity over a full year. In the case of farm work, survey questions examined the seasonal profile of labour input identifying peak and trough months and the typical weekly hours of work each month. Information was also collected on time per week devoted to caring responsibilities, household tasks (e.g. maintenance) and leisure activities. Respondents also provided information on the number of days of holiday they had taken in the previous 12 months.
Alongside labour allocation and detailed farm data, the survey collected information on respondents’ education and qualifications and annual off-farm gross annual earnings for 2007. Unfortunately, it was not possible to directly obtain reliable farm income data during the interviews. Instead gross family farm income (FFI) for 2007 was imputed for each respondent using a profit function estimated using panel data from the Northern Ireland Farm Business Survey. This function was used to estimate the FFI for each farm based on the detailed farm system information supplied by each respondent (including land areas and land quality, livestock output, crop output, single farm payment entitlements, land rented, business loans and farm labour hours employed).
For the analysis, hourly on-farm and off-farm wage rates were computed by dividing annual gross earnings from each source by the corresponding reported annual labour hours worked. Hourly pay is used as it controls for variation in annual earnings due to hours at work, e.g. part-time versus full-time work.
Within our analysis, years in education is calculated based on the age at which the respondents finished their formal education less school starting age (5). For 30 individuals within the sample group who indicated that their schooling went beyond the age of twenty three (perhaps where there has been a break in education) we follow Harmon and Walker (1995) by recoding their school finishing age to a maximum of twenty three years of age. In addition, in order to analyse the relationship between earnings and qualifications, dummy variables were derived to denote the highest qualification level of each respondent ranging from entry level (minimum school leaving) qualifications through to degree level. The actual qualifications within each level, listed in Appendix A, are defined according to Office for National Statistics, “Harmonised Concepts and Questions for Government Social Surveys.” Level 1 comprises entry level qualifications including GCSE below grade C and GNVQ foundation level. Level 2 includes trade apprenticeships, GCSE grades A*-C, GNVQ intermediate, City and Guilds Craft/Part II. Level 3 includes A Levels, and higher vocational qualifications such as NVQ level 3 and OND. Level 4 comprises higher education qualifications below degree level, e.g. HNC, HND. Level 5 comprises degree level qualifications. An additional dummy variable was used to identify where individuals had completed an agricultural qualification involving the equivalent of at least one full-time year of study.
9
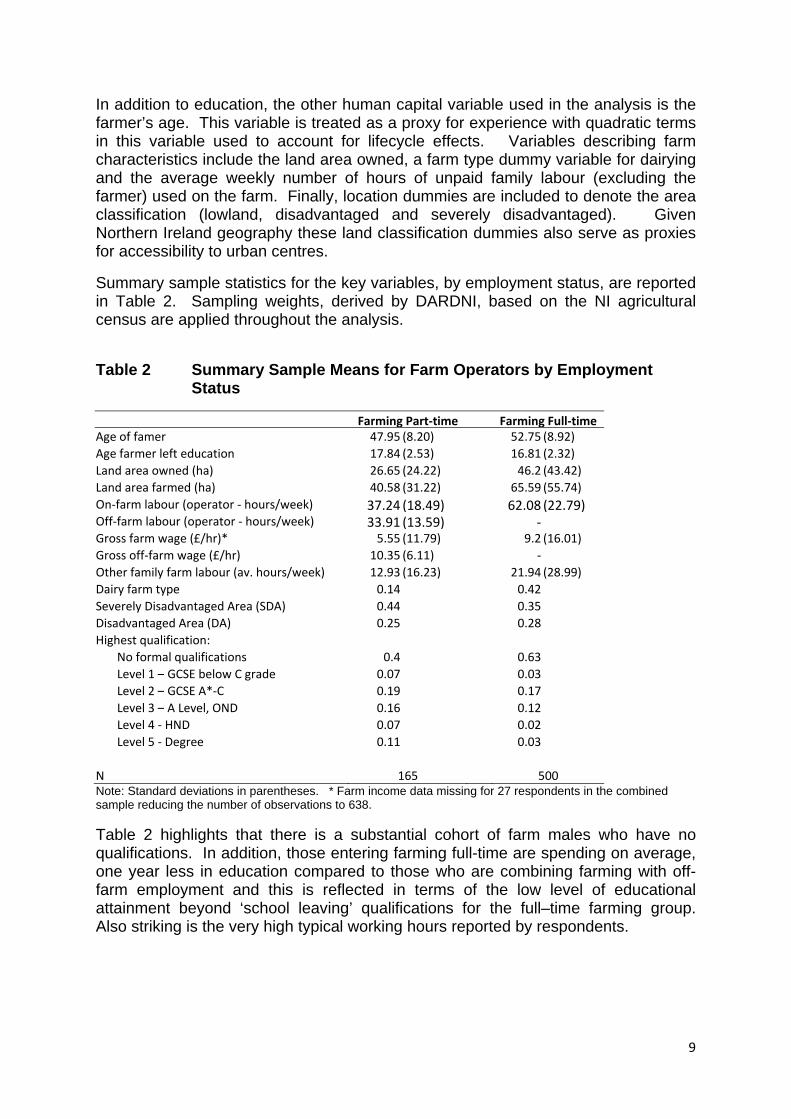
In addition to education, the other human capital variable used in the analysis is the farmer’s age. This variable is treated as a proxy for experience with quadratic terms in this variable used to account for lifecycle effects. Variables describing farm characteristics include the land area owned, a farm type dummy variable for dairying and the average weekly number of hours of unpaid family labour (excluding the farmer) used on the farm. Finally, location dummies are included to denote the area classification (lowland, disadvantaged and severely disadvantaged). Given Northern Ireland geography these land classification dummies also serve as proxies for accessibility to urban centres.
Summary sample statistics for the key variables, by employment status, are reported in Table 2. Sampling weights, derived by DARDNI, based on the NI agricultural census are applied throughout the analysis.
Table 2 highlights that there is a substantial cohort of farm males who have no qualifications. In addition, those entering farming full-time are spending on average, one year less in education compared to those who are combining farming with off-farm employment and this is reflected in terms of the low level of educational attainment beyond ‘school leaving’ qualifications for the full–time farming group. Also striking is the very high typical working hours reported by respondents.
Table 2 Summary Sample Means for Farm Operators by Employment Status
Farming Part‐time Farming Full‐time Age of famer 47.95 (8.20) 52.75 (8.92) Age farmer left education 17.84 (2.53) 16.81 (2.32) Land area owned (ha) 26.65 (24.22) 46.2 (43.42) Land area farmed (ha) 40.58 (31.22) 65.59 (55.74) On‐farm labour (operator ‐ hours/week) 37.24 (18.49) 62.08 (22.79) Off‐farm labour (operator ‐ hours/week) 33.91 (13.59) ‐Gross farm wage (£/hr)* 5.55 (11.79) 9.2 (16.01) Gross off‐farm wage (£/hr) 10.35 (6.11) ‐Other family farm labour (av. hours/week) 12.93 (16.23) 21.94 (28.99) Dairy farm type 0.14 0.42Severely Disadvantaged Area (SDA) 0.44 0.35Disadvantaged Area (DA) 0.25 0.28Highest qualification:
No formal qualifications 0.4 0.63Level 1 – GCSE below C grade 0.07 0.03Level 2 – GCSE A*‐C 0.19 0.17Level 3 – A Level, OND 0.16 0.12Level 4 ‐ HND 0.07 0.02Level 5 ‐ Degree 0.11 0.03
N 165 500Note: Standard deviations in parentheses. * Farm income data missing for 27 respondents in the combined sample reducing the number of observations to 638.
10
4.2. Empirical Specifications
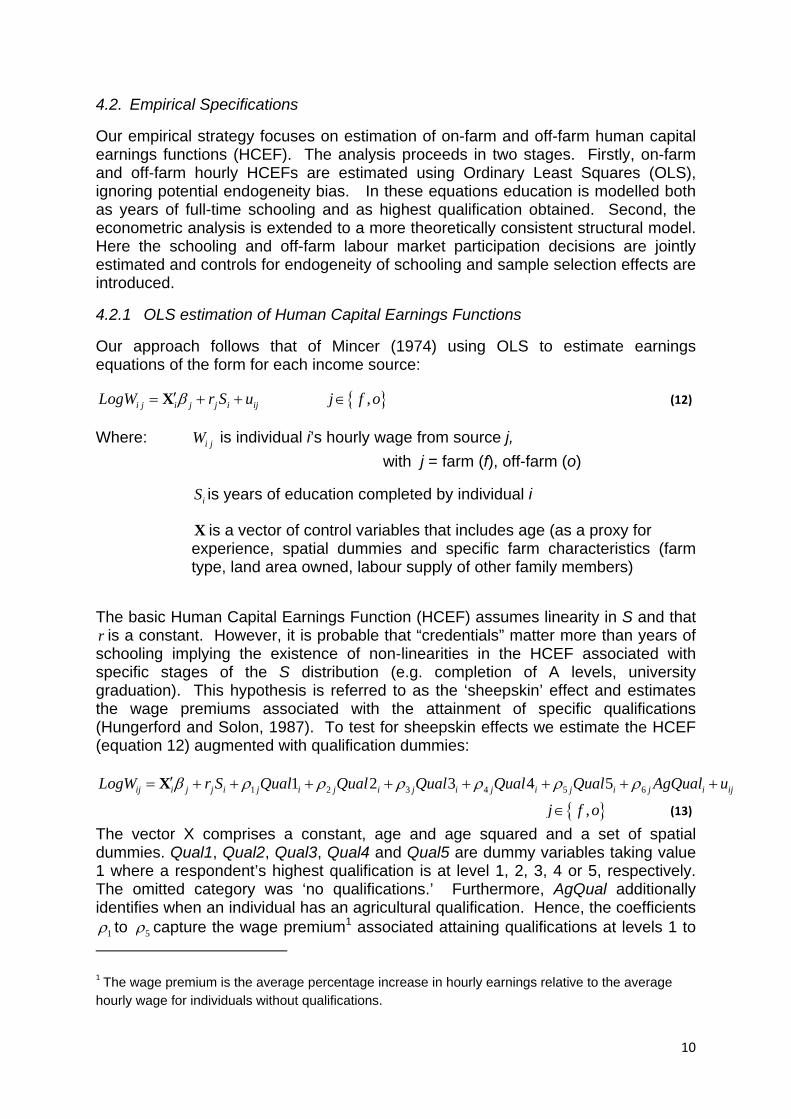
Our empirical strategy focuses on estimation of on-farm and off-farm human capital earnings functions (HCEF). The analysis proceeds in two stages. Firstly, on-farm and off-farm hourly HCEFs are estimated using Ordinary Least Squares (OLS), ignoring potential endogeneity bias. In these equations education is modelled both as years of full-time schooling and as highest qualification obtained. Second, the econometric analysis is extended to a more theoretically consistent structural model. Here the schooling and off-farm labour market participation decisions are jointly estimated and controls for endogeneity of schooling and sample selection effects are introduced.
4.2.1 OLS estimation of Human Capital Earnings Functions
Our approach follows that of Mincer (1974) using OLS to estimate earnings equations of the form for each income source:
{ } ,i j i j j i ijLogW r S u j f oβ′= + + ∈X (12)
Where: i jW is individual i’s hourly wage from source j, with j = farm (f), off-farm (o)
iS is years of education completed by individual i
X is a vector of control variables that includes age (as a proxy for experience, spatial dummies and specific farm characteristics (farm type, land area owned, labour supply of other family members)
The basic Human Capital Earnings Function (HCEF) assumes linearity in S and that r is a constant. However, it is probable that “credentials” matter more than years of schooling implying the existence of non-linearities in the HCEF associated with specific stages of the S distribution (e.g. completion of A levels, university graduation). This hypothesis is referred to as the ‘sheepskin’ effect and estimates the wage premiums associated with the attainment of specific qualifications (Hungerford and Solon, 1987). To test for sheepskin effects we estimate the HCEF (equation 12) augmented with qualification dummies:
1 2 3 4 5 61 2 3 4 5ij i j j i j i j i j i j i j i j i ijLogW r S Qual Qual Qual Qual Qual AgQual uβ ρ ρ ρ ρ ρ ρ′= + + + + + + + +X
{ },j f o∈ (13) The vector X comprises a constant, age and age squared and a set of spatial dummies. Qual1, Qual2, Qual3, Qual4 and Qual5 are dummy variables taking value 1 where a respondent’s highest qualification is at level 1, 2, 3, 4 or 5, respectively. The omitted category was ‘no qualifications.’ Furthermore, AgQual additionally identifies when an individual has an agricultural qualification. Hence, the coefficients
1ρ to 5ρ capture the wage premium1 associated attaining qualifications at levels 1 to
1 The wage premium is the average percentage increase in hourly earnings relative to the average hourly wage for individuals without qualifications.

11
5, respectively. 6ρ measures any additional wage premium associated with attaining an agricultural qualification.
4.2.2 Structural Model
Unfortunately, OLS estimates of returns to schooling are potentially biased due to the endogeneity of education in the HCEF coupled with endogenous sample selection effects. The structural model attempts to remedy both sources of potential bias.
Education is likely to be endogenous since it is a choice variable of the individual’s optimisation problem. Hence, we expect a positive correlation between levels of education and its return. In addition, there is an omitted variable issue associated with unobservable characteristics of individuals. Individual ability is not known to the researcher but is likely to be correlated with levels of education and wages resulting in biased OLS estimates of returns to schooling (Harmon and Walker, 1995).
Sample selection bias arises from the fact that off-farm wages are only observed for farmers who choose to engage in off-farm employment. The decision to work off-farm is not random and is likely to be correlated with unobservable characteristics of individuals (e.g. preferences, motivation, etc). As noted by Dubin and Rivers (1989), sample selectivity is a missing variable problem and an effective cure for the selection bias requires the inclusion of sample correction factors which can overcome the omitted variable effect. Farm successors make their choice about future on-farm/off-farm labour allocation in conjunction with their education decision. Thus, for example, a successor expecting that full-time farming will not provide them with a satisfactory future income may accordingly invest more in education to enhance their off-farm employment prospects.
Moreover, education is a discrete rather than continuous variable and individuals tend to be clustered at specific points on the education scale. For example the education level of full-time famers in our sample tends to be strongly clustered at the statutory minimum level of schooling. Accordingly, the structural approach incorporates schooling as a discrete choice variable and models the interdependent nature of schooling and work decisions that give rise to the endogenous sample selection problems.
Estimation proceeds in two parts using an extension of the Heckman two-step model (Heckman, 1979) proposed by Ham (1982). In the first step equations for the schooling choice and the labour market participation decision are estimated simultaneously. In the second step the human capital earnings functions are estimated with additional controls for the endogeneity of schooling and sample selection.
12
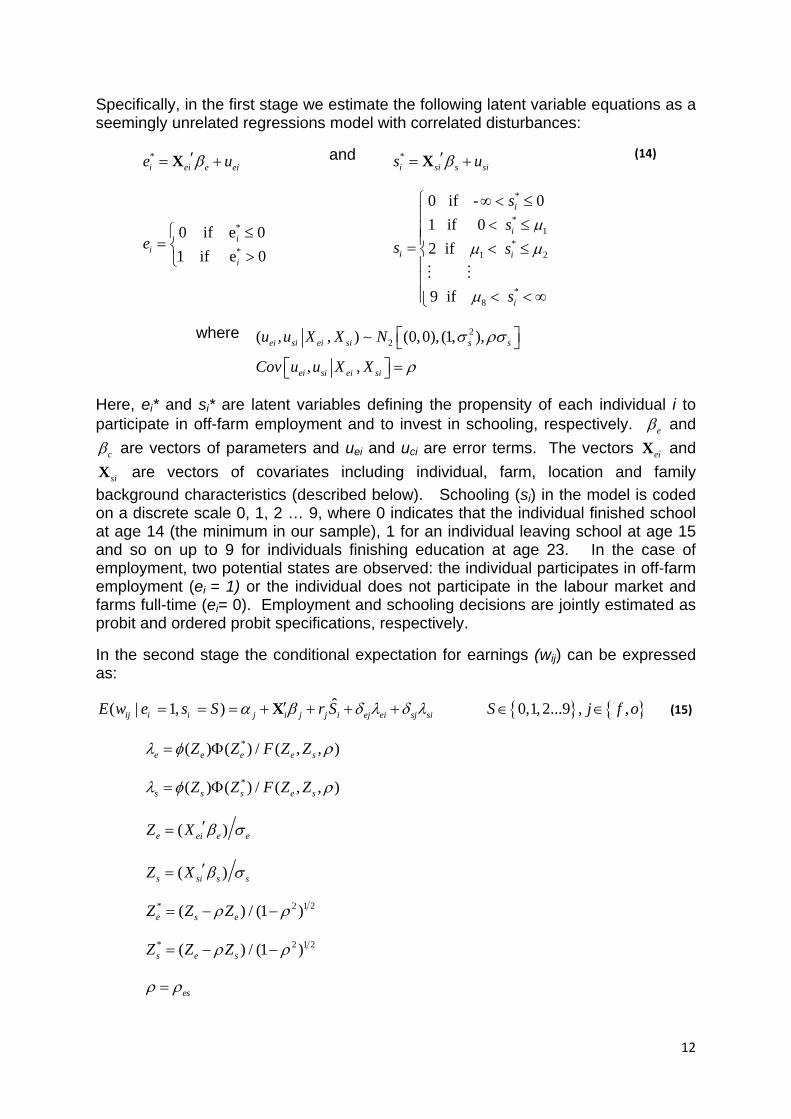
Specifically, in the first stage we estimate the following latent variable equations as a seemingly unrelated regressions model with correlated disturbances:
*i ei e eie uβ′= +X
*
*
0 if e 0 1 if e 0
ii
i
e⎧ ≤
= ⎨>⎩
and *i si s sis uβ′= +X
*
*1
*1 2
*8
0 if - 0 1 if 0 2 if
9 if
i
i
i i
i
ss
s s
s
μμ μ
μ
⎧ ∞ < ≤⎪ < ≤⎪⎪= < ≤⎨⎪⎪⎪ < < ∞⎩
(14)
where 22( , , ) (0,0), (1, ),
, ,ei si ei si s s
ei si ei si
u u X X N
Cov u u X X
σ ρσ
ρ
⎡ ⎤⎣ ⎦⎡ ⎤ =⎣ ⎦
∼
Here, ei* and si* are latent variables defining the propensity of each individual i to participate in off-farm employment and to invest in schooling, respectively. eβ and
cβ are vectors of parameters and uei and uci are error terms. The vectors eiX and
siX are vectors of covariates including individual, farm, location and family background characteristics (described below). Schooling (si) in the model is coded on a discrete scale 0, 1, 2 … 9, where 0 indicates that the individual finished school at age 14 (the minimum in our sample), 1 for an individual leaving school at age 15 and so on up to 9 for individuals finishing education at age 23. In the case of employment, two potential states are observed: the individual participates in off-farm employment (ei = 1) or the individual does not participate in the labour market and farms full-time (ei= 0). Employment and schooling decisions are jointly estimated as probit and ordered probit specifications, respectively.
In the second stage the conditional expectation for earnings (wij) can be expressed as:
{ } { }ˆ( | 1, ) 0,1,2...9 , ,ij i i j i j j i ej ei sj siE w e s S r S S j f oα β δ λ δ λ′= = = + + + + ∈ ∈X (15)
*( ) ( ) / ( , , )e e e e sZ Z F Z Zλ φ ρ= Φ
*( ) ( ) / ( , , )s s s e sZ Z F Z Zλ φ ρ= Φ
( )e ei e eZ X β σ′=
( )s si s sZ X β σ′=
* 2 1 2( ) / (1 )e s eZ Z Zρ ρ= − −
* 2 1 2( ) / (1 )s e sZ Z Zρ ρ= − −
esρ ρ=
13
Here (.)φ and (.)Φ are the univariate standard normal density and distribution functions respectively. F(.) is the bivariate standard normal distribution function while eσ and sσ are standard deviations of ue and us, respectively. ρ is the correlation between the error terms (ue and us) of the selection equations. eiλ and
siλ are sample correction factors (inverse mills ratios) for employment participation and schooling, respectively. The sample correction factors that are substituted into wage equations are estimated for each observation in the selected sample using the conditional means of the bivariate selection equations. If the estimated coefficients ( ejδ and sjδ ) for the selection factors are not equal to zero then selection into sample subgroups (by education level and employment status) is endogenous and OLS estimation of the earnings equation using the censored sample suffers from selectivity bias of the type described by Heckman (1979).
Instrumental Variables (IV) methods provide a suitable means for correcting for endogeneity of schooling in the HCEF (Card, 1999). Valid instrumental variables need to be strongly correlated with the endogenous regressor (schooling) but should be independent of the unobservable ability factors that are correlated with education and wages. We instrument schooling in the structural model using a number of family background variables:
• Number of siblings: Number of siblings of the farmer. For a given level of parental income, family size is likely to reduce the per capita resources that can be spent on educational investments.
• Birth order: An index for the farmer’s birth order within his family. The variable takes a value of 1 where the respondent is the first born, 2 if second born, etc. The reason for including this variable is that the shares of family resources that each child receives are likely to differ across birth order. In particular, given that parents have a fixed time endowment, the first born will receive a greater time endowment than subsequent children who have to compete for parental attention.
• Few books, Lots of books: Two dummy variables concerning the presence of books in the parental childhood home of the farmer are used as a proxy for family-specific attitudes to education2.
• Mother Skilled/Professional: A dummy variable with value equal to 1 if the farmer’s mother was employed in a professional or associate professional occupation. We expect this variable to be positively associated with the farmer’s level of education.
• Spouse’s education: The number of years of education completed by the farmer’s spouse. In the context of assortative mating (Pencavel,1998) we expect that a farmer’s level of schooling will be positively correlated with that of their spouse.
2 Respondents were asked: “Thinking about the time from when you were a baby until the age of ten, which of the following statements best describes your family home: There were a lot of books in the house; There were quite a few books in the house; There were not very many books in the house.”
14
The structural model is estimated in STATA® using full information maximum likelihood. Suitable exclusion restrictions are required for identification of model coefficients. Consequently, we require that each structural equation excludes at least one exogenous variable appearing in the other structural equations.
5. Results
5.1. OLS Estimates of Returns to Education
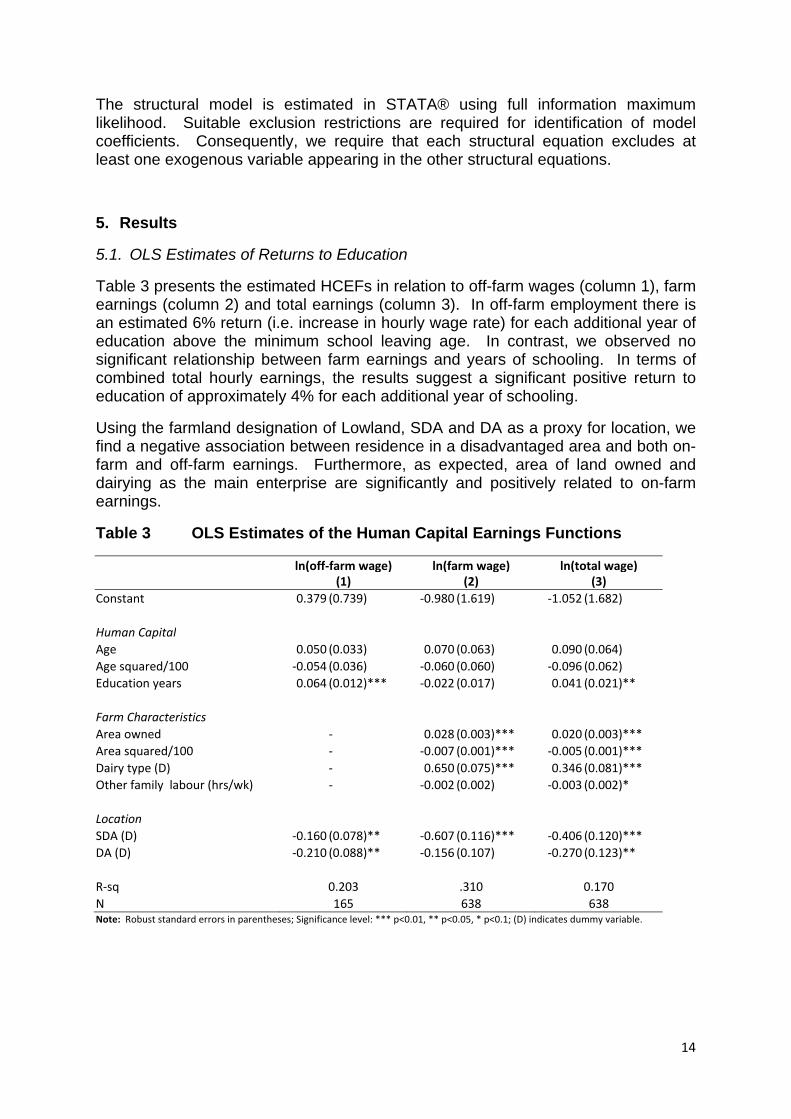
Table 3 presents the estimated HCEFs in relation to off-farm wages (column 1), farm earnings (column 2) and total earnings (column 3). In off-farm employment there is an estimated 6% return (i.e. increase in hourly wage rate) for each additional year of education above the minimum school leaving age. In contrast, we observed no significant relationship between farm earnings and years of schooling. In terms of combined total hourly earnings, the results suggest a significant positive return to education of approximately 4% for each additional year of schooling.
Using the farmland designation of Lowland, SDA and DA as a proxy for location, we find a negative association between residence in a disadvantaged area and both on-farm and off-farm earnings. Furthermore, as expected, area of land owned and dairying as the main enterprise are significantly and positively related to on-farm earnings.
Table 3 OLS Estimates of the Human Capital Earnings Functions
ln(off‐farm wage) ln(farm wage) ln(total wage) (1) (2) (3) Constant 0.379 (0.739) ‐0.980 (1.619) ‐1.052 (1.682)
Human Capital Age 0.050 (0.033) 0.070 (0.063) 0.090 (0.064) Age squared/100 ‐0.054 (0.036) ‐0.060 (0.060) ‐0.096 (0.062) Education years 0.064 (0.012)*** ‐0.022 (0.017) 0.041 (0.021)**
Farm Characteristics Area owned ‐ 0.028 (0.003)*** 0.020 (0.003)*** Area squared/100 ‐ ‐0.007 (0.001)*** ‐0.005 (0.001)*** Dairy type (D) ‐ 0.650 (0.075)*** 0.346 (0.081)*** Other family labour (hrs/wk) ‐ ‐0.002 (0.002) ‐0.003 (0.002)*
Location SDA (D) ‐0.160 (0.078)** ‐0.607 (0.116)*** ‐0.406 (0.120)*** DA (D) ‐0.210 (0.088)** ‐0.156 (0.107) ‐0.270 (0.123)**
R‐sq 0.203 .310 0.170 N 165 638 638 Note: Robust standard errors in parentheses; Significance level: *** p<0.01, ** p<0.05, * p<0.1; (D) indicates dummy variable.
15
5.2. Sheepskin Effects in Returns to Education
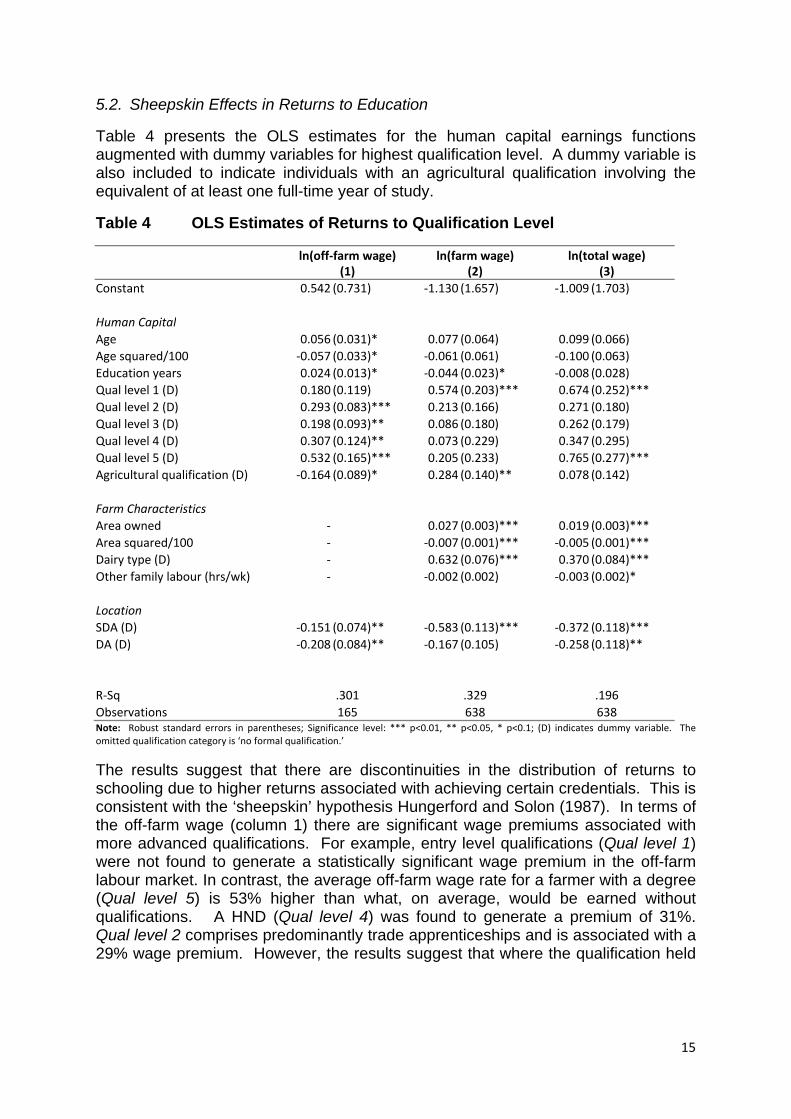
Table 4 presents the OLS estimates for the human capital earnings functions augmented with dummy variables for highest qualification level. A dummy variable is also included to indicate individuals with an agricultural qualification involving the equivalent of at least one full-time year of study.
The results suggest that there are discontinuities in the distribution of returns to schooling due to higher returns associated with achieving certain credentials. This is consistent with the ‘sheepskin’ hypothesis Hungerford and Solon (1987). In terms of the off-farm wage (column 1) there are significant wage premiums associated with more advanced qualifications. For example, entry level qualifications (Qual level 1) were not found to generate a statistically significant wage premium in the off-farm labour market. In contrast, the average off-farm wage rate for a farmer with a degree (Qual level 5) is 53% higher than what, on average, would be earned without qualifications. A HND (Qual level 4) was found to generate a premium of 31%. Qual level 2 comprises predominantly trade apprenticeships and is associated with a 29% wage premium. However, the results suggest that where the qualification held
Table 4 OLS Estimates of Returns to Qualification Level
ln(off‐farm wage) ln(farm wage) ln(total wage) (1) (2) (3) Constant 0.542 (0.731) ‐1.130 (1.657) ‐1.009 (1.703)
Human Capital Age 0.056 (0.031)* 0.077 (0.064) 0.099 (0.066) Age squared/100 ‐0.057 (0.033)* ‐0.061 (0.061) ‐0.100 (0.063) Education years 0.024 (0.013)* ‐0.044 (0.023)* ‐0.008 (0.028) Qual level 1 (D) 0.180 (0.119) 0.574 (0.203)*** 0.674 (0.252)*** Qual level 2 (D) 0.293 (0.083)*** 0.213 (0.166) 0.271 (0.180) Qual level 3 (D) 0.198 (0.093)** 0.086 (0.180) 0.262 (0.179) Qual level 4 (D) 0.307 (0.124)** 0.073 (0.229) 0.347 (0.295) Qual level 5 (D) 0.532 (0.165)*** 0.205 (0.233) 0.765 (0.277)*** Agricultural qualification (D) ‐0.164 (0.089)* 0.284 (0.140)** 0.078 (0.142)
Farm Characteristics Area owned ‐ 0.027 (0.003)*** 0.019 (0.003)*** Area squared/100 ‐ ‐0.007 (0.001)*** ‐0.005 (0.001)*** Dairy type (D) ‐ 0.632 (0.076)*** 0.370 (0.084)*** Other family labour (hrs/wk) ‐ ‐0.002 (0.002) ‐0.003 (0.002)*
Location SDA (D) ‐0.151 (0.074)** ‐0.583 (0.113)*** ‐0.372 (0.118)*** DA (D) ‐0.208 (0.084)** ‐0.167 (0.105) ‐0.258 (0.118)**
R‐Sq .301 .329 .196 Observations 165 638 638 Note: Robust standard errors in parentheses; Significance level: *** p<0.01, ** p<0.05, * p<0.1; (D) indicates dummy variable. The omitted qualification category is ‘no formal qualification.’
16
is an agricultural qualification the off-farm wage premium is reduced by 16%3; although this result is on the margins of statistical significance (P<0.1).
However, the estimates of the HCEF for on-farm earnings present a contrasting picture. Here the highest returns are associated with entry level qualifications (Qual Level 1) while having a specialised agricultural qualification is found to be associated with an increase of 28% in hourly on-farm earnings compared to a farmer without an agricultural qualification. There was no significant on-farm return to other educational qualifications.
The contrasting on-farm versus off-farm results, are perhaps symptomatic of endogenous sample selection effects. Farmer’s education choice and their decisions about whether or not to engage in off-farm employment are interrelated. Those planning to work off-farm also tend to invest in attaining qualifications which are most likely to generate higher wages in the labour market. Those planning to farm full-time might be more inclined to finish with a sound basic education coupled with an agricultural qualification. Recognising this issue, in the next section, we present results of a structural model that controls for endogenous sample selection arising from for the interdependent nature of education and labour supply decisions.
5.3. Structural Model Estimates
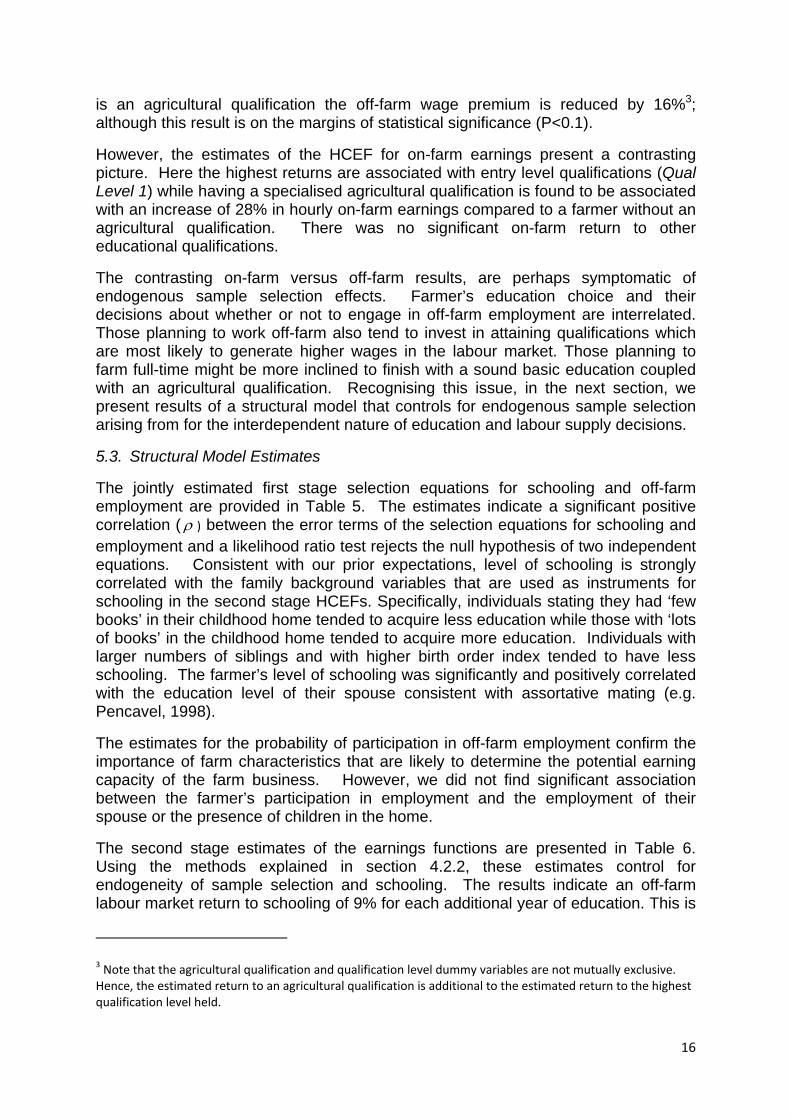
The jointly estimated first stage selection equations for schooling and off-farm employment are provided in Table 5. The estimates indicate a significant positive correlation ( ρ ) between the error terms of the selection equations for schooling and employment and a likelihood ratio test rejects the null hypothesis of two independent equations. Consistent with our prior expectations, level of schooling is strongly correlated with the family background variables that are used as instruments for schooling in the second stage HCEFs. Specifically, individuals stating they had ‘few books’ in their childhood home tended to acquire less education while those with ‘lots of books’ in the childhood home tended to acquire more education. Individuals with larger numbers of siblings and with higher birth order index tended to have less schooling. The farmer’s level of schooling was significantly and positively correlated with the education level of their spouse consistent with assortative mating (e.g. Pencavel, 1998).
The estimates for the probability of participation in off-farm employment confirm the importance of farm characteristics that are likely to determine the potential earning capacity of the farm business. However, we did not find significant association between the farmer’s participation in employment and the employment of their spouse or the presence of children in the home.
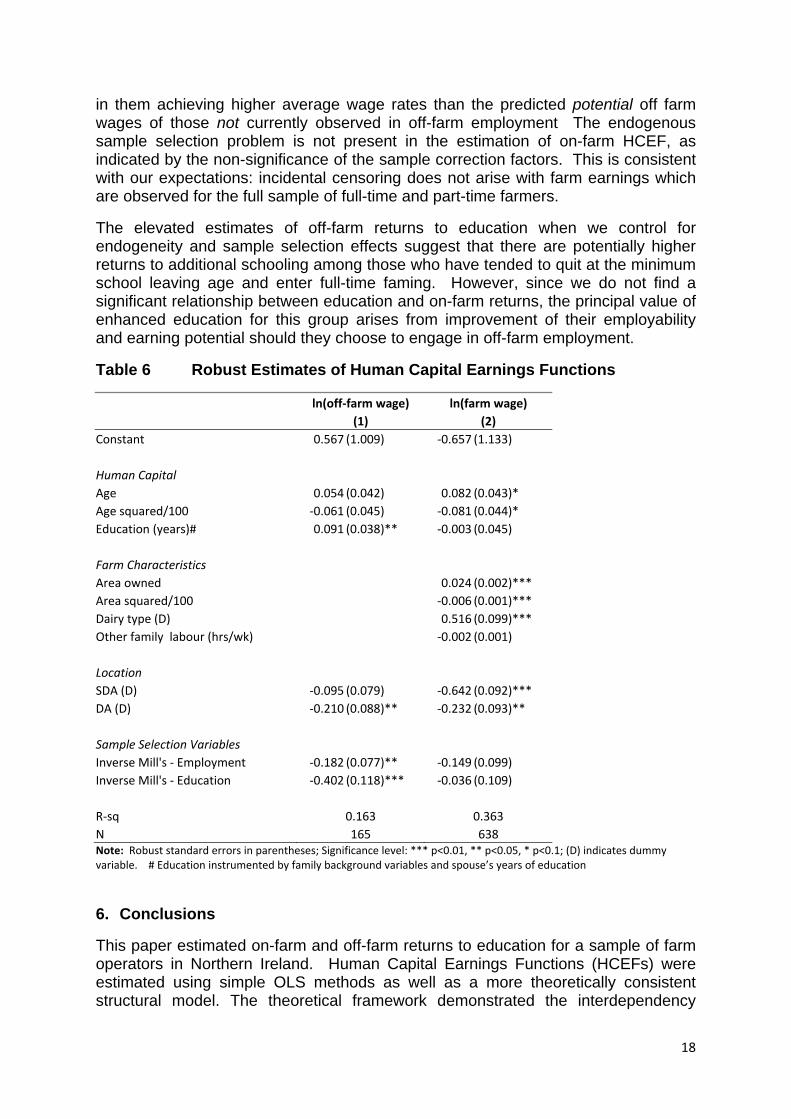
The second stage estimates of the earnings functions are presented in Table 6. Using the methods explained in section 4.2.2, these estimates control for endogeneity of sample selection and schooling. The results indicate an off-farm labour market return to schooling of 9% for each additional year of education. This is
3 Note that the agricultural qualification and qualification level dummy variables are not mutually exclusive. Hence, the estimated return to an agricultural qualification is additional to the estimated return to the highest qualification level held.
17
considerably higher than the earlier OLS result presented in Table 3, suggesting that endogeneity of schooling results in downward bias in the OLS estimate; a finding consistent with results reported in other studies (Card, 1999; Trostel et al., 2002). For farm earnings, other human capital characteristics such as experience (proxied by age) appear more important than years of education. The estimates suggest a concave relationship between farm wage and experience, although we note that this only marginally significant (P<0.1).
Statistical significance of the sample correction factors confirms the presence of endogenous sample selection effects in the off-farm HCEF. In particular, the negative coefficients on these terms indicate that failure to control for sample selection effects results in overestimation of the average off-farm wage rate. Thus unobservable characteristics of individuals engaged in off-farm employment results
Table 5 Selection Equations estimated as Bivariate ‘Seeming Unrelated’ Probit Regressions
Education (Ordered Probit) Employment (Probit) (1) (2) Human Capital Age 0.111 (0.044)** 0.207 (0.074)*** Age squared/100 ‐0.137 (0.044)*** ‐0.261 (0.078)***
Farm Characteristics Area owned 0.001 (0.002) ‐0.015 (0.005)*** Area squared/100 ‐0.001 (0.001) 0.002 (0.003) Dairy type (D) ‐0.225 (0.087)*** ‐0.854 (0.143)*** Other family farm labour (hrs/wk) ‐0.006 (0.003)**
Location SDA (D) ‐0.029 (0.099) 0.271 (0.145)* DA (D) ‐0.027 (0.104) ‐0.017 (0.157)
Family Background Mother skilled/professional (D) 0.373 (0.201)* ‐0.321 (0.284) Few books (D) ‐0.325 (0.089)*** 0.076 (0.132) Lots of books (D) 0.280 (0.125)** 0.007 (0.187) Number of siblings ‐0.050 (0.021)** 0.040 (0.032) Birth order ‐0.052 (0.028)* ‐0.128 (0.042)*** Spouse's education (years) 0.076 (0.016)*** ‐0.009 (0.025)
Spouse Employment and Children Spouse works off‐farm (D) 0.082 (0.174) Kids under 16 (D) ‐0.339 (0.225) Spouse works x kids under 16 (D) 0.255 (0.247)
Rho ( ρ ) 0.215 (0.061)*** Log likelihood ‐1550.59 Wald chi‐sq (13) 156.49 [0.000] LR Test of 2 Independent Eq. ChiSq(1) 11.60 [0.000] N 665 Note: Standard errors in parentheses; Significance level: *** p<0.01, ** p<0.05, * p<0.1; (D) indicates dummy variable.
18
in them achieving higher average wage rates than the predicted potential off farm wages of those not currently observed in off-farm employment The endogenous sample selection problem is not present in the estimation of on-farm HCEF, as indicated by the non-significance of the sample correction factors. This is consistent with our expectations: incidental censoring does not arise with farm earnings which are observed for the full sample of full-time and part-time farmers.
The elevated estimates of off-farm returns to education when we control for endogeneity and sample selection effects suggest that there are potentially higher returns to additional schooling among those who have tended to quit at the minimum school leaving age and enter full-time faming. However, since we do not find a significant relationship between education and on-farm returns, the principal value of enhanced education for this group arises from improvement of their employability and earning potential should they choose to engage in off-farm employment.
6. Conclusions
This paper estimated on-farm and off-farm returns to education for a sample of farm operators in Northern Ireland. Human Capital Earnings Functions (HCEFs) were estimated using simple OLS methods as well as a more theoretically consistent structural model. The theoretical framework demonstrated the interdependency
Table 6 Robust Estimates of Human Capital Earnings Functions
ln(off‐farm wage) ln(farm wage) (1) (2) Constant 0.567 (1.009) ‐0.657 (1.133)
Human Capital Age 0.054 (0.042) 0.082 (0.043)* Age squared/100 ‐0.061 (0.045) ‐0.081 (0.044)* Education (years)# 0.091 (0.038)** ‐0.003 (0.045)
Farm Characteristics Area owned 0.024 (0.002)*** Area squared/100 ‐0.006 (0.001)*** Dairy type (D) 0.516 (0.099)*** Other family labour (hrs/wk) ‐0.002 (0.001)
Location SDA (D) ‐0.095 (0.079) ‐0.642 (0.092)*** DA (D) ‐0.210 (0.088)** ‐0.232 (0.093)**
Sample Selection Variables Inverse Mill's ‐ Employment ‐0.182 (0.077)** ‐0.149 (0.099) Inverse Mill's ‐ Education ‐0.402 (0.118)*** ‐0.036 (0.109)
R‐sq 0.163 0.363 N 165 638 Note: Robust standard errors in parentheses; Significance level: *** p<0.01, ** p<0.05, * p<0.1; (D) indicates dummy variable. # Education instrumented by family background variables and spouse’s years of education
19
between education and on-farm/off-farm labour supply decisions. This hypothesis was supported by the estimates of our structural model, with farmers who engaged in off-farm employment also more likely to have higher levels of education. The structural model estimates identified the significance of this endogenous sample selection problem. We found that that failure to control for endogeneity of education and labour supply in HCEF regressions was likely to result in underestimation of off-farm returns to schooling. A principal finding of our analysis concerned the marked difference between on-farm and off-farm returns to education. Years of schooling was not significantly correlated with farm earnings in any of our estimations. This contrasts with the picture in relation to off-farm employment where years of education was typically the most important variable in explaining variation in off-farm wage rates. Across model specifications we estimated that the off-farm return to schooling was between 6% and 9% for each additional year of schooling. Hence, extra education typically generated a marked enhancement in hourly earnings in off-farm employment. These magnitudes are consistent with other estimates of economic returns to education. For example, in the case of male employees in Northern Ireland, Harmon and Walker (2000) estimated rates of return to education of 7.5% using OLS and 14% using IV methods. It might be argued that attainment of qualifications (such as A levels or a college degree) matters more than years of education. This hypothesis called the ‘sheepskin’ effect suggests the existence of wage premiums associated with achieving credentials (Card, 1999). Estimation of the HCEFs augmented by qualification levels appeared to support the sheepskin hypothesis especially in relation to off-farm wages. Specifically, we found a gradation in returns by qualification level with a college degree providing a 53% off-farm wage premium relative to the average wage earned without qualifications. In contrast when looking at on-farm earnings, with the exception of an agricultural qualification, we did not find any wage premium associated with post-secondary qualifications. In this regard an agricultural qualification was found to generate an on-farm wage premium of 28% relative to an unqualified farmer. However, in off-farm employment an agricultural qualification was not found to produce a positive wage premium additional to that pertaining to the level of the highest qualification held. The relatively high on-farm earnings premium associated with agricultural training requires caution though because of the likely endogeneity of agricultural qualifications. Specifically, successors of larger and more profitable farm businesses are probably more likely to acquire agricultural qualifications and this would generate upward bias in the estimated farm return to such qualifications. Compared to employees, lower rates of return to education among the self-employed, such as farmers, are consistent with the predictions of labour market signaling theory (Spence, 1973) and empirical findings of studies such as Brown and Sessions (1999) and Chevalier et al. (2004). However, the fact that we did not find any significant association between farm earnings and education was surprising. One possible explanation is that measurement error is probably much more prevalent in farm earnings than in reported earnings from off-farm employment. This would result in some attenuation bias in our estimates of the on-farm return to schooling. The ‘noise’ problem is exacerbated by the fact that hourly farm earnings,
20
used in the regressions, are calculated by dividing annual family farm income by annual labour hours, both of which are prone to reporting/measurement errors. Nonetheless, the acceptable level of goodness of fit of the on-farm HCEFs, based on the significance of other variables, leads us to believe that our general finding of lower on-farm compared to off-farm returns to education would likely remain even with more accurately measured farm earnings data.
While schooling was not statistically significant in the on-farm HCEFs, the structural model estimates suggested a positive concave relationship between farm earnings and years of experience (proxied by age). This may support the proposition of Huffman (2001), that “in a relatively static farm environment (political, economic, technical), accumulated experience seems to be a better investment than schooling” (p.347). In NI, for example, it may be the case that the potential efficiency advantage of higher levels of education becomes muted, at least partially, by regulatory and insulating effects of the Common Agricultural Policy. A major proportion of NI farm incomes are now obtained from decoupled direct support (Single Farm Payment). Since the level of such support received by a farmer is largely independent of their current managerial efficiency this may, to some extent, mask variation in farm income due to managerial quality and improved levels of education.
The apparent low on-farm returns to education are a disincentive to higher levels of educational attainment among farm successors. This is borne out in data (Table 1) clearly showing the much lower average levels of educational attainment of farmers compared to other male workers. This is an important issue for policy makers concerned with how to encourage more positive attitudes to education among farm-based males. For those planning to farm full-time, our results suggest that a solid secondary education plus agricultural training is a very sound investment. The results in relation to off-farm earnings are emphatic – investment in education pays substantial dividends in terms of higher wage rates. Moreover, in the context of a weak and uncertain economic climate, the emphasis on education is elevated as the opportunities for less skilled employment diminish. Finally, education has a fundamental role within the context of structural adjustment in agriculture. In the face of declining real farm incomes, participation in off-farm employment has been a predominant adaptation strategy of farm households. Education facilitates and supports such adaptation by enhancing the employment and wage prospects of farm operators who choose to engage in the off-farm labour market.
References
Blundell, R. and MaCurdy, T. (1999). Labor Supply: A Review of Alternative Approaches. In Ashenfelter, O. and Card, D., (Eds.). Handbook of Labor Economics, Volume 3A. (pp. 1559-1695.). Amsterdam: Elsevier Science.
Brown, S. and Sessions, J.G. (1999). Education and Employment Status: A Test of the Strong Screening Hypothesis in Italy . Economics of Education Review, 18, 397-404.
Card, D. (1999). The Causal Effect of Education on Earnings. In Ashenfelter, O. and Card, D., (Eds.) Handbook of Labor Economics, Volume 3A. (pp. 1801-1863.). Amsterdam: Elsevier Science.
Chevalier, A., Harmon, C., Walker, I. and Zhu, Y. (2004). Does Education Raise Productivity, or Just Reflect It? Economic Journal, 114 (November), F499-F517.
21
Dubin, J.A. and Rivers, D. (1989). Selection Bias in Linear Regression, Logit and Probit Models. Sociological Methods and Research, 18 (2 & 3), 360-390.
Gasson, R. (1998). Educational Qualifications of UK Farmers: A Review. Journal of Rural Studies, 14 (4), 487-498.
Goetz, S.J. and Rupasingha, A. (2004). The Returns to Education in Rural Areas. Review of Regional Studies, 34 (3), 245-259.
Ham, J.C. (1982). Estimation of a Labour Supply Model with Censoring Due to Unemployment and Underemployment. Review of Economic Studies, 49 (3), 335-354.
Harmon, C. and Walker, I. (1995). Estimates of the Economic Return to Schooling for the United Kingdom. American Economic Review, 85 (5), 1278-1286.
Harmon, C. and Walker, I. (2000). Education and Earnings in Northern Ireland, A Research Report to Analyse the Economic Returns to Education in Northern Ireland. Belfast: Department of Higher and Further Education, Training and Employment.
Heckman, J.J. (1979). Sample Selection Bias as a Specification Error. Econometrica, 47 (1), 153-161.
Huffman, W. and Orazem, P. (2004). The Role of Agriculture and Human Capital in Economic Growth: Famers, Schooling, and Health , Working Paper Series, Working Paper No. 04016. Department of Economics: Iowa State University.
Huffman, W.E. (2001). Human Capital: Education and Agriculture. In Gardner, B.L. and Rausser, G.C., (Eds.) . Handbook of Agricultural Economics, Volume 1A. (pp. 333-381.). Amsterdam: Elsevier Science.
Hungerford, T. and Solon, G. (1987). Sheepskin Effects in the Returns to Education. The Review of Economics and Statistics, 69 (1), 175-177.
Jolliffe, D. (2004). The Impact of Education in Rural Ghana: Examining Household Labor Allocation and Returns On and Off the Farm. Journal of Development Economics, 73, 287-314.
LeClere, F.B. (1991). The Effects of Metropolitan Residence on the Off-Farm Earnings of Farm Families in the United States. Rural Sociology, 53 (3), 366-390.
Lockheed, M.E., Jamison, D.T. and Lau, L.J. (1980). Farmer Education and Farm Efficiency: A Survey. American Journal of Agricultural Economics, 29 (1), 37-76.
MaCurdy, T.E. (1981). An Empirical Model of Labor Supply in a Life-Cycle Setting. Journal of Political Economy, 89 (6), 1059-1085.
Pencavel, J. (1998). Assortative Mating by Schooling and the Work Behavior of Wives and Husbands. American Economic Review , 88 (2), 326-329.
Romer, P.M. (1994). The Origins of Endogenous Growth. Journal of Economic Perspectives, 8 (1), 3-22.
Schultz, T.W. (1960). Capital Formation by Education. Journal of Political Economy, 68 (6), 571-583.
Shucksmith, M. (2004). Young People and Social Exclusion in Rural Areas. Sociologia Ruralis, 44 (1), 43-59.
Spence, M. (1973). Job Market Signaling. Quarterly Journal of Economics, 87 (3), 355-374.
Taylor, J.E. and Yunez-Naude, A. (2000). The Returns from Schooling in a Diversified Rural Economy. American Journal of Agricultural Economics, 82 (2), 287-297.
Trostel, P., Walker, I. and Woolley, P. (2002). Estimates of the Economic Return to Schooling for 28 Countries. Labour Economics, 9, 1-16.
Vera-Toscano, E., Phimister, E. and Weersink, A. (2004). Panel Estimates of the Canadian Rural/Urban Women's Wage Gap. American Journal of Agricultural Economics, 86 (4), 1138-1151.
Welch, F. (1970). Education in Production. Journal of Political Economy, 78 (1), 35-59.

22
Appendix A
Classification of Qualifications
Level 0 - No qualifications
Level 1 - NVQ or SVQ level 1 - GNVQ Foundation level, GSVQ level 1 - GCSE or O level below grade C, SCE Standard or Ordinary below grade 3 - CSE below grade 1 - BTEC, SCOTVEC first or general certificate - SCOTVEC modules - RSA Stage I, II, or III - City and Guilds part 1 - Junior certificate Level 2 - Trade Apprenticeships , GCSE/O Level grade A*-C, vocational level 2 and equivalents - NVQ or SVQ level 2 - GNVQ intermediate or GSVQ level 2 - RSA Diploma - City & Guilds Craft or Part II (& other names) - BTEC, SCOTVEC first or general diploma et - O level or GCSE grade A-C, SCE Standard or Ordinary grades 1-3 Level 3 - Vocational level 3 and equivalents - A level or equivalent - AS level - SCE Higher, Scottish Certificate Sixth Year Studies or equivalent - NVQ or SVQ level 3 - GNVQ Advanced or GSVQ level 3 - OND, ONC, BTEC National, SCOTVEC National Certificate - City & Guilds advanced craft, Part III (& other names) - RSA advanced diploma Level 4 - Other Higher Education below degree level - Diplomas in higher education & other higher education qualifications - HNC, HND, Higher level BTEC - Teaching qualifications for schools or further education (below Degree level standard) - Nursing, or other medical qualifications not covered above (below Degree level standard) - RSA higher diploma Level 5 - Degree or Degree equivalent, and above - Higher degree and postgraduate qualifications - First degree (including B.Ed.) - Postgraduate Diplomas and Certificates (including PGCE) - Professional qualifications at degree level e.g. graduate member of professional institute, chartered accountant or surveyor - NVQ or SVQ level 4 or 5 Source: http://www.ons.gov.uk/about-statistics/harmonisation/secondary-concepts-andquestions/S1.pdf