Steel Long Products Market 85th IREPAS Meeting
24
Alex Gordienko Export Director CELSA Group Steel Long Products Market 85 th IREPAS Meeting October 18 th , 2021
Transcript of Steel Long Products Market 85th IREPAS Meeting

Alex Gordienko
Export Director
CELSA Group
Steel Long Products Market85th IREPAS Meeting
October 18th , 2021

• Macroeconomics and steel use
• Construction sector overview
• Steel industry overview
• Long products consumption
• Rebars consumption
• International Market price situation
• Summary & Outlook
2
TABLE OF CONTENTS

3
The global economy is performing better than expected in 2021.
The outlook for the emerging economies have been downgraded because of the COVID impact.
By contrast, the forecast for advanced economies for 2022 has been revised up by 0,5%. These revisions reflect uneven pandemic developments.
GDP Growth Projections
The 0.5 % increase derives mainly from the American economy.

GDP Growth Projections

• Macroeconomics and steel use
• Construction sector overview
• Steel industry overview
• Long products consumption
• Rebars consumption
• International Market price situation
• Summary & Outlook
5
Table of Contents

6
EU Construction sector overview
The recovery of the European construction industry is proceeding faster than initially expected. It is expected that a large part of the losses due to the Corona pandemic can be recovered in 2021.
SOURCE: 91st EUROCONSTRUCT, June 2021

SOURCE: 91st EUROCONSTRUCT, June 2021

• Macroeconomics and steel use
• Construction sector overview
• Steel industry overview
• Long products consumption
• Rebars market
• International Market price situation
• Summary & Outlook
15
Table of Contents

Global Steel output is expected to increase by 2.7% in 2021.
World Steel Production
157
37
100120
41 14 40
1.001
111
99
153
6
1.880
139
39102 101
38 17 45
1.053
100 83141
6
1.864
149
48103 113
43 13 42
1.067
112 92 126
7
1.914
0
500
1.000
1.500
2.000
2.500
EU Other Europe C.I.S North America South Amercia Africa Middle East China India Japan Other Asia Oceania TOTAL
World Crude Steel Production by Regions (Millions of TN)
2019 2020 2021E

Steel demand will grow by 5.8% in 2021 to reach 1.874 Mt, after declining by 2.6% in 2020
In 2022 steel demand will see further growth of 2.7% to reach 1,924.6 Mt.
CELSA GROUPTM Strictly Private & Confidential
Global Steel Market Analysis
2019
1.766 Mt
2020
1.725 Mt
2021
1.874 Mt
2022
1.924 Mt

Progression of China’s Steel Exports and ImportsGlobal Steel Market Analysis
• Macroeconomics and steel use
• Construction sector overview
• Steel industry overview
• Long products consumption
• Rebars consumption
• International Market price situation
• Summary & Outlook
29
Table of Contents
Source: CRU OCT’21
30
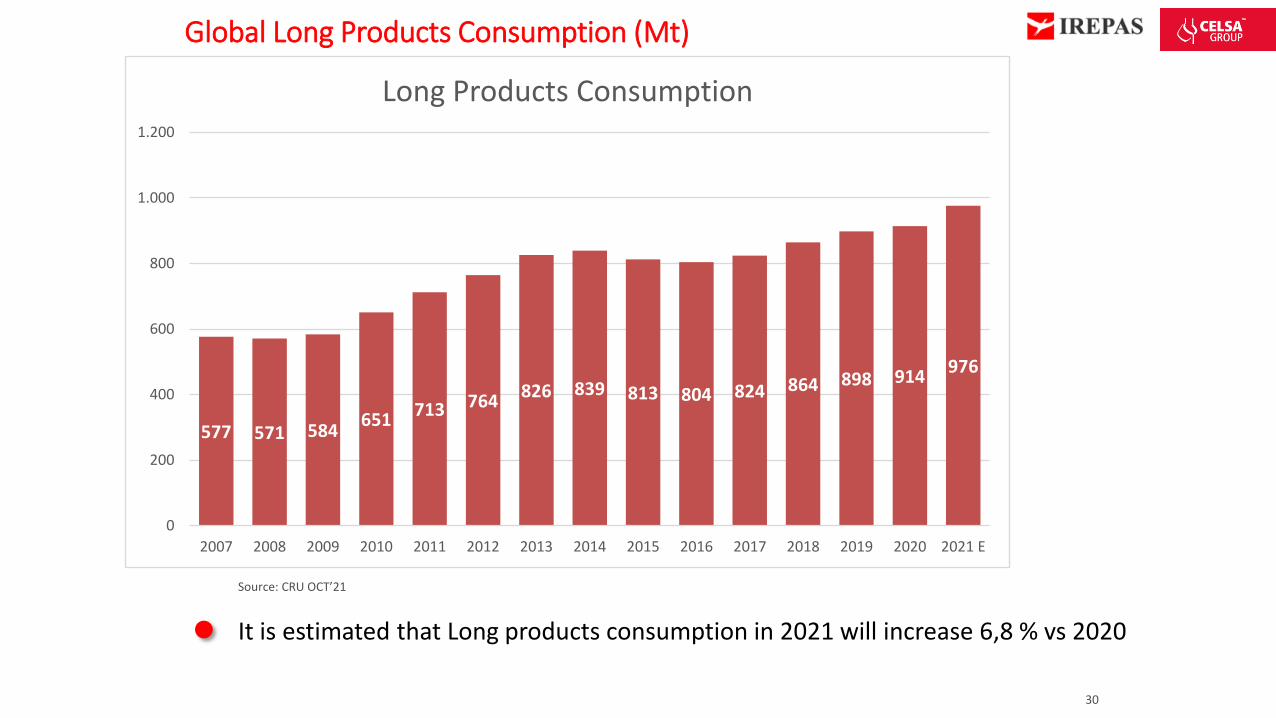
Global Long Products Consumption (Mt)
It is estimated that Long products consumption in 2021 will increase 6,8 % vs 2020
577 571 584651
713 764826 839 813 804 824 864 898 914
976
0
200
400
600
800
1.000
1.200
2007 2008 2009 2010 2011 2012 2013 2014 2015 2016 2017 2018 2019 2020 2021 E
Long Products Consumption

31
Long Products Consumption, by Product (Mt)
Source: CRU OCT’21
Consumption of all products is estimated to increase by 6,8% in 2021 vs 2020 . WireRod 3,9%, Rebar 6,4%, Mbars 10% , Sections 9,7%
147 146 154 171 191 205 220 222 216 210 211 224 232 236 245
233 234 247 260289
322354 371 366 370 375 388 412 416 443143 142 144
175185
187200 193 178 170 182
194197 206
227
54 49 3945
4850
52 54 54 54 5658
58 5661
0
200
400
600
800
1.000
1.200
2007 2008 2009 2010 2011 2012 2013 2014 2015 2016 2017 2018 2019 2020 2021 E
Long Products Consumption by Product
WR Rebar Bars Sections
• Macroeconomics and steel use
• Construction sector overview
• Steel industry overview
• Long products consumption
• Rebars consumption
• International Market price situation
• Summary & Outlook
40
Table of Contents
Source: CRU
43
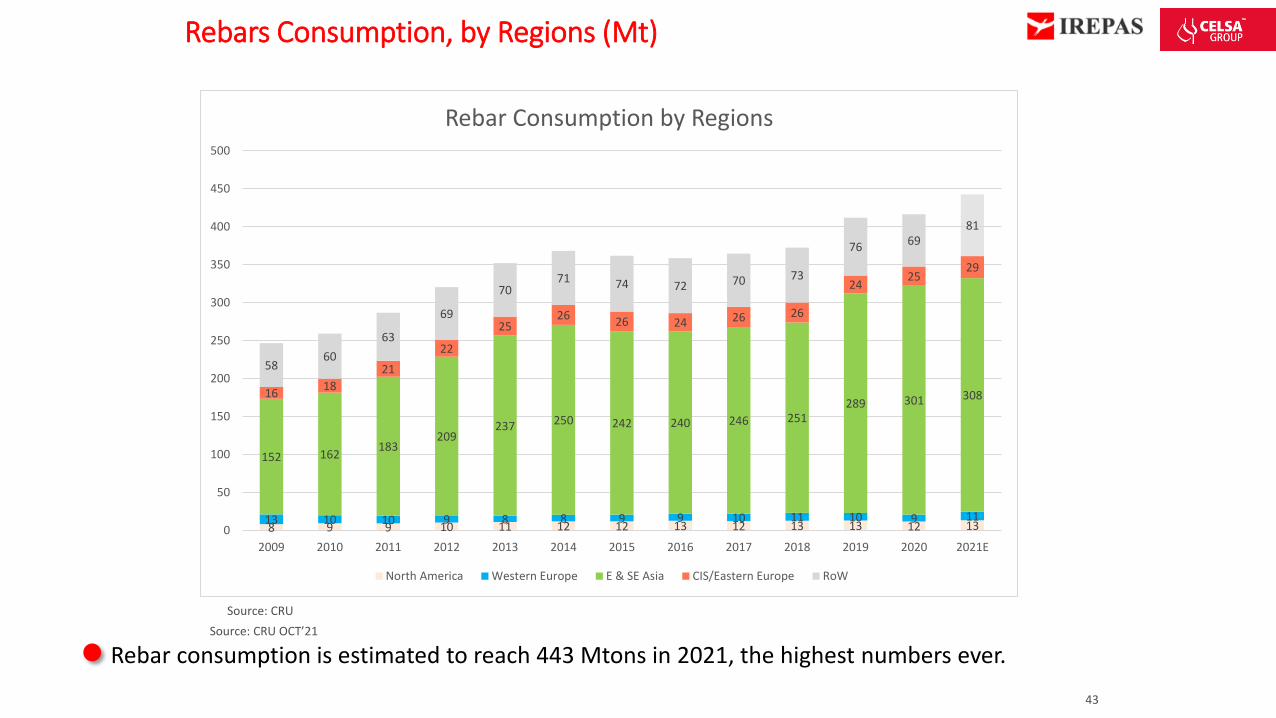
Rebars Consumption, by Regions (Mt)
Rebar consumption is estimated to reach 443 Mtons in 2021, the highest numbers ever.Source: CRU OCT’21
8 9 9 10 11 12 12 13 12 13 13 12 1313 10 10 9 8 8 9 9 10 11 10 9 11
152 162183
209237 250 242 240 246 251
289 301 3081618
21
22
2526 26 24 26 26
2425
29
5860
63
69
7071 74 72 70 73
76 6981
0
50
100
150
200
250
300
350
400
450
500
2009 2010 2011 2012 2013 2014 2015 2016 2017 2018 2019 2020 2021E
Rebar Consumption by Regions
North America Western Europe E & SE Asia CIS/Eastern Europe RoW

Source: CRU OCT’2136
Rebar by Regions Apparent Consumption 2021 E (%)
3,0%
2,5% 1,6%
60,7%
3,2%
6,5%
18,4%
Rebar Consumption by Regions
North America Western Europe Japan China
Other E & SE Asia CIS/Eastern Europe RoW

• Macroeconomics and steel use
• Construction sector overview
• Steel industry overview
• Long products consumption
• Rebars consumption
• International Market price situation
• Summary & Outlook
46
Table of Contents

Source: Platts
Reinforcing bars, wire rod and billet FOB price
19
Año 01/01/2012 01/01/2013 01/01/2014 01/01/2015 01/01/2016 01/01/2017 01/01/2018 01/01/2019 01/01/2020 01/01/2021 11/10/2021
Billet FOB Black Sea ($/tn) 600 525 507 395 249 398 515 405 408 580 610
Rebar FOB Turkey ($/tn) 668 600 580 505 325 433 570 450 449 640 695
Wire Rod Mesh FOB Turkey ($/tn) 681 613 585 520 360 450 605 478 458 735 790

48
Reinforcing bars spread evolution
Source: CRU
100
120
140
160
180
200
220
240
260
280
300
150
250
350
450
550
650
750
850
Spread Scrap Rebar Turkey ($ / Tn)
Rebar FOB Turkey ($/tn) Scrap CFR Turkey ($/tn) Spread Scrap Rebar Turkey ($/tn)

42 42 42 52 59
87 9279
133
216
288
0
50
100
150
200
250
300
350
01-ene 01-feb 01-mar 01-abr 01-may 01-jun 01-jul 01-ago 01-sep 01-oct
Spanish Electricity price (EUR/Mwh)
Energy price evolution
Direct energy cost effect on EAF – EUR120-130 per mt.
Indirect effect on input costs – ferroalloys, lime etc

• Macroeconomics and steel use
• Construction sector overview
• Steel industry overview
• Long products consumption
• Rebars consumption
• International Market price situation
• Summary & Outlook
51
Table of Contents

• 2021 - Uneven economic recovery after COVID. V shaped recovery invaccinated countries.
• Disruption of supply chains and shipping.
• Energy price increases.
• China construction industry update. USA infrastructure spending.
• Unprecedented economic situation.
52
Summary & Outlook

Thank you for your attention !