
6848574
395
BECElveo BY TJ C JUN 131984 NUREG/CR-3805 Vol.1 Engineering Characterization of Ground Motion Task I: Effects of Characteristics of Free-Field Motion on Structural Response Prepared by R. P. Kennedy, 8. A. Short, K. L. Merz, F. J. Tokarz/SMAI I. M. Idriss, M. S. Power, K. Sadigh/WCC Structural Mechanics Associates, Inc. Woodward-Clyde Consultants Prepared for _ -^ ^ «-.. - - ^c^,.!^^Z"•"""""' K) N O T MICROFILM 1 ^ ^ COVER MASJEll • D1STWB8TO» 9 m WCMIHIT IS W lHiTa
-
Upload
pauloandressepulveda -
Category
Documents
-
view
215 -
download
0
Transcript of 6848574

8/22/2019 6848574
http://slidepdf.com/reader/full/6848574 1/394
B E C E l v e o BY TJC JUN 1 3 1 9 8 4
NUREG/CR-3805Vol.1
Engineering Characterizationof Ground Motion
Task I: Effects of Characteristics ofFree-Field Motion on Structural Response
Prepared by R. P. Kennedy, 8. A. Short, K. L. Merz, F. J. Tokarz/SMAII. M. Idriss, M. S. Power, K. Sadigh/WCC
Structural Mechanics Associates, Inc.
Woodward-Clyde Consultants
Prepared for _ -^ ^ « - . . - -
^c^,.!^^Z"•"""""' K ) NOT MICROFILM1 ^ ^ COVER
M A S J E l l
D 1S T W B 8T O » 9 m W C M IH IT IS W l H i T a

8/22/2019 6848574
http://slidepdf.com/reader/full/6848574 2/394
w e t
^ NOTICE
This report was prepared as an account of work sponsored by an agency of the United StatesGovernment. Neither the United States Government nor any agency thereof, or any of theiremployees, makes any warranty, expressed or implied, or assumes any legal liability of responsibility for any th ird party's use, or the results of such use, of any info rm atio n, apparatus,product or process disclosed in this report, or represents that its use by such third party wouldnot infringe privately owned rights.
NOTICE
Ava ilability o f Reference Materials Cited in NRC Publications
Most documents cited in NR C pu blications wi ll be available from one of the follo win g sources:
1 . The NRC Public Document Room , 1717 H Street, N.W.Washington, DC 20555
2. The NRC/GPO Sales Program, U.S. Nuclear Regulatory Commission,Washington, DC 20555
3. The National Technical Informa tion Service, Springfield, VA 221 61
Although the listing that follows represents the majority of documents cited in NRC publications,it is not intended to be exhaustive.
Referenced documents available for inspection and copying for a fee from the NRC Public Document Room include NRC correspondence and internal NRC mem oranda; NRC O ffice of Inspectionand Enforcement bulletins, circulars, information notices, inspection and investigation notices;Licensee Event Reports ; vendor reports and correspondence; Commission papers; and applicant andlicensee documents and c orrespondence.
The following documents in the NUREG series are available for purchase from the NRC/GPO SalesProgram: form al NR C staff and contrac tor reports, NRC -sponsored conference proceedings, andNRC booklets and brochures. Also available are Regulatory Guides, NRC regulations in the Code ofFederal Regulations, and Nuclear Regulatory Commission Issuances.
Documents available from the National Technical Information Service include NUREG seriesreports and technical reports prepared by other federal agencies and reports prepared by the AtomicEnergy Commission, forerunner agency to the Nuclear Regulatory Commission.
Documents available from public and special technical libraries include all open literature items,such as books, journa l and p eriodical articles, a/nd transactions. Federal Register notices, federal andstate legislation, and congressional reports can usually be obtaine d fr om these libraries.
Documents such as theses, dissertations, foreign reports and translations, and non-NRC conferenceproceedings are available for purchase from the organization sponsoring the publication cited.
Single copies of NRC d raf t reports are available free, to the extent of su pply , upon wri tte n requestto the Division of Technical Information and Document Control, U.S. Nuclear Regulatory Commission, Washington, DC 205 55.
Copies of industry codes and standards used in a substantive manner in the NRC regulatory processare maintained at the NRC Library, 7920 Norfolk Avenue, Bethesda, Maryland, and are availablethere for reference use by the public. Codes and standards are usually copyrighted and may bepurchased from the originating organization or, if they are American National Standards, from theAmerican National Standards Institute, 1430 Broadway, New York, NY 10018.
GPO Printed copy price: $ 8 . 5 0

8/22/2019 6848574
http://slidepdf.com/reader/full/6848574 3/394
DISCLAIMER
This report was prepared as an account of work sponsored by anagency of the United States Government. Neither the United StatesGovernment nor any agency Thereof, nor any of their employees,makes any warranty, express or implied, or assumes any legalliability or responsibility for the accuracy, completeness, or usefulness of any information, apparatus, product, or processdisclosed, or represents that its use would not infringe privatelyowned rights. Reference herein to any specific commercial product,process, or service by trade name, trademark, manufacturer, or otherwise does not necessarily constitute or imply its endorsement,recommendation, or favoring by the United States Government or anyagency thereof. The views and opinions of authors expressed hereindo not necessarily state or reflect those of the United StatesGovernment or any agency thereof.

8/22/2019 6848574
http://slidepdf.com/reader/full/6848574 4/394
DISCLAIMER
Portions of this document may be illegible inelectronic image products. Images are producedfrom the best available original document.

8/22/2019 6848574
http://slidepdf.com/reader/full/6848574 5/394
NUREG/CR—3805-Vol
DE84 901344
Engineering Characterizationof Ground iViotion
Tasl< I: Effects of Characteristics ofFree-Field Motion on Structural Response
Manuscript Completed: February 1984
Date Published: May 1984
Prepared by
R. P. Kennedy, S. A. Short, K. L. Merz, F. J. Tokarz, Structural Mechanics Associates, Inc.
I. M. Idriss, M. S. Power, K. Sadigh, Woodward-Clyde Consultants
Structural Mechanics Associates, Inc.
Newport Beach, CA 92660
Under Contract to:
Woodward-Clyde Consultants
Walnut Creek, CA 94596
Prepared forDiv is ion of Engineer ing TechnologyOf f ice of Nuclear Regulatory ResearchU.S. Nuclear Regulatory Commiss ionW a s h i n g to n , D.C. 20555
NRC FIN B6680 DISCLAIMER
This report was prepared as an account of work sponsored by an agency of the United StatesGovernment. Neither the United States Government nor any agency thereof, nor any of theiremployees, makes any warranty, express or implied, or assumes any legal liability or responsi
bility for the accuracy, completeness, or usefulness of any information, apparatus, product, orprocess disclosed, or represents that its use would not infringe privately owned rights. Reference herein to any specific commercial product, process, or service by trade name, trademark,manufacturer, or otherwise does not necessarily constitute or imply its endorsement, recommendation, or favoring by the United States Government or any agency thereof. The viewsand opinions of authors expressed herein do not necessarily state or reflect those of the
United States Government or any agency thereof.
J o l s l i l e a t a l i a W l l t f .
O is ii iiBinioi Of m mcuMEJiT is UNLIMITED

8/22/2019 6848574
http://slidepdf.com/reader/full/6848574 6/394

8/22/2019 6848574
http://slidepdf.com/reader/full/6848574 7/394
FOREWORD
This report presents the results of the first task of a two-task
study on the engineering characterization of earthquake ground motion for
nuclear power plant desig n. The overall objec tive of this study is to
develop reco mmendations for methods for selecting design response spectra
or accel eratio n tine histories to be used to characterize motion at the
foundation level of nuclear power plant s.
Task I of the study, presented h erein , develops a basis for
selecting design response spe ctra, taking into account the characteris
tics of free-field ground motion found to be significant in causingstructural d ama ge. Task II of the stu dy , to be completed later in 1984,
will provide recomm endations for methods for selecting response spectra
and time histories incorporating wave passage and soil-structure inter
action effects and Task I results.
This study is being conducted under Contract No. NRC 04-80-192
with the U.S. Nuclear Regulatory Commission ( U S N R C ) . Woodward-Clyde
Consultants (WCC) is the prime contractor for the project. Task I has
been carried out primarily by Structural Mechanics Ass oci ate s, Inc.
( S M A ) , as a subcontractor to WCC.
In additio n to the listed aut hors o f this repo rt, several
individuals made important contribu tions to the study. These individuals
included T. R. Kipp and H. Banon of SMA ; and C.-Y. Chang and R. R.
Youngs of WCC. Project consult ants, W. J. Hall of the University of
Illinois, Champaign ; J. E. Luco of the University of Cali fornia, San
Diego; J. M. Roesset of the University of T e x a s , Austi n; H. B. Seed ofthe University of Californ ia, Berkeley; and N. C. Tsai of NCT Engi
neering, I nc., Lafay ette, Californi a, provided a detailed review of
draft versions of the report and made many useful com ments . J. F.
Costello provided overall technical guidanc e and review in his role
as technical representativ e of the USNRC for this research project.
lii/iv

8/22/2019 6848574
http://slidepdf.com/reader/full/6848574 8/394

8/22/2019 6848574
http://slidepdf.com/reader/full/6848574 9/394
TABLE OF CONTENTS
Section Title Page
1 INTR ODUC TION 1-1
1.1 Backgrou nd (Literatu re Revi ew) 1-1
1.1.1 Effect ive Ground Acce lera tion for
Ancho ring Elastic Spectra 1-3
1.1.2 Effect of Duration on Damage Capability . . . . 1-8
1.2 Conclus ions Reached from a Review of Structural
Damag e from Past Earthquake s 1-11
1.3 Charac teriza tion of Struct ure Damage 1-14
1.4 Obj ect ive of this Study 1-17
1.5 Stud y Appr oach 1-19
1.6 Repo rt Out lin e 1-20
2 ENGINEERING CHARACTERIZATION OF GROUND MOTION
FOR RECORDS STUDI ED 2-1
2.1 Energ y, Power and Duration Content 2-3
2.2 Frequency Conten t 2-6
2.2.1 Respon se Spectra 2-6
2.2.2 Cumulative Power Spectral DensityFunctions 2-9
2.2.3 Moments of the Spectral Density
Function 2-11
2.2.4 Frequency Content Summary and
Conclusions 2-13
2.3 Engineering Characterization needed for
Elastic Respon se 2-15
2.4 Engineering Characterization of Ground
Motion Summary 2-22
3 TECHNICAL APPROACH FOR NONLINEAR STRUCTURAL
RESPONSE ANALYSES 3-13.1 Representative Nonlinear Structural
Response Resistance Functions 3-1
3.2 Detailed Descrip tion of Shear Wall Model 3-4
3.2.1 Rules for Construct ing Shear Wall
Resist ance Function Model 3-4
3.2.2 Resist ance Function Properties Used
in this Study 3-8
3.2.3 Dynamic Propertie s Used in this Study 3-10
v

8/22/2019 6848574
http://slidepdf.com/reader/full/6848574 10/394
TABLE OF CONTENTS (Continued)
Section Title Page
3.3 Simplified Methods to Approxim ate
Nonlinear Structural Response 3-12
3.3.1 Equivalent Linear Resistance
Function Models 3-13
3.3.2 Inelastic Spectra Deamplification
Factors 3-16
4 NONLINEAR STRUCTURAL RESPONSE ANALYSIS RESULTS
AND COMPARISON TO PREDICTION EQUATIONS 4-1
4.1 Input Scale Factor Results for Ground
Motion Studied 4-2
4.1.1 Dura tion Effects 4-2
4.1.2 Freque ncy Effects 4-3
4.1.3 Influence of Frequency Shift from
Elastic to Secant Frequency 4-3
4.2 Number of Strong Nonlinear Response Cycles 4-5
4.3 Comparison of Computed Scale Factors withthose Predicted by Equivalent Linear
Response Models 4-7
4.4 Comparison of Computed Scale Factors with
those Predicted by Inelastic Response Spectra 4-12
4.5 Conclusions on Predicting Inelastic Response 4-17
5 GROUND MOTION CHARACTERIZATION FOR NONLINEAR RESPONSE . . . 5-1
5.1 Inela stic R.G. 1.60 Spec tra 5-1
5.2 Predicted Inelastic Spectra for Real
Time Histori es 5-3
5.3 Comparison of Inelastic Spectra to
R.G. 1.60 Inelasti c Spectr a 5-4
5.4 Ground Motio n Characterization for
Nonlinear Response Summary 5-8
6 MEASURE OF RELATIVE STRENGTH OF GROUND MOTION
RECORDS 6-1
6.1 App roa ch 6-1
6.2 Relative Strengths of Ground Motion
Records Studied 6-3
6.3 Relative Strength SUMMARY 6-6
vi

8/22/2019 6848574
http://slidepdf.com/reader/full/6848574 11/394
TABLE OF CONTENTS (Continued)
Section Title Page
7 CONCLUSIONS 7-1
7.1 Engineer ing Charact erizat ion of
Ground Motion 7-1
7.2 Predict ion of Inelastic Spectral
Deamplification Factors and
Inelastic Response Spectra 7-6
7.3 Measur e of Relative Strength of
Ground Moti on Records 7-15
8 REFER ENCES 8-1
APPENDICES:
A LITERATURE REVIEW: EARTHQUAKE STRUCTURAL DAMAGE A-1
B INPUT GROUND MOTION DATA B-1
C TECHNICAL BACKGROUND ON EQUIVALENT LINEAR
RESISTANCE FUNCTION MODELS C-1
D PARAMETER STUDIES TO DETERMINE SENSITIVITY OF
NONLINEAR RESPONSE RESULTS TO PROPERTIES OF
THE RESISTANCE FUNCTION MODEL . D-1
E STRUCTURAL EVALUATION OF EL CENTRO STEAM PLANT
UNIT 4 SUBJECTED TO TH E 1979 IMPERIAL VALLEY
EARTHQUAKE E-1
vii

8/22/2019 6848574
http://slidepdf.com/reader/full/6848574 12/394
1 . INTRODUCTION
This re po rt pro vides a summary of the re su lts obtained du ring
the f i r s t phase of an ongoing pro jec t with the ob jec t ive o f pr ovid ing
guidance and the development of procedures fo r the ch ar ac te riz at io n of
earthquake ground motion used for design of nuclear power plant struc
t u r e s . The ov er all study e ff o r t is divide d in to two separate tasks :
I : The development of a bas is fo r se le ct in g design responsespectra based on f r e e -f ie ld mo t ion.
I I : The development of recommendations for methods forselect ing design response spectra and t ime histories to beused as input motions at the foundation level.
This re po rt is concerned w ith the Task I e f fo r t o nl y. The work performed
co nsis ts of (1 ) the development of a procedure fo r e stim atin g redu ction
factors that provide equal-damage effect ive response spectra, (2) the
comparison of ground motions on the basis of equal structural damage
po te n tia l and (3) a review of the design basis and observed behavior o f
actual structures due to past damaging earthquakes.
1 .1 BACKGROUND (LITERATURE REVIEW)
The ground motion in pu t fo r the seism ic ev alu ati on and design of
nuclear power plants is ge ne ra lly de fined i n terms of a design response
spectrum fo r which the stru ct u re is expected to remain e la s ti c . The
design response spectrum is generally a broadbanded spectrum with broad
frequency con ten t. I t expresses the peak lin e a r response of a whole
ser ies of s ingle-degree-of- f reedom o sc i l l at or s at a spe ci f ied damping
l e v e l . Either site-independent or site-dependent response spectra are
s p e c i f i e d . A site-independent sprectrum uses a broad standard spectrum
shape which is considered ap plic ab le to a wide range of loc al geo logic
and seismological condit ions, while a site-dependent spectrum tends to be
less broadbanded as i t depends at lea st in pa rt on p a rt ic u la r loc al s it e
co nd it ion s. F igure 1-1 presents a repres entat ive s i te- independent
1-1

8/22/2019 6848574
http://slidepdf.com/reader/full/6848574 13/394
response spectrum which has been commonly used for nuclear power plants
in the United States [USNRC ( 1 9 7 3 a ) ] . This s pectr um (as well as most
other site-independent spectra) is anchored to a design ground acceler
ation with the entire spectrum normally being defined in terms of this
one ground motion para mete r. Newmark (1973) states that in the frequency
region of interest (approxima tely 1.8 to 10 Hz) for stiff nuclear power
plant s tructure s, the design spectra are most appropria tely anchored to
the design ground accel erati on. Th us , as a minimum the ground motion
parameter which must be defined is the design ground accele ration .
Seismologists have tended to concentrate on defining ground
motion in terms of an instrumental peak acc elera tion, which represent s
the absolute peak acceleration recorded during the entire earthquakemotion by a reliable strong-moti on instrument situated at the free ground
surface (i.e., not significan tly influenced by soil-stru cture interaction
or local topographic con dit ion s). This parameter represents a relatively
easily determined quantitative value not strongly influenced by subjective
judg ment s. Unfortunately, as illustrated by many studies (e.g., see
Hoffman , 1 974; Page and ot hers, 1972; Housner, 1975, 1979; Housner and
Jennings , 1977; Newmark, 1975; Blume, 1979; Nuttli, 1979 , Kennedy, 1 9 8 0 ) ,
the instrumental peak accel eration is, by itsel f, a poor measur e of the
damaging potential of earthqua ke ground mo tio ns. It has been noted, par
ticularly in connection with near-source motions due to low-to-moderate-
magnitude earthqu akes, that structures have performed much better during
earthq uakes than would be predicted co nsidering the instrumental peak
acceleration to which the structures were subj ecte d. Examples of this
behavior may be seen from the 1966 Parkfield eart hqu ake , the 1971 Pacoi ma
Dam earthquake record, the 1972 Ancona earthquak es, and the 1972 Melendy
Ranch Barn earthqu ake reco rd. These earthq uake record s had instrumental
peak accel erations of between 0.5 and 1.2g and ye t, only minor damageoccurred in the vicinity of the recording sit es. In these cases and
others, the differences in measured ground moti on, design levels, and
observed behavior is so great that it cannot be reconciled with typical
safety factors associated with elastic seismic analyses used for design .
This subject is discussed in more detail in Newmar k and Hall , 1982 .
1-2

8/22/2019 6848574
http://slidepdf.com/reader/full/6848574 14/394
The problem with instrumental peak acceleration is twofold.
First, a limited number of high freq uency spikes of high acceleration but
yery short duration have little effect on the elastic response spectra
within the region of primary interest (1.8 to 10 H z ) . This problem can
be corrected throu gh the use of a design ground ac celeration value that
is often called "effect ive peak a ccel erat ion" and is defined herein as
that accele ration at which the design resp onse spectrum is anchored at
zero-period (or y &ry high f r e q u e n c y ) . The design ground acceleration can
be defined by the methods reviewed by Kennedy (1980, 1981) if the purpose
is to anchor an elastic response spectrum for computing peak elastic
structural resp onse. Howeve r, the second problem is that an elastic
respo nse spectrum anchored to any of these design ground acceleration
values or to the instrumental peak a ccelera tion does not provide a goodmeasu re of damage to struct ures. Elastic response spectra describe
elastic response while structure damage is related to structures being
strained into the inelas tic r ange in which the duration of motio n or the
number of cycles of straining as well as the nature of such cycles sub
stantially influence the damage. The elastic spectrum ignores the effect
of duration and unde rest imate s the effect of the number of cycles of
near-peak excursions on damage.
1.1.1 Effective Ground Accelerat ion for Anchoring Elastic Spectra
Much research has been conducted for the purpose of defining
"effecti ve" design ground accelerations to use as anchor accelerations
for elastic design spectra. In gen eral , the elastic response spectrum
used in design should have a broad freq uenc y content and should be smooth
(i.e., not contain large differences in spectral amplitude for minor
shifts in natural f r e q u e n c y ) . This is required because the specific
frequency content of a future ea rthquake ground motion cannot be accu
rately specified and two different ground motions recorded at the samesite may have different frequency conten t. Howeve r, recorded instrumental
ground motions often lead to elastic response spectra with narrower fre
quency content than smooth design spectra and with many peaks and valleys
(i.e., substantial differences in the spectral response for minor shifts
in natural f r e q u e n c y ) . The narrow frequency content of the spectra and
1-3

8/22/2019 6848574
http://slidepdf.com/reader/full/6848574 15/394
the differe nces in amplitudes between peaks and valleys increases as the
effective duration of the motion decr ease s. Th us , real spectra derived
from actual short duration earthq uake re cords dif fer more from the broad
idealized design spectra than do spectra derived from the recorded long
duration reco rds . Yet normal ly, it may not be prudent in design to take
advantage of the narrow frequency content and large differences between
the amplitudes of peaks and valleys associated with these short duration
spectra be cause their frequen cy content could vary over a wide range for
different eart hqua kes. One often proposed solution to this problem is to
anchor the broad design spectrum to a reduced "effec tive" ground accel
eration such that "on the ave rage" the broad freq uenc y, smooth design
spectrum will predict about the same elastic respo nse as would be pre
dicted by the actual spec tra.
Even within the higher frequenc y range (1.8 to 10 Hz) the elasti
response spectrum values are primaril y influenced by the energy contained
within a number of cycles of ground motion and are little influenced by a
few spikes of very high acceler ation. Blume (19 79) has shown that
clipping the highest 3 0% off the measured acceleration time histor y
(using only 7 0% of the re cord, in an absolute sen se, closest to the zero
line) produced only about a 5% reduction in the elastic resp onsespectrum. Similar results have been shown by Schnabel and Seed (1973)
and Ploessel and Slosson ( 1 9 7 4 ) . Newmark (1976) has shown that the
elastic response spectrum from the 1.25g Pacoima Dam record can be
conser vative ly enveloped wit hin the freque ncy range of interest by a
broadbanded design spectrum anchored to a design ground acceleration of
0.75g. These fin dings have led to a number of recommendations for
defining an effective design acceleration, A Q , including the use of
sustained or repeatabl e peak acceleration (Nutt li, 1 9 7 9 ) , the use of an
equivalent cycl ic motion (Whitman, 1 9 7 8 ) , and the use of filtered time
histories in which high freque ncy spikes are removed by passing the
measured time histor y through an 8 to 9 Hz cutoff frequ ency filter (Page
and othe rs, 1972 ; Ploessel and Slosso n, 1 9 7 4 ) . Based upon a review of
these recom menda tion s, Kenned y (1980) has suggested that the effective
design acceleration, Ap for elastic response might be defined by:
1-4

8/22/2019 6848574
http://slidepdf.com/reader/full/6848574 16/394
AQ = 1.25 * A3P (1 -1 )
where A^p is the third highest peak acceleration from the f i l tered t ime
h is to ry re co rd . The f i l t e r chosen by Page (1972) which is centered at
8.5 Hz w ith a value of 1.0 at 8.0 Hz and 0.0 at 9.0 Hz appears t o be a
reasonable f i l t e r approach. Th is d e f in i t i on is i l l u s t ra te d us ing the
1.25g Pacoima Dam re co rd . Figure 1-2 presents the u n fi l t e re d and f i l t e r e d
Pacoima Dam rec ord . The t h ir d h ighest peak, A^p, from the f i l t e r e d
record is 0.62g as opposed to an u n fi l t e re d peak acce lera tion of ap pro xi
m ately 1 .2g. The Ap from Equation 1 -1 is 0.78g which agrees w ith
Newmark's (1976) recommendations fo r th is re co rd . On the othe r hand, fo r
the 1940 no rth -so uth El Centro reco rd i n which there were several lower
frequency near-peak excursions the design ground acceleration, Ar,, wouldbe e ss e n tia l ly equal to the instrum en tal peak acce lera tion of Q.35q by
t h i s d e f i n i t i o n .
Another approach to de f in in g an ef fe ct ive "e la st ic " design
ground motion is in terms of the energy conten t of the earthquak e. Ar ias
(1970) and Housner (1975) have suggested that E(T) given by:
. / ' - " ' . .E(T) = J a'=(t)dt (1-2)
to
can serve as a measure o f t h e total energy between time t a n d time
tg + T Q . T h e Arias Intensity i s proportional t o E ( T ) . In Equation
1-2, a(t) represents t h e instrumental acceleration at time t , a n d Tr, is
the duration o f strong motion. T h e average rate of energy input (earth
quake power) i s then given b y :
P = E(T)/T[j ( 1 - 3 )
A lt e r n a te ly , M ortgat (1 97 9), and McCann and Shah (1979) have suggested
the root-mean-square acceleration, rms, as the ground motion parameter of
in te re st . This rms acc elera t ion is g iven by:
1-5

8/22/2019 6848574
http://slidepdf.com/reader/full/6848574 17/394
rms = V P (1-4)
Both the powe r, P, and rms acceleration are heavily influenced by the pro
cedure used to select the duration of strong mot io n, T Q . Often the
duration of strong motion has been selected as the time between the first
and last excursion of the absolute acceleration above a selected percent
age of the peak accelerati on (such as 10 or 20 percen t) or the time
between the first and last crossing of a particul ar acceleration level
(such as 0.05g). Such definitions give anomalous results for durat ion,
power, and rms acceler ation for a record such as the 1940 El Centro record
which appears to consist of three distinct zones of strong motion during
the time history . Kenn edy, (1980) has suggested that the cumulative time
the ground motion exce eds a selected percentage (such as 10 perce nt) of
the peak acceleration provides a more consistent estimate of the strong
motion durati on, power , and rms acceleration for a number of reco rds.
Duration defined in this manner is referred to as T^ in this report.
In the analytical studies reported in later chapters of this
report, the strong du ration , T^ is defined by:
"""[) = """M - ''"0.05 wh er e T ^ = ma x { " T ^ } (1-5)
where T Q 75 and T Q 05 represent the time at which 75 % and 5%, respec
tively, of the total energy as measured by / a^ dt has been reached. If
the time of maximum positive or negative ground acceleration occurs after
^0.75» *'^®" ^^^ ^^""^ ^pa °^ ^^^ first zero crossing after the time of
peak acceleration is used in lieu of T Q 75. The reasons for the use of
this definitio n of duration are described in Chapter 2. Strong durati ons
by this definition are shown in Tab le 2-3. For the San Fernando recordswith peak ground accelera tions in exce ss of 0.2g, the strong durations
T Q were generally 5 to 6 seconds while T Q was generally 9 to 10
seconds. T h u s , these records might be said to have 5 to 6 seconds of
strong dura tion, or 9 to 10 seconds depending upon the strong duration
definition. By some other definiti ons, these records would have strong
durations of about 12 seco nds. The reported strong duration can differ
by more than a factor of 2 depending on the defini tion.
1-6

8/22/2019 6848574
http://slidepdf.com/reader/full/6848574 18/394
Use of the rms acceleration as the basis for the design ac celera
t i o n , A Q , has many attracti ons. It is an easily computed quantity once
a definition for T Q is accepted. As shown by Mortgat ( 1 9 7 9 ) , it
enables a design acc eleration to be selected at any desired pro bability
of excee danc e. A design acceleration defined in this fashion can be usedto define the elastic r esponse spectru m with a given probabilit y of
exce edanc e. The design acceleration is related to the rms acceleration
by:
A Q = Kp * rms (1-6)
where K is a function of the acceptable exceedance probability for each
individual peak of the time hist ory. Consider ing the design acceleration
as a median estimate of the maximum acceleration over the duration of
strong motion for a stationary random Gaussian mo tion , Vanmarcke and Lai
(1980) have determined K„ to be:
Kp = v/2 an ( 2. 8 T Q / T ^ ) ( 1- 7)
except K is not less than ^ / ^ wh ere T Q is the predominant period of
the ground motion which can be taken to be between 0.2 and 0.4 seconds
for most r ecor ds. Kenn edy (1980) has reported that Equations 1-6 and 1-7appear to work well for defining a design acceleration to which elastic
response spectra can be anchored.
The usage of Equat ions 1-2 thro ugh 1-7 can be illustrated using
the 0.7g 1972 Melend y Ranch recording (Figure 1-3) and the 0.18g 1952 Taft
recording (Figure 1-4) . Both records contain relatively similar total
energy content despite the nearly fourfol d greater instrumental peak
acceleration for the Melendy Ranch record. The Melendy Ranch record has
a much shorter strong motion duration ( T Q ) of about 1.5 seconds versus
about 16 seconds for the Taft record. With these durat ions, the design
accelerations given by Equations 1-6 and 1-7 are 0.34g for the Melendy
Ranch record and 0.14g for the Taft reco rd. The design acceleration
ranges from less than 50 percent of the instrumental peak acceleration
for Melend y Ranch to 70 percent for Taft which illustrates the expected
effect of the short duration for Melendy Ra nch.
1-7

8/22/2019 6848574
http://slidepdf.com/reader/full/6848574 19/394
For several earthquake r eco rds . Table 1-1 compares i nstrumental
peak acce lera tio ns, and design ac celerat ions given by Equatio ns 1-1 or 1-6
and 1-7 (T^ = 0.3 seconds ) based on a duration , T Q . Also presented
is the strong motion duration, T Q . In each case, the design accelera
tion from E quatio ns 1-1 or 1-6 and 1-7 is judged to be a consistent basis
for anchoring the design response spectrum for the purpose of computing
elastic response in the 1.8 to 10 Hz frequency range. One can note the
influence of duration on the rati o of A Q to Ajp (instrumental peak
accele ration ) for elastic respo nse.
Either the approach of Equation 1-1 or Equations 1-6 and 1-7 have
been reported by Kennedy (1980) to provide reasonable estimates of
"effective" design accelerations to be used to anchor elastic design
response spectra for elastic anal yses. Howe ver, it was already mentioned
that compa risons of elastic resp onse do not provide a good description of
relative damage from two different ground mot ion s. Ther efor e, neither
method of defining a design acceleration provides an adequate characteri
zation of the damage capability of earthquake ground motion in every case.
1.1.2 Effect of Duration on Damage Capa bili ty
There are energy absorbing mechanisms that occur during seismicresponse of structures that limit the resisting force levels such that a
limited number of cycles of very high acceleration input ground motion
might result in only minor damage and not affect the prim ary function of
the structural system. Such energy absorbing mechan isms include concrete
cracki ng, minor bond slip of reinforcement bars, friction at bolted
connections and other locations, and other mech anis ms. These energy
absorbing mechanisms cause nonlinear behavior of sufficient amount to
considerably reduce required design force levels from those calculated
assuming totally elastic behavio r. For each cycle of earthquake motion,
energy absorptio n has a small d eterio rating or degrading eff ect on the
structure; for sufficient numbers of cycles these degrading effects would
eventually accumulate to produce noticeable structural da mage . For
exa mpl e, when a reinforced concrete shear wall is subjected to sufficient
transverse shear forces during an earthqua ke, the concrete will crack
1-8

8/22/2019 6848574
http://slidepdf.com/reader/full/6848574 20/394
even though the steel continues to behave elastical ly. This would const i
tute acc eptabl e beha vior even for a critical facil ity such as a nuclear
power plant. Such a memb er in shear would exhibit softer unloadin g
stiffness and degrading stiffness during reloading because the concrete
cracks do not heal during unloading and the concrete begins to deterio
rat e. For a limited number of cycles of seismic response such that the
energy of the seismic excitation was less than the energy absorption
capaci ty of the struc ture , such a structur e as that described would shake
down to pseudo -elas tic behavior possibly at a reduced stiffness and
possibly with some permanent set but the structure would be stable and
safe and would not have experienc ed significant damage (Figure 1- 5) . On
the other ha nd, for a strong earth quake in which the number of cycles o ^
seismic response is such that the energy of the seismic excita tionexceeds the energy absorption capacit y of the structure, such a structure
as that described above would reach displa cement amplitudes correspo nding
to significant structural damage and possibly total collapse (Figure 1 -6 ) .
The effect of the duration of strong motion or number of cycles
of strong inelastic response is not incorporated into the low-damped
elastic response spectrum. Thu s, a given elastic spectral response would
correspond to greater damage capabil ity for a long duration earthquake
than for a short duration eart hqua ke.
Furt herm ore , it was mentioned in the previous subsection that
short duration earthquake records have narrower frequency content and
greater differences between the spectral responses at peaks versus
valleys than do longer duration reco rds . Thes e longer duration records
are richer in a broad range of frequenc y content and tend to be
smoothe r. The abilit y of structures to withstand ea rthquake ground
motions which result in elastic response spectra substant ially higherthan the elastic design response spectrum is greater for spectra which
have narrow frequ ency co ntent and ma ny peaks and valleys than it is for
smooth, broad frequency content spectra. Basically, if the elastic
structure is in resonance with the ground moti on at a frequenc y of one of
1-9

8/22/2019 6848574
http://slidepdf.com/reader/full/6848574 21/394
the peaks of the elastic spect rum, small inelastic behavior of the
struct ure will shift the structure freque ncy off the resonan t peak and
into a valley. As will be shown in subsequent chapt ers, the level of
inelastic response is more consistently predicted by the average spectral
response over a broad frequency range to the soft (lower frequenc y) side
of the elastic natural frequenc y. The difference between this frequency
averaged spectral response and the elastic natural frequency spectral
response is significantly greater for narrow frequency band elastic
spectra with large peaks and valleys than it is for broad fr equen cy
conte nt, smooth elastic spectra of the type used in design.
When one ignores duration and considers only the elastic
resp onse spectra or the design acceleration defined by Equations 1-1 or1-6 and 1-7, one would conclude that the Melendy Ranch record was more
severe than the Taft record for structures with natural frequen cies
greater than 3 Hz (see Figure 1-7 ), and the 1966 Parkfield Cholame #2
record was more severe than the 1940 El Centro record at all frequencie s
(see Figure 1-8 ). Both conclusions would be incorrect and illustrate the
inadequacy of the elastic response spectrum to define the damage
capability of an earthquake. The problem is that the elastic response
spectrum values are related primar ily to the power of the earthquake
(Equation 1-3) , or the rms acceleration (Equation 1-4 ), or the design
acceleratio n (Equations 1-1 or 1-6 and 1- 7) , whi le the d amage capability
is probably more related to the total energy fed into structure s
(Equation 1-2 ). Housner (1975) has proposed that this dilemma be solved
by a two-parame ter definition of the ground shak ing in which one para
meter could be any of the parameters relating to the power of the earth
qua ke such as the design acce lera tion fr om Equ ation s 1-1 or 1-6 and 1-7.
the other parameter should be strong motion dura tio n, T^.
1-10

8/22/2019 6848574
http://slidepdf.com/reader/full/6848574 22/394
Short (1980a and 1980b ) and Kenned y (1981a) have studied the
effect of a high a ccelerat ion, short duration record such as the Melendy
Ranch (1972, 0.52g corrected accelera tion) record on a nuclear power
plant structure designed for a long dur ati on, much lower acceleration
record like the Taft (1952, 0.18g correc ted acc ele rat ion ) recoi'd. The
shear wall-typ e structure was designed to ultimate strength for a broad
banded design spectrum anchored to 0.2g. The structure was subjected to
shaking characterized by the Melendy Ranch record. Concrete elements
were defined to have highly degrading stiffness characteristi cs. The
Mele ndy Ranch record shows maxim um 5% damped spectral acceleration in
exce ss of 1.5g in the 5 to 6 Hz frequen cy range and the str ucture was
designed to have a fundamental frequency within this range. The
nonlinear response of this structure was found to be highly stable with a
single inelastic excursion followed by pseudo-elastic behavior with a
slightly degraded st iffnes s. T h u s , a highly degrading structure designed
for a design response spectrum anchored to an "effective" ground
accelerati on of 0.2g shows per fectly satisfa ctory behavior when subjected
to the Melendy Ranch record. Ther efore , this record should be taken to
have a design acceleration value of 0.2g o r less as opposed to the
nominal values of 0.5g. In sum mar y, ignoring duration and considering
only the elastic response spectrum would lead one to conclude that the
Melendy Ranch record was more severe than the Taft record; however, this
would be an incorrect co nclusion which illustrates the inadequacy of the
elastic response spectrum to alone define the damage capability of an
earthquake.
1.2 CONCL USION S REACHED FROM A REVIEW OF STRUCTURAL DAMAGE
FROM PAST EARTHQUAKES
Appendix A summarizes the results of a literature review on
structural damage from past ear thq uak es. The primary purpose of this
review was to summarize the avai lable data on whether or not elastic
computed forces could be used to estimate the onset of significant
structural dam age. Whenever po ssible, the elastic computed forces were
compared with the design forces and/or the estimated ult imate ca pacity of
the structures reviewe d.
1-11

8/22/2019 6848574
http://slidepdf.com/reader/full/6848574 23/394
The conclusion of this review is that the inelastic energy
absorption capability of the structure, and the duration of strong ground
motion both influence structural performance and one cannot totally rely
on the elasti c computed force s in determini ng structural perf orma nce.
The onset of significant structural damage for structures which had some
seismic design was predominantly due to either:
1. Inadequate design, detailing, or construction necessary toachieve a ductile design. In other word s, the structurehad features which do not meet a strict interpretation ofthe intended provisions in the current Uniform BuildingCode for achieving a ductile design.
2 . The structure contained "weak links" such that inelastic
energy absorption was not spread throughout the structurebut was very localized. In other words , the ratio ofelastic computed forc es (dema nd) to estimated ultimatecapacity was far from uniform throughout the struct ure.
These factors appear to have at least as much and prob ably more influe nce
on the ground motion level at which significant structural damage occurs
than does the average ratio of elastic computed demand to estimated
ultimate capacity.
As discussed in Appendi x A, the ratio of elastic computed demand
to capacity was evaluated for a number of structures for the 1971 San
Fernando ea rth qua ke. So long as the structu re did not suffer from one of
the above two defi cie nci es, minor structural damage did not appear to
occur at elastic demand to capacity ratios less than about 1.5.
Similarly, significant structural damage did not appear to occur at
elast ic demand to capa city ratios less than about 2.5. These estima tes
represen t lower bounds and were s ignifi cantly exceede d in some cases
witho ut the corres pondin g dam age. For inst ance , in the case of the
Veterans Administration Hospital Building #4 1, the elastic demand to
capacity ratio exceeded 3 with essentially no structural damage.
Howe ver , this lack of even minor damage appears to be heavily influ enced
by beneficial nonlinear soil-structure interaction effects.
1-12

8/22/2019 6848574
http://slidepdf.com/reader/full/6848574 24/394
The ratio of elastic demand to capacity will be referred to as
the reduction factor or the input scale facto r, F, in subsequent chapters
of this repoi^t. This fact or F represents th e factor by which the ela stic
computed re sponse must be divided before being compared with the yieldingcapacity for the purpose of predicting a given level of structural d amag e.
Alt ern ate ly, F represent s a scale factor by which the ground motion can
be increased beyond that which corresponds to an elastic response equal
to the structural yielding capacity.
The reduction factor, F, associated with the onset of significant
structural damage appears to be influenced by the duration of strong
shak ing. The follo wing statem ents are keyed to durations T Q defined by
Equation 1-5 for con siste ncy. It was noted above that for the 1971 San
Fernando records ( T Q « 5 to 6 sec onds) the reduction facto r, F, corres
ponding to the onset of significant structural damage was at least 2.5.
Simi larl y, F corres pondin g to the onset of significant structural damage
would also appear to have been at least 2.5 for the 1952 Kern County
( T Q « 10 seconds) and the 1972 Managua earthqu akes. However, correla
tion with the onset of structural damage for well-designed buildings would
appear to require larger F factors for the 1978 Santa Barbara ( T Q « 3
s e c o n d s ) , the 1979 Imperial V alle y (generally T Q between 3 and 5 secondsfor records exceeding 0 . 2 g ) , the 1966 Parkfield ( TQ < 2 s e c o n d s ) , an d
the 1972 Ancona ( T Q < 2 second s) earthquak es. The sketchy nature of
the data does not enable the increase in F to be quantitatively defined.
Howe ver, the summation of damage data strongly suggest that F corres
ponding to the onset of significant structural damage is larger for
records with strong durations less than about 5 seco nds. Strong dura
tions less than about 5 seconds reduce the damag e potential of a given
level of ground shaking.
In summary, the literature review clearly indicates that the
characte rizatio n of ground motion by low-damped (10% and lesser dampin g)
elastic response spectra is insufficient to define the structural damage
potential of the ground mot ion . One must also consider the inelastic
1-13

8/22/2019 6848574
http://slidepdf.com/reader/full/6848574 25/394
energy absorption capability of the structure and the strong duration of
the ground motion particularly for records with strong durations by
Equation 1-5 of less than 5 seco nds. The inelastic energy absorption
reduction factor, F, appears to be at least 2.5 prior to the onset of
significant structural damage for well-designe d structures and eart hquake
strong durations greater than 5 seco nds. These observations form the
impetus for the analytical studies reported in subsequent ch apters .
1.3 CHARACTERIZAT ION OF STRUCTURE DAMAGE
This study concentrates on predicting nonlinear response of
stiffness degrading shear wall and braced frame structures with
fundamental f req uenc ies in the amplified spectral acceleratio n region
from 1.8 to 10 Hz . These structure types and fundamental frequencies are
typical of those found in nuclear power pl ants .
Representative shear force versus deformation diagrams for shear
walls and braced frames unde rgoing multiple cyc les of deformation are
shown in Figure 1-9. The structural elemen t retains its initial st iff
ness and strength characteristics up to the first nonlinear cycle. After
the first nonlinear cycle, the structure loses stiffness and streng th.
Thus , each subsequent nonlinear cycle ratchets the structure to greater
total nonlinear defor matio ns. A short duration ground motion is likely
to result in only one nonlinear cycle . With a long duration record ,
multiple nonlinear cycles occur and each subsequent cycle results in
greater deformation . Th us, one effect of a longer duration ground motion
is to result in greater total de formati ons than occur from a short
duration ground motion for a stiffness and strength degrading struc ture.
For this study, a quantitative description of damage was
required. Basically, damage can be generally related to:
1. Displacement ductility which is defined as the ratio ofmaximum deformation to yield deforma tion.
2 . Total hysteretic energy absorbed during nonlinear cycles.
1-14

8/22/2019 6848574
http://slidepdf.com/reader/full/6848574 26/394
For moment frames and in e la s t i c hinge ro ta t i o n s , the to ta l
hysteretic energy absorbed during nonlinear cycles probably best accounts
fo r the c um ulative damage th a t may occur as a re s u lt of reverse d
ine las t ic deformat ions.
However, fo r degrading s ti ff n e s s and degrading stre ng th shear
wa lls and braced frames, the displacement d u c t i l i t y also de scribes
cumulative damage because each nonlinear cycle results in increased
deformation or displacement duct i l i ty over the previous nonlinear cycle
(see Figures 1 -5, 1 -6 and 1 -9) . Thus, the maximum displacement d u c t i l i t y
reached prov ides a measure of the cum ula tive damage up to t ha t p o in t.
Furthermore, a study of m u lt ip le cycle forc e-d eform ation diagrams such as
those shown in Figure 1-9 tends to indicate that strength degradation isminor u n t i l a ce r ta in displacement d u c t i l i t y is reached. Beyond the dis
placement duct i l i ty , s t rength degradat ion increases rapidly wi th add i
t io n a l nonlinear cycles. This displacement d u c t i l i ty at which st rength
degrad ation tends to increase r a p id ly w ith subsequent cycles can be
considered to represent the onset of signif icant structural damage.
Thus, i f the onset of s ig n if ic a n t st ru ct ur a l damage is considered to
represent the l i m it of acceptable st ru ct ur a l per formance, the displace
ment d u c t i l i t y probably represents the bet ter des cr iptor of permissibledamage. Collapse would ge ne rally re qu ire a dd it io na l non linear cycles
resu l t ing in substant ia l s t rength degradat ion af ter the permiss ib le d is
placement d u c t i l i t y is reached. The refore, hy ste ret ic energy absorpt ion
for nonl inear cycles af ter the permissible displacement duct i l i ty is
reached probably provides the best descriptor of collapse for shear walls
and braced frames. Ad dit i on al research is necessary on th is su bj ec t.
For nuclear power plan t s tr u c tu re s , deformations beyond the onset
of s ig n if ic a n t st ru ct u ra l damage would ge ne rally not be considered
acceptab le . Therefore, w i th in th is s tudy, a l i m i t on permiss ib le
displacement d u c t i l i t y is used as a measure of acceptable st ru c tu ra l
performance.
1-15

8/22/2019 6848574
http://slidepdf.com/reader/full/6848574 27/394
The use of permissible displacement ductility as the descriptor
of structural performance introduces some conservative bias to this study
for short duration rec ord s. A short duration ground motion could result
in the permisible displacement ductili ty being reached without the ground
motion time history having sufficient rema ining strong motion duration to
lead to the rapid strength degradation from subsequent nonlinear cycles
necessa ry for collap se. Th us , the short duration record could lead to
the permissible displacement ductility being reached without the structure
being at the onset of collapse because of insufficient duration to the
ground motion recor d. On the other hand, for a long duration reco rd,
reaching the permissibl e displacement ductil ity would indicate the
structure was at the onset of collapse from rapid strength degradation
during subsequent nonlinear cycles.
In other wo rds , the use of a permissible displacement ductility
as a measure of damage may overem phasize the ability of short duration
ground motion records to damage shear wall and braced-frame structures.
Howe ver, this potential conservatis m in evaluatin g the effect of short
duration records was judged desirable because of the lack of understanding
on the relat ive importance of hysteretic e nergy absorption versus
displacement ductility in leading to dama ge. Even so, the reader should
note that this study ma y overempha size the ability of short duration
earthqua kes to damage shear wall and braced- frame str uctu res.
The response of nonlinear systems can be best represented graphi
cally by means of a modified respon se spectrum to reflect the effect of
nonlinear behavior (called herein an inelastic yield s p e c t r u m ) . * Consider
the structural resistance function (or primary load-deflection c u r v e ) , as
shown in Figure l - l O ( a ) . In this c ase , the total deforma tion of the
system is specified as a multi ple of the yield deform ation , 6 = \i 6
The term "inelastic yield spectrum" is somewhat of a misno mer butwill be used herein because of its common usage in the lite ratu re.
1-16

8/22/2019 6848574
http://slidepdf.com/reader/full/6848574 28/394
The fa ct or y represents the displacement d u c t i l i t y . For the response of
a s ingle-degree-of- freedom system, the y ie ld level sp ectra l acc elera t ion ,2
SA = 0) 6 m ul t ip l ie d by the mass, gives the yi e ld resistance le v e l,
Vy = Mco 6 = K6y. The in e la s ti c y ie ld spectrum is a p lo t of the
yield level spectral acceleration versus the corresponding system elastic
freq uen cy, as ind ica ted i n Figure l- lO ( b ) . I f the system had remained
li n e a r, then the system response would be the e la s ti c de form atio n, <S
and the corresponding spe ctra l ac ce ler ati on lev el would be given by2
SA = w 6 g . jh e yield level spectral acceleration m a y then b e considered
as a reduced elastic level response or, SA = SA/F, where F is t h e
reduction factor (Application A ) . I f 6 ^ i s considered t o b e t h e elastic
response level associated with t h e input motion y , then & = M 6 i s
the response level which results from t h e scaled input moti on, y x F
(Application B). Thus, F m a y b e viewed as either an input scale factor
(Application B ) o r a s a reduction factor (Application A ) depending upon
application viewpoint. It should b e noted that t h e inelastic yield spec
trum is associated with a given level of peak deformation as specified b y
the ductilit y ratio (Application A ) . Given a deformation damage measure,
the inelastic yield spectrum o r input scale factors provide t h e format
for comparing input motion s o n t h e basis o f equal inelastic structural
r e s p o n s e . T h u s , f o r a permissible displacement o f ductility, t h e inelas
tic yield spectrum represents th e "effective" response spectrum. T h e
definition o f equal-damage response spectra allows t w o records with t h e
same effective spectral acceleration at a structural natural frequency t o
cause t h e same level of nonlinear structural response.
1.4 OBJECTIVE OF THIS STUDY
In t h e previous subsections it w a s shown that t h e low-damped
elastic spectral response does not provide a consistent descriptor o f
damage f o r short duration versus long duration ground motion records.
The elastic spectral response would indicate much greater damage t o a 5 H z
structure from t h e ^ e r y short duration Melendy Ranch record than from t h e
long duration Taft record (see Figure 1 -7 ). Yet, a detailed nonlinear
analyses o f a nuclear power plant structure showed that if this plant w a s
1-17

8/22/2019 6848574
http://slidepdf.com/reader/full/6848574 29/394
designed for the 0.18g Taft record, the structure would not be ser iously
damaged by th e 0.52g Melendy Ranch record because i t on ly undergoes one
cycle of nonl inear deform ation. There is in s u ff ic ie n t energy content in
the shor t d urat ion record to ratche t a degrading s t i f f ne ss s tru ctu re tof a i l u r e .
The objective of this study was to determine what ground motion
ch a ra ct e ri st ic s do provide a good de sc rip to r of damage fo r degrading
sti f fness ducti le structures such as those found in nuclear power plants.
Thus, th is s tudy w i l l def ine a procedure fo r developing " e f fe ct iv e"
spectral responses such that two ground motion records with the same
"e ff e ct iv e" spec tra l responses at the s tructures natura l f requency w i l l
lead to the same displacement d u c t i l i t y . Thus, us ing the "e f f e ct iv e "
response spectra as input to an e la st ic analysis and design w i l l re su lt
in the permissible system displacement ducti l i ty being reached for both
ac tua l t ime h is to r ies .
These "e f f e c t iv e " response spec tra then serve as a means of
des cr ibing the re la ti v e damage ca p a b il i ty of di ff e re n t ground motion t ime
h is to ri e s and thus serve as a means of p ro vid ing an eng ineering ch ara cte r
iz at io n of the ground mo tion. The ch ara cte r iza tio n of the ground motionby "e ff e c ti v e " s pec tral responses provides a be tter en gineering chara cter
iz at io n of the ground motion than does the instrume ntal peak a cc el er at io n,
or the elastic spectral responses.
I t w i l l be shown th at the "e f fe c t iv e " spe ctra l responses can be
approximated by the highly-damped average sp ec tra l ac ce le ra tio n over a
frequency range to the soft ( f lex ib le) s ide of the e last ic natura l
frequency. Thus, the highly-damped spe ctral ac cele ration w ith in t h is
frequen cy range can serve as a method of p ro vi d in g an en gin ee ring charac
te r i z a ti o n of the ground mo tion. De tai ls w i l l be presented in subsequent
chapters .
1-18

8/22/2019 6848574
http://slidepdf.com/reader/full/6848574 30/394
This study is concerned with the in e la s t i c response of st ru ct ur a l
systems (braced frames and shear w a lls ) and the concept of " e ff e c ti v e "
sp ec tra l response is considerd va li d fo r such systems. The re su lts of
th is study can also probab ly be ex trap ola ted to d u c ti le passive equipmentwhose f r a g i l i t y is governed by st ru ct u ra l fa i l u r e modes. However, the
study is probably not appropriate for act ive equipment.
1.5 STUDY APPROACH
The study effort was subdivided into three major subtasks:
(1) a na lyt ic al s tudies to develop an est ima t ion procedure fo r in e la st ic
y ie ld spe ctra; (2) a demonstration of "e f fe ct iv e " ground motion compari
sons on the basis of equal damage; and (3) a literature review to documentand evaluate the observed performance of structures during past damaging
earthquakes. The major study e ff o rt was associated with the a n al yt ic al
subtask. The a na ly t ic al studies were fu rt h e r subdivided in to the
fol lowing study increments:
(a) The se le cti on and ev alu atio n of a group of stron g motion\ e c o r d s which encompass a wide range of poss ible f r e e - f i e l d
input mot ions.
(b) A review of the in e la s ti c beh avior of primary power plantst ru ct u ra l co nf ig ura t ion s and components.
(c) The d e f i n i t io n of a set of represe ntat ive st r uc tu ra l systemmodels with the overall nonlinear response behaviorat t r ibuted to power plant st ructural types.
(d) The development of an an alys is procedure fo r de term inatio nof reduct ion factors based upon input scaling.
(e) The determ inat ion and ev alu at io n of a set of input scalefactors (reduct ion factors) which correspond to two
d if fe re n t damage (deforma tion) le ve ls .( f ) The development and co rr e la ti o n of an inp ut scale fa ct or or
reduct ion factor est imation procedui^e.
(q) The development of "e ff e c t i v e " spe ctra using th is reduc t ionfactor procedu<^e.
1-19

8/22/2019 6848574
http://slidepdf.com/reader/full/6848574 31/394
1.6 REPORT OUTLINE
The ground motion r ecor ds used in this study are described in
Chapter 2. Engineering characterizat ion defining both the time and
frequency characteristics of these records are presented and discussed.Minimum engineering characterizations to define elastic response of these
records are discussed.
The structural mo dels and analytical approach used in this study
are presented in Chapter 3. The primary structural model used consisted
of a degrading st iffn ess, degrading s trengt h, pinched behavior shear wall
model developed to closely approximate the shear wall behavior shown in
Figure 1-9. This model was specified as having 7 percent elastic damping.
Nonlinear response of such mode ls with initial (elastic ) natural freque n
cies of 2.1, 3.2, 5.3, and 8.5 Hz was studied . These natural frequencie s
are approximately equally-spaced within the frequency range from 1.8 to 10
Hz which covers the range of fundamental frequencies for the majority of
nuclear power plant building stru ctur es. The study concentrated on pre
dicting the nonlinear reduction factor, F, associated with ductility
ratios of 1.85 and 4.3. These ductility ratios were considered to repre
sent lower bounds on the onset of minor s tructura l damage and the onset
of significant structural damage, respectively.
Model parameter variation studies were also conducted (Appendix
D ) . For a few ca ses, damping was reduced to 3 percent elastic damping to
determine the effect of elastic damping on the reduction facto r. The
nonlinear force-deformation characteristi cs were modified to study the
effect of such charac teri stic s. Lastly , a few cases were also analyzed
for a nonlinear model representing the braced-frame characteris tics in
Figure 1-9.
The study results are presented in Chapter 4 in terms of
response reduction fact ors, F, obtained from a series of nonlinear
analyses using the ground motions and structure models described in
Chapters 2 and 3. Statistical studies performed on these reduction
1-20

8/22/2019 6848574
http://slidepdf.com/reader/full/6848574 32/394
factors are prese nted. A method to derive these reduction factors from
the characteristics of the elastic response spectra and the structural
model is present ed.
A method to define an "effecti ve" resp onse spectrum using the
results of Chapt er 4 is presen ted in detail in Chapt er 5. This meth od
requires only a knowledge of the nonlinear ch aracteristics of the
struc ture model and the elast ic response spect>-a. "Effect ive" response
spectra are presented for the ground motion time histories studied.
The relative strengths of the ground motion records used in this
study in terms of ela stic (y = 1.0) and i nelas tic (y = 1.85 and 4.3)
structural response for stiff structures (f = 1.8 to 10 Hz) are describedin Chapte r 6.
Lastly, conclusions from these analytical studies are summarized
in Chapter 7.
1-21

8/22/2019 6848574
http://slidepdf.com/reader/full/6848574 33/394
TABLE 1-1
INSTRUMENTAL PEAK VERSUS DESIGN ACCELER ATIONS
Earthquake Records
Melendy Ranch N61E
N29W
Parkfield, Cholame #2 N65E
Temblor S25W
Pacoima Dam N76W
Hollywood Storage SOOW
PE Lot N90E1
El Centre 1940 NS
Olympia N86E
Taft S69E
1*
Instrumental Peak Accel
Aip (g)
Uncorrected
.50
.70
.51
.41
1.25
.19
.22
.37
.31
.20
Corrected
.48
.52
.49
.35
1.07
.17
.21
.35
.28
.18
Elastic Response
Design Accel .
A , (g)
1.25*A3p
0.40
0.45
0.500.26
0.78
0.150.21
0.30
0.21
0.14
K *RMSP
0.36
0.34
0.41
0.26
0.78
0.15
0.19
0.28
0.21
0.14
Strong Duration
T[3"(Sec)
1.2
1.5
4. 4
4. 2
5.7
9.3
9.0
13.1
13.1
16.1
* As reported by California Institute o f Technology

8/22/2019 6848574
http://slidepdf.com/reader/full/6848574 34/394
S.0 ro 1JI
PERIOD. IN SECONDS
as 02 0.1 aos 0.02 0.01
1000
100
10
0.3
\
V/ "
/
^
^
/
' ^ ••
1 \p i tnp in
yt2
'
\
factor(ptfo
^
••5V-—
V/ ^
nU
K:
\
^
f/'(c)
1
^ 1
1 \
~ \ \
l \ \ /
/
/
<
A11
1
A
f/
)
v
i" ^
/
1 \
^
• # ^/
y
\
a i OJ 0.5 10 20 so 100
FREQUENCY, IN HERTZ
FIGURE 1-1. SITE-INDEP ENDENT HORIZONTAL RESPONSE
SPECTRUM SCALED TO l.Og [USNRC (1973a)]
1-23

8/22/2019 6848574
http://slidepdf.com/reader/full/6848574 35/394
UNFILTERED
A V V< ^ < '* »»i * i « t y o i w V v M ^ •
I
ro
^
5Q :UJ- IUJoo<
FILTERED (/'c*8.5 Hz)
FIGURE 1 - 2 . UNFILTERED AND FILTERED ACCELEROGRAMS OF THE 1971 SAN FERNANDO EARTHQUAKE FROM THE S . 74 " W.ACCELEROGRAPH COMPONENT AT PACOIMA DAM. RESPONSE OF F ILTER I S 1 . 0 A T FREQUENCIES LESS THAN
8 HZ AND 0 . 0 AT FREQUENCIES GREATER THAN 9 HZ WITH A HALF-WAVE COSINE TAPER FROM 8 TO 9 HZ.(PAGE AND OTHERS, 1972) .

8/22/2019 6848574
http://slidepdf.com/reader/full/6848574 36/394
1972 Bear Valley Earthquake
Melendy Ranch Recording
Component N29W
i^'yhl/^'rA*/^ ^'v '^.^' '\j < » . * » ' • - n -
0.02
~ T~ • - 1 1 " - T '
-i L-
2.5 5.0 7.5 10.0 12.5 15.0 1 7.5 20.0 22.5 25.0Time (seconds)
FIGURE 1-3. ACCELE RATION A N D VARIATION O F CUMULATIVE ENERGY
WITH TIME F O R T H E 1972 BEAR VALLEY EARTHQUAKERECORDING A T MELENDY RANCH
1-25

8/22/2019 6848574
http://slidepdf.com/reader/full/6848574 37/394
co
ou
<
u
CM
I
•a
(0
- 0 . 1 -
>a>c
LU
- 0 . 2
0.04
o.m
0 . 0 } '
aoi'
1952 Kern County Earthquake
Taft. ACXM, Component S69E
""{ i f^ i^ ' i^^^^A^^^^ '^VgwV^
15 20 25 30
Time (seconds)
35 40 45 50 55
FIGURE 1-4 ACCELEROGRAM A N D VARIATION OF CUMULATIVE ENERGY WITH
TIME FOR THE 1952 KERN COUNTY EARTHQUAKE RECORDING A T TAFT
•
1-26

8/22/2019 6848574
http://slidepdf.com/reader/full/6848574 38/394
Resistance
0 - (D Init ial UncrackedConcrete Stiffness
(D - (?) Pseud o-ElasticStif fness
5. SEISMIC SHEAR FORCE-DISPLAC EMENT RELATION F OR STRUCTURAL
MEMBER WHICH SHAKES DOWN T O PSEUDO-ELASTIC BEHAVIOR
1-27

8/22/2019 6848574
http://slidepdf.com/reader/full/6848574 39/394
Deformation Associated
FIGURE 1-6. SEISMIC SHEAR FORCE-DISPLACEMENT RELATION FOR STRUCTUR E MEMBER WHICH
PROGRESSIVELY CYCLES TO DEFORMATION CORRESPONDING TO SIGNIFICA NT DAMAGE

8/22/2019 6848574
http://slidepdf.com/reader/full/6848574 40/394
1 0 " ' 2 3 y 5 6 7 8 9 J 0°1 1 — I — I I I I I r
2 3 y 5 6 7 8 9 J 0 '_ i — I I I 1 I r
2 3 y 5 6 7 8 9 j 0 '- 1 i I I I I I 1 "
- r2
TAFT
DAMPING 0.07
MELENDY RANCH
y " \
^^^•\
J
-r3
1 — I — 1 1 1 1 — r r I 1 1 — I — 1 1 1 1 — r5 6 7 8 9 ' l 0 2 3 y 5 6 7 8 9 ' l 0 T
0.52g
O.lSg
-r-3
T — I 1 1 ' I I f ,
y 5 6 7 8 'l 00-'FREQUENCY (HERTZ)
FIGURE 1-7. COMPARISON OF MELENDY RANCH A N D TAFT RESPONSE SPECTRA

8/22/2019 6848574
http://slidepdf.com/reader/full/6848574 41/394
0.6
-0.6
0.3
t 1 1-
Parkfield
^w^A^v*^
4 6 8 10 12
Time (sec)
•0.3 -
Time (sec)
(a) Accelerograms
(/> «uQ .
>, 60+ ->
( J
° 40OJ
>
-g 203QJ
^ 0
1 1 1
Damping 0.05
A ^ P a r k f i e l d
y / ^' {\ / ^-^-^^IAL V / ^ ' • ^ ^11 \ > x ^ ^1/ v ^ ' ^
- / / ^ — s ^ A El Centre'//
3 1 2 3
~ ~ n
\
\
\
4Period (sec)
GROUND RESPONSE CHARACTERISTICS FROM PARKFIELD CHOLAME #2
(1966) AND EL CENTRO (1940) EARTHQUAKE RECORDS
1-30

8/22/2019 6848574
http://slidepdf.com/reader/full/6848574 42/394
1l-S.
}M
•O t
(w) (Km)
no o
800-
aooi
4 0 0
25 0
« o o l J A
M /
m^^^^TZ/jfil fi
»-too
»1 -W / AW y^^ «
-MO
• ^ I
"^^jpy
^Hr'^l
u^^^±
^J»
Vl\\/^
n 1
HI //y^^ ^
\*mt iM i
1*
•••••««-
IM'! l
J.«ao
Vl/
/ /
/
/« IMO)
0 1
• . ? _ . v
»
11'
t m . . . ,
u i 1ITI1 *
_
I
L-p""I
(a) Shear force-shear distortion diagram f o r structuralconcrete wall test (Wang, Bertero, Popov; 1975)
H(ton)P=70t p
A (cm)
(b) Lateral force-displacem ent diagram f o r braced-steelframe (Wakabayashi; 1973)
FIGURE 1-9. CYCLIC LOAD-DEFLE CTION BEHAVIOR O F REPRESENTATIVE POWER PLANT STRUCTURAL ELEMENTS
1-31

8/22/2019 6848574
http://slidepdf.com/reader/full/6848574 43/394
M
— r
mm
T/7 - 7
^ ^ _ , U
711 f fj
2 K
M H M
Factored Seismic Input
e nO
3
II
A p p l i c a t i o n ( B )
Mu + K u =-My X 1 —*. 6
Mii + K u =- My x F —» . 6
Mli + V (u ) = -My X F — ^ y6
Appl icat ion (lO
Mli + K u = - ^
F
M u + K u = -M y
M u + V( u ) = - My y6
« m = ^ « y
(a) Structural Resistance Function f o r Single-Degree-of-FreedomRepresentation o f Overall Structural Behavior
I A = FSA (Application B)
SA =0)2$ (Application A)
• B)^Elas tic Spectrum
Inelastic Yield
Spectrum
(log f )
f = 1.8 Hz f = 10 Hz rigid
Range o f Interest f o rNuclear Structures
(b) Inelastic Yield Spectrum
FIGURE 1-10. DEFINITION O F STRUCTURAL RESISTANCE FUNCTION
AND CORRESPONDING INELASTIC YIELD SPECTRUM
1-32

8/22/2019 6848574
http://slidepdf.com/reader/full/6848574 44/394
2 . ENGINEERING CHARAC TERIZATION OF GROUND MOTION
FOR RECORDS STUDIED
Eleven real earthquake ground motion time histories and one
artificial ea rthqu ake time history were used in this study. The eleven
real records used are defined in Table 2-1 . Througho ut the study , the
record will be designated by the underlined name in Table 2-1 . On some
fig ure s, an abbreviat ed symbol will be used for each reco rd. The names
and symbols used for these 11 records a re: Taft ( T) , Olympia (0 ), El
Centro No. 12 ( E C 1 2 ) , El Centro No. 5 ( E C 5 ) , Pacoima Dam (P D) , Hollywood
Storage (H S) , Coyote Lake (C L) , Parkfield ( P A 2 ) , Gavilan College (GC),
Goleta (G) , and Melendy Ranch (MR ). The Artificial (A) time history was
a 0.2g ground motion which approximated, at low damping, the NRC Regula
tor y Guide 1.60 resp ons e spect rum a nchored to 0.2g and had a duration of
approximately 20 seco nds. It is typical of some of the more realistic
artificial time histories used in nuclear power plant dynamic ana lys es.
Table 2-1 presents the earthquake name and da te, the local
magnitu de. M L , the surface-wave magnitude , Ms , the recording station, its
distance from the fault trace on which the earthquake was located, and
the corrected peak ground accelerati on, a, and velocity, v. All time
history inputs utilized herein have been corrected and processed using
the routine processi ng procedures outlined by Hudson ( 1 9 7 9 ) . The
corrected peak ground velocity reported was obtained by integrating the
corrected acceleration record.
These real earthquake records were selected in order to have a
wide variation in ground motion charact erist ics. Local magnitudes range
from 4.7 to 7.2 with fault rupt ure dista nces ranging from less than 1 Km
to 40 Km. The corrected peak accel erati ons vary between 0.14 and 1.17g
with corrected peak velocities ranging from 1.6 to 44.6 in/sec. Figure
2-1 present s a ccelera tion time history plots of these 11 real records
2-1

8/22/2019 6848574
http://slidepdf.com/reader/full/6848574 45/394
plus the artificial recor d. All time histories have been normalized to a
peak acceleration of 0.5g in Figure 2-1 in order to make dur ation compari
sons easie r. These plots are ordered by decreasing du ration of strong
motion . The Olympia, Taft, El Centro #12, and Artificial records repre
sent long strong motion duration r eco rds . The Pacoima Dam, HollywoodStorage, El Centro #5, and Goleta records are of moderate d uration. The
Coyote Lake, Parkfield, Gavilan College and Melendy Ranch records have
short strong motion dura tio ns. The generally expected range of strong
motion durations of earthquakes with magnitudes from 4.5 through somewhat
over 7.0 are covered by the 12 tim e histories used in this stud y. The
very long strong motion durations which might occur from great earth
quakes with surface wave magnitudes greater than 8.0 are not covered by
this study.
Plots of the followin g detailed ground motion charact eristi cs
are presented in Appendix B for each of these 12 reco rds :
1. Acceleratio n time history
2 . Cumulative energy
3. 7, 10, 15, 20 and 25% damped-elastic response spectra
4. Elastic response time histories for 2, 5, and 8 Hz , 7%damped oscillator
5. Fourier spectra for the strong motion portion of theaccelerogram
6. Cumulativ e spectral densi ty functio ns for the strong motionportion of the records.
These plots fully define the time duration, frequency characteris tics,
elastic response characteristics, and energy characteristics of these
rec ord s. A careful study of these plots will show the wide variation of
ground motion charac terist ics in the 2 to 8 Hz frequ ency range included
in this study. All of these plots are ordered in descend ing order from
the longest duration record (Olympia) to the shortest duration record
(Melendy R a n c h ) . Data presented in these plots will be discussed in
subsequent subsections.
2-2

8/22/2019 6848574
http://slidepdf.com/reader/full/6848574 46/394
2 .1 E N E R G Y , P O W E R , A N D D U R A T I O N C O N T E N T
T h e t o t a l e n e r g y E ^ ( m o r e c o r r e c t l y d e f i n e d a s t h e F o u r i e r
e n e r g y ) of t h e r e c or d i s d e f i n e d b y E q u a t i o n 1 -2 i n t e g r a t e d o v e r t h e f u l l
d u r a t i o n o f t h e r e c o r d . A c u m u l a t i v e e n e r g y p l o t i s s i m p l y a p l o t o f E ( T )
v e r s u s t i m e , T , w h e r e E ( T ) is de f i n e d b y E q u a t i o n 1 -2 i n t e g r a t e d f r o m t i m e
z e r o t o t i m e T .
H o u s n e r a n d J e n n i n g s ( 1 9 7 7 ) , h a v e d e m o n s t r a t e d t h a t j E ^ m a y b e
i n t e r p r e t e d as t h e " f r e q u e n c y e n s e m b l e w o r k " a nd i s a m e a s u r e o f t h e
c a p a c i t y o f t h e g ro u nd m o t i o n t o d o w o r k o n an i d e a l i z e d u n i f o r m p o p u l a
t i o n o f s t r u c t u r e s o f aVI_ n a t ur a l f r e q u e n c i e s . F o r t h i s r e a s o n . A r i a s
( 1 9 7 0 s u g g e s t e d u s i n g ^ E^^ as a m e a s u r e o f s ei s m i c i n t e n s i t y an d s u ch
is de f i n e d a s t h e A r i a s I n t e n s i t y . O n e m i g h t t h u s c o n s i d e r E,^ o r A r i a sI n t e n s i t y t o b e a m e a s u r e o f t h e d a m a g e p o t e nt i a l o f a g r o u n d m o t i o n
r e c o r d f o r a u n i f o r m p o p u l a t i o n o f s t r u c t u r e s o v e r a l l f r e q u e n c i e s . A s
c an b e s ee n f r o m t h e p l o t s i n A p p e n d i x B , t h e t ot a l e n e r g y , E ^ , i s v e r y
p o o r l y c o r r e la t e d w i t h t h e p e a k g r o un d a c c e l e r a t i o n , a . T h i s i s o n e o f
t h e r e a s o n s w h y p e a k g r o u n d a c c e l e r a t i o n a l o n e d o e s n o t p r o v i d e a g o o d
m e a s u r e of d a m a g e . F o r i n s t a n c e , F i g u r e 2 -2 c o m p a r e s t h e Ol y m p i a a n d
M e l e n d y R a n ch r e c o r d s . M e l e n d y R a n c h h a s a c o r r e c t e d p e a k a c c e l e r a t i o n
1 .8 5 t i m e s t h a t o f O l y m p i a . Y e t , t h e t o t al e n e r g y f o r M e l e n d y R a n ch is
o n l y 5 6 % o f t h at f o r O l y m p i a .
T h e m o st c om m o n d e f i n i t i o n o f s t r o n g m o t i o n d u r a t i o n i s t h at d u e
t o T r i f u n a c a nd B r a d y ( 1 9 7 5 ) . B y t h i s d e f i n i t i o n , t h e s t r o n g m o t i o n
d u r a t i o n i s d e f i n e d a s :
^ D " ^ 0 . 9 5 • ^ 0 . 0 5 ^ ^ ' ^ ^
where TQ gg represents the time at which E (T)/E^ = 0.95 and T Q Q S i^epre-
sents the time at which E(T)/En, = 0.0 5. Thus, t h is du rat ion window
inclu des 90% of the t o ta l cum ulative en ergy. The time T^ can be defined
as the f- f ra c t io n Husid t ime since i t represents the t ime at which the
f- f ract ion of the tota l energy has occurred.
2-3

8/22/2019 6848574
http://slidepdf.com/reader/full/6848574 47/394
Howe ver, for stiff structures (1.8 to 10 Hz) such as those in
nuclear power plants. Equation 2-1 provides too long of an estimate of
strong motion duration for many re cord s. Many records contain a long tail
of oscillatory ground motion with lesser accelerations at the end of the
record which c ontinues to input energy but at a substa ntiall y lesser rate
than the earlier portion of the record. This situation is illustrated
for the Taft record in Figure 2-3. Based upon Equation 2- 1, the duration
of the Taft record would be considered to be 28.1 sec ond s. Yet, 70 % of
the total energy is input in a duration T Q of only 9.9 s econ ds. Reporti ng
the duration of the Taft record as 28.1 seconds would severely misrepre
sent its effect ive dura tion at least for stiff structur es with frequ encie s
over 2 Hz. Figure 2-4 compares the time histo ry acceleration resp onse of
an example set of simple, damped-elastic oscillators (7% damping) obtained
for represent ative long and short duration input mo tio ns . The example
oscillators were tuned to 2, 5 and 8 Hz to encompass the range of ela stic
structure frequency considered in the study. The time of peak respons e,
T , and the times, T Q Q ^ and T Q 75 are indicated for each example
oscillator respon se shown in Figure 2-4. For the records and freque ncies
considered in Figure 2-4, the time of peak res ponse, T„ ,^ , falls
between T Q Q ^ and T Q 75. Thus , at least for stiff s tructures, a more
appropriate and shorter definition of strong duration than that given by
Equation 2-1 is needed.
In order to determine a more a ppropriat e definition of strong
duratio n, a study of the time of maximum respons e was conducted for all
twelve earthquake time histories considered herein. The time of maximum
response for both elastic and nonlinear s tructures represent ative of
degrading stiffness and degrading strength shear walls was cons idered .
Shear wall st ructur e mod els with initial (elas tic) natural freq uencie s of
2.14, 3.20, 5.34, and 8.54 Hz and 7% elast ic damping were used. The time
of maxi mum dis pla cem ent res pon se, T ^^^^ for elast ic resp onse (y = 1.0) and
two levels of nonlinear response (y = 1.9 and y = 4.3) was determined for
all four natural fre que nci es. The upper bound of maximum re sponse time ,
T „ , ^ , noted for the entire set of oscilla tors w ithin a frequenc y ran ge
from 2.14 to 8.54 Hz (i.e., T ^ ^ ^ y ^ = max {TJJ,3J^>.J) can be compared to
2-4

8/22/2019 6848574
http://slidepdf.com/reader/full/6848574 48/394
v a r i o u s H u s i d r a t i o t i m e s as t a b u l a t e d in T a b l e 2-2 for e a c h of the 12
s e l e c t e d e a r t h q u a k e r e c o r d s . In T a b l e 2 - 2 , the t i m e T 0 . 9 5 , T Q . S S * T 0 . 7 5 .
T Q Q 5 are the t i m e s a s s o c i a t e d w i t h 9 5 % , 85 % 75% and 5% of the t o t a l
c u m u l a t i v e e n e r g y . The t i m e , Tpg , is the t i m e a s s o c i a t e d w i t h the f i r s t
z e r o c r o s s i n g of the a c c e l e r o g r a m f o l l o w i n g the m a x i m u m p o s i t i v e or
n e g a t i v e a c c e l e r a t i o n , w h i c h e v e r o c c u r s l a t e r in t i m e . F r o m T a b l e 2 - 2 , it
c a n be s e e n t h a t an u p p e r b o u n d on the t i m e of m a x i m u m r e s p o n s e can be
r e a s o n a b l y a p p r o x i m a t e d by:
|;:.'1^ =ma x { , -'-^ } (2-2)
I n no c a s e , was the a c t u a l u p p e r b o u n d on the t i m e of m a x i m u m r e s p o n s e
m o r e t h a n 6% g r e a t e r t h a n t h a t g i v e n by E q u a t i o n 2-2.
T h u s , E q u a t i o n 2-1 was m o d i f i e d to p r o v i d e the f o l l o w i n g
d e f i n i t i o n of e f f e c t i v e s t r o n g m o t i o n d u r a t i o n for s t i f f s t r u c t u r e s :
Ti = T M - T O . 0 5 (2-3)
E q u a t i o n 2-3 p r o v i d e s a b e t t e r d e f i n i t i o n of the r e l a t i v e l e n g t h of
s t r o n g d u r a t i o n for s t i f f s t r u c t u r e s t h a n d o e s E q u a t i o n 2-1.
W i t h the s t r o n g d u r a t i o n d e f i n e d by E q u a t i o n 2 - 3 , the H o u s n e r
p o w e r ( a v e r a g e r a t e of e n e r g y i n p u t ) d u r i n g t h i s t i m e can be d e f i n e d by:
P= f (2-4)
' D
where AE represents the cumulative energy between time TQ Qg and T|v|.
Except for Olympia and Pacoima Dam, AE is equal to 70% of E , since
T = TQ 7c. For Olympia and Pacoima Dam, Tpg exceeds TQ 75 and thus T j,
exceeds TQ 75. For Olympia and Pacoima Dam, AE equals 85%, and 82%,
respectively, of E^.
2-5

8/22/2019 6848574
http://slidepdf.com/reader/full/6848574 49/394
The d ur a tio ns , TQ and TQ, peak ground a cc el e ra tio n s, a, peak
ground velocity, v, effect ive total energy, AE, and average power, P, are
tab ula ted in Table 2-3 fo r a l l 12 records stu die d. The records are
ordered i n terms of decrea sing du ra tio n , TQ . One should note the
reasona bly poor c o rr e la ti o n between TQ and TQ. These records would have
been in a su b st a n t ia l ly d if fe re n t order i f they had been ordered by TQ
ra th e r than TQ . Thus, TQ does not serve as a good measure fo r th e
ef f ec t ive du rat ion of s t rong shak ing fo r s t i f f s t ru c tu res .
If the power of the cumulative energy plot is assumed to be
approximately constant during the effect ive durat ion window, then the
root-mean-square-accelerat ion, a^j j ,^, is also approximately constant
durin g th is in te rv a l and can be given by:
a = / P ~ ( 2- 5)rms '
A review o f t h e cumulative energy plots given in Appendix B f o r t h e 1 2
records considered in this study indicate that t h e assumption of constant
power during t h e interval defined by Equation 2 - 3 i s re as on ab l e . T h e r m s
accelerations ar e tabulated in Table 2 - 3 .
For stiff structures, t h e q u an t it i es T Q , a , v , A E , a n d P listed
in Table 2 - 3 a r e judged to provide an adequate characterization o f t h e
ground motion i n t h e time domain. It should b e noted that only t w o o f
t he q u a n t it i es T Q , A E , a n d P need b e defined. T h e third quantity follows
automatically from Equation 2 - 4 .
2.2 FREQUENCY CONTEN T
2.2.1 Response Spectra
Structural analysts a re most familiar with t h e frequency content
of ground motion records being defined b y their low-damped elastic
response spectra. Elastic response spectra f o r a l l 1 2 records a r e
presented in Figures B - 2 o f Appendix B . I t i s most informative t o group
these records into t h e following three groups in accordance with their
effective duration:
2-6

8/22/2019 6848574
http://slidepdf.com/reader/full/6848574 50/394
1. Long Duration: T Q > 9 sec.
2 . Intermediate Duration: 2.5 sec- < T Q 9 sec.
3. Short Duration: T Q < 2.5 sec.
This study considers four records in each grou p. The 7% damped elastic
response spectra normalized to Ig ground acceleration are plotted in
Figure 2-5 for each of the four records in each of the three groups and
compared to the Regulatory Guide 1.60 response spectrum.
Table 2-4 lists the 7% damped spectral accelerations at 2.14,
3.20, 5.34, and 8.54 Hz for each of the recor ds. In addition. Table 2-5
lists the v/a ratio s, the maximum 7% damped spectral acceleration
amplific ation fac tor (SA^^/a) and the freq uen cy (f^) at which th isamplification occ urs , the maximum 7% damped ve locity amplification factor
(SV /v ) and the frequ ency (f ) at which it ocu rs, and the corner
freq uenc y* (f,„) between the amplified acceleration and amplifieda V
velocity regio ns. This corner frequen cy was defined by:
^av = 2 ^ - (2-6)
m
The relationship between the corner freque ncy and the frequencies at which
the spectral acceleration and spectral velocity peak is shown schemati
cally in Figure 2-6. For short duration records such as Melendy Ranch,
the spectral acceleration and spectral velocity peak at the same
freque ncy. In this cas e, the corner frequ ency is equal to the frequency
at which both spectral responses pea k. For the longer duration recor ds,
the frequ ency, fg, at which the spectral acceleration peaks is generally
a factor of 2 or more gre ater than the frequ ency f^ at which the spectralvelocity peaks. In these ca ses, the corner frequenc y is not as
distinctly locate d. The corner frequency estimated by Equation 2-6 lies
about midway between f^ and f^.
* As used herein, the term "corner frequen cy" refers to the
interact ion of the amplified spectral acceleration and amplifiedspectral vel ocity regi ons. This definition is not the same as thatused by seismologists.
2-7

8/22/2019 6848574
http://slidepdf.com/reader/full/6848574 51/394
Equa tion 2- 3. Such spe ctra are presen ted in Figure B-4 throu gh B-5 of
Appendix B fo r the 12 t ime h is to r ie s stu die d. The sin gle -sid ed Power
Spec tra l Dens ity fu nc t io n , G ' ( f ) , i s re la ted to the Four ie r ampl i tude,
F' ( f ) , by:
G ' ( f ) = ^ ,2 -7)I Q V /
where t h e primes are used to indicate that these functions are only
evaluated within t h e time window defined by Equation 2-3. T h e Cumulative
Spectral Density function (Cum G ( f ) ) is obtained b y integrating G'(f)
from zero t o t h e frequency f .
The differing frequency characteristics o f t h e short duration
records versus t h e long duration records is clearly indicated b y t h e
Fourier spectra in Figure B - 4 o r th e Cumulative Spectral Density plots of
Figure B-5. Table 2- 6 lists t h e fre quen cie s, fj^Q, f^Q, and fgQ, at which
1 0 , 5 0 , a nd 9 0 % , r e s p e c t i ve l y , o f t h e cumulative power occurs f o r t h e 1 2
records studied. T h e range from f , Q t o f g Q represent t h e frequency range
within which 80% o f t h e power is located. T h e frequency f g Q represents
the median frequency.
The five records with durations T Q from 9.6 seconds t o 3 . 4
seconds (El Centro # 1 2 through El Centro #5) all have median frequencies
between 2 . 1 5 a n d 3 . 3 H z a n d contain significant power between at least
0.8 and 6.55 H z . T h e t w o longest duration records (Olympia and T a f t )
have similar median frequencies but do have slightly lesser frequency
bandwi dths. Even so, these records cover frequency bands from at least
1.2 t o 5 .5 H z .
As shown in Table 2-6, all five o f t h e records with strong
durations T ' o f 3 . 0 seconds and less are missing some o f t h e frequency
content o f t h e longer duration record s. Coyote Lak e, Gavilan College,
2-10

8/22/2019 6848574
http://slidepdf.com/reader/full/6848574 52/394
and Melendy Ranch are missing f requency content below the 2.5 to 3.6 Hz
r a n g e . Parkfield is missing frequency content below 1.2 Hz . Both Goleta
and Parkfield are missing high freque ncy content above about 3 Hz.
Because of either missing low or high frequency content, Goleta, Coyote
Lake, Parkfield, and Melendy Ranch have \/ery narrow amplified regions for
their response spectra as demonstrated in the previous section. The
breadth of the frequency bandwidth for Gavilan College is nearly as large
as those for Olympi a and Taft but is much less than for the other longer
duration record s. Furthermor e, the median frequency for this record
differs substan tially from that of the longer records having a much
higher median freque ncy because low frequ ency content is missing fr om
this record.
2.2.3 Moments of the Spectral Densit y FunctionVanmarcke (1972, 1975) has suggested that the moment s of the
spectral density function can be utilized to provide a measure of the
freque ncy content of a given input mo tio n. The terms X Q , XJ and ^2
denote , resp ecti vely , the zero, first, and second moment of the spectral
density function as given by:
/
oo
G'(a3)da) ( 2 - 8 )
700
coG'(a))daj ( 2 - 9 )
X' = 2nd mome nt = J a3^G'(u))dto (2-10)0
It should be noted that {x^/Z-n) serves as an alternate means of
describing the power P listed in Tabl e 2-3. Given the zero, firs t, and
second mome nt s, the central fre quency (mean f r e q u e n c y ) , fi', and
dispersion (coefficient of v a r i a t i o n ) , 6', are given by:
^' s central freque ncy (Hz) = o-^ /^ ^/x ^ (2-11 )
s * = dispersio n parameter = >il- (xp /^2'^Q (2-12)
2-11

8/22/2019 6848574
http://slidepdf.com/reader/full/6848574 53/394
Thus the frequency standard deviation, o^, is:
0^=6'^' (2-13)
The mean frequency and frequency standard deviations f o r each o f t h e 1 2
records are also listed in T a b l e 2 - 6 .
The mean frequencies, ^', all exceed t h e m e d i a n f r e q u e n ci es, f g Q ,
as o n e would expect. F o r t h e 7 longer duration records, t h e mean
frequencies l i e between 3 . 6 a n d 4 . 7 H z . T h e lower frequency f ^ g ^"• ^
1.25 t o 1 . 4 5 standard deviations below t h e mean while f g g lies from 0 . 9 5
to 1 . 2 0 standard deviations above t h e m e a n . T h u s , f o r records with
durations T p greater than about 3 s e c o n d s , t h e records c a n b e described
as having 80% o f their power within a range from -1.35 t o +1.05 standard
deviations from t h e m e a n . In t h e s e c a s e s , fi' nd a | serve as good
descriptors o f t h e frequency conten t. However, it should also b e noted
that one m a y n ot need to describe t h e specific frequency content of t hese
r e c o r d s . A l l o f these records c a n b e reasonably f i t i n t h e 1 . 8 t o 1 0 H z
range b y a single design spectrum such a s Reg. Guide 1 . 6 0 anchored t o a
design acceleration . Thu s, their frequency content i s n o t sufficiently
different from each other to require a record specific description o f t h e
f r e q u e n c y c o n t e n t .
For t h e 5 short duration records (TA < 3 . 0 s e c o n d s ) , t h e mean
f r e q u e n c y , a' , tends t o serve a s a reasonable description o f t h e central
f r e q u e n c y . H o w e v e r , t h e dispersion statistic (either a | o r 5') appears
to overpredict t h e breadth of f r e q u e nc i e s f r om f J Q t o f g g i n some cases.
For instance, f , Q lies at o n l y - 1. 0 6 , - 1 . 1 , and -0.92 standard deviations
below t h e mean frequency f o r G o l e t a , C o yo te L a k e , and Parkfield, respec
tive ly, rather than at the -1.25 t o -1.45 standard deviation range
applicable f o r t h e longer reco rds. Similarly, f g g lies at only 0.49,
0.85 a n d 0 . 3 3 standard deviations above t h e mean frequency f o r Go let a,
Coyote Lake and Parkfield, respectively, rather than at t h e 0 . 9 5 t o 1 . 2 0
standard deviation range applicable f o r t h e l on g er r e c or ds . T h u s , o n e
must be cautious in using this dispersion statistic f o r t h e short
duration records with T Q o f 3 seconds or less.
2-12

8/22/2019 6848574
http://slidepdf.com/reader/full/6848574 54/394
2.2.4 Frequ ency Content Summary and Conclus ions
The seven long duration spectra can be reasonab ly approximated
at about an 84th percent no n-exce edance probability by a Reg. Guide 1.60
spectrum or some other "smooth-design" spectrum without introducing undue
conser vatism . Th us , the concept of a smooth design spectrum is compatible
with these rec ord s. The problems with a "smooth -design " spectrum become
serious with the four short duration (Tp < 2.5 secon ds) reco rds. These
four records apparently do not have sufficient duration to develop broad
freque ncy content. Each record shows high spectral amplification only
within a narrow frequency ran ge. They cannot be fit over any broad
freque ncy range by any Reg. Guide 1.60 spectrum anchored to any design
ground accel erat ion. In fac t, the ensemble of these four records cannot
be fit by any "smooth-d esign" spec trum. If the four spectra were
avera ged, a smooth broad spectrum would result . However, this resulting
smooth spectrum would be unrepresentative of any one of the four
individual spectra which contain only narrow frequency content. Each
spectrum shows high amplification in a different frequenc y range so that
averaging the four would lead to a broad frequency content and the loss
of the frequency characteristics of the individual records.
It will be shown that breadth of the amplified r espon se regionof the elastic respons e spectra has a majo r influence on both linear and
nonlinear response of stru cture s. A narrow frequency spectrum will only
strongly excite one or two modes of a structure while a broad freque ncy
design spectrum excites many mo de s. Use of a broad frequency design
spectrum is likely to overpredict elastic response because of this
combination of modes . As a structure goes nonlinear, its "effective"
frequ ency is lowered. With a broad respo nse spectrum, this shifting of
frequen cy has only a small effect on the nonlinear respon se. On the
other hand, with a narrow response spect rum, this shifting of frequency
often has a major effect in reducin g the nonlinear resp onse . Artificial
broadenin g of the frequ ency content will lead to an overpre diction of the
damage capabil ity of this record . The most significant single conclusion
of the entire study is that any engineeri ng characterizatio n of these
2-13

8/22/2019 6848574
http://slidepdf.com/reader/full/6848574 55/394
short duration records must retain the record's narrow frequency content.
Hope ful ly, this conc lusion will not be lost because of the maz e of data
presented herein.
The most apparent solution to the above dilemma for records with
strong durati ons, Tn, less than about 3 seconds is to define a narrow-
frequ ency c ontent design spectrum and then to vary the frequ ency at which
this spectrum peaks over the range of frequenc y uncertainty for the site.
An engineering characteriza tion of the frequency content of the
records can be provided by the frequency range from f,Q to fgQ over which
8 0 % of the power is distributed and by a mean freq uency ^'. All seven of
the records with durations Tp greater than 3.0 seconds contained
freq uenc y content between at least 1.2 to 5.5 Hz . The elasti c respon se
spectra for all of these records can be reasonably fit by a single design
spectrum within the 1.8 to 10 Hz ran ge. Thu s, for these rec ords , it
appears to be unnecessary to specify the frequency content except in
terms of a standard design spectrum.
On the other hand , all short duration rec ord s, with Tp less than
about 3.0 seconds included in this study are missi ng fre quen cy conten t in
eith er the high or low range of freq uenc ies between 1.2 and 5.5 Hz. All
of these records either do not contain power below 2.5 Hz or above 3.1 Hz.
A single broadbanded design spectr um cannot be used even within the 1.8 to
10 Hz range to adequately approximate these records which miss frequency
content either below 2.5 Hz or above 3.1 Hz . These records with duration s
less than about 3 seconds should be represented by narrow frequency con
tent design spectra based upon ground motion record with similar frequency
content as defined by the frequency range from f^g to fgg. Thu s, CoyoteLake, Gavilan Colle ge, and Melendy Ranch could probably be approximated
in the 1.8 to 10 Hz range by a single nar row frequ ency design spectrum
which does not contain power below about 2.6 Hz . Parkfield and Golet a
could pr obably be approximated in the 2 to 8 Hz range by a different
narrow frequency design spectrum which doesn't contain power above about
2-14

8/22/2019 6848574
http://slidepdf.com/reader/full/6848574 56/394
3.0 Hz. For these reco rds , uncertainty in the central f requency should
be accommodated by the use of multiple narrow frequency content design
spectra with differing central frequencies rather than by a single broad
banded spectrum which will result in overcomputing damag e.
2.3 ENGINEERING CHARACTERIZATION NEEDED FOR ELASTIC RESPONSE
In order to define a design spectrum for elastic response of
structures in the 1.8 to 10 Hz freque ncy ran ge, records should be
classified as having either broad or narrow frequency content. A record
classified as having a broad frequ ency content should have at least a
freque ncy range from 1.2 Hz to 5.5 Hz needed to develop 80 % of the
cumulative power of the record. All of the records considered in this
study with effective durat ions, Tp, from Equations 2-2 and 2-3 of greater
than 3.0 seconds meet this require ment. The elastic response spectra
within the 1.8 to 10 Hz frequenc y range for these records can be approxi
mated by a single broad frequency content design spectrum such as Reg.
Guide 1.60 anchored to an "effective" accele ration. The shape of the
design spectrum and the specification of an "effective" acceleration is
sufficient to provide an engineering char acterization of these records
for computing elastic response of structures in the 1.8 to 10 hz
frequency ran ge. The concept of an "effective" acceleration is valid for
elastic response with these recor ds. Such statements cannot be made for
the five records with T Q durations of 3.0 seconds or less. None of these
records can be fit over t he 1.8 to 10 Hz frequ ency range by a broad
freque ncy content design spectrum such as Reg . Guide 1.60. For these
reco rds , the concept of an "effectiv e" anchor acceleration is not very
meaningful until narrow frequency content design spectra are developed
and specified.
To demonstrate these po ints , the 7% damped Reg . Guide 1.60
spectrum anchored at an "eff ecti ve" accelera tion is compared with the 7%
damped spectra for the 11 real earth quake time histo ries over the
frequency range from 1.8 to 10 Hz in Figures 2-7(a) through 2 - 7 ( c ) . The
"effective" acc eleration , A Q ^ , for anchoring the elastic Reg . Guide 1.60
2-15

8/22/2019 6848574
http://slidepdf.com/reader/full/6848574 57/394
spectrum was set so that 8 4% of the actual re cords spectral accelerat ions
between 1.8 and 10 Hz would lie below the Reg. Guide spect ra. In other
w o r d s , the Reg. Guide spectra is exceeded at 16% of the frequencies
between 1.8 and 10 Hz . Based upon this definiti on, the "effective"elastic anchor ac celerat ions, Apr* were determined and are shown in Table
2-7 for the 11 real rec ords . Table 2-7 also presents the maximum,
me dia n, and minimum ratios of the actual spectral accelerat ions to Re g.
Guide 1.60 spectral acceleration within the frequency range from 1.8 to
10 Hz . These ratios are defined as (SA^/SA^ g o ) ^ ^ ^ . (SA^/SA^ g Q ) ^ ^ ^ ^ ^ ^ ,
and (SA /SA, ^n) ,• . resp ecti vely . All of these ratios are reported fora 1.60 min '
the Reg. Guide spectru m being anchored at the "eff ectiv e" elastic design
acceleration. Ape*
The six real ground motion records with T Q greater than 3.0
second s (Olympia throug h El Centro #5) are all re asona bly fit by th e Reg.
Guide 1.60 spectrum anchored at Apr. For these 6 reco rds, the maximum
amount by which the actual spectral acceleration exceeds t he Reg. Guide
spectral accelerat ions between l.S and 10 Hz varies from 1.08 to 1.23
with a median -maxim um value of 1.12. The median ratio of actual spectral
acceleration to Reg. Guide spectral acceleration varies from 0.84 to 0.90
with a median-median of 0.88. Thus on the a verage, the Reg. Guide
spectrum introduc es a factor of conserva tism of (1/0.8 8) = 1.14. The
minimum ratio of actual spectral accelerati on to Re g. Guid e spectral
acceleration varies from 0.45 to 0.70. Thu s, for these 6 recor ds,
between 1.8 and 10 Hz the Reg. Guide spectrum anchored to A Q ^ ranges from
1.23 unconservative to (1/0.45) = 2.22 conse rvative with a median factor
of conservatism of 1.14. The Reg. Guide spectrum anchored to A Q ^
represents an adequate characterization of these 6 records for elastic
structural response.
The four short duration records with T Q less than 3.0 seconds
(Coyote Lake through Melendy Ranch) are clearly inadequately represented
by the Reg. Guide s pectrum anchored to A Q ^ . The maximum-maximum factor
of unconservatism is 1.66 while the minimum-minimum factor of conserva
tism is (1/0.08) = 12.5 whi le the media n-med ian factor of conserva tism is
2-16

8/22/2019 6848574
http://slidepdf.com/reader/full/6848574 58/394
(1/0. 64) = 1.56. The scatter band is simply too large when those records
are attempted to be fit by the Reg. Guide spectrum even within the 1.8 to
10 Hz frequen cy ra nge . The Reg. Guide spectrum does not serve as an
adequate representation of these records.
The Goleta record ( T Q = 3.0 sec ond s) could be placed in either
group . The fit to the Reg. Guide spectrum is better than for the four
shorter duration records but not as good as for the six longer duration
records. It is judge d tha t the fit is not adeq uate and the Goleta record
is placed with the four shorter duration records.
Development of narrow frequency design spectra would require the
considerat ion of many more records than the five short duration records
used in this study. How eve r, these five records can be utilized to
illustrat e some pro ble ms. If all five of these short duration records
were used to develop a design spectrum, the resulting spectrum would have
a broad frequency content and would represent each individual record
nearly as poorly as does the Reg. Guide 1.60 spectrum. In order to
develop narrow frequency content design sp ectrum, one must separate these
short duration records by their freque ncy conte nt. The freque ncy range
fjQ to fgQ over which 80 % of the cumulati ve power is contained canprobabl y be used for this purp ose. It might be appropria te to segregat e
these records into a high freque ncy group of records in which f J Q exceeds
2.5 Hz (Coyote Lake , Gavilan Col lege , and Melend y Ranch would belong to
this group) and a low frequency group in which fgg is less than 3.5 Hz
(Parkfield and Goleta would belong to this g r o u p ) . A mid-frequency group
of short duration records would probably also be needed to cover those
records which do not fall into either the high or low freque ncy gr oup.
Once narrow frequency design spectra are developed for these records with
T Q less than about 3.0 sec ond s, the resulting design spectrum needs to be
compared to the spectrum of the individual records similar to the
comparisons made in this study for the longer duration records and the
Reg . Guide 1.60 spectrum. It is believed that these narrow frequency
design spectrum will provide an adequate engineering characterization for
2-17

8/22/2019 6848574
http://slidepdf.com/reader/full/6848574 59/394
elasti c response of those short duration reco rds when anchored to an
appropriate "effective " accelera tion. Uncertai nties in frequency content
should be covered by requiring the central freq uen cy of these narrow
frequency design spectrum to be varied over the range of uncertaintyrather than by broadening the design spectrum.
It should be noted from the 11 real recor ds in this study that
the characteristics of narrow frequency content appears to be directly
correlat ed to short durati ons T Q of about 3.0 secon ds and less as defined
by Equation 2-2 and 2-3. Furthe rmore , the duration T Q also appears to be
hig hly co rrelated with the local ma gni tud e, M L » i'or records with ground
accelerations of 0.14g and greate r. The five records with T Q of 3.0
seconds and less all have M L of 5.7 and l ess. The six records with T Q
greater than 3.0 seconds all have M L of 6.4 and grea ter. Th us, one might
tentat ively conclude that the Reg. Guide 1.60 spectrum provides an
acceptable engineering characterization for elastic response for records
from earthq uakes with M L of about 6.0 aiid greater and does not provide an
adequate characterization for records with M L less than about 6.0. It
appears likely that records with both ground accele ratio ns of 0.14g and
greater and M L of 6.0 or less can only be characterized by narrow
frequency design spectrum and the standard usage of broad design spectra
anchored at the 84th percent ile will likely lead to substanti al
inaccuracy and generally excessive conservatism in these cas es. Note
that the SSE ground motion for nuclear power plants east of the Rocky
Mountains generally correspon ds to records with ground accelerations of
0.14g or greater and M L of 6.0 or less and thus fal ls into this cate gory .
For reco rds with broad frequ ency con tent (at least 1.2 to
5.5 H z ) , it was shown that the Reg. Guide 1.60 spectrum anchored to A Q ^provides an adequate characterization for elastic response . The next
step is to define A Q E in terms of characteristics of the ground mot ion .
Several likely candidates exist for defining A Q E * These are corrected
peak ground accel eratio n, a, rms accele ration, a ^ms . and spectrum
intensity, SI.
2-18

8/22/2019 6848574
http://slidepdf.com/reader/full/6848574 60/394
The rms acc ele ratio n over the du ratio n TQ is repo rted in Table
2-3. A median estimate o f the design acce lera tion fo r e la st ic response
is then pro vided by Equ ation 1-6 and 1-7 where the du ra tio n TQ is
subs t i tu ted fo r J^ and the predominant p e ri o d , T , i s given by:
T^ = l / f j ' (2-1 4)
in which f2' represents the central frequency from Equation 2-11 and is
l i s te d in Table 2-6 . The re su lt is an e ff ec ti ve e la s ti c rms based anchor
acce lera t ion AQ^J given by:
AQ^T = (yz SLr){2.8J^n')) Vms (2-15)
Housner (1952) has suggested that spectrum intensity could serve
as a measure o f t h e ground motion severity. Within t he frequency domain,
spectrum intensity is defined b y :
. S „ ( 6 , f )
SKB.f^-f^)= I - ^ df (2-16)
w h e r e S ^ represents the spectral velocity, e represents the appropriate
damping, f represents frequency, a nd f , t o f ^ represents t h e frequency
range o f interest. For elastic response of nuclear power plant
s t r u c t u r e s , an elastic spectrum intensity SI will be defined b y t h e 7 %
damped spectrum between 1 . 8 a n d 1 0 . 0 H z . T h u s :
SIg = S I (0.07, 1 . 8 - 10.0) (2-17)
2-19

8/22/2019 6848574
http://slidepdf.com/reader/full/6848574 61/394
With this definition, an effective elastic SI based anchor acceleration
A Q C O for anchoring the Reg. Guide 1.60 spectra can be defined as:
'DE2 18(2-18)
w h e r e A Q £ 2 is in fraction of g ra v it y un i t s, Slg is obtained from
integrating spectral velocities in inch-per-second units over a fre qu ency
range in Hz u n i t s . The factor in the denominator of Equation 2-18 has
been empirically determined by this study to achieve a mean A Q £ / A Q £ 2
ratio near unity.
T a b l e 2-7 p r e s e n t s , for each of the 11 records studied, the
corrected ground acceleration, a, the rms based acceleration, A Q ^ J , and
SIg based acceleration, A Q £ 2 for comparison with AQE obtained from
fitting the Reg. Guide Spectrum to actual ground motion spectra from 1.8
to 10 H z . All three definitions for "effective" elastic design
a c c el e r a ti o n a g r ee c l o s e l y w i th A Q £ f o r the six records (Olympia through
El Centro # 5) which can be represented by the Reg. Guide spectrum. For
these six r e c o r d s :
Ratio
AQE/a
'^DE/'^DEI
DE''' DE2
Max.
1.10
1.17
1.17
Mean
0.87
1.06
0.99
Min.
0.73
0.96
0.85
c o v 1
0.15
0.08
0.12
2-20

8/22/2019 6848574
http://slidepdf.com/reader/full/6848574 62/394
All mean ratios are close to unity and have low coefficients of
va ria tio n (COV). The use of corre cted ground ac ce le ra tio n, a, introduc es
a mean fa ct or of con servatism of (1/0 .87 ) = 1.15 and has the la rg es t
COV. Intr od uc tion of added conse rvatism in defin ing AQ^ is undesirable
since the use of the Reg. Guide 1.60 already generally introduces conser
vatism in th e 1.8 t o 10 Hz freque ncy range when compared w ith s pe ct ra from
the actual reco rds . The rms based "ef fec t ive " a cc ele rat ion , AQ^J, i n t r o
duces a mean fa c to r of u nco nse rva tism of 1.06 and has th e lowes t COV.
This mean unconservatism is negligible when one considers the conserva
tism introd uce d by the use of the Reg. Guide 1.60 spe ctrum . The SIg
based "ef fec t ive" a cce lera t ion , ADE2» tends to overemphasize the
impo rtance of the lower fre qu en cie s (near 1.8 Hz) wh ile underemp hasizing
the importance of the highe r frequ enc ies (near 10 Hz). For th is rea so n,i t has a s li g h tl y hig her COV than does A Q E I .
It is concluded th at an rms based effec tive ac ce le ra tio n, AQ^J,
defined by Equation 2-15 provides a good definition of the anchor
acceleration for the Reg. Guide 1.60 spectrum for the six longer duration
re a l r ec or ds s tu d ie d . When the Reg. Guide 1.60 spectrum i s anchored to
A Q £ J , with in t he 1.8 to 10 Hz frequency range of i n t e r e s t , th e maximum
r a t i o of (SA^/SAj gg) rang es from 1.29 to 1.05 with a median-maximum
ra ti o of 1.20 for the six records stud ied. Si m ilar ly , the median ra t i o
ran ge s from 1.05 to 0.8 3 w ith a median-median of 0 .88 wh ile th e minimum
r a t i o ra ng es from 0.76 to 0 .49 with a median-minimum of 0 .5 9. This
performance is just as good as that obtained from the empirically
determined AQ^.
For broad frequency content records (frequency content from 1.2
to 5.5 Hz) associated with duration TQ greater than 3.0 seconds, the
elast ic response character ist ics of the ground motion for structures with
freq uen cies from 1.8 to 10 Hz can be adequate ly c ha rac ter ize d by th e Reg.
Guide 1.60 spe ct ra anchored to an rms based "e ffe ct iv e" ac ce le ra tio n
defined by Equation 2-1 5. For th e si x reco rd s st u d ie d , the maximum
factor of unconservatism introduced was only 1.29, the median factor of
2-21

8/22/2019 6848574
http://slidepdf.com/reader/full/6848574 63/394
conservatism was (1/0.88) = 1.14 and the largest factor of conservatism
was (1/ 0.49) = 2.04. These uncertainties are certainl y tolera ble
considering the simplicity of this engineering characterization of the
ground motion.
2.4 ENGINEE RING CHARACTERIZATIO N OF GROUND MOTION SUMMARY
Eleven real earthquake ground motion time histories and one
artificial earthquake time history have been cons idere d. Charact eristic s
of these ground motion records have been evaluated including energy, power
and duration as well as frequency content by mean s of frequency breadth
and a central freq uenc y. Section 2.1 recommends that the strong motio n
durat ion, T Q , for stiff structures be computed from Equations 2-2 and 2-3
using cumulative energ y plots (Figure 2 - 3 ) . It is shown that this dura
tion corres ponds to the time of steepest slope (i.e., greatest power and
greatest rms acce ler atio n) from these energy plo ts. It is also shown
that T Q corr elate s well with the longest tim e to reach maximum structural
response (both for elastic and inelastic re spo nse ) for stiff structures
(1.8 to 10 Hz ) . The breadth of the range of freque ncy content can be
defined by the freq uenc y range from fjg to fgg wher e 1 0% of the cumul ative
power lies at freque ncies below fjg and 90 % of the cumulative power lies
at frequencies below fgg. Thu s, the frequency range from fjQ to fgg
contains the central 80 % of the cumulative power of the strong motion
portion ( T Q duratio n) of the record. Central frequency, fi' is defined in
accordance with Equation 2-11 in terms of moments of the spectral density
function.
The 11 real e arthqua ke ground motion s can be divided into two
groups (Group 1: Taft, Olympia, El Centro #12 , El Centro #5, Pacoima Dam
and Hollywood Storage; Group 2: Coyote Lake, Parkfield Cholame #2,
Gavilan College , Goleta and Melendy Ranc h) as foll ows:
1. Strong duration, T Q . All the Group 1 records have strongdurations of 3.4 seconds and greater while all the Group 2records have durations of 3.0 seconds and less.
2-22

8/22/2019 6848574
http://slidepdf.com/reader/full/6848574 64/394
2. Local magnit ude. M L . All the Group 1 records are from
earthq uakes with local magnitu des of 6.4 and greater while
all the Group 2 records are from- earthquakes with local
magnitudes of 5.7 and less.
3. Frequency breadth. All the Group 1 records have motionsrich in frequency content (fjQ to fgg) from at least 1.2 to5.5 H z. Each of the Group 2 records has narrower freque ncycontent than the above range (i.e., f^Q to fgg does notcover the range from 1.2 to 5.5 H z ) .
An adequate engineering characterization for elastic structural
response for stiff str uctures (1.8 to 10 Hz ) subjected to any of the 6
longer duration (Group 1) records is provided by the Re g. Guide 1.60
spectrum anchored to an "effect ive" peak accelera tion. It is shown in
Section 2.3 that this "effective" peak accel eration, A Q ^ ^ , can be definedas an rms based acceleration given by Equation 2-15. This conclusion is
not applicable to the 5 shorter duration (Group 2) rec ord s. Elastic
response from any of the five Group 2 records cannot be adequately approx
imated by the Reg . Guide 1.60 spectrum or by any other broad frequency
content spectrum . The most adequate way to characterize these records is
by a narrow-banded design spectrum obtained by averaging records with
similar central frequ encie s, Q \ and frequency bands, f^g to fgg. Uncer
tainties in central freq uenc y, n', should be covered by shifting the
central frequ ency of a narrow-banded design spectrum throughout the range
of uncert ainty and not by the use of a broad frequency content design
spectrum for stiff structures subjected to Group 2 type records.
2-23

8/22/2019 6848574
http://slidepdf.com/reader/full/6848574 65/394
T A B L E 2-1
C H A R A C T E R I S T I C S O F T H E S E L E C T E D A C C E L E RO G R A M S
ro
EARTHQUAKE
21 July
13 April
15 Oct.
15 Oct.
09 Feb.
09 Feb.
06 Aug.
27 June
28 Nov.
13 Aug.
04 Sept.
1952
1949
1979
1979
1971
1971
1979
1966
1974
1978
1972
Kern County, CA
Olympia, WA
Imperial Valley, CA
Imperial Valley, CA
San Fernando, CA
San Fernando, CA
Coyote Lake , CA
Parkfield, CA
H o i lister, CA
Santa Barbara, CA
Bear Valley, CA
MAGNITUDE
\
7.2
7.0
6.6
6.6
6.4
6.4
5.7
5.6
5.2
5.1
4.7
^S
7.7
7.0
6.9
6.9
6.6
6.6
5.6
6.4
4.5
5.6
4.3
RECORDING STATIONAND COMPONENT
Taft Lincoln School (S69E)
Highway Test Lab (N86E)
El Centro Array No.12(140)
El Centro Array No.5 (140)
Pacoima Dam (S14W)
Hollywood Stg.P.E.Lot(N90E)
Gilroy Array No.2 (050)
Cholame-Shandon No.2 (N65E)!
Gavilan College (S67W)
UCSB Goleta (180) !
Melendy Ranch (N29W)
SYMBOLS
T
0
EC12
EC5
PD
HS
CL
PA2
6C
G
MR
FAULTDISTANCE
(km)
40
29
18
1
3
21
7
< 1
13
4
6
a
(g)
0.180
0.281
0.142
0.530
1.170
0.211
0.191
0.490
0.138
0.347
0.520
V
(in/sec)
7.0
6.7
6.9
17.3
44.6
8.3
4.0
10.4
1.6
15.7
5.4

8/22/2019 6848574
http://slidepdf.com/reader/full/6848574 66/394
TABLE 2-2
COMPARISON OF UPPER BOUNDS ON PEAK ELASTIC AND INELASTIC DEFORMATION
RESPONSE TIME WITH HUSID RATIO TIMES
E a r t h q u a k e R e c o r d
( C o m p o n e n t )
1
2
3
4
5
6
7
8
9
10
11
12
O l y m p i a , W A . , 1949
( N 8 6 E )T a f t , K e r n C o . , 19 5 2
( S 6 9 E )
El Centro Array N o . 12
I m p e r i a l V a l l e y , 197 9, (140)
A r t i f i c i a l
(R.G. 1.60)
P a c o i m a D a m
S a n F e r n a n d o , 1971 ( S1 4 W )
H o l l y w o o d S t o r a g e P E L o t ,
S a n F e r n a n d o , 1971 ( N 9 0 E )
El C e n t r o A r r a y N o . 5I m p e r i a l V a l l e y , 197 9, (140)
U C S B G o l e t aS a n t a B a r b a r a , 197 8 (180)
G i l r o y A r r a y N o . , 2 , C o y o t e L a k e
1979, ( 0 5 0 )
C h o l a m e A r r a y N o . 2 , P a r k f i e l d
1966 (N65E)
G a v i l a n C o l l e g e
H o l l i s t e r , 1974 ( S 6 7 W )
M e l e n d y R a n c h B a r n , B e a r V a l l e y
1 9 72 ( N 2 9 W )
^ 0 . 9 5
( s e c )
21.7
31.8
2 5 . 0
15.0
10.0
13.5
12.7
13.6
10.0
12.4
3.4
4.1
^ 0 . 8 5
( s e c )
19.8
18.3
18.3
13.2
8.5
8.9
8.7
8.7
6.9
5.3
3.0
2.6
"•^0.75
( s e c )
19.2
14.0
16.0
11.4
8.2
7.2
7.9
6.9
4.7
4.6
2.9
2.3
^ 0 . 0 5
( s e c )
4.4
3.7
6.4
2.0
2.6
1.8
4.5
3.9
2.5
3.2
1.8
1.5
( s e c )
2 0 . 0
6.7
11.0
10.3
8.7
3.4
5.7
4.9
3.1
4.0
2.3
1.9
E l a s t i c
( y =1 . 0 )
19.9
9.9
12.0
11.5
8.6
5.1
8.2
5.1
4.5
4.5
3.0
2.3
N o n l i n e a r
^ y =1 . 9 & 4 . 3 )
T m a x ( ^ ^ ^ )
19.9
9.2
16.6
10.6
8.6
7.6
8.3
5.1
3.5
4.8
2.9
2.1
T = Upp e r bou n d on tim e of ma x i m u m res p o n s e thr o u g h o u t fre q u e n cy ran g e , f = 2.1-8.5 H z , at 7 % dam p i n g
^ ^^ and for the following du ctilit ies: Elastic (y = 1.0) and Nonlinear (y = 1.9 and 4.3)

8/22/2019 6848574
http://slidepdf.com/reader/full/6848574 67/394
TABLE 2-3
COMPARISON OF DURATION MEASU RES. PEAK GROUND ACCELERATION. PEAK GROUND VELOCITY.
ENERGY. AVERAGE POWER A N D R M S ACCELERATION OF SELECTED INPUT ACCELERATIONS
roIroat
1 Earthquake Record(Component)
1
1 2
3
4
5
6
7
8
9
10
11
12
Olympia. WA.. 1949(N86E)
Taft, Kern Co., 1952(S69E)
El Centro Array No. 12Imper ia l Val ley, 1979, (140)
A r t i f i c i a l(R.G. 1.60)
Pacoima DamSan Fernando, 1971 (S14W)
Hollywood Storage PE Lot,San Fernando. 1971 (N90E)
El Centro Array No. 5Imper ia l Val ley, 1979. (140)
UCSB GoletaSanta Barbara. 1978 (180)
Gilroy Array No. 2, Coyote Lake,
1979. (050)Cholame Array No. 2, P ar kf ie ld1966 (N65E)
Gavi lan CollegeH o l l is te r . 1974 (S67W)
Melendy Ranch Barn, Bear Valley1972 (N29W)
TD
(sec)
15.6
10.3
9.6
9 .4
6 .1
5.4
3.4
3. 0
2.2
1 .4
1 .1
0.8
TD
(sec)
17.3
28.1
18.6
13 .0
7.4
1 1 . 7
8 .2
9.7
7.5
9.2
1 .6
2.6
a(g )
0.281
0.180
0.142
0.200
1.170
0.211
0.530
0.347
0.191
0.490
0.138
0.520
AE
( i n / s e c ) K f t V s e c ' ' )
6 .7
7.0
6.9
1 1 . 3
44.6
8 .3
17 .3
15.7
4 .0
10 .4
1 .6
5.4
64.2
27.4
18.6
44.2
466.8
30.0
78.1
57.3
13 .3
86.1
2 .1
29.8
P
( g ^ x i o - 2 )
3.97
2.57
1.88
4.54
74.0
5.37
22.2
18.5
5.86
59.4
1.80
36.0
RM S Ace. 1
Vms(9)
. 0 6 3 1
. 0 5 1 1
. 0 4 3 1
. 0 6 7 1
. 2 7 2 1
. 0 7 3 1
. 1 4 9 1
.136
.077
.244
. 0 4 2 1
.190
T Q = Strong Duration (from Equation 2-3 )
AE = Fourier Input Energy E (T^)-E(T o5),E (T) = / " a ^d t
P = Average Fourier Input Power = A E / T A
T Q = Trifunac-Brady Duration = 5 - 9 5 % Range f o r / a d

8/22/2019 6848574
http://slidepdf.com/reader/full/6848574 68/394
TABLE 2-4
ELASTIC 7 PERCENT DAMPED SPECTRAL ACCELERATION
Earthquake Record
(Component)
1
2
3
4
5
6
7
8
9
10
11
12
Olympia, WA., 1949
(N86E)Taft, Kern Co., 1952
(S69E)
El Centro Array No. 12
Imperial Valley, 1979, (140)
Artificial(R.G. 1.60)
Pacoima 0am
San Fernando, 1971 (S14W)
Hollywood Storage PE Lot,
San Fernando, 1971 (N90E)
El Centro Array No. 5
Imperial Valley, 1979, (140)
UCSB GoletaSanta Barbara, 1978 (180)
Gilroy Array No., 2, Coyote Lake1979. (050)
Cholame Array No. 2, Parkfield1966 (N65E)
Gavilan CollegeHollister, 1974 (S67W)
Melendy Ranch Barn , Bear Valley1972 (N29W)
SA(g)
2.14 Hz
0.487
0.395
0.218
0,430
1.623
0.263
0.741
0.641
0.203
1.404
0.088
0.158
3.20 Hz
0.595
0.375
0.270
0.549
1.614
0.431
0.880
0.642
0.443
0.813
0.118
0.435
5.34 Hz
0.443
0.323
0.327
0.477
1.673
0.626
1.136
0.585
0.656
0.533
0.204
1.491
8.54 Hz
0.440
0.214
0.248
0.454
1.589
0.512
1.106
0.490
0.390
0.557
0.241
0.951

8/22/2019 6848574
http://slidepdf.com/reader/full/6848574 69/394
T A B L E 2-5
COMPARISON O F RESPONSE SPECTRA PARAMETERS
Earthquake Record
(Component)
1
2
3
4
5
6
7
8
9
10
11
12
Olympia, WA., 1949(N86E)
Taft, Kern Co., 1952
( S 6 9 E )
El Centro Array No. 12Imperial Valley, 1979, (140)
Artificial(R.G. 1.60)
Pacoima DamSan Fernando, 1971 (S14W)
Hollywood Storage PE Lot,San Fernando, 1971 (N90E)
El Centro Array No. 5Imperial Valley, 1979, (140)
UCSB GoletaSanta Barbara, 1978 (180)
Gilroy Array No. , 2, Coyote Lake1979. (050)
Cholame Array No. 2 , Parkfield
1966 (N65E)
Gavilan CollegeHollister, 1974 (S67W)
Melendy Ranch Bar n, Bear Valley1972 (N29W)
^/ a
in/sec/g
24.0
38.7
48.5
(56.5)
38.1
39.4
32.7
45.4
21.0
21.3
11.4
10.4
m
a
2.24
2.58
2.42
2.83
2.13
3.06
2.16
2.44
3.45
2.96
2.79
3.03
f, (Hz)
3.12
2.30
5.00
2.50
2.60
5.50
5.88
1.33
5.26
2.30
10.5
5.50
m
v
2.52
1.97
2.29
1.91
1.74
2.78
2.29
2.57
2.18
5.34
1.83
3.19
fv (^ )
1.61
1.18
0.45
0.45
0.83
0.25
0.36
1.20
3.30
1.52
2.60
5.50
fav (" '
2.3
2.1
1.3
1.6
2.0
1.7
1.8
1.3
4.6
1.6
8.3
5.5
S A ^ = M a x . Spectral Acceleration
"' 7% Damping
SV = M a x . Spectral Velocity, 7 % Damping
•

8/22/2019 6848574
http://slidepdf.com/reader/full/6848574 70/394
TABLE 2-6
COMPARISON O F FREQUENCY DOMAIN PARAMETERS
1
2
3
4
5
6
7
8
9
10
11
12
Earthquake Record(Component)
Olympia, WA., 1949(N86E)
T a f t , K e r n C o . , 1 9 5 2(S69E)
El Centro Array No. 12Imperial Valley, 1979, (140)
Artificial(R.G. 1.60)
Pacoima Dam
San Fernando, 1971 (S14W)
Hollywood Storage PE Lot,San Fernando, 1971 (N90E)
El Centro Array No. 5Imperial Valley, 1979, (140)
UCSB Goleta
S a n ta B a r b a r a , 1 9 7 8 ( 1 8 0 )Gilroy Array No. , 2, Coyote Lake1979, (050)
Cholame Array No. 2, Parkfield1966 (N65E)
Gavilan CollegeHollister, 1974 (S67W)
Melendy Ranch Barn, Bear Valley1972 (N29W)
Frequency Range (Hz)
fio
1.20
1.10
0.55
0.60
0.75
0.75
0.80
0.80
2.70
1.20
2.55
3.55
^50
3.05
2.70
3.05
2.15
2.60
3.30
2.75
1.40
4.70
1.80
6.35
5.60
^90
6.10
5.50
7.50
6.55
6.70
7.90
6.75
3.05
6.90
2.75
11.35
8.20
Mean Freq.
n' (Hz)
3.90
3.61
4.52
3.91
4.19
4.68
4.12
2.34
5.12
2.34
7.67
6.11
Std. Dev.
a f (Hz)
1.99
1.89
2.80
2.58
2.56
2.71
2.51
1.45
2.10
1.24
3.30
2.08

8/22/2019 6848574
http://slidepdf.com/reader/full/6848574 71/394
T A B L E 2-7
'EFFECTIVE" ELASTIC DESIGN ACCELE RATION
1
2
3
4
5
6
7
8
9
10
11
Earthquake Record(Component)
Olympia, WA., 1949(N86E)
Taft, Kern Co., 1952
(S69E)
El Centro Array No. 12
Imperial Valley, 1979, (140)
Pacoima Dam
San Fernando, 1971 (S14W)
Hollywood Storage PE Lot,
San Fernando, 1971 (N90E)
El Centro Array No. 5
Imperial Valley, 1979, (140)
UCSB Goleta
Santa Barbara, 1978 (180)
Gilroy Array No., 2, Coyote Lake1979, (050)
Cholame Array No. 2, Parkfield1966 (N65E)
Gavilan CollegeHollister, 1974 (S67W)
Melendy Ranch Barn , Bear Valley1972 (N29W)
(SA^/SAj_gg)*
Max.
1.12
1.23
1.09
1.08
1.14
1.11
1.33
1.15
1.16
1.66
1.14
Medi an
0.90
0.89
0.86
0.84
0.86
0.90
0.82
0.77
0.48
0.58
0.69
Min.
0.70
0.61
0.61
0.55
0.45
0.60
0.69
0.25
0.37
0.26
0.08
Effective
ElasticAcceleration
A Q , (g)
0.219
0.149
0.128
0.856
0.233
0.471
0.283
0.233
0.562
0.105
0.573
Ground
Accel.
a (g)
0.281
0.180
0.142
1.170
0.211
0.530
0.347
0.191
0.490
0.138
0.520
RMS Based
Accel.
A Q E I (g)
0.202
0.155
0.133
0.795
0.213
0.404
0.332
0.202
0.514
0.106
0.435
Spectral
Intensity
Based Accel.
% 2 (9)
0.253
0.175
0.128
0.879
0.200
0.442
0.324
0.154
0.564
0.060
0.221
* Ratios of Actual to R e g . Guide 1.60 S p e c tr a l Acc e l e r a t i o n s are reported for the
frequency range of 1.8 to 10 Hz.

8/22/2019 6848574
http://slidepdf.com/reader/full/6848574 72/394
oLP
6 . 0 0 1 2 . 0 0 18.00 2 4 . 0 0 3 0 . 0 0 3 6 . 0 0TIME (SECOND)
oLP
6 . 0 0 1 2 . 0 0 18.00 2 4 . 0 0TIME (SECOND)
3 0 . 0 0 3 6 . 0 0
oLP
O
0 . 0 0 6.00
El Centro Array No. 12
Imperial Vall ey, 1979(140;
1 2 . 0 0 18.00 2 4 . 0 0TIME (SECOND)
3 0 . 0 0 3 6 . 0 0
FIGURE 2-1. EARTHQUAKE TIME HISTORY RECORDS (NORMALIZED TO 0 . 5 g )
2-31

8/22/2019 6848574
http://slidepdf.com/reader/full/6848574 73/394
oLP
0 . 0 0 6.00 1 2 . 0 0
r iME
1 8 . 0 0 2 4 . 0 0
(SECOND)
3 0 . 0 0 3 6 . 0 0
aLP
0 . 0 0 6.00
< y \ ^ , v V L I t,, >...ii , t^f I,..
Pacoima Dam
San Fernand o,1971 (S14W)
^^•4\fv •—
1 2 . 0 0 18 .00 2 4 . 0 0
TIME (SECOND)
3 0 . 0 0 3 5 . 0 0
oLP
0 . 0 0 6.00 1 2 . 0 0 18.00 2 4 . 0 0 3 0 . 0 0 3 6 . 0 0
riME (SECOND)
FIGURE 2-1. EARTHQUAKE TIME HISTORY RECORDS (NORMALIZED TO 0 . 5 g )
(Continued)%
2-32

8/22/2019 6848574
http://slidepdf.com/reader/full/6848574 74/394
oIP
Ooo
LLJ
C JC J
cr. oLP
o .0 . 0 0 6 . 0 0
El Cent ro Array No. 5
I m p e r i a l V a l l e y , 1979 (140)
^ / ^ J \ ^ ^ y v r ^ ^ V ^ ' / ' ' V ^ - ^ i > V ' ^ V " " ~ " v '
1 2 . 0 0 18 .00 2 4 . 0 0
TIME (SECOND)
3 0 . 0 0 3 6 . 0 0
oLP
O
CD
oo
LUC JC J
L P
0 . 0 0 6 . 0 0
UCSB GoletaSanta Barbara. 1978 (180)
A . S, yr y * f t ^ y \ ^ . - r t ^ n.^ »fV^
1 2 . 0 0 18 .00 2 4 . 0 0
TIME (SECOND)
3 0 . 0 0 3 6 . 0 0
oLP
0 . 0 0
Gilroy Array N o . 2Coyote Lake. 1979 (050)
6 . 0 0 1 2 . 0 0 18 .00 2 4 . 0 0
TIME (SECOND)
3 0 . 0 0 3 6 . 0 0
FIGURE 2-1. EARTHQUAKE TIME HISTORY RECORDS (NORMALIZED TO 0 . 5 g )
(Continued)
2-33

8/22/2019 6848574
http://slidepdf.com/reader/full/6848574 75/394
oLP
O
oo
CJCJC E O
LP
0 . 0 0 6 . 0 0
Cholame Array No.2
Parkfield. 1966 (N65E)
y/V'^'v'^' -V- ••'' ' ^ -''• ' ' ""•
12.0 0 18.00 24. 00 30. 00 36 .0
TIME (SECOND)
oLP
O
I
0.00
^•WW^NWyw^'V"*'*"
G a v i l a n C o l l e g e
H o l l i s t e r . 1 9 7 4 ( S 6 7 W )
e'. 00 12.0 0 18.0 0 24. 00
T I M E ( S E C O N D )3 0 . 0 0 3 6 . 0
oLP
o
CJ
oo
LJ J
C JC J
c n oLP
o_t
" W n lIW|PlfV^^"'^'^' • ^ " •"
1 • 1
Melendy Ranch Barn
Bear Valley. 1972 (N29W)
1 1 1
0. 00 6.0 0 12.0 0 18. 00 24. 00 30. 00 36. 0
TIME (SECOND)
F I G U R E 2 - 1 . E A R T H Q U A K E T I M E H I S T O R Y R E C O R D S ( N O R M A L I Z E D TO 0 . 5 g )( C o n t i n u e d )
•
2 - 3 4

8/22/2019 6848574
http://slidepdf.com/reader/full/6848574 76/394
• • • S.O 10 .0 IS.O !•• n.o M.eTIHE (SECSI
M .O 4 0 .0 4 i . a « . *
OL YM PIA . WASHINGTON HIGHWAYTEST L AB. N8 6 E
1 0 - 0 t S . O 2 0 . 0
Tine I SEC)
MELENDY RANCH N29W
FIGURE 2-2 . COMPARISON O F ACCELEROGRAM AND VARIATION O F CUMULATIVE ENERGYWITH TIME F O R REPRESENTATIVE LONG.AND SHORT DURATION MOTIONS

8/22/2019 6848574
http://slidepdf.com/reader/full/6848574 77/394
FIGURE 2-3. ACCELEROGRAM AND VARIATION OF CUMULATIVE ENERGY WITH TIME
FOR THE 1952 KERN COUNTY EARTHOUAKE RECORDING AT TAFT
•
2-3'6

8/22/2019 6848574
http://slidepdf.com/reader/full/6848574 78/394
1 0 .0 l e . o ZO.O 28 .0 30 .0
TIME I S E C )
fe = 5 Hz
^ 0 5 ^ '•^^ max75
0 S .b 10.0 IB .O 20.0 21.0 30.0
TItlE (SEC)20.0 29.0
ri ME ISE C)
(a) SDOF Oscillator (7% Damping) Response D u e t o Taft Record
o
e
a
-1
•j":
^
m
•
^.05
\ 7 5
\m MMAhMttfLAfiJi tu^ MJU-
1max
0 I.ll lo'.o is'.oTIHE ( SE C)
f = 2 Hze
•
•
lo' .o n' .o 30 0
,05
T
f»0H,»f »
max
fe = 5 Hz
l.o ' r S ioTo iJTo ioTo 2«'.oT i n E ( S E C )
O.o s.b lo'.o is'.oTIHE ( SE C)
20.0 2S .0
(b) SDOF Oscillator (7% Damping) Response D u e t o Melendy Ranch Record
fIGURE 2-4. ELASTIC RESPONSE O F DAMPED OSCILLATOR D U E T O REPRESENTATIVE LONG A N D SHORT DURATION MOTIONS

8/22/2019 6848574
http://slidepdf.com/reader/full/6848574 79/394
t » T T 1 I 'I I I I I I '» ' ' f -" f f 1 I I I
T|! j>9 Sec
W
DHMPINC 0.070
EC12
- I 1 y — T — I — I I I I
F R E Q U E N C Y I H E R T Z )
1 3 i 6 7 " * 1 0 '
o.
tx>
^ H)
3 ^Z =^
cror.UJ V
JUJo- J
lU """
- -3 «. J t^
ID un( T
C3Qn »iUJV I
" -
o
'
-
•iff
2 5
-T
Sec
n
^ T ^ ^ 9 Sec
'V>/ ^y/ -^ {
Z ' A ^Jf\ /^_^^\J \l
/ IF / / \ /
li fv ^^Im^ '^ J
" C ECS
I ns^ i i t f
DflMPlNC
' ^ P D
: \ \ \ \ Ti i ' l t f ;
0.070
A .
M «
! M T
f f 1 »J
•j
1
J
JJ
•H
- i
]
^
H
^
1 TJTI
F R E Q U E N C Y I H E R T Z )
- J r~
OO3 "
I I I I I—I I I I
T^< . 2 . 5 Sec
PA2
-T 1 f — 1 — r - - I r — I — I — I I I
DflMPlNC 0.010
s0-^—:—r-rrTTT7Trf—;—mrTTTTtf—J—i <! i \\\\\o-F R E Q U E N C Y I H E R I Z )
FIGURE 2-5. COMPARISON OF NORMALIZED (l.Og) RESPONSESPECTRA SHAPES ASA FUNCTION OF DURATION
2-38

8/22/2019 6848574
http://slidepdf.com/reader/full/6848574 80/394
«/1
O
o
s-
oo<
< t3
s-+ ->o(UQ.
CO
av 2TrSV.
1 1
Frequency (log f )
(a) Representative Long Duration Input Motion
o
co
(O
s-O)
oo•a:
s-
o
Q .00
Frequency (log f)
(b) Representative Short Duration Input Motion
FIGURE 2-6. GROUND MOTION PARAMETERS
2-39

8/22/2019 6848574
http://slidepdf.com/reader/full/6848574 81/394
(J j lO_ lIxJ u^
C_)(_) 3-
cr
o1/1C O
cr_,
Q ' " '-D 07UJ CO
to c~
a .lO
in
T 1 1 1 1—I I » - I 1 r — I — I I I T 1 r — 1 — r — I — j — r
DflMPINC 0.070
Olympia WA, 1949(N86E)
~I 1 1—I—I—TT n
n s s 1 Q °\ff—\ 1 [ — I — I — i — T T — r
3 ij 5 6 7 8 9 ' l 0-1 1 1 —I—I—r—r
3 4 s e v e s hO"FREQUENCY (HERTZ)
T [ 1 — ( — I — t — r - 1 ( 1 — I — [ — I — r — r - 1 1 1 1 — I — I — r — r
- ^ ID
o
r ^ "cr
UJ cv_ lU JC_)CJ
cr o
lO
U JI - <"= ) "O
.-I r-OLOca uicr
3"
o
Q
U J
to
D fiM P IN C 0 . 0 7 0
T af t ,K e rn CO, 1952(S69E)
I I — I — I — [ — r"T n • 1 1 1 1 1—TT"! r
3 14 5 6 7 8 9 1 0 2 3 IJ 5 6 7 8 9 1 0
- I 1 1 — I — I I r -
3 II 5 6 7 8 90'FREQUENCY (HERTZ)
(a) Long Duration Records (!!> 9.0 S e c )
FIGURE 2-7a. COMPARISON OF REAL GROUND MOTION SPECTRA WITH REG.GUIDE 1.60SPECTRA ANCHORED T O "EFFECTIVE" ACCELERATI ON, A p ^
2-40

8/22/2019 6848574
http://slidepdf.com/reader/full/6848574 82/394
n 1 1 1—I—I I I - | 1 1 1 — I — I — n - T 1 1 1—I—I—r
CJ
O
cra :UJ .>;_ lUJC JC J „
U J
U3
ID to
O
t oCO m I-cn
o
aU J
to
O R M P I N C 0 . 0 7 0
El Centro Array N o. 12Imperial Valley, 1979 (140)
"T 1 1 1—I—r—TT n ' 1 1 ' 1 '—'"T-l T
3 y 5 6 7 8 9 ' l O 2 3 y S 6 7 8 9 ' l O
FREQUENCY (HERTZ)
- I ( — I — I — I — r ~ T
3 y 5 6 7 8 9 1 0 'iG-
(a) Long Duration Records (Tp> 9 .0 S e c )(Continued)
FIGURE 2-7a. COMPARISON O F REAL GROUND MOTION SPECTRA WITH REG,SPECTRA ANCHORED T O "EFFECTIVE" ACCELERATION, A ^ ^
GUIDE 1.60
2-41

8/22/2019 6848574
http://slidepdf.com/reader/full/6848574 83/394
crU J_ JU J
CJC J
cc
U J
CD
° u>to
CE
OQZ 3 nU Jt o
O
-\ —I—I—r—r - i — I — I — n - -T 1 1 1— TT
D A M P I N G 0 . 0 7 0
Pacoima Dam
San F ern and o, 1971 (S 14W)
—I 1 — I — T T
5 6 7 8 9^—\ 1 — I — I — r — r
y 5 6 7 B 9 1 00'I I I I I \
0" i. 3 y 5 6 7 8 9 '1 0
F R E Q U E N C Y ( H E R T Z )
Al
CJ
ACCELERATION
y5 6 7 8 9 1
ABSOLUTE
i
3
a "3 en
U J OD
to t~
-
-
—
-
^ 0 "
1 —
1
1- — I — I—r-T—T—r
1 1 1 1 1 1 1
3 y 5 6 7 8 9
1
1.
/
/v
0°
r
r '
2
[ T - -1 — 1 1 —r - i p
fP"^
- , . . . .
D R M P I N C
K^
r • I — r I
0 . 0 7 0
\
Hol lywood Storage FSan Fernando, 1971
3 y 5 6 7 8 9 ' ! 0' r^ 3 y
•T I I -
-
-
—
> . E . L o t '(N90E) 1
5 6 )h ^F R E Q U E N C Y ( H E R T Z )
FI
( b ) M id D u ra t io n R e co r ds ( 2. 5 S e c ^ T p «9 . 0 S e c )
GURE 2-7b, COMPARISON OF REAL GROUND MOTION SPECTRA WITH RE G. GUIDE 1.60
SPECTRA ANCHORED TO "EFFECTIVE" ACCELERATION, A
2-42
DE

8/22/2019 6848574
http://slidepdf.com/reader/full/6848574 84/394
-| 1—I—I—r~r T 1—I—I—r—r- r I 1—I—I—r-r
DflMPlNC 0. 07 0
El Centro Arra y No.5
Imperial Valley, 1979(140)-
-i—I—I—I—r-
5 6 7 8 9
- I 1 1—I—I—n-
3 y 5 6 7 8 9 ] 0O' 0" 3 y 5 5 7 B 9 ' J 0 '
FREQUENCY (HE RTZ)
- i—I—I—r -r -I 1—I—r 1 I
DHMPINC 0 07 0
UCSB Go!etaSanta Barbara, 1978 (180)
-1 1—I—I—r-n—;; 1 1 ' —i—' —i—i i i—Tli 5 6 7 8 9 "l 0 ^ 3 y 5 6 7 8 9 "l O'
T 1 1—I—I—r-r-i
3 y 5 6 7 8 9 ' ] 0 'n ^ ; ,
l O ' 2
FREQUENCY (HE RTZ)
(b) Mid Duration Records (2.5 S e c ^ T ' 6 9.0 Sec)(Continued)
FIGURE 2-7b. COMPARISON OF REAL GROUND MOTION SPECTRA WITH REG. GUIDE 1.60SPECTRA ANCHORED TO "EFFECTIVE" A CCELERATION, A
2-43 'DE

8/22/2019 6848574
http://slidepdf.com/reader/full/6848574 85/394
CJ
cr "ct: ^IjJ ID— II j j m
CJO = r
crU J "I —
:D
otoCQ
cr_
3 <"
I J J CO
to ~.
T 1 — I — I — n - - I 1 — I — I — r - r
DAMP INC 0 .0 7 0
Gilroy Array N o . 2 .Coyote Lake, 1 9 7 9 ( 0 5 0 )- I — I — l — T T n > "
6 7 8 9 ' l 0 2 3
FREQUENCY
T 1 1 1 1— t-T
Y Fl O " y 5 6 7 8 9
(HERTZ)
3 y 5 6 7 8 9 ' ] 0 '
C J
o
cra;
C JCJ
=D "
t oe n u->c r
oa
U Jt oQ_
- I 1 — I — I — n - - I 1 1 — I— I— r — r - - I 1 1 1 — I — I — r - T^ ^
10"
OflMPlNC 0 . 0 7 0
Cholame Array N o . 2Parkfield. 1 9 6 6 (N65E)
-1 1 1—T—I—I I I I—5 r-
2 3 y s e v e g i o 2I I—I—I— I I I I— r3 y 5 6 7 6 9 ' ] 0
- 1 1 1—I—I I I
3 y 5 6 7 8 9 1 0 '
FREQUENCY (HERTZ)
(c) Short Duration Records ( T'< 2. 5 S e c )
FIGURE 2-7c. COMPARISON O F REAL GROUND MOTION SPECTRA WITH REG. GUIDE 1.60SPECTRA ANCHORED TO "EFFECTIVE" ACCELERATION, A ^ r
2-44
•

8/22/2019 6848574
http://slidepdf.com/reader/full/6848574 86/394
o- | — I — I — i — r - -1 1—I—I—r—r
DRMPINC 0 . 0 7 0
Gavi l an Co l l egeHoi l i s t e r , 1974 (S67W)
-1 1—I—I—n-
n 5 6 7 e 9 ] 0'ID -
FREQUENCY (HERTZ)
- | 1 1 1 — I — I — i — r - 1 1 1 1 1—TT - I [ 1 1—I—I—r"^ T
i 1 < ' 3—I—I I I I—7~
l O ' ^ 3 y 5 6 7 8 9 ' ! 0
DflMPINC 0.070
Melendy Ranch BarnBear Valley, 1 9 7 2 (N29W) "
— I — I — I I I I I — r T 1 1 — I — I — r — r ,
3 y 5 6 7 8 9 ' ] 03 y 5 6 7 8 9 ' l 0 ' 2
FREQUENCY (HERTZ)
(c) Short Duration Records C T Q < 2 . 5 S e c )(Continued)
FIGURE 2-7c. COMPARISON O F REAL GROUND MOTION SPECTRA WITH R E G . GUIDE 1.60SPECTRA ANCHORED T O "EFFECTIVE" ACCELERATION, A ^ ^
2-45

8/22/2019 6848574
http://slidepdf.com/reader/full/6848574 87/394
3. TECHNICAL APPROACH FOR NONLINEAR STRUCTURAL RESPONSE ANALYSES
Chapter 2 presented the minimum engineering characterization of
the ground motion required for the deter mina tion of elastic structural
respons e. However , as noted in Chapter 1, elastic structural response
does not provide a good measure of structural dam age. Potential quan tita
tive meas ures of structural damage and their relative pros and cons were
presented in Section 1.3. Throu ghout this study, the ratio of peak
displacement to elastic yield displace ment (ductility ratio, y) is used
as a measur e of damage for the reasons given in Section 1.3. Aga in, it
should be noted that this measure of damage may overstate the damage capa
bility of short duration ground moti ons . However, this damage measure is
used because of uncer taint y concer ning other meas ures of damage and
because it serves as a conservative damage m easu re.
The purpose of this chapter is to provide technical background
material for the computation and prediction of inelastic structural
response . Results of inelastic structural response analyses will be
presented in Chapter 4. Ground motion characterizations for inelasticrespons e will be described in Chapt er 5.
3.1 REPRESENTATIVE NONLINEAR STRUCTURAL RESPONSE RESISTANCE FUNCTIONS
Several representative nonlinear structural response resistance
functi ons are shown in Figure 3-1. Thes e are a) Bilin ear, b) Take da, and
c) Shear Wall.
The bilinear model represents the resistance function for intrin
sically duct ile, nondeteriorating systems such as shear members and
unbraced mom ent-resi sting steel frames primarily deforming in flexure with
only moderat e axial loads. In this mo de l, the structure loads with an
initial stiff ness, K, until the yield capaci ty, V is reached. Further
loading occurs along a reduced sti ffn ess , sK. Unloading occurs on the
3-1

8/22/2019 6848574
http://slidepdf.com/reader/full/6848574 88/394
initial st iffne ss, K. Cycles are stable without any dependence on the
number of previous nonlinear cycl es. The elasto-plas tic model represents
a subset of this bilinear model in which the second s lope , sK, is zero.
The Takeda model generally represents the appropriate model for
properly reinforced concrete structures pr imarily loaded in flex ure.
Init iall y, the Takeda model loads and unl oads in the same man ner as the
bilinear mo de l. However, nonlinear deformations are accompanied by
concrete cra cking. Upon returning to zero force , the presence of these
cracks softens reloading in either direct ion. Future loading cycles are
always toward the point of maximum previous defo rmatio n. The Takeda model
thus incorporates stiffness degradation due to concrete cr ackin g.
Experimentally determined resistance functions (Figure l-9a) for
low-rise concrete shear walls predominantly deforming in shear exhibit
certain characteristics not incorporated into the previously described
Takeda mode l. These are:
a) Unloading on a softer stiff ness, Ky, than the initialloading stiffness.
b) A substantial pinched behavior upon loading in the oppositedirection until disp lacements return to zero.
c) After zero displacements are reached, further loading istoward a point of greater displac ement than that reached inany prior deformation cycle.
d) Once a certain ductility lev el, ^niax* ^s reache d, futureloading cycles are accompanied by rapid str engthdegradation.
The shear wall model shown in Figure 3-lc in corpora tes Items ( a) through( c ) . Strength degradation should be precluded by limiting the permissible
upper bound ductility, v^^^^ to leve ls less than that at which subst an
tial strength degradation occ urs . Th us , it was judged to be unnecessary
to incorporate strength degradation into this shear wall model.
3-2

8/22/2019 6848574
http://slidepdf.com/reader/full/6848574 89/394
Low-rise shear walls predominantly deforming in shear represent
the primary seismic load carrying e lements for most nuclear plant struc
ture s. Th us , the shear wall resistance func tion model is used for most of
the nonlinear analyses in this study. This model was chosen because:
1. It is more representat ive of the major ity of nuclear plants t r u c t u r e s .
2 . Its use is conservative relative to either the bilinear orT a k e d a m o d e l s .
The shear wall model has less hysteretic energy dissipation per cycle
than does either the bilinear or Takeda mo del . Thu s, for a given ground
motion time hist ory, the maximum computed ductility l evel, P, will be
larger from this model tha n from either the Takeda or bilinear mo de l. A
short parame tric analysis is presented In Appendi x D to demonstra te that
this shear wall model does lead to greater ductility levels than does the
T a k ed a m o d e l .
The other primary lateral load carrying systems often found in
nuclear plants are steel-braced fram es. A representative nonlinear
resistance function for such braced frames was shown in Figure l-9b. Thisbraced frame resistance function also shows pinched behavior similar to
that for shear wa ll s. Howe ver, the pinching is not generally as severe
so that a typical braced frame nonlinear re sponse cycle will generally
contain more hysteretic energy dissipation than does a similar shear wall
nonlinear response cycl e. Th us , again , the shear wall model will
generally conservatively overestimate the ductility le vel, y, for a
braced frame subjected to a given ground motion when both model s have the
same yield capac ity and elastic stiffne ss, K. This point is also demon
strated by a short braced frame paramet ric analysis presented in
Appendix D.
3-3

8/22/2019 6848574
http://slidepdf.com/reader/full/6848574 90/394
In surmiary, it is judge d that r esult s and c oncl usi ons prese nted
in this study based upon the shear wall model can be conservatively used
for structures exhibiting bilinear, Takeda, shear wal l, or braced-frame
resistance functions.
3.2 DETAILED DESCRIPTION OF SHEAR WALL MODEL
3.2.1 Rules for Constructing Shear Wall Resistan ce Function Model
Reinforced c oncret e wall s resist shear through various
mec hani sms. Initially, the wall is elastic and shear resistance is
developed according to elastic beam theor y. Inclined shear cracks develop
when the principal tensile stresses exceed the concrete tensile strength.
Once shear cracks o pen , the shear force is resisted m ain ly by the reinforcing bars and aggregate inte rlock. Other mecha nisms such as dowel
action, truss action, and the flexural compression zone also contribute
to the shear resi sta nce . The opening and closing of cracks under load
reversals causes the pinching behavior noted in the hysteresis loops.
Also, as shear cracks open wider and damage to the concrete increases,
the contribution of concr ete, through aggregate in terlock , to shear
resistance decrease s. This effect causes,strength degradation under large
displacement cyc les. A shear force-shear distortion diagram obtained
during a structural wall test was shown in Figur e l-9a whic h illustrate s
the reverse cycle loading behavior characterized by stiffness degradation
and pinching of the hysteresis loo ps. Relatively few reversing load tests
of low-rise walls have been reported. Fiorato and Corley (1977) have
summarized the laboratory testing conducted on low-rise walls with
typical reinforcement rati os, in the range of 0.25 - 0.5%, which are more
typical of commerical building construction (Shiga, 1973; Barda, 1976;
Cardenas, 1973; Paulay, 1977; Park, 1975; Alexander, 1 9 7 3 ) . Much of the
structural wall testing (Wang, 1975) conducted at the Univers ity of
Calif ornia , Berkeley, provides useful information on the behavior of low-
rise wall segments which has been recently summarized by Bertero (1977)
and Popov ( 1 9 8 0 ) . Cyclic load testing of low-rise box structures with
3-4

8/22/2019 6848574
http://slidepdf.com/reader/full/6848574 91/394
reinforc ement ratios in the range of 0.6 - 1.6% has been limited to model
structures and conducted p rimaril y in Japan (Umemura, 19 77, 1980 : Uchi do,
1980; Fukada, 1 9 8 1 ) .
The primary or envelope loading curve assumed for inelastic shear
elements representing the shear flexibility of low-rise reinforced
concre te walls is defined by a bilinear approximation of the deformation
behavior of low aspect ratio walls under mono tomi call y increasing load.
The consideratio n of a bilinear curve consisting o f two linear segments
is based on the work by Umemura (1977, 1980) interpreted in terms of the
Araka wa formula (Kubota, 1978) for shear strength of reinforced concrete
mem bers . The slope of the first segment represents the effective shear
stiffness of the uncracked concrete wall secti on, whi le the slope of the
second segment rep resents the effecti ve stiffness of the reinforcing steel
after cracking has occurred.
The hystere sis behavior for the shear element is defined by a
set of 10 ru les . These rules are described bel ow, and they are also
shown by their corre sponding numbers in Figure 3-2.
Rule 1: The shear deformat ion curve, defined by a linearstiffnes s, K, is elastic up to the yield shear force,Vy.
Rule 2: Once the yield point in any direction is exceeded,loading continues on the second slope defined by asofter linear stiffness para meter , sK.
Rule 3: Unloading is initiated when the direction of loadingchanges. A degrading unloading stiffness feature isbuilt into the mo de l. This is shown in Figure 3-3a.Therefore, if the system unloads from Rule 2, instead
of unloading parallel to the elastic s tiff ness , K, toa recov ery point such as 6,1, unlo adin g is towards anew recovery point, 6p, such that
\ = (i-cc)6; (3-1)
3-5

8/22/2019 6848574
http://slidepdf.com/reader/full/6848574 92/394
wher e a is the unloading stiffness paramet er. Thereduced unloading slope is used for subsequentunloading as long as the maximum deformation is notexceed ed. If the recov ery point, 6p, is reache d,
loading in the opposite dire ction is according toRule 4. Reloading from this part is according toRule 8.
Rule 4: Once the unloading is fini shed, the system wouldinitially exhibit a low stiffness in the opposit edirec tion . This 1s a typical pinching behavior whichis observed in shear wall tes ts. The pinched behavio ris due to opening and closing of cracks under cyclicloads. Loading s tiffness for this point is assumed tobe the same as the second slope of the primary curve,sK. Once zero deformation is reached , loading will beaccording to Rule 7. Unloading from this part is
according to Rule 5.
Rule 5: Unloading from Rule 4 is parallel to the unloading(Rule 3) slope on the same deformation sid e. Oncezero shear force is reached, loading in the oppos itedirection is according to Rule 8. If the direction ofloading chan ges , loading is according to Rule 6.
Rule 6: If the direction of loading changes while in Rule 5,loading will be on the same line until the point whereunloading was initiated is reached (Point A In Figure3 - 2 c ) . Loading is according to Rule 4 there after. On
the other hand, unloading from this part is accordingto Rule 5.
Rule 7: Once the cracks are closed (6 = 0 In Rule 4 ) , loadingbegins toward the previous point of maximumdeformatio n. In addition, a strength degradingfeature is built into the mod el. This is shown inFigure 3-3b. Th us , instead of loading towar ds theprevious point of maximum (Point A in Figur e 3 - 3 b ) , anew target point such as 5 Is defined such that
-Sg = ^~^/y (3-2)
wher e Y Is the strength degradation paramet er. Oncepoint B is reached, loading starts on the second slopeagain (Rule 2 ) . Unloading from this part is accordingto Rule 3.
%
3-6

8/22/2019 6848574
http://slidepdf.com/reader/full/6848574 93/394
Rule 8: This rule assures that any loading from Rule 3 will betowar ds the previous intermedi ate point (Points B andC in Figure 3 - 2 c ) . Once tKis point is reach ed, loadingis according to Rule 7 (Point C in Figure 3 - 2 c ) .However, for a point such as B in Figure 3-2c, loadingfrom Rule 8 is on the second slope (Rule 2 ) .
Unloading from this part is according to Rule 9.
Rule 9: Unloading from Rule 8 is parallel to the last minimumunloading slope (Rule 3 ) . Once unloading is finished,loading in the other direction is according to Rule 4.A change of direction in load would cause the systemto follow Rule 10.
Rule 1 0: Loading from Rule 9 is on the same slope until theprevi ous Inter mediate point (Point D in Figure 3-2c)is reached. Loading is according to Rule 8 thereafter .Unload ing from this part is according to Rule 9. Thesmall am plitude or shakedown behavior of the shear
hystere sis model is shown in Figure 3-3c.
The 10 rule hyst eretic model defined above is based on quas i-
static cyclic load tests of shear wall elements representative of nuclear
plant box-type reinforced concrete st ructur es. The model is similar to
the shear models used by Banon (1981) and Saiidi ( 1 9 7 9 ) . Except for shear
pinching and strength degr adat ion, the model is very similar to the mod i
fied Takeda model (Kanaan, 1975) used to represent the hystereti c behavior
of reinforced concrete in flexure . Comparison of the model behavior with
avail able cyclic load test data Ind icates that the model provides good
agreement with test results when large displacement cycles are considered
up to displacements associated with the onset of substantial strength
degradation (typically occurring at ductility levels ranging from 4.3 to
6 . 0 ) . The shakedown behavior (i.e., behavior after peak deformation is
reached as shown in Figure 3-3c) used in this model is unverified because
of insufficient experimental data on cyclic behavior after peak response
is reached. However, proper modeling of this shakedown behavior is
unimportant so long as a peak displacemen t (ductility rat io) crite ria is
used as a measure of damage. The proper modeling of this shakedown
behavior is very Important If a total hys teretic energy absorption
criterion had been used as a meas ure of dama ge. The lack of experiment al
data on shakedown behavior Is one of the prima ry drawbacks to the use of
a total hysteretic energy absorption criteria as a measure of damage.
3-7

8/22/2019 6848574
http://slidepdf.com/reader/full/6848574 94/394
3.2.2 Resistan ce Function Properties Used in this Study
The follo wing resista nce functio n par ameters were used in this
study:
a) Slope parameter of post-yield loading curve , s = 0.1
b) Unloading stiffness param eter, a = 0.35
c) Strength degradation param eter, Y = 0.95
The second slope of the loading curve is shallow compared to the initial
stiffn ess, K, for most structural elem ents , with s typically ranging fro m
about 0.03 to 0.15. The value chosen for this study (s = 0.1) is
considered repres entative for shear walls with large reinforcement ratios
(approximately one percent stee l) typical of nuclear plant struct ures.The second slope increases with steel perc entag e and s would be less than
0.1 for steel percentages less than about one percent. A very limited
parame ter study is presented in Appe ndix D to show that the computed
ductili ty level, y, decreases slightly as s is increased above 0.1. The
resul ts presented herein are reas onab le for the case of 0 < s < 0.1 and
become conservative for cases where s » 0.1.
The unloading stiffness and strength degradation pa ramet ers, a
and T, respectively, have been chosen to be realistic (slightly conserva
tiv e) for duc tility levels up to about 4.3 which is the maximum ductility
level considered in this study. The unloading stiffness parame ter, a =
0.35, results in an unloading stif fness , K^^, of approximately two-th irds
of the initial loading (elas tic) stiffness at a duct ility level of 3.0
which is slightly greater unloading sof tening than shown by most e xperi
mental dat a. Howeve r, Appendix D shows results are not sensitive to a.
Simila rly, the strength degradation param eter, y = 0.95, is repr esentative
of the very slight strength degrad ations which occur at duct ilit y levels
less than 4.3. Howeve r, this strength degradation is substantially too
small if the ducti lity level is increased signif icantl y beyond about 4 .3.
3-8

8/22/2019 6848574
http://slidepdf.com/reader/full/6848574 95/394
The elastic yield capacity, V ^ , f o r each analysis w a s estab
lished b y :
V = m S ( f . B ) * ( 3 - 3 )y o
where m is the mass of the s tr u c tu ra l elem ent, and S /^ g\ is the
spectral acc elera t ion fo r the given ground mot ion at the e la st ic natura l
freque ncy, f , and the e la s t ic damping r a t i o , 3 , where:
f = f A / T (3-4)27r Y m
represents t h e frequency at t h e initial (elastic) stiffness, K . I n other
w o r d s , all structures were placed a t t h e onset o f yielding when subjected
to t h e ground motions defined in Chapter 2 .
This study was conducted a t t h e following t w o ductility levels:
Low: y|_ = 1. 8 5
High: y ^ = 4 . 2 7
Inelastic response o f shear walls begins a s soon as extensive
concrete cracking occurs. F o r heavily reinforced shear walls (steel
percentages o f about o n e percent ) typical o f those found in nuclear
plants, this inelastic behavior occurs before t h e code specified minimum
ultimate capacity is reached . Based upon o u r review o f a number o f shear
wall designs, a ductility level o f about 1 . 8 5 represents o u r best estimate
of t h e inelastic deformations which would occur in a shear wall designed
for static lateral loads t o t h e ACI-349 code capacity. T h e current
elastic design analysis method when carried t o code ultimate capacities
is judged t o lead t o roughly this level o f inelastic deformation f o r
S (f, B) used here is equivalent t o S A i n Chapter 1 a n d Figure 1 - 1 0
for Application B (determination o f input scale f a c t o r s ) .
3-9

8/22/2019 6848574
http://slidepdf.com/reader/full/6848574 96/394
static lateral loads. In other wor ds, ^^^ of 1.85 is judged to corres
pond to code capacity pseudo-elast ic behav ior. This situation is illus
trated in Figure 3-4. This means that the recomm endatio ns and conclusions
of this study for the low ductil ity case ( y = 1.85) are consid ered to be
approp riate for shear wall structur es designed to remain ess entia lly
elastic for the design earthquake.
The high ductility level, y^ = 4.27, represents a conservative
lower bound on the deformations which correspond to significant strength
degradation under a small number (3 to 5) of strong nonlinear respo nse
cycles which might occur during strong ground shaking. In other wor ds,
this d uctility level represents our best judgment of a conservative lower
bound on the onset of significant structural d ama ge.
T h u s , the low (1. 85) and high (4.27) ducti lity l evels considered
in this study are believed to bound the ductility range of interest for
nuclear plant shear wall type structures.
3.2.3 Dynamic Proper ties Used in this Study
This study is concerned with the engineering characterization of
ground motion responses of stiff structures repre sentative of those innuclear plants . Such structures tend to have fundamental elastic
frequenci es in the 1.8 to 10 Hz ran ge, i.e., the amplified acceleration
response rang e. There fore, this study is Intended to cover structures,
with fundamental elastic frequen cies from 1.8 to 10 Ht. Results of this
study can probabl y be extrapola ted to frequ encie s beyond this range but
this was not verified by studying structures with elastic frequencies
outside of this ran ge. Shear wall structural elements with the follow ing
elastic natural frequencies were used in this study:
f = 2.14 Hz; 3.20 Hz; 5.34 Hz; 8.54 Hz
to represent the frequency range from 1.8 to 10 Hz . Elastic stiff nesses,
K, for the shear wall resist ance func tion were then computed from
Equation 3-4.
3-10

8/22/2019 6848574
http://slidepdf.com/reader/full/6848574 97/394
Energy dissipation due to the elastic component of response was
modeled by a viscous damping coefficient, c, given by:
c = (i f) K, (3-5)
where 6 represents the fraction of critical damping within the elastic
range of r esp ons e, and K-,. repr esen ts the tangent stiffness at any point
on the resistance functio n. The damping coef ficient, c, was made propo r
tional to the tangent stiffness as opposed to the initial stiffness to
avoid double-counting the hysteretic energy dissipation within the inelas
tic ran ge. Energy dissipation primarily occurs during nonlinear respons e
due to the hysteresis loop of the resis tance funct ion. This energydissipation is already accounted for by the use of resistance functions
with hysteretic loops and would be double-counted to some extent if the
damping coeff icien t, c, were not reduced durin g nonlinear res pons e.
«
Damping is a term which is utilized to account for various mecha
nisms of energy dissipation which occur when a structure is subjected to
dynamic loads . Within the elastic range, damping is normally considered
to be visco us and it is defined as a perc enta ge of critical dam ping . Itis usually difficult to estimate the viscous damping in a structure,
because it depends on many factors such as material type (i.e., reinforced
concrete or steel ) and stress level. Damping values used in structural
analyses are usuall y conservative estimates based upon experimental dat a.
A detailed survey of studies on damping in nuclear facilities has been
recently compiled by Stevenson ( 1 9 8 0 ) . Test results indicate that a
conservative estimate of damping in concrete structures (mainly shear
wal ls) varies from 5 percent for stress values below 0.5 yield to 10
percent for stress values close to yiel d. Regulato ry Guide 1.61 (USNRC,
1973) suggests a 7 percent damping value be used for shear wall type
structures under SSE condi tions . This value has been used in this
study. Thus:
e = 0.07
3-11

8/22/2019 6848574
http://slidepdf.com/reader/full/6848574 98/394
A small paramet ric study was performed with a lower elast ic
damping value of B = 0.03 and the results are presented in Append ix D.
This study shows that the results and conclusions of this study on
reduction factors to be applied to elastic spectra to obtain inelastic
spectra are slightly conservative when the elastic damping value used for
the elastic spectra is less than 7 perce nt. Thu s, the results of this
study are usable for elastic spectra with 7 percent and less damping.
This study is not Intended to address the question of what value
of damping should be used when per forming nonlinear analyses of shear
wall struc tures. There are advocates of damping values ranging from
about 3% to 10 % as well as advocates for both initial stiffness and
tangent stiffnes s proportional d amping . More research needs to beperformed on these Issues. Howe ver, the conclusions of this study are
insensitive to these Issues.
3.3 SIMPLIFIED METHODS TO APPROXIMATE NONLINEAR STRUCTURAL RESPONSE
Simplified metho ds to predict nonl inear structural r espon se from
elastic response spectra consist generally of one of the following
a p p r o a c h e s :
1. Replace the nonlinear resistance function by an equivalentlinear resistance function which has a lesser stiffness,K e , and increased damping, 3e. This equivalent linearresistance function is then used with the elastic re sponsespectra to compute maximum displacement res pon se, 6^ = y<s .
2 . Modify the elastic response spectra to create reducedequivalent inelastic response spectra for use with theinitial elastic stiffn ess, K, and elastic range damping, B,to compute the yield displacement r espon se, Sy and Vy.
Each of these general methods is discussed in greater detail in the
following subsections.
3-12

8/22/2019 6848574
http://slidepdf.com/reader/full/6848574 99/394
3.3.1 Equivalent Linear Resistance Function Models
An equivalent linear resistance function model is developed t o
replace t h e actual resistance functions (Figure 3 -1 ). This equivalent
model should be capable o f approximating t h e average reduced stiffness
(or frequency) and average increased damping which occur during t h e
nonlinear response cycles which occur prior t o peak response. T h e secant
stiffness represents t h e minimum effective stiffness during nonlinear
response a nd f o r t h e resistance functions shown in Figure 3-1 this
stiffness is given b y :
V ^ ' I ± f ^ (3.6)
The secant freque ncy, f^, is obtained from Equation 3-4 by s u b st itu t in g
Kg fo r K. Thus:
f g/ f = N/K^/K (3-7)
The effective frequency, f ^ , represents the frequency associ
ated with some "average" nonlinear response cycle a n d t h e effective
damping, e^, represents t h e s u m o f elastic, 6, and hysteretic, 3 ^ ,
damping associated with this "average" nonlinear response cycle.
Appendix C provides technical background suggesting that t h e effective
frequencies and damping c a n b e approximated b y :
f ; / f = ( i-A) + A(f^/ f )
3 H = C,(l-f^/f)
3-13

8/22/2019 6848574
http://slidepdf.com/reader/full/6848574 100/394
where A and C^ are empirically determined coefficients selected to
provide a good fit of the peak responses computed by nonlinear time
histor y analy ses. One would expect A to be approximately 0.5 for the case
of N=l (one strong nonlinear response cycle) and to increase toward 1.0 as
N became large with the pinched shear wall resistance funct ion. Further
m o r e , the coefficient A should increase with Increasing ductility, i.e.,
with reducing (fg/f) ratios . The coefficient C ^ is expected to be
less than 0.55 for N=l, less than 0.38 for N=2, and less than 0.32 for N=3
and 4 for the pinched shear wall resistance function (See Appendix C ) .
How eve r, both A and C ^ will be empirica lly dete rmine d.
Previous inv estigators have made attempts to estimate the average
effective frequency and damping for nonlinear structural res ponse . Based
upon a study of Takeda resistance function models for reinforced
concrete struc tures, Sozen (Gulkan and Soz en, 19 74; and Shibata and
Sozen, 1976) has suggested:
(Sozen) f K fe s
3 ' « 3 + 0.2(1-f /f) (3-9)
" s
Note that Equ ation 3-8 would be Identical to Equation 3-9 if A=1.0 and
Cf = 0 .2 0.
Simila rly, based upon a study of bilinear resistance functions
and of resistance functions which approximate those for braced frames
(Figure l - 9 b ) , Iwan (1980) has suggested the effective freq uen cy be given
by:
f
( ^ " ^; = 1 +0 . 1 2 1 ( y - 1 ) 0 - 9 3 9
B ; = 3 + 0.0587(y-1)°-3 7^ (3-10)
3-14

8/22/2019 6848574
http://slidepdf.com/reader/full/6848574 101/394
T h e eq u i v a l e n t l i n ea r r e s p o n s e c o e f f i c i e n t s , A a n d C| ^, w i l l be
d e t e r m i n e d i n C h a p t e r 4 t o p r o v i d e a g o o d f i t o f t h e n o n l i n e a r t i m e
h i s t o r y m a x i m u m r e s p o n s e r e s u l t s . T h e n , E q u a t i o n s 3 - 8 , 3- 9 , a nd 3 - 1 0
w i l l e a c h b e us ed t o p r e d i c t t h e n o n l i n e a r r e s p o n s e f a c t o r , F , w h i c h w i l l
b e c o m p a r e d w i t h t h e a c t u al c o m p u t e d n o n l i n e a r r e s p o n s e f a c t o r f o r al l 12
e a r t h q u a k e t i m e h i s t o r i e s and 4 e l a s t i c f r e q u e n c i e s at y , = 1 . 8 5 a n d
v ^ = 4 . 2 7 i n t h e ne x t c h a p t e r . F i s t h e s c a l e f a c t o r b y w h i c h t h e
g r o u n d m o t i o n m u s t b e i n c r e a s e d o v e r t h a t c o r r e s p o n d i n g t o s t r u c t u r e y i e l d
c a p a c i t y i n or d er t o a c h i e ve a g i v e n l e ve l o f n o n l i n e a r r e s p o n s e , y.
W i t h e a ch o f t h e s e e q u i v a l e n t l i n e ar m o d e l s , t h e m a x i m u m
n o n l i n e a r s t r u c t u r a l r e s p o n s e d i s p l a c e m e n t , <5 is g i v e n b y :
m= '/ \o ( 3 - 1 1 )*" (2TTf')2
whereas, the yield displacement, <5 is given by:
6y= 'f (3-12)
or
S , ( f , 3 )6 = ^ 1 — (3-13)^ (2Trf)2
3-15

8/22/2019 6848574
http://slidepdf.com/reader/full/6848574 102/394
T h u s , t h e i n p u t s c a l e f a c t o r , F , is g i v e n b y :
F = y ( f : / f ) ^y 6
S ^ ( f , 3 )( 3 - 1 4 )
i n o r d e r to a c h i e v e a d u c t i l i t y l e v e l y . It i s t h e s e p r e d i c t e d f a c t o r s ,
F , w h i c h w i l l b e c o m p a r e d w i t h 1
f a c t o r s , F , i n t he n e x t c h a p t e r .
F , w h i c h w i l l b e c o m p a r ed w i t h t h e a ct u a l n o n l i n e a r a n a l y s i s c o m p u t e d
3 .3 .2 I n e l a st i c S p e c t r a * D e a m p l i f i c a t i o n F a c t o r s
I n l i e u of c o n s t r u c t i n g a n e q u i v a l e n t e l a s t i c s t r u c t u r e m o d e l t o
a c co u nt f o r i n e l a s t i c r e s p o n s e , o n e c an s i m p l y m o d i f y t h e e l a st i c s p e c t r umt o o b t a i n an I n e l a st i c r e s p o n s e s p e c t r u m f o r u s e w i t h t h e e l a s t i c
s t r u c t u r e m o d e l . T h e I n e l a s t i c s p e c t ra l r e s p o n s e t o u se at t h e e la s t i c
f r e q u e n c y i s o b t a i n e d b y d i v i d i n g t h e e l a s t i c s p e ct r a l r e s p o n s e a t t h a t
f r e q u e n c y b y an i n e l a s t i c d ea m p l i f i c a t i o n f a c t o r , F ^ , i . e . :
S , ( f , 3 ) **
s w f « ^ = - ^ r - ^ ( 3 - 1 5 )
ay(f,3) F^
T h e n t h e r e q u i r e d y i e l d c a p a c i t y , V ^,^ , o f t h e s t r u c t u r e t o a c h i e v e a
g i v e n d u c t i l i t y l e v e l , y , i s o b t a i n e d b y u s i n g t h e i n e l a s t i c s p e ct r a l
a c c e l e r a t i o n , S . i n E q u a t i o n 3 -3 i n l i eu o f t h e e l a s t i c s p e c t r al
a c c e l e r a t i o n , S , .a
* M o d i f i e d s p e c t r a t o r e f l e c t n o n l i n e a r b e h a v i o r
** F o r t h e p u r p o s e of c o m p u t i n g s p e c t r a d e a m p l i f i c a t i o n f a c t o r s ( A p p l i
c at i o n A ) , S , ( f , 3 ) as u s e da
C h a p t e r 1 a nd F i g u r e 1 - 1 0 .
c at i o n A ) , S , ( f , 3 ) as u s ed i n t h i s s e c t i o n c o r r e s p o n d s t o S A o fa
•
3 - 1 6

8/22/2019 6848574
http://slidepdf.com/reader/full/6848574 103/394
•
One method to predict t h e inelastic deamplification factor is
through t h e u s e o f Equation 3-14. If this equation is used, t h e
technique o f using an inelastic response spectrum and an elastic
structure model will produce identical results a s a r e obtained from t h e
use of an equivalent elastic structu re model with t h e elastic response
spectrum so long a s t h e same effective frequency and effective damping
are used in Equation 3 - 1 4 t o determine F .
Alte rnat ely, investigators have developed estimates of F
directly from a combination of theoretical considerations and empirical
studies. T h e inelastic deamplification factor is different i n t h e
amplified spectral acceleration frequency range (generally about 2 t o 8
Hz) than it is in the amplified spectral velocity frequency range
(generally about 0 . 2 5 t o 2 H z ) . N ew m a r k ( 1 9 7 8 ) has suggested that:
Acceleration Region
^ = a = ^^^^ (3-16)
Velocity Region
^ = ^ v = ^ (3-17)
More recently, Riddell and Newmark (1979) have suggested t h e following
improvement on these factors:
• ; = ( ( q - i ) ^ - q ) ' (3-18)
3-17

8/22/2019 6848574
http://slidepdf.com/reader/full/6848574 104/394
where :
Acce le ra t ion Reg ion
q = q = 3.06•0.30
r = r = 0.48B-0.08
(3-19)
V e l o c i t y R e g i o n
q = q^ = 2.7B
r = r^ = 0.66B
- 0 . 4 0
- 0 . 0 4 ( 3 - 2 0 )
When using Equation 3 - 1 9 o r 3-20, B is elastic damping in percent of
critical. F o r y = 1. 8 5 a n d 4.27, these t w o approaches yield (B = 7 % ) :
1 ^
1.854.27
Acceleration, F ^ ^
Newmark
1.64
2.75
Riddell
1.632.55
Velocity, F ^ ^
Newmark
1.854.27
Riddell
1.923.65
The Riddell equations will be used herein f o r comparison with t h e time
history computed F, factors.
3-18

8/22/2019 6848574
http://slidepdf.com/reader/full/6848574 105/394
A n i n e l a s t i c s p e c t r al r e s p o n s e c o r n e r f r e q u e n c y i s sp e c i f i e d b y :
fsavMr^K.v ( 3 - 2 1 )
w h e r e f ^ ^ r e p r e s e n t s t h e c o r n e r f r e q u e n c y b e t w e e n e l a s t i c s p e c t r a l
v e l o c i t y a nd a c c e l e r at i o n a s l i s t ed i n T a b l e 2 - 5 f o r e a c h of t h e g r o u n d
m o t i o n s c o n s i d e r e d i n t h i s s t u d y . A t f r e q u e n c i e s b e l o w f . , „ . t h e
v e l o c i t y d e am p l i f i c a t i o n f a c t o r , F ^ ^ , i s us ed t o s p e ci f y t h e i n e l as t i c
s p e ct r a l a c c e l e r a t i o n , S g b y E q u a t i o n 3 - 1 5 . A t f r e q u e n c i e s a b o v e f ^ g y
t h e a c c e l er a t i o n d e a m p l i f i c a t i o n f a c t o r , F g , i s u s e d . H o w e v e r , w i t h i n
t h e a m p l i f i c a t i o n a c c e l e r a t i o n r e g i o n , t h e i n e l a s t i c s p e c t r al a c c e l e r a
t i o n i s no t a l l o w e d t o d r o p b e l o w :
A c c e l e r a t i o n R e g i o n
y
a s p e r t h e s u g g e s t i o n o f R i d d e l l a n d N e w m a r k ( 1 9 7 9 ) .
•
3 - 1 9

8/22/2019 6848574
http://slidepdf.com/reader/full/6848574 106/394
a) Bilinear b) Takeda
6 = y6
m ^"y
c) Shear Wall
FIGURE 3-1. REPRESEN TATIVE NONLINEAR RESISTANCE FUNCTIONS
3-20

8/22/2019 6848574
http://slidepdf.com/reader/full/6848574 107/394
1
h
1
I
L
V
/
/
/
/1
w «
"11
1f
I1
COIro
^^ ^ / / / / / / /
I* Hw I
(a) Reinforced ConcreteShear Wall
Structure Mass, M
I
TTTf f "f }
Seismic Excitation
(?) Model Rules
^ 6
(b) Structure Model (c) Shear Deformation Hysteretic Behavior
FIGURE 3-2. SHEAR WALL STRUCTURE MODEL AND CORRESPONDINGHYSTERETIC DEFORMATION BEHAVIOR

8/22/2019 6848574
http://slidepdf.com/reader/full/6848574 108/394
-5^ = (l-a)6V
6 6
r r
a6'
B = V y
(a) Unloading stiffnessparameter a
(b) Strength degradationparameter y
*- 6
(c) Shakedown behavior
FIGURE 3-3. CHARACTERISTICS OF THE HYSTERESIS MODEL ANDIDENTIFICATION OF MODEL PARAMETERS
3-22

8/22/2019 6848574
http://slidepdf.com/reader/full/6848574 109/394
ACI-349 Capacity
(wl.09 V )
1.85 (6 )
y
FIGURE 3-4. REPRESENTATIVE RELATIONSHIP BETWEEN ACTUAL NONLINEAR RESISTANCEFUNCTION AND ACI -349 CODE CAPACITY FOR SHEAR WALL WITH ABOUTONE PERCENT REINFORCEMENT STEEL
3-23

8/22/2019 6848574
http://slidepdf.com/reader/full/6848574 110/394
4. NONLINEAR STRUCTURAL RESPONSE ANALYSIS RESULTS AND
COMPARISON TO PREDICTION EQUATIONS
As noted in Chapter 3, the structural model yield capa citi es,
V , were determined from the elastic spectral acceleratio n, Sg (f ,3 ) ,
at the models elastic freq uency, f, and elastic damping B , of 7 percent.
Next, the input ground motion was scaled by an input amplitude scale
facto r, F, and the maximum inelastic response (ductility factor,y ) was
computed by time history nonlinear structural response analys es. Note
that with a scale factor of un ity, the elastic yield response (y = 1.0)
will occur and with F factors greater than unity, inelastic response
( y > 1 . 0 ) will occu r. A sufficient number of analyses were performed
with different F factors to enable the F factors corresponding to y. =
1.85 and y ,^ = 4.27 to be accurat ely determi ned by interpolation for each
ground motion time history and elastic natural freq uency, f, considered .
Thus, F represents an input scale factor by which the ground
motion must be increased over that corresponding to the structure yield
capacit y in order to achieve a given level of nonlinear respon se,y .
Alterna tely, F is also equal to the spectral deamplification factor needed
to convert an elastic spectral ac celerati on to a ducti lity of y. This
inelastic spectral acceleration then defines the yield capac ity, V p,
required in order to limit the ductili ty level to y when the structure is
subjected to the actual unsealed time histor y. Both definition s for F are
equivalent to each other. Thu s, the input scale factors, F, corre s
pondi ng to y|_ = 1.85 and ^^ = 4.27 as com puted by time h ist ory
nonlinear structural response analyses can be directly compared to the
inelastic deamplification fact ors, F , predicted by Equations 3-14 and
3-16 through 3-20 to evaluate the accuracy of these prediction methods.
4-1

8/22/2019 6848574
http://slidepdf.com/reader/full/6848574 111/394
4.1 INPUT SCALE FACTOR RESUL TS FOR GROU ND MOTION STUD IED
Tabl e 4-1 pres ents the input scale fac tor s, F^ and Fr ,
corr espon ding to y^ = 4.27 and \ = 1.85, respectively, for the time
histories and elastic frequencies studied. Mean valu es, standard devi atio ns, and coeffici ents of variation of these scale factors are also
present ed for each earthq uake ground motion and for each freq uen cy studied
as well as overall composite val ues . The trends for the high duc tili ty
and low ductility scale factors are similar. There fore, only the high
ductility scale factor results will be discussed.
One sho uld not infer t hat the mea n F| and F^ value s s hown in
Tabl e 4-1 of 2.62 and 1.54, respe cti vel y, can be used as aver age
inelastic scale fact ors . The inelastic scale factor is sensitive to
durat ion, frequen cy, and the smoothness of the elastic spectrum and a
single average number should not be used for any partic ular cas e.
4.1.1 Duration Effects
The high d uctil ity sc ale fac tor , F^^, is plotted in Figur e 4-1
against strong motion duration, Tp, for each of the cases studied.
Very large data scatter exis ts. In fact , the coefficient of variation
for F^ is 0.49. This large data scatter tends to mask strong motion
duration eff ects . For durations Tp greater than 2.5 seco nds, the
scatter band on F^ is from 1.25 to s lightl y less than 4.0 with a mean
of 2.28 and a coefficie nt of variation of 0.29. For durati ons less than
about 2.5 seco nds , the lower bound on F, remains about 1.25 whil e the
upper bound rapidl y increases with decreas ing dura tion . The result is
that the mean increases for these short duration record s to 3.29 but the
coefficient of variation also increases to 0.57 or approximately double
what it was for the longer duration rec ord s.
The only conclusion which can be reached from the comparison is
that in some cases F| is sub sta nti all y g reater for the short dura tion
records than it is for the long duratio n records but in some other cas es,
^H does not appear to be increased by short duration.
4-2

8/22/2019 6848574
http://slidepdf.com/reader/full/6848574 112/394
4.1.2 Frequency Effects
Table 4-1 shows a definite trend of increasing F M with
decreasing elastic natural freq uenc y. Howe ver , there is substantial data
scatter which also tends to increase with decreasing natural frequency.
Obv iou sly , there is a freq uenc y effect but it is being partiall y masked
by some other important eff ects .
4.1.3 Influence of Freque ncy Shift from Elastic to Secant Frequency
As structures go nonlinear, their effective frequency gradually
shifts from the elastic frequency toward the softer secant frequency (see
Section 3.3.1 for a discuss ion of this e f f e c t ) . As this effect occurs,
energy is fed into the structure over the frequenc y range from f to f
and thus one could postulate that the average spectral acceleration over
this frequency range is a better descriptor of nonlinear structural
response than is the elastic spectral accele ration . Th us , if the average
spectral acceleration within this frequency range is less than the
spectral acceleration at the elastic frequenc y then Fn would be high,
whil e if the average spectral acceleration is less than the spectral
accelera tion at the elasti c freq uen cy, then FM would be low (see Figure
4-2 for a schematic^ pict ure of the c o n c e p t ) .
Figures 4-3a through 4-3c plot the relationship between averagespectral acceleration and elastic frequen cy spectral a cceleration for
each of the 12 records and 4 frequ encie s con sidere d. FM exceeds 2.7 in
each of the following cases:
' ^ H ^ 2 . 7
Olympia - 2.14 Hz
Taft - 2.14 Hz
Artificial - 3.20, 2.14 Hz
Pacoima Dam - 2.14 Hz
El Centro #5 - 2.14 Hz
Coyote Lake - 5.34, 3.20, 2.14 Hz
Gavilan Co llege - 8.54, 5.34 , 3.20, 2.14 Hz
Melendy Ranch - 5.34, 3.20, 2.14 Hz
4-3

8/22/2019 6848574
http://slidepdf.com/reader/full/6848574 113/394
All of these 16 cases have average spectral accel eratio ns between f and
fg less than the spectral accele ration at f. Simi larl y, F^ is less
than or equal to 1.7 in each of the following case s:
' H ^ 1 - 7
Olympia - 8.54, 5.34 Hz
Taft - 8.54, 5.34 Hz
El Centro #12 - 8.54 Hz
Pacoima Dam - 8.54 Hz
Goleta - 8.54 Hz
Coyote Lake - 8.54 Hz
Parkfield - 8.54, 5.34, 3.20 Hz
All of these 11 cases have average spectral accele rations between f and
fg greater than the spectral acceleration at f.
It is clear that the average spectral accelerat ion between f and
fg has a more sig nifican t influence on inelastic res ponse than does the
spectral acceleration at the elastic frequenc y, f. This factor accounts
for the large variation in F^. This spectral avera ging effect is the
overriding dominant effect influencing inelastic structural response.
The spectral averagin g effect is much more important than the
apparent duration effect described in Subsecti on 4.1. 1. In fac t, it is
this spectral averaging effect which creates most of the apparent duration
effect on F| . As noted in Chapter 2, short duration recor ds ( T Q <
3.0 seconds) appear to have narrow frequency content with a narrow
frequency range of highly amplified spectral a ccele ratio ns. When the
elastic frequency lies from about 1.4 to 2.0 times the frequency at which
these narrow frequency content spectra have maximum spectral accelerati on,
the F| fa cto r is low (less than 1 . 7 0 ) . On the other ha nd, when the
elastic frequency is less than 1.2 times the frequency of maximum
spectral acce lera tion , the F, factor is higher (greater than 3 . 0 ).
T h u s , one should ex pect very large data scatter on the FM factor for
these short duration records.
4-4

8/22/2019 6848574
http://slidepdf.com/reader/full/6848574 114/394
The conclusion is that one must retain the narrow frequency
content band-width on spectral amplification for these short duration
records in any engineering characterization of the record for nonlinear
structural resp ons e. All of the comments made in Chapter 2 on the
importance of freq uency conte nt band-width are even more important for
nonlinear structural res pon se. Short duration records (Tr, < 3.0
seco nds) should not be averaged to gether in a way which increases their
freque ncy content band-width in order to obtain a design spectrum. Such
averaging will destroy ones ability to accurately compute nonlinear
structure response using the averaged design spectrum.
4.2 NUMBER OF STRONG NONLINEAR RESPONS E CYCLES
So long as the duc tility leve l, y , is used as a measure of
dama ge, the spectral averaging effect described in the previous subsection
will have the predominant influence on the ductility level reached and
thus on dama ge. The strong motion duration , Tp, primar ily effects the
spectral averaging process because short duration records have narrower
frequen cy conten t. How eve r, duration also has a very direct influence on
the number of strong nonlinear cycles, N, and thus the hysteretic energy
dissipation per cycle (see Subsection 3.3.1 for a technical discussio n of
this e f f e c t ) . This number of strong nonlinear cycles appears to haveonly a minor influence on the maximum ductility level , y, reached. Thu s,
so long as the duct ility level is used to describe da mage , this duration
effect on damage will be much less important than the spectral averaging
effect described previo usly. However, if the total hysteretic energy
dissipation were used to descri be dama ge, then this duration effect on
the number of strong nonlinear cycles would be \/ery important. Thus , the
following discussions on the number of strong nonlinear cycles is
warranted even though N has only a minor effect on the ductilit y level
reached.
Figure 4-4 shows a plot of nonlinear structural response versus
time for a 5.34 Hz structure subjected to the Olympia record scaled to an
input level to produce a ductil ity level of 4.35 . Initially, the
4-5

8/22/2019 6848574
http://slidepdf.com/reader/full/6848574 115/394
structure oscil lates at an elastic frequency of about 5.3 Hz . Just prior
toT O t h e first nonlinear excursion occur s. Due to the strong nonlinear
cycle r i j - (z j , the effective frequency is reduced to about 4.1 Hz . A
second strong nonlinear cycle is associated with M ^ - M J - Q T ^ . Due tothis cycle, fg is further reduced to about 3.7 Hz. The next strong
nonlinear cycle is ^ 6 ^ - (Vj. During this tim e, the effective frequency
gradually lowers from 3.6 to 3.1 H z. The last nonlinear cycle is ( s ) -
Q g j and peak d uctility, y = 4.35, is reached at ^ ¥ ) . Olympia results in
essentially 4 strong nonlinear cycles through the time of peak
displ aceme nt. The effect of previous nonlinear cycles is to reduce the
hysteretic energy dissipation during the last cycle ( V ) -r 9) be lo w that
which would have occurred at this ductili ty if the precedin g cycles had
not occ urred. Th us, the peak ductility, y, is somewhat greater than would
have occurred with this same fac tor, F, if the preceding cycles had not
occurred.
The influence of strong duration, Tp^ on the number of strong
nonlinear cycles is illustrated by comparisons of the nonlinear resistance
vers us deformation plots for Taft (Tp = 10.3 s e c o n d s ) , Parkfield (T^ =
1.4 seconds), and Melendy Ranch {l^^ = 0.8 s e c o n d s ) . These resistance
versus deformation plots are shown in Figures 4-5 through 4-7 for a 5.34Hz structure at ductility levels of approximately 1.9 and 4.3. Note that
the number of strong nonlinear cycles does not appear to be sensitive to
the ductility leve l. This conclusion was found to be generally true for
all cases studied. Nex t, Figures 4-8 and 4-9 present the resistance
deformation diagrams for Taft and Melendy Ranch scaled to produce
ductility levels of approximately 4.3 for elastic frequencies of 2.14,
5.34, and 8.54 H z. These plots show that the number of strong nonlinear
response cycles does vary somewhat with frequen cy. However , no consistent
trends were observed. Sometimes N increased as f decreased and sometimes
N decreased as f decreased. Generally, the differences were one cycle .
4-6

8/22/2019 6848574
http://slidepdf.com/reader/full/6848574 116/394
T a b l e 4 -2 p r e s e n t s t h e r e la t i o n s h i p b e t w e e n s t r o n g d u r a t i o n ,
T Q , a nd t h e n u m b e r o f s t r o n g n o n l i n e a r r e s p o n s e c y c l e s , N , g e n e r a ll y
o b s e r v e d i n t h i s s t u d y . A l s o p r e s e n t e d i n t h i s t a b l e ar e f r e q u e n c y a nd
d a m p i n g c o e f f i c i e n t s , Cp a n d Cf j, w h i c h w i l l b e d i s c u s s ed i n t h e n e x t
s e c t i o n .
4 .3 C O M P A R I S O N O F C O M P U T E D S C A L E F A C T O R S W I T H T H O S E P R E D I C T E D B Y
E Q U I V A L E N T L I N E A R R E S P ON S E M O D E L S
T h e s c a l e f a c t o r s , F , b y w h i ch t h e g r o u nd m o t i o n a m p l i t u d e s m u s t
b e i n c r e a s e d t o a c h i e v e a d u c t i l i t y r a t i o o f y, = 1 .8 5 o r PLI = 4 . 2 8
a re l i st e d i n T a b l e 4 - 1 . T h e s e f a c t o r s w e r e c om p u t e d b y p e r f o r m i n g
n o n l i n e a r t i m e h i s t o r y a n a l y s e s . I t w o u l d b e d es i r a b l e t o be a b l e t o
p r e d i c t t h e s e s c a l e f a c t o r s s i m p l y f r o m c h a r a c t e r i s t i c s o f t h e e l a st i c
r e s p o n s e s p e ct r a w i t h o u t h a v i n g t o p e r f o r m n o n li n e a r t i m e h i s t o r y
a n a l y s e s . O n e m e t h o d t o a c h i e v e t h i s g oa l w o u l d b e t o c on v e r t t h e
n o n l i n e a r r e s i s t a n c e f u n c t i o n f o r t h e s t r u c t u r e t o an e q u i v a l e n t l i n e ar
r e s i s t a n c e f u n c t i o n w i t h an e f f e c t i v e f r e q u e n c y , f ' a nd e f f e c t i v e
d a m p i n g , B g . T h i s e q u i v a l e n t l i n e ar m o d e l i s u s ed w i t h t h e e l a s t i c
s p e c t r a l a c c e l e r a t i o n at f r e q u e n c y f ^ a n d d am p i n g 6 ^ t o c o m p u t e p e a k
r e s p o n s e . B y t h i s a p p r o a c h , t h e p r e d i ct e d s c al e f a c t o r , F , i s g i v e n b y
E q u a t i o n 3 - 1 4 . T h e n , t h e r a t i o , R , g i v en b y :
R = - f ( 4 - 1 )
r e p r e s en t s t h e r a t i o o f t h e p r e d i c t e d t o t i m e h i s t o r y c o m p u t e d s c al e
f a c t o r . I f R e x c e e d s 1 . 0 , t h e e q u i v a l e n t l i n e a r m o d e l o v e r p r e d i c t s
( u n c o n se r v a t i v e ) t h e s c a le f a c t o r . C o n v e r s e l y , i f R i s le ss t ha n u n i t y ,
t h e e q u i v a l e n t l i n e a r m o d e l u n d e r p r e d i c t s ( c o n s e r v a t i v e ) t h e s ca l e f a c t o r .
T h e d e s i r e i s t o f i n d a m e t h o d t o d e f i n e t h e e q u i v a l e n t l i n e a r m o d e l s o
t h a t t h e m e an v a l u e o f R w i l l b e c l o s e t o u n i t y w i t h a s m a ll c o e f f i c i e n t
o f v a r i a t i o n .
4-7

8/22/2019 6848574
http://slidepdf.com/reader/full/6848574 117/394
Subsection 3.3.1 suggested that the effective frequency, f'
and effective damping, B^, could be defined by Equation 3-8 in terms of
two empirical coef fici ents , A and C^. jhe coefficient A was varied
from 0 to 1.0 in 0.1 increments while the coeffi cient C» was varied
from 0 to 0.5 in 0.1 in crem ents . For each specific set of A and C ^
coef ficie nts, the ratio R of predicted to computed scale factors was
determined for the four elastic frequen cies , f, the two ductilitie s,y ,
and the twelve time histories studied . It was found that a mean R value
close to unity with a low coefficient of variation could be achieved when
A was defined by:
' = ^F (1- (f s/ f) ) ^ 0 . 8 5 (4-2)
with the coefficients Cp and C^ defined in Table 4-2 as functions of
the number of strong nonlinear cycles N.
One should note that as A increase s, the effec tive frequ ency,
fg* is shifted clos er to the secant fr equen cy (A = 1.0) and away from
the elastic frequ ency (A = 0 ) . It was found that A increases withincreases in the number of strong nonlinear cycles and with decreases in
the ratio ( f g / f ) , i.e., increases in the ductility ratio,y . However,
A should not exceed 0.85. Th us, the effective frequency (Equation 3-8)
does not shift more than 85 % of the difference from the elastic frequency
to the secant freque ncy. The lowest A found in this study was 0.35 for
Melen dy Ranch ( N=l) at the low ducti lity y= 1.85 (f^/f = o . 7 7 ) . T h u s ,
in this study, the effective frequency was found to range from 3 5% to 85%
of the difference from the elastic frequency to the secant frequency.
Table 4-3 lists the ratio of (f^/f) as obtained from Equations 3-8 and
4-2 and the Cp valu es in Table 4-2 for N=l through 4 for the low and
high ductility cases studied.
4-8

8/22/2019 6848574
http://slidepdf.com/reader/full/6848574 118/394
The hyster etic damping coe ffi cie nts , Cj^, listed in Table 4-2
range from 32 % to 55 % of the values listed in Equation C- 10 of Appendix C
for C ^^ associated with the largest nonlinear response cycle. This
coefficient C ^ decre ases subst antia lly as N is increased from 1 to 2 and
only slightly with further increases in N. Table 4-3 presents the
effective damping percentages Bg , which results from the use of these
C i value s in Equation 3-8 for the cases s tudi ed. Damping p ercent ages
are rounded to the closest 0.5%. One should note that the effective
damping percenta ges, Bg , are only slightly increased over the elastic
damping ( B= 7%) for the low ductilit y (y^ = 1.85) case with N of 2 and
great er. Significantl y higher effective damping percentages result for
the high duct ility cases (y^ = 4.27) and for the case of N=l.
Also shown in Table 4-3 are effective frequency and damping
percen tages as defined by the Sozen proced ure (Equation 3-9) and the Iwan
procedure (Equation 3 - 1 0 ) . The effective frequencies obtained by the
method recommended in this study generally lie between those obtained by
the Sozen and Iwan me th od s. For N=l, the method recommended herein give s
an effective frequency yery similar to that from the Iwan method.
However, as N incre ases, the recommended method produces an effective
frequency lower than that from the Iwan method and higher than that fromthe Sozen method.
The effective damping percentages obtained from the recommended
method are substantially lower than those obtained from the Sozen and Iwan
met hod s. The reasons for this lower effective damping are twofold:
1. The shear wall resist ance functions used in this study havea more extreme pinched behavior (more conservative) than
the resistan ce functio ns used in the Sozen and Iwan stud ies .It is believed that the resistance functions used in thisstudy are more re alisti c for shear wall structu res and areconservative for other structural systems where theresistance functions used by Sozen and Iwan are likely tobe more re alistic.
8/22/2019 6848574
http://slidepdf.com/reader/full/6848574 119/394
2 . The elastic d amping,B , was made proportional to the tangentstiffness at any time in this study whereas the elasticdamping was held proport ional to the initial stiffn ess inthe Sozen and Iwan stud ies . Thu s, within this study, theeffective elastic damping was much reduced during nonlinearresp onse . The reasons for making elastic damping proportional to the tangent stiffness are given in Subsection3.2.3.
Tables 4-4 through 4-6 present the ratios R of predicted to
computed scale factors obtained from effective linear models defined by
the recommended, Sozen, and Iwan methods, respectively.
Table 4-4 shows that an effective linear model with effective
frequenc y and effective damping defined by the recommended procedure
accurate ly predicts the scale facto r. The ratio of predicted to computed
scale factors has a mean of 0.98 (2% conse rvati ve) for the high ductility
case and a mean of 1.02 (2% unco nser vati ve) for the low ductility cas e.
Furthermore, the COV about these means are only 0.12 and 0.09 for the
high and low ductility cases, respectively. At the worst extrem es, the
rat io of predicte d to computed scale factors ranged from 0.75 to 1.29 for
the high ductility case and from 0.85 to 1.26 for the low ductility case.
This agreement is considered to be exceptional ly good. Furth ermor e, no
consistent errors are obse rved . The agreement is equally good throughout
the frequency range covered (approximately 1.8 to 10 H z ) . The agreement
is good for all 12 time histories co nside red. Figure 4-10 demonstrates
that the ratio R of predicted to computed scale factors is independent of
the strong motion dur ation, T Q , and the ductility level,y . In other
w o r d s , no consistent bias exists with either of these param ete rs. The
worst COV are for the Coyote Lake record but are only 0.20 and 0.15 for
the high and low ductility cas es, respe ctive ly. The most severe uncon-servatism occurs for the Taft and El Centro #12 records where the
predicted scale factors are 6 to 10% unconservative on the avera ge. The
most severe conservatism occurs for the El Centro #5 and Pacoima Dam
records where the predicted scale factors are 5 to 1 2% conservati ve on
the average.
4-10

8/22/2019 6848574
http://slidepdf.com/reader/full/6848574 120/394
The Sozen method (Table 4-5) also performs well on the average
for defining an effective linear structure model to be used to predict
peak resp ons e. How eve r, it does not perform as well as the recommended
proc edur e. On the average, the Sozen model introduces slight conservatism
( 2 % for the high ductility case, and 6% for the low ductility c a s e ) . How
ever , the COV are from 150 % to 2 00 % of those for the recommended
proc edur e. Thus , the scatter band is larger with the ratio of predicted
to computed scale factors ranging from 0.66 to 1.43 for the high ductility
case and from 0.60 to 1.37 for the low ductility cas e. Furthermore,
consistent errors are observ ed. The method tends to introduce consistent
conservative bias (ratios of predicted to computed scale factors less
than unit y) when the elastic frequ ency lies to the stiff side of the
frequency at which the elastic spectra peak . The basic problem appears
to be that the method o verpredicts the softening of the structure. Thus,
the method tends to overpredict the peak displacement (ductility)
respons e of the structure for a given level of ground mot ion . On the
other hand, the method also tends to overe stima te the effecti ve damping
for the shear wall resistance functions used in this study and this tends
to underpredict peak respons e. On the average, this overprediction and
underprediction cancel each other and thus the mean ratio of predicted to
computed scale factors is close to unity. However , for structures withan elastic frequency on the stiff side of the frequency at which spectral
accelerations pe ak, the overprediction of displacement (ductility) due to
too large a freque ncy shift is subs tant iall y greater than the under
prediction due to the use of too large of an effective damping and the
net result is significant overprediction of peak response.
The Iwan method (Table 4-6) does not perform well in defining an
effective linear structure model for the shear wall resistance functions
used in this study . The ratio of predicted to computed scale factors for
a given ductility ratio is consistent ly greater than unity. This means
that for a given ground motion lev el, the Iwan method will c onsist ently
unconservatively underpredict the peak displacement (ductility) response .
This unconservatism results from both an underestimate of frequency shift
4-11

8/22/2019 6848574
http://slidepdf.com/reader/full/6848574 121/394
and an overestimate of the effective damping. This unconservatism is
signi ficant ly greater for the long duration r ecor ds (N=3 and 4) than for
Melendy Ranch (N=l) for which the Iwan method works reasonably wel l. In
gene ral, the Iwan method should not be used to generate effect ive linear
structure models for shear wall type structures.
The conclusion is that an equivalent linear model can be used to
accurately predict peak nonlinear response of structures at least within
the elastic frequency range from 1.8 to 10 Hz studied herein. For shear
wall type struc tures , the procedure recommended herein should be used to
define the effective f requency, fg , and effec tive damping, ^e » of the
equivalent linear mo de l. This procedure requires that the number of
strong nonlinear response cycle s, N, be defined . Table 4-2 can be used
to define N as a function of the strong duration T Q . This procedure
will be conservative for other types of structural resistance functions
where the pinching behavior is less severe than for the shear wall
resistance function models used in this study.
4.4 COMPARISON OF COMPUTED SCALE FACTORS WITH THOSE PREDICTED BY
INELASTIC RESPONSE SPECTRA
As noted in Section 3.3.2, in lieu of constructing an equivalentelastic structure model to account for inelastic respo nse, one can simply
modify the elastic spectrum to obtain an inelastic response spectrum for
use with the elastic structure mo de l. The inelastic spectral response
associated with the elastic frequency, f, and elastic damp ing,B , is
obtained by dividing the elastic spectral respo nse at this frequency and
damping by an inelastic deamplifi cation fac tor , F , as shown in Equation
3 - 1 5 .
One method to define F is through the use of Equation 3-14
together with the effective elastic frequency, fg , and effective damping
B g . defined in the preceding section for the equivalent elastic
structure mo de l. Another method to define F is through the use of the
Riddell procedure described in Subsection 3.3.2. Lastly, F might be

8/22/2019 6848574
http://slidepdf.com/reader/full/6848574 122/394
defined by some average spectral acceleration within a frequency range
bounded by the elastic freq uency , f, and the secant frequency, f^.
Thus:
where S (f^ - f ,B ' ) represents the average spectral acceleration
between an upper frequ ency , f^, and the secant frequ ency, fg, at an
average effective dam pin g, B^g , and fga represents an average
effective frequency within the frequency band from f^ to fg. Intui
tive ly, it would seem that this averaging proces s would provide a mor e
accurate estimate of F than that obtained by Equation 3-14 wherein only
a single effective f requency, fg, is used.
Many different forms of spectral averaging were tried. These
included:
1. Averagin g spectral accelera tions with a uniform weighting
of spectral accelerations at all frequencies between f and
f . "
s
2. Averaging spectral accelerations with a linear increase in
weighting of spectral accelerations as frequencies were
decreased from f (zero weighti ng) to f <. (unity w e i g h t i n g ) .
u -'
3. Uniform weighted averaging of spectral velocities at all
freque ncies between f and f^,
u s
It was found that M ethods (2) and (3) did not produce better accuracy in
estimating F than could be obtained with Method (1) . There fore , onlythe method based on uniform weighted averaging of spectral accelerations
will be described he rein .
Sg(f,B)(4-3)
.1-13

8/22/2019 6848574
http://slidepdf.com/reader/full/6848574 123/394
T h e u p p e r f r e q u e n c y , f , w a s d e f i n ed b y :
{ - j - ) = ( 1 -B ) + B ( - f ) ( 4 -4 )
a nd f or u n i f o r m w e i g h t e d a v e r a g i n g , t h e av e r a g e e f f e c t i v e f r e q u e n c y
w i t h i n t he f r e q u e n c y b a nd f r o m f t o f i s :
f + f cf = - ^ - ^ ( 4 - 5 )e a c
T h e n t h e a v e r ag e e f f e c t i v e d a m p i n g w a s d e f i n ed b y :
ea( 4 - 6 )
N o t e t h a t E q u a t i o n s 4 -4 a n d 4- 6 a r e i d en t i c a l i n f o r m a t t o E q u a t i o n 3 -8
w h i c h w a s r ec o m m e n d e d f o r d e v e l o p i n g a s i n g l e f r e q u e n c y e q u i v a l e n t
e l as t i c s t r uc t u ra l m o d e l . T h e c o e f f i c i e n t , B , w a s v a r i ed f r o m 0 (f jj = f )
t o l (f = f ) i n 0 .1 i n c r e m e n t i n t e r v a l s w h i l e t h e c o e f f i c i e n t C M w a s
v a r i e d f r o m 0 t o 0. 5 i n 0 . 1 i n c r e m e n t s . F o r ea c h s p e c i f i c s e t of B a nd
C|^ c o e f f i c i e n t s , t h e r a t i o R o f p r e d i c t e d t o c om p u t e d d e a m p l i f i c a t i o n
f a c t o r s w a s d e t e r m i n ed f o r t h e f o u r e l a st i c f r e q u e n c i e s , f , t h e t w o
d u c t i l i t i e s , y , and t h e 1 2 t i m e h i s t o r i e s s t u d i e d .
•
4 - 1 4

8/22/2019 6848574
http://slidepdf.com/reader/full/6848574 124/394
Mean R values close to unity with a low coefficient of variation
could be achieved when:
B = r2Cp(l- (f5/f)) j-l (4-7)
except
0 < B < 0.70
with the coefficie nts Cp and C^ being identical to those defined for
the effe ctiv e elastic structural model in Table 4-2 . It should be noted
that with B defined by Equation 4 -7, the average effective frequen cy, fgg,
is identical to the equivalent elastic fr equen cy, fg, defined by Equations
3-8 and 4-2 for all cases where A from Equ ation 4-2 exceeds 0.5 since B =
( 2 A - 1 ) . How eve r, when A is less than 0 .5, B is limited to a lower bound
of zero (f^j = f ) and f' is less than f'. For those ca ses where f g^ is
less than f', the average effective damping , Bg^, from Equation 4-6 is
slightly greater than B ' from Equation 3- 8. Otherwise , these two
effective damping ratios are identica l. Table 4-7 lists the frequency
ratios ( f , , / f ) , and (f' /f ) and the average ef fectiv e damping perce ntage ,
6 !=.» found from Equation 4-4 through 4-7 together with Table 4-2 for all
cases stu died . Note that average effe ctiv e damping has been rounded to
the nearest 0.5 percent.
The ratio of the predicted inelastic deamplification factor
(identical to scale fact or) using Equation 3-14 together with the
effective frequency, fg , and effective damping, Bg, to the computed
facto r has alread y been given in Tabl e 4-4 since this method is identi cal to the use of an equivalent elastic structure mod el. The ratio of
the predicted inelastic deamplification factor using the spectral
averaging approach defined by Equations 4-3 through 4-7 to the computed
factor is given in Table 4-8 . The ratio of the predicted inelastic
deampl ificat ion factor obtained by the Riddell method (Equations 3-18
through 3-22) to the computed factor is given in Table 4-9.
4-15
8/22/2019 6848574
http://slidepdf.com/reader/full/6848574 125/394
By comparing Tabl e 4-8 and Ta ble 4-4, one notes that the spectral
averaging approach recommended in this section does only trivially better
than the simpler equivalent elastic freq uency approach of the previou s
secti on. The mean ratios of predicted to computed deamplification factors
are essen tially identical from the two app roa che s. The spectral averaging
approach shows only a negligible reduc tion in an already low coefficien t
of vari atio n. Howe ver, the spectral a veraging approach does reduce the
extrem e bounds of this ratio of predicted to computed deamplification
factors. Wher eas, for the high ductility case the equivalent elastic
model produced a scatter band for this ratio ranging from 0.75 to 1.29,
the spectral averaging approach reduces this band to a range from 0.75 to
1.19. Simil arly, for the low ductili ty case, the equivalent elastic
model scatter band ranged from 0.85 to 1.26 while the spectral averaging
approach scatter band ranged from 0.85 to 1.14. Response spectra contain
a number of small local peaks and valleys even at damping rat ios as high
as 12 %. The equivalent elastic model approach can place the effective
frequency at one of these local valleys or peak s. The spectral averaging
approach smooths these local valleys and peaks and thus reduces the
possi ble extremes in the ratio of predicted to computed deamplifi cation
f a c t o r s . This smoothing represents a minor im provem ent. It is unclear
whether this minor improvement warr ants the substantial increase in compu
tational work entailed by the spectral averagi ng ap proach .
The mean ratio of the predicted to computed inelastic dea mpl ifi
cation factor for the Riddell method is 1.10 (10% unco nser vati ve) for both
the high and low ductili ty cases stud ied. This mean unconserv atism is due
to the extreme pinched behavior of the shear wall resistance functions
used in this study. Such pinching was not considered in the Riddell
study . This slight unconserva tism of the Riddell method could be accommodated in design by the use of sligh tly lower acceptable duc tilit y levels
in des ign. Howe ver, the Riddell method also shows COV for the ratio of
predicted to computed deamp lification factors which range from 1 40% to
2 0 0 % of those obtained for the spectral ave raging method recommended in
this study. For the high ductility cas e, the scatter band ranges from
4-16

8/22/2019 6848574
http://slidepdf.com/reader/full/6848574 126/394
0 . 4 3 t o 1 .7 8 w h i c h i s j u d ge d t o b e e x c e s s i v e l y l a r g e w h e n c o m p a r e d t o a
s c a t t e r b a n d o f 0. 75 t o 1 .19 f o r t h e s p e c t r a l a v e r a g i n g m e t h o d . T h e
p r o b l e m o f a l a r g e s c a t t e r b a n d i s n o t a s s e v e r e f o r t h e l ow d u c t i l i t y
c a s e w h e r e i t r a n g e s f r o m 0 . 8 8 t o 1 .4 7 f o r t h e R i d d e l l m e t h o d a s c o m p a r e d
w i t h 0 .8 5 t o 1.1 4 f o r th e s p e c t r a l a v e r a g i n g m e t h o d . T h e R id d e l l m e t h o d
i s a v e r y e a s y m e t h o d t o g e n e r a t e a n i n e l a s t i c r e s p o n s e s p e c t r u m .
H o w e v e r , t h i s s t u d y s h o w s i t s h o u l d b e u s e d w i t h s o m e c a u t i o n b e c a u s e o f
t h e p o t e n t i a l l y l a r g e u n c e r t a i n t i e s a s e x p r e s s e d b y t h e w i d e s c a t t e r b a n d s
d e m o n s t r a t e d h e r e i n . I t s h o u l d b e n o t e d t h a t t h e N e w m a r k m e t h o d d e s c r i b e d
i n S ub s e c t i o n 3 .3 .2 w o u l d b e s l i g h t l y l e s s a c c u r a t e t h a n t h e R id d e l l
m e t h o d s o t h e s e s a m e c o m m e n t s a p p l y t o t he N e w m a r k m e t h o d .
4 .5 C O N C L U S I O N S O N P R E D I C T I N G I N E L A S T I C R E S P O N S E
I t i s c o n c l u d e d t h a t t h e i n e l a s t i c s p e c t r a l r e s p o n s e , S , i f „ \ ,apkT,3;
a s s o c i a t e d w i t h a n e l a s t i c s t r u c t u r al f r e q u e n c y , f , e l a s t i c d a m p i n g , 3 ,
a n d d u c t i l i t y f a c t o r , y , c a n b e a c c u r a t e l y a p p r o x i m a t e d b y e i t h e r :
P o i n t E s t i m a t e A p p r o a c h
S f f ' 8 ' )
' ^ y(f;/f)2
s p e c t r a l A v e r a g i n g A p p r o a c h
S (f - f , 6 ' JS , ( f . 3 ) = ' ' ' 2 ' ' ( 4 - 9 )
w h e r e f ' a n d g ' r e p r e s e n t t h e b e s t e s t i m a t e e f f e c t i v e f r e q u e n c y a n d
e f f e c t i v e d a m p i n g r a t i o s a s d e f i n e d b y E q u a t i o n s 3 - 8 , a n d 4 -2 w i t h
c o e f f i c i e n t s d e f i n e d b y T a b l e 4 - 2 . S i m i l a r l y , S ^ ^ ^ u ' ^ s ' ^ e a ^ r e p r e s e n t s
t h e a v e r a g e s p e c t r a l a c c e l e r a t i o n b e t w e e n f r e q u e n c i e s f ^ a n d f ^ f o r a n
a v e r a g e e f f e c t i v e d a m p i n g , 3 ' , a n d f ' r e p r e s e n t s t h e m i d p o i n t f r e q u e n c y
b e t w e e n f a n d f w h e r e t h e s e t e r m s a r e d e f i n e d b y E q u a t i o n s 4- 4 t h r o u g h
4 -7 w i t h c o e f f i c i e n t s f r o m T a b l e 4 - 2 .
4 - 1 7

8/22/2019 6848574
http://slidepdf.com/reader/full/6848574 127/394
Within this study, the spectral a veraging approach shows only a
slight improvement in accuracy over the point estimate approac h. Both
approaches are very accurate with a COV of only 0.12 at v ^ = 4.27, and a
COV of only 0.09 at v , = 1.85 for the point estimate approach withslightly lower COV for the spectral averaging appr oach. The spectral
averaging approach requires substantially greater computational effort.
However, it does smooth out local peaks and valleys in the spectral
responses and this smoothing is desir able. The ref ore , for an elastic
response spectrum which contains significant local peaks and valleys at
damping values of 7.5 to 12.5%, the spectral averaging approach would be
slight ly prefera ble. If the elastic response spectrum does not contain
significant local peaks and valleys at these higher damping level s, the
point estimate approach would be equally a ccura te.
It should be noted that both approaches require knowledge of the
elastic response spectrum at the appropriate damping values which range
from 7.5 to 12.5 % for the ductili ty levels considered in this study. In
addition, both methods require an approximate knowledge of strong motion
duratio n, T Q , since the freq uenci es fg, fg^, and fjj and the effective
damping value s, g' and 3' depend slig htly on Tp particularl y when T Q
becomes moderate ly short (7 seconds and l e s s ) . These properties represent
the minimum engineering characteriz ation of the ground motion required for
predicting inelastic structural response.
The approache s defined by Equation 4-8 and 4-9 for predi ctin g
inelastic spectral response and the approach described in the previous
section for defining an equivalent elastic structural model were developed
for shear wall type resistance functions with elastic damping of 7%.
Howe ver, based upon the parameter studies described in Appendix D , these
approaches can be conservatively used for braced frames and other
structu ral or equipme nt systems so long as the structural system does not
have a resistan ce-deform ation function which shows greater stiffness
degr adat ion and pinchin g behavio r than that used in this study for shear
w a l l s .
4-18

8/22/2019 6848574
http://slidepdf.com/reader/full/6848574 128/394
The brief parametric studies in Appendix D demonstrate :
1. Equation 4-6 can be used to estimate the average effectivedamping equally well for an elastic damping of 3% as for anelastic damping of 7%. The prediction procedure worksequall y well at 3% elastic damping as at 7% elastic damp ing.
2 . The frequency shift and hysteretic damping coefficient, Cpand C| , in Table 4-2 we re d evelo ped for a shear wallresistance function mode l. Use of these coefficients willintroduce only a slight conservatism for the Takeda model.The shear wall model overestimates the stiffness degradationand pinching behavior for braced-frame and bilinearresistance function mod els . Therefor e, these coefficientsoveremph asize the importance of N and T Q for suchm o d e l s . The input scale factor (inelastic spectral
deamplification factor) for the braced-frame and bilinearresistance function models studied in Appendix D lay midwaybetween the scale factors predicted using the Cp and C ^given in Table 4-2 for the appr opriate T Q and the scalefact or predi cted using Cp = 1.5 and C^ = 0.30 whic h aregiven for N=l. Averagin g the results obtained from the useof t hese two dif fer ent sets of Cp and C|\j va lu es wi llimprove the prediction accuracy for braced-frame andbilinear models when TQ is greater than 1.0 seconds.
4-19

8/22/2019 6848574
http://slidepdf.com/reader/full/6848574 129/394
TABLE 4-1
STATISTICAL EVALUATION O F SCALE FACTOR DATA
(a) Scale Factors (Fu) for High Ouctnity Ratio (p - 4.27)
i1 (Co^p)
10
111
lu
Olynpla, UA., 1949(N86E)
Ta ft . Kern Co .. 1952(S69E)
El Centro Array No. 12Imperia l Val ley . 1979. ( 140)
A r t i f i c i a l(R.6. 1.60)
Pacolma DamSan Fernando. 1971 CS14W)
Hollywood Storage PE L ot .San Fernando. 1971 (N90E)
El Centro Array No. 5.Imperia l Val ley . 1979. (140)
UCS8 GoletaSanta Barbara. 1978 (180)
Gllroy Array No. 2. Coyote Lake.1979. (050)
Cholame Array No. 2. Parkfleld1966 (N65E)
Gavllan CollegeHoi l is ter . 1974 (S67H)
Melendy Ranch Barn. Bear Valley.1972 (N29U)
Model Stru ctu re Frequency ]
8.54 Hz
1.56
1.25
1.56
1.89
1.70
1.94
2.38
1.52
1.56
1.55
2.84
1.89
5.34 Hz
1.54
1.65
2 . 29
1.88
1.86
2.50
2.66
2.05
3 . 85
1.29
2.97
5.48
3.20 Hz 1
2 . 61
2.05
2 . 10
2.84
2.67
2.60
2.33
2.05
4.36
1.48
2 . 71
1 5.16
2.14 Hz 1
3.75
3.38
2.14
2.75
3.89 1
2.05
3.45
1.96
3.03
2.65
8.49
3.36
Meanj<F>
2.37
2.08
I7.O2
2.34
2.53
2.27
12.71
1.90
3.20
1.74
| 4 .25
I3.97
swqOev.
a \
1.05
0.92
0.32
0.53
1.00
0.33
0.52
0.25
1.22
0.61
2.83
1 1.67
C.O.V.<J/<F>
0.44
0.44
0.16
0.23
0.40
0.15
0.19
0.13
0.38 1
0.35
0.67
0.42
1 Mean,< F>
Std. D e v . . a
1 C.O.V., a/<r>
1. 8
0.43
0.24
2. 5
1.17
0.47
2.75
1.03
0.37
3.41 1
1.73
0.51
Overal l:
<F> -
0 •
1 C.O.V. •
2.62
1.28
0.49
(b) Scale Factors (F^) for Low Du cti lity Ratio {y^^ ' 1.85)
r«y>t-hniiak« OATAMI„ . „ . , „ _ „ , . .
2
3
4
5
6
7
8
9
[1 0
11
| l 2
Olynpla. WA.. 1949(N86E)
Taft. Kern C o.. 1952(S69E)
El Centro Array No. 12Imperial Valley. 1979. (140)
A r t i fi c i a l(R.6 . .1 .60)
Pacolma DamSan Fernando. 1971 (S14U)
Hollywood Storag e PE Lot.San Fernando. 1971 (N90E)
El Centro Array No. 5.Imperial Valley. 1979. (140)
UCSB Go le USanto Barbara. 1978 (180)
Gllroy Array No. 2. Coyote Lake.1979. (050)
Cholame Array No. 2. Parkfleld1966 (N65E)
Gavllan CollegeHoi11 star. 1974 (S67H)
Melendy Ranch Bam. Bear Valley.1 1972 (N29W)
Model Structu re Frequency |
8.54 Hz
1.36
1.20
1.34
1.50
1.25
1.45
1.58
1.35
1.36
1.22
1.61
1 1.45
5.34 Hz
1.11
1.25
1.56
1.33
1 .38
1.65
1.60
1.65
1.93
1.21
1.55
1 1.96
3.20 Hz 1
1.49
1.50
1.29
1.60
1.26
1.58
1.34
1.41
2.00
1.21
1.62
1 2 . 1 8
2.14 Hz 1
1.70
1.78
1.48
1.73
2.19 1
1.39
1.51
1.49
1.86
1.59 1
1.93 1
1 ^-^
Mean<F>
1.41
1.43
1 .42
1.54
1.52
| l . 5 2
1.51
1.48
1.79
1.31
| l . 6 8
1.89
SM. 1Dev .
0
0.25
0.27
0.12
0.17
0.45
0.12
0.12
0.13
0.29
0.19
0.17
0.31
C.O.V.a/<F>
0.18
0.19
0.08
0.11
0.29
0.08 1
0.08
0.09 1
0.16
0.15
0.10 1
I 0 . 16
1 Mean.<F>
Std. D ev . . 0
1 C.O.V.. o ^ F >
1.39
0.13
0.09
1.52
0.27
0.18
1.54
0.29
0.19
1.72 1
0.24
0.14
4-20
Overal l :
< F> -
a •
1 C.O.V. •
1.54
0.26
0.17

8/22/2019 6848574
http://slidepdf.com/reader/full/6848574 130/394
TABLE 4 - 2
CORRELATION BETWEEN DURATION (T|!j), EFFECTIVE NUMBER O F STRONG NONLINEAR CYCLES (N ), FREQUENCY SHIFT
COEFFICIENT (Cp), A N D HYSTERETIC DAMPING COEFFICIENT (C ^) *
I
Strong Duration
T,!) (S ec .)
less than 1.0
1.0 - 7.0
9.0 - 11.0
greater than 15.0
Effective Number of Strong
Nonlinear Cycles, N
1
2
3
4
Frequency Shift
Coefficient, Cp
1.5
1.9
2.3
2.7
Hysteretic DampingC o e f f i c i e n t , C^ .
0.30
0.15
0.11
0.11
These frequency shift an d hysteretic damping coefficien
model. Howev er, based upon parameter studies in Append
bilinear, Takeda, a n d braced-frame resistance function
a slight conservatism f o r t h e Takeda model. T h e shear
pinching behavior f o r braced-frame and bilinear resista
overemphasize t h e importance o f N a n d T n f o r such model
fication factor) for t h e braced-frame a n d bilinear resis
between t h e scale factors predicted using the Cp and Cfjscale factor predicted using C p = 1.5 an d Cf^ = 0.3 0 wh i
ts were developed f o r a shear wall resi
ix D , they c a n also b e conservatively umodels. U s e o f these coefficients will
wall model overestimates t h e stiffness
nee function models. Therefore, these
s. T h e input scale factor (inelastic stance function models studied in Append
given in Table 4 - 2 f o r t h e appropriate
ch a r e given f o r N = l .
stance functio
se d f o rintroduce onl
degradation a n dcoefficients
pectral deampli
ix,D l i e midwa
T Q a n d t h e

8/22/2019 6848574
http://slidepdf.com/reader/full/6848574 131/394
TABLE 4-3
COMPARISON O F EFFECTIVE FREQUENCY A N D EFFECTIVE DAMPING A S OBTAINED B Y VARIOUS METHODS
I
Ductility
y
1.85
4.27 1
Secant Frequency
Ratio, (f^/f)
0.77
0.56
N*
1
2
3
4
1
2
3
4
Recommend
( f ; / f )
0.92
0.90
0.87
0.85
0.71
0.63
0.62
0.62
ed Method
^e (° )
10
7.5
7.5
7.5
12.5
10.5
9.5
9.5
Sozen Method
{ f ; / f )
0.77
0.56
3 ; {% )
11.5
16
Iwan Method
( f ; / f )
0.91
0.73
Bg (%)
12.5
16
Number o f Strong Nonlinear Cycles

8/22/2019 6848574
http://slidepdf.com/reader/full/6848574 132/394
TABLE 4-4
RATIO O F PREDICTED T O COMPUTED SCALE FACTOR FOR RECOMMENDED METHOD T O
DEFINE EFFECTIVE LINEAR MODEL
High Ductility Case (nu • 4.27)
(Corap)
1
2
3
4
5
6
7
8
9
10
11
12
Olympla, WA.. 1949(N86E)
Ta ft. Kern Co .. 1952(S69E)
El Centro Array No. 12Imperia l Val ley , 1979, (140)
A r t i f i c i a l(R.G. 1.60)
Pacolma DamSan Fernando. 1971 (S14W)
Hollywood Storage PE Lo t.San Fernando. 1971 (N90E)
El Centro Array No. 5,Imperia l Val ley . 1979. (140)
UCSB GoletaSanta Barbara, 1978 (I80)
G11roy Array No. 2. Coyote Lake.1979, (050)
Cholame Array No. 2, Pa rk fle ld1966 (N65E)
Gavllan CollegeHolllster, 1974 (S67H)
Melendy Ranch Barn. Bear Valley,1972 (N29H)
Model Struc ture Frequency |
8.54 Hz
1.09
1.01
.9 0
1.00
1.01
.8 4
.7 5
1.11
.8 3
1.16
.8 4
.9 0
5.34 Hz
1.01
.9 9
1.C2
.8 7
1.13
1.11
.8 7
.95
.7 7
.9 8
1.09
1.02
3.20 Hz
.9 3
1.02
1.29
.9 2
.8 8
1.17
.9 9
.8 4
1.19
.7 7
1.13
1.06
2.14 Hz
1.01
1.02
1.03
.9 1
.9 0
1.05
.9 1
.7 8
1.01
1.03
1.01
1.01
Mean<F >
1.01
1.01
•1.06
.9 3
.9 8
1.04
.8 8
.9 2
.9 5
.9 9
1.02
1.00
Std.
D e v .0
.0 7
. 0 1
.1 6
.0 5
.1 2
.1 4
.1 0
.1 4
.1 9
.1 6
.1 3
.0 7
C.O.V.o/<F>
.0 6
.0 1
.1 6
.0 6
.1 2
.1 4
. 1 1
.1 6
.2 0
.1 6
.1 3
.0 7
Mean,<F>
Std. Dev., a
C.O.V., oA:F>
.9 5
.1 3
.1 4
.9 8
.1 1
.1 1
1.02
.1 6
.1 5
.9 7
.0 8
.0 8
Ov e ra l l :
< F> «
0 =
C.O.V. •
.9 8
.12
.1 2
Lo w Ductility Case (y = 1.85)
1 ( C o m p )
1
2
3
4
5
6
7
8
9
10
U
12
Olympla. MA.. 1949(N86E)
Ta ft . Kern Co .. 1952(S69E)
El Centro Array No. 12Imperia l Val ley . 1979, (140)
A r t i f i c i a l(R.G. 1.60)
Pacolma DamSan Fernando, 1971 (S14W)
Hollywood Storage PE Lot,San Fernando, 1971 (N90E)
El Centro Array No. 5,Imperia l Val ley , 1979, (140)
UCS8 Goleta
Santa Barbara, 1978 (180)Gllroy Array No. 2, Coyote Lake,1979. (050)
Cholame Array No. 2, Parkfleld1966 (N65E)
Gavllan CollegeHolUstor. 1974 (S67H)
Melendy Ranch Barn, Bear Valley,1972 (N29U)
Model Stru ctu re Frequency |
8.54 Hz
.9 7
1.10
.9 6
.8 9
.9 6
1.07
1.06
1.16
1.00
1.13
1.01
1.00
5.34 Hz
1.05
1.01
1.04
1.17
.9 0
1.11
.9 5
1.06
.9 0
1.19
1.03
1.05
3.20 Hz
.9 3
1.09
1.04
1.00
1.00
.8 9
1.00
1.01
1.02
.9 2
.8 5
.9 7
2.14 Hz
.9 5
1.20
1.09
.8 5
.94
1.05
.9 8
.8 5
1.26
.9 9
1.07
1.06
Mean<F >
.9 8
1.10
•1.03
.9 8
.9 5
1.03
1.00
1.02
1.05
1.06
.9 9
1.02
S to .
D e v .
0
.0 5
.0 8
.0 5
.1 4
.0 4
.1 0
.0 5
.1 3
.1 5
.1 2
.1 0
.0 4
C.O.V.a/<F>
.0 5
.0 7
.0 5
.1 5
.0 4
.0 9
.0 5
.1 3
.1 5
.1 2
.1 0
.0 4
Mean,<F>
Sto. Dev. , 0
C.O.V.. o/<F>
1.03
.0 8
.0 6
1.04
.0 9
.0 9
.9 8
.0 7
.0 7
1.02
.1 2
.1 2
O v e r a l l :
< F> •
0 •
C.O.V. -
1.02
.0 9
.0 9
4-23

8/22/2019 6848574
http://slidepdf.com/reader/full/6848574 133/394
TABLE 4-5
RATIO O F PREDICTED T O COMPUTED SCALE FACTOR FOR SOZEN METHOD T O
DEFINE EFFECTIVE LINEAR MODEL
High Duc t i l i ty (y > 4 .2 7 >
Earthauake Record
(Comp)
1
2
3
4
5
6
7
8
9
10
U
12
Olympla. UA., 1949
(N86E)
Taft. Kern Co .. 1952(S69E)
El Centro Array No. 12
Imperial Valley, 1979, (140)
Artificial(R.G. 1.60)
Pacolma Dam
San Fe rnando, 1971 (S14W)
Hollywood Storage PE Lot,San Fern ando, 1971 (N90E)
El Centro Array No. 5,
Imperial Valley. 1979, (140)
UCSB Goleta
Santa Barb ara, 1978 (180)
Gllroy Array No. 2 , Coyote Lake,
1979. (050)Cholame Array No . 2. Parkfleld1966 (N65E )
Gavllan College
Holllster, 1974 (S67W)
Melendy Ranch Barn, Bear Valley,
1972 (N29 W)
Model Structure Frequency
8.54 Hz
.91
.95
1.12
.93
.82
.84
.68
1.09
.82
.88
.80
.79
5.34 Hz
.87
.98
.98
.92
.90
1.11
.90
.77
.92
.66
.93
1.30
3.20 Hz
.96
1.31
1.11
.97
1.15
1.11
1.19
.68
1.43
.78
1.33
1.19
2.14 Hz
1.13
.91
1.05
1.18
.67
.91
.86
.74
.96
1.32
1.13
.90
Mean
<F >
.97
1.04
1.07
1.00
.89
.99
.91
.82
1.03
.91
1.05
.97
Sto.
Oev.a
.11
.18
.06
.12
.20
.14
.21
.18
.27
.29
.23
.17
C.O.V.o/<F>
.12
.18
.06
.12
.23
.14
.23
.22
.26
.32
.22
.18
Mean, <F >
Sto. Dev.. 0
C.O.V.. a/cF>
.89
.13
.14
.94
.16
.17
1.10
.22
.20
.98
.19
.19
Overall:
< F> -
o «
C.O.V. -
.98
.19
.19
Low Du ctility (p - L as')
11 (Comp)
Olympla. UA.. 1949(N86E)
Taft. Kern C o.. 1952(S69E)
El Centro Array N o. 12
Imperial Vall ey. 1979 . (140)
Artificial(R.G. 1.60)
Pacolma Dam
San F ernando. 1971 IS14U)
Hollywood Storage PE L ot.San Fern ando, 1971 (N90E)
El Centra Array No. 5.
Imperial Val ley. 1979. (140)
UCSB GoletoSanto Barbara. 197 8 U S O )
Gllroy Array No. 2. Coyote Lake.1979. (050)
Cholame Array No. 2 . Parkfleld
1966 ( N65E)
Gavllan CollegeHolllster. 1974 (S67U)
Melendy Ranch Barn. Bear Valley.
1972 (N29 U)
Model Structure Frequency |
8.54 Hz
.85
.91
.82
.81
.91
.91
.76
.74
.80
.85
.84
.60
5.34 Hz
1.04
.96
1.09
.89
.91
.82
.81
.85
.85
.80
1.15
1.12
3.20 Hz
1.00
.88
1.02
.86
.82
1.08
1.11
.98
1.30
.62
.83
.97
2.14 Hz
.89
1.15
.90
1.01
1.17
1.06
1.37
.68
1.16
.86
1.35
.90
Mean<F >
.95
.98
• .96
.89
.95
.97
1.01
.81
1.03
.78
1.04
.90
Sto.
Dev.0
.09
.12
.12
.09
.15
.12
.28
.13
.24
.11
.25
.22
C.O.V.o/<F>
.09
.12
.13
.10
.16
.13
.28
.16
.24
.14
.24
.24
Overall:
< F > •
a •
C.O.V. •
.94
.17
.18
Mean,< F>
Sto. Dev.. 0
C.O.V.. oA F>
.82
.09
.11
.94
.13
.14
.96
.17
.18
1.04
.21
.20
4-24

8/22/2019 6848574
http://slidepdf.com/reader/full/6848574 134/394
TABLE 4-6
RATIO O F PREDICTED T O COMPUTED SCALE FACTOR FOR IWAN METHO D T ODEFINE EFFECTIVE LINEAR MODEL
High D uc t i l i t y (u •= 4 . 27>
rarthniialfA Rornrvi
(Comp)
1
2
3
4
5
6
7
8
9
10
1 1
12
Olympla. UA.. 1949
(N86E)
Taf t . Kern Co. , 1952(S69E)
El Centro Array No. 12I mper ia l Va l l ey . 1979 . ( 140)
A r t i f i c i a l(R.G. 1.60)
Pacolma DamSan Fernando. 1971 (S14U)
Hol lywood Storage PE Lot ,San Fernando. 1971 (N90E)
El Centro Array No. 5,I mper ia l Va l l ey , 1979 , ( 140)
UCSB GoletoSanto Barbara. 1978 (180)
Gl l roy Array No. 2, Coyote Lake.
1979. (050)Cholame Array No. 2, Park f le ld1966 (N65E)
Gav l lan Col legeHo l l l s t e r . 1974 (S67U)
Melendy Ranch Bam. Bear Val ley .1972 (N29U)
Model St ru ctu re Frequency |
8.54 HZ
1.83
1.88
1.64
1.63
1.54
1.55
1.14
1.53
1.62
1.55
1.21
1.10
5.34 Hz
1.72
1.68
1.90
1.47
1.64
1.42
1.19
1.59
1.15
1.61
1.45
1 . 10
3.20 Hz
1.38
1.48
1.60
1.30
1.14
1.65
1.63
1.44
1.43
1.23
1.34
1 . 12
2.14 Hz
1 . 11
1.49
1.52
1.62
1.42
1.60
1.42
1.26
1.68
1.39
.8 1
1.15
Mean<F>
1.51
1.63
•1.67
1.51
1.44
1.56
1.35
1.46
1.47
1.45
1.20
1.12
SM .Dev.o
.3 3
.19
.1 6
.1 6
.22
.1 0
.2 3
.14
.24
.17
.2 8
.0 2
C.O.V.o/<F>
.22
.12
.1 0
.10
.1 5
.06
.17
.10
.16
.12
.2 3
.02
Mean.<F>
Sto. Dev.. 0
C.O.V.. aAF>
1.52
.2 5
.16
1.49
.2 5
.17
1.40
.1 8
.1 3
1.37
.25
.1 8
Overa l l :
< F> -
a «
C.O.V. -
1.44
.2 3
.1 6
Low Ductility (p > 1 . 8 5 )
! (Comp)
1
2
3
4
S
6
7
8
9
10
1 1
12
Olynv la . UA. . 1949(N86E)
Ta f t . Kem Co. . 1952(S69E)
El Cent ro Array No. 12I mper ia l Va l l ey . 1979 . ( 140)
A r t i f i c i a l(R.G. 1.60)
Pacolma DamSan Fernando. 1971 (S14U)
Hol lywood Storage PE Lot .San Fernando. 1971 (N90E)
El Cent ro Array No. 5.I mper ia l Va l l ey . 1979 . ( 140)
UCSB GoletoSanto Barbara. 1978 (180)
Gl l roy Array No. 2. Coyote Lake.1979. (050)
Cholame Arr«y No. 2. Pa rk f le l d1966 (N65E)
Gav l l an Co l l egeHo l l l s t e r . 1974 (S67H)
Melendy Ranch B a m . Bear Va l l ey .1972 (N29U)
Model St r uc to re Frequency |8.54 Hz
1.37
1.32
1.35
1.15
1.13
1.32
1.14
1.22
1 . 18
1.27
1.26
1.02
5.34 Hz
1.33
1.42
1.37
1.53
1 . 12
1.25
1.09
1.30
1 . 15
1.25
1.27
1 . 17
3.20 Hz
1.22
1.39
1.43
1 . 31
1.28
1 . 19
1 . 41
1.30
1.32
1 . 13
1.03
1.03
2.14 Hz
1.21
1.35
1.37
1.23
1.20
1.28
1.35
1 . 01
1 . 41
1.21
1.25
1.12
Mean<F>
1.28
1.37
1.38
1.31
1.18
1.26
1.25
1.21
1.27
1.22
1.20
1.09
SM .Oev.
0
.08
.0 4
.03
.1 6
.07
.05
.1 6
.14
.12
.06
.12
.07
C.O.V.o/<F>
.06
.0 3
.0 3
.1 3
.06
.04
.1 3
.1 1
.1 0
.05
.1 0
.07
O v e r a l l :
<F> -
a "
C.O.V. •
1.25
.1 2
.1 0
Mean.<F>
SM . Oev. , 0
C.O.V., o/tF>
1.23
.1 1
.0 9
1.27
.1 3
.1 0
1.25
.1 4
.1 1
1.25
.1 1
.0 9
4-25

8/22/2019 6848574
http://slidepdf.com/reader/full/6848574 135/394
TABLE 4-7
EFFECTIVE FREQUENCY RANGES A N D AVERAGE EFFECTIVE DAMPING
Ductility
y
1.85
4.27
Secant FrequencyRatios, (fg/f)
0.77
0.56
Number of Strong Nonlinear
Cycles, N
1
2
3
4
1
2
3
4
(f,/f)
1.00
1.00
0.98
0.94
0.86
0.70
0.69
0.69
(^a/^)
0.88
0.88
0.87
0.85
0.71
0.63
0.62
0.62
B ; , (%)
10.5
8
7.5
7.5
12.5
10.5
9.5
9.5

8/22/2019 6848574
http://slidepdf.com/reader/full/6848574 136/394
TABLE 4-8
RATIO OF PREDICTED TO COMPUTED INELASTIC DEAMPLIFICATION FACTOR FORRECOMMENDED SPECTRAL AVERAGING METHOD
High Ductility Case (p - 4.27)
1 (Component)
1
2
3
4
5
6
7
8
9
10
U
12
Olympla. UA.. 1949(NOeE)
Ta f t , Kem Co. . 1952(S69E)
El Centro Array No. 12I mper ia l Va l l ey , 1979 . ( 140)
A r t i f i c i a l(R.G. 1.60)
Pacolma DamSan Fernando. 1971 (S14U)
Hol lywood Storage PE Lot ,San Fernando. 1971 (N90E)
El Centro Array No. 5,I mper ia l Va l l ey , 1979 , ( 140)
UCSB GoletoSanta Barbara, 1978 (180)
Gi l roy Array No. 2, Coyote Lake,1979, (050)
Cholame Array No. 2, Pa rk f le l d1966 (N65E)
Gav l l an Co l l egeHo l l l s t e r , 1974 (S67H)
Melendy Ranch Barn, Bear Valley,1972 (N29W)
Model St ruc tur e Frequency |
8.54 Hz
1.04
.9 6
.9 2
.9 9
1.01
.8 7
.7 5
1.06
.8 6
1.15
.8 0
.9 5
5.34 Hz
1.00
1.02
1.04
.8 8
1.06
1.05
.87
.9 1
.8 1
.9 6
1.07
1.00
3.20 Hz
.92
1.03
1.17
.9 1
.89
1.17
1.05
.8 2
1.19
.77
1 . 11
1.02
2.14 Hz
.98
.94
1.01
.93
.9 0
1.02
.90
.76
1.01
1.05
.95
1.09
Mean<F >
.9 9
.9 9
•1.04
.9 3
.97
1 .03
.8 9
.89
.97
.9 8
.9 8
1 .02
Std.
Oev.0
.05
-04
.1 0
.05
.08
.1 2
.12
.1 3
.17
.16
.1 4
.06
C.O.V.a/<F>
.05
.04
.1 0
.05
.09
.1 2
.14
.1 5
.1 8
.1 6
.1 4
.06
Mean,< F>
St d . D e v . . 0
C . O . V . . o/<F>
.9 5
.1 1
.1 2
.9 7
.09
.09
1 . 0 0
.14
.1 4
.9 6
.09
.09
O v e r a l l :
< F> -
0 »
C.O.V. •
.97
.1 1
.1 1
Lo w Ductility Case (p • 1.85)
ravfh/ i t iaka DArnwt
(Component)
1
2
3
4
5
6
7
8
9
10
U
12
Olympla. UA.. 1949(N86E)
Ta f t . Kem Co. . 1952(S69E)
El Centro Array No. 12I mper ia l Va l l ey . 1979 . ( 140)
A r t i f i c i a l( R . G . , 1 . 6 0 )
Pacolma DamSan Fernando, 1971 (S14H)
Hollywood Storage PE Lot,San Fernando. 1971 (N90E)
El Cent ro Array No. 5.I mper ia l Va l l ey , 1979 , ( 140)
UCSB GoletoSanto Barbara, 1978 (180)
Gl l roy Array No. 2, Coyote Lake.1979, (050)
Cholame Array No. 2, Pa rk f l e ld1966 (N65E)
Gav l lan Col legeHo l l l s t e r , 1974 (S67H)
Melendy Ranch Barn. Bear Valley,1972 (N29W)
Model Structure Frequency
8.54 Hz
.9 6
1 . 11
1.00
.9 0
1.00
1.08
1.00
1.04
.9 9
1.09
1.01
.8 9
5.34 Hz
1.02
1.04
.9 9
1.12
.9 5
1.00
.9 4
1.02
.8 8
1.12
1.09
1.06
3.20 Hz
.95
1.03
1.06
.95
.95
.94
1.12
1.05
1.05
.8 9
.87
.95
2.14 Hz
.9 2
1.12
1.07
.89
.98
1.09
1.10
.85
1.14
.97
1.08
1.04
Mean
<F >
.9 6
1 .08
•1 .03
.9 7
.97
1 .03
1 .04
.9 9
1 . 0 2
1 . 0 2
1 .01
.9 9
St d .
D e v .
0
.04
.05
.04
.1 1
.02
.07
.08
.09
.1 1
.1 1
.1 0
.08
C.O.V.
o/<F>
.04.
.04
.04
.1 1
.0 3
.07
.08
.1 0
.1 1
.1 1
.1 0
.0 8
Mean,<F>
Std. Dev. . 0
C.O.V.. o A F >
1.01
.07
.0 7
1.02
.0 7
.0 7
.9 8
.0 8
.0 8
1.02
.1 0
.09
O v e r a l l :
< F> •
o •
C.O.V. •
1.01
.0 8
.0 8
4-27

8/22/2019 6848574
http://slidepdf.com/reader/full/6848574 137/394
TABLE 4-9
RATIO O F PREDICTED T O COMPUTED SCALE FACTOR FOR RIDDELL METHOD T ODEFINE EFFECTIVE LINEAR MODEL
High Ductility Ca3e (p ' 4.27)
11 (Component)
1
2
3
4
5
6
7
8
9
10
11
12
Olympla, UA., 1949
(N86E)Taft , Kem Co. , 1952(S69E)
El Centro Array No. 12Imperia l Val ley , 1979, (140)
A r t i f i c i a l(R.G. 1.60)
Pacolma DamSan Fernando, 1971 (S14U)
Hollywood Storage PE L ot ,San Femando, 1971 (N90E)
El Centro Array No. 5,Imperia l Val ley . 1979, (140)
UCSB GoletoSanta Barbara, 1978 (180)
Gllroy Array No. 2, Coyote Lake,
1979, (050)Cholame Array No. 2, Parkfleld1966 (N65E)
Gavllan CollegeHol l ls ter , 1974 (S67U)
Melendy Ranch Bam, Bear Valley.1972 (N29U)
Model Str uc tor e Frequency |
8.54 Hz
1.21
1.15
1.35
1.35
.9 6
1.31
1.06
1.13
1.58
.8 8
1.29
1.17
5.34 Hz
1.23
1.32
1.11
1.36
.9 3
1.02
.96
1.00
.9 5
1.02
1.23
.6 7
3.20 Hz
1.40
1.23
1.10
.9 0
.6 3
.9 5
.8 6
1.09
.8 4
1.35
1.35
.7 1
2.14 Hz
.9 7
1.08
.8 6
1.33
.9 4
1.78
1.06
1.14
1.20
1.38
.4 3
1.09
Mean<F >
1.20
1.20
1 .1 0
1.24
.8 6
1.26
.9 8
1.09
1.14
1.16
1 .08
.9 1
• S M .O e v .
.1 8
.1 0
.20
.2 2
.1 6
.3 8
.1 0
.0 6
.3 3
.25
.4 3
.26
C.O.V.o/<F>
.1 5
.08
.1 8
.1 8
.1 9
.3 0
.1 0
.06
.29
.22
.4 0
.2 9
Mean.<F>
S M . O e v . . o
C . O . V . . o/cF>
1.20
.1 9
.1 6
1.07
.1 9
.1 8
1.03
.26
.25
1.10
.3 2
.29
O v e r a l l :
< F > •
a "
C.O.V. •
1 . 1 0
.25
.2 3
Lo w Duct ili ty Cas e (p •= 1.85)
1r .M.fc .# . . .a l . . . DA. .M.W4
(Component)
1
2
3
4
5
6
7
8
9
10
11
12
Olympla. UA.. 1949(N86E)
Ta ft . Kem Co . . 1952(S69E)
El Centro Array No. 12Imperia l Val ley . 1979, (140)
A r t i f i c i a l(R.G. 1.60)
Pacolma DamSan Femando, 1971 (S14U)
Hollywood Storage PE Lo t.San Femando, 1971 (N90E)
El Centro Array No. 5,Imperia l Val ley . 1979. (140)
UCSB GoletoSanta Barbara, 1978 (180)
Gllroy Array No. 2. Coyote Lake.1979. (050)
Cholame Array No. 2. Parkfleld1966 (N65E)
GavHan CollegeHol l ls ter . 1974 (S67U)
Melendy Ranch Barn, Bear Valley,1972 (N29U)
Model Stru ctu re Frequency |8.54 Hz
1.20
1.08
1.22
1.09
1.18
1.12
1.03
1.13
1.20
1.01
1.19
1.12
5.34 Hz
1.47
1.30
1.04
1.23
1.12
.9 9
1.02
.9 9
.9 9
.9 8
1.24
.9 8
3.20 Hz
1.09
1.09
1.26
1.02
1.19
1.03
1.22
1.16
.9 6
1.35
1.19
.8 8
2.14 Hz
1.13
1.08
1.10
.9 4
.8 8
.97
1.01
1.09
1.03
1.03
.9 9
.9 7
Mean<F >
1.22
1.14
1.16
1.07
1 .09
1 .03
1.07
1 .09
1.04
1.09
1.15
.9 9
S td .
D e v .0
.1 7
.1 1
.1 0
.1 2
.1 4
.07
.1 0
.07
.1 1
.1 7
.1 1
.1 0
C.O.V.a/<F>
.1 4
.1 0
.09
.1 1
.1 2
.07
.09
.06
.1 1
.1 6
.1 0
.1 0
Mean,<F>
S M . D e v . . a
C . O . V . . o/tF>
1 . 1 3
.07
.0 6
1 . 1 1
.1 6
.1 4
1 . 1 2
.1 3
.1 2
1.02
.07
.07
4-28
O v e r a l l :
< F> -
0 -
C.O.V. -
1 1 0
.1 2
.1 1

8/22/2019 6848574
http://slidepdf.com/reader/full/6848574 138/394
C 6
o
o(O
(U
oC O
5 .
OI 4
0
00
2 •0
0
©
© O
Upper Bound of Data
2©
@ ®
© /^ Lower Bound0 0 V of Data
Q 5§
6 8 10 12
Stro ng Du ra tio n, TJI, (se c.)
14 16 18
FIGURE 4-1. SCALE FACTOR, F^ VERSUS DURATION, TJ
4-29

8/22/2019 6848574
http://slidepdf.com/reader/full/6848574 139/394
\—I—I—I I 1 I — ry 5 6 7 8 9 ' ! 0 2 3 y 5 6 7 8 9 'l O'
FREQUENCY
I 1
FIGURE 4 - 2 . EFFECT OF FREQUENCY SHIFT DUE TO NONLINEAR RESPONSE
4-30

8/22/2019 6848574
http://slidepdf.com/reader/full/6848574 140/394
J or ' 2 3 « S 6 7 8 9 J G r 2 3 a 5 6 7 8 9 J 0 ' 2^ • • • 1 • • r I . I I I I I I I r 1_
3 « 5 6 7 8 9 J ( f- I 1 I ' ' ' > '
a. •»•0 1 r-bJ
U
taJn
a '
in-
O L Y M P I P
f
DAMPING 0.070
R a n g e off r e q u e n c y s h i f t~ f o r d e g r a d i n g s y s t e m w i t h11 = 4.3
• , ' I ' I I l i i i i i ' . ' ' — r , T,—f '11 r—I I II I—r-1 0 ' 2 3 y 5 6 7 8 9 ^ 0 " ?! 3 l < J 5 i 6 7 8 p ' l 0 '
FREQUENCY (HERTZ)
T 1 1 i I I I I • ,
2 3 < S 6 7 89| | ( j '
E l a s t i c s t r u c t u r e fr e q u e n c y , f 2.14 3.20 5'. 34 8.54
IQT' 2 3 V 5 6 7 8 9 j a r 2 3 « S 6 7 8 9 J 0 '
n , I t i_i I I I I r I I I I I I I I r
» - <»
en •»
0 1 c-
l U u>
(_)
omma.
o
aZJl i j
IO0 .
tv -
fc»• ^ .
0 ) -» •
e»-
in-
3 M S 6 789 J O *- I I I—i 1 1 1 ^
TflFT
DAMPING 0.070
-\ R a n g e off r e q u e n c y s h i f t
f o r d e g r a d i n g s y s t e m w i t h
M = 4.3
— . , i ' I I — I — I — r I I I—J ' I I 1 I I I I I ' I I — : 1 T 1 —I I I I I • _ ,
10 2 3 i | S 6 7 8 9 ' l 0 ' 21 3 l > l 5 | 6 7 e | 9 ' l 0 ' 2 3 1 5 6 7 8 9 1 0 ^
FREQUENCY (HERTZ)
I i I I
E l a s t i c s t r u c t u r e f r e q u e n c y , f - 2.14 3.20 5.34 8.54
FIGURE 4-3a. ELASTIC RESPONSE SPECTRA FOR 7% DAMPING ( T ^ > 9 S ec )
4-31

8/22/2019 6848574
http://slidepdf.com/reader/full/6848574 141/394
ICT' ? 3 ^ 5 Blf>9}tf 2 3 f 5 6 7 8 ? j Q- 2 3 < 5 6 7 8 j j t f
2 -*IT mo t "»0 1 I-U J
I ] "U
^ '
UJ n
CD
ac
o toQ ~*3 <nUJ OB
W p.
in
EL CENTRO. ARRAY NO. 12
f
DAMPING 0. 070
Ra nge of f r e q u e n c y s h i f t" f o r d e g r a d i n g s ys te m w i t hu • 4.3
10- i 3 4 s iUs\(f 5 T T T T T J I WFREQUENCY (HERTZ)
2.14 sizo s'.34 8',s4
"T 1 .1 i I I 1 I • .
2 3 <i $ 6 7 8 9 1 0 '
Elastic ttructur * frtqutncy. f •
IGT' 7 3 i | 5 6 7 8 9 J C r
2°P o,CE •0 1 (-
UJ in
tn
CE
O ^3 •>UJ •>
in -
A R T I F I C I A L
3 U S 6 7 8 9 J 0 '• • I I I I i r — j__LJ_iillll<'
. ^ ^ 1 : - J
DRMPING 0.070
Range of frequency shiftfor degrading system withy ' 4.3
^» J—i 4 i ni i ^ t f l\ ii 4 siiUji',0' 5 T T T T T nFREQUENCY IHERTZ)
E l a s t i c s t r u c t u r e f r e q u e n c y , f2 . 1 4 3.20 5.3» 8 54
FIGURE 4-3a. ELASTIC RESPONSE SPECTRA F OR 7% DAMPING (T^> 9 S e c )(Continued)
•
4-32

8/22/2019 6848574
http://slidepdf.com/reader/full/6848574 142/394
10-'
»-( T
0 1UJ_ lUJ
uu( E
UJ
»—3- 1O
«oI Q<E
O
a3U J
«n0 .
OJ.
m
f -I D
in
n
N
•o
O)
<D
t~
in
2 3 U S 6 7 8 9 J G ^ 2 3 t 5 6 7 8 9 J 0*t • 7 ? ? . . . r I 1—I—I I I I I r—
2 3 « 5 6 7 8 9 JCf
PACOIMA DAMDRMPING 0.070
Range of frequency shiftfo r degrading system w i t hy ' 4.3
10- 1 3 4 i iUi\(f' 2 i 4 5 r 7 8 9 ' | 0 ' I i 4 i iU 9\(fFREQUENCY, (HERTZ)
• tr1>i I'lV 5 6 7 89
u„w. . JHERTZ) I
E l a s t i c s t r u c t u r t f r t q u t n c y . f • 2.14 3.Z) s'.SH 9,54
' « ^ ' 1 ? It ^ ? 7 ? ? K I ? ! ? «???. '0 ' ? 3 f, 8f T f j J t f
h -CE0 1U J- 1
tuuuaU it-3- 10
«nCD( E
0
3U J
in0 .
O I
•>t -
•0
in
M
N -
b
O I
»^10
HOLLYUOOO STORAGE
f
10"* 2 i M^TTTeTToT
DAMPING 0.070
Range of f r e q u e n c y s h i f tf o r d e g ra d in g s y s te m w i thu ' 4. 3
1— nmuvitfFREQUENCY (HERTZ)
I I IE l a s t i c s t r u c t u r t f r t q u t n c y . f • 2.14 3.20 5.34 8
54
FIGURE 4 - 3 b . ELASTIC RESPONSE SPECTRA F O R 7 % DAMPING (2.5 Sec* T' ^ 9 S e c )
4-33

8/22/2019 6848574
http://slidepdf.com/reader/full/6848574 143/394
l o r ' 3 3 « S 6 7 8 9 J ( f 2 3 4 5 6 7 9 9 J 0* 2 3 « 5 I 7 8 ? Q^ • ' f • • i i i i i i i 1 I i i i i i T .
t c •0 1 f
s 'UJ nh -3- IO «i nCOa.o fc)a -* •3 atUJ *>
in p.
EL CENTRO. JAMES ROADDAMPING 0.070
R a ng e o f f r e q u e n c yf o r d e g r a d i n g s y s t e i iu = 4 . 3
i F 2 3 4 5 6 7 89h ( f 2 I i j 4 i | ^7 e|9 "l 0*FREQUENCY (HERTZ)
i—rTTTTTn(j '
E l a s t i c s t r u c t u r e f r e qu e n c y• ' ' 2.14 s'.ZO 5.34 8.54
ICT' 2 3 l | S 6 7 B 9 J a r 2 3 q 5 6 7 8 9 j | 0 ' 2 3 « 5 6 7 8 a ( f, 1 1 1—I—I I I I r I X L _ j I I I i r ' • . . i i . T '"
(E s
UJ „
a:lu nh -3- IO «in03(C
o fc>a - *•
3 o>U J OB'in r..
GOLETA
/ "
DAMPING 0.070
R an ge o f f r t q u t n c y s h i f t• f o r d e g r a d i n g s y s t e m w i t h
u - 4 . 3
' . , I ' I I I I I I I L -« * I '* '1
10 2 3 « 5 6 7 8 9 ' l 0 r 2 3 " !FREQUENCY (HERTZ)
«TTTeTYtf" 1 — r T T H T P I t f
Elastic structurt frtqutncy
r [\I:.UUI:RI. I i n [ ; i \ i c ) i
. f ' t\u l ! » S'.3» $.8 4
FIGURE 4-3b. ELASTIC RESPONSE SPECTRA 7 % DAMPING ( 2 . 5 S e c « T ^ < 9 S e c )
(Continued)
4-34

8/22/2019 6848574
http://slidepdf.com/reader/full/6848574 144/394
) 0 " 2 3 « S 6 7 a 9 j a r 2 3 « 5 6 7 8 9 J 0 ' 2 3 « S S 7 a 9 J 0 '• I 1 1— I i 1 11 I I I I I I TI r 7 1 T 1 t , T f f
DAMPING 0. 07 0
Range of f r e q u e n c y s h i f tf o r deg rad i ng sys t em w i t hV ' 4.3
Iff' 5 T T T T T a l W 2 1 ii4 5id7eJ9'io'FREQUENCY (HERTZ)
E l a s t i c s t r u c t u r t f r t q u t n c y , f •2;i4 3.20 5.34 8.54
1 4 i i 7 islio'
J LJLLLLUiO'
• -(E
acU I- 1U i
uuaU if-3- 1
ai n
oas
0
a3U ii n
ft,
Ofa -fto
rn-
OK
•»•
IM '
to
"at-0 -r-
le-in-
PRRICFIELDDAMPING 0.070
Range of f r e q u e n c y s h i f tf o r deg rad i ng sys t em w i t hu -4.3
T^» 5—TTTTTnTtfiTilTTlTTTTO 3 — i H iiUi\(fFREQUENCY (HERTZ)
E l a s t i c s t r u c t u r t f r t q u t n c y , f •2.14 3.20 5.34 8. SI
FIGURE 4-3c, ELASTIC RESPONSE SPECTRA F O R 7 % DAMPING (T,!)<2.5 S e c )
4-35

8/22/2019 6848574
http://slidepdf.com/reader/full/6848574 145/394
• b i o " 3 M
0 1
(_) - 1
03.
OQ =''(X
mOQ
UJ (MIO0 -
5 6 7 8 9 J tf• I • • • r
2 3 1 1 5 6 7 8 9 | 1 0 '-x • • 1 • • • • •
3 <» S 6- I t.
7 8 9 JO *I I I I
HOLLISTER DAMPING 0. 07 0
•at
-•o
R a n g e of f r e q u e n c y s h i f tf o r d e g r a d i n g s y s t e m w i t hu • 4.3
-O)
' ; 1 1 I I I — I r I I , I I 1 I I — I ' l l — r
1 0 2 3 « S 6 7 8 9 ' l O ^ 2 3 q 5 5 7 8 9 ' l 0FREQUENCY IHERTZ)
—1 1—I—1—I I I ,
3 1 s e v e g i o
E l a s t i c s t r u c t u r t f r t q u t n c y , f • 2.14 3.29 5.34 ^_^^
\ff* 2 3 l i 5 6 7 B 9 J Q r 2 3 U S 6 7 e 9 J 0 ' 2 3 « S S 7 8 9 0 f• • ' • • • I • r I • • • • I I • r • • . . i I T T **
a. «»m c-UJJ "U i inO
UJ n» —3
intoa
o t>a "*
U i B
in ,-
MELENDY RANCHDAMPING 0. 07 0
Range of f r e q u e n c yf o r d e g r a d i n g s y s t eli = 4. 3
10 -I I I I I I I—tV 5 6 7 8 9 ^ o r sTrTiTTTTO!- \—TXTTTTHO'
FREQUENCY (HERTZ)
E l a s t i c s t r u c t u r e f r e q u e n c y , f * 2 . 1 4 3 1 2 0 5:34 8'.54
FIGURE 4 - 3 c . ELASTIC RESPONSE SPECTRA F O R 7 % DAMPING (T J^ 2.5 S e c )(Continued)
t4-36

8/22/2019 6848574
http://slidepdf.com/reader/full/6848574 146/394
V = R(u)
M
/ J
/ R
1/ / t / / / }
r r—»6
/1rf*\l •> •
5.34H2
f =3.1Hze
0 . 0 0 y . o o 8 . 0 0
( a ) Tim e H i s t o r y R e s p o n s e
1 2 . 0 0 1 6 . 0 0 2 0 . 0 0 2 4 . 0 0
T I M E
0 3 0 a .^0 a 10
OEfOR^I f iTJON
(b) Reaction Force - Displacement Response
FIGURE 4 - 4 . MODEL STRUCTURE RESPONSE FOR OLYMPIA EARTHQUAKE
(N86E , 1949) FOR f = 5.34 H z , y = 4.35
4-37

8/22/2019 6848574
http://slidepdf.com/reader/full/6848574 147/394
\/T
1
(a) f = 5.34 Hz
e = 0.07
y = 1.9
0.00 0.39 0.16
DEFORMfiTlON
0.40
(b) f = 5.34 Hz
6 = 0.07
y = 4.3
- 0 . 6 0 - 0 . 4 a -0.20 O.aO 0.20 0.40
OEFORMflTlON0.60 o . e o
FIGURE 4-5. MODEL STRUCTURE RESPONSE TO KERN CO. EARTHQUAKE(TAFT, S69E, 1952) for f = 5.34 H z, y = 1.9-4.3
4-38

8/22/2019 6848574
http://slidepdf.com/reader/full/6848574 148/394
(a) f = 5.3 4 Hz
3 = 0.07
y = 1 .9
0 38 3 30 0 38
DEFORMATION
(b) f = 5.34 Hz3 = 0.07
y = 4 .3
0 eo 9 30 0 iO 0 -taDEFORMATION
•
FIGURE 4-6. MODEL STRUCTUR E RESPONSE TO PARKFIELD EARTHQUAKE (CHOLAME
ARRAY NO. 2 , N65E , 1966) f o r f = 5 . 34 H z , y = 1.9-4.3
4-39

8/22/2019 6848574
http://slidepdf.com/reader/full/6848574 149/394
ooo
OQ
Q•M.
aoo .to
oc:c tl i jX H
a
ooQto.
aaQ
§ao
/ f(a) f = 5.34 Hz
3 = 0.07
y = 1.9
0 36 0 30 0 38
DEFORMflTiaN
J
J - _ , ,
0r 1 ' " T 1
(b ) f = 5.34 Hz
3 = 0.07
y = 4.3
0 90 0 20 0 i<0
DE f^O RM P TlO N
FIGURE 4 - 7 . MODEL STRUCTURE RESPONSE TO BEAR VALLEY EARTHQUAKE (MELENDYRANCH, N29W, 1 972) fo r f . = 5.34 H z, y = 1.9-4.3
•
4-40

8/22/2019 6848574
http://slidepdf.com/reader/full/6848574 150/394
0 60 -0 to -0 20 0.0 0 0.^0 O.VO 0 $0DEFORHflTION
v.oo
0.)0 1 00
(a) f = 2.14
6 = 0.07
y = 4.3
(b) f = 5.34 Hz
B = 0.07
M = 4.3
(c) f = 8.54 Hz
B = 0.07
y = 4.1
-0 6 -0 08 0' 00 0" oa 3 6 am 0 3 j
FIGURE 4-8. STRUCTURE RESPONSE TO KERN CO. EARTHQUAKE (TAFT,
S 6 9 E , 1952) for f = 2-9 Hz , y = 4.1 - 4.3
4-41

8/22/2019 6848574
http://slidepdf.com/reader/full/6848574 151/394
0.00 O.OS 0.10DCFORNRTION
o V . s ^ 2 0 O.ZS
(a) f^ = 2.14 Hz
Bg = 0,07
y = 4.3
(b) f^ = 5.34 Hz
Bg = 0.07
y = 4.3
(c) fg = 8.54 Hz
Bg = 0.07
4.3
FIGURE 4-9. MODEL STRUCTURE RESPONSE TO BEAR VALLEY EARTHQUAKE (MELENDY RANCH,
N29W, 1972) for f^ = 2-9 H z , y = 4.3

8/22/2019 6848574
http://slidepdf.com/reader/full/6848574 152/394
-n
H cz m O o o -a 7
3
o IH o oo
RaooPeceoCmpeSeFo
o
o bo
o
C
rM.
f -5o3 lO
C 0C
I CA)
0 o>t—
m
-n3O—o <m 7 ocC C c7 •3
O 3 —O
- O •.
ac- aro e o
© ©
O©
©
§
©
©
9
©
©
©
>
©
O ©©
^
I©
e
»
l>
©
0
©
^
©
^ ©
©
>
©
•
©
©
0
@ >Q
>O
> 1 TI • 0 e
1 I ro

8/22/2019 6848574
http://slidepdf.com/reader/full/6848574 153/394
5. GROUND MOTION CHARACTERIZAT ION FOR NONLINEAR RESPONSE
Chapter 2 described the engineering characteriz ation of ground
motion for elastic structural resp onse . This chapter will extend that
engineering characterization of ground motion to the prediction of
nonlinear structural response using the procedure recommended by Chapter 4
for predicting nonlinear response.
The nonlinear response cha racteriza tion of ground motion can be
defined in terms of the inelast ic spec tral r esp ons e, S ^ ( f , B ) , which can
be obtained by the spectral averaging approach of Equation 4-9, This
inelastic spectral response can be obtained for either an average design
spectrum such as R.G. 1.60 or for actual ear thquake spec tra. It was shown
in Chapter 2 that the R.G. 1.60 spectrum anchored to an "eff ective" acce l
eration could be used as an engineering characterization of the ground
motion for longer duration ( T Q > 3.0 rec ord s) broad frequency content
(1.2 to 5.5 Hz) records when predicting the elastic response of stiff
structures (natural frequenc ies of 1.8 to 10 H z ) . There fore, the
inelastic spectral respo nses will first be shown for the R.G. 1.60spectrum.
5.1 INELASTIC R.G. 1.60 SPECTRA
Figures 5-1 and 5-2 show the inelastic response spectra from 1.0
to 10.0 Hz correspo nding to y = 1.85 and y = 4.27 for the 7% damped R .G.
1.60 spect rum. All spectra are anchored to a l.Og ground acc eleration .
The inelastic spectra were developed using Equations 4-4 through 4-7 and
4-9 together with the coefficients of Table 4-2. The inelastic deamplifi-
cation factors for a given d uctility are a constant throughout the ampli
fied acceleration frequency range and another constant throughout the
amplified spectral velocity regi on. These constants are a function of the
number of strong inelastic cycles (i.e., a function of the strong
durat ion) decreasing with an increasing number of cycl es. One can compare
5-1

8/22/2019 6848574
http://slidepdf.com/reader/full/6848574 154/394
these constant F factors found from this study for shear wall resistant
function models with the Riddell factors reported in Section 3.3.2 as
follows:
V
1.85
4.27
N
1
2
3
4
1
2
3
4
Inelastic Deamplification
Factor for Acceleration
Reg ion , F^a
Recommended
1.74
1.52
1.44
1.36
3.68
1.93
1.81
1.81
Riddell
1.63
2.55
Inelastic Deamplification
Factor for Velocity
Regi on, F^y
Recommended
1.92
1.69
1.63
1.58
3.60
2.91
2.75
2.75
Riddell
1.92
3.65
One should note that the Riddell F values are greater than the F
values found in this study for the longer duration records (N=2 through 4)for which the R.G. 1.60 spectrum was an adequate characterization of the
ground moti on. The shear wall resistance function models used in this
study have significantly lower effective damping Bg than the models used
in the Riddell study for the same elas tic damping of 755.
#
5-2

8/22/2019 6848574
http://slidepdf.com/reader/full/6848574 155/394
The conclusion is that the inelastic deamplification factors
proposed by Riddell are unconservative for the shear wall r esistance
function models used in this study. This unconservatism increases with
duc tili ty level from a factor of about 1.15 at y = 1.85 to about 1.37 atP = 4.27 .
Secondl y, one should note that for Tp > 3.0 seconds (N=2
through 4 ) , the F^j factor is rather insensitive to N. One could use the F^
values for N=3 with a maximum error of about + 6%. The refo re, for broad
frequency content ground motion s associated with T Q > 3,0 seconds for
which the R.G. 1.60 spectrum is a reasonable characterization of the
ground motion, it is unnecessary to estimate T Q ' or N. It is adequate
to assume N=3 for the purpose of predic ting the ductility level y .
5.2 PREDICTED INELASTIC SPECTRA FOR REAL TIME HISTORIES
Figures 5-3 through 5-13 present the inelastic spectra predicted
within the frequency range from 1.0 to 10.0 Hz for the 11 real time
histories included in this study using the prediction methods of Chapter 4
and ductilitie s of 1.85 and 4.2 7. Several points should be noted from
these figures:
1. The peak inelastic spectral accelerations always occur atfrequencies higher than those at which the peak elasticspectral accelerations occur. This situation occurs becauseinelastic response of these higher frequency structuresshifts the effective frequency downward into the range ofpeak elastic response.
2 . The inelastic deamplification factors associated withfrequencies equal to or less than that at which the elasticspectr um peaks are much gr eater than those for higherf r e q u e n c i e s .
These points are most dramatica lly illustrated by the Parkfield
Cholame Array #2 spectra (Figure 5 - 1 1 ) . The elastic spectral amplifica
tions are very high from 1.2 to 3.0 Hz and drop off very rapidly at both
higher and lower freq uenc ies. The largest inelastic deamplification
5-3

8/22/2019 6848574
http://slidepdf.com/reader/full/6848574 156/394
factors are associated with elastic frequencies less than 3.0 Hz since
inelastic response will shift these frequencies lower and markedly reduce
respo nse. Structures with frequen cies of 3.0 Hz and less could be
designed to yield at spectral acc elera tions much less than those indicatedby the elastic spectra for Parkfield without severe damag e. However , for
the Parkfield record one must be very careful not to reduce the e lastic
spectral accelerations for structures in about the 3.5 to 5.0 Hz ran ge.
These str uctures should be designed to remain elastic for the Parkfield
record. Inelastic response of such structures will shift their effective
frequencies into the frequency range (1.2 to 3.0 Hz) within which the
power of the input is predominantly con centrat ed. For such stru cture s,
inelastic responses would rapidly increase because of this frequency
shift . For records with narrow frequency co ntent , such as Parkfield, one
should be very careful about taking any credit for inelastic re spons e for
structures which lie slightly to the stiff side of the predominant
frequency range of the record. On the other hand, for even stiffer
structures (elastic frequencies greater than 5.0 Hz) the inelastic
deamplification factors are again significant although not as large as
for structures with frequencies below 3.0 Hz .
5.3 COMPARISON OF INELASTIC SPECTRA TO R.G. 1.60 INELASTIC SPECTRA
In Section 2.3, the 7% damped elastic R.G. 1.60 spectrum
anchored at an "effective" acceleration w as compared to the 1 % damped
elastic spectra for the 11 real earthquake time histories over the
frequency range from 1.8 to 10 Hz . The "effective" acceleration, A^c ,
was set so that 8 4% of the actual spectral accelera tions between 1.8 and
10 Hz would lie below the R.G. 1.60 spectr um. In other wor ds, the R.G.
1.60 spectrum wa s exceeded at 16 % of the frequenc ies b etween 1.8 and 1 0
H z . This process has been repeated for the inelastic spectra corresponding to y = 1.85 and 4.27. The corresponding "effective" acc eleration,
^Dy» ^^"^ inelastic response are shown in Table 5-1.
5-4

8/22/2019 6848574
http://slidepdf.com/reader/full/6848574 157/394
Figure s 5-3 through 5-13 c ompare the y = 1.0, 1.85, and 4.27
spectr a for the 11 actual reco rds studied to the correspondin g R.G. 1.60
spectra anchored to the effective design ac celerati ons, A^ , for these
same ductility levels for frequencies fr om 1.0 to 10 Hz . The R.G. 1.60spectrum used depends upon the number of strong nonlinear cycl es, N. The
N = 4 spectrum wa s used for O lympi a; N = 3 for Taft and El Centro #12;
N = 1 for Melendy Ranc h; and N = 2 for the other 7 recor ds. Table 5-2
presents the maxim um, med ian , and minimum ratio of actual inelastic
spectral accel eration to R.G. 1.60 inelastic spectral acceleration
(SA,, /SA,, ) fo r the fre que ncy range fro m 1.8 to 10 Hz conside red in• a ^1.60
this study.
The six real ground motion records with T^ > 3.0 seco nds
(Olympia through El Centro #5) are all reasonably fit by the R.G. 1.60
spectrum anchored at A Q for y = 1.0 (elastic), 1.85, and 4.27. Actuall y,
the fit is even be tter for the inel astic R eg. Guide spectra to the
inelastic actual spectra than it is for elastic spectra (y = 1.0 ). There
f o r e , the conclusio n of Section 2.3 that the R.G. 1.60 spectrum anchored
to an "effective" acceleration provides an adequate engineering character
ization of the ground motion for the six longer duration records for
elastic response of structures with elastic frequencies between 1.8 and10 Hz can be easil y extended to inelastic response at least up to
duct ility levels of 4.3. The reason that the R.G. 1.60 spectrum works
even better for inelastic resp onse than for elastic response is that
inelastic response spectra are smoother than elastic spectra and thus can
be better fit by a smoot h, broad frequency design spectrum such as R.G.
1.60.
Simil arly, the conclusion of Section 2.3 that the elastic R.G.
1.60 spectrum does not provide an adequate engineering characterization
for the 5 shorter duration records (Tp ^ 3.0 seconds) for elastic
response can also be extended to inelastic response.
5-5

8/22/2019 6848574
http://slidepdf.com/reader/full/6848574 158/394
For t h e s i x records with broad frequency content a nd T ^ > 3 . 0
seconds (Olympia through El C e n t r o # 5 ) , t h e "effective" design accelera
t io ns , A Q ^ , f o r y = 1.0, 1.85, a nd 4 . 2 7 a r e compared in Table 5 - 1 t o t h e
corrected instrumental ground acceleration,a , t h e r m s
based design accel
e r a t i o n , A p ^ j ^ , a n d t h e Spectral Intensity based design acceleratio n,
^DE2» described in Section 2.3. F o r these s i x records, all three accel
erations could serve a s a basis f o r defining "effective" acceleration t o
anchor t h e R.G. 1 . 6 0 spectrum. F o r these s i x records:
y
1 .0
1 . 8 5
4 . 2 7
Ratio
^Dy^^DEl
' Dy/' DE2
^Dy/'^DEl
^Dy ' DE2
^ D y / ^
' Dy/ DE2
Max.
1 . 1 0
1 . 1 7
1 . 1 7
1 . 1 3
1 . 2 1
1 . 1 9
1 . 1 9
1 . 3 1
1 . 2 6
Mean
0 .8 7
1 .06
0 .99
0 .87
1 .06
0 . 9 9
0 . 9 1
1 .10
1 .03
Min.
0 .73
0 .96
0 .85
0.71
0 . 9 4
0 . 8 3
0 .70
0 .95
0 .85
COV
0.15
0 .08
0 .12
0 .17
0 .09
0 .14
0 . 1 9
0 . 1 2
0 . 1 6
The rms-based "effective" acceleration, Ap^^, h a s t h e lowest
COV. However, it also introduces a mean factor o f unconservatism o fbetween 1 . 0 6 a t t h e lower ductilities t o 1 . 1 0 a t y = 4.27. Considering
the conservative bias introduced b y u s e of t h e R.G. 1 . 6 0 spectrum ( s e e
Table 5- 2) , this slight factor o f unconservatism is unimportant. When t h e
R.G. 1 . 6 0 spectrum is anchored t o Ap^^, within t h e 1 . 8 t o 1 0 H z range,
the following ratio o f ( SA / S A ) a r e obtained f o r t h e 6 records
considered: ^ ^-^^
5-6

8/22/2019 6848574
http://slidepdf.com/reader/full/6848574 159/394
y
1.0
1.85
4.27
(SA /SA )^a ^1.60
Maximum
Range
1.29-1.05
1.24-1.00
1.32-1.03
Median
1.20
1.10
1.12
Med i urn
Range
1.05-0.83
1.15-0.85
1.06-0.84
Median
0.88
0.99
0.98
Minimum
Range
0.76-0.49
0.88-0.51
0.82-0.56
Median
0.59
0.64
0.67
For broad frequency content records (frequency content at least
throughout the range from 1.2 to 5.5 Hz) associated with durations TI
greater than 3.0 seconds, both the elastic (y = 1.0) and inelastic
response chararacteristics of the ground motion for structures with
elastic frequencies from 1.8 to 10 Hz can be adequately characterized by
the R.G. 1.60 spectra anchored to an rms based "effective" acceleration
defined by Equation 2-15. For the six records studied with these charac
t e r i s t i c s , the maximum factor of unconservatism obtained at a n y frequency
from 1.8 to 10 Hz for ductilities from 1.0 to 4.3 was 1.32 while the
maximum factor of conservatism w a s (1/0.49) = 2.04. The median factor of
conservatism ranged from (1/0.88) =1 . 1 4 f o r elastic response (y = 1.0) to
(1/0.99) = 1.01 for inelastic response. In other words , at t h e w o r s t ,
this method of defining the engineering characterization ofground motion
can range from a 1.3factor of unconservatism to a 2.0 factor of conserva
tism with a slight conservative bias on the average. Considering the
uncertainties in the ground motion, this range of accuracy is very
tolerable.
5-7

8/22/2019 6848574
http://slidepdf.com/reader/full/6848574 160/394
5.4 GROU ND MOTION CHARACTERIZATION FOR NONLINEAR RESPONSE SUMMARY
In this cha pter , inelastic spect ra are predicted by the spectral
averaging approach presented in Chapter 4 for the 11 real e arth quake
ground motion records considered in this study. In addition, inelastic
Re g. Guide 1.60 spectra have been constructed by the same approac h. The
actual ea rthqua ke spec tra and the Reg. Guide spectra are utilized to
establish "effective" accelera tion, Ap , for inelastic response as the
value the Reg. Guide spectrum must be anchored such that 84 percent of
the actual earthquake inelastic response spectral accelerations between
1.8 and 10 Hz would lie below the Reg. Guide 1.60 spectr um. It is shown
in Tabl e 5-2 that the inel astic spectra for all the longer du ration
records studied are reasonab ly fit by the Reg Guide 1.60 spectra anchored
to Ap but this is not the case for the 5 shorter duration r ec or ds. It
is also shown in this chapter t hat the rms based definiti on for
"eff ectiv e" acc eler atio n, Ap^j^ as given by Equation 2-15 pr ovid es a good
match with the empirically determined "effective" acceleration, Ap^.
In Chapter 2 it was demonstrated that an adequate engineer ing
characterization for elastic structural response for stiff structures
(1.8 to 10 Hz) subjected to any of the six real ground motion records
with Tp > 3.0 seconds is provided by the Reg . Guide 1.60 spectrum anchored
to an "effectiv e" peak acceleration, Apni as given by Equation 2-15. In
this ch apte r, it is demonstr ated that this conclusion can be extended to
inelastic response at least up to ductility levels of 4.3. Similar ly,
the conclusion of Chapter 2 that the elastic Reg. Guide 1.60 spectrum
does not provide adequate engineering characterization for the 5 shorter
duration records (Tp ^ 3.0 secon ds) for elastic response can also be
extended to inelastic response.
5-8

8/22/2019 6848574
http://slidepdf.com/reader/full/6848574 161/394
TABLE 5-1
"EFFECTIVE" DESIGN ACCELERATIONS FOR INELASTIC RESPONSE
( C o m p o n e n t )
1
2
3
5
6
7
8
9
10
11
12
O l y m p i a , WA., 1949
N 8 6 E )
T a f t , Kern Co., 1952
( S69 E )
El Cent r o Arra y No. 12
Imperial Valley, 1979, (140)
PaCOima Dam
S a n Fern a n d o , 1971 (S14W)
H o l l y w o o d Stor a g e PE Lot,
S a n Fern a n d o , 1971 ( N 9 0 E )
El Cent r o Arra y No. 5,
Imperial Valley, 1979, (140)
UCSB Go!eta
S a n ta B a r b a r a , 1978 (180)
Gil r o y Arra y No. 2, C o y o te L a k e ,
1979, (050)
C h o l a m e Arra y No. 2, Parkfield
1966 (N65E
Gav i l a n Coll e g e
Hoi l i s t e r , 1974 ( S67W)
M e l e n d y Ranc h Barn , Bear Valle y ,
1972 (N29 W )
'E f f e c ti v e"D es i g n Acc e l e r a t i o n ,
y = 1.0
0.219
0.149
0.128
0.856
0.233
0.471
0.283
0.233
0.562
0.105
0.573
y = 1.85
0.216
0.145
0.129
0.825
0.238
0.487
0.272
0.241
0.516
0.101
0.631
y = 4.27
0.223
0.148
0.135
0.820
0.251
0.528
0.402
0.243
0.625
0.093
0.620
Ground
A c c e l .
a (g)
0.281
0.180
0.142
1.170
0.211
0.530
0.347
0.191
0.490
0.138
0.520
RMS-Based
A c c e l .
ApEi (g)
0.202
0.155
0.133
0.795
0.213
0.404
0.332
0.202
0.514
0.106
0.435
Spectral
Intensity
B a s e d Acce l .
ApE2 (g)
0.253
0.175
0.128
0.879
0.200
0.442
0.324
0.154
0.564
0.060
0.221

8/22/2019 6848574
http://slidepdf.com/reader/full/6848574 162/394
TABLE 5- 2
COMPARISON O F ACTUAL SPECTRAL ACCELERATIONS T O R.G. 1.60 SPECTRAL ACCELERATIONS ANCHORED TO A,
Earthquake Record
(Component)
1 ^ '1 ^1 ^
5
1 ^1 7
1 ^1 ^10
1 ^12
Olympia, WA. , 1949(N86E)
Taft, Kern Co., 1952(S69E)
El Centro Array No. 12Imperial Valley, 1979, (140)
Pacoima Dam
San Fernando, 1971 (S14W)
Hollywood Storage PE Lot,San Fernando, 1971 (N90E)
El Centro Array No. 5Imperial Valley, 1979, (140)
UCSB Goleta
Santa Bar bara, 1978 (180)
Gilroy Array No. 2, Coyote Lake1979 (050 )
Cholame Array No. 2, Parkfield1966 (N65E )
Gavilan CollegeHolliste r, 1974 (S67W)
Melendy Ranch Barn, Bear Valley1 1972 (N29W)
(S A / SA ) * 1^ a ^ 1 . 6 0 1
y = 1.0 1
Max.
1.12
1.23
1.09
1.08
1.14
1.11
1.33
1.15
1.16
1.66
1.14
Median
0.90
0.89
0.86
0.84
0.86
0.90
0.82
0.77
0.48
0.58
0.69
M i n . 10 . 7 0 1
0 . 6 1 1
0.61 1
0.55
0.45 1
0 . 6 0 1
0 . 6 9 1
0.25
0.37 1
0.2 6 1
0 . 0 8 1
1 y = 1.85 1
1 M a x .1 1.08
1 1.12
1 1.03
1 1.02
1 1.02
1 1.03
1 1.65
1.04
1.40
1 1.26
1 1.03
Median
0.94
0.92
0.88
0.93
0.91
0.95
0.89
0.80
0.53
0.84
0.80
M i n . 10 . 8 2 1
0 . 6 8 1
0.70
0 . 4 9 I
0.51 1
0 . 5 4 1
0.76
0.27 1
0.46
0 . 1 8 1
0.09 1
1 y = 4.27 1
1 M a x .1 1.07
1 1.10
1.01
1 1.03
j 1.02
1 1.01
I 1.35
1.01
1 1.15
1 1.09
1 1.01
Median
0.94
0.95
0.83
0.91
0.87
0.81
0.64
0.77
0.49
0.57
0.61
M i n . 10 . 6 1 1
0 . 8 6 1
0 . 7 0 1
0 . 5 4 1
0.50
0.51
0.53
0.27 1
0 . 4 2 1
0.11
0.10
* Ratios o f Actual t o R e g . Guide 1.60 Spectral Accelerations a r e reported
fo r t h e frequency range of 1.8 to 10 Hz

8/22/2019 6848574
http://slidepdf.com/reader/full/6848574 163/394
T 1 1 1 1—r n \ 1 1—r
7% Damping
N
N
N
N
= 1.0
1.85
TJ (Sec)
< 1.01.0 - 7.0
9 .0 - 11.0>15.0
N
12
34
•^y
1.75 Hz
1.921.69
1.631.58
6.0 Hz
1.741.52
1.441.36
T 1—r - I — I — I — I — r7 8 9 'l 0'
1 ^
6 7 8 9 '1 0
FREQUE NCY (HERT Z
FIGURE 5 - 1 . INELASTIC REG. GUIDE 1.60 RESPONSE SPECTRA - LOW DUCTILITY

8/22/2019 6848574
http://slidepdf.com/reader/full/6848574 164/394
o" T — I — r 1 1 1—r
1% Damping
y = 1.0
N = 3 & 4,N = 2 Vy = 4.27
N = 1
T^ (Sec)
1 < 1 . 01.0 - 7.09.0 - 11.0
>15.0
N
1234
^ 11.75 Hz
3.602.912 . 7 52.75
6.0 Hz 1
2.68 11.931.811.81
6"1 1— r7 8 9 '1 0" 3
-r -5
F R E Q U E N C Y ( H E R T Z )
9 '10^
FIGURE 5-2. INELASTIC REG. GUIDE 1 . 6 0 RESPONSE SPECTRA - HIGH DUCTILITY

8/22/2019 6848574
http://slidepdf.com/reader/full/6848574 165/394
1 r 1 1—r
u = 1 .0
^ = 1.85
n = 4.27
Dashed lines areR.G. 1.60 spectra
n —3
-I 1 1 — i — r1 1 — r
6 7 8 9 10"
FREQUENCY (HERTZ)
6 7 8 9 1 0
FIGURE 5-3. COMPARISON O F OLYMPIA SPECTRA WITH REG. GUIDE 1.60 SPECTRA
ANCHORED T O "EFFECTIVE" DESIGN ACCELER ATION, A^ .

8/22/2019 6848574
http://slidepdf.com/reader/full/6848574 166/394
CD
CM
o
O I -
Z «° -O r~- -
CL LD -
Ql
L U 3. -
_ JU JCJ ro -
CJCC
L UCM -
0COOD
cr
0
L JZ )
ii 1COCL.
0
—'O I
00
r-
eo
U )
T 1 1—I—r -1 1—I—r
C M V
3
// = 1.0
- B — n = 1.85_
~e— u = 4.27
Dashed 1ines are
R.G. 1.60 spectra
- 1 1 1 1 — I — I — ; ;
5 6 7 8 9 l 02
-T 1—r27 8 9 1 0
FREQUENCY (HERTZ)
FIGURE 5-4. COMPARISON OF TAFT SPECTRA WITH REG. GUIDE 1.60 SPECTRA
ANCHORED TO "EFFECTIVE" DESIGN ACCELERATION, Ap

8/22/2019 6848574
http://slidepdf.com/reader/full/6848574 167/394
-I 1 1 1 1 — r "T 1 1 — r
A = 1.0
^ = 1.85
H = 4 . 2 7
Dashed lines areR.G. 1.60 spectra
3- I — r - 1 1 1 — I — 1 r
6 7 8 9 'l 0^ 38 9 1 0"1^
2
FREQUENCY (HERTZ)
FIGURE 5-5. COMPARISON OF EL CENTRO #12 SPECTRA WITH REG. GUIDE 1.60 SPECTRAANCHORED TO "EFFECTIVE" DESIGN ACCELERATION, Ap^

8/22/2019 6848574
http://slidepdf.com/reader/full/6848574 168/394
T 1—I—r 1 1 — r
^ = 1 .0
|/-= 1.85
^ = 4.27Dashed lines are
G. 1.60 spectra
- i — I — I — r37 8 9 'lO° 2 3 4 5
FREQUENCY (HERTZ)6 7 8 9 '1 0
FIGURE 5-6. COMPARISON O F PACOIMA DAM SPECTRA WITH REG. GUIDE 1.60 SPECTRA
ANCHORED T O "EFFECTIVE" DESIGN ACCELERATION, ADii

8/22/2019 6848574
http://slidepdf.com/reader/full/6848574 169/394
1 1 1 1 1 — r 1 1 — r
^ = 1.0
n = 1.85
Ii = 4.27
Dashed lines a r e
R.G. 1.60 spectra
1 1 — r5 6 7 8 9 'lO°
- I -
3- 1 1 1 — I — 1 r
6 7 8 9 'l 0— I
3
FREQUENCY (HERTZ
FIGURE 5-7. COMPARISON O F HOLLYWOOD STORAGE SPECTRA WITH REG. GUIDE 1 . 6 0SPECTRA ANCHORED T O "EFFECTIVE" DESIGN ACCELERATION. A p ^

8/22/2019 6848574
http://slidepdf.com/reader/full/6848574 170/394
LD
3 *
roC J
GD
ct: oLU —^— I mUJ COC JC Jcn u3
c^
U l
n
LU
COQQCE
OCD
L J J „CO O
cn -CD
r~ [-
iD -
T T 1 r
/ i = 1 .0
- Q — M = 1 . 8 5
— 8 — n = 4.27
Dashed lines a r eR.G. 1.60 spectra
-| 1 1 — r -1 1 1 — I — I — r
6 7 8 9 'l O'8 9 '10" 2 3 4 5
FREQUENCY (HERTZ)
FIGURE 5-8. COMPARISON O F E L CENTRO # 5 SPECTRA WITH RE G. GUIDE 1.60 SPECTRA
ANCHORED T O "EFFECTIVE" DESIGN ACCELERATION, AD//

8/22/2019 6848574
http://slidepdf.com/reader/full/6848574 171/394
-| 1 \—r - r — r - | r -
H = 1. 0
O — p = 1.35
— e — U = 4.27
Dashed lines areR.G. 1.60 spectra
-| 1 — r2 3
-1 1 1 — I — I r
6 7 8 9 1 08 9 1 0
F R E Q U E N C Y ( H E R T Z )
FIGURE 5-9. COMPARISON OF GOLETA SPECTRA WITH REG. GUIDE 1.60 SPECTRAANCHORED TO "EFFECTIVE" DESIGN ACCELERATION, Ap

8/22/2019 6848574
http://slidepdf.com/reader/full/6848574 172/394
^ 2m
Z ^ -O r~ -I— I
h - ^
(X Ln -
LU :3._ JL ULJ ro -
CJCC
L U 'M -
CO oCQ ^cr cn
QO
g -=) lo
LU(O ^CL.
1 1 1—r - | 1—r
'M r3
- r5 6
1 — r
^ = 1 .0
— Q — u = 1.85
— 8 — n = 4 . 2 7Dashed lines a r eR.G. 1.60 spectra
3 5-1 1 — I — I — r
7 8 9 1 08 9 '10
F R E QU E N C Y ( H E R T Z i
%
FIGURE 5-10. COMPARISON O F COYOTE LAKE , GILROY SPECTRA WITH REG. GUIDE 1.60SPECTRA ANCHORED T O "EFFECTIVE" DESIGN ACCELERAT ION, A p ^
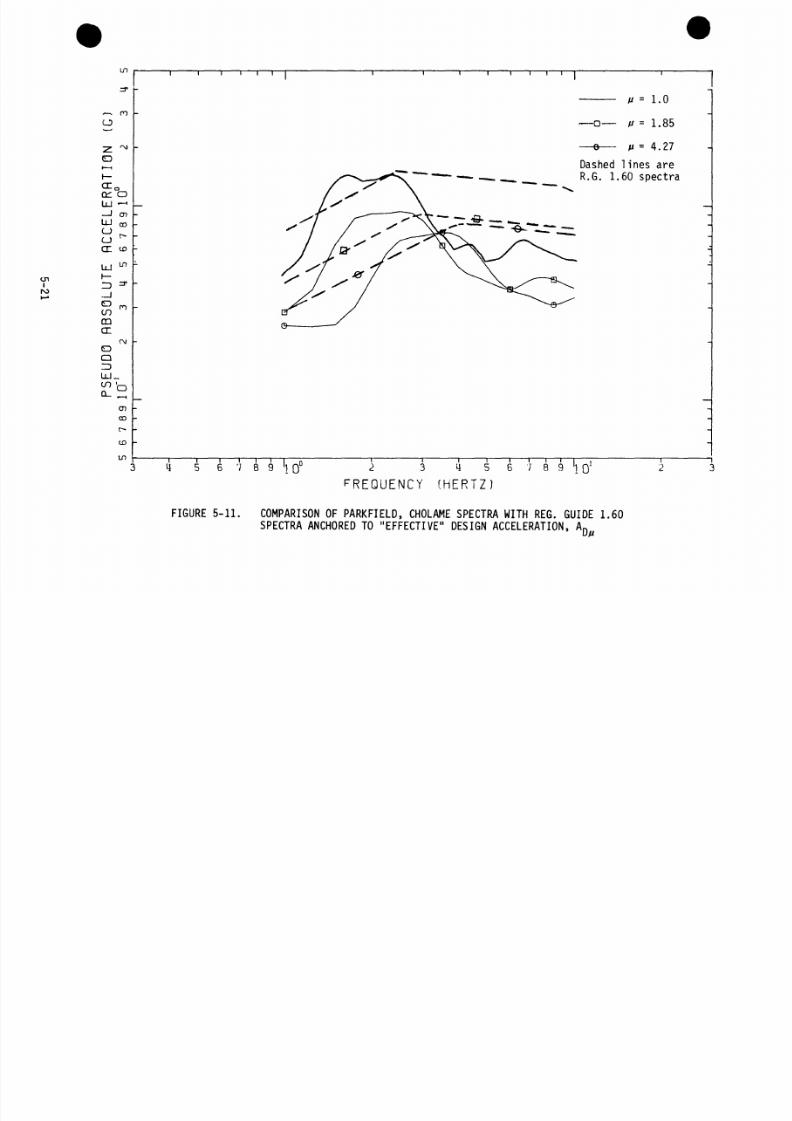
8/22/2019 6848574
http://slidepdf.com/reader/full/6848574 173/394
LD- | 1 1—r 1 — r
CJ
D
L U_ JL UCJCJ
cr
o'—'cn
00
O)
L U
OCDQQCC
OauL J U _
fO
CM
cnCL. oen
OD
-T 1 1 1 1 1 fT
5 6 7 8 9 1 0
fl = 1 .0
- o — ^ = 1.85
- 8 — ^ = 4.27
— j S - : : i . - - .
Dashed 1ines a r eR.G. 1.60 spectra
5- 1 1 1 — I — I r
6 7 8 9 1 0FREQUENCY (HERTZ)
FIGURE 5-11. COMPARISON O F PARKFIELD, CHOLAME SPECTRA WITH REG. GUIDE 1.60SPECTRA ANCHORED T O "EFFECTIVE" DESIGN ACCEL ERATION, A p

8/22/2019 6848574
http://slidepdf.com/reader/full/6848574 174/394
on 1—r -| 1—r
^ = 1.0
- Q — n = 1.85
- 9 — ^ = 4.27
Dashed lines areR.G. 1.60 spectra
5 2 3•T 1 — r
6 7 8 9 1 0
FREQUENCY (HERTZ)
7 8 9 1 0 2
FIGURE 5-12. COMPARISON O F GAVILAN COLLEGE SPECTRA WITH REG. GUIDE 1.60 SPECTRA
ANCHORED TO "EFFECTIVE" DESIGN ACCELERATION, A p ^

8/22/2019 6848574
http://slidepdf.com/reader/full/6848574 175/394
IroCO
O ^
I—I e n
in ^
LU
O ^
c r M
L U -
t - bI D ^—I OTO CO
COm to
CC ^
O
CO
Q_ ,
O
CD -
U3
1 — r
U = 1 .0
-G // = 1.85
^ — H = 4 . 2 7
Dashed lines a r eR.G. 1.60 spectra
T5 7 8 9 'l 0 4 5
1 -
6 -r -9 '10'
FREQUENCY (HERTZ)
FIGURE 5-1 3. COMPARISON O F MELENDY RANCH SPECTRA WIT H REG. GUIDE 1.60SPECTRA ANCHORED T O "EFFECTIVE" DESIGN ACCELERATION, A n

8/22/2019 6848574
http://slidepdf.com/reader/full/6848574 176/394
6. MEASURE OF RELATIVE STRENGTH OF GROUND MOTION RECORDS
6.1 APPROACH
One method to define the relative strength of a ground motion
record is in terms of the resulting maximum structural r espo nse. Within
this s tudy, the maximum structural res ponse is defined in terms of
ductil ity levels reach ed. The study has considere d shear wall resistance
function structures with elastic behavior (y = 1. 0) , nearly elastic
behavior (y = 1 . 8 5 ) , and a conservative lower bound on the onset of
significant structural strength degradation (y = 4 . 2 7 ) . The relative
strength of a ground motion record can then be defined by the inelastic
spectral acceleration, S^^^^^gj, corresponding to an appropriate
ducti lity level, y, for a structure with an elastic freque ncy, f, and
elastic damping, 6.
Figures 6-la through 6-ld present the relative strengths of each
of the 12 records studied as defined by S^^/^ ^j for ductilities of 1.0,
1.85, and 4.27 for 1 % damping and elastic frequencies of 8.54, 5.34, 3.20,
and 2.14 Hz, resp ectiv ely. These frequen cies are considered representa
tive of the frequenc y range from 1.8 to 10 Hz which is typical for stiff,
nuclear power plant structures.
Several ground motion relative strength zones are defined on
Figures 6-la through 6-ld. These zones are defined in terms of the zero
period ground acceleration (ZPA) for which a plant must be designed to
remain elastic using the R.G. 1.60 spectrum in order to prevent the
ductility level from exceeding 4.27 (conservative lower bound for onset
of significant strength deg rada tion ) when subjected to the actual r ecord.
For y = 4.27 these zo nes are defined by:
6-1

8/22/2019 6848574
http://slidepdf.com/reader/full/6848574 177/394
Zone
Very Severe
Severe
Moderate
Low
Requi red Elastic Design ZPA Range (g)
> 0 . 3
0.2 - 0.3
0.1 - 0.2
< 0 . 1
In other word s, if the plant must be designed to remain elastic for a R.G .
1.60 spec trum anchored at a ZPA greater than 0.3g in order to prevent the
ductility from exceeding 4.27 for the actual record, this record is
considered to be very severe . Similarl y, if the elastic design ZPA must
be between 0.2 and 0.3g to prevent the ductility from exceeding 4.27 for
the actual record, the record is considered to be sev ere . For y = 1.0
and y = 1.85 these zones are defined in terms of a mul tip le of th e
spectral acceleration at y = 4.27. The following multiples are used:
^^1 .0 = 1-9 Sa4.27 f > 4 Hz
S a ^ Q = 2.7 Sa4 27 f < 4 Hz
^^1.85 = 1-^ Sa4.27 f > 4 Hz
^^1.85 = 1-7 Sa4.27 f < 4 Hz
These intercepts were selected so as to enable these lesser ductility
spectral accelerations to be a reasonable prediction of the severity of
the ground motion at y = 4.27.
As an example , at a frequency of 8.54 Hz, the Reg . Guide 1.60
spectral amplification factor is 2.29. Ther efor e, the intercept between
the ve ry severe and the severe zones for y = 4.27 at f = 8.54 Hz is 2.29
times 0.30g = 0.69g. The other interc epts fo r y = 4.27 and f = 8.54 Hz
are at 0.46g and 0.23g. Thes e zone interce pts for y = 4.27 are drawn on
6-2

8/22/2019 6848574
http://slidepdf.com/reader/full/6848574 178/394
Figure 6-la (f = 8.54 H z ) . The int ercepts for y = 1.0 and y = 1.85 are
then at 1.9 and 1.4 tim es , respe ctive ly, the correspon ding intercept at
y = 4.27. Thu s, the intercept between the very severe and severe zones
is at 1.31g and 0.97g for y = 1.0 and 1.85, respectively, on Figure
6-la. A similar approach was used to define these intercepts on the
figures for other frequencies.
6.2 RELATIVE STREN GTHS OF GROUN D MOTION RECORDS STUDIE D
The Pacoima Dam record represents a wer y severe ground motion by
this definition for structures with elastic frequencies greater than about
4 Hz . This record represents sever e ground motio n for structures with
natural f requencies of about 2.5 to 4 Hz and only moderate ground motion
for structures with natural frequ encies less than about 2.5 Hz. The
elastic spectral acceleration (y = 1.0) properly describes the relative
severity of this record for structures with natural freque ncies greater
than about 2.5 Hz but overstates the relative severity of the record for
structures with natural f reque ncies less than 2.5 Hz .
The elastic spectral accelera tions (y = 1.0) would lead one to
believe that the Melendy Ranch and El Centro #5 records would be severe
to very severe records for structures with natural frequencies from about4 to 10 Hz . Howev er, the severit y of these records based upon the onset
of significant strength degradation is seriously overstated by the elastic
spectral accelerat ion. Based upon significant strength degrad ation , both
records are barely severe records for structures with elastic frequencies
of about 8.5 Hz . El Centro # 5 is only a mode rate record for structures
with natural frequencies from about 2.2 to 8.0 Hz and is a low severity
record for structures with frequencies below 2.2 Hz despite its high
elast ic spectral accel erati on. The severity of Melendy Ranch drops off
even more rapidly as the structure frequencies are reduced. Melendy Ranch
is a moder atel y severe record for structures with natural frequenc ies of
5 to 8 Hz and has low severity for structures with natural frequencies
less than 5 Hz despite its very high elastic spectral acceleration at
frequencies above 4 Hz.
6-3

8/22/2019 6848574
http://slidepdf.com/reader/full/6848574 179/394
The Parkfield record shows elastic spectral accelerations
(y = 1.0) of 0.5 to 0.6g for frequ enci es above about 5 Hz . Thes e
elastic spectral accelerations increase to about 0.8g at a frequency of
3.2 Hz and in crease to 1.4g at 2.1 Hz . Th us , based upon the elastic
spectral acceleration, one would judge the Parkfield record to be of
moderate severity for structures with natural frequenci es above about 2.5
Hz increasing to a severe record for structures with natural frequenc ies
less than about 2.5 Hz. The elastic spectral ac celera tions appear to
underestimate the relativ e severity of the Parkfield record for structures
in the 2.5 to 3.5 Hz ran ge. Based upon the onset of significant streng th
degradat ion, the Parkfield record represents a severe ground motion for
structures with natural frequencies of 1.8 to 3.5 Hz.
El Cent ro No. 12, Taft, and Gavilan College represent low
severity ground motions throughout the frequency range from 1.8 to 10 Hz
whethe r defined by the elastic spectral accele ration or by the onset of
significant strength degrad ation. Howev er, Gavilan College is of partic
ularly low severity for ductilities associated with the onset of signifi
cant strength d egradati on (y = 4.27) and this parti cula rly low severi ty
is not fully indicated by the elastic (y = 1.0) spectral acc eler ati ons .
Because of its high frequency content. Coyote Lake is of moderate
severity for frequencies above about 7.5 Hz. For frequencies between 4.5
and 7.5 Hz , the elas tic (y = 1.0) spectral accel erati ons would indicate
moderat e severity for Coyote Lake. Howeve r, because of its short
duration , this record has a narrow frequency content and is missing the
lower frequency content . Thu s, based on the onset of significant strength
degradation, this record has low severity for structures v/ith elastic
freq uenc ies less than 7.5 Hz despite the high elastic spectral accel era
tions down to 4.5 Hz.
Based on the onset of significant strength degradation, Goleta
represents a mode rate severity ground motio n for structures througho ut
the frequency range from 1.8 to 10 Hz because of its low frequency content
(similar to Parkfield in this regar d) and moderatel y high ground accelera
t i o n .
6-4

8/22/2019 6848574
http://slidepdf.com/reader/full/6848574 180/394
For structures with elastic frequencies between about 1.8 and
3.5 Hz, only Pacoima Dam, Parkfiel d, El Centro # 5, and Goleta represent
moderate or severe ground motions based upon the onset of significant
strength d egra dati on. Pacoi ma Dam and El Centro #5 are in this category
because of their broad frequ enc y content (at least 0.8 to 6.7 H z ) , longer,
strong durations (greater than 3.0 s e c o n d s ) , and high ground accelerations
(greater than 0 . 5 g ) . Goleta and Parkfield are in this category despi te
their shorter durations (3.0 seconds or less) because of their predomi
nately low frequency content (essentially no frequencies above 3.0 Hz)
and yet moderately high ground acceleration (at least 0 . 3 5 g ) . To obtain
this high a ground acceler ation without fre quen cy content abov e 3.0 Hz
requir es substantial velo city content in the 1.8 to 3.5 Hz rang e.
In summary, from this study only Pacoima Dam is clearly capable
of causing very severe structural damage (possibly collapse) for struc
tures with natural fr eque nces greater than 4 Hz that have been designed
to remain elastic for the R.G. 1.60 spectrum anchored to 0.2g. This
damage ca pabili ty is due to the high acceler ation ( 1 . 1 7 g ) , longer strong
duration (6.1 s e c o n d s ) , and broad freq uency content (0.75 to 6.7 Hz)
associated with this record. Even so, this record would be expected to
resu lt in only severe damage (ductiliti es sli ghtly greater than 4.3 and
some significant strength degr adati on) for structures with frequencies
between 1.8 and 2.5 Hz when these str ucture s are designed to remain
elastic for a 0.2g R.G. 1.60 spectrum.
In addition, Parkfield might result in severe damage (ductilities
slightl y greater than 4.3 but no colla pse ) for such structures with elas
tic frequencies from 2.0 to 4.0 Hz because of its low frequency content
(approximately 1.0 to 3.0 Hz) and high acceleration ( 0 . 5 g ) . Similarly,
El Centro #5 and Melendy Ranch might result in severe damage to similarly
designed structures with frequency content above 7.5 Hz because of their
high ground acc elerat ion (0.5 g) and higher freque ncy content (up to at
least 7 Hz ) . None of the other records are capable of resulting in more
than moderat e damag e (ductil ities less than 4.3) for a 0.2g R. G. 1.60
designed structure.
6-5

8/22/2019 6848574
http://slidepdf.com/reader/full/6848574 181/394
Basically , this study indicates that 0.5g short duration records
such as Parkfield and Melendy Ranch are capable of causing severe damage
(short of collapse) to 0.2g designed struct ures within a narrow fre quency
range from about 1.8 f ^ to 1.3 fy where fg is the freque ncy at which
the spectral accele ration peaks and f^ is the frequenc y at which the
spectral velocity peaks (see Table 2-5 for these freque ncie s). Outside
this narrow frequency range which lies on the stiff side of the peak
elastic spectral r espo nses , these short duration records should not result
in severe damage despite th eir ground accelerations being 2.5 times the
elastic design acceleration.
Even the above may overestimate the damage capability of these
high acceleration ground motio ns. This phase of this study has not
considered the reduced structural responses which might result from
soil-structure intera ction, wave passage effects and wave scattering
effe cts. Secondly, in this study, damage is defined in terms of the
maximum duct ility factor rather than total hysteret ic energy ab sorpti on.
The ductility descriptor of damage results in less benefit of short
duration than would a hysteretic energy descriptor of damag e. Third ly,
only single-degree- of-freedom structural resp onse is considered in the
measures of relative strength presented herein which tends to overestimatethe damage capability of narrow frequency content rec ords as compared to
broad frequency content records capable of exciting multiple frequen cies
simultaneously in multi-degree-of-freedom structures. Lastly, potential
overcapaci ty of the structure has been ignored. Genera lly, a structure
has greater capacity than indicated by the minimum design re quir emen ts.
6.3 RELA TIVE STRENGTH SUMMARY
If a structure of elastic fre quency , f, and elastic damping, e,
is designed to be at the onset of yield ing fo r spectral accele ration
S^ (f.3) which is the inelastic spectral acceleration for any grounday
motion considered, then the structure will respond to ductility level, y,
when subjected to that ground motion record . Thu s, comparing S^ (f,3)ay
for the various ground motion records considered in this study provides a
6-6

8/22/2019 6848574
http://slidepdf.com/reader/full/6848574 182/394
measure of the relative strength of the records . A ground motion record
with a large S^ (f,6) requi res the struct ure to be designed at a largeay
yield level to limit respo nse to a given duct ility and is more s evere
than a record with a small S^ (f,6) which req uires the structure to be
designed at a small yield level to limit resp onse to the same duct ility
l e v e l . In this chap ter, the inelastic spectral acceleration values are
compared for the 12 ground motio n re cords co nsidere d in this study at 3
duc tili ty level s (y = 1.0, 1.85 and 4. 27) at 4 freq uenc ies (f = 8.54,
5.34, 3.20 and 2.14 Hz and one damping value (6 = 7 p e r c e n t ) ) .
Relative strength zones (i.e., very severe, sev ere, moderate and
low strengths) are defined in terms of the acceleration level for which a
structure must be designed to remain elastic using the Reg. Guide 1.60
spectrum in order to prevent seismic response exceeding ductility levels
of 4.27 when subjected to the actual earthquake ground moti on. Similar
relative strength zones for y = 1.85 and 1.0 are obtained by scaling the
zone levels for y = 4.27 . The inelastic spectral accelera tions and
relati ve strength zones are presente d in Figu res 6-la through 6-ld for
the 4 frequencies consider ed.
Based upon the data presented in Figur es 6-la through 6-ld, itis concluded that only the Pacoima Dam record is a very severe ground
motion in terms of potential damage for structures with frequencies
greater than 4 Hz. At below 4 Hz, this record is a severe ground motion
at about 3 Hz and a moder ate ground motion at about 2 Hz. At 8.5 Hz , the
Mele ndy Ranch and El Centro #5 records are in the severe categor y. At
below 4 Hz, the Parkfield record is within the severe category. All
other ground motion records fall in the low or mod era te categories at all
freq uenc ies. Note that reasons are outlined in this chapter as to why
the damage capability of high accelera tion, short duration earthquakes
such as Mele ndy Ranch and Parkf ield ma y be oversta ted by the metho ds used
to assess relative strengths of the ground mot ion .
6-7

8/22/2019 6848574
http://slidepdf.com/reader/full/6848574 183/394
PD
EC S
MR
1.59* PD _- 1.27*
1.11
0.95
EC 5
MR
0.70
0.65
0.47
1.0 1.85
PD
MR
EC 5
PA 2
0 . 9 4*
0.50
0.47
0.37
y 4.27
s-
>
> >s-a>
s-
>
0)
LEGEND
A
CL
ECS
EC12
G
GC
HS
MR
0
PAZ
PD
T
Artificial (0.2g)
Coyote Lake
El Centro #5
El Centro #12
Goleta
Gavilan College
Hollywood Storage
Melendy Ranch
Olympia
Parkfield
Pacoima Dam
Taft
•Values shown are inelastic
spectral acceleration S.
for y = 1.0, 1.85, and '
4.27
ay
FIGURE 6-la.f= 8.54 Hz
MEASURE OF RELATIVE STRENGTH OF GROUND MOTION RECORDS A S DEFINED BY Sau(f,7%)
#

8/22/2019 6848574
http://slidepdf.com/reader/full/6848574 184/394
y = 1.0 y = 1 . 8 5 y = 4.27
PD _
MR -
EC5 -
CLHS
G -
PA2 -
A
0
E C 1 2 _T -
GC
_ 1 . 6 7 *
- 1 . 4 9
- 1 . 1 4
_ 0 . 6 6- 0 . 6 3
- 0 . 5 8
- 0 . 5 3
_ 0 . 4 8
- 0 . 4 4
- 0 . 3 3- 0 . 3 2
- 0 . 2 0
PD _
MR
EC5 _
PA2 -
0| S
CL
T
E C 1 2 -
GC
- 1 . 2 2 *
- 0 . 7 6
- 0 . 7 1
- 0 . 4 4
E8:|§0 . 3 4 ^
- 0 . 2 6
f - 0 . 2 1
r o . i 3
PD
EC 5PA 2
0
§R
' HS
T
CL
E C 1 2
GC
4
- 0 . 9 1 *
V
V
>)
^1)
i1
c
1)
>
o
- 0 . 4 3- 0 . 4 2
a>fO
s-
_ 0 . 2 9 :m£
._
. 2 5 1- 0 . 2 0
_ 0 . 1 7
- 0 . 1 4
5
_ 0 . 0 7 - 3
LEGEND
A
CL
ECS
EC12
GGC
HS
MR
0
PA2:
PD:
T:
A r t i f i c i a l ( 0 . 2 g )
: Coyote Lake
El Centro #S
El Centro #12
Goleta
Gavi lan College
Hollywood Storage
Melendy Ranch
Olympia
P a r k f i e l d
Pacoima Dam
Taf t
*Values shown a r e inelastic
spectral accelerations Sfor y = 1.0, 1.85 and
4.27
ay
FIGURE 6-lb.f = S.34 Hz
M E A S U R E O F RELATIVE STRENGTH O F GROUND MOTION RECORDS A S DEFINED BY Sa y ( f , 7 % )

8/22/2019 6848574
http://slidepdf.com/reader/full/6848574 185/394
PD - - 1.61*
ECS
P A2
G
O
H ST
E C12 --0.27
G C
0.88
0.81
0.64
.0.60
.0.55
•M i0.43•0.38
.0.12
PD
E C SP A 2
O
A
H S
5L Z ILEC12.M R •
G C
1.28*
,0.660.66
•0.46
•0.400.35
0.27'0.25.0.23•0.21"0.20
.0.07
y = 4 . 2 7
LEGEND
A:
CL:
ECS:
EC12:
G:
GC:
HS:
MR:
0:
P A 2:
PD:
T:
Artificial (0.2g)
Coyote Lake
El Centro # 5El Centro # 12
Goleta
Gavilan College
Hollywood Storage
Melendy Ranch
Olympia
Parkfield
Pacoima Dam
Taft
*Values shown a r e inelastic
spectral accelerations Sfor y = 1.0, 1.85 and "^4.27
y = 1.0 p = 1.8S
f = 3.20 Hz
FIGURE 6 -lc. MEASURE O F RELATIVE STRENGTH O F GROUND MOTION RECORDS A S DEFINED BY Sa y ( f , 7 % )

8/22/2019 6848574
http://slidepdf.com/reader/full/6848574 186/394
7. CONCLUSIONS
Many conclusions are reached in the individual sections as data
are presen ted. Only the more significant con clusio ns will be summarized
h e r e .
7.1 ENGINEERING CHARAC TERIZAT ION OF GROU ND MOTION
The 11 real e arthq uake ground motion time histories studied
(listed in Table 2-1) can be divided into two groups . Group 1 consists
of the 6 longer duration records (Taft, Olympia, El Centro # 12 , El Centro
# 5 , Pacoima Dam, and Hollywood Storage ) while Group 2 consists of the 5shorter duration reco rds (Coyote Lake, Parkfield Cholame #2 , Gavilan
College, Goleta, and Melendy R a n c h ) . Both elastic and inelastic struc
tural response of stiff struct ures (1.8 to 10 Hz) subjected to the Group
1 recor ds can be adequate ly approxi mated by the use of the Reg. Guide
1.60 spectrum anchored to an "ef fect ive" peak accel erati on. In fac t, it
is shown in Section 2.3 that for elastic r espon se between 1.8 and 10 Hz ,
the maximu m ratio of actual spectral acceleration to Reg. Guide 1.60
spectral acceleration (SA^/SA^ gg) ranges from 1.29 to 1.05 with a
median maximum ratio of 1.20 for the six records studied. In other
wor ds, the Reg. Guide 1.60 spectrum anchored to an "effe ctive" peak
acceleration never introduces more than a factor of 1.29 unconservatism.
The median ratio ranges from 1.05 to 0.83 with a median median of 0.88,
or a factor of (1/0.88) =1 . 1 4 conservatism. The minimum ratio ranges
from 0.76 to 0.49 with a median minimum of 0.59. Thu s, the Reg. Guide
1.60 spectrum anchored to an "effective" peak acceleration never intro
duces more than a factor of (1 /0.49) = 2.04 conservat ism for these six
rec ords . Section 5.3 shows similar results for inelastic response out to
ductility ratio of 4.3 (the highest ratio s t u d i e d ) . The maximum factor
of unconservatism never exceeded 1.32 for ductilities from 1.0 to 4.3 and
elasti c frequencies from 1.8 to 10 Hz . Withi n this same rang e, the factor
of conservatism never excee ded 2.04 and the med ian fact or of conservatism
7-1

8/22/2019 6848574
http://slidepdf.com/reader/full/6848574 187/394
ranged from 1.14 for elastic r esponse (y = 1.0) to 1.01 for inelastic
response (y = 1.8 to 4. 3 ) . Considering the uncertainti es in the ground
motion , this performance is excellent.
In other words, an adequate engineering characterization for both
elastic and inelastic structural response for stiff structures (1.8 to 10
Hz ) subjected to any of the 6 longer du ration (Group 1) records is
provided by the Re g. Guide 1.60 spectrum anchored to an "eff ectiv e" peak
acce lera tion . It is shown in both Section 2.3 (elastic resp onse ) and 5.3
(inelastic respo nse) that this "effect ive" peak accelerati on, Apci, can
be defined as an rms-ba sed acceleratio n given by Equation 2 -15. It can
be seen from Equation 2-15 that the "effective" acceleration increases
with increasing strong motion duration, T Q , and increasing mean (central)
frequency, n'. In addition, the rms acceleration, a^.^^, used to define
'^DEl ^^ heavily influenced by the method used to define the strong
motion duratio n, Tp (see Section 1.1.1 for a further di sc us si o n ) .
T h u s , to establish an "effective" a ccelera tion, one must define a method
to quantify Tp and one must define a central f req uen cy, Q'. The
central fre quen cies computed for each of the 11 real records and for an
artificial R eg. Guide 1.60 time history are given in Table 2-6. The
central freq uency for the six Group 1 (longer d uratio n) records plus theartificial record ranges from 3.6 to 4.7 Hz. For all of these reco rds,
this central fre quency can be approximated as 4.0 Hz without introducing
more than a 6% error in the computed "effect ive" peak accelerat ion.
Section 2.1 recommends that the strong motion duration, Tp,
for stiff structures be computed from Equations 2-2 and 2-3 using cumula
tive energy plots (Figure 2- 3) . It is shown that this duration corres
ponds to the time of steepest slope ( i.e., greates t power and greates tRMS acceler ation) from these energy plo ts. It is also shown that Tp
correla tes well with the longest time to reach maxi mum structural respo nse
(both for elastic and inelastic resp onse) for stiff structures (1.8 to 10
H z ) . The strong motion durati ons, Tp, given by Equations 2-2 and 2-3
7-2

8/22/2019 6848574
http://slidepdf.com/reader/full/6848574 188/394
are tabulated in Table 2-3 for the 11 real and one artificial record
studi ed. It should be noted that Equati ons 2-2 and 2-3 often lead to
much shorter estimates of strong duration than do other commonly used
metho ds. However , it is recommended that the short durations given by
Equation s 2-2 and 2-3 correlate better with the longest time of maximu m
respons e for stiff structures and with the duration of maximum rms accel
erat ion . The strong duration for the six Group 1 records range from 15.6
seconds (Olympia) to 3.4 seconds (El Centro #5 ) . The strong duration for
the five Group 2 records range from 3.0 seconds (Goleta) to 0.8 seconds
(Melendy R a n c h ) . Increasing str ong duration from 3.4 seconds to 15.6
seconds increases th e "effec tive " peak acceler ation by a factor of 1.50
given identical rms acceleration s. Ther efor e, strong duration has a
moderately significant influence on the "effective" peak acceleration and
must be reasonably app roximated.
The previous concl usion that the Re g. Guide 1.60 spectrum
anchored to an "effective" acceleration provides an adequate characteriza
tion of both elastic and inelastic structural response for stiff struc
tures (1.8 to 10 Hz ) is not applicable to the five Group 2 records.
Neither ela stic nor inelastic r espon se from any of these five records can
be adequately approx imated by th e Reg. Guide 1.60 spectrum or by any
other broad frequency content spectrum. T h u s , one must define the
distinguishing differences between the Group 1 and Group 2 record s. The
most obvious differences are :
1. Strong dur ati on, Tp . All the Group 1 recor ds have strongdurations of 3.4 seconds and greater while all the Group 2records have durations of 3.0 seconds and less.
2. Local magnit ude. M L . All the Group 1 records are from
earthquake s with local magnitud es of 6.4 and greater whileall the Group 2 reco rds are from eart hquakes w ith local
magnitudes of 5.7 and less.
However, these differences do not appear to be the primary
reason why the Reg. Guide 1.60 spectrum is inadequate for predicting the
response of stiff structures. The primary reason is related to differ-
7-3

8/22/2019 6848574
http://slidepdf.com/reader/full/6848574 189/394
ences in the breadth of the range of freque ncy co ntent. This breadth of
the range of freq uenc y content can be defined by the frequency ran ge from
f^O to fgo where 10% of the cumulative power lies at frequencies below
f]^0 and 90 % of the cumula tive power lies at freq uenc ies below fg Q.
T h u s , the frequency range from f^Q to fgo contains the central 80 % of
the cumulative power of the strong motion portion (Tp duratio n) of the
rec ord . Table 2-6 defin es the frequenc y range from f^^Q to fgo for
the 11 real records and one artificial record studied. The six Group 1
records for which the Reg. Guide 1.60 spectrum provides an adequate
engineering charact erization from 1.8 to 10 Hz all have frequency bands
(f]^0 t° fgo) ^^^'"^ ^* least 1.2 to 5.5 Hz . None of the five Group 2
records for which the Reg. Guide 1.60 spectrimi does not provide an
adequate engineering characterization cover the entire frequency band
from 1.2 to 5.5 Hz . Coyote Lake , Gavilan Co lleg e, and Melendy Ranch are
missing frequency content below about 3 Hz . Goleta and Par kfield-Ch olame
#2 are missing fr equency content above about 3 Hz . This missing frequency
content and resultant narrow-banded response spectra has a strong in
fluence on both elastic and inelastic structural response even for these
stiff structures.
The conclu sion is that the Reg . Guide 1.60 spectrum or other
broad frequency content spectra anchored to an "effective" acceleration
should only be used even for stiff str ucture s (1.8 to 10 Hz) to char ac
terize ground motion records which contain significant power between at
least 1.2 to 5.5 Hz as defined by the range from f^Q to fgn . Recor ds
which do not contain significant power throughout this frequency range
should be characterized by narrower frequency design spectra .
The standard practi ce of averaging a number of real recor ds
together irrespective of their relative frequency content to produce a
design spectrum will always lead to a broad freq uenc y content de sign
spectr um even when all the individual reco rds are narrow bande d. For
instance , averaging the five Group 2 spectra will lead to an average
spectrum which contains frequency content from at least 1.3 to 7 Hz .
7-4

8/22/2019 6848574
http://slidepdf.com/reader/full/6848574 190/394
Such a spectrum will be narrower than the Re g. Guide 1.60 spectrum which
contains f requen cy content from 0.6 to 6.4 H z , but for stiff structures
(1.8 to 10 Hz) the differences will be mino^-. These differen ces wou ld
only be significant for structures with freq uenci es less than 1.8 Hz .T h u s , a design spectr um obtained by averaging the five Group 2 spectra
would not provide an adequate engineering characterization for either
elastic or inelastic response of stiff structu res subjected to any one of
these five record s. The only adequate way to characterize these records
is by a narrow-banded design spectrum obtained by averaging records with
similar central freq uen cie s, ^', and frequency bands, fng to fgn . For
inst ance , Parkfield Cholame #2 and Goleta can be averaged to obtain a
narrow-banded, low-frequency spectrum representative of either record.
Possibly , Melendy R anch , Gavilan Coll ege, and Coyote Lake could be
averaged to obtain a representative high frequency spectrum. Uncertain
ties in central f requ ency, i', hould be covered by shifting the central
frequenc y of a narrow-banded design spectrum throughou t the range of
uncertainty and not by the use of a broad freque ncy content design
spectrum for stiff structures subjected to Group 2 type record s.
A strong correlatio n appears to exist between local magnit ude
and strong dura tion, Tp , for records with instrumental acceleratio ns, a,
of 0.14g and gre ate r. Reco rds with M _ of 5.7 and less and values of a
of O . H g a n d greater all had Tp of 3.0 seconds and less. Conversel y,
the rec ords with M|_ of 6.4 and greater all had Tp greater than 3.0
secon ds. It appears that earthquakes with M, less than about 6.0 ma y
not have sufficient energy content to be capable of producing both high
accelerations (greater than 0.14g) and longer dur ation s (Tp > 3.0
seconds). Sec ond ly, a strong correlation exists between Tp and the
breadth of the frequency band of significant power . None of the records
with Tp < 3.0 seconds had significant power throu ghout the freque ncy
range from 1.2 to 5.5 Hz whil e all of the recor ds with Tp > 3.0 seconds
contained power throughout this frequency ra nge. A tentative conclusion
woul d be that the design respo nse spect rum for ear thqu akes with M|_ < 6.0
and ground ac celerations of 0.14g and greater should be a narrow-banded
7-5

8/22/2019 6848574
http://slidepdf.com/reader/full/6848574 191/394
spectrum obtained by averaging only records with similar central
fr eq ue nci es , f^', and similar freq uenc y ban ds, f^^Q to fgn. This
conclusion would have wide ranging effects since the SSE design earth
quake for nuclear plants east of the Rocky Mountains would generally
correspond to these condit ions . The conclusion is only tentative because
not enough records were stud ied.
7.2 PREDICTION OF INELASTIC SPECTRAL DEAMPLIFI CATION FACTORS AND
INELASTIC RESPONSE SPECTRA
A represent ative nonlinear lateral force-def ormation resistance
function for shear wall type structures was presented in Chapter 3. In
each an alys is, the yield cap acity of this model was set equal to the
capacity associated with the elastic spectral acceleration at the
structur e's elastic natural frequency for each earthq uake record. Th us ,
the structure was at the onset of yielding (ductility, y, of unity) when
subjected to the ground motion record. Next, a series of nonlinear time
history analyses were performed in which the record time history had
ampli tudes scaled up by an input scale fac tor , F. For a given F, the
maximum resultant ductili ty, y, was determined. By this me an s, the input
scale fact ors , F, corresponding to a low ductil ity (v. = 1.85) and a
high ductility (y^ = 4.27) were de termine d. Table 4-1 presents these
input scale factors for the 12 records studied at four natural
frequenci es between 1.8 and 10 Hz . The low ductility is intended to
correspond to minor i nelastic behavior while the high ductili ty
corresp onds to a conservative estimate of the onset of significant
strength degradation.
It should be noted that these input scale factors, F, are equal
to the inelastic spectral deamplificatio n factor by which the elastic
spectral acceler ation must be divided to obtain an inelast ic spectral
accele ratio n. If the structure were designed to have a yield capacit y
corresponding to this inelastic spectral acceleration at the elastic
natural freque ncy, then the structure would undergo a ductilit y, y, when
subjected to the actual recorded time history. As illustrated in Figure
7-6

8/22/2019 6848574
http://slidepdf.com/reader/full/6848574 192/394
3-4, a shear wall elastically designed to ACI -349 code ultimate capac
ities for static lateral loads is permitted some inelastic deformation.
Input scale factors or inelastic spectral deampli fication factors are
based on the yield capacity which is less than the code ultimate cap acity .
It was found that these input scal e factors (inelastic spectral
deamplification fact ors ) were not constant for a given ductility factor , v.
The F factors w ere hea vily influenced by the ratio of spectral accele ra
tions on the soft (lower freque ncy) side of the elastic frequency to the
spectral accelerations at the elastic frequenc y. When the spectral accel
erations on the lower frequ ency side were much less than the spectral
acceleration at the elastic frequ ency, F was high . Conversel y, when these
lower frequency spectral accelerations were much higher than the elastic
frequency spectral acceler ations , F was low. This effect can be con
sidered to be either a spectral averaging ef fect or can be considered to
be an effective frequency shift to lower frequ encie s. For simplicity, it
will be called a spectral averagin g effe ct. This effect is discussed in
more detail in Sectio n 4.1.3.
This spectral averaging effe ct was by far the most substantial
factor influencing the computed F fact ors. For the broad frequency
content Group 1 reco rds {Jj^ > 3.0 seconds), the F factors were fairly
uniform and showed a gradual increase as frequ encie s were reduc ed. On
the other hand , the F factors for the narrow frequency Group 2 records
( T Q < 3.0 se cond s) were far from uniform. T h u s , for the short duration
records, th e F factor could be either very large or could be low depending
upon where the structure's elastic frequency lay relative to the frequency
of maximum spectral acceleration. Except within a narrow frequency band,
the F factors fo r thes e short duration records are greater than for the
longer duration recor ds. Howe ver, within this narrow frequency ban d, the
F factors for the short duration records are about equal to or may be
slightly less than those for the longer duration records . Figure 4-1
shows this increase in scatter for F as TA is reduced.
7-7

8/22/2019 6848574
http://slidepdf.com/reader/full/6848574 193/394
In addition to the spectral averaging ef fec t, a smaller duration
effect was also noted. The predomi nant duration effect is accounted for
by the spectral av eragi ng. The lesser duration effect is related to the
number of strong nonlinear response c ycl es. It is clear that the number
of strong nonlinear response cycles inceases with duration and ranges
from 1 for Melendy Ranch (Tp =0 . 8 seconds ) to 4 for Olympia (Tp =
15.6 s e c o n d s ) . Other than for Olympia and Melendy Ran ch, the records
generally showed 2 or 3 strong nonlinear response cycles . In every case,
the total number of strong nonlinear response cycles was low (4 or l e s s ) .
On the aver age, the duration effect on the F factors was small once the
spectral averaging effect was accounted for.
One effect of increasing the number of strong nonlinear response
cycles from 1 to 4 was to reduce the effective structural natural fre
quency toward the secant frequenc y and away from the elastic fr eque ncy.
With one strong nonlinear cycl e, the effective frequency lay about midway
between the secant and the elastic frequenc ies. With more nonlinear
response cyc les, the effective frequency more closely approached the
secant fre quency. However, the effective frequency was never as low as
the secant frequen cy. A second effect was to reduce the effective damping
percentage with increasing numbers of nonlinear cycles for the shear wallresistance function s. The technical basis for this reduced damping is
described in Appendi x C. Both the freque ncy shift and effective damping
reduction we re most not iceabl e when increasing the number of strong
nonlinear cycles from 1 to 2. These effects were much smaller when
increasing the number of strong nonlinear cycles from 2 to 4 (see Table
4 - 3 ) . Thus , within about 1 0% accuracy on the predicted F fact or, one
could assume 3 strong nonlinear response cycles when evalua ting th e
effective frequency and effective damping except when Tp is less than
one second in which cas e, one should assume 1 strong nonl inear respo nse
cycle . There fore, other than for the spectral averaging e ffect, it is
really only necessary to estimate whether Tp is greater or less than
one second for predicting the inelastic spectral deamplification factor,
F^. The effect of Tp and the number of strong nonlinear resp onse
c y c l e s , N, on the F factor is shown for the Reg. Guide 1.60 spectrum in
Figures 5-1 and 5-2.
7-8

8/22/2019 6848574
http://slidepdf.com/reader/full/6848574 194/394
It was found that the inelastic structural response of singl e-
degree-of-freedom structural mod els , the inelastic spectral deamplifica-
tion factor (F ) , and the inelastic spectral acceleration (Sg^) could all
be accurate ly predicted from char acteri stics of the moderate ly damped (7
to 15% damp ing) elastic r esponse spectrum and an approximate knowledge of
Tp . Either of two meth ods could be used.
1. The nonlinear resistance function model can be replaced by
an equivalent linear resistance functio n with a lesser
effective frequency (lesser effective stiffness) and
increased effective damping than the elastic frequency
(elastic stiffnes s) and elastic damping. This equival ent
linear model is then used with the elastic respo nse
spectrum to compute maximum displacement response s,
2 . The elastic res ponse spectrum is reduced to obtain an
inelastic response spectrum for use with the elastic
frequ ency and damping in order to compute the yield
displac ement, *y , and required yield capaci ty, Vy, needed
to hold the structure to a duct ilit y, y. At a given
frequency and damping v alue , the inelastic spectral accel
eration is given b y:
S j f , 3 )
Say(f'^) = ^ (7-1)
y
whe re F^ is the predicted inelast ic spectral deamplificationfactor.
In the first method, and effective fre quency, f' and an
effective damping ratio , 3^, must be estimated. It is recommended that
Equations 3-8 and 4-2 be used together with coefficients fr om Table 4-2
to make these esti mate s. This effective frequenc y and effective damping
estimate can also be used together with the elastic r esponse spectra to
predict F by Equation 3-14 for use in the second meth od. This approach
for predictin g F is called a point estima te approach since it is based
upon a single point estimate of fg, and Bg. When this point esti
mate approach is used to predict F^, the first and second approxim ate
nonlinear analysis methods described above produce identical results.
The ref ore , further comparisons can be made based upon the accuracy with
which F is predicted compared to the time history computed F fac tor s.
7-9

8/22/2019 6848574
http://slidepdf.com/reader/full/6848574 195/394
It was found that the recommen ded point estimat e approa ch (based
on an estimat ed f^ and 3g) provided an excellent estim ate of F^^. The
ratio of predicted to time history computed scale facto rs (F /F) are shown
in Table 4-4 to have mean values of 0.98 and 1.02 and coefficients of
vari atio ns (COV) of only 0.12 and 0.09 for ducti lit y levels of u^ = 4.27
and \i^ = 1.85, resp ecti vely. At the worst ext reme s, the ratio F^/F
ranged from 0.75 to 1.29 for y^ and from 0.85 to 1.26 for \ .
Other methods also exist for predicting an effective fr equency
fg , and an effective damping rat io, 3g. Two common metho ds defined
as the Sozen method and the Iwan method are described in Section 3.3.1.
These methods were not developed for shear wall type resistance functions
but were used in this study for comparison with the recommended methodfor predicting an effective frequency and an effective dampin g. Table 4-3
compares the effectiv e freque ncies and effective damping percenta ges
predicted by the three me tho ds . One should note that the Sozen method
predicts lower effective frequen cies while the Iwan method predicts
higher effective frequencies than does the recommended method . In other
wo rd s, the Sozen method softens the structure more while the Iwan method
softens the structure less than the method recommended by this study .
Both the Sozen and the Iwan meth ods predict substa ntiall y higher effective
damping percentages than the method recommended by this study for shear
wall res istance func tio ns. The reasons for this difference are given in
Section 4.3. Tables 4-5 and 4-6 compare the predicted to computed scale
factor s (F /F) when the effective frequ encies and effective damping are
computed by the Sozen and Iwan met hod s, resp ecti vely . The Sozen method
introduces a slight conse rvative bias while the Iwan method introduces a
significant u nconservative bias for the mean ratios . Both methods result
in substan tially higher COV than the recommended meth od. The conclusion
is that the recommended proced ure p rovide s a better estim ate of the
effective frequency and effective damping for shear wall type structures
than does either the Sozen or Iwan methods.
7-10

8/22/2019 6848574
http://slidepdf.com/reader/full/6848574 196/394
It was judged that a spectral a veragi ng approach should provide
a better estimate of F than the best point estimate approach . Spectral
avera ging smooths out local peaks and valle ys in the response spectru m
and is expected to be more stable. The ref ore , a number of spectral
averaging approaches to estimate F were also investigated. A simple
approach given by Equations 4-3 through 4-7 together with Table 4-2 is
recomm ended. This approach averages the spectral accelerations between
f^j and the secant fre que nc y, f^, whe re f^ lies between the elas tic and
secant freque ncies as shown in Table 4-7. The ratios of predicted to
computed scale factors (F /F) as obtained by this spectral averaging
approach are shown in Table 4-8. One should note that the spectral
averaging approach provides only marginal improvement over the recom
mended point estimate approach (Table 4 - 4 ) . It is not clear that thismarginal improvement is worth the consid erable increase in computational
effort requir ed. Howe ver, if the elastic response spectrum contains
significant local peaks and valleys at about 10 % dampin g, the spectral
averaging approach would be expected to provide some improvement over the
point estimate approa ch. The data indicates that the spectral averaging
approach does reduce the maximum factor of unconserva tism (maximum ratio
of F / F ) . This maximum ratio of F /F is 1.29 for the point estimate
y y ^
approach and only 1.19 for the spectral avera ging approach at yj, = 4.2 7,
and is lowered from 1.26 to 1.14 for y. = I.35.
Other commonly used approache s for estimating F^ are the Newmark
method and the Riddell method described in Section 3.3.2. These method s
give similar results for F with the Riddell method being a slight
improvement over the Newmark method . Table 4-9 shows the predicted to
computed scale facto rs (F /F) when the Riddell method is used. One should
note that for the shear wall res istan ce fu ncti on model used in this stu dy,
the Riddell method introduces a slight factor of unconservatism on the
averag e. Furt hermo re, the COVs range from 14 0% to 200% larger than those
obtained for the spectral averaging approach recommended in this study
(Table 4 - 8 ) . For y^ = 4.27 , the extre me range of (F /F) ranges from
0.43 to 1.78 for the Riddell approach as compared to a range of 0.75 to
7-11

8/22/2019 6848574
http://slidepdf.com/reader/full/6848574 197/394
1.19 for the recom mende d spectral aver agin g me th od . At y|_ = 1.8 5, the
extr eme ra nge for the Riddell meth od is not as severe but still ranges
from 0.88 to 1.47 as compared to 0.85 to 1.14 for the recommended spectral
averaging method.
It is concluded that either the point es timat e approach or the
spectral averaging approach rec ommended in this study provide excell ent
predi ctions for F out to ducti liti es of at least 4.3. Either approach
provides significantly more accurate estimates for F^ than do other
commonly used approaches for shear wall type resistance fun ctio ns. It
should be noted that F fact ors presented in this report are not intended
to be specifically used for the design of fac ilit ies . These factors have
been evaluated on the basis of a limited number of ground motion records
and at a limited number of structural fr equenc ies and ductili ty lev els .
Instead, the purpose of this work is to present the methodol ogy by which
inelastic spectral deamplification factors may be developed such that
permissible levels of inelastic deformation may be incorporated into
designs using simplified elastic analytical tech nique s.
Although this study was predominantly concerned with shear wall
resistance fun ctio ns, other inelastic resistance fu nctions and the
influence of various parameter variations were also studied and the
results are summarized in Appendix D. The basic conclusion of these
parameter variation studies was that the approaches recommended in this
study can be conse rvat ively used for braced-f rames and other structural
or equipme nt systems so long as thes e systems do not have re sist ance -
deformation functions which show greater stiffness degradation and
pinching behavior than that used in this study for shear wal ls. The
authors do not know of any other structural system used in nuclear power
plants which would have more severe stiffness degradation or pinching
behavi or and so they genera lly believe that the recommended approaches
from this study could be cons erva tive ly applied to all structural and
equipm ent systems in a nuclear power plant. Some other conclusio ns of
these parametric studies are:
7-12

8/22/2019 6848574
http://slidepdf.com/reader/full/6848574 198/394
1. Equation 4-6 can be used to esti mate the average effective
damping equally well for an elastic damping of 3% as for an
elastic damping of 1%. The prediction procedure works
equally well at 3% elastic damping as at 7% elastic d amping.
2 . The frequency shift and hysteretic damping coefficie nt, Cpand Cfj, in Tabl e 4-2 were developed for a shear wall
resistance function mo de l. Use of these coefficients willintroduce only a slight conservatism for the Takeda mod el.
The shear wall model overes timates the stiffness degradationand pinching behavior for braced-frame and bilinear resistance function mod els . There fore, these coefficients over
emph asiz e the importance of N and T[) for such mo de ls .
The input scale factor (inelastic spectral deamplification
fac tor ) for the braced-fra me and bilinear resistance
function models studied in Appendix D lay midway between
the sc ale fac tors predicted using the Cp and Cfj given
in Tabl e 4-2 for the appropriate T Q and the scale factorpred icte d usin g Cp = 1.5 and Cfj = 0.30 wh ich are given
for N=l . Averagi ng the results obtained from the use of
these two d ifferent sets of Cp and C M values will
improve the prediction accuracy for braced-frame and
bilinear mod els when T Q is greater than 1.0 seconds and
thus will reduc e the conserv atism introduced by the
recommended approach for these mod els .
Figures 5-3 through 5-13 present the inelastic spectra predicted
with in the fre quen cy r ange fro m 1.0 to 10.0 Hz for the 11 real time
histor ies included in this study using the spectral averaging prediction
meth ods of Chapter 4 and duct ilit ies of 1.85 and 4.27 . Several points
should be noted from these figu res:
1. The peak inela stic spectral accelerat ions always occur at
frequencies higher than those at which the peak elasticspectral accelerations occur. This situation occurs
because inelastic response of these higher frequencystructures shifts the effective frequenc y downward into the
range of peak elastic respon se.
2 . The inelastic deamplification factors associated with
frequenc ies equal to or less than that at which the elastic
spectrum peaks are much greater than those for higher
frequencies.
7-13

8/22/2019 6848574
http://slidepdf.com/reader/full/6848574 199/394
These points are most dramatically illustrated by the Parkfield-
Cholame Array #2 spectra (Figure 5 - 1 1 ) . The elastic spectral amplifica
tions are very high from 1.2 to 3.0 Hz and drop off very rapidly at both
higher and lower fre que nci es. The largest inelasti c deamplification
factors are associated with elastic frequencies less than 3.0 Hz since
inelastic respon se will shift these frequenci es lower and marke dly reduce
resp ons e. Struc tures with frequ encie s of 3.0 Hz and less could be
designed to yield at spectral acce leration s much less than those indicated
by the elastic spectra for Parkfield without severe damag e. However , for
the Parkfield reco rd, one must be very careful not to reduce the elast ic
spectral accele ratio ns for structu res in about the 3.5 to 5.0 Hz ran ge.
These str uctures should be designed to remain elas tic for the Parkfield
record. Inelastic response of such structures will shift their effective
freque ncies into the frequency ran ge (1.2 to 3.0 Hz) with in which the
power of the input is predominantly conc entrated. For such struct ures,
inelastic responses would rapidly increase because of this frequency
shift. For records with narrow frequency co ntent , such as Parkfield, one
should be very careful about taking any credit for inelastic response for
structures whi ch lie slightly to the stiff side of the p redominant
freq uency range of the rec ord. On the other hand, for even stiffer
structures (elastic frequencies greater than 5.0 Hz) the inelastic
deamplification factors are again significant although not as large as
for structures with frequencies below 3.0 Hz .
This study is concerned with the inelastic response of
structural systems (braced frames and shear walls) and the concept of
"effective" spectral response is considered valid for such system s. The
results of this study can also probably be extrapo lated to ductile
passive equipment w hose fragil ity is governed by structural failure
m o d e s . Howeve r, the study is probably not appropriat e for activeequipment.
7-14

8/22/2019 6848574
http://slidepdf.com/reader/full/6848574 200/394
This study was conducted using single-degree-of-freedom (SDOF)
str uc tu ra l models. I t is bel ieved that the res ul ts should also be a p p l i
cable f o r m ul ti-d eg re e- of -fre ed om (MDOF) models. However, when used w ith
MDOF mo dels, one must keep in mind these re s u lt s are to be used w it h a
system d u c t i l i t y . In the case of loc al iz ed nonl inear behavior , the story
d r i f t d u c t i l i t y is o f ten about tw ice the system d u c t i l i t y and e lement
d u c t i l i t y w i l l exceed s to ry d r i f t d u c t i l i t y . Thus, i f one needs a
sp ec i f ic c on trol on ei th er element or s t o r y d r i f t duc t i l i t y , t he s y s t em
d u c t i l i t y must be he ld to lesser l im i t s . Th is top ic w i l l be d iscussed
fu rt h e r in a fo llo w -o n study which extends the SDOF re s u lt s to MDOF
models.
7.3 MEASURE OF RELATIVE STRENGTH OF GROUND MOTION RECORDS
I f a st ru ctu re of el a st ic f reque ncy, f , and el a st ic damping, S,
is designed to be at the onset of y ie ld in g fo r s pe ctral ac cele rat io n
Sg ( f ,3 ) which is the in e la st ic s pec tral ac cele rat ion for any ground
mot ion cons idered, then the s t ruc ture wi l l respond to duct i l i t y leve l , y ,
when sub jected to th a t ground motion rec o rd . Thus, comparing Sg^ (f, P )
for the various ground motion records considered in this study provides a
measure of the re la t i v e stre ng th of the rec ord s. A ground motion record
w ith a large S^^ (f ,3 ) req uire s the str uc tu re to be designed at a largey ie ld level to l im it response to a given du c t i l i t y and is more severe
than a record with a small S^^ (f ,S ) which requ ires the s tru ctu re to be
designed at a small y ie ld lev el to l im it response to the same d u c t i l i t y
l e v e l . In Chapter 6, the inelast ic spectral accelerat ion values are
compared fo r the 12 ground motion records considered in th is study at 3
d u c t i l i t y lev els (y = 1 .0, 1.S5 and 4.27) at 4 f requencies ( f = 8.54,
5.34 , 3.20 and 2.14 Hz and one damping value ( 3 = 7 p e rc e n t) ).
Relat ive strength zones ( i . e . , very severe, severe, moderate and
low streng ths) are def ined in terms of the a cce lera t ion lev el f o r which a
structure must be designed to remain elastic using the Reg. Guide 1.60
spectrum in order to prevent seismic response exceeding duct i l i ty levels
of 4.27 when subjected t o the actua l earthquake ground m otio n. Sim ilar
7-15

8/22/2019 6848574
http://slidepdf.com/reader/full/6848574 201/394
rel ativ e s trengt h z ones for y = 1.85 and 1.0 are obtained by scalin g the
zone levels for y = 4.27. The inelastic spectral ac celerations and
relative strength zones are presented in Figure s 6-la through 6-ld for
the 4 frequencies considered.
Based upon the data presented in Figu res 6-la through 6-ld, it
is concluded that on ly the Pac oima Dam record is a very severe ground
motion in terms of potential damage for structures with frequenci es
greater than 4 Hz . At below 4 Hz , this record is a severe ground motion
at about 3 Hz and a moder ate ground motion at about 2 Hz . At 8.5 H z , the
Melen dy Ranch and El Centro #5 records are in the severe categ ory. At
below 4 Hz , the Parkfield record is within the severe categor y. All
other ground motion records fall in the low or mode rate categories at all
fre que nci es. Note that reasons are outlined in Chapter 6 as to why the
damage capability of high accelera tion, short duration earthquakes such
as Melendy Ranch and Parkfie ld may be overstated by the methods used to
assess relative strengths of the ground mot ion .
7-16

8/22/2019 6848574
http://slidepdf.com/reader/full/6848574 202/394
8. REFERENCES
Alexander, C. M., Heiderbrecht, A. C , and Ts o, W. K. ( 1 9 7 3 ) , "Cyclic LoadTests on Shear Wall Pan els ", Proceedings of the Fifth World
Conference on Earthquake Engine ering, Ro me, pp. 1116-1119.
A r i a s , A . ( 1 9 7 0 ) , "A Measure of Earthquake Intensity", Seismic Design for
Nuclear Power Plant s, MIT Pres s, Cambridge, Massachusetts.
Banon, H., Bi ggs , J. M., and Irvine , H. M. ( 1 9 8 1 ) , "Seismic Damage in
Reinforced Concrete Frame s", Journal Structural Division, ASC E, Vol.1 0 7 , ST 9, pp . 1713-1729, Septem ber.
Barda, F., Hanson, J. M., and Corley, W. G. ( 1 9 7 6 ) , "Shear Strength of
Low-Rise Walls with Boundar y Ele ment s", Proceedings of the SixthWorld Conference on Earthquake Engineer ing, New Delhi.
Bertero, V. V., et. al. , ( 1 9 7 7 ) , "Seismic Design Implications of
Hysteretic Behavior of R/C Structural W al ls" , Proceedings of the
Sixth World Conference on Earthquake Engineering , New Delh i.
Blume, J. A., ( 1 9 7 9 ) , "On Instrumental versus Effective Acceleration andDesign Coeff icien ts", Proceedings of the Second U .S. NationalConference on Earthquake Engineeri ng", Stanford, Califo rnia, Augus t.
Cardenas, A. E. , Hanson, J. M. Corley, W. G., and Hognestad, E. ( 1 9 7 3 ) ,
"Design Provisions for Shear W all s", ACI Journal, Proc. Vol. 70 ,
N o . 3, pp. 221-230, March .
Dobry, R., Idriss, I. M., Ng , E. ( 1 9 7 8 ) , "Duration Characteristics of
Horizontal Components of Strong-Motion Earthquake Recor ds", Bulletin
°^ ^!?^-^^J^'?9^°g^^^.^ Soc iet y o f A me ri ca , Vo l. 6 8 , No . 5 ,p p . 1487-1520, Octob er.
Fiorato, A. E . and Corley, W. G. ( 1 9 7 7 ) , "Laboratory Tests of Earthquake-Resistant Structural Wall Systems and E lemen ts", Workshop onEarthquake-Resistant Reinforced Concrete Building Construction,University of California, Berkeley, pp. 1388-1429, July.
Fukada, Y., Hirashima, S. and Shobara, R. ( 1 9 8 1 ) , "Experimental Study on
One-Thirtieth Scale Model of Reinforced Concrete Reactor Build-UnderCyclic Lateral Loadi ng", Tran s. Sixth International Conference of
Structural Mechanics in Reactor Tec hnolog y, Volume K, paper K15/1,
August.
Gugerli, H. and Goe l, S. C. ( 1 9 8 0 ) , "Large Scale Tests for the HysteresisBehavior of Inclined Bracing Memb ers ", Proceedings of the SeventhWorld Conference on Earthquake Engineering , Istanbul, pp . 87-94.
8-1

8/22/2019 6848574
http://slidepdf.com/reader/full/6848574 203/394
REFERENCES (Continued)
Gulkan, P. and Sozen, M. A. ( 1 9 7 4 ) , "Inelastic Responses of ReinforcedConcrete Structures to Earthquake Moti ons" , ACI Journal, Vol. 71,N o . 12, pp. 604-610, December.
Hoffman, R. B. ( 1 9 7 4 ) , "State-of-the-Art for Assessing Earthquake Hazardsin the United Stat es; Factors in the Sp ecification of Ground Mo tionsfor Design Earthquakes in California", Miscellaneous Paper S-63-1,U . S . Army Engineers Waterways Experiment Station, Vicksburg,M i s s i s s i p p i , J u n e .
Housner, G. W. ( 1 9 5 2 ) , "Spectrum Intensities of Strong-Motion Earthq u a k e s " , Proceedings of the Symposium on Earthquake and Blast Effec tson Struct ures", Earthquake Engineering Research Institute, Los
Angeles, California, June.
Housner, G. W. ( 1 9 7 5 ) , "Measures of Severity of Earthquake Ground
Shaki ng", Proceedings of the U. S. National Conference on Ear thquakeEngineering, EER I, Ann Arbor, Michigan, pp . 25-33., June.
Housner, G. W., and Je nnings, P. C. ( 1 9 7 7 ) , "Earthquake Design Criteriafor Struc tures", Report No. EERL 77-06, EERL, California Instituteof Technology, Pasadena, November.
Housner, G. W. ( 1 9 7 9 ) , "Statistics of Pulses on Strong Motion Accelerog r a m s " , Proceedings of the NSF Seminar Workshop on Strong Ground
M o t i o n .
H u d s o n, D . E . ( 1 9 7 9 ) , Reading and Interpreting Strong Motion Accel erograms , EERI Monograph, EERI, Berkeley.
Husid, R. ( 1 9 7 3 ) , Terremotos-Earthquakes, Editorial Andres Bello,Santiago, Chile.
Iwan, W. D . and Gate s, N. C. ( 1 9 7 9 ) , "Estimating Earthquake Response ofSimple Hysteretic S ystem s", Journal of the Engineering Mec hanicsD i v i s io n , A S C E , V o l . 1 0 5 , N o . E M 3 , p p . 3 9 1 - 4 0 5 , J u n e .
Iwan, W. D. ( 1 9 8 0 ) , "Estimating Inela stic Response Spectra from Elast ic
Spectra", Earthquake Engineering & Structural Dynamics, Vol. 8, pp.375-399.
Jain, A. K. and Goel , S. C. ( 1 9 7 8 a ) , "Hysteresis Models for Steel MembersSubjected to Cyclic Buckling or Cyclic End Moments and Buckling(User's Guide for Drain - 2D: EL9 and E L I O ) " , Report No. UMEE 78R 6,Department of Civil Engi neers, University of Michigan, December.
8-2

8/22/2019 6848574
http://slidepdf.com/reader/full/6848574 204/394
REFERENCES (Continued)
Jain, A. K., G oel , S. C. and Hanson, R. D. (1978b ) , "Inelastic Responseof Restrained Steel Tub es" , Journal of Structural Division, ASCE ,S T 6 , Vol. 104, pp. 897-910, June.
Jain, A. K. and Goel, S. C. ( 1 9 7 9 ) , "Cyclic End Moments and Buckling inSteel Members", Proceedi ngs of the Second U .S . National Conferenceon Earthquake Engineerin g, Stanford, pp. 413- 422.
Jain, A. K., Goel, S. C. and Hanson, R. D. ( 1 9 8 0 ) , "Hysteretic Cycles ofAxially Loaded Steel Mem bers ", Journal Structural Di vision, ASCE ,S T 8 , Vol . 106, pp. 1777-1795, August.
Jennings, P. C. and Housner, G. W. ( 1 9 7 7 ) , "The Capacity of ExtremeEarthquake Motions to Damage Struc tures ", Structural and GeotechnicalMechanics, Prentice-Hall, Englewood Cliffs, New Jersey, pp. 102-116.
Kanaan , A. E. and Powel l, G. H. (1973, 1 9 7 5 ) , "DRAIN- 2D, General PurposeComputer Program for the Dynamic Analysis of Inelastic PlaneStruct ures", EERC Report No . 73- 6, Earthquake Engineering ResearchCenter, University of California, Berkeley, April, 1973 (Revised1 9 7 5 ) .
Kennedy, R. P. ( 1 9 8 0 ) , "Ground Motion Parameters Useful in StructuralDesign", presented at Conference on Evaluation of Regional SeismicHazards and Risk , Santa Fe , New Mexico, Octo ber.
Kenned y, R. P.\, Short, S. A. and Newmar k, N . M. ( 1 9 8 1 a ) , "The Response ofa Nuclear Power Plant to Near-Field Moderate Magni tude Earthquakes",Sixth International Confer ence on Structural Mechani cs in ReactorTechnology, Paris, France, August 17-21.
Kennedy, R. P. ( 1 9 8 1 b ) , "Peak Acceleration as a Measure of Dama ge",
presented at Fourth In ternational Seminar on Extreme- Load Design ofNuclear Power Facil ities , Paris, France, August.
Mahin, S. A. and Bertero, V. V., "An Evaluation of Inelastic SeismicDesign Spectra", Journal Structural Division, ASCE, Vol. 107, ST9,
p p . 1777-1795, September.
Maison, B. F. and Popov, E. P. ( 1 9 8 0 ) , "Cyclic Response Prediction forBraced Steel Fr ames ", Journal Structural Division , ASC E, Vol 106,S T 7 , pp. 1401-1416, July.
McCann, M. W., J r. and Sh ah, H. C. ( 1 9 7 9 ) , "RMS Accele ration for SeismicRisk Analys is: An Overview" , Proceedings of the Second U .S . NationalConference on Earthquake Engineerin g, Stanford Un iversit y,p p . 883-897 , August 2 2 - 2 4 .
8-3

8/22/2019 6848574
http://slidepdf.com/reader/full/6848574 205/394
REFERENCES (Continued)
Mortgat, C. P. ( 1 9 7 9 ) , "A Probabilistic Definition of Effective
Acce lera tion ", Proceedings of the Second U. S. National Conference onEarthquake Engineering, Stanford University, pp. 743-752,August 22-24,
Newmark, N. M. ( 1 9 7 0 ) , "Current Trends in the Seismic Analysis and Designof High Rise Structur es, Chapter 16, in Earthquake Engineering,edited by R. Wiegel, Prentice-Hall, Inc., Englewood Cliffs, NewJersey, pp. 403-424.
Newmark, N. M. ( 1 9 7 3 a ) , "A Study of Vertical and Horizontal Earthqu akeSpectra", WASH-1255, Directorate of Licensing, U. S. AEC, Washing ton.
Newmark, N. M. and Hall , W. J., ( 1 9 7 3 b ) , "Procedures and Criteria forEarthquake Resistant Design", Building Practices for DisasterMitigation, National Bureau of Standards (Washington, D . C . ) ,
Building Sciences Series 46 , Vol. 1, pp. 209-236, February.
Newmark, N. M. ( 1 9 7 5 ) , "Seismic Design Criteria for Structures and
Faciliti es: Trans-Alaska Pipeline System", Proceedings of the U.S.National Conference on Earthquake Engineering, Ann Arbor , Michigan.
Newmark, N. M. ( 1 9 7 6 ) , "A Rationale for Development of Design Spectrafor Diablo Canyon Reactor Facil ity" , N. M. Newmark Consulti ng
Engineering Servi ces, Urbana, Illinoi s, September.
Newmark, N. M. and Hall , W. J. ( 1 9 7 8 ) , "Development of Criteria forSeismic Review of Selected Power Plant s", NUREG/CR-q098 , NewmarkConsulting Engineering Serv ices, Urbana , Illinois, May.
Newmark, N. M., and H all , W. J. ( 1 9 8 2 ) , "Earthquake Spectra and Design",Earthquake Engineering Research Institute Monograph.
Nuttli, 0. W. ( 1 9 7 9 ) , "State-of-the-Art for Assessing Earthquake Hazardsin the United S tat es: The Relation of Sustained Maximum GroundAcceleration and Velocity to Earthquake Intensity and Magnitude",Miscellaneous Paper S-73-1, Report 16, November, 1979, U.S . Army
Engineers Waterways Experiment Statio n, Vicksburg, Missi ssip pi.
Page, R. A., Boore, D. M., Joyner, W. 8., and Cou lter, H. W. ( 1 9 7 2 ) ,
"Ground Motion Values for Use in the Seismic Design of theTrans-Alaska Pipeline System", USGS Circular No. 672, Washin gton.
Park , R. and Paul ay, T . ( 1 9 7 5 ) , Reinforced Concrete Structures, JohnWiley and Sons, New York, pp. 610-66 2.
8-4

8/22/2019 6848574
http://slidepdf.com/reader/full/6848574 206/394
REFERENCES (Continued)
P a u l a y , T . ( 1 9 7 5 ) , "Earthquake Resistant Structural Walls" , Workshopon Earthquake-Resistant Reinforced Concrete Building Construction,University of California, Berkeley, pp. 1339-1365, July.
Ploessel , M. R., and Slosson, J. E. ( 1 9 7 4 ) , "Repeatable High Ground
Accelerations from Earthquak es", California Geology, Vol. 27, No. 9,pp. 195-199, September.
Popov, E. P., Zayas, V. A. and Mahin , S. A. ( 1 9 7 9 a ) , "Cyclic InelasticBuckling of Thin Tubular Colu mns", Journal Structural Division,ASCE, Vol. 105, STll, pp. 2261-2277, November.
Popov, E. P. ( 1 9 7 9 b ) , "Inelastic Behavior of Steel Braces Under CyclicLoad ing", Proceed ings of the Second U. S. National Conf erence onEarthquake Engineering, Stanford, pp. 923-932.
Popov, E. P. ( 1 9 8 0 ) , "Update on Simulated Seismic Tests on ReinforcedConcrete and Structural Steel As sembli es", Proceedings of the 1 980Annual Convention of the Structural Engineeri ng Association ofCalifornia, Monterey, pp. 15-35, October.
Popov, E. P. and Black, R. G. ( 1 9 8 1 ) , "Steel Structures Under Severe
Cyclic Load ings", Journal Structural Division, ASCE, Vol. 107, ST9,p p . 1857-1881, September.
Riddell , R. and Newmark, N. M. ( 1 9 7 9 ) , "Statistical Analysis of theResponse of Nonlinear Systems Subjected to Earthquakes", SRS 468 ,Department of Civil Engineering, University of Illinois, Urbana,A u g u s t .
Saiidi, M. and Sozen, M. A. ( 1 9 7 9 ) , "Simple and Complex Models for
Nonlinear Seismic Response of Reinforc ed Concrete Stru ctures ", CivilEngineering Studies, Structural Research Ser ies, No. 465, Universityof Illinois, Urbana, August.
Schnabel, P. 8. and Seed, H. B. ( 1 9 7 3 ) , "Accelerations in Rock forEarthquakes in the Western United States", Bulletin of the
Seismological Society of Americ a. Vo l. 62, April.
Shibata, A. and S ozen, M. A. ( 1 9 7 6 ) , "Substitute-Structure Method forSeismic Design in R/C" , Journal Structural Division, ASCE, Vol . 102,STl, pp. 1-18, January.
Shiga, T., Shibata, A. and Ta kahas hi, J. ( 1 9 7 3 ) , "Experimental Study onDynamic Properties of Reinforced Concrete Shear Walls", Proceedingsof the Fifth World Conference on Earthquake Engineering, Rome,Paper 142.
8-5

8/22/2019 6848574
http://slidepdf.com/reader/full/6848574 207/394
REFERENCES (Continued)
Short, S. A., Kennedy, R. P., and Newmark, N. M. ( 1 9 8 0 a ) , "PWR ReactorBuilding Response from High Acceleration, Short DurationEarthquakes", Seventh World Conference on Earthquake Engineering,I s t a n b u l , Turkey, September.
Short, S. A., Kennedy , R. P., Ne wmark, N. M., and Sozen, M. A. ( 1 9 8 0 b ) ,"Nonlinear Response of Nuclear Plant to Moderate Magnitude, NearField Earthqu ake", ASCE Specialty Conference on Civil Engineeringand Nuclear Power, Knoxvil le, Tennessee, September.
Singh, P. ( 1 9 7 7 ) , "Seismic Behavior of Braces and Braced Steel Fram es",UMEE 77 R1, Department of Civil Enginee ring, University of Mich igan,July.
Stevenson, J. D. ( 1 9 8 0 ) , "Structural Damping Values as a Function of
Dynamic Response Stress and Deformation Lev els" , Nuclear Engineeringand Design. Vol. 60, pp. 211-23 7.
Trifunac, M. D. and Brady, A. G. ( 1 9 7 5 ) , "A study of the Duration ofStrong Earthquake Ground Motion", Bulletin of the SeismologicalSociety of America, Vol. 65, pp. 581- 626.
Uchida, T. et. al., ( 1 9 8 0 ) , "Structural Test and Analysis on the SeismicBehavior of the Reinforced Concrete Reactor Building", Proceedingsof the Seventh World Conference on Earthquake Engineering, Istanbul,
p p . 2 1 7 - 2 2 4 .
Umemura, H. and Tanaka, H. ( 1 9 7 7 ) , "Elasto-Plastic Dynamic Analysis ofReactor Bu ildin gs", Proceedings of the Sixth World Conference onEarthquake Engineering., New Delhi, India, pp. 8-51/8-56.
Unemura, H. et. al., ( 1 9 8 0 ) , "Restoring Force Characteristics of R.C.Walls with Openings and Reinforcing Meth ods" , Proceedings of theSeventh World Conference on Earthquake Engineering, Istanbul,p p . 209-216.
USNRC ( 1 9 7 3 a ) , "Design Resonse Spectra for Seismic Design of NuclearPower Plan ts', Regulatory Gu ide 1.60 (Revision 1 ) , Office of
Standards Development, USNRC, Washington, D.C., December.
USNRC ( 1 9 7 3 b ) , "Damping Values for Seismic Design of Nuclear PowerP l a n t s " , Regulatory Guide 1.61, Office of Standards Development,USNRC, Washington, D.C., October.
USNRC ( 1 9 8 0 ) , "Part 100 - Reactor Site Criteria", Rules and Regulations,Title 10, Chapter 1, Code of Federal Regulati ons - Ener gy.
8-6

8/22/2019 6848574
http://slidepdf.com/reader/full/6848574 208/394
REFERENCES (Continued)
Vanmarcke, E. H. ( 1 9 7 2 ) , "Properties of Spectral Moments with Applicationsto Random Vibrat ion", Journal of the Engineering Mechanical Division,A S C E , V o l . 9 8 , N o . E M 2 , p p . 4 2 5 - 4 4 6 , A p r i l .
Vanmarcke, E. H. ( 1 9 7 5 ) , "Structural Response to Earthquakes", Chapter 8in Seismic Risk and Engineering Decis ions, C. Lomnitz andE . Rosenblueth, eds. , Elsevier Publishing Co., New York.
Vanmarcke, E. H., and Lai, S. P. ( 1 9 8 0 ) , "Strong Motion Duration and RMSAmplitude of Earthquake R eco rds ", Bulletin of the SeismologicalSociety of America, Vol. 70, No. 4, pp. 1293-1307, August.
Wang, T. Y., Bertero, V. V. and Popov, E. P. ( 1 9 7 5 ) , "Hysteretic Behaviorof Reinforced Concrete Framed W all s", Report No . EERC 75-23, EERC,University of California, Berkeley.
Wakabayashi, M. et. al., ( 1 9 7 3 ) , "Inelastic Behavior of Steel FramesSubjected to Constant Vertical and Alternating Horizontal Load s",Proceedin gs of the Fifth World Conf erence on Earthquake Eng ineering,Rome, Vol. I, pp. 1194-1197.
Wakabayashi, M. et. al., ( 1 9 7 7 ) , "Hysteretic Behavior of Steel Braces
Subjected to Horizontal Load due to Earthquakes ", Proceedings of theSixth World Conference on Earthquake Engineering, New Delhi, India,V o l . Ill, pp. 3188-3193.
Whitman, R. V. ( 1 9 7 8 ) , "Effective Peak Acceleration", Proceedings of theSecond International Conf erence on Micro zonat ion, San Francisc o,Califo rnia, Vo l. Ill, pp. 124 7-125 5, November 26 - December 1.
8-7

8/22/2019 6848574
http://slidepdf.com/reader/full/6848574 209/394
P D
P A 2
E C 5
- G
AT
H S -EC12.C L -M R -
G O -
1.62*
1.40
0.74
0.64-
0.49
0.430.40
•0.260.220.20
0.16
0.09
y = 1.0
P A 2 _ _ 0 . 8 8 *
P D
E C S
0.74
0.50
__ 0.43
0
A
TH S
EC12
C L
M R
G C
y
f
_ 0.28
- 0 . 2 5
- 0 . 2 2- 0 . 1 9
_ 0 . 1 5
_ 0 . 1 1
- 0 , 0 8
_ 0 . 0 5
= 1.85
2.14 H z
y = 4.27
LEGEND
A
CL
ECS
EC ! 2
GGC
HS
MR
0
PA2
PD:
T:
• Artificial (0.2g)
Coyote Lake
El Centro #5
El Centro # 12
Goleta
Gavilan College
Hollywood Storage
Melendy Ranch
Olympia
Parkfield
Pacoima Dam
Taft
*Values shown a r e inelastic
spectral accelerations Sfo r y = 1.0, 1.85 and4.27
ay
FIGURE 6-ld. MEASURE O F RELATIVE STRENGTH O F GROUND MOTION RECORDS A S DEFINED B Y Say(f,7%)

8/22/2019 6848574
http://slidepdf.com/reader/full/6848574 210/394
APPENDIX A
LITERATURE REVIEW: EARTHQUAKE STRUCTURAL DAMAGE
Seismic design criteria for nuclear power plants are normally
expressed in the form of elastic response spectra anchored to an instru
mental peak acceleration or some "reference acceleration for seismic
design" coupled with an elastic structural a nalys is. Numerous studies
have suggested that the predicted performance (i.e., damage or lack of
damag e) of structures obtained using such design spectra anchored toinstrumental peak ground motion and elastic analysis does not correlate
well with the observed perf orman ce of real stru ctur es. Namel y, the
analyses generally overestimate earthquake force levels and thus predict
that damage would be more severe than is actually observ ed. One such
invest igatio n has been perfor med as part of this study for the El Centro
Steam Plant subjected to the 1979 Imperial Valley earth quake . The
results of the steam plant evaluation are reported in Appendix E. These
studies indicate that in order to better correlate both design conditions
and predicted structural response with the actual observed performance
(i.e., damage or lack of damage) of structures, design parameters must
not only reflect peak acceleration and the frequency characteristics of
the earthquake motion, but also must consider factors such as duration of
strong motio n, the number of peak cyc les, etc., as well as the energy
absorption capac ity of the structures and soil-structure interaction
effe cts. It has also been suggested that the problem is further compli
cated when dealing with near-source ground motions due to low-to-moderate
magnitu de eart hquakes wh ose motions are characterized by very high peak
accelerations, and short duration of strong shaking.
The purpose of this task was to conduct a literature review of
available data and document the performance of real structures subjected
to strong ground shaking from past eart hqua kes. The primary objective was
A-1

8/22/2019 6848574
http://slidepdf.com/reader/full/6848574 211/394
to use the assembled information to judge how well the predicted struc
tural perfo rma nce , based on design motions such as those currently defined
for nuclear power pla nts ( namely , design motio ns based on elastic spectra
anchored to peak acceleration from recorded motions coupled to an elastic
response analysis) correlates with the actual observed behavior of real
structures in past earth quakes. A second objective was to identify, from
the cases reviewe d, ground motion and structural characteris tics that
strongl y influenced the actual observed respo nse behavior of the
structure.
A.l SCOPE
There are many papers describing damage to structures re sulting
from earthquakes. By far , most of these papers focus on architecturaland cosmetic damag e. There are only a limited number that discuss
performance (i.e., structural damage or lack of structural d amage ) wher e
the level of ground shaking is known. This review focuses on such papers
as much as poss ible . The review concentrates on the performance of
structures subjected to near-s ourc e, strong ground motions from low-to-
modera te size eart hqua kes. It also emphasizes the structural performance
of those structures located in close proximity to recorded motion . For
completeness and comparisons sake, the review includes data from larger-
size earthquakes and for structures located at more distant rang es. In
all cases, structures which had dynamic response characteristics similar
to those of nuclear power plant structures were sought.
The review addresses and documents in detail the performance of
a wide variety of structure-types subjected to strong motion from ten
different ear thqu akes . The damage noted in 18 additional earthquakes is
addressed in brief. Table A-1 lists all of the earthquakes reviewed and
structure-type s reported . Table A-2 provides additional details on these
earthquakes and distance to pertinent struc tures . The earthquake s cover
a wide Richter magni tude ran ge, 2.7 to 8.3. The majo rity fall in the low-
to-moder ate range of 4.5 to 6.5. Esse ntial ly, all structures discussed
are located near-source and t h u s , were subjected to high accelerations.
A-2

8/22/2019 6848574
http://slidepdf.com/reader/full/6848574 212/394
The performance of a wide range of structure-t ypes is noted and
includes residen tial, commer cial, and industrial bui ldings . Discusse d,
for exampl e, are older to newer structures; low-rise to high-rise
buildings; office building s; mobile homes and office traile rs; private
and commercial ho usin g; sch ool s; bri dge s; and general commercial
buildings. Industrial facility structu res include those associated with
refineries, steam pla nts, pumping station s, cycling p lan ts, water tanks
(elevated and ground l e v e l ) , a research/experimental laboratory, a
thermal pla nt, steel st ack s, hydro/geothermal pla nts , and nuclear power
plants. The review focused on the performance of engineered structures
where attempts were made to reconcile pr edicted re sponse beha vior with
actual observed behavior.
Earthquake design considerations of the reported struct ures
covered a wide range. On the one ext reme , there were structures which
incorporated the latest concepts in earthquak e resist ance desi gn. Such
structures employed good provisio ns for accommodating both lateral and
vertical earthquake for ce s, had good lo ad-carryin g continui ty between
major structural elements (e.g., beam s, flo ors , wal ls, e t c . ) , were
well-anchored to well-designed found ations , were designed to be flex ible ,
and had good energy absorbing capacit y. Well-de signed structu res were
built under quality control guidel ines. Scho ols, hos pita ls, and nuclear
power plants have even more strict earthquake pr ovision s placed on them
than conventional facilities designed to the Uniform Buildin g Cod e. At
the other extre me, many reported structures did not incorporate any
earthquake design pr ovisio ns, lacked any structural continuity between
major load-carrying mem be rs , and had few or no quali ty control or quality
assurance requirement s.
A detailed study of the El Centro Plant subjected to the 1979
Imperial Valley earthqua ke was conducted for this proje ct. This plant
was designed for a horizontal force coe fficient of 0.2 and was subjec ted
to actual earthquake ground motion estimated to be about 0.5g and
experienced no significant structural d amage . It was also a case in
A-3

8/22/2019 6848574
http://slidepdf.com/reader/full/6848574 213/394
which building drawings as well as measur ed ground motion close to the
site was availabl e. The results of the El Centro Steam Plant evaluation
are sutmari zed in Section A.3 .5 and presente d in detail in Appendi x E.
A.2 ASSESSMENT PROCEDURE
The following is a brief description of the assessment procedure
employed to meet the review object ives . For each eart hqua ke, the litera
ture was reviewed to identify structures that were subjected to strong
ground shaking and whose observed structural performan ce is repor ted.
The structure's capacity was then established by defining the earthqu ake
force level associated with the onset of structural damage and/or the
force level associated with the onset of col lap se. At the lower cap acit y
level , one would expect only minor yielding and inelastic behavior of
structural me mbers . At the higher capacity level, one would expect sig
nificant damage, yielding and inelastic behav ior. Next , the earthq uake
force level in the structure was estimated by means of an elastic respon se
analysis using either recorded or estimated ground motion to define the
struc ture i nput. The estimat ed force level was then compared with the
structure's capacity in order to predict perf orma nce. This final compar
ison was employed to assess how well the predicted structural perf orma nce,
using elastic structural analysis methods based on elastic response spectra and peak accelerations from recorded moti on, correlated with actual
observed behavior.
Most published observatio ns of performance fo cus on conventional
structures designed to Uniform Building Code (UBC) pro vis ion s. For such
stru ctur es, the expected performance can be expressed as a function of
code design level . For exam ple, past observations suggest that on the
aver age, a properly designed structure should survive major shakin g to
earthquake force levels more than 4 to 6 times design v al ues . Under such
force levels , the structure can be expected to behave inel astic ally,
exhibi ting large , plastic deformations and some structural dama ge, but
without collap se. At force levels at about 2 to 3 times code design
leve ls, onset of yielding can be expected with some inelastic behavior but
only minor structural dama ge.
A-4

8/22/2019 6848574
http://slidepdf.com/reader/full/6848574 214/394
Figure A-1 taken from Referen ce A -6 0, gives an example of
observed data from the 1971 San Fernando earthquake for multi-sto ry rein
forced concrete structures constructed since 1964. The figure supports
the above capaci ty level of 2 to 3 times code design levels for the onset
of dama ge. The authors suggest that margin of safety against collapse of
these structures was not tested by the San Fernando earthq uake, but the
data suggests that responses equivale nt to five or more times design base
shear could have been resisted with out co lla pse , though severe damage
would probably have resulted.
A.3 RESULTS OF REVIEW
Over 150 papers (listed at the end of this Appendix) have been
reviewed ; most of which describe the nature of structural damage resulting
from past earth quake s. Based on information presented in these pap ers ,
the performance of structures during ten different earthquakes is reported
in more det ail . Published data from the other earthquakes is generally
too limited to draw significant con clus ions . Table A-1 lists the earth
quakes chronologically and identifies the types of structures which are
discussed along with cited refe renc es. Other earthquakes investigated
but not discussed in any detail are the 1933 Long Beac h, 1949 Olymp ia
(A-140, A-152, A - 1 5 5 ) * , 1964 Alask a ( A - 5 5 ) , 1967 C aracas , Venezuela(A-110, A - 1 4 8 ) , 1974 Lima Peru (A-65, A - 1 4 6 ) , 1976 Fr iuli , Italy (A-80,
A-145) 1977 Roma nia , 1980 Mammoth Lakes (A-156) and 1980 Trinid ad-Offshore
(Eureka) (A-123, A - 1 2 4 ) .
For each of the cases pr esen ted, a brief description of the size
and location of the earthquake and the general extent of strong ground
shaking is first inclu ded. Nex t, the types of affected structures are
identified and the level of ground motion to which they were subjected is
estimat ed. The actual performance of the structures is then described
and compared with that which would be predicted using elastic dynamic
analysis procedure s.
Numbers in parentheses refer to the Research Bibliography reference
number.
A-5

8/22/2019 6848574
http://slidepdf.com/reader/full/6848574 215/394
A.3.1 San Fernando, California Earthquake, 1971 (A-58, A- 60 , A-6 6,
A - 6 7 , A - 7 6 . A - 8 4 . A - 8 7 , A - 1 5 7 , A - 1 5 9 , A - 1 6 2 , A - 1 6 3 )
The San Fernando ear thquake occurred on February 9, 1971 at the
northern edge of the Los Angel es metropolitan area. The earthquake was
of mod era te mag nit ude (M|_ = 6.4, M5 = 6. 6 ). Its hypoce nter was located
at the southern edge of the San Gabriel M ountains at a depth of 8.4 km.
The focal mechanism for the San Fernando fault consists of thrust with a
significant left-lateral movement along a fault dipping north-northe ast
at an angle between 35° and 50 °. The aftershock locations indicate
that rupture was limited to a disc-shaped region approxim ately 20 km
across. The rupture extended to the surface along an irregular fault
z o n e .
The San Fernando earthquake occurred near the center of the
largest concentration of strong motio n recording instruments in the world.
As a resu lt, more usable strong-motion accelerometers were recorded than
from all previous earthquakes combi ned. The highest ground motion was
1.2g horizo ntal mo tion recor ded on the Paco ima Dam abutment located on the
upthrust block 8 km from the epic ent er. Peak horizontal accelerat ions from
0.15 to 0.40g were recorded in the area surrounding the fault ruptu re.
Strong motion lasted some 12 sec onds . The major ity of the recordings
were obtained in the Los Angeles area approximately 30 km to the south of
the rupture zo ne. Many of these instruments were installed at various
levels of high-rise buil ding s. The site conditions at the recording
stations range from crystalline basement rocks to the north and east
through older sedimentary rocks to deep deposits of unconsolidated and
consolidated alluvium in the valleys to the south. The majo rity of the
recor dings obtained in the Los Angeles area are from buildings founded on
thick. Pliocene deposits.
Modified Mercalli (MM) intensitie s ranging from VIII to XI
occurred in a 190 square mile area in the region s urrounding the fault
rup tur e. Extensive damage to residential buil dings , streets and
utilities occurred along the zone of surface fault ing. Two hospitals
suffered major collapses due to ground shaking. Forty-nine people were
A-6

8/22/2019 6848574
http://slidepdf.com/reader/full/6848574 216/394
killed in the collapse of olde r, unreinforced ma sonr y buildings at the
San Fernando Vetera ns Admini strati on Hospital and three additional people
were killed (2 due to to life support fail ure ; 1 due to structural
fai lur e) in a modern reinforced concrete hosp ital . Severe damage toother residential and commerical buildings and highway bridges occurred
in this area. Major landslides were caused by ground shaking, inc luding
the near failure of the Lower Van Norman Dam and severe damage to the
Upper Van Norman Dam.
Outside of the immediate area of strongest shaking , damage was
mai nly restricted to older stru ctur es. Most of the urban areas were
constructed since 1933 when the first earthq uake design requirements were
incorporated into the local building codes and most modern buildings
performed well.
Although only of moderate size, the earthquake provided a real
test for many types of building st ruct ures . Many engineering studies were
conducted of earthqu ake-res istant structures to determine the adequacy of
present design criteri a. These studies included (a) tall buildings that
contained three stro ng-motion instruments (b) major structures in the
heavily shaken ar eas , most which happened to be medical facilities
(c) modern one-st ory industrial and commercial stru ctur es, (d) public
schools because these represented both non-earthquake and earthquake
resistant designs and (e) some old, unreinfor ced mas onry structures (e.g.,
the Veterans Administration H o s p i t a l s ) .
The majority of the structures studied (except for tall buildings
in downtown Los Ange les ) suffered modera te to severe damage and even
colla pse. Engineering studies focused on damaged structures rather than
undamaged structures subjected to strong mo tio ns. The discussion included
herein of Building 41 of the Veterans Administr ation Hospital complex is
an exception.
A-7

8/22/2019 6848574
http://slidepdf.com/reader/full/6848574 217/394
Veterans Administration Hospital Building 4 1 . - The Veterans
Adminis tration Hospital Buildi ngs 41 and 43 provid e what is probably the
best examp le in the San Fernando earthquake of structures designed to
resist nominal loads, yet surviving intense shaking and suffering only
minor structural dama ge. A study (A-163) was conducted of Building 41 to
reconcile the observed behavior with the level of strong shaking experi
enced during the earthqu ake.
Building 41 and the Olive View Hospital (which was severely
dama ged) were located near the major surface faulting and about 1-1/4
miles southwest of the Pacoima Dam where peak acceleratio ns over Ig were
recorded. Other buildings at the Veterans Administration sit e, which
accounted for most of the earthquake's cas ual tie s, were not designed to
resist earthquakes.
There were no actual strong-motion accelerometers in the vicinity
of the building site and t h u s , it is impossible to reconstruct the high-
frequency components of the ground motion which are important towards the
response of the building. The range of peak acceleration values measure d
or inferred from nearby sites is rather wide ; 0.5g to 1.2g. Mor eov er,
the peak acceleration is not as important as the freque ncy content of the
record in the range of structural freq uenc ies. Reasonab le estimates of
spectral amplit udes in the period rang e of inter est are 0.7g to 1.5g.
Building 41 was designed in 1937 and built in 1938 . It was four
stories hi gh, about 51 x 20 0 feet in plan with a centrally-located
pent hous e. The vertical and lateral load-carr ying system consisted mainly
of reinforced concrete shear walls supported on spread foo tin gs. There
wer e six shear walls in the transverse direction and three longitudinal
walls. Due to the sloping ter rai n, the ground story (or basem ent) was
half-buried on the north s ide , whe rea s, it was nearly on grade on the
south eleva tion. The basement floor slabs were cast on gra de, and, as
suc h, were not load-carrying. The other three floor slabs and the roof
slabs were ribbed. These slabs were supported on beams spanning between
columns and bearing w a l l s . The building had structural symmetry.
A-8

8/22/2019 6848574
http://slidepdf.com/reader/full/6848574 218/394
The building was designed for a lateral load coefficient of
appro ximate ly 10 percent its weight (at workin g s t r e s s e s ) . The UBC code
in force today would lead to a base shear coefficient of 0.28.
In view of the apparent strength of the longitudinal wal ls, the
study focused on the transverse response onl y. The lateral load capacity
was first estimated on the basis of conventional code (current) oriented
proc edur es. The results indicated that with a fixed base , the structure
could resist lateral loads implied by a lateral load coefficient of about
0.4g; the limiting factor being the tensile strength of concrete in the
w a l l s .
A complete three- dimension al model of the entire structure was
dynamicall y analyzed for a flat acceleration spectrum . The most important
result from the analysis was that the inferred level of ground accelera
tion as indicated by a spectral accel erati on of about 0.5g is still quit e
low compared with credible lower bound estimates of the spectral accelera
tion to which this building was subject ed. This implies that the struc
ture had a capacity signif icantly in excess of that revealed by the
fixed-base elastic analy sis. Conside ring linear soil-structure inter
action in the analysis d oes not necess ari ly lower the level of internalforces in the structure compared with the fixed-base analysis (i.e.,
spectral acceleration m ay rise steeply with inc reasing period even though
damping is increas ed. Th us , a nonlinear soil-str ucture interaction
analysis was performed to help resolve the discrepancy between observed
behavior and capacity estimates.
The need for a nonlinear analysis stemmed m ainly from the fact
that at relat ively low levels of exci tati on, partial uplift of the
structure was already suggeste d. The reduced contact area between the
base and the soil leads to lowering the rocking and lateral rigidities of
the founda tion , and with increasing sepa rati on, may lead to partial
yielding of the soil. A two-dimension al analysis was conducted using the
1971 Pacoima Dam (S 16E) and the Holida y Inn (Orion Blvd., N OOW) records
A-9

8/22/2019 6848574
http://slidepdf.com/reader/full/6848574 219/394
norm a l i zed t o a 0 .5g peak ac ce le ra t i o n . Th i s leve l i s com pa t i b l e w i t h
the lower est ima tes of ground mo t ion at the s i t e . Both reco rds gave a
base shear o f appro x ima te ly 0 .9 g .
The r e s u l t s c l e a r l y show t h a t n o n li n e a r s o i l - s t r u c t u r e i n t e r
ac t io n e f f e c ts lead to lower shear forc es and moments and to h ig he r
com press ive ax ia l f o r ces i n t he conc re te w a l l s . A l l these e f f e c t s t end
t o in c r e a s e t h e a b i l i t y o f t h e s t r u c t u r e t o s u r v i v e s t r o n g s h a k i n g . The
key to the su cce ssfu l response of the bu i ld in gs was found to be in the
com bined e f f e c t s o f two f a c to r s : ( a ) t he l a rge s t r en g th bu i l t i n t o the
s t r u c t u r e a t t a i n e d th r o ug h p ro p e r d e t a i l i n g and ( b) t h e b e n e f i c i a l e f f e c t s
o f n o n li ne a r s o i l - s t r u c t u r e i n t e r a c t i o n .
Ear thquake fo rc es based on l in ea r e la s t i c an a ly s is es t im ate
forc es grea ter than 10 t imes des ign or a t lea s t 3 t imes the es t ima ted
c a p a c i t y . A t such f o r c e l e v e l s , y i e l d i n g and i n e l a s t i c r es p on s e b e h a v io r
lea din g to severe damage would be p re d ic te d . The ac tu al per formance o f
t he bu i l d i n g was one o f es se n t i a l l y no dam age. Th e re fo re , t he l i n ea r
ana l ys i s ove res t im a ted t he ac tua l ea r thquake f o r ces by a s i g n i f i c a n t
amount.
Thus, VA Bu i l d i n g 41 rep rese n ts a s t r uc tu r e wh i ch , a t l i n ea r
e l a s t i c c a l c u l a t e d fo r c e s o f a t l e a s t 3 t im e s t h e e s t im a t e d c a p a c i t i e s ,
expe r ienced e ss e n t i a l l y no dam age.
H igh -R i se Bu i l d i ngs - There were 66 h i gh - r i se bu i l d i n gs i n t he
major Los Ange les area th a t were ins t rum ented w i th s t ro ng -mo t ion ac ce l
erometers at the t ime of the Feb ruary 9, San Fernando ea r thq ua ke. En gi
nee r ing s tud ie s were conducted and are rep or te d on 11 o f these bu i ld in gs
(A -60 ) . A l l had th re e s t rong -m ot ion ins t rum ents and were des igned by
ap p l i ca b le b u i ld in g codes. S tudy re su l ts were used to rev iew ear thquake
des ign procedures and eva lua te ac tu a l sa fe ty fac to rs in the m in imum
des ign requ i rem en ts sp ec i f i e d by t he bu i l d i n g code .
A-10

8/22/2019 6848574
http://slidepdf.com/reader/full/6848574 220/394
The buildings are the Sheraton-Universal Hote l, Bank of
Califo rnia, two Holiday Inn s, Bunker Hill Tow er, KB Valley Cen ter , Muir
Medical Cent er, Kajim a International Building , Certified Life Building,
Union Bank (Los Angeles), and 1901 Avenue of the Stars Building . All of
the buildings w ere located 13 to 26 mile s from the epicen ter.
The buildings ranged from 7 to 42 stories in height. Construc
tion mater ials we re either reinforced concrete or structural st eel.
Lateral force systems employed ductile moment resisting frame s, moment -
resisting fra me s, flat slab and parameter f ram e, ductile frame (tube
s y s t e m ) , shear wall, and X-braced fra me.
Fundamental periods of the buildings ranged from 0.7 seconds to
over 4.0 seco nds . Design base shear values varied from 2.6 to 7.3 percent
of gravity . Peak record ground acceleration values at the different
building sites ranged from 10 to 26 percen t gravit y.
All of the 11 buildings ex perience d calculated force levels
greater than code design values . For the Sheraton-Universal Hote l, KB
Valley Cente r, Union Ban k, Muir Medical C ent er, Kajima International
Build ing, Certified Life Building and the 1901 Avenue of Stars Buildin g,
dynamic elastic analyses using the recorded ground motion would predict
forces from about 1 to 2 times their design level s. Even so, no damage
was observed. For the Bunker Hill Tower and the Bank of California
bui ldi ng, calculated forces were 2.5 to 3.0 times their design loads and
there fore, some yieldi ng, inelastic behavior and minor strutural damage
might be expected. However , no significant structural damage was
observed in these buildi ngs. Minor damage to structural elements was
observed in the form of cracking and spall ing of concrete and local
yielding of rein forc emen t. The structural r esponse of the Bunker Hill
Tower was nonlinea r and could not be described or modeled very well by
linear-elastic dynamic analysis techn iqu es. The analysis of the two
Holiday Inns indicated ear thquak e force levels 4 to 5 times design
values. T h u s , predicted performance would suggest significant yieldi ng,
inelastic behavior and structural da mag e. Beam and slabs would be
A-11

8/22/2019 6848574
http://slidepdf.com/reader/full/6848574 221/394
expected to y ie ld and columns to remain w it h in el a s t i c l i m i t s . Observa
t io ns did show signs of beam y ie ld in g and su bs tan tial no ns truc tura l
damage. No serious column damage was obse rved . Beam damage was less
severe than would be predicted from the calculated forces.
Thus, fo r these 1 1 h ig h -r is e b u il d in g s , no damage was observed
at e l a st ic calcu lated forces up to 2 times th e ir design le ve ls . Only
minor c rac kin g, concrete s p a l l in g , and re inforcement y ie ld in g was observed
fo r e la s t ic calcu lated forces up to 3 t imes the design le v e ls . Stru ctu ral
y ie ld in g and su bs tan tial no ns truc tura l damage was observed at e la s t i c
ca lcu la ted fo rces 5 times design, but w i thout s i gn i f ic an t s t ru ctu ra l
damage.
Olive View Ho spital (A-1 62) - An extensive f i e l d and an al yt ic al
inv es t ig at i on of the str uc tu ra l performance of the main bui ld ing of th e
O live View H os pita l M edical Treatment and Care F a c i l i t y was conducted.
This modern, engineered building suffered such severe structural and
no ns tru ctu ra l damages th at i t had to be demolished aft er the earthqua ke.
The observed st ru c tu ra l damages were compared w ith those pr ed ic te d by
e la s t i c and nonlinear dynamic an al ys is .
The main bu i ld in g was a re la t i v e ly massive, 6-story re in forc ed
concrete stru ct ur e. The bu i ld in g ' s ground stor y was considerably larger
in p lan than the upper f ive stor ies; approximately 1 /3 of the bui ld ing 's
to ta l weight was concentrated at the f i r s t f l o o r . The upper por t ion
consisted of fou r recta ngu lar stru ctu res connected to each other at r ig h t
angles and en clo sin g an open co u rt ya rd . A st ai rt o w e r appendage was
located at the end of each wing.
The entire Olive View Medical Center was designed according to
the p ro vi sio n of the 1964 UBC fo r a la te ra l base shear of appro xima tely 8
percent g ra v it y . The main bu ild in g had a complex s tr u c tu ra l system
inco rpo rat ing a wide va r ie ty of st ru ctu al e lements. The pr imary v er t ic a l
loa d-c arr yin g system used in the bu ild in g consisted of columns and f l a t
slabs with drop panels.
A-12

8/22/2019 6848574
http://slidepdf.com/reader/full/6848574 222/394
Two di f fe re n t types of la te ra l lo ad -re sis t in g st ru ctu ra l systems
were used. In the upper fo u r s t o r i e s , numerous shear w al ls were provided
to re s is t l a te ra l loads . These w a lls , however, did not extend through
the f i r s t and ground st o r ie s , so th at the slabs and columns of the lower
two stor ies formed a relat ively f lex ible, moment-resist ing space f rame.
Essentially all observed damage is attributed to ground shaking
( i . e . , none due to permanent ground displa ce m en ts) . No ground mo tion
records were obtained near the bu ild in g si t e . Several accelerograms were
numerically simulated or taken from recordings obtained at other sites in
order to perform the analyses . The Olive View f a c i l i t y was located about
six miles southwest of the epicenter, a MM intensity of XI has been
assigned to the s i t e . According to Reference A-1 62, the dura t ion of the
severe ground motion in the general v i c i n it y of the s it e was est imated tobe about 8 seconds and the peak ground acceleration was estimated to be
0.65g. Acc elera t ion t ime h is to ry used in the e la st ic analysis was the
Pacoima Dam base rock motion norma lized to 0 .65g . The no nl ine ar dynamic
analysis used several d i f f e re n t acce lerat ion t ime hist or ie s scaled to
peak values ranging from 0.4g to l.Og.
Damage to the building was particularly severe in the bottom two
s t o r i e s , \lery large, permanent deformations were observed, including
sub stan t ia l in e la st ic deformat ion in s labs and columns, and the fa i l u re
of numerous t ied-co lum ns. The t ied-columns ge ne rally fa i l e d in shear,
re su lt i n g in the collapse of three of the stair tow ers and much of the
sin gl e- sto ry po rt ion of the ground st or y. In te rs to ry deformation in the
upper st o ri es were small due to the presence of the shear w a ll s . In
genera l , damage to upper stories was relatively minor.
E la s t ic analys is res u l ts were ab le to detec t b r i t t l e fa i lu re s o f
the tied-columns (when the results were compared with estimated shearca pa cit ie s) and the co nce ntra tion of deforma tion in the bottom two
s to r i e s. However, id e n t i f i c a t i o n of many of the deta i ls of the response,
such as the sev er i ty and d is t r ib u t i o n of in el a st ic deformat ions, and the
s ig n if ic a n t increase i n l a te ra l displacements when an in e la s t i c mechanism
formed, was not poss ible from the res ul ts of the various e la st ic analysis
performed.
A-13

8/22/2019 6848574
http://slidepdf.com/reader/full/6848574 223/394
The in e la s t i c ana lyses revea led th a t the b u i ld in g was des igned
to be very s t r o n g i n co m p ar is o n w i t h b u i l d i n g cod e s p e c i f i c a t i o n s , b u t
th a t fo r some members (no ta b ly , the t ied-c o lum ns and f l a t s labs in th e
b o tt om tw o s t o r i e s ) t h e r e q u i r e d i n e l a s t i c d e f o r m a t i o n s were l a r g e r t h an
t h e y c o u ld d e ve lo p a c c o r d i n g t o t h e i r d e t a i l i n g . The i n e l a s t i c a n a ly s e sa l s o i n d i c a t e d t h a t t h e r e l a t i v e l y s m a l l s t r e n g t h and s t i f f n e s s o f t h e
bo ttom two s t o r ie s re su l te d in a p a r t i a l s idesway co l la pse mechan ism
w h ic h c o n c e n t r a te d d r i f t s and i n e l a s t i c d e f o r m a t i o n s i n t h es e tw o s t o r i e s .
The d i sp l a ce m e n t s p r e d i c t e d b y t h e i n e l a s t i c a n a l y s e s , a l th o u g h g e n e r a l l y
la rg e r than those p re d ic ted by the e la s t i c a na ly ses , were sm a l le r than
the permanent d isp lace me nts observed in the b u i l d in g . On the o ther hand,
the i n e la s t i c response was found to be ve ry se ns i t i ve to the g round
m o t io n r e c o r d u s e d , a n d , i n p a r t i c u l a r , t o r e c o r d s t h a t c o n t a i n s e v e r e ,
l o n g - d u r a t i o n a c c e l e r a t i o n p u l s e s .
Base shears o f the b u i ld in g were ca lcu la t ed us ing e la s t i c an a ly
s i s w i th re su l t s i n d ic a t i n g va lues a t l ea s t 12 t imes des ign va lue . F rom
s uc h a l a r g e c a l c u l a t e d base s h e a r , one w o u ld g e n e r a l l y p r e d i c t t o t a l
c o l l a p s e o f th e m ain b u i l d i n g p a r t i c u l a r l y , when one c o n s i d e rs t h e l o c a l
c o n c e n t r a t i o n o f n o n l i n e a r i t i e s a t t h e b o tt om tw o s t o r i e s . Maximum s t o r y
shears were a lso ca lc u la ted f rom non l inea r dynamic analyses fo r d i f fe re n t
g round ac ce le r a t i on t im e h is to r i e s and found to be s i m i la r i n magn itude
desp i te o f the fac t tha t the t ime h is to r ies were sca led to peak acce le ra
t i o n va lues rang ing f rom 0 .4g to l .O g . From non l inea r a na ly s i s , the base
shear in the bo ttom two s to r ie s were ca l cu la t ed to be 4 t imes la r ge r than
the work ing s t re ss l ev e l s used in the des ign o f the b u i l d in g . The in e la s
t i c s he a rs w ere s i g n i f i c a n t l y s m a l le r t h a n t h e s t o r y s he a r f o r c e s p r e d i c t e d
us ing e l a s t i c methods. Th is base shear va lue o f 4 t ime s des ign appeared
to be more com pat ib le w i th the observed be ha v io r , nam e ly , s ig n i f i c a n t
dam age, y i e l d i n g and i n e l a s t i c b e h a v io r r e s u l t i n g i n n ea r c o l l a p s e .
Thus , the O l i ve V iew Ho sp i ta l rep re sen ts a case where e la s t i c
computed fo rc es were a t l eas t 12 t imes th e i r des ign va lue s . Fu r the rmo re ,
n o n l i n e a r i t i e s w ere c o n c e n t r a t e d at t h e lo w e r tw o s t o r i e s . V e ry s e ve r e
damage resu l ted .
A-14

8/22/2019 6848574
http://slidepdf.com/reader/full/6848574 224/394
Holy Cross Hospital - The Holy Cross Hospital was located in the
area heavily shaken by the earthquake approximately nine miles from the
ep ice nte r. The main bu i ld ing has a 7-s tory towe r, a 3-s tory wing to the
north and 1-story wings to the east and we st. A s in g le -s to ry basementwas b u i l t under the main tow er. The main fram ing of the 7-s to ry tower
consisted of concrete joists framed to beams or to walls along inter ior
column line s and to spandrels on the ex te ri o r column li n e s . On the n ort h
and south e xt e r io r w a ll s, spandrels were located on the in side edge of
the columns. The 1-story and 3- st or y wings were of s im ila r j o i s t and beam
con stru ctio n fo r f loo rs and ro o fs . The la te ra l force system consisted of
concrete shear w all s in each d ir e c t io n . As most shear wa lls were not
continuous from top to bottom, reliance also was placed on the concrete
fl o o r j o i s t and slab system actin g as a diaphragm to tra ns fe r shears at
po ints of d is c o n ti n u it y . The ho sp ita l was designed to a base shear of
approx imately 8 percent g ra v i ty .
Damage to the s tr u c tu ra l system of the main b u ild in g was qu ite
genera l , but more pronounced on the f i r s t 4 s to ri e s . The west shear w all s
were dis co ntin uo us below the second f l o o r . The diaphragms were inadequate
to re d is tr ib u te hor iz on ta l loads on the 2nd, 3rd and 4th f l o o r s , and were
damaged se ve rely in t h is are a. One of the west w al l columns was sha tte redat the t h i r d f l o o r . Each of the west shear wa ll elements exh ibit ed
cra ck ing . The lo ng itu di na l shear wa lls had numerous X-pa ttern f a i l u re s
over door op en ings . Excessive no ne la st ic movement of shear w al ls p ro
duced deforma tions large enough to cause po rtio ns of the ve rt ic a l load
fram ing system to act as a moment frame so th a t columns were ca rry in g
earthquake shears and moments. Due to de form ations in the tra ns ve rse
d ire ct io n s, the columns ex hib i ted shear crac k ing . In the lon gi tu din al
d ir e c ti o n , many ex te r io r spandrels were crushed in f le xu ra l compression
and the column covers were sh a tt e re d .
There were no accelerometers in or near the Holy Cross Hospital
complex. However, i t s loc at ion ind ica tes th at the ground shaking would
be between the in st ru m en ta l mo tion at th e Pacoima Dam and at th e Holid ay
A-15

8/22/2019 6848574
http://slidepdf.com/reader/full/6848574 225/394
Inn on Orion Bl vd. Peak ground ac celera tion at these sites were 1.2g and
0.25g, respe ctivel y. Using this information plus the observed perform
ance of the building itsel f, a peak ground accelerati on of 0.4g to 0.5g
was estimated for the site (Reference A - 6 7 ) .
Calculated earthquake forces for the main building using an
elastic model of the building indicate a base shear of app roxima tely
0.55g. As with the Indian Hills Medical C enter , respons e spec tra of the
Pacoima Dam (S74W) and the Holiday Inn, Orion Blvd. (NS) records were
scaled to the peak ground a cceler ation estim ates and were used to account
for spectral amp lification. In addition , ultimate capacities of several
critical shear walls were computed in the main tower struct ure. These
capacity calcula tions suggest a 15 percent gravity base shear would be
associated with major c rackin g.
Elasti c calculated ear thquake forces were 3 to 4 times ultimate
capacity and 6 to 8 times design. From such high forc es, one would
predict significant yielding , inelastic be havior, and structural dama ge.
Although significant damage was obser ved, collapse was not imminent. The
buildi ng met the basic intent of the code (i.e., no collapse under heavy
s h a k i n g ) . The shattered columns gave indication that damage would have
been greater had the high intensity of shaking occurred over a longer
time interval.
Thu s, the Holy Cross Hospital represents a case where significant
damag e, but no collapse occurred for elastic calculated forces 6 to 8
times design and 3 to 4 times ultimate capac ity.
Indian Hills Medical Center - The Indian Hills Medical Center
was located in the heavily shaken area, some nine miles from the
epic ente r. The building is a reinforced concret e structure of seven
storie s, about 80 x 170 feet in plan, with a complete load-carrying frame.
Concrete beams run north and south across the building. Typical floor
slabs span between girde rs. The exterior walls are light, curtain-wall
A - 1 6

8/22/2019 6848574
http://slidepdf.com/reader/full/6848574 226/394
construction ex cept where concrete shear wall s are located. These shear
walls are concentrate d toward the ends of the building. The building was
designed per the 1966 edition of the Los Angles code for a lateral base
shear of 4.5 percent gravity.
Some damage to shear walls was observed as cracks forming at the
horizontal co nstruct ion joints of floor lin es. There was evidence of
slight horizontal movement although these cracks were not related
directly to shear. The slabs, in some case s, also showed cracks. The
ends of shear walls were designed as columns and thu s, were subjected to
both shear and axial l oad s. Concret e in the splice area crumbled. All
shear walls in lower levels cracked in the typical X-pattern indicating
high shear stress. Damage was noted at interse ctions of girders and
w a l l s .
No strong-motion records were available at the building site.
However, based on the building location relative to the epicent er, the
nearby buildings studi ed, and its own observed p erfo rmanc e, the peak
ground motion was estimated to be between 0.4 and 0.5g (Reference A - 6 7 ) .
A linear elastic dynamic analysis was conducted of the building
to estimate earthquake force s. Time history motions considered were the
Pacoima Dam (S74W) and the Holiday Inn, Orion Blvd. (NS) records scaled
to the peak estimated acceleration for the site. This analysis,
accounting for spectral eff ect s, result ed in a calculated base shear of
35 percent gravity . In addi tion , ultimate ca pacities of several of the
critical shear walls in comp ressi on, tension and shear were computed
establishing an ultimate capacit y limit of about 10 percent gravit y or 2
times the design values.
Thu s, elastic calculated earthquake forces are 3.5 times
ultimate capacit y and 7 times design. From such high for ces , one would
predict significant yi eldi ng, inelastic be havior , structural damage, and
possibly the onset of collapse. Howev er, observations suggest the
building was not near collapse.
A - 1 7

8/22/2019 6848574
http://slidepdf.com/reader/full/6848574 227/394
Medical B ui ld in gs Near Hansen Lake - Four med ical b ui ld in g s
loc ate d near Hansen Lake were s tu d ie d . These are the Fo o th i ll Medical
Center, the Pacoima Lutheran Medical Center, the Golden State Community
Mental Health Center and the Pacoima Memorial Lutheran H o s p it a l. A ll are
loca ted about 8 to 9 m iles from the earthquake e pice nter and less than 1
m ile south of the nearest f a u l t break . There were no stro ng motion
instrum ents at any of the b ui ld in g s it e s . However, peak ground motion is
estimated to be about the same as that at Holy Cross Hospital and Indian
H il ls Medical Center ( i . e . , in the 0.4 to 0.5g range).
A ll four f a c i l i t i e s were designed to a base shear of about 13
percent g ra v it y . Except fo r the Golden State Center, a l l of the medical
bu ild ing s included design and co ns truc t ion fe ature s not consideredadequate under str ict interpretat ion of the Los Angeles Building Code.
These features were directly responsible for the type of damage observed
in the stru ctu re s. For example, a closer study of the Fo o th i l l Medical
Center showed tha t a 7 percent g ra vi ty l a te ra l load would be s u ff ic ie n t
to cause the f i r s t fa i l u r e of i ts bracing system.
The Golden State Center is considered to be properly designed in
tha t i t met the in te nt of the bui ld in g code. Calculated forces (viae la s t i c a nalys is and peak ground ac ce lera t ion ) would re s u lt in an ea rth
quake fo rc e le ve l perhaps 2 to 3 times th e Golden Sta te Center design
va lue . One would, th us , pre dic t onset of y ie ld in g , minor in el a st ic
beha vior, and ne g lig ib le s tr uc tu ra l damage except at the lo ca tio n of
improper design and con struct io n fea tur es . This pred ict io n is consistent
with the observed performance.
Low-Rise In d u s tr ia l and Commercial Bu ild in gs - The performance
of f i f te e n low -r ise i n du st r i a l and commercia l bui ld in gs were stud ied.
Th irtee n are one-story bu ildi ng s w ith wood roof systems, one is a
f i v e -s to ry mon ol i th ic concrete bu i ld in g, and one is a one-story bu i ld in g
wi th precast concrete roof and w al ls . A l l f i f te e n b ui ld ing s were located
between 8 and 17 mile s from the epic ente r and were b u i l t since 1 958. A ll
were designed by ap pli ca ble b ui ld in g codes. No reco rding s of the motion
A-18

8/22/2019 6848574
http://slidepdf.com/reader/full/6848574 228/394
at the b u il d in g s it e s were made. Peak ground mo tion was estim ated to have
been between 20 and 40 percent gravity with most buildings subjected to
40 perce nt g r a v i ty (Reference A -6 7) . P ri n c ip a l damage was due to heavy
v ib ra ti o n altho ug h th er e was some permanent ground disp lace m ent. The
la te r a l design for ce s f o r most bu ild in gs was about 13 percent of dead
l oad . Calculated forces using e last ic analysis procedure ( i . e . , response
spectra anchored to the peak acceleration estimates) would suggest
earthquake forces at least 3 to 6 times design . Thus, s ig n if i ca n t
y i e l d i n g , in e la s t i c beha vior, and s ig n if ic a n t damage would be predicted
from the ca lcu la te d loa ds . Observed performance var ied from moderate
damage to complete c oll ap se of the s tr u c tu re s . Much of the damage was
the resu l t o f lack o f cont inu i ty ( i . e . , stre ng th cap acity ) between the
w al l and the ro of systems. Several w all shear fa il u r e s were caused by
lack of a b i l i t y to re s is t out-of-p lane earthquake for ce s. Performance of
the bu i ld ing s was stro ng ly inf luenc ed by th e ir capacity fo r energy
absorp t ion and duc t i l i t y .
Implications - The San Fernando earthquake subjected a variety
of structures to ground accelerat ions that equaled or exceeded their
design v alue s. Many en gin ee rin g analyses were performed to compare both
ca lcu lat ed and actua l respon ses. In those cases where an e la s ti canalysis calculated base shear forces only moderately greater than the
structures design values, good correlation was seen between predicted and
observed beha vior. Both pre dic ted and ac tual performances of these
structures ranged from no damage to moderate cracking and yielding of
s t ructura l e lements.
In those cases where an e la s ti c an aly sis ca lcu lat ed base shear
forces much grea ter than the str u ct u re 's design valu e, the p redicte dexte nt of damage s i g n i f i c a n t l y exceeded observed response. Tota l
collapse would be pre dic ted f o r some st ru ct u re s , yet actua l performance
ranged from no damage (VA Building 41) to signif icant yielding and
in e l as t ic response (O l ive V iew, Ho ly Cross, Ind ian H i l l s ) .
A-19

8/22/2019 6848574
http://slidepdf.com/reader/full/6848574 229/394
Ine last ic ana lys is incorpora t ing non l inear mater ia l p roper t ies
were performed on several stru ctu res in an e ff o r t to rec on cile the
diffe ren ce s between ca lcu late d el a s t i c response and actual b ehav ior. The
in e l a s t i c an aly sis method produced lower base shear for ce s and gave a
bet ter corre lat ion with observed structural performance.
In the absence of design or construct ion deficiencies which
would resu l t in reduced duct i l i t y o r energy absorp t ion capab i l i t y , the
fo llo w in g general observations could be made:
1 . For the Veterans Ad m inistra t ion H ospita l Bui ld ing #41 ,e s s e n ti a l l y no s tr u ct u ra l damage occurred even though thef ixed base, l inear e last ic calculated forces exceededdesign forc es by a fa c to r grea ter than 10 and exceeded theestimated ul t im ate capa cit ies by a fa ct or greater than 3.This st ru ctu re was a s t i f f st ru ctu re (s im i la r to manynuclear power p lant st ructures) subject to substant ia lnon l inear so i l s t ruc ture in te ra ct io n e f fe ct s . Thebene f ic ia l e f fec t of non linea r so i l - s t ru c tu re in te rac t ionef fe cts and pa r t ic u l a r l y good st r uc tur a l de ta i l in g havebeen judged to be responsible for the very good performanceat high fo rce l ev e l s .
2. High-r ise bui ld ings (not s imi lar to nuclear power p lants)
tended to show no damage at elastic calculated force levelsup to 2 t imes t h e ir design le v e ls ; minor s tr uc tu ra l damageat e la s t i c calcuated forces up to 3 t imes des ign; andst ru ct ur al y ie ld in g and su bs tant ia l no n-s truc tura l damagebut no su bs tan t ia l st ru ct ur al damage at e l a st ic calc ulate dforc es 5 t imes d esig n. I t should be noted tha t the designca pa city is based on working s tres s design and th a t t heest imated actual u l t imate capacity is general ly about twicethe design ca pa ci ty . Thus, minor s tr u c tu ra l damage mightbe expected at 1.5 t imes the ult imate capacity, while nosu b st an tia l s tr u c tu ra l damage would be expected at 2.5times ul tim at e ca pa ci ty . The Holy Cross Ho sp ital showeds ig n if ic a n t s t ru ct ur al damage but no col lapse at e la s t i ccalc ulate d forces 3 to 4 t imes the u l t ima te cap acity .However, collaps e is l i k e l y to have re su lte d i f theduration of strong shaking had been longer.
3. Very s ig n if ic a n t str uc tu ra l damage occurred at the O liveView Hospital at elast ic calculated forces greater than 12times d esig n. However, th i s damage was he av ily influ en ce dby the fact that nonlinear behavior was concentrated at thelower two floors as opposed to being spread uniformlythroughout .
A-20

8/22/2019 6848574
http://slidepdf.com/reader/full/6848574 230/394
The S a n Fernando data illustrate t h e importance of designing
adequate ductility into the structural system and the importance o f n o t
overdesigning t h e strength of a portion o f t h e structure s o a s t o
concentratet he
nonlinearities into localized "weak-link" regio ns.So
long as these principles are obse rved , these data illustrates that t h e
onset o f significant structural damage should not occur at elastic
calculated force levels less than 2.5 times t h e ultimate capacity f o r
ground motion similar to that recorded f o r t h e S a n Fernando earthquake.
Because of nonlinear soil-structure interaction, t h e actual performance
might be substantially better than indicated by this 2.5 factor. These
data clearly illustrate that elastic response cannot be correlated with
damage unless the inelastic energy absorption capability (ductility) o f
properly designed structures is considered. T h e elastic computed
response must be reduced by a factor o f approximately 2 .5 o r greater if
it is to be compared with t h e ultimate c apacity for t h e purposes of
predicting t h e onset of significant structural damage f o r a properly
designed structure subjected t o S a n Fernando type ground moti on.
A.3.2 Managua , Nicaragua, Earthquake, 1972
(A-26, A - 3 0 , A - 4 0 , A - 4 2 , A- 111, A-112. A-113)
On December 23 , 1972, a moderate magnitude earthquake (M^ = 6.2 )
occurred i n Managua. Loss of l i f e approached 10,000 , appro ximate ly 57
percent of the city's 450,000 occupants were rendered homeless, property
damages are estimated to be about $1 b i l l i o n . The hypocenter of th e main
shock was located in an area approximately coinciding with downtown
Managua at a depth of 2 to 8 ki lo m e te rs . Only one accelerometer rec ord
was obtained at the ESSO r e f in e r y which was app roxim ately 3 m iles from
the f a u l t tra ces and the ci t y of Managua. Peak recorded ac ce ler atio ns
were 0.39g EW, 0.33g NS and 0.31g v e r t i c a l .
From the re su lts of seismoscope records throughou t the c i t y ,
ob se rva tion of damage, and the estimated lo ca tio n of the hypocenter, i t
fo llo w s th a t the ground motion in ce nt ra l Managua was more inten se than
th at recorded at the r e fi n e r y . Peak ac ce ler atio ns have been estimated at
A-21

8/22/2019 6848574
http://slidepdf.com/reader/full/6848574 231/394
0.5 to 0.6g. A maxi mum MM intensit y of nearl y IX was estimated in the
central downtown area where much damage was observed. Other areas of
concentrated damage were the heavily populated northwestern part of the
city and in the popula ted, industrial areas to the northea st. In the
vicinity of the ESSO refine ry, intensity values of V to VI were estima ted.
Structures in Managua were predominan tly one-to-two stories with
some taller buildings up to eight stories in height. The type of con
struct ion in the city can be describ ed accordin g to height rather than
func tion . Low-rise structures were dominated by taquezal type construc
tion - adobe bricks filling a light timber frame work . Suburban hou sing
typically consisted of reinforced maso nry or concrete walls with heavy
reinforced concrete roof slabs. One-st ory factori es and wareh ouses were
also constructed in this man ner . Taller structures consisted primaril y
of reinforced c oncre te. The range of actual base shear strength
coefficients was wide . On one extreme were institutional bui ldin gs,
heavy but with considerable wall area. At the other extreme were light,
modern buildings.
Severe damage and collapse were generally confined to those
structures with taquezal, concrete, and unreinforced masonry construction
that lacked adequate lateral force resi sta nce . These buildings are
inherently quite weak and heavy enough to generate large lateral forces
under earthqua ke shaking. There were examples of moment resist ing
unbraced frame structures for which the structure endured the ea rthquak e
without severe damage but experienced motions great enough to cause
extensiv e proper ty losses and loss of func tiona lity . Shear wall frame
buildings were much stif fer; the limited deformations resulted in very
little property loss or loss of funct iona lity. Howe ver, some of these
showed sufficient structural damage to question their safety for an
earthquake of equal intensity but longer dura tion.
A variet y of industrial fac ilities were located in Man agu a.
Damage to these facilities varied with dista nce from the fau lt, type of
const ructi on, and the extent to which earthqua ke-resi stive details were
engineered into their desig n.
A - 2 2

8/22/2019 6848574
http://slidepdf.com/reader/full/6848574 232/394
ESSO R e fin er y - The ESSO R ef in e ry was designed and b u i l t in two
d if fe re n t stages in the mid 1950's and ea rly 1 960's. Plant stru ctu res
include v e rt ic a l vessels of various h eights and slenderness, pumps,
generators, heat exchangers, p ip ing systems, tanks, foundat ions, etc.
The design met requirements of the Uniform Bu ild in g Code. A ll d e ta il in g
ref lected the U.S. design procedures in effect at the t ime of design.
All equipment was tied to its foundation, piping systems were braced,
et c . In 1968, a smaller earthquake caused some d i f f i c u l t i e s at the
p la nt . Consequently, port io ns of the pla nt were redesigned to withs tand
a peak ground ac ce le ra tio n o f 0.2 g. On the a verage, however, the design
base shear c oe f f ic ie nt at the f a c i l i t y was about 0.10 to 0.1 3g.
The peak recorded ac ce le ra tio n a t the si t e was 0.3 9g. The highamplitude portion of the motion lasted for about five seconds with a
nominal acc ele ra tio n value of about 0.2 g. Ground motion of a lon g-p erio d
nature fo ll o w e d . Much of the equipment and low-h eight str uc tur es at the
s i te have re la t i v e ly h igh natura l f requencies. The t a l l f ra ct io na t ing
tow ers, rea ct or s, and o i l heaters are cha racte rized by low freq ue ncie s.
The nature of the ground shaking was such that most structures and
equipment would see some response amplification over the ground
a cc e le ra tio n. The peak ground ac ce ler at ion was over 3 times the average
design base shear c o ef f i c i e n ts . Consider ing spec tra l am pl i f i ca t io n, the
e la s t i c computed for ce s would be expected to have been at le as t 6 times
the average design base shear and at l ea st 3 times the yi e ld ca pa cit y.
Damage at the r e fi n e ry was minimal and lim it e d pr im arl y to
grouted pads, concrete block w a ll s , and some ste el cross brac ing . A fte r
performing analyses, Blume (A-26) noted that even when the earthquake
demand on the p la nt was over t hr ee times y ie ld capac it y , damage was
i n s i g n i f i c a n t .
A-23

8/22/2019 6848574
http://slidepdf.com/reader/full/6848574 233/394
ENALUF Thermal Pla nt - The ENALUF f a c i l i t y is a thr ee u n i t ,
o i l - f i r e d p lant with a to ta l c apa city of 90 MW(e). At the s i te were
modern tu rb ine gen era tors, a,group of six dies el gen erators of
app roxim tely 1 MW(e) each, a 138/69-KV transm ission su bs ta t io n, a
69/13.8-KV d is t r ib u t i o n sta t io n and an indoor switching s ta t i o n . The
pla nt was rep or ted ly designed to a la te ra l force of O.lOg.
The ENALUF f a c i l i t y was located w ith in 0.15 miles of th e
p r i n c ip a l f a u l t . A peak ground acc elera t ion at the s i t e was est imated at
0.6g - si x t imes the design le v e l. Any e la s t i c ana lysis techniques based
on the ground excitat ion would give calculated forces much greater than
yi e l d capa ci ty . S ig n i f ic an t y ie ld ing wou ld be pred ic ted .
O ve ra ll damage to the plan t was s l i g h t . Some of the wors t
damage occurred to unanchored equipment which was free to displace or
f a l l . Equipment attached to the floor was not affected by the
earthquake. Piping throughout the pla nt struck platform s or equipment.
U su al ly, the pip e's lagging and thermal in su la t io n were crushed , but the
pipe i t s e l f was undamaged.
Im p li ca ti ons - Both the ESSO R ef in er y and the ENALUF the rm alplant provides examples of engineered structures subjected to strong
ground sh ak ing . Ca lcula ted earthquake forc es based on ground acc ele ra
t io ns w ould fa r exceed estimated ca pa cit ie s (by fac tor s of 3 to 6 or
more) . Aga in , e l a st ic ana lys is w i thout accounting fo r the i ne la st ic
energy absorpt ion c ap ab i l i ty would re s u lt i n a poor co rr e l at io n between
pre dic ted and observed s tr u c tu ra l performance.
A.3 .3 Kern County, C a li fo rn ia Earthquake, 1952
(A-32, A-137, A-138, A-139, A-140)
The Kern County area of C a li fo rn ia was sub jecte d to stro ng
ground shaking from the major J ul y 2 1 , 1952 Kern County (Arv in-Te hac hap i)
earthquake ( M L = 7 .2 , Ms = 7.7) and a se ries of r e la te d earthquakes and
aftersho cks tha t fol l ow ed . The epice nter was located about 26 miles
A-24

8/22/2019 6848574
http://slidepdf.com/reader/full/6848574 234/394
south of B ak er sf ie ld and 4 m iles west of Wheeler Ridge . The shock was
f e l t over 160,000 square m ile s. Another stron g shock, August 22, 1952,
had a more loc al e f f e c t . I t caused cons iderable damage to B ake rsfie ld
and immediate v i c i n i t y and was f e l t over 40,000 square m ile s.
There were no strong motion accelerometer stations in the
ce n tra l area to record the ground m otio n. The nearest s ta tio n was at
T af t about 25 m iles from the f a u l t ru p tu re . The maximum peak
ac ce lera tio n was 0.20 g. Strong motion (>0.1 g) la ste d more than 12
seconds. The instru m en t s it e has been assigned a MM i n t e n s i t y o f V I I .
In areas of higher intense shaking (MM in te n s it y V I I I and IX ), c lose r to
the fa u l t ru pt ur e, the ground mot ion is est imated to be s ig n i f ic a n t l y
greater than 0.20g.
The earthquake occu rred near a pop ulated a rea . Con seque ntly, a
la rge var ie ty o f res id e n t i a l , pu b l ic , commercia l and ind us t r ia l s t ruc tures
were af fe ct ed . Co nstruction m ate r ial used in these stru ctu res included
wood, both reinforced and unreinforced masonry and concrete, and steel.
In g en era l, damage to b u i ld in g s, e levated water tan ks, and other str uc
tur es fol lo we d the patt ern t ha t stru ctu res performed we ll when earthquake
prov isions were incorpo rated i n th e ir design . Poorly designed and con
stru cte d bui ld ings were the f i r s t to su ffe r severe damage or co l lap se .
Relatively few wood frame structures were seriously damaged.
Those th a t were h ea vi ly damaged were thrown o ff fou nd atio ns because of a
lack of brac ing or su ff ic ie n t bo l t in g to foundat ion w al ls . In the region
of stron gest sh aking, un reinforce d b r i ck , concrete block and adobe stru c
tures were severely damaged; however, the performance of reinforced
concrete block and re in fo rc e d , grouted br ick was good. Small ste el
structures such as gasoline stations suffered no damage, although somehigh-r ise steel structures suffered minor damage.
There were several r e fi n e r i e s subjected to strong shaking. The
o v e ra ll behavior of re fi n e ri e s was good and damage was s l i g h t . This can
be attr ibuted to the general use of steel piping and good anchorage of
A-25

8/22/2019 6848574
http://slidepdf.com/reader/full/6848574 235/394
equipment. Most p ip ing breaks occurred due to lack of f l e x i b i l i t y or use
of cast i r o n . Breakage in ste el underground pip in g was li m it e d to a few
cases in very poor s o i l .
Kern County Steam Plan t - The Kern County Steam Pla nt was b u i l tin 1947-48 and has a capacity of 175 MW in two un i ts . The pr in c ip a l
bu ild in g is construc ted of stee l frames and concrete w a ll s . The pla nt
b ui ld in g and associated equipment re prese nt a wide range of fundamental
f requ enc ies. A l l st ruc tures w ith in the p lant were designed fo r a la te ra l
for ce of 20 percent g ra v i ty . For th is design le v e l, the onset of
y ie ld in g is est imated at base shears of 40 to 60 percent of i t s we ight.
This p lant i s located about 15 miles from the fa u lt ru pt ur e. Att h i s lo c a ti o n , peak ground motion was estim ated t o be between 0.3 and
0.4 g. The fundamental frequ enc ies of the plan t str uc tu re s should cover a
wide range. Estimated earthquake forc es using e la s t i c response (spectrum)
analysis should re su lt in some plant st ru cture s having a calc ulated forc e
of at least two to three times greater than the above estimated yield
le v e ls . Y ie ld in g of major st r uc tu ra l e lements in the p lant would then be
pr ed ic te d. However, damage to the build ing s was ne g lig ib le suggesting
th a t i f an e la s t i c analys is had been used to ca lcu lat e earthquake fo rc es ,
the loads would have been signif icant ly overest imated.
Elevated W ater Tanks - A water tank at th e Maricopa Seed Farms,
100,000 gallo ns in c apa city and 100 fe e t in h ei gh t, was sub ject to stron g
shaking estimated to be about 0.25 to 0.3 g. This tank was loca ted about
20 m iles from the f a u l t r u p tu re . The tank was designed to a value of
O. lg . Even ignor ing poss ib le spect ra l am pl i f ic a t io n e las t ic ana lys is
would re su lt i n calcu lated forces in the tank fa r greater than i t s design
ca pa city . S ig ni f ic a n t damage would be pr ed ic te d; y e t, none occ urre d. A
similar tank at nearby Di Giorgio Farms, designed to 0.12g and subjected
to strong shaking a lso suf fered l i t t l e damage. For both tank s, e la s t ic
analysis would overestimate earthquake forces actually seen by the
s t ru c t u re s .
A-26

8/22/2019 6848574
http://slidepdf.com/reader/full/6848574 236/394
Implications - The overall pe rformance of structures during this
earth quake points to the importance of energy absorption and ductility in
the response behavor of structures (e.g., brittle structures suffered the
greatest d a m a g e ) . The observed performance of the Kern County steam
Plant and elevated tanks show that calculated earthquake forces based on
elastic analysis overestimate actual forces. Thus, their predicted
performance did not correlate with observed behavior.
A.3.4 Santa Barbara , California Earthqu ake, 1978
(A-64, A-119, A-120, A-160)
A moderate earthquake ( M L = 5.1, Ms = 5.6) struck the Santa
Barbara-Goleta area on August 13, 1978. The earthquake was centered in
the Santa Barbara Cha nne l, 5 to 8km south of downtown Santa Barbara. The
resulting ground motion displayed a marked directional asymmetry which
had an important bearing on overall effects of the earthq uake. This
asymmetry caused the mos t intense ground moti on in the Goleta area even
though Santa Barbara is closer to the epicen ter. A maximum MM intensity
of VII is reported near the Universit y of Califor nia Santa Barbara (UCSB)
campus located in Gole ta. The focal depth was estimated at about 13km.
The fracture apparently propagated from the epicenter laterally west -
northwest toward Goleta for a rupture length of about 8km with a terminus
about 4km from the UCSB campu s.
Several strong motion accelerometers recorded the ground
mot ion . In Santa Bar bara , strong motion was recorded at the base of the
Freitas Building and also the Santa Barbara Courtho use. A peak value of
0.23g was recorded . A Goleta Substation of the Southern California
Edison Company recorded 0.29g. Two recordi ngs were made on the UCSB
campus near Building 340 and at the base of North Hall. The recorded
accel erati on at North Hall had a peak value of 0.42g. Duration of
strongest shaking was about 2 to 3 seconds.
A-27

8/22/2019 6848574
http://slidepdf.com/reader/full/6848574 237/394
As would generally be expected because of the more severe
shaking, structures in Goleta suffered more damage than those in Santa
Barbara . Most of the major stru ct ur es loca ted i n Goleta are on or near
the UCSB campus. These inclu de d a number of re in fo rc e d c oncre te shear
w all bu i lding s up to 8 sto rie s in h eight locate d on the campus, several
larg e s te el frame hangars and a co nt ro l tower at the adjacent m unicip al
a i r p o r t , a pa i r o f h igh -r ise re in forced concrete shear wal l dorm i tor ies
west of campus, and a number of long low -r is e (1 -3 st o ri e s ) commercial
bu ildin gs n or th of campus. The major rema ining buil din gs i n the Goleta
area co ns ist of co nve ntiona l 1-3 s to ry wood frame apartment bu ildin gs and
duplexes locate d in the area west of campus. F in a l l y , there are several
mob ile home parks i n the area loca ted e as t, n o rt h and west of campus.
Except f o r a few o ld wood frame and adobe st ru ct u re s (m os tly farm houses)
the bui ld ing s in Goleta are r e la t iv e ly modern. The m aj or i ty have been
constructed wi th in the la st 20 to 30 yea rs.
Several of the m u l t i - s t o ry , reinfo rce d concrete bu i ld ings on the
UCSB campus rece ived moderate diagonal cra ck ing of shear wa lls in the
lower st o r ie s . Some of the ro o f- to p mechanical equipment were sev ere ly
a f f e c t e d , and instruments and supplies were destroyed in some
lab or ato r ies . Damage to l ig h t f i x tu re s , ce i l i n g s , and p las ter occurredthrou ghout the campus. The t o t a l ea rthquake damage to s truct u re s and
bu ild in gs on the UCSB campus was estimated at $3.4 m i l l i o n . Of th is
t o t a l , only approximately $300,000 was a tt ri b u te d to s tr u ct u ra l damage.
Just no rth o f the UCSB campus ther e are n ea rly 100 bu il d in g s .
The bui ldin gs comprise a m ixture of hangars and sin gle sto ry o ff ic e
service b u i ld in g s. The m a jo ri t y of the bu i ldin gs are wooden and of World
War I I v in ta ge . Most of the damage was a r c h it e c tu r a l. The most nota bles tr u c tu ra l damage was lim it e d to two hangars and the a ir p o rt co nt ro l
tow er. Both are ste el frame st ru c tu re s . They su ffe re d permanent
deform ations. With these exceptions., the remaining st ru ct u ra l damage
consisted of cracked concrete f loor slabs in two bui ldings and shifted
wood columns i n one o f them. There was e s s e n t ia ll y no damage to
A-28

8/22/2019 6848574
http://slidepdf.com/reader/full/6848574 238/394
el ec t r i ca l serv ice f a c i l i t i e s . S t ruc tures in the Santa Barbara area
disp lay a wider va r ia t io n of a rc hi te ct ur e , and con struct ion than those in
Go leta . However, damage to these stru ctu re s was com paratively m inor.
North Ha ll (UCSB) - North H all is a rectan gu lar th re e- sto ry
re in forced concrete shear wal l s t ru c ture o r i g in a l l y b u i l t w i th a
de f ic ien cy in i t s la te ra l res istan ce . Thus, concrete shear wa l ls were
'added to make the structure meet the 1976 edit ion of the Uniform Building
Code. As previously indicated, the bui ld ing was inst rumented with
strong-mo tion accelerometers during the earthquake. The base ac ce lera t ion
in the tran sve rse d ir e c ti o n was about .40 g. There was also another
intrument w hich measured approximately .65g on the t h ir d f l o o r , and the
ro of rec ord reached I g . These motions im ply a base shear of 50 to 70
percent of the weight of the s tr u c tu re ; yet the damage to the bu ild in g
consisted only of l ight - to-moderate X-cracking in the concrete shear
w a l l s .
Im plic at io ns - Although the lev el of ground shaking was quit e
h i g h , l i t t l e s t r uc tur a l damage occurred to engineered s t ruc ture s .
Performance pre dic t ion s based on earthquake forces lev els from e la s t i c
ana lysis would have pre dicte d much grea ter damage. In p a rt ic u la r,calculated earthquake forces at North Hall based on the measured
acceleration would clearly have predicted damage, yet none was observed.
Second ly, the damage was less at G oleta f o r 0.25 to 0.45g ground
ac ce lera tion s than occu rred in San Fernando w it h in these same ground
acc elerat ion regio ns. Thus, the in e la s t ic energy absorpt ion ef fec ts
indi ca ted by the San Fernando da ta , would have to be even grea ter at
Go leta to account fo r the sma ll amount of observed damage. In oth erwords, the shorter duration Goleta records resulted in less damage than
the longer du ra tio n San Fernando reco rd s, fo r the same ground
ac c e le r a t i on .
A-29

8/22/2019 6848574
http://slidepdf.com/reader/full/6848574 239/394
A.3.5 Impe ria l Va l ley , C a l i fo rn ia , Earthquake, 1979
(A-35, A-36. A-37, A-38, A-125, A-127, A-128, A-129)
On October 1 5, 1 979, a moderate earthquake ( M L = 6.6, Ms = 6.9)
shook the Impe ria l Val ley of C a l i f o rn ia . The cen tra l region of Im peria l
Valley extending from Brawley to Calexico is estimated to have had ground
motion associated w ith a maximum MM V I I . The d is tr ib u ti o n of strong
ground shaking was about the same in El Centro, Imperial, Calexico, and
Brawley, the four communities most affected by the earthquake.
The area was w el l instru me nted by a network of str on g-m otio n
accelerometers. In several instanc es, peak v e rt ic a l a ccele rat ions were
considerably higher than horizontal accelerat ion values (for example, at
S ta tio n No. 2, a 1.74g ve r ti c a l ac ce ler ati on was re co rd ed ). The maximumpeak recorded horizontal acceleration was 0.81g at Bonds Corners which is
loca ted about 2km from the ep ice nter and caus ative fa u l t . El Centro
experienced ground motion in the 0.2 to 0.5g range. Im pe rial Va lley
College 0.52g , Brawley 0.22g , H o lt v i l le 0.26 and Calexico 0.28. Sta t ion
No. 9 in El Centro is the same location where the 1940 El Centro record
was take n. I t is 6km west of the Im pe rial Fa ul t and also 1km from the El
Cen tro Steam P la n t. Peak acce le ra tio ns were 0.40g NS, 0.27g EW, and 0.38
v e r t i c a l . About 0.83km SE of the p la nt another str on g-m otio n instru m ent
recorded 0.51 g NS, 0.37g EW and 0.93 v e r t i c a l . With onl y a few excep
t i o n s , pa rt ic u la r l y tha t at Bonds Corners, the durat ion of st rong shaking
( i . e . , grea ter than O.lg) was very sh o rt . Bonds Corners stro ng shaking
la st ed about 13 seconds.
Earthquake damage and e ffe ct s in the Imp eria l V al le y va ried
gr ea tly in th e ir occurrence and d is tr ib u ti o n . The damage consisted of
par t ia l ly co l lapsed unre in forced br ick wa l ls ; cracked corn ices, parapets
and gab les ; a few damaged chimne ys; d is p la y windows broken or sh a tt e re d ;
plas ter cracked and f a l l e n ; sect ions of suspended c e i l in g t i l e s d isplaced
or fa l l e n ; shelves, and considerable q ua nt i t ie s of g lassware, d ishes , and
small objects f a ll e n and broken.
A-30

8/22/2019 6848574
http://slidepdf.com/reader/full/6848574 240/394
Wood frame stucco d w e ll in g s , some as clo se as 30 to 150 meters
from the f a u l t ru pt ur e had ve ry minor damage. The most he av ily damaged
modern building was the Imperial County Services Building in El Centro, a
six-story reinforced concrete frame shear wall structures designed under
the 1967 pro vis ions of the UBC. Excluding th is b u il d in g , the most severe
damage in Brawley, Calexico, El Centro, and Imperial was to low-rise
unreinforced b r ick bui ld ings and to a few low-r ise re in forc ed concrete
frame buildings constructed before the 1940 El Centro earthquake.
The Im pe ria l Va lle y College had a rec ord ing of 0.52g . The
m aj or i ty of bu i ld ing s on campus are low, one-s tory stru ctur es with
rei nfo rc ed concrete block w alls and metal deck ro o fs . Bu ildings are of
recent c o ns tru c t io n, probably less than 10 years o ld . St ruc tur al damage
was minor and t y p ic a l of damage observed in prev ious earthq uakes.
There was some ele va ted w ater stora ge tanks in or near the
c i t i e s of Brawley, Im pe ria l, El Centro and Ca lex ico . Most experienced no
damage. Two suf fe re d mino r t o moderate damage in the form of buckled
braces and to rn gusset p la te s ; one tank colla pse d and ru p tu re d. Ground
supported ste el storage ta nk s, in g en era l, performed very we ll except fo r
those with height to diameter rat io s grea ter than one. As these tankswere not anchored down, the y rocked and l i f t e d o ff th e ir foun datio n pads
re su lt i n g in seam ru ptu re s, p ip ing fa i l u r e s , and compression buck l ing.
Imperial County Services Building - Although the intensity of
shaking in El Centro was V I I , the Im pe rial County Service s B uil din g was
assigned an in te n s it y IX. Completed in 1971 , the si x- st o ry re in force d
concrete frame and sh ea r-w all st ru ct ur e was designed per UBC (probab ly
fo r a base shear of about 13 percent gr a v it y ) . Although seve relydamaged, the b ui ld in g did not c ollap se but was subsequ ently demolished
because of the ea rthquake damage. The major damage to the b u il d in g was
the fa il u r e of the four re info rc ed concrete support columns on the east
sid e of the b u il d in g . The con crete a t the base of the columns on one
side of the b ui ld in g was sha ttered and the v e rt ic a l rei nfo rc ed beams were
seve rely bent. The p a rt ia l colla pse of the support columns allowed
A-31

8/22/2019 6848574
http://slidepdf.com/reader/full/6848574 241/394
the eastern extr em ity of the bu i ld in g to sag about 1 f o o t . In the upper
leve ls of the b u i ld in g , the south ex te r io r w al l was ex ten sive ly cracked
near the window fram es. A ls o , the re was p a r t ia l se pa ratio n between
f loors , wal ls , and ce i l ings ; fa l len suspended ce i l ing t i les ; damage to
in te r io r w a l l s ; and o f f i ce fu rn i tu re sh i f ted o r over tu rned . A shear wa l l
system was used to r e s i s t NS motion and a frame system used fo r EW
fo rc e s . At the east and west ends of the b u ild in g above the second
f lo o r , the ex te r io r consisted of rein forc ed concrete shear w al ls . The
ground st or y had fou r w al ls r e s is t i n g NS fo rc e s. The second f l o o r slabs
tra ns fe rre d shear forc es from the end w alls in the second stor y t o
in te r i o r w al ls in the ground st or y. A thi ck er s lab at the second f l o o r
was used to aid the shear tr a n s fe r. The foun datio n con sisted of p i l e
caps re st in g on tapered p i l e s .
Sixteen accelerat ion records were obtained at the bui ld ing
s i t e . Three were f r e e - f i e l d . Peak ground acce lera tions were 0.29g NS
and 0.32g EW. Mo tion measurements in d ic a te d b u il d in g pe riod s were 0.62
seconds i n th e EW d ir e c t io n , 0.44 seconds in t he NS d ir e c ti o n and a
to rs io n mode pe riod at 0.35 seconds. Much in e la s ti c behavior was also
noted. Peak measured roof acc el er a tio n was 0.48g EW.
El C entro Steam P lant (See Appendix E) - The El Centro Steam
Plan t i s located i n the no rtheast po rt io n o f El Cen tro, about 25km from
the ep icenter and 5km from the causa tive fa u lt fo r the 1979 earthquake .
The NS component of the ac ce ler at ion rec ord fro m USGS re co rd ing s ta ti o n
5165 which was lo ca ted less than 1km from the steam pla n t had a peak
recorded acc ele ra tio n of 0.49g NS. In sp ite of the high ground
acce lerat ions at the plant s i t e , no s ig n i f i c a n t s tr uc tu ra l damage
occurred to the plant.
The El Centro Steam Plan t has fou r u ni ts th at burn o i l or
na tu ra l g as. U nits 1 , 2, and 3 were designed by Gibbs and H i l l and b u i l t
in 1 949, 1952 and 1 957, re sp e ct iv e ly . U nit 4 , the newest and larg es t
w i th a 80-MW e le c tr ic ou tpu t, was designed by Fluor co rp ora t ion , L t d . ,
A-32

8/22/2019 6848574
http://slidepdf.com/reader/full/6848574 242/394
and b u i l t i n 1968 . Combined ou tpu t of a l l fo u r u ni ts i s 174 MW. Each
un it of the p lant i s s t r u c tu ra l l y independent and contains three st ru c
tu r es : a tu rb in e bu i ld in g , a tu rb in e pedesta l and a bo i le r s t r uc tu re .
So il at the s it e con sists of very deep a l lu v i a l deposits composed of
s t i f f to hard c lays in te r l a in w i th laminat ions o f s i l t y c lay loam.
Un its 3 and 4 were o pe ratin g when the earthquake o cc urr ed .
Un its 1 and 2 were down fo r maintenance. The op era ting un its tri pp ed o ff
l in e when s ta t io n power was l o s t . Un it 3 was restore d to servic e w it h in
15 minutes a fte r the main shock. U nit 4 was resto red to se rvice w ith in
two hours. Several of the references c ite d rep ort the de tai led ea rth
quake ef fe ct s on the p la n ts . In ge ne ra l, only minor damage was observe d.
There was a great deal of motion at the s i t e , and vario us tr ac es of the
motion were observable, e.g., skid marks of reheater feet, bent seismic
sto ps , e tc . There were"some equipment f a i l u r e s ; leaks occurred in the
water supply for the hydrogen coo lers ; a two- inch pipe f a i l e d ; a buckl ing
fa i l u r e occurred in an o i l storage tan k; o ld wooden forced dra f t coo l ing
towers sustained damage to the wooden structure; and a l ightning arrester
broke o ff a tran sfo rm er. St ru ct ur al damage was l im ite d to buck ling of
bracing members in the bo ile r st ru ct ur e s.
The seism ic design basis of U nits 1 , 2 and 3 is unknown. Review
of the pro je ct s pe ci f ic a t io ns f o r U n i t 4 ind ica tes tha t the s tee l f raming
was designed fo r a la te ra l s ta t i c eq uiva lent seismic load ing of 0.2g
(dead and l i v e loa ds ). The Un it 4 tur b in e bu i ld i ng is a mom ent-resist ing
ste el frame w ith rei nfo rce d concrete shear w al ls on 3 si de s. The boi le r
st ru ctu re is a braced ste el frame wh ile the turb ine pedestal is a r e i n
forced concrete frame tha t supports the tu rb in e ge nerator. The pedestal
shares a box-girder foundat ion with the turb ine bui ld ing and boi lers t r u c t u r e .
Analyses o f U nit 4 o f the steam pla nt have been re po rte d i n
References A-37 and A-1 28. Both analyses of th e Unit 4 st ru ct u re were not
conducted for the expressed purpose of correlat ing predicted structural
A-33

8/22/2019 6848574
http://slidepdf.com/reader/full/6848574 243/394
damage w ith observed s tr u c tu ra l damage. The an aly sis pre sented i n
Reference A-37 was conducted for the purpose of estimating equipment
response le ve ls , th us , the st ru ct ur al model was gr ea t ly s i m p l i f ie d . The
an alysis presented in Reference A-128 u t i l iz e d a general three-dim ensiona l
repre sen tat ion of the Uni t 4 st ru ct u re , but considered the founda t ion to
be f ix ed -bas e , t hus , i gno ri ng s o i l - s t ru c tu r e i n t e rac t i on e f f e c t s . I t
should be noted that the purpose of the analysis conducted in Reference
A-128 was to demonstrate th at a p a rt ic u la r set of con serva tive design
c r i t e r ia would y ie ld analysis res ul ts which would grea t ly overpredic t the
observed st ru ct u ra l response leve ls of the Un i t 4 st ru ct u re .
Since por t ion s of the Un it 4 str uc tu re were designed fo r a
s t a t ic 0.2g la te r a l forc e and yet the observed damage fo r a recordedground mot ion, character ized by a 0.5g peak accelerat ion, was s l ight, the
Un i t 4 str uc tur e was selected to be inve st igate d in de ta i l as part of
th is stud y. This inv es t ig at ion is described in Appendix E. In ge ne ral ,
the resul ts of this study indicate that the concrete shear wal ls , which
were not considered as part of the design lateral force system, actual ly
ca rr ie d much of the la te r a l fo r c e . Thus because of the presence of these
shear wal ls, the basic response of the turbine bui lding remained within
code l i m it s fo r the 0.5g ground motion due to the p a rt ic ip a ti o n of thesew alls in the ov e ra l l l a te ra l response. However, the re were loc al regions
in which the calculated seismic response of the turbine bui lding steel
frame was nearly double the plastic moment capacity and in which horizon
t a l diagonal bra cing members exceeded y ie ld by a fa c to r of 4 due to the
lack of ef fe ct ive diaphragms in some reg ions . In the bo i le r st ru ct u re ,
e la s t ic a l l y ca lcu late d seismic response would also in dic at e more damage
than was a c tu a ll y obs erved. For members damaged du rin g the e arth quak e,
the rat io of calculated seismic response to ul t imate capaci ty is 4.0 or
gr ea te r. For the members w ith no observed buckl ing fol lo w in g the ea rt h
quake, the rat io of calculated seismic response to ul t imate capaci ty is
4.9 or le ss . Hence, i t may be concluded th a t for the Im pe rial V al ley
earthquake and the steam plant st ru ct u re , the onset of s i g n i f i ca n t
st ru ct ur a l damage should not occur at el a s t i c a l l y c alcu lated force leve ls
less than about 4 t imes the code sp ec if ie d u lt im ate ca pa city . The
A-34

8/22/2019 6848574
http://slidepdf.com/reader/full/6848574 244/394
investigation of the El Centro Steam Plant demonstrates that the plant
had significantly more capacity than the design level of 0.2g due to the
additional turbine building shear walls as well as other factors such
that it may be concluded that seismic capaci ty cannot be directly
inferred from the design level earthquake acceleration . In addit ion,
this investigation also demonstrates that elastic analyses using
instrumental earthquake ground motion predicts much more damage than
actually occurs during an earthquake even if all seismic resistant
mechan isms for the structure and code specified ultimate capacities are
accounted for. This investigation points out the need for including
inelastic energy absorption capability, wave scattering phenomena,
repeatable acceleration peaks , duration of strong shaking, etc ., in
design analyses of critical facilitie s such that analytical results
realistically reflect potential levels of structural damage.
1940 versus 1979 Earthquakes - There are man y similarities
between the May 18, 1940 and the October 15, 1979 Imperial Val ley
earthquakes. Ground rupture from the 1979 event followed the same
pattern as the 1940 ev en t, and showed man y of the same features and
chara cteri stics . The similarity also exten ds to the distribution and
types of damage. Their magnit ude, about 6.5, and felt areas are
approximately the s ame , yet damage from the 1940 earthquake was much
greater if damage to the Imperial County Services Building in El Centro
is excluded in the c omparis on.
It should be noted that the maximum acceleration recorded at the
same site in El Centro during the 1940 and 1979 earthquake s were 0.36 and
0.40g, resp ecti vely . This suggests that the levels of maximum horizontal
acceleration in El C ent ro, were not marked ly different in the two earth
quakes, but the duration of strong shaking differs by a factor of at
least thr ee. The differenc e in damage levels suggest that the greater
duration of shaking during the 1940 shock might be the reason for the
greater damage.
A-35
8/22/2019 6848574
http://slidepdf.com/reader/full/6848574 245/394
Implication - The general lack of damage (excluding the Imperial
County Services Building) during the 1979 Imperial Valley earthquake for
0.3 to 0.6g ground mo tion ind ica te s the importance of ground motion dura
t i o n i n est im ating damage p o te n t ia l and the need fo r in e la s t i c energy
absorpt ion capabi l i ty in the design of st ructures to mit igate damage.
C e rt a in ly , one would have expected grea ter damage i f these str on g ground
ac ce lera tion s had been asso ciated w ith long er d ura tion re cord s such as
those recorded in the 1971 San Fernando or in the 1952 Kern County
earthquake.
A.3.6 P ar k f i e l d , C al i fo rn ia Earthquake, 1966
(A-32. A-33, A-115 through A-118)
The Parkf ield-Cholame area of California was subjected to veryhigh ground acc ele rat ion s from a moderate earthquake ( M L = 5. 6 , Ms = 6.4 )
on June 27 , 1966. The epice nte r was locate d on the San Andreas f a u l t
approxim ately 5 miles northwest of P a rk f ie ld or 20 miles northwest of
Cholame. A maximum in t e n s it y V II was assigned to a sm all area in and
near the San Andreas fa u lt zone, extending sou thea ster ly from a few miles
no rth of P a rk f ie ld to a few miles south of Cholame. Five strong motion
instrum ents and f i f t e e n seismoscopes recorded the ground m oti on . The
maximum recorded a cc ele rat io n was 51 percent g ra vi ty (S ta t io n 2) locate dabout 200 fe et of the f a u lt t r a c e . Other peak ac ce lera t ion values were
47 (Stat ion 5 ) , 28 (Sta t ion 8) and 7 (Sta t ion 12) percent gr a vi t y a t
distan ce of 3, 6 and 9 m il e s , res p ec t iv e ly . The accelerometer at Temblor
also located about 6 mi les f rom the f a u l t recorded 41 percent g ra vi ty .
Although 0.5g was recorded at the f a u l t , the ground motion attenuated
ra p id ly w ith distance and at 10 m iles from the fa u l t the maximum
ac ce lera t ion was reduced to about one -tenth of i t s near fa u lt va lue . At
Cholame Sta t ion 2, the motion cons isted p rim a ri l y of a si n gl e pulse wi th
stro ng motion less than 2 seconds. However, ground mo tion recorded at
f u r ther d is tance los t t h i s pu lse - l i ke charac te r i s t i c .
A-36

8/22/2019 6848574
http://slidepdf.com/reader/full/6848574 246/394
Despite the large ac ce ler at ion s, very l i t t l e damage was caused
by the earthqua ke. In ge ne ra l, the area was spa rsely populated and the re
were no m u lt i- s to ry b u ild in g s. However, th er e were a number of sm all
s tr u ctu re s, a couple of o i l company pumping p lan ts, an e le ct r i ca l t ra ns
former s ta ti o n , several br idg es , and houses, e tc . A pump st at io n near
Shandon was subjected to ground motion e stimated at 25 percent g r a v it y .
No damage occured to the b u il d in g or t o a st eel st ac k. Another pump
st a tio n loca ted closer to the fa u lt and subjected to higher ground shaking
also saw no damage.
In Cholame and v i c i n i t y , a domestic water tank con tain ing
approximately 4500 gallons of water saw an estimated 0.4g acceleration.
Although th er e was evidence of s l i g h t base movement, no damage was
observed. At a Standard O il S ta ti o n , some metal forms bu ckled .
The f i r e s ta t ion b ui ld in g in Pa rk f ie ld is located w i th in l im i ts
of the fa u lt and was subjected to an estimated acc elera tion greater than
0 .4g . The sta t io n is a on e-s tory , rein for ce d br ick bu i ld in g presumably
constructed according to UBC requirem ents. A conse rvative estimate of
the design base shear would be about 0.1 5g . Given the high le ve l o f
ground m otio n, some y ie ld in g would have been pre dic te d. The st a ti o n ,however, was not damaged.
Implications - The observed performance of the Parkfield f i re
stat ion indicates that elast ic calculated earthquake forces would
su b st an t ia l ly overestimate actual fo rce s. Co rrela t ion between e la st ic
predicted and observed behavior would not be good.
Reference A-33 states in general, judging from the effects ofthe main shock on structures, the recorded maximum acceleration appar
e n tly lacked damage p o te n ti a l . Probable reasons are (a) short dur ation
of the maximum ground ac c e le ra ti o n , (b) predominent pe rio d of the ground
accelerat ion out of range of the natural periods of exist ing structures,
and (c) few structures of engineering s igni f icance located in the v ic ini ty
of the maximum recorded ac ce le ra tio n s.
A-37

8/22/2019 6848574
http://slidepdf.com/reader/full/6848574 247/394
A.3.7 Bear Valley Earthquake, 1972 (A-34)
The Bear Valley earthquake occurred on September 4, 1972 in San
Benito Coun ty, Cali forni a. The earthq uake was of small size
( 13 = 4.6 , M|_ = 4 . 7 ) . The hyp oce nte r wa s locat ed at a dept h of 5km,
approxi mately 1km southwest of the most re cent ly active trace of the San
Andreas fau lt. The aftershock locations define a vertical plane 3km in
width and 4km in length parallel to the San Andre as fault . Recent work
indicates that there may be a systematic bias to the west for the location
of the earthqua ke in the reg ion . Movement of the aftershock z one, a few
kilometers to the east, would place the zone direc tly on the San An dr ea s.
Three strong moti on instruments wer e located within 10km of the
calculated epicenter. The stations, recorded peak horizontal accelera
tions and calculated epicentral distances are: the Stone Canyon
Geophysical Observatory, peak acceleration 0.23g, distance 3km; Melendy
Ranch Barn, peak recorded acceleration 0.70g, (0.52g c o r r e c t e d ) , distance
9km; Bear Valley Fire Station, peak acceleration 0.17g, distance 10km.
Eastward movement of the rupture zone to place it on the San Andreas
fault would result in the distance from the rupture zone to each of the
three stations being only a few kilome ters . All three instruments are
located on relatively shallow deposits of recent alluvium.
The earthquak e occurred in a sparsely populated region. The
principal effect of the earthquake pertained to numerous rockfalls along
the steep banks of the San Benito Riv er. The epicentral region was
assigned an intensity VI with only slight damage repor ted. The damage
was reported at the Bear Valley Fire Station at a distance of approxi
mately 9km from the epicenter. At the fire station, cinder block walls
developed fine crack s, a fire truck rocked noticeably from side-to-side,
and a vertical pip e from a water heater exten ding through the ceiling
crushed the sheet rock. At Melendy Ranch, approximately 8km from the
epi cen ter , small landslide s occurre d, small objects fell and vehicles
rocked.
A - 3 8

8/22/2019 6848574
http://slidepdf.com/reader/full/6848574 248/394
Implications - A s n o major eng ineered structures were located
within t h e region affected b y t h e Bear Valley earthquake (the design
basis f o r t h e Bear Valley Fire Station is unknown) no significant
statement c a n b e made concerning t h e effect o f high ground acceleration
earthquake motions on engineered structures from this earthquake.
A.3.8 Coyote Lake Earthquake, 1979
(A-105, A-106, A-107, A-108, A-109)
On August 6, 1979, a ma gnitud e, M[_ = 5.7 , earthquake occu rred
at a depth of 10km in the Calaveras f a u l t zone at Coyote Lake ap pr ox i
ma tely 50 km southeast of San Jose or 10km no rth- no rthe as t of G il ro y ,
C a l i f o r n i a .
Because of the high seismic act iv i ty in the Gi l roy-Hol l is ter
area, there were a number of strong motion instruments in the area which
recorded the ground mo t ions. A l l s tat io ns in the G i l ro y array are wit hi n
16km of the epice nter and extend from a rock si te through an a l l u v ia l
va l le y to another rock s i t e . The sta t ion s in the Bear Va l ley array
loca ted between 50 and 75km from the e pic en ter recorded ac ce lera tion s
gre ater than 0.05 g. A maximum ho riz on ta l ac ce lera tion of 0.42g was
recorded at st at io n 6 located on rock wi th in 1km of the fa u l t t race andto the southeast of the epicenter.
The earthquake caused wery l i t t l e damage in the ep icen tral area,
which is mountainous and spa rsely p op ula ted . A stron g motion instrum ent
at Coyote Dam recorded a ho riz on ta l ac ce le ra tio n of 0.23 g. The highe st
MM in te n s it y values of V II were observed in the G ilro y and San Fe lipe
Lake areas . In te n s it i e s were higher in these areas due to deep, a l l u v i a l -
f i l l e d val leys and the dire ct io n of earthquake energy propaga t ion.
Reports f rom G i l roy and H o l l is te r ind icated no s ign i f ic an t
st ru c tu ra l damage. Minor cosmetic damage co ns ist in g of pla ste r c rac kin g,
some pounding between adjacent b u il d in g s , and glass breaking occ urre d.
In g en e ra l, the le ve l of damage was ve ry low.
A-39

8/22/2019 6848574
http://slidepdf.com/reader/full/6848574 249/394
Imp l icat io ns - Although the earthquake af fec ted a va r ie ty of
commerc ia l s t ructures in both G i l ro y and H o l l is te r , in s uf f ic ie n t
published data describing the performance of specif ied structures
e x is ts . Consequently, no co rr el at io n between pred icted and observeds tr u c tu ra l performance can be made.
A.3 .9 O ro v i l le , C al i fo rn ia Earthquake, 1975 (A-147)
The O ro v il le earthquake occurre d on August 1 , 1975, near
O r o v il le , C a li fo rn ia . The earthquake was of medium size (M| = 5. 7,
M^ = 5.6) w ith a hypocenter depth of 8km.
Five str on g motion instrum ents were loca ted w it h in 35Km of the
earthquake epice nter . The O ro vi l le Dam seismograph st a t i o n , a rock s i t e ,
recorded a peak ho riz on tal ac ce lera t ion o f O.llg and a peak vert ical
ac ce lera t ion of 0.1 4g. Two instrumen ts were on alluvium and recorded
peak accelerations of 0.08g and 0.07g while the remaining two instruments
were on rock, one recording a peak acceleration of 0.03g and the other
not be ing t r iggered.
Twelve strong motion instruments were installed in the
ep ic en tra l area a fte r the occurrence of the main shock. Over 100 stro ng
motion recordings were obtained for aftershocks in the magnitude range
\ = 3.0 to 5.0 at e pic en tra l distances ge ne rally less than 12km.
The O ro vi l le Medical Center is a one -story wood frame st ru ct ur e
wi th a two -sto ry p ort io n on a side h i l l . The building is located on
approximately 100 fe et of Cenozoic terr ac e gra ve ls. Peak ho riz on tal
ac ce ler atio ns between 0.04g and 0.39g were recorded fo r afters hoc ks in
the magnitude range M|_ = 4.0 to 4.9 a t hyp ocentra l dista nce s of 7km to11km. Damage cons isted p ri m a ri ly of no ns truc tura l pla ste r damage.
With in the ci ty of Orovi l le , where the peak hor izontal accelera
ti o n s may have been of the orde r o f O.lOg to 0.1 5g , bu il d in g damage con
sis ted p ri m a ri ly of broken windows, cracked plas ter and broken c e il in g
A-40

8/22/2019 6848574
http://slidepdf.com/reader/full/6848574 250/394
tiles. Very little structural damage occurred in modern building s. Only
minor damage w a s observed in any o f t h e several Sta te Water project
facilities i n t h e area, including t h e O r o v i l l e D a m a n d t h e associated
power plant.
Implications - T h e only engineered structures o f significance in
the epicentral area were t h e State Water Project facilities at Oroville
Dam and Thermal ito Afte rbay . These facili ties experienced peak horizon
tal accelerations o f t h e order o f O . l g during the main shock with only
slight damag e. This low level o f shaking d i d n o t allow an effective
assessment o f t h e correlation between predicted an d observed behavior.
A.3.1 0 Greenvi lle, California Earthqua ke. 1 9 8 0
(A-141, A - 1 4 2 , A - 1 4 3 )
In January, 1980, the Livermore Valley area of California was
shaken by a se rie s of earth qua kes . Most of the damage was the r e s u lt of
shocks which occurred on January 24th. The largest shock was a ML = 5.5
loc ate d 12km no rth of t he Livermore V al le y and 20km northwe st o f th e
Lawrence Livermore National Laboratory (LLNL) along the Greenville
f a u l t . In ad di t io n to the main shock, the re was a foreshock ML = 2.7 a
minute and a ha lf e a rl ie r and an aftersh ock ML = 5. 2, loca ted again onthe Gre env i l le fa u lt 14km to the south of the f i r s t pr i nc ipa l shock. The
second principal shock caused essentially no damage.
There were no strong motion instruments in the Livermore Valley
or at LLNL. The clos es t instru me nts were at Del V a ll e Dam and Ve teran 's
H os pit a l , south of General E le ct r ic Va l le ci to s Plant (Pleasan ton), Kodak
F a c il i t y (D ub lin ), and Trac y. Peak ground ac ce lera t ion recorded were
0.26g, 0.1 8g, O . ll g , 0.15g and 0.09g. Estimates fo r ground motion at theLLNL Site were 0.2 to 0.3g.
In general, damage to structures in the Livermore vicinity was
very l i g h t . A few chimneys were cracked and seve ral u nre inforc ed br ick
se rpe ntin e w al ls were to p p le d . The abutment on G re e nv ill e Road Overpass
on Int er sta te 580 which passes almost d ir e c t l y over the Gree nvi l le fa u lt
A-41

8/22/2019 6848574
http://slidepdf.com/reader/full/6848574 251/394
had one abutment drop 6 to 10 inches i n te rr u p ti n g t r a f f i c . There was
some in si g ni f ic a nt minor cracking in the concrete s tru ct ur e. The
Livermore City H a l l , a f a i r l y new re info rced concrete b u i ld in g , had no
s t ru c tu ra l damage; however, the re was ex ten siv e damage to the suspended
T-bar ce il in g s . Elsewhere in Livermo re, there was very l i t t l e damage tostructures except for occasional broken glass.
Most of the damage was concentrated in the eastern portion o^
the v a ll e y , damage was noted p r in c ip a l ly to a mob ile home pa rk. A high
percentage of mo bile homes f e l l o ff t h e i r stands and sus taine d damage.
No damage was rep orte d to an e l e c t r i c a l su bs ta tio n or any equipment which
was located 1 m ile west of Gre en vil le f a u l t . Two wine ries are located
about 2 to 3 kil om ete rs south east of Live rm ore . One su ffe re d no damageto any s tr u c tu re , wh ile exte nsiv e damage was sustain ed by an elevated
water tank and wine tanks i n the oth er . An e la s ti c e stimated base shear
c o e ff ic ie n t of 35 percent of g ra v it y was estima ted to have caused the
observed damage. Ty pic al damage to the small wind fi b e rg la s s lin ed ste el
tanks was top p lin g due to broken leg s . No ru pt ures occurred and damage
was not s ig n if ic a n t . The larger tanks (sta in le ss st ee l) suf fered more
damage. There were fa il u re s to anchorage, loc al bu ck lin g, concrete
s p a ll in g of support base, and permanent ov er al l d efor ma tions . Only onetank rup ture d. Total do l la r value fo r re pairs was est imated at $1 to 1 .5
m i l l i o n .
The Lawrence Livermore National Laboratory occupies an area of
ap pro xim ate ly one square m ile loc ate d about 2 m iles east of downtown
Liverm ore. I t contains some 147 bu ildin gs and 975 t r a i l e r un its (re pre
sent ing about 3.5 m i l l i o n square fee t of f lo o r a rea). Design c r i t e r i a
f o r LLNL f a c i l i t i e s va ri es co n side rab ly . C r i t i ca l f a c i l i t i e s ( i . e . , those
with radioactive materials) were designed or evaluated using dynamic
an aly sis w ith peak ground motion values o f 0.5 to 0 .8 g; lase r and magnetic
fusio n experimental f a c i l i t y (with h igh ca pita l c ost) employs a 0.25g
ground acc elera t ion w ith a dynamic an aly sis ; o f f i c e bui ld ings vary f rom
no seismic design to the Uniform Bui ldin g Code with an equ ivalen t s ta t i c
c o e ff ic ie n t of about 0. 2; equipment and fu rn is h in g also v aries from no
A-42

8/22/2019 6848574
http://slidepdf.com/reader/full/6848574 252/394
seismic design to a greater than l.Og s ta t i c c o e ff ic ie n t. Damage to
equipment and f a c i l i t i e s were est imated at $10 m il l io n . A large part of
the cost was fo r s t ruc tur a l repa i rs to th ree adm in is t ra t ive bu i ld in gs ,
fo r the repa ir of a rc hi te ct ur al - ty pe damage, and for esse nt ia l improve
ment to meet upgraded seismic sa fe ty stan dard s. The to t a l d o ll a r co st
fo r both re p a ir and improvements was es tim ate d a t between $15 and $20
m i l l i o n .
There was no st ru ct ur al damage to c r i t i c a l f a c i l i t i e s at LLNL
and on ly minor cosmetic or arc hi te ct ur al damage. These f a c i l i t i e s are
ty p ic a l l y o f very s t i f f low r is e shear wa l l type o f con st ruc t ion . In
genera l , bu i ld ing fa c i l i t y damage was p r im ar i l y to f i ve no n -c r i t i c a l
bui ld ing s a l l o f which are moment re s is t i n g st ru ctu re s. The in te r i o r
fur nis hin gs were most af fe c te d . Connections between t i l t - u p concrete
slabs and th e ir support ing s tru ct ur al stee l frames were af f ec ted . Core
walls had considerable cracking in some buildings.
The 975 in d iv id u a l t r a i l e r un its at LLNL are assembled in to 216
complexes. Eighty-seven were t ie d down. In ge ne ral, there was l i t t l e
damage to t r a i l e r s . In complexes not ti e d down, one t r a i l e r was badly
damaged (w alls cra cke d, e tc .) and fo ur were mod erately damaged ( i n t e r i o rce i l i n g t i le s and l i g h t f ix tu re s d isp lace d) . No st r uc tur a l damage
occurred to t ra i lers t ied down.
In ge ne ra l, much of the a ctu al cost of rep ai r at LLNL res ult ed
from cosmetic damage. T a ll bookcases th a t were not anchored tip pe d ov er ,
damaging wa lls and breaking i n te r io r gla ss . Sheetrock p a rt it io n s were
cracked in many bu i ld in gs . Ce i l ing t i l e s , l ig h t f ix tu re s , and a i r
d if fu s e rs (not anchored) f e l l to the flo o r and broken water pipes causedwater damage.
Im pli ca tio ns - The engineered s tru ct ur es behaved as would be
expected of st ru ct ur es designed in accordance wi th UBC code design
provisions which resist moderate earthquakes without structure damage but
allow nonstructural damage.
A-43

8/22/2019 6848574
http://slidepdf.com/reader/full/6848574 253/394
A.3 .1 1 Other Earthquakes
In addition to the above included cases, numerous other examples
e x is t where obs erv ations have been made of st ru ct ur es sub jecte d to
r e la t i v e ly st rong ground mot ions. Although not included in d e t a i l , they
a re wor th c i t ing .
The lack of damage in the vicinity of the ground accelerat ions
due to the 1972 Ancona, It a l y earthquakes i s noted in Reference A-1 3.
The 1 972 earthquakes magnitude o f 4 to 5.0 produced reco rded maximum
ac ce ler atio ns of 0.6g at Rocca (roc k) and 0.4g at Palombina (s ed im en t).
Ep ice ntra l distances to these st at io ns were about 7 and 15km, respec
t i v e ly . I t a l i a n se ismolog is ts and engineers (A-39) repor t the re la t i v e ly
small damage and the fac t th at bu ild ing s designed w ith seismic c o e f f i cients of about 0.07g in accordance with the recently adopted Ital ian
earthquake code, su ffe re d no damage. This con clusion again in di ca te s
tha t short durat ion records and in e la s t i c energy absorpt ion c a p ab i l i ty of
st ru ctur es l i m it actual damage. Without accounting fo r these fa c to rs ,
e la s t i c computed force s compared to u lt im ate ca pa cit ie s would gr ea tly
overpredict damage.
References A-140, A-154 descr ibe b r i e f l y s t ru ct ur al performance during the 1940 Imperial Valley (El Centro) earthquake which caused
con side rable damage. References A-1 52, A-155 des cribe e ffe c ts from the
1949 Olympia ear thqu ake . Reference A-55 describ es th e damage to
s tr u c tu re s caused by the 1 964 Alaska earth qu ake . There were no reco rded
motions fo r the 1 964 Alaska ea rthquake.
References A-26 and A-40 address the damage th a t the 1906 San
Franc isco earthquake (magnitude 8.3) brought on the C it y o f San Fr an cis co .
The e pice nt er of the 1906 earthquake was about 17km from downtown San
Franc isco on the San Andreas f a u l t . There were no ground motion r e
co rd ing s. References A-26 and A-40 suggest th at cu rre nt procedures would
estimate peak ac cele rat io ns exceeding l.Og in downtown. Fu rth er , sp ec tral
ac ce le ra t io ns , i f based on the peak ac ce lera t ion va lue , w it h reasonable
damping ratios and at the fundamental frequencies of major buildings of
A-44

8/22/2019 6848574
http://slidepdf.com/reader/full/6848574 254/394
the e ra , would be 2.0g or more. The papers in di ca te th at the re were 52
major b uild ing s in San Fra ncis co, none of which were sp e c if ic a ll y designed
to re s is t earthquake s. The ir resi sta nc e to earthquakes was a by-product
of th e ir wind design and no n- str uc tur al facades and p a rt it io n s . None of
the b uild ing s collap sed and a l l but seven were repair ed and return ed to
use. Most are s t i l l in use today. A few of the su rvi vin g b uildin gs
include the 19-story Central Tower, the Fairmont Hotel, the old port ion
of the S t. F rancis H o te l, the post of fi c e at Seventh and Mission S tree ts
and the Ferry B u il d in g . None of these bu ild ing s would meet cu rre nt code
requ irem ents . The referenc es in di ca te tha t an average base shear c o e ff i
ci en t of 0.4 would be a generous estimate of the y ie ld -l e v e l stres s
capaci ty fo r these bu i ld ings.
A number o f obs ervation s have been made reg ard ing the e ff e c t of
more di st an t earthquakes on st ru ct ur es . References A-11 0, A-146, A-148,
A-149, and A-150 discuss the 1967 Caracus, Venezuela, 1974 Lima, Peru,
and the 1977 Romania earthquakes whose ep icen te rs were fa r removed from
i t s hig hly affec ted are as. Structure s with longer periods were more
inf luenced and so i l cond it ions p layed a larger ro le .
Another more distant earthquake series, the 1960 Chile earthquakes, caused con side rab le damage and is f a i r l y well-documented in
References A-151 , A-26, A-40, A-43, and A-88. Of pa rt ic u la r note, is the
behavior of the Huachipato Steel Plant located near Concepcion in Central
C h i l e . This plan t was subjec ted to stron g mo tions . The pla nt was b u i l t
in 1947-1960. The f a c i l i t y includes a b las t furna ce, stee l product ion
plant and blooming, merchant and rev ers ing m il ls and a fa b ri c a ti n g shop.
There are also many v e r ti c a l stacks and seve ral e levate d water tan ks . In
genera l , the plant was designed using allowable stress values associated
with st at ic la te ra l c oe f f ic ie nt s bel ieved to be in the range of 0.10 to
0.3 0. An ex tens ive stu dy of the plan t was conducted in order to develop
the most l i k e l y sp ec tral response ac ce ler at i on s. The actual damage, or
lack of damage, was then used to r ec on str uc t the p robable response p at ter n
and then to determine the base shears and an approximate spectral diagram
fo r the pl an t. The probable spe ctral ac cele rat io n at the period and
A-45

8/22/2019 6848574
http://slidepdf.com/reader/full/6848574 255/394
damping of the most c r i t i c a l stru ctu res is 1 .2g. Damage pr ed ict ion s based
on earthquake force s developed from such sp ec tral acc eler at ion s c le a rl y
would suggest s ig n if ic a n t damage. Very l i t t l e damage was observed.
Agadir, Morocco was severely damaged by an earthquake on February29, 1 960. The earthquake was assigned a magnitude of 5 .8 , w it h e stim ates
ranging from 5.5 to 6 .0 . The epic ente r of the earthquake was w ith in 2 to
3 kilo m ete rs of the center of the c i t y of Ag ad ir. Damage obs ervation s
suggest a depth of focus no more than 2 or 3 ki lo m e te rs . The rad ius of
s ig n if ic a n t damage was very con fine d, w it h in a 5km radiu s of the e p i
cente r. In te ns it i es of X and XI were assigned to th is cen tra l c i t y
area. No stro ng motion data are a v a il a b le . Damage evidence (A-U O)
str on gly suggests tha t the ground motion consisted l a rg e ly of a sin gleprimary ac ce lera t ion pulse of short du ra tio n. There were several types
of s tru ct ur es in Agadir at the time of the earthq uake . The most preva
lent was constructed with unreinforced or poor ly re inforced masonry.
Nearly all such structures nearest the quake epicenter collapsed or were
damaged beyond repair.
Another principal type of structure employed reinforced
co nc ret e. Many had concrete columns and beams fo r ca rry in g v e r ti c a l
loads; however, th e j o i n t s between members lacked both moment and shear
resistance c a p a b i l i t y . When subjected to la te ra l sha king, the beam-
column connections f a i l e d . The lack of c o n tin ui ty between the various
s tr u c tu ra l elements did not allow a re d is tr ib u ti o n of loads and many such
st ru ct ur es co lla ps ed . I t was ge ne ra lly observed th at even in cases where
s t ruc tu res had s ig n i f i ca n t s ta t i c res is tance to la te r a l f o rce s , the i r
earthquake performance was poor due to a lack of d u c t i l i t y and energy
absorpt ion capacity.
References A-44, A-121 and A-122 report on the June 8, 1975,
earthquake ( M L = 5. 2, M^ = 5.7) th at occured in the Ferndale region of
Northern C a l i fo rn ia . The epicenter was located 4 miles south and s l i g h t l y
west of Fernd ale . The Humboldt Bay Power Pl an t is lo ca ted south of Eureka
and adjacent to the bay. The plan t con sists of two un its of fo s s il fu el
A-46

8/22/2019 6848574
http://slidepdf.com/reader/full/6848574 256/394
powered gen erato rs and a nuc lear powered gen erato r u n it (U nit 3 ). Both
fossi l fuel units were operating at the t ime of the earthquake while the
nuclear un it was out of ser vice f o r a scheduled re fu e l i n g , maintenance
and m o d if i ca tio n . The only strong motion accelerograms recorded during
the earthquake were those obtained at the power plant site located 12
miles from the epice nter of the earthquake. A MM i n tens i t y o f V i s
assigned to the pla nt s i t e . Un it 3 was instrume nted w ith three strong
motion instr um en ts. At these sensor lo c a tio n s, the large st peak acc elera
t io n was recorded in the (tran svers e) EW d ir e c ti o n . Peak (c orre cted )
values were 0.35g, 0.25g and 0.1 6g, fo r f r e e - f ie ld (storage b u i ld in g ),
ground leve l ins id e the ref ue l ing bu i ld in g and reactor caisson (78 fe et
below grade ), re sp e c tiv e ly . Strong shaking was about 3 to 5 seconds.
The corresponding ac ce ler at ion response sp ectra f o r 2 percent dampingind ica tes tha t maximum sp ec tra l values occurred fo r both instrumen ts in
th e Refu eling B ui ld ing between 2 to 3Hz and fo r the Storage B uild ing
between 2 to lOHz. The e ff e c t of the earthquake was to t r i p the generator
o i l c i r c u i t breakers and the aux i l ia ry t ransformer fo r both fo ss i l u n i ts .
On the nuclear u n i t , the on ly abnormal co n di tio n caused by the earthquake
invo lved spu rious ac tion s on one of a pa ir of redundant rela ys i n the
ref ue l ing bui ld in g h igh d i f fe re n t i a l pressure protec t ion system. Small
waves (9 to 12 inches) were observed in the spent fuel poo l . Nos ig n if ic a n t earthquake re la te d damage was observed .
References A-1 1 4, A-123 and A-124 re po rt the ef fe ct of a
November 8, 1980 ear thquake on the Humboldt pl a n t . Th is earthquake had a
surface wave magnitude of 7.0 and occured o ff the coast of C a lif o rn ia
west of Eureka and the Humboldt pl a n t. F re e -f ie ld peak ground motion
estimates were 0.15g to 0.25g . The e ff e ct s of the earthquake on pla nt
s tr u c tu re , pi p in g , equipment and components were m inim al. The on lys tr u ct u ra l damage was permanent de form ation of a re in fo rc ed masonry w all
of the pl a n t' s on e- sto ry cold machine shop. The w all is 18 fe e t high and
spans ho ri z o n ta ll y 70 to 80 fe e t between cross w a ll s . Movement at the
base of thre e w ater stora ge tanks was eviden ced , but the re was no damage
to the tank or attached p ip in g . Effe cts on pip ing and mechanical
equipment were e ss e n t ia l ly n i l .
A-47

8/22/2019 6848574
http://slidepdf.com/reader/full/6848574 257/394
References A-45, A-97 and A-144 discuss earthquake effects on
two nuclear power p la n ts . F ir s t is the Fukishima Nuclear S ta tio n which
was subjected to strong motion from the 7.4 magnitude Miyagi-Ken-Oki,
Japan earthquake o f June 1978 loc ate d about 140km from the s t a t i o n . Peakground mo tion was ap pro xim ate ly O .lg w ith a maximum response ac ce le ra tio n
o f about 0.25g . OBE design motion was 0.1 8g . The on ly damage repor ted
fo r the power complex was breakage of some n o n - c r it ic a l e le c t r ic a l i nsu
l a t o r s . The second is the Wm. H. Zimmer Station, Moscow, Ohio which was
subjected to ground motion from the July 27, 1980 Sharpsburg, Kentucky
earthquake. Magnitude of th is event was 5.1 w ith i t s e picen ter located
46 mi les south-southeast of the st a t i o n . Peak acc elera t ion at the s i te
was 0.0 4g , below the OBE of O .l g . There was no v i s i b l e damage to any
structures at Zimmer.
References A-13 4, A-135 and A-136 ind ica te th at the V i r g i l C.
Sumner Nuclear Station, located near Parr, South Carolina was subjected
to ground mo tion from sev era l nearby magnitude earthquakes in 1 978. The
strongest event occurred on August 27, 1978 and had a local magnitude of
2.8 . The epicenter on th is even t, ca l led Monti ce l lo R eservoir Earth
quake, was about 6500 fe et northwest of the nuclear s ta ti o n . The fo ca l
depth is estimated at 100 to 500 m eters. The nearest rec ord ing i n s tr u
men t, a USGS stro ng motion accelerometer was locate d on a s tr a ig h t l i n e
between the pl an t and the e pic en te r and at a dis tan ce of about 4400
f e e t . Peak recorded h or izo nt al components of the acc ele ra tion s were
0.27g and 0.2 1 g, and 0.08g fo r the ve r ti c a l component. The du ra tion o f
stron g shaking was very shor t (les s than 1 second). A con serva tive
estim ate o f 0.lOg to 0.18g i s made fo r the ground motion a t the pla nt
s i t e . No damage was observed. In fa c t , the event was e s se n ti a l ly u n fe lt
by personnel at the p la n t.
Cloud (A-41) discusses the seismic performance of power piping
by examin ing the in t r in s ic ch ara cte r is t ic s of p ip ing that are b u i l t - in due
to designed co ns tru ct io n p ra ct ic e and also by examining the performance
of comparable pip in g in past earthqu akes. Discussed are power p lan t
A-48

8/22/2019 6848574
http://slidepdf.com/reader/full/6848574 258/394
pip ing be havior d urin g seven past earthqua kes . These are the 1979
Imp eria l V a ll ey , the 1978 Miya gi-Ke n-O ki, the 1972 Managua, the 1971 San
Fernando, the 1964 Alas ka , the 1952 Kern County (T a ft ) and the 1933 Long
Beach. Observations include the seismic performance of piping in the El
Centro Steam Pla nt in th e Im pe ria l V a ll e y , th e Fukushima Nuclear Power
P la n t , and the ESSO R efinery Complex and the ENALUF Power P la nt in
Managua. San Fernando Valley Power Plant, the Kern County Steam Station,
and the Long Beach Steam S ta t io n . In summary. Cloud ind ic at es th a t based
on the ava ilab le data and observations pe rta inin g to the behavior of
power piping during actual earthquakes, even for power plants experiencing
severe ground motion the p ipin g remains in ta c t.
A .4 CONCLUSIONS
The objec t ives of the review e f f o rt were tw ofo ld. F ir s t , t o
assess how we ll pred icted s tr u c tu ra l performance, based on el a s t i c
an aly sis procedures tha t employ e la s ti c response spec tra derived from
recorded ground mo tion, cor rela tes with ac tual observed str uc tu ra l
behavior durin g past earthquak es. Second, to id e n ti fy ground motion and
st r uc tura l ch ara cte r is t ic s tha t s t rong ly in f luence a s t ru ctu re 's response
behavior.
To meet these ob je ct iv e s, an extensive l i te ra tu re review was
conducted and a data base es ta bl is hed th a t documents the performance o f
structures subjected to strong ground shaking from past earthquakes.
When po ss ib le , those cases were id e n ti f i e d where a d ir ec t comparison
between observed behavior and predicted performance based on calculated
earthquake for ce s cou ld be made.
The literature review and damage documentation presented,he r e in , lead to the fo l lowing conclusions:
1 . When the level of ground motion was such that the observedove ra l l s t ru ctu ra l behavior was es se nt ia l ly e l a s t i c , thepredicted behavior based on calculated earthquake forcesusing e la st i c ana lys is cor re la ted we l l w i th observat ion .Note, structures were observed to often exhibit suchove ra l l behav io r and s t i l l e xh ib i t loca l y ie ld ing .
A-49

8/22/2019 6848574
http://slidepdf.com/reader/full/6848574 259/394
When the le ve l of ground motion caused the actua l st ru c tu reto respond in e la s t i c a l l y , the e la s t i c analysis method gavecalculated earthquake forces which signf icant ly overestimated the actual force level which occurred producingthe observed damage. In these cases where the cal cul a te d
e l as t ic fo rce leve ls wou ld be genera l ly ind ica t ive o fs ig n if ic a n t s tru ct ur al damage, the pred icted performancedid not corre late with observed behavior.
Several factors were ident i f ied which inf luence theresponse behavior of we ll-de sig ne d s tr u c tu re s . Among theseare the duration of strong shaking, the energy absorptionor d u c t i l i t y capa city of a g iven str uc tu ra l system, and thee f fec ts o f so i l - f ounda t ion in te ra c t i on . In genera l , t hedocumentation assembled qualitat ively supports the beliefthat such factors must be included in the develoment ofdesign ground motion c r i t e r ia i f p red ic ted s t ru ctu ra lbehavior is to accurately correlate with actual observed
performance.
There are some documented cases where sho rt du ra tio nmotions have not caused any significant damage, even tonon-engineered structures, in spi te of the fact that thesh ort du rat ion motions had equal or higher peak ac ce lera t ions than long durat ion mot ions which resulted in significant damage.
A-50

8/22/2019 6848574
http://slidepdf.com/reader/full/6848574 260/394
TABLE A-1
LIST OF EARTHQUAKE/STRUCTURE-TYPES
INCLUDED IN REVIEW/DAMAGE DOCUMENTA TION
EARTHQUAKE STRUCTURE-TYPE REFERENCES
Cases with Damage Documentation
1952 Kern County, CA
i»
en1—'
1966
1971
1972
1972
1975
1978
1979
1979
1980
Other
1906
1940
1949
1960
1960
1964
Parkfield, CA
San Fernando, CA
Bear Vall ey, CA
Managu a, Nicaragua
O r o v i l l e , CA
Santa Barb ara, Ca
Coyote Lak e, CA
Imperial Valley , CA
Greenville, CA
Cases Reviewed
San Francisco, CA
Imperial Valley, CA
Olympia, WA
Agadir, Morocco
Chile
Alaska
General, Kern County Steam Plant ,
Elevated Tanks
General
General Medical Facilities,
High-Rise Buildings , Industrial,
0. View, VA
General
Ge n e r a l , ESSO Refiner y, ENALUF
Thermal Plant
Ge n e r a l , State Water Project
General
General
General, El Centro Steam Plant
General, LLNL
Major High-Rise Buildings
General
General
General
Huachipato Steel Plant
General
137-140, 32
3 2 , 33 , 115-118
5 8 , 6 0 , 6 6 , 6 7 , 7 6 , 8 4
8 7 , 157, 158, 159, 162
34
2 6 , 3 0 , 4 0 , 4 2 ,111-113
147
6 4 , 119, 120 , 160
105-109
35-38, 125-129
141-143
26, 3 0, 99, 155
154, 140
140, 152, 155
110
26, 4 0 , 4 3 , 8 8 , 151
5 5 , 110

8/22/2019 6848574
http://slidepdf.com/reader/full/6848574 261/394
TABLE A-1 (Continued)
LIST OF EARTHQUAKE/ST RUCTURE-TYPES
3sI
Other
1967
1967
1972
1974
1975
1976
1977
1978
1978
1980
1980
1980
EARTHQUAKE
Cases Reviewed (Con tinued)
Caracas, Venezuela
Koyna, India
Ancona, Italy
Lima, Peru
Ferndale, CA
Friuli, Italy
Romania
Miyagi-Ken-Oki, Japan
Monticellor Reservoir
Mammoth Lake , CA
Eureka, CA
Sharpsburg
INCLUDED IN REVIEW/DAMAGE DOCUMENTATIO^
STRUCTURE-TYPE
General, High-Rise
Koyna Dam
General
General
General, Humboldt Bay, Nuclear
General
General
Fukushima Nuclear Power Plant
Virgil C. Summer Nuclear Plant
General
General, Humboldt Bay, Nuclear
Wm. Zimmer Nuclear Power Plant
1
Power
Power
Plant
Plant
REFERENCES
110, 148
130-133
1 3 , 39
6 5 , 146
4 4 , 121,
8 0 , 145
6 2 , 149,
4 5 , 97
134-136
156
114, 123,
144
122, 85
150
, 124

8/22/2019 6848574
http://slidepdf.com/reader/full/6848574 262/394
TABLE A-2
SUMMARY EARTHQUAKES , MAXIMUM RECORDED ACCELER ATIONS, STRUCTURE-TYPES AND
LEVEL OF MOTION AT STRUCTURE SITE
Magnitude
M MEarthquake
Maximum DistanceRecorded CausativeAcceleration Fault
3»Icn
18 April
18 May
21 July
29 Feb.
21 May
26 July
27 June
10 Dec.
9 Feb.
14/21 June
4 Sept.
23 Dec.
6 Oct.
7 June
1906
1940
1952
1960
1960
1963
1966
1967
1971
1972
1972
1972
1974
1975
12 June 1978
13 Aug. 1978
27 Aug. 1978
15 Oct. 1979
San Francisco
Imperial Valley
Kern County
Agadir, Morocco
Chile
Skopje, Yogoslavia
Parkfield
Koyna, India
San Fernando
Ancona, Italy
Bear Valley
Managua, Nicaragua
Acapulco, Mexico
Ferndale
6.9
6.4
7.2
5.6
6.0
6.4
4.9/4.4
4.7
5.2
Miyagi-Ken-Oki
Sabta Barbara
Monticello Reservoir
Imperial Valley 6.6
5.1
2.8
6 Aug. 1979 Coyote Lake
24 Jan. 1980 Greenville
27 July 1980 Sharpsburg
5.7
5.9
5.1
8.3
7.1
7.7
5.8
7.5
6.0
6.4
6.5
6.6
4.3
6.2
4.8
5.7
7.4
5.6
6.9
5.6
5.9
0.39
0.20
0.50
0.63
1.2
0.60/0.40
0.70
0.39
0.53
0.35
0.10
0.45
0.25
0.81
0.42
0.17
10 km
40
<1
7
3
7/15
6
5
35
20
140
4
<1
7
16
Structure-Type
High Rise Buildings
General
General
General
Hauchipato Steel Plant
General
General
Koyna Dam
General
General
General
General
ESSO Refinery
ENALUFGeneral
General
Humbolt Bay Power Plant 0.35
Fukushima Nuc. Power Plant 0.10
Level of Motion
Structure Site
Duration ofStrong Shaking
(>-ig)
Up to l.Og EST
0.2 - 0.5 EST
>0.1
0.06 - 0.50
0.63
Up to 0.5 (?)
0.60/0.40
<0.6 EST0.390.6 EST
0.53
General
Virqil C. Summer NPP
General
El Centro Steam Plant
General
Livermore Valley/LLNL
Wm. Zimmer NPP
0.45
<0.1 EST
0.2 - 0.4
0.49
0.42
0.2 - 0.3 EST
<0.1
IX-X
VIII-IX
X-XI
VI I
VI I
VI-XI
VI
IXV-VIVII-VIII
VI-VII
V
VI I
VI IVI I
VI I
[long]
25 sec.
>12
single pulse
[short]
short
<2 single puls
6
[<7]
<2
<3
[>io310
[>10]
1-2
VI
[<4]<4
[short]
2-3
<1
<13
7
<2
[short]
[short]

8/22/2019 6848574
http://slidepdf.com/reader/full/6848574 263/394
60
40
20 -
&«n
1—
zU J
oH-1L l.U .L UOO
^U J3 :o i
U JCO
CO
10
8
6
4
2 -
—
[—
—
1—
1 1,
j—
• ^
1 ^
1—
L_
1 1 1 1 1 1 1
dd
o oo
o
D off
o
EJn
D D
1 1
cfo
D
D
O
D DO
C i r c l e s r e p r e s e n t t h e i Mx ii wu i f i r s t - m o d e b a a * s h e a r se i ^ e r l e n c e d d u r i n g t h e e a r t h q u a ke , t i c k e d c i r c l e s r e p r e s e n ts t r u c t u r e s t h a t h a d s a n e d a m a ge ; s qu a r e s r e p r e s e n t t h e n o m i n a lc o d e v a l u e s o f b a s e s h e a r s f o r w hi c h t h e b u i l d i n g s w e r e d e s i g n e d .T he p e r i o d s a r e t h o s e o f t h e f u n d a m e n ta l mo d e s o f v i b r a t i o n .B a s e s h e a r c o e f f i c i e n t i s e q u a l t o b a s e s h e a r d i v i d e d b y t o t a lw e i g h t o f s t r u c t u r e .
t
1 1 1 1 1 1 1 1 1
— j
-1
-\
—H
_J
- j
^^
-\
-J
0.4 0 .6 1 .0
OBSERVED PERIOD ( s e c . )
FIGURE A - 1 . BASE SHEAR COE FFICIENTS OF MULTI-STORY CONCRETE BUILD INGS SUBJECTEDTO STRONG GROUND SHAKING DURING 1 9 71 SAN FERNANDO EARTHQUAKE
( R e f e r e n c e A - 6 0 )
A-54

8/22/2019 6848574
http://slidepdf.com/reader/full/6848574 264/394
RESEARCH BIBLI OGRAPHY FOR THE EARTHQUAKE STRUCTURAL DAMAGE
LITERATURE REVIEW
1 J. A. Blume , The Effect of Arbitr ary Variations in Peak GroundAcceleration on Spectral Response, Diablo Canyon Nuclear PowerPlant, URS D-11 30 , May 9, 1977.
2 P. B. Shnab el, and H. B. Seed, "Accelerations in Rock for Earthquakes in Western U . S . " , Bulletin of the Seismological Societyof America, Vol. 6 3, Nos. 2, 1973.
3 M. R. Ploes sel, and J. E. Slosson, "Repeatable High GroundAccelerations from Earthq uakes ", California Geology, September,1974.
4 R. A. Page , D. M. Boore , W. B. Joyner and H. W. Coulte r, "GroundMotion Values for Use in the Seismic Design of the Trans-AlaskaPipeline System", Geological Surve y Circular, 672. Washin gton,D.C., 1 9 7 2 .
5 R. B. Hoffm an, "State-of-the-Art for Assessing Earthquake Hazardsin the United States; Factors in the Specification of GroundMotions for Design Earthquakes in Califo rnia", MiscellaneousPaper S-63-1, U.S. Army Engineers Water ways Experiment Stat ion,Vicksburg, Miss., June, 1974.
6 0. W. Nutt li, "State-of-the-Art for Assessing Earthquake Hazards
in United S tate s; The Relation of Sustained Maximum GroundAcceleration and Velocity to Earthquake Intensity and Magnit ude",Miscellaneou s Paper S- 73-1, Report 16 , November, 1979, U.S. ArmyEngineer Waterways Experiment Station , Vicksburg, Miss., 1979.
7 C. P. Mort gat, and H. C. Shah, "A Bayesian Approach to SeismicHazard Mapping; Develo pment of Stable Design Para meters" , TheJ. A. Blume Earthquake Engineering C enter , Report No. 28, Dept.of Civil E ngr., Stanford Universit y, 1978.
8 C. P. Mortg at,, "A Probabilistic Definition of Effective Acce leration", Proce edings of the 2nd U.S . National Conference onEarthquake Engi neering, Stanford Univ ersity , August 22-24 , 1979,
pp. 743-752.
9 E. H. Vanmarcke and S. P. Lai , "Strong Motion Duration ofEarthq uakes" , M. I.T . Dept. of Civil Engineering Research ReportR 7 7 - 1 6 , 1 9 7 7 .
10 T. C. Hanks , "Measures of High-Frequency Strong Ground Motion" ,Proceedings of the NSF Seminary Workshop on Strong Ground Motion,1978.
A-55

8/22/2019 6848574
http://slidepdf.com/reader/full/6848574 265/394
RESEARCH BIBL IOGRAPHY FOR THE EARTHQUAKE STRUCTURAL DAMAGEL I T E R A T U R E f t E V T E f f
(Continued)
A - U T. C. Hanks, "Seismological Aspects of Strong Motion Seismology",Proceedings of the 2nd U.S. National Conference on EarthquakeEngineerin g, Stanford University , August 2 2-24, 1979, pp.8 9 8 - 9 1 2 .
A-12 M. W. McCann , Jr., and H. C. Shah, "RMS Acceleration for SeismicRisk Artalysis: An Over view ", Pro ceedi ngs of the 2nd U. S. NationalConference on Earthquake Engineering, Stanford University,August 22-24, 1979, pp. 883-897.
A-13 N. M. Newmark, "A Rationale for Development of Design Spectrafor Diablo Canyon Reactor Facili ty", N. M. Newmark ConsultingEngineering Service s, Urbana, Illi nois, September, 1976.
A- 14 R. P. Ken ned y, "Ground Motion Paramet ers Useful in Structural
Design", Structural Mechanics Associates, Inc., Presented at theConference on Evaluation of Regional Seismic Hazards and Risk,Santa Fe, New Mexico, October 21, 1980.
A-1 5 H. Yam aha ra, "Ground Motion During Earthquake and the Input Lossof Earthquake Power to an Excitation of Buildings", Soils andFoundation, Vol. 10, No. 2, 1970, pp. 145-161, Tokyo.
A-1 6 N. M. Newm ark, W. J. Hall and J. R. Mor gan , "Comparison ofBuilding Response and Free-Field Motion in Earthquakes",Proceedings of the 6th World Conference on EarthquakeEngineering, New Delhi, India, 1977.
A-1 7 R. H. Scan Ian, "Seismic Wave Effects on Soil- Struc ture-Interaction", Earthquake Engineering and Structural Dynamics,V o l . 4, 1976, pp. 379-338.
A- 18 N. Ambr asey s, "Character of Strong Ground Motion in the Near
Field of Small Magnitude Earthquakes", Invited Lecture, 5 Conf.European Committee for Earthquake Engineering, Istanbul,September, 1975 .
A-1 9 J. R. Whitel y, J. R. Morgan, W. J. Hall , and N. M. Newmark "BaseResponse Arising from Free-Field Mo tion s", Transactions of the4th SMiRT Conference, Vol. K(a ), 1977.
A-20 D. Ray and D. P. Jhaveri , "Effective Seismic Input Through RigidFoundation Filtering", Transactions of the 4th SMiRT Conference,V o l . K ( a ) , 1 9 7 7.
A-56

8/22/2019 6848574
http://slidepdf.com/reader/full/6848574 266/394
RESEARCH BIBLIOGRAPHY FOR THE EARTHQUAKE STRUCTURAL DAMAGELITERATURE REVIEW
(Continued)
A-21 W. J. Hall , J. R. Morgan and N. M. Newmark , "Traveling SeismicWaves and Structural R esp ons e", Proceedings of the SecondInternational Conference on Microzo nati on, Vol. Ill, SanFrancisco, California, November, 1978.
A-22 Reduction in Free-Field Ground Motion Due to the Presence ofStru ctur es, Submitted to: Southern California Edison Company byTERA Corporation, August, 1980.
A - 2 3 C. B. Crou se, "Prediction of Free-F ield Ear thquake Ground
Motion s" Proceeding s ASCE Conferen ce on Earthquake Eng r. & SoilDynamics, 1978.
A - 2 4 G. W. Housner, "Statistics of Pulses on Strong Motion Accelerograms", Proceedings of the NSF Seminar Workshop on Strong GroundM o t i o n , 1 9 7 9 .
A-25 G. W. Housn er, "Spectrum Intensities of Strong Motion Earthq u a k e s " , Proceedin gs of the Symposium on Earthquake and BlastEffects on Stru ctures, EERI, June, 19 75, pp. 20-36.
A-26 J. A. Blume , "Instrumental Versus Effective Acceleratio n",Report D - U 26, Final Safety Analysis Report, Units 1 and 2,
Diablo Canyon Sit e, Amendment N o. 50 . "Seismic Evaluation forPostulated 7.5M Hosgri Earthquak e", U.S. Nuclear RegulatoryCommission Docket No s. 50-275 and 50-23 2, 1977.
A-27 R. V. Whitman, "Effective Peak Acceleration", Proceedings of the2nd International Conference on Microzonation, San Francisco ,V o l . Ill, 1578, pp. 1247-1255.
A-28 S. A. Short, R. P. Kennedy, et al, "Nonlinear Response of a
Nuclear Plant to a Moderate Magn itude , Near-Field Earthquake",ASCE Specialty Conference on Civil Engineering and Nuclear Power,K n o x v i l l e , T e n n e s s e e , S e p t e m b e r , 1 9 8 0 .
A-29 G. W. Housner, "Measures of Severity of Earthquake GroundShaking", Proceedings of the U. S. National Conference onEarthquake Engineering, EERI, Ann Arbor, Michigan, June, 1975,p p . 25-33.
A-30 J. A. Blume , "On Instrumental Versus Effective Acceleratio n andDesign Coeffici ents", Proceedings of the 2nd U. S. NationalConference on Earthquake Engineerin g, Stanford, California, 1979
A - 5 7

8/22/2019 6848574
http://slidepdf.com/reader/full/6848574 267/394
RESEARCH BIBLIOGRAPHY FOR THE EARTHQUAKE STRUCTURAL DAMAGEL I T E f t A T U f t E R E Y T b r
(Continued)
A-3 1 S. H. Harz ell, J. N. Brune and J. Princ e, "The October 6, 1974 ,Acapulco Earthquake; An Example of the Importance of Short-PeriodSurface Waves in Strong Ground Motion", Bulletin of theSeismological Society of America, Vol. 68, December, 1978 , pp.1 6 6 3 - 1 6 7 7 .
A-32 6. W. Housner, "Earthquake Research Needs for Nuclear PowerPlants", Journal Power Divisi on, Proceedings ASCE, Vol. 97,1 9 7 1 , pp. 77-91.
A-33 W. K. Cloud, "Intensity Map and Structural Damage, Parkfield,Californi a Earthquake of June 2 7, 1966 ", Bulletin of theSeismological Society of America, V ol. 57, No. 6, 1967, pp.1 1 6 1 - 1 1 7 8 .
A-3 4 J. F. Lander, Editor, Seismological Notes, Bulletin ofthe Seismological Society of America, Vol. 62, No. 5,January-February, 1972, pp. 1360-1362.
A-35 C. Rojah n, Selected Papers on the Imperial Valle y, Californi aEarthquake of October 15, 1979, U.S. Geological Survey, OpenFile Report 80- 1094, 1980.
A-36 6. E. Brandow, et al. Reconnaissance Report, "Imperial County,California Earthquake of October 15, 1979", EarthquakeEngineering Research Institute, February, 1980.
A-37 R. C. Murray, T. A. Nelson, et al, "Response of El Centro SteamPlant Equipment During the October 15 , 1979, Imperial Va lleyEarthquake", Lawrence Livermore Laboratory, NUREG/CR-1665,UCRL-53005, September, 1980.
A-38 Reconnaissance Reports - Imperial Valley Earthquake, October 15,1 9 7 9 , USNRC Earthquake Team Report, November, 1979.
A-39 R. Console, F. Peronaci, A. Sonaglia, Relazione Sue FenomeniSismica Dell 'Anconitano, 197 2, Annali di Geofi stica , Vol . 26,Supplement, 197 3, Rome .
A-4 0 J. A. Blume, "Performance of Industrial and Power Facilities inMajor Earthquakes", Report D-11 34, Final Safety AnalysisRepo rt, Units 1 and 2, Diablo Canyon Site , Amendment No . 50,"Seismic Evaluation for Postulated 7.5M Hosgri Earthquake",Nuclear Regulatory Co mmission, Docket N os. 50-275 , and 50-232,1 9 7 7 .
.V58

8/22/2019 6848574
http://slidepdf.com/reader/full/6848574 268/394
RESEARCH BIBLIOGRAPHY FOR THE EARTHQUAKE STRUCTURAL DAMAGELITERATURE klJWH
(Continued)
A-41 R. L. Cloud, "Seismic Performance of Piping in Past Earthquakes",
ASCE Specialty Conference on Civil Engineering and Nuclear Power,Knoxville, Tennesee, September, 1 9 8 0 .
A-42 J. F. Meehan, H. J. Degenkolb, e t a l , "Managua, NicaraguaEarthquake of December 2 3 , 1972", Earthquake EngineeringResearch Institute, M a y , 1 9 7 3 .
A-43 J. A. Blume, A Structural Dynamic Analysis of Steel PlantStructures Subjected t o t h e M a y , 1 9 6 0 , Chilean Earthquakes,
Bulletin of the Seismological Society of America, V o l . 5 3 ,February, 1 9 6 3 , p p . 4 3 9 - 4 8 0 .
A - 4 4 0 . Steinhardt, Report on Magnitude 5.7 Ferndale Earthquake of
June 7 , 1 9 7 5 , PG&E Company.
A-45 P. I. Yanev, T . A . Moore and J. A. Blume, "Fukushima NuclearPower Station, Effect and Implications o f t h e June 1 2 , 1 9 7 8 ,Miyagi-Ken-Oki, Japan, Earthquake", U R S Reconnaissance Report,Copy 6 6 , January, 1 9 7 9 .
A-46 R. P. K e n n e d y , W . H . Tong and S. A. Short, "Earthquake DesignGround Acceleration Ver sus Instrumental Peak Ground Accelera
tion", Report SMA 12501.01, Structural Mechanics Associates,Inc., Newport Beach, 6a^lifornia, October, 1 9 8 0 .
A-47 J. A. Blume, "On the Attenuation of Ground Motion by Large
Foundations", Report D - L L 3 9 * , J . A . Blume, M. R. Somerville,an d R. M. Czarnecki, "A Comparison of Observed and EstimatedPeak Ground Accelerations and Their Probabilities", Report D-LL3 6 * , J. A. Blume, A . S . Kiremedjiian, "Recurrence Relationshipsby Fault Units", Report D - LL 3 7 * , 1 9 7 7 .
A-48 J. A. Blume, "A Busy Start for the New Decade", Newsletter,
EERI, V o l . 1 4 , N o . 2 , March, 1 9 8 0 .
A-49 J. A. Blume and M . H. Stauduhar, ( e d s . ) , "The Thessaloniki,Greece Earthquake of June 2 0 , 1978", EERI, January, 1 9 7 9 .
* Final Safety Analysis Report, Units 1 and 2, Diablo Canyon Site,Amendment N o . 5 0 , "Seismic Evaluation for Postulated 7.5M HosgriEarthquake", 1 9 7 7 , USNRC, Docket N o s . 50-275 and 50-232.
A-59

8/22/2019 6848574
http://slidepdf.com/reader/full/6848574 269/394
RESEARCH BIBLIOGRAPHY FOR THE EARTHQUAKE STRUCTURAL DAMAGELITERATURE REVIEW '
(Continued)
A-5 0 J. A. Blume, "The Motion and Damping of Building Relative to
Seismic Response Spec tra", Bulletin of the Seismological Societyof America, 60:231-249, Febru ary, 1970.
A-51 J. A. Blume , "Allowable Stresses and Earthquake Perfo rman ce",Proceedings of the 6th World Conference on EarthquakeEngineering, New Delhi, 1977 .
A-52 J. A. Blume, "Structural Dynamics in Earthquak e-Resist ant
Design",Journal of the Structural Div ision, ASCE, July, 1958 .
A-5 3 B. A. Bolt and R. A. Hansen , "The Upthrow of Objects in
Earthquakes", Bulletin of the Seismological Society of America,V o l . 67, No. 5, October, 1977, pp. 1415-1427.
A- 54 R. L. Cloud, "How Nuclear Piping Code Rules Will Influence PipingDesign Today and Tomorrow", Heating, Piping & Air Condi tions,J u n e , 1 9 7 0 , p . 6 9 .
A-55 W. K. Cloud, The Great Alaska Earthquake of 1964, Engineering,National Academy of Sci ences, Washington, D. C., 1973.
A-56 C. A. Cornell and N. M. Newma rk, "On the Seismic Rehab ility ofNuclear Power Plants", Proc. Topical Mtg . on ProbabilisticAnalysis of Nuclear Reactor Safety, Vol. 3 ANS, 19 78, pp.XXIVI-1 to 1-14.
A-5 7 N. C. Donova n, B. A. Bolt and R. V. Whit man, "Development ofExpectancy Maps and Risk Analy sis", Jour nal, StructuralDivision, Proceedings, ASCE, 1978.
A-5 8 K. V. Steinbrugge , et. al ., "San Fernando Earthquake, February 9,1971", Pacific Fire Rating Bureau, San Francisco, California,1971.
A-59 W. J. Hall, B. Mohr az and N. M. Newmark, Statistical Studies ofVertical and Horizontal Earthqua ke Spectr a, prepared for USNRC,Report NUREG-0003, January, 1976.
A-6 0 G. W. Housner, and P. C. Jenning s,, "Earthquake Design Criteriafor Structures", Report No. EERL 77-06, EERL, CaliforniaInstitute of Technology, Pasadena, November, 1977.
A-61 Jungmann, "Documentation of the Earthquake in the SchwabiacheAlb on 3 September 1978" , Kraftwerk Union, October 11, 1978.
A - 6 0

8/22/2019 6848574
http://slidepdf.com/reader/full/6848574 270/394
RESEARCH BIBLIOGRAPHY FOR THE EARTHQUAKE STRUCTURAL DAMAGELITERATURE REVIEW
(Continued)
A-62 D. L. Leeds, ( e d . ) , "Earthquake in Roma nia, March 4, 1977",EERI, V o l . 1 1 , N o . 3 B , M a y , 1 97 7.
A-6 3 R. K. McGuir e and T. P. Bernard, "The Usefulness of GroundMotion Duration in predicting t he Severity of Seismic Shak ing,"Proceedi ngs of the 2nd U. S. National Conference on EarthquakeEngineering, Stanford University, August 22-24, 1979.
A-6 4 R. K. Miller and S. F. Felszegh y, "Engineering Features of the
Santa Barbara Earthquake of August 13, 1978", EERI, UCSB-ME-78-2,
December, 1978.
A-65 D. Moran, G. Ferver, et al, "Engineering Aspects of The Lima,Peru Earthquake of October 3, 1974", E E R I , M a y , 1 9 7 5 .
A-66 J. L. Mulloy, "San Fernando Earthquake of February 9, 1971",
Effects on Power System Operation and Facilities, Department ofWater and Power, City of Los Angeles, October 1974.
A-67 L. Murphy, "San Fernando , California Earthquake of February 9,1971", Sci-Coord., U .S. Dept. of Commerce, NOAA, 3 Vols.,Washington, D.C., 1973.
A-6 8 N. M. Newmark , Testimo ny Before the Atomic Licensing AppealBoard USNRC, Pacific Gas and Electric Company (Diablo CanyonNuclear Power Plant Units No s. 1 and 2 ) , Docket No s. 50-275 and50-323.
A-6 9 N. M. Newmark , W. J. Hall and B. Mo hra z, "A Study of Verticaland Horizontal Ea rthqua ke Spectra, " Directorate of Licensi ng,U. S. Atomic Energy Commission Report W ASH-1255, April, 1973.
A- 70 N. M. Newmark , J. R. Morgan and W. J. Hal l, "Response Spectra ofCombined Translation and Torsion For A Traveling Seismic Wave,Prepared for NRC, Contract NRC-04- 058, September, 1978.
A-71 N. M. Newmar k, "Interpretation of Apparent Upthrow of Objects inEarthquakes", Proceedings of the 5th World Conference onEarthquake Engineering, Rome, Vol. 2, 1974, pp 2338-2343.
A-7 2 N. M. Newma rk, "Seismic Design Criteria for Structures andFacilities: Trans-Alaska Pipeline System", Proceedings of theU.S. National Conference on Earthquake Engineering, Ann Arbor,Michigan, 1975.
A - 6 1

8/22/2019 6848574
http://slidepdf.com/reader/full/6848574 271/394
RESEARCH BIBLIOGRAP HY FOR THE EARTHQUAKE STRUCTURAL DAMAGELITERATURE mmi
(Continued)
A-73 R. A. Page, J. A. Blume and W. B. Joyner, "Earthquake Shaking
and Damage to Build ings", Science Vo l. 189, No. 4203, August 22 ,1975.
A-74 C. Rojahn, B. J. Merri ll, et. al , "The Island of Hawaii Earthquake", EERI, Vol. 10, No. 18, February, 1976.
A-75 J. 8. Savy, "Determination of Seismic Design Parameters: AStochastic Approach", M . I . T . , Cambridge, Massachusetts.
A-7 6 A. I. Snyder , "Damage to Mechanical Equipment as the Result ofthe February 9, 1971 Earthquake in San Fernando, California,"Seismic Design and Analysis, American Society of MechanicalEngineers, 1971.
A-77 0. W. Steinhardt, "Protecting A Power Lifeline AgainstEarthquakes", Journal of the Technical Councils of ASCE,November, 1978.
A-78 0. W. Steinhardt, "Low-Cost Seismic Strengthening of a PowerSystem", ASCE Preprint 80-076, April, 1980.
A-79 J. M. Stephenson , "Earthquake Damage to Anchorage Area
Utilities", U. S. Naval Civil Engineering Laboratory, June, 1954.
A-80 J. L. Stratta and L. A. Wyll ie, Jr., "Reconnaissance Report,Friuli, Italy Earthquakes of 1976", EERI, January, 1979.
A-81 J. L. Stratta, T. J. Canon, et al, "Reconnaissance ReportMindana o, Phillippines Earthquake, August 17, 1976", E E R I ,August, 1977.
A-8 2 W. F. Swig er, "Notes on Plants Designed by Stone & Webster WhichHave Experienced Large Earthquakes", 1979 (unpublished).
A-83 J. M. Tanaka, "Airports and Air Traffic Control Facili ties",U . S . Army Corps of Engineers District, Alaska, 1967.
A-84 A. Rutenberg, P. C. Jennings and G. W. Housner, "The Response ofVeterans Hospital Building 41 in the San Fernando Earthquake",EERI Report 80-03, May, 1980.
A - 6 2

8/22/2019 6848574
http://slidepdf.com/reader/full/6848574 272/394
RESEARCH BIBLIOGRAPHY FOR THE EARTHQUAKE STRUCTURAL DAMAGE
LU'ERATURE REVIEW
(Continued)
A-85 J. E. Valer a, H. B. Seed, C. F. Tsai and J. Lysmer, "Seismic
Soil-St ructure Interaction Effects at Humboldt Bay Power Plant",Journal of the Geotechnical Engineering Division, ASCE, Vol.103, No. GTIO, October, 1977.
A-8 6 E. H. Vanmarc ke and S. P. La i, "Strong-Motion Duration and RMSAmplitude of Earthquake Records", Bulletin of the SeismologicalSociety of America, Vol . 70, No. 4, August, 1980, pp 1293-1307.
A-87 H. S. Lew, E. V. Leyendecke r, and R. D. Dikkers, "Engineering
Aspects of the 1971 San Fernando E arthq uake ", U.S. Department ofCommmerce, National Bureau of S tandard s, Washingt on, D.C., 1971.
A-8 8 R. Vignola and E. Arz e, "Behavior of a Steel Plant Under MajorEart hqua kes" , Proceedi ngs of the 2nd World Conference onEarthquake Engineering, Japan, 1960.
A-89 H. M. Waldr on, R. P. Miller and S. 0. Wer ner , "GeotechnicalInvestigations at Nuclear Power Plant Site s", NuclearEngineering and Design , North Holland Publishing Company, Vol.3 6 , 1976, pp. 397-405.
A-90 S. D. Werner , "Engineering Characteristics of Earthquake GroundMotions," Nuclear Engin eering and Design , North HollandPublishing Company, Vol . 36, 1976, pp.367-395.
A-91 S. D. Wern er, "Procedures for Developing Vibrato ry Ground MotionCriteria at Nuclear Power Plant Si tes ", Nuclear Engineering andDesign, North Holland Publishing Company, Vo l. 36, 1976, pp.4 1 1 - 4 4 1 .
A-92 P. I., Yanev , Draft Paper on "Behavior of Power Plants and OtherIndustrial F aciliti es in Past Eart hqua kes" , URS, April 2 8, 198 0.
A-9 3 T. Zsutty and M. Dehe rra, "A Statistical Analysis of Accelerogram
Peaks Based Upon the Exponential Distribution Mode l", StanfordUniversity, Palo Alto, California.
A-94 Letter, N. Hirata, San Francisco District Mgr., Toshiba International Corporation, to T. Mcllraith , Pacific Gas & Electric Co.,San Francisco, California, April 9, 1979.
A-95 Ministry of Power Engineering and Electriciation, "ProvisionalDesign Standards for Nuclear Power Plants in Seismic Regions",Minehnergo, USSR.
A - 6 3

8/22/2019 6848574
http://slidepdf.com/reader/full/6848574 273/394
RESEARCH BIBLIOGRAPHY F O R T H E EARTHQUAKE STRUCTURAL DAMAGEL I T E R A T U R E R E T T b T
(Continued)
A-96 CIT Reports Published 1 951 , Dynamics Lab orato ry Disa sterResearch Center, EERL, 1980.
A-97 P. I . Yanev, ( e d . ) , "Reconnaissance Re po rt, M iyag i-Ke n-O ki,Japan Earthquake", EERI, June 12, 1978.
A-98 H. Bo lton Seed and John Lysmer, "The S ig ni fic an ce of S it eResponse in Soi l -Structure Interact ion Analyses for NuclearF a c i l i t i e s " , ASCE Sp ecia l ty Conference on C iv i l Engineering andNuclear Power, Knoxvil le, Tennessee, September, 1980.
A-99 T a ll B u ild in g C r i t e r ia and Loa ding , Monograph on Planning andDesign of Tall Buildings, Volume CL, ASCE, 1980.
A-lOO D. E. Hudson, "S tro ng Mo tion Earthquake Measurements i nEpicentral Regions", Proceedings of the 6th World Conference onEarthquake Eng inee ring, New D e lh i, 1 977.
A-1 01 E. H. Vanmarcke, "Random V ib ra ti o n Approach to So il DynamicsProblems", The Use of P ro b a b i l i t ie s in Earthquake En gine ering ,ASCE P re p ri n t 291 3, ASCE F a ll Co nve ntion , San Fran cis co ,C a l i f o rn i a , 1977 .
A-102 "Damage to Pumping and Power S ta ti o n s ", C a li fo r n ia DWR B u ll e ti nNo. 166-3, June, 1967.
A-103 J . Prince and L. Alons o, "The R e la ti v e ly Li gh t Damage Producedby Two Strong Motion Earthquakes in Southern Mexico", Proceedings of the 7th World Conference on Earthquake Engineering,September, 1980.
A-104 J . P rin ce , L. Alon so, and I . Na varro, "Procasamiento deAcelerogramas Obtenidos en 1974, "Reporte del Instituto deIn g e n ie ri a , Universida d Nacional Autonoma de Mexico, Fe brua ry,1976.
A-105 R. B. Ma tthiesen and J . Ragsdale, "P re lim ina ry Report of Stro ng -Motion Data from the August 6, 1979 Coyote Lake Earthquake",USGS, 1979.
A-106 G. Dean, et a l , "1979 Coyote Lake (G ilr o y) Earthq uake ", EERINewsletter, September, 1979.
A-107 R. K. Reitherman , "Notes on No n-S truc tura l Features of theAugust 6, 1979 Coyote Lake Earthquake", EERI Newsletter,November, 1979.
A-64

8/22/2019 6848574
http://slidepdf.com/reader/full/6848574 274/394
RESEARCH BIBLIOGRAPHY FOR THE EARTHQUAKE STRUCTURAL DAMAGELITERATURE REVIEW
(Continued)
A-108 F. L. M el lo n, "Report of Post-Earthquake In ve st ig at io n TeamCoyote Lake Earthquake o f August 6 , 1 97 9" , CALTRANS O ff ic e o fStructures Design.
A-109 C. F. Arm stro ng , "Coyote Lake Ea rthqu ake , 6 August 1 979",California Geology, November, 1979.
A -l lO Earthquakes - Ag ad ir, Morocco, February 1 9, 1 960, Skop je,Yugoslavia, July 26, 1963; Anchorage, Alaska, March 27, 1964;Caracas, Venezuela July 1967, American Iro n and Steel I n s t i t u t e ,1975.
A-1 1 1 Managua, Nicaragua Earthquake of December 23. 1972. EERIConference Proceedings, San Fran cisc o, C a l i fo rn ia , Vo l. I & I I ,November 29 & 30, 1973.
A-11 2 B u il d in g Performance i n the 1972 Managua Earthqu ake , NBSTechnical Note 807, U.S. Department of Commerce, November, 1973.
A-11 3 M. A. Sozen and R. B. M at th ie se n, "En gin ee ring Report on theManagua Earthquake of 23 December 1973", "National Academy ofSciences, Washington, D.C., 1975.
A-11 4 H er rin g, K. S. et a l . "Reconnaissance Repo rt: Effe cts ofNovember 8, 1980 Earthquake on Humboldt Bay Power Plant andEureka, California Area", NUREG-0766, USNRC, June, 1981.
A-115 G. W. Housner and M. D. T ri fu n a c , "An al ys is of Accelerogram -Parkf ie ld Earthquake", Bul let in of the Seismological Society ofAmerica, Vol. 57, No. 6, December, 1967, pp. 1193-1220.
A-11 6 W. K. Cloud and V. Perez , "Accelerograms - P a rk fie ld Earthquake ",Bullet in of t l ie Seismological Society of America. Vol. 57. No. 6,December, 1967, pp. 1179-1192.
A-11 7 Un ited Sta tes Earthquakes 1966, U.S. Dept. of Commerce, ESSA,
A-11 8 G. B. Oakes hott, "Geologic Hazards P ar kf ie ld Earthquakes",C a li fo rn ia D iv isi on of Mines and Geology. July 1 3, 1966.
A-11 9 J . F. Meehan, "Reconnaisance Report Santa Barbara EarthquakeAugust 13, 1978", Off ice of the State Architect, Sacramento,C a l i f o r n i a .
A-65

8/22/2019 6848574
http://slidepdf.com/reader/full/6848574 275/394
RESEARCH BIBLIOGRAPHY F O R T H E EARTHQUAKE STRUCTURAL DAMAGEL I T E RA T U R E R E V T W
(Continued)
A-120 United States Earthquakes, 1978, U.S. Dept. of In te ri o r Ge ological Survey and U.S. Department of Commerce, NOAA, Golden,Colorado. 1980.
A-121 J . H. Gates, "A Note on the Fe rnda le, C a li fo rn ia Area Earthquakeof June 7. 1975", (personal correspondence).
A-122 United States Earthquakes. 1 975, U.S. Department of In t e r i o r ,Geo logica l Survey and U.S. Department o f Commerce, NOAA.Boulder. Colorado. 1977.
A-123 "Seismic Report Post-Earthquake In ve s tig a tio n Team. Eureka,California (Trinidad-Offshore) Earthquake of November 8, 1980",CALTRANS, O ff ic e of St ru ct ur es De sign.
A-124 "T rin ida d-O ffsh ore , C a li fo rn ia Earthquake November 8, 1 980",EERI Newsletter, Vol. 15, Part B, January. 1981.
A-125 R. Nason, "Seismic In te ns ity Studies in the Impe ria l V al le y" ,(d ra f t re po rt ) U. S. Geological Survey, Menio Park. C a l i fo rn ia ,1980.
A-126 "Seismic Report Post-Earthquake In ve st ig at io n Team, "Im pe rialV a lle y . C a li fo r n ia , Earthquake of October 1 5, 19 79", CALTRANS,Off ice of Structures Design.
A-127 C. Re al, R. D. McJunkin, and E. Le iva s, "Eff ec ts of Im pe rialVa lley Earthquake 15 October 1 979". Imp erial County. Ca li fo rn ia .California Geology, December, 1979.
A-128 "Ana lysis of the El Centro Steam P la n t" , (d ra ft re po rt) submittedto PG&E by URS/John A. Blume, May, 1 98 1 .
A-129 J . M. Pauschke, C. S. O li v e ir a , H. C. Shah and T. C. Z u tt y . "APreliminary Investigation of the Dynamic Response of the ImperialCounty Services Building During the October 15, 1979 ImperialValley Earthquake", J. A. Blume Earthquake Engineering Center,S tanford Un ive rs i ty , January. 1981 .
A-130 A. K. Chopra and P. C ha kr ab ar ti, "Analy sis of the EarthquakePerformance o f Koyna Dam". Paper No. 1 2 1 , B u l l e t in ISET, V o l. 9 ,No. 2, June, 1972, pp. 49-60.
A-66

8/22/2019 6848574
http://slidepdf.com/reader/full/6848574 276/394
RESEARCH BIBLIOGRAPHY FOR THE EARTHQUAKE STRUCTURAL DAMAGELITERATURE REVIEW
(Continued)
A-131 A. K. Chopra and P. C ha kr ab a rt i, "The Koyna Earthquake and theDamage to Koyna Dam", Bulletin of the Seismological Society ofAmerica. V o l. 63, No. 2, A p r i l , 1 973, pp. 380-397.
A-132 G. V. Be rg, Y. C. Das, K. Gokhale, and A ., V. S e tl u r, "TheKoyna. India Earthquakes". Proceedings of the 4th WorldConference on Earthquake En gin eer ing, San tiago . Ch il e , 1969.
A-1 33 UNESCO Committee o f E xpert s , "Koyna Earthquake of December 1 1 ,1967", Re port, New D e lh i. 1 968.
A-1 34 Dames and Moore Rep or t: Comparison of August 27, 1 978,Monticello Reservoir Earthquake Response Spectra to theOperating Basis Earthquake Response Spectra for the Virgil C.Summer Nuclear Station, submitted to South Carolina Electric &Gas Company, 1980.
A-135 "F ina l Report - Sig nif ic an ce of the M on tice llo ReservoirEarthquake o f August 27 . 1978 to th e V i r g i l C. Summer NuclearS t a t i o n " , prepared f o r South Ca rol ina E le c tr ic & Gas Company,Dames and Moore Report 5182-068-09, May, 1980.
A-136 Personal Communication w it h Robert Whorton, South Ca roli naE le c tr ic and Gas Company, May, 1 981 .
A-137 United Sta tes Earthquakes 1 952, S e ri a l No. 773, U. S. Departmentof Commerce, Coast and Geodetic Survey, Washington, 1954.
A-138 K. V. Steinbrugg e and D. F. Moran, "An Eng inee ring Study of theSouthern C a li fo rn ia Earthquake of J uly 2 1 , 1952 and I t s A ft e rshocks", Bullet in of the Seismological Society of America, Vol.44, No. 2b A p r i l , 1954.
A-139 Earthquakes in Kern County, C a li fo rn ia During 1952, State ofCalifornia, Department of Natural Resources, Division of Mines,SF, Bu l le t in 1 71 , 1955.
A-140 C. F. Ri ch te r. Elementary Seismo logy, W. H. Freeman and Company.San Francisco and London, 1958.
A-1 41 "The LLNL Ea rthqu ake". Impact Ana lysi s Committee Report on theLivermore, California, Earthquakes of January 24 and 26, 1980,UCRL-52956, July 15, 1980.
A-67

8/22/2019 6848574
http://slidepdf.com/reader/full/6848574 277/394
RESEARCH BIBLIOGRAPHY F O R T H E EARTHQUAKE STRUCTURAL DAMAGEL I T E R A T U R E R E v T E w
(Continued)
A-142 G re en vil le (D iablo -Live rm ore ) Earthquakes of January 1 980, EERINewslet ter, Vol . 14, No. 2, March, 1980.
A-143 "Seismic Report Post-Earthquake In ve st iga tio n Team, G re en vi l le ,C a li f o rn ia Earthquake of January 24, 1 980", CALTRANS, O ffi ce ofStructures Design.
A-144 "E ffe cts of Sharpsb urg, Kentucky Earthquake of Ju ly 27, 1 980, onWm. Zimmer Station Moscow, Ohio", Report prepared for theCincinnati Gas and Electric Company. Cincinnati , Ohio, Sargent
and Lundy Engineers and Fugro, I n c . , Janu ary, 1 981 .
A-145 C on trib utio n to the Study of F r i u l i Earthquake of May^ } ^ ^ ^ *CNEN-ENFL Commission on Seismic Problems Associated with theInstal lat ion of Nuclear Plants, November, 1976.
A-146 P. Re pe tto, I. Aranzo and H. B. Seed, "In flu en ce of S ite Con ditions on Building Damage During the October 3, 1974 Lima Earthquake", Report No. UCB/EERC-80/41. September. 1980.
A-147 "O ro vi l le , C a l i f o rn ia . Earthquake. August. 1 975", Special Report124, C a li f o rn ia D ivis ion of Mines and Geology, 1975.
A-148 H. B. Seed, I . M. Id r is s , and H. D e zf ul l ia n, "R elat ions hipBetween Soil Conditions and Building Damage in the CaracasEarthquake of Ju ly 1 9, 1 967", Report No. EERC 70 -2 , F ebruary ,1970.
A-149 S. S. Tezcon, V. Y e r l i c , and H. T. Du rgunoglu, "A ReconnaissanceReport f o r th e Romanian Earthquake of 4 March 1 977 ", EarthquakeEngineering and S tru ct ur al Dynamics. Vo l. 6. 1 978, pp. 397-421.
A-150 Earthquake in Romania, ^^gi ch 4 . 1 977, An Engine ering Re po rt.National Research Council and EERI, 1980.
A-1 51 "Sp ecial Issue - An Eng ineering Report on the Ch ilean Earthquakesof May, 1960". Bul let in of the Seismological Society of America.Vol. 53. No. 2, February, 1963.
A-152 United Sta tes Earthquakes 1949, S e ria l No. 748, U. S. Departmentof Commerce, U.S. Coast and Geodetic Survey, Washington, 1951.
A-153 Un ited State s Earthquakes 1 928-1 935. U.S. Department of Commerce,Environmen tal Science Services A d m in is tr a tio n , Coast and GeodeticSurvey, Washington, 1969.
A-68

8/22/2019 6848574
http://slidepdf.com/reader/full/6848574 278/394
RESEARCH BIBLIOGRAPHY FOR THE EARTHQUAKE STRUCTURAL DAMAGELITERATURE REVIEW
(Continued)
A-154 Un ited Sta tes Earthquakes 1 936-1 940, U.S. Department of Commerce,Environmental Science Services Administrat ion. Coast and GeodeticSurvey, Washington, 1969.
A-155 Earthquakes and Blas t E ffe ct s on S tr uc tu re s, Proceedings ofSymposium, Los Angeles, June, 1952, Sponsored by EERI andUniversi ty of Cal i forn ia, September, 1952.
A-156 A. G. S yl ve st er , "The Mammouth Lakes, C a li fo r n ia , Earthquakes,25-31 May 1 98 0", Department of Geo log ica l S cien ce s, U.C. SantaBarb ara, May 3 1 , 1 980.
A-157 P. C. Je nn ings , En gine ering Feature s of the San FernandoEarthquake February 9, 1971 , C a l i f or n i a I n s t i tu te of Technology,EERL 71-02, 1971.
A-158 Un ited Sta tes Earthquakes 19 71 , U.S. Department of Commerce,NOAA, Boulder, Colorado, 1973.
A-159 G. Howard, et a l , "Earthquake Ef fec ts at Nuclear F a c i l i t ie s -San Fernando Earthquake of February 9. 1971 " , U.C. Los Angeles,UCLA ENG-7215, February, 1972.
A-160 S. H. Mendes, "Earthquake Re sistance of Modern B ui ld in gs - ACase Stu dy", The 50-Year Ev en t, Proceed ings of the 1980 SEADCConvention, Monterey, October 2-4, 1980.
A-161 M. A. Lars on, "Needed Improvements i n A Seismic De sig n", Stru ct u r a l Moments, SEAOC p u b li c a ti o n , Feb ruary, 1 980.
A-162 S. A. Ma hin, e t . a l , "Response of the O live View H os pita l MainB u il d in g D uring th e San Fernando Ea rthq ua ke ", EERC 76 -22 .Un ivers i ty o f Ca l i fo rn ia . Berke ley, October . 1976.
A-163 A. Ru thenberg . P. C. Je nn ing s, and G. W. Housner. "The Response
of the Veterans Hospital Building 41 in the San FernandoEarthquake". Earthquake Engineering Research Laboratory, ReportEERL 79-03, C a li fo rn ia In s t i tu te of Technology, Pasadena,C a l i f o rn ia , 1 9 7 9 .
A-69

8/22/2019 6848574
http://slidepdf.com/reader/full/6848574 279/394
A P P E N D I X B
I N P U T G R O U N D M O T I O N D A T A
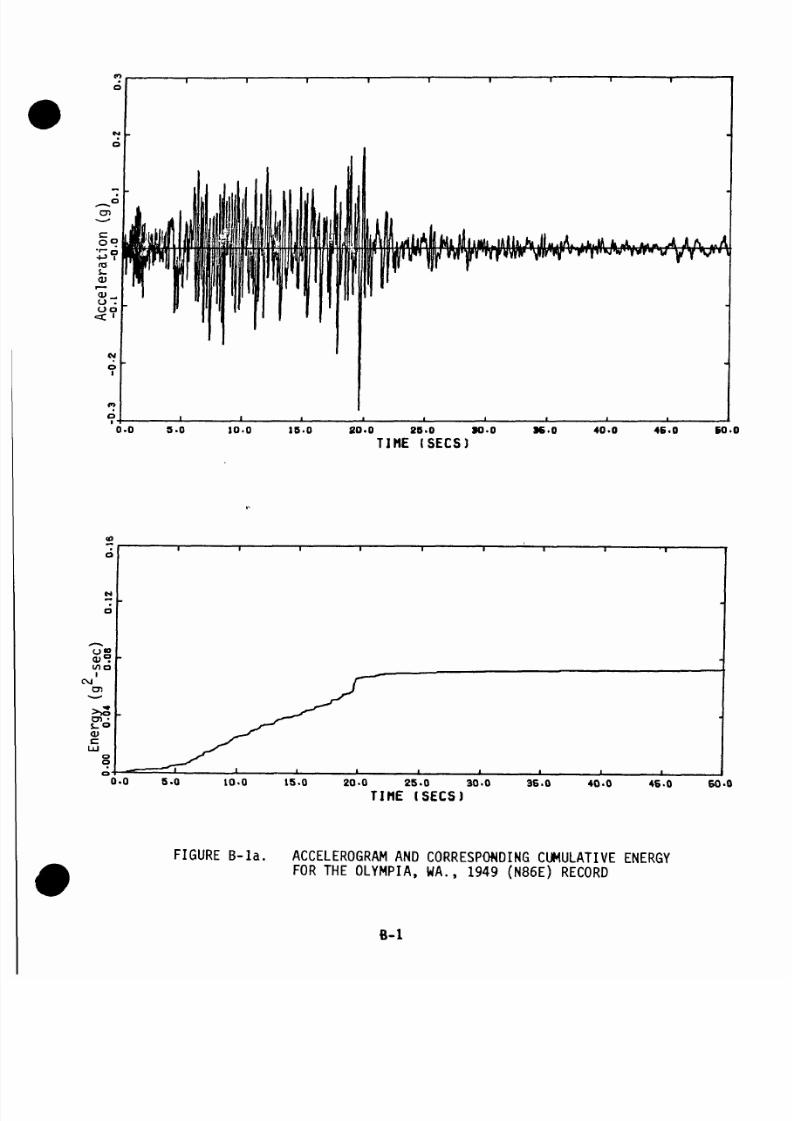
8/22/2019 6848574
http://slidepdf.com/reader/full/6848574 280/394
80.0 2B.0 90.0
T I H E ( S E C S )96.0 40.0 4E.0 EO.O
5.0 10.0 IS.O 20.0 25.0 30.0 38.0
T I H E ( S E C S )40.0 4&.0 60.0
FIGURE B-la. ACCELEROGRAM AND CORRESPONDING CUMULATIVE ENERGYFOR THE OLYMP IA, WA., 1949 (N86E) RECORD
B-1

8/22/2019 6848574
http://slidepdf.com/reader/full/6848574 281/394
0.0 5.0 1 0 - 0 I S .O 2 0 . 0 2 S . 0 3 0 - 0
T I M E ( S E C )35.0 4 0 . 0 4 E . 0
40.0 4C .O M. O SCO
TIHE tSECi
FIGURE B-lb. ACCELEROGRAM A N D CORRESPONDING CUMULATIVE ENERGYFOR T H E TAFT , KERN CO., 1 9 5 2 (S69E) RECORD
B-2

8/22/2019 6848574
http://slidepdf.com/reader/full/6848574 282/394
^ ^c r .
c zo
' r -
• M
r e£-<U
r—
<uoo
<t
o
IVt
o
a
Q
~*o1
. 1 1 i j
.^...AkJil••ftWrm11
'
"
0 .0 5 . 0 1 0 . 0 1 5 - 0 2 0 - 0 2 5 - 0 3 0 - 0
T I M E ( S E C S )
3 5 . 0 4 0 - 0
0-0 5-0 10.0 IS.O 20-0 2S-0
TIME (SECS)3 0 - 0 3 5 . 0 4 0 . 0
FIGURE B-lc. ACCELEROGRAM A N D CORRESPONDING CUMULATIVE ENERGY F O R T H E
EL CENTRO, ARRAY NO. 1 2 , IMPERIAL VALLEY 1 9 7 9 (140) RECORD
B-3

8/22/2019 6848574
http://slidepdf.com/reader/full/6848574 283/394
a>
s -
01
oo•a:
I S . O 2 0 . 0 2 5 . 0 3 0 . 0
TIME ( S E C )
CO
O JOi
s-
c:
r v lo'.o is'.oTint (sec)
20.a 28.0 30.0
FIGURE B-ld. ACCELEROGRAM A N D CORRESPONDING CUMULATIVE ENERGYFOR T H E ARTIFICIAL (R.G. 1.60) RECORD
B-4

8/22/2019 6848574
http://slidepdf.com/reader/full/6848574 284/394
o>
co
•I—•M(C
s-
cuoo
•X .
0.0 s-o 10.0 IS.O 20.0 2S.0T I M E ( S E C S )
30.0 36 .0 40 .0 4S .0
IC>0
en> ,ens-
c
0.0 s.o 10.0 IS.O 20.0 28-0T I M E ( S E C S )
30.0 36 .0 40 .0 4C .0
FIGURE B-le. ACCELEROGRAM A N D CORRESPONDING CUMULATIVE ENERGY F O RTHE PACOIMA DAM, S A N FERNANDO, 1 9 7 1 (S14W) RECORD
B-5

8/22/2019 6848574
http://slidepdf.com/reader/full/6848574 285/394
lO-O 15.0 20.0 25.0
T I M E ( T E C S )30-0 35-0 40.0 45 .0
20.0 25 .0
TIHE(5EC5)30.0 3S.0 40.0 45.0
FIGURE B - l f . ACCELEROGRAM AND CORRESPONDING CUMULATIVE ENERGY FOR THE
HOLLYWOOD STORAGE P.E. L OT, SAN FERNANDO, 1971 (N90E) RECORD
B-6

8/22/2019 6848574
http://slidepdf.com/reader/full/6848574 286/394
10.0 15.0 20.0 25.0 30.0TIME (SECS)
36.0 40.0
o(/I
CVJ
>>ens-c
0.0 8.0
6
o•
o
s•
a
IBo•o
s•
a
3
1 1 1 1 1 1 1 • - •
/ ^
1• /
-
/
;
\
/ 110.0 IS.O 20.0
TIH E (SEC S)25.0 30.0 3S.0 40.0
FIGURE B-lg. ACCELEROGRAM A N D CORRESPONDING CUMULATIVE ENERGY F O R T H EEL CENTRO ARRAY NO. 5 IMPERIAL VALLEY, 1 9 7 9 (140) RECORD
B-7

8/22/2019 6848574
http://slidepdf.com/reader/full/6848574 287/394
en
4->
(U
oo<
0.0 s.o 1 0 . 0 1 5 . 0 2 0 . 0
T I M E ( S C E S )
25 . 0 30 . 0
o
rCM
C 3 »
S -
< u
1 0 . 0 1 5 . 0
T l t l E I S E C S )2 0 . 0 25 . 0 30 . 0
FIGURE B-lh. ACCELEROGRAM A N D CORRESPONDING CUMULATIVE ENERGY F O R T H EUCSB GOLETA , SANTA BARBARA 1978 (180) RECORD
B-8

8/22/2019 6848574
http://slidepdf.com/reader/full/6848574 288/394
en
co
S-
0)
oo
0.0 5.0 10.0 IS.O
T I M E ISECS )
20.0 25.0 30.0
0.0 8.0 10.0 18.0
T I H E ( S E C S )20.0 26.0 90.0
FIGURE B-li . ACCELERO GRAM AND CORRESPONDING CUMULATIVE ENERGY FOR
THE GILROY ARRA Y NO. 2 , COYOTE LAKE 1979 (050) RECORD
B-9

8/22/2019 6848574
http://slidepdf.com/reader/full/6848574 289/394
10.0 15.0 20.0 25.0 30.0
T I M E ( S E C S )36.0 40.0
a
t/l o1
1C31
Eng
0.08
O
s
^ ' ^
/'^""^
•
/
,y .
1 1 1 1 1
•j
0.0 s.o 10.0 15.0 20.0 25.0 30.0 36.0 40.0
T I H E ( S E C S )
FIGURE B- lj. ACCELEROGRAM A N D CORRESPONDING CUMULATIVE ENERGY FOR THECHOLAME ARRAY N O . 2 , PARKFIELD 1966 (N65E) RECORD
B-IO

8/22/2019 6848574
http://slidepdf.com/reader/full/6848574 290/394
0.0 2.0 4.0 6.0
T I M E ( S E C )
12.0
.0 2.0 4.0 8.0
T I M E t S E C )8.0 10.0 lt.D
GURE B-lk. ACCELEROGRAM AND CORRESPONDING CUMULATIVE ENERGY FOR
THE GAVILAN COLLE GE, HOLLISTE R, 1974 (S67W) RECORD
B-11

8/22/2019 6848574
http://slidepdf.com/reader/full/6848574 291/394
15.0
T I M E ( S E C )20.0 25.0 30.0
15.0
T I M E ( S E C )
20^ 25^0 30 0
FIGURE B-11 . ACCELEROGRAM AND CORRESPONDING CUMULATIVE ENERGY FOR
THE MELENDY RANCH BARN, BEAR VALLEY 1972 (N29W) RECORD
B-12

8/22/2019 6848574
http://slidepdf.com/reader/full/6848574 292/394
? ? t ^ ^ T t ^ j t f I ? ? < M ? ? ? ^ " * ? 3 1 S » 7 « 9 J 0 '
-3—n~rn7TT?—3—rmTTTTtf 3 i M u (ill's-FREOUENCr IHERIZI
-
5-bZ W0 «•
£E *
< = .« -J-1 - .UJUI
cr
UJ1— nt'3
0
CD 0cr - 1 .
0 « ;0:3 "^UJ >0-VIQ_ «rt-
»
0- ? ? 1 ?
•*
n
V.11
y'
/r-
^ r" "^^y"^
K
j ^ j
^^y\
^—/
1? ?
* \U\•A rS V^Ajfx-^^X.' x ^ ^ y - C :' ' ^ ^ ' ' ' ^ S —
• ^
1 ? ?
r J ^
^ U 7^v x i~ V/^^//^*.*'
?!?
\ , . >V ^Y >^i*^•-2^^
i'^
^
? ?
DAMP INC
^' ^ S s ^
^*<:^
•) ? •
0.070
0 . 100
0 . 1 5 0
0.200
0.250
'?? J•r>t
t
• •
ta
VI
• *
•» •
i^ V
b
• •
.«
.«»
T-TTTTTTT? 5 T T T T T n T FFREOUEMCT (MERTZI
"1 — I i i i U i t o -
EL CENTRO. BRRBT NO- 12
10"'
S"b
^ ' •
? ? ? l " ^ '. ? f ? ?r??.!" ? ? 't S 6 769,10'
OBMPING 0-070
0. 100
0. 150
0.200
0.250
1 0 ' 1 i i i i H^\tf 3 r T T T T U T F J 8 3 ' ^
IPFT
10"' ! 3 « 5 6 7 « a J C f ! i I | 5 6 7 e 9 l 0 ' J J l | S « 7 a 9 | l C f—I 1 1—I—u-i—I I r 1 1 1 1 I I • • ' I I ..n
(S o
a -t
DAMPING 0.070
0. 100
0.150
0.200
0.250
TTTTTTTTo i 3— rTTTTTTTt f i—TTTTTTJlo'FREOUENCr (HERTZ)
10'
B R T I F I C I B L
FIGURE B-2a. ELASTIC RESPONSE SPECTRA (T||j > 9 SEC.)

8/22/2019 6848574
http://slidepdf.com/reader/full/6848574 293/394
D OI
10"'
2 ffi.
? ? « ? I'Uf ? ; '! ? «?«»J°' ? ? '• M?!>lO"
DBMPING 0.070
0.100
0. 150
0-200
0.250
10" i r m r n T t f 3 m r n r ^FREQUENCT IHEBTZ')
PRCOIMB DRN
1 — m T T T T r t f
10-' ? ? f ? ^ l > U < f ? ? 1 ? * T lW f ? ? 1 s 8 7»? JO-
DBMPING 0 - 0 7 0
0. 100
0 . 1 5 0
0 - 2 0 0
0 - 2 5 0
To ^— r - rX TTTS TTo ' 3 rTTTTTTTt f "FREQUENCT (HERTZ)
~3 i u S 6 7 « q ' i a '
HOLLTWOOO 5T0RBGE
10"' 9 H S i 7 t > 1 0 r 2 J « S i 7 l ( J 0 '• • L— ^ ' ' ' i i 1 r I— I I r
« 5 6 7 _ J 9 J C f
OBMPING 0-070
0 - 1 0 0
0 - 1 5 0
0 . 2 0 0 P
0 . 2 5 0
10" 3 r m T T T T t f 3 — n - T T f T T T t f 3—i i i iHi\lfFREQUENCT (HERTZ)
EL CENTRO. BRRBT NO. 5
10"' J } « 5 S 7 9 9 J 0 P J S « S e J a j J O " ? 3 14 5 8 7 S 9 J 0 '— I I I 1—>- 1 I I r 1 1 1—1 • • • • r 2 • ' T . I I . ^
DAMPING 0.070
0-100
0.150
0.200
0.250
10"
GOLETA
" 1 T T T T T T P i t f 3 TTTTTTsTt f 3 i J U HgWFREQUENCT (HERTZ)
F IG Ur .E B - 2 b . E L A S T I C R E S P O N S E S P E C T R A (2.5 SEC. < T^ < 9 SEC.)

8/22/2019 6848574
http://slidepdf.com/reader/full/6848574 294/394
ft-
-,2 »•
— !«.d • -oc ,„.UJ- • J » .
UJu
<£
UJl_ »M-ID- IDV I -
oo o(£ ^
D 0 .
3 ' ^ 'U J « •tnQ. »n-
10-'
) 0 '
f
i
? 1
i T
5 6 7 as f cT
A . , - - ^/ j ~ ^
Ir^J r^ir^./Jfr^^ III/X /W
4/^/'/yy
f i U i ^ o -
a
J
Zo///// /. / W
^ #f]-J
i
? f ? ? ? ? ?^ 0 ' ? ? ' ! ? ? ? • ?
DRMPING 0 . 0 7 0
0 . 1 0 0
0 . 15 0
0 . 2 0 0
0 . 2 5 0
^ ^ V
I J ~^ - _ ^ ' ^ \ Iff^^
/( ' t r ^ " ' * — ^ — ^ - ^
lf//W' ^ ^ ^ vv// ^ ^ ^ > *
i \ i i U i W i i .1 u u ^
\S
•<-*
•b
•t t
•< •
•tf»
..«-«M
o
• «
• ^
VI
• *
irf
10
F R E Q U E N C T I H E R T Z )
C O T O T E L A K E
St.
10'
? ? ' ) ? » ? ? ? i ' 0 ' % ? ' ! ? ? ; » ? i ' 0 ' ? 3 ' !? ? T ? ? | 1 C I '
D R M P I N G 0.070
0. 10 0
0 . 1 5 0
0.200
0.250
CO
I
T — \ \ kk u M o - — ? — r m T T i T ? 'FREQUENCT IHERTZ)
"1 r^rmjvC'i
PSRKFIELO
>.'°"' ? ? ^ M???»tf 5 ? 1 M???^° 5 LJ _L JL ll i j " ' 10 -
UJ
CE Ot-
1 0' \ k ikiS,
H O L L I S T E R . G R V I L R N
O R M P I N C 0.070
Q . I O O
0 . 1 5 0
0.200
0.250
-1—T-TTTTTTTFFREQUENCY (HERTZ)
T - T T T T U T ^
J ? 1 M ? ? ? K ? ? 1 M T J f ^ t f ? ? 1 5 ; 7 , 9 j o '
D R M P I N G 0.070
0. 10 0
0 . 1 5 0
0.200
0.250
10' i — T T T T r n W i—r TTTTTTTtf-FREQUENCT IHERTZI
MELENOT RRNCH
T r~rTTTaTt'B'
FIGURE B-2c. ELASTIC RESPONSE SPECTRA (T;^ < 2 .5 S E C . )

8/22/2019 6848574
http://slidepdf.com/reader/full/6848574 295/394
.l>»M»iV<VV •
J O 0 0 2 0 0 0 9 0 0 0 q o 0 0 s o 3 0 « 0 0 0 1 0 3 0 K O 0 0 3 0 3 0 1 0 0 3 0 1 1 0 3 0
T I H E I S E C O N O l
FIGURE B -3 a . ELAS TIC RESPONSE OF It DAMPED, 2 , 5 AND 8 HZ OSCILLATORSTO THE OLYM PIA, WA ., (1 9 4 9 ) EARTHQUAKE (N8 6E )
B - 1 6

8/22/2019 6848574
http://slidepdf.com/reader/full/6848574 296/394
v | < 4 ' ^ / i f > ^ | i f 4 | # ^ ' ^ ' V v > ' W i J W w r ' ^ v \ i \ r ^
D 30 S 00 1 0 3 0 I S 0 0 2 0 3 0 2 5 3 3 30 0 3 3' 30 110 30 IS 0 0 5 0 3 0 S 5 0 0
riME ISECOND)
IK^W^^ A.' l».uV^^> .
'=^ 0 s''oc JO 30 IS 00 20 30 2S~03 30 00 ?-" l^ lib 33 JTo o So lo Ss 00
FIGURE B -3 b . EL ASTIC RESPONSE OF 7 % DAMPED, 2 , 5 AND 8 HZ OSCILLATORSTO THE TAFT, KERN CO., 1952 EARTHQUAKE (S69E)
B-17

8/22/2019 6848574
http://slidepdf.com/reader/full/6848574 297/394
3 3 3 <4 :iD
" ** N ^ ' [iM|lfiftw/yA^v^-yi j i r " 'A H-V fcj " *'•••u • •
3 0 0 1 3 3 • 33 J2 33 16 33 20 30 24 33 2S 30 3 33 J 30 <I0 33 >1J 33. IME 'SECOND'
FIGURE B-3c. ELASTIC RESPONSE O F 1% DAMPED, 2 , 5 A N D 8 H Z OSCILLATORS T O T H EEL CENTRO ARRAY NO. 12 , IMPERIAL VALLEY , 1979 EARTHQUAKE (140) •
B-18

8/22/2019 6848574
http://slidepdf.com/reader/full/6848574 298/394
riHE 'SECOND!
30 3 . 00 3- 30 'JO 30 IJt) 33
»' 00 l ' 00 12 00 le 00 21) 00 2\l 00 21 30 } '. 30 j ' t 00 10 30 VI 30
TIME ISECOND)
FIGURE B - 3 d . ELAS TIC RESPONSE OF 7 % DAMPED, 2 , 5 AND 8 HZ
OSCILLATORS TO THE NRC AR T IF IC IA L EARTHQUAKE
B-19

8/22/2019 6848574
http://slidepdf.com/reader/full/6848574 299/394
3 3 3 V 3 0 I 0 0
3 30 U 0 0 a 0 0
1 1 1 ^ ^ 1 ^ . p^iM »•»> H f..i*>i S ¥m~^
l' 00 1 2 0 0 J « 0 0 2 0 0 0 J T o O 2'« 30 92 00 i't DO t'o 30 W 3 0
T I M E ' S E C O N D )0 00 « o o
FIGURE B -3 e . ELA STIC RESPONSE OF 7% DAMPED, 2 , 5 AND 8 HZ OSCILLATORS TOTHE PACOIMA DAM, SAN FERNANDO, 1 9 71 EARTHQUAKE (S1 4W)
B-20

8/22/2019 6848574
http://slidepdf.com/reader/full/6848574 300/394
l^A * '"/'^ ''* •**" ''• '•W'. W-~-it- * r—
•;^ 1 r r 1 10 . 3 3 • 3 3 li 33 2<J 33 3 . . 3 3 1 0 .3 0 116 3 0
riNE ISECOND)
fmnnfi^^'fUvt'' - K
? 1 1 —
0 . 3 0 3 3 0J« 30 MTOO J'^ .OO 43 .00 I j' s 30 S6 .3 0 f iV 00 72.0 0 I 'o . 30 M . 00
f lNE 'SECOND)
y^ivytJo^-i^f*
3 3 0 t o o I t 3 0 2 ^ 3 0 l i 3 0 1 0 . 3 0 1 1 3 0 l \ 00 t \ 30 I 'j 30 10
(IKE ISECOND)0 . 3 0 I S 3 0
B - 3 f . ELAS TIC RESPONSE OF 7% DAMPED, 2 , 5 AND 8 HZ OSCILLATORS TO THEHOLLYWOOD STORAGE P .E . LO T, SAN FERNANDO, 1 971 EARTHQUAKE ( N90E )
B-21

8/22/2019 6848574
http://slidepdf.com/reader/full/6848574 301/394
iVyVV^V^.. </y,J^, "AV
3 33 1 33 t 33 T 2 33 15 33 20 33 2'J 30 28 30 3. 30 3 30 1330 11 30
TIME 'SECOND)
<»Hwy"iif'*» • • /*• O'»• 1 ^
J 2 . 0 3 16 30 2 0 . 0 0 M O O 2« 30 ^ 0 0 9C 00 «b . 0 0 11 30
( IH E IS ECO ND !
3 . 0 0 1 33 t 30
> » y v * i | i f V ' ~ ^ ' » " - . I"
i IKE 'SECOND)
FIGURE B-3g. ELASTIC RESPONSE OF 7 % DAMPED, 2 , 5A N D 8H Z OSCILLATORS T O T H G
EL CENTRO ARRAY NO. 5 , IMPERIAL VALLEY, 1979 EARTHQUAKE (140)
B-22

8/22/2019 6848574
http://slidepdf.com/reader/full/6848574 302/394
3 30 J 30
is /A/y-<y-» .\ V i * •' "^' •• •'^'
" T 1
a 30 V 0 0 « 00 12 00 16 "oij 20 00 2^ 30 3S 30 3*^ 33 3G 33 v'o 30 «1| 3 0T I M E ' S E C O N D )
V-*<rfV*S/*w* • ^ ^ - ^ . . . . T u * .
•' 00 ?2 30 j 's 00 30 00 2^ 30 28 00 3\ 30 3'^ 00 40 00 Ijl* 30
T I M E ( S E C O N D )0 0 0 q 30
B -3 h . ELAST IC RESPONSE OF 7 % DAMPED, 2 , 5 AND 8 HZ OSCILLATORS TOTHE UCSB GOLE TA, SANTA BARBARA, 1 97 8 EARTHQUAKE (1 8 0 )
B-23

8/22/2019 6848574
http://slidepdf.com/reader/full/6848574 303/394
3 3 0 1 3 0
^.i'"ii«'i<iym<*'i".
•' 0 0 J 2 3 0 I'e 3 0 2 0 3 0 2 ^ 3 0 2 1 3 0 9 2 0 0 9'c 3 0 1 0 0 0 1 1 3 0T I M E ' S E C O N D )
0 30 1 30
iA\/*^'** ^*/"i*''u'*'*w''~'^'v"" •
1 30 T o o 12 00 I'c 00 20 30 JT oO 2'« 30 92 00 9C 00 10 30 Hj 30
T I M E 'SECO N D )
FIGURE B - 3 i . ELAS TIC RESPONSE OF 7% DAMPED, 2 , 5 AND 8 HZ OSCILLATORS TO THEGILROY ARRAY NO. 2 , COYOTE LA KE , 1 97 9 EARTHQUAKE (0 5 0 )
B-24

8/22/2019 6848574
http://slidepdf.com/reader/full/6848574 304/394
A / V > -
3 00 T's o TT o 12 33 16 33 20 30 21 33 2'« 30 9'. 33 9 0 0 10 33 iV 30r i M E ' S E C O N D )
^\M»'^""'^w>"'"' > . '.v^ . i ^ * * "
12 00 I'e 00 2b 30 l \ 30 21 30 92 33 96 00 t'o 00 t \ 30
riME 'SECOND)0 30 1 30 I 00
» " Y > \ » » ^ , ^ ' H J ^ ^ . • •VUv '^ . . * •••".••
12 00 16 00 2 0 0 0 2^ 00 2'l 30 9' 30 9V 00 vb 00 11 30
i INE 'SECOND)
3 30 1 00 I 00
B - 3 i ELAS TIC RESPONSE OF 7 % DAMPED, 2 , 5 AND 8 HZ OSCILLATORS TO THECHOLAME ARRAY NO. 2 , PA RK FIE LD , 1 96 6 EARTHQUAKE (N 65 E)
B-25

8/22/2019 6848574
http://slidepdf.com/reader/full/6848574 305/394
" • -yvy^ u—v^vT ' - / '
3 30 2 30 1 0 3 6 3 0 I 03 10 00 12 33 j l j 00 16 00 J'B 30 20 30 22 33
, I M E 'SECO N D!
. r < ^ " ^ » - i ^ m ^
2* 00 l' 0 0 f i ' 0 0 •' 0 0 J O 0 0 j'2 0 0 1 ^ 0 0 1 6 0 0 I S 3 0 2 0 0 0 2 2 0 0
( I M E I S E C O N D )
FIGURE B -3 k . EL ASTIC RESPONSE OF 7 % DAMPED, 2 , 5 AND 8 HZ OSCILLATORS TOTHE GAVILAN COLLEGE, HOLLISTER, 1974 EARTHQUAKE (S67W)
B-26

8/22/2019 6848574
http://slidepdf.com/reader/full/6848574 306/394
i^.M--^vyvw'.' /
0 00 1 30 8 30 12 33 16 30 20 00 21 33 26 03 3* 30 3 03 10 00 11 30
TIME ' S E L O N D '
3 30 1 00
"" 10 0 Too 12 00 JS 00 jb 00 JToO 2< 00 92 00 96 00 IQ 00 ill 00
T I M E I S E C O N D )
FIGURE B - 3 L . ELA STIC RESPONSE OF 7 % DAMPED, 2 , 5 AND 8 HZ OSCILLATORS TOTHE MELENDY RANCH BARN, BEAR V ALLE Y, 1 97 2 EARTHQUAKE (N29W)
B-27

8/22/2019 6848574
http://slidepdf.com/reader/full/6848574 307/394
=b'. 0 0 y . 0 0 9 . 0 0 J 2 . 0 0 1 6 . 0 0
FREQUENCY ( C P S )2 0 . 0 0 2 4 . 0 0
=^'. GO tt. 0 0 e .O O 1 3 . 0 0 1 6 . o o
FREQUENCY ( C P S )3 0 . 0 0 214. OO
(a) T^> 9 sec ,
FIGURE B-4a. FOURIER SPECTRA O F EFFECTIVE ACCELEROGRAM
SEGMENT DEFINED B Y T i = T „ - T ^ .
D m ,05
B-28

8/22/2019 6848574
http://slidepdf.com/reader/full/6848574 308/394
E l C e n t r oNo. 12
=%'. oo B. 00 1 2 . O O J 6 . O O
F R E Q U E N C Y ( C P S )
'=b'. o o 1 4.0 0 a . 0 0 1 2 . o o l e . o o
F R E Q U E N C Y ( C P S J
(a) T '> 9 sec .
(Continued)
FIGURE B-4a. FOURIER SPECTRA O F EFFECTIVE ACCELEROGRAM
SEGMENT DEFINED B Y T ^ = T^ - T Q ^
B-29

8/22/2019 6848574
http://slidepdf.com/reader/full/6848574 309/394
U -IC D
a::
ik1 i W\
Pacoima Dam
=b'. 0 0 4 . 0 0 e . 0 0 1 2 . 0 0 1 6 . 0 0F R E Q U E N C Y ( C P S )
=b'. 0 0 <J. 0 0 e . 0 0 1 2 . 0 0 1 6 . 0 0F R E Q U E N C Y ( C P S ) s y . 0 0
(b) 2.5 sec$ Tp $9 sec.
FIGURE B-4b. FOURIER SPECTRA O F EFFECTIVE ACCELEROGRAMSEGMENT DEFINED B Y T ^ = T ^ - T ^
B-30

8/22/2019 6848574
http://slidepdf.com/reader/full/6848574 310/394
= b ' . 0 0 B . 0 0 1 2 . 0 0 1 6 . 0 0
F R E Q U E N C Y ( C P S )2 0 . 0 0 2 y . 0 0
^b.ooI J. OO S . o o 1 2 . O 0 1 6 . 0 0
F R E Q U E N C Y ( C P S )2 0 . o o 2 4 . 0 0
(b ) 2.5iT^'69 sec .
(Cont inued)
F I G U R E B - 4 b . F O U R I E R S P E C T R A O F E F F E C T I V E A C C E L E R O G R A MS E G M E N T D E F I N E D B Y T J = T ^ - T Q ^
B - 3 1

8/22/2019 6848574
http://slidepdf.com/reader/full/6848574 311/394
= ^ . 0 0 8 . 00 1 2 . 0 0 1 6 . OOF R E Q U E N C Y ( C P S )
=%. 00 <i. 0 0 6 . 0 0 1 2 . 0 0 1 6 . 0 0F R E Q U E N C Y ( C P S )
214 . 0 0
Co) T ^< 2 .5 sec .
FIGURE B-4c. FOURIER SPECTRA O F EFFECTIVE ACCELEROGRAM
SEGMENT DEFINED B Y T ' = T „ - T c
D m .Do
B-32

8/22/2019 6848574
http://slidepdf.com/reader/full/6848574 312/394
"=b.oo 8 . 0 0 1 2 . 0 0 16 . oo
FREQUENCY (CPS)
2 0 . 0 0 214 . OO
= * . 0 0 8 . OO 1 2 . 0 0 1 6 . 0 0
FREQUENCY (CPS)2 0 . 0 0 2 14 .O O
(,c) T|!j<2.5 s e c .
CContinued)
FIGURE B-4c. FOURIER SPECT RA O F EFFECTIVE ACCELEROGRAM
TEGMENT DEFINED BY Tjj = T^.05
B-33

8/22/2019 6848574
http://slidepdf.com/reader/full/6848574 313/394
'%' . 00 14 . o o B . 0 0 1 2 . 0 0 1 6 . 0 0
F R E Q U E N C Y ( C P S )
2 0 . 0 0 2 4 . 0 0
=T3'. OO 14. OO 6 .O O 1 3 . 0 0 1 6 . 0 0
F R E Q U E N C Y ( C P S )3 b . 0 0 3 \ l . 0 0
Ca) T^>9 sec.
FIGURE B -5 a . CUMULATIVE SPECTRAL DENSITY FUNCTIONS OF EFFE CTIVEACCELEROGRAM SEGMENT DEFINED BY T^ = T ^ - T Q^
B-34

8/22/2019 6848574
http://slidepdf.com/reader/full/6848574 314/394
E l C e n t r e
N o . 1 2
=^'.00 <4. 0 0 a . 0 0 1 2 . 0 0 1 6 . 0 0F R E Q U E N C Y ( C P S )
2 0 . 0 0 2 ) 4 .0 0
' ^ ' . 0 0 a . 0 0 1 3 . o o 1 6 . 0 0F R E Q U E N C Y ( C P S )
3 0 . OO 314 . 0 0
( a ) T p > 9 s e c .
( C o n t i n u e d )
FIGURE B -5 a . CUMULATIVE SPECTRAL DENSITY FUNCTIONS OF EFFECTIVE
ACCELEROGRAM SEGMENT DEF INED BY TA = T - T ^ ^D m . 0 5
B-35

8/22/2019 6848574
http://slidepdf.com/reader/full/6848574 315/394
• ^b .o D y . o o 8 . 0 0 1 2 . 0 0 1 6 . 0 O
F R E Q U E N C Y ( C P S )3 0 . 0 0 2 4 . 0 0
^ b . 00 < i . o o 8 . 0 0 1 2 . 0 0 1 6 . 0 0
F R E Q U E N C Y ( C P S )3 0 . 0 0
Cb) 2.5 sec<T^^9 sec.
FIGURE B-5b. C U M U L A T I V E S P E C T R A L D E N S I T Y F U N C T I O N S O F E F F E C T I V EA C C E L E R O G R A M S E G M E N T D E F I N E D B Y T Jj = T^^ - T Q ^
B - 3 6

8/22/2019 6848574
http://slidepdf.com/reader/full/6848574 316/394
c
E l C e n t r oNo. 5
' ^ . 0 0 4 . 0 0 e . 0 0 1 2 . 0 0 1 6 . 0 0F R E Q U E N C Y ( C P S )
2 0 . 0 0 2 4 . OO
^ . 0 0 4 . 0 0 e . O O 1 3 . 0 0 1 6 . 0 0
F R E Q U E N C Y ( C P S )
3 0 . 0 0
( b ) 2 . 5 se c^ T^ i9 se c .
(Continued)
FIGURE B-5b. CUMULATIVE SPECTRAL DENSITY FUNCTIONS O F EFFECTIVEACCELEROGRAM SEGMENT DEFINED BY T ^ = T„ - T .
B-37

8/22/2019 6848574
http://slidepdf.com/reader/full/6848574 317/394
^ . 0 0 B . 0 0 1 2 . 0 0 1 6 . 0 0
F R E Q U E N C Y ( C P S )2 0 . 0 0 2 4 . 0 0
• ^ . 0 0 4 . 0 0 6 . 0 0 1 3 .O O 1 6 . 0 0F R E Q U E N C Y ( C P S ) 3 0 . 0 0 3 4 . 0 0
(c ) T | l j<2 .5 sec .
FIGURE B-5c. CUMULATIVE SPECTRAL DENSITY FUNCTIONS O F EFFECTIVEACCELEROGRAM SEGMENT DEFINED B Y T ^ = T^ - T ^^
B-38

8/22/2019 6848574
http://slidepdf.com/reader/full/6848574 318/394
APPENDIX C
TECHNICAL BACKGROUND ON EQUIVALENT LINEAR RESISTANCE
FUNCTION MODELS
An equivalen t linear resistance functi on model is developed to
replace the actual resistance function (Figure 3- 1 ). This equivalent
model should be capable of approximating the reduced stiffness and
increased hys teretic loop damping associated with a nonlinear response
cycl e. Figure C-1 shows one such nonlinear cycle from peak negative
displacement to peak positive displac ement . During this cycle , the
equivalent stiffness is K given by:
K. 2 + S(y„ + y . - 2)e
^^n ^n*'(C-1)
where (Vp^y) is the n-cycle peak nonlinear displa cement in one direction
and (y *S )"is the preceding peak nonlinear displacement in the opposited i r e c t i o n .
With the equivalent linear resistance function app roach, one must
also estimate an effecti ve damping rati o. With c defined by Equation 3-5,
the total energy dissipat ion, E within a half-cycle oscillation (i. e.,
from peak response in one direction to peak response in the other
dire ction ) as shown in Figure C-1, can be given by:
9 7
TTK e(y + y +) 6
E„ - ° " 7 '' * 4E„ (C-2)
C-1

8/22/2019 6848574
http://slidepdf.com/reader/full/6848574 319/394
where K i s t h e effective linear stiffness from peak-to-peak, y „ i s t h e
ductility level i n o n e direction f o r that response cycle, yp*is t h e
immediately preceding ductility level i n t h e opposite direction, & i s t h e
yield displacement and A E ^ i s t h e half-cycle hysteretic energy dissipation
as defined b y Figure C-1 . This total energy dissipation in a half-cycle
can b e rewritten in terms of an effective inelastic damping, & -
2 . 2^K^6„(y„ + y „ * ) 6
e e (C-3)
where t h e effective damping is given b y :
(C-4)
in which e ^ represents an equivalent viscous damping to account f o r t h e
one-half cycle hysteretic energy dissipation as given b y :
4 A E .
"n
IfK^d^r, + tJ^*) 5 y
(C-5)
e"^n n'
For t h e shear wall resistance function shown in Figure C-1, t h e
half-cycle hysteretic energy dissipation c a n b e obtained from:
2
yAE„ = K S ^ C l - s ) ! ( y ^ + y ^ * - 2 X )
-h -^ + y „ * (Y + 1 ) - ( 2X + Y )
(C-6)
l-s(l-a)(y„* - 1 )
C-2

8/22/2019 6848574
http://slidepdf.com/reader/full/6848574 320/394
where
1 + (s + a - Sa)(y^* - 1)
1 + S(y * - 1)
Y = (1 - a) (1 - S)
and a and Y are the unloading stiffness parameter and strength degradation
parameter, respectively, as defined in Figure 3 - 3 .
A large number ofnonlinear resistance-deformation diagrams were
developed f o r t h e 4 frequencies and 12 earthquake time histories
considered in this study at various maximum ductility ratios, y , from 1.5
to 5. A limited number ofthese diagrams are shown in Figures 4 -4 through
4-9. Based upon these resistance-d eformation d iagr ams, it w a s observed
that:
P, - (y) "/'
~ / J n - 1 ) / N ^ " ^
v i - ^ ^ )* ^ (,)(n-0.5)/N
^n
where N is the number of strong nonlinear cycles through t h e time of
maximum ductility, y . With these approximation s, the effective stiffness
and effective damping associated with any individual nonlinear cycle can
be estimated by use of Equations C-1 through C-6. The effective
frequency, f , can be obtained by substituting K- f o r K in Equation 3 - 4 .
The cycle with the lowest effective stiffness. K g , and effective
frequency, f , and the largest effective damping, 6 corresponds to the
last strong nonlinear cycle at which y is reached ( n = N ) . Table C-1
presents estimates f o r t h e secant and effective frequency ratios, and
C-3

8/22/2019 6848574
http://slidepdf.com/reader/full/6848574 321/394
hysteretic and effective damping percentage for this largest nonlinear
cycle as a function of number of strong nonlinear c ycle s, N, based upon
the approximations of Equation C-7 . Note that the effective frequency
associated with the maximum nonlinear response cycle reduces only slightly
as the number of strong nonli near cycles through the maximum cycle (N) isincreased from one to fou r. Even with only one strong nonlinear cycle,
the effective frequency associated with the maximum nonlinear cycle is
onl y 1 1% greater than the secant fre quency for y = 4.27 and approache s
the secant frequency closer as N increas es. Thu s, for the maximum
nonlinear cycle, the secant frequency only slightly underestimates the
effective frequency.
The hysteretic damping percenta ges,6u , and total effectiveNdamping perc enta ges, 6„ , associated with the maximum nonlinear response
Ncycl e increase as N is reduced from 4 to 1. For N=l, the hyst eretic
damping is considerably greater than for N of 2 and mor e.
The effective frequenc y and hysteretic damping in Table C-1 for
the largest nonlinear r esponse cycle (n=N) can be approxim ated by:
(*)••§ (C-8)
6 H , = ' = N N O - (fs/f)) (C-')
where
SN = 0.55
CNN = 0.38
NN - 0-34
(N=l)
(N=2)
(N=3 and 4)
(C-10)
c-4

8/22/2019 6848574
http://slidepdf.com/reader/full/6848574 322/394
Similarly , for elastic response cycles ( n = 0 ) :
(f / f) = 1.0 (C-11 )
^ e 'o
s, = 0 (C-12 )
For any intermediate response cycles ( 0 < n < N ) , the effective frequency lies
between the elast ic and the secant fre que ncy and the hystere tic dam ping B|
lies between Q ^, and zero.
" N
The equivalent linear resistance function model used for
computing peak response must represent some average of the effective
frequencies for the various linear and nonlinear cycles loading up to peak
respo nse. One might define this average effective frequency, f', by:
^ = (1-A) + A(l- f3/f ) ^ - ^
where A is an empirically determined coefficient which lies between 0
(elastic) and 1.0 ( s e c a n t ) . This coefficient would be expected to be
about 0.5 for N=l (midway between the frequency of the elastic cycles and
the one strong nonlinear cyc le) and should increase with increasing
numbers of nonlinear cycles. Further more, the coefficient A is expected
to increase with increasing ductility ratios.
The equivalent linear resistance function model should retain
the same energy dissipation capability as the actual mod el. Using
Equation C-3 to define the energy dissipation capability of each mod el,
the equivalent elastic model must have an effect ive dampi ng, B g , given by:
C-5

8/22/2019 6848574
http://slidepdf.com/reader/full/6848574 323/394
, I
e ' SN^^' ^ / f ) ] (C-14)
to be equivalent to the largest nonlinear cycle of the actual model when
both go from a displacement of - y t o +y. Equation C-14 can be rewritten
a s :
' S N ^ I - f,/f) (C-15)
by noting that (K /K' ) = (f / f r . Actually , Equation C-15 will ove rstate B ' because the last nonlinear c ycle has the greatest hystere tic
damping while 6' should express an average damping level during the strong
portion of the response time history leading up to the time of peak
respo nse. To correct this deficienc y. Equation C-15 should be replaced
by :
I - ^ 6 + C^(l- f 3 / f ) ] (C-16)
where Cj^ is an empirical ly de termined coefficien t which should have a
va lu e less than C ^ ^ (Eq uat ion C - 1 0 ) .
•
C-6

8/22/2019 6848574
http://slidepdf.com/reader/full/6848574 324/394
#
TABLE C-1
SECANT A N D EFFECTIVE FREQUENCY RATIO A N D HYSTERETIC A N D TOTAL EFFTrTIVE DAMPING PERCENTAGE
(SHEAR WALL RESISTANCE FUNCTION - LARGEST N O N L K ' ^ A K CYCLE)
Number of StrongNonlinear Cycles, N
1
2
3
4
y = 1.85 1
y'
0.77
0.77
0.77
0.77
(Vf)N
0.81
0.79
0.78
0.78
BM (%)
" N
13
9
8
7
3e (%)^N
20
16
15
14
y = 4.27
V^
0.56
0.56
0.56
0.56
< V " N
0.62
0.59
0.58
0.57
Bn (%)
" N
24
17
15
14
3g (%)^H
31
24
22
21

8/22/2019 6848574
http://slidepdf.com/reader/full/6848574 325/394
F I G U R E C - 1 . H A L F - C Y C L E H Y S T E R E T I C E N E R G Y A B S O R P T I O N
C - 8

8/22/2019 6848574
http://slidepdf.com/reader/full/6848574 326/394
A P P E N D I X D
P A RA M E T E R S T U D I E S T O D E T E R M I N E S E N S I T I V I T Y O FN O N L I N E A R R E S P O N S E R E S U L T S T O P RO P E R T I E S O F T H E
R E S I S T A N C E F U N C T I O N M O D E L
T h i s a p p e n d i x p r e s e n t s t h e re s u l t s o f a f e w s e n si t i v i t y s t u d i e s
p e r f o r m e d t o d e t e r m i n e t h e s e n s i t i v i t y o f n o n l i n e a r r e s u l t s t o p r o p e r t i e s
o f t h e r e s i s t a n c e f u n c t i o n m o d e l . T h e p u r p o s e o f t h e s e a n al y s e s i s t o
d e m o n s t r a t e t h a t t h e s h e a r w al l r e s i s t a n c e f u n c t i o n p r o p e r t i e s u s ed i n
t h i s s t u d y t e n d t o c o n s e r v a t i v e l y u n d e r e s t i m a t e t h e i n p u t s c a l e f a c t o r
( i n e l a s t i c d e a m p l i f i c a t i o n f a c t o r ) , F . T h e r e f o r e , t h e r e s u l t s p r e s e n t e d
i n C h a p t e r 4 t e n d t o b e c o n s e r v a t i v e f o r o t h e r m o d e l p r o p e r t i e s . T h i s
a p p e n d i x w a s w r i t t e n w i t h t h e a s s u m p t i o n t h a t t h e r ea d e r h a s c a r e f u l l y
r e v i e w e d C h a p t e r s 3 a nd 4 an d d o e s n ot r e p e a t d i s c u s s i o n s c o n t a i n e d i n
t h o s e c h a p t e r s .
D . l I N F L U E N C E O F N O N L I N E A R R E S I S T A N C E F U N C T I O N T Y P E
F i g u r e 3 -1 c o m p a r e s t h e b i l i n e a r , T a k e d a , a nd s h e a r w a l l
r e s i s t a n c e f u n c t i o n s . I t c an b e s ee n t h a t f o r t h e s a m e d u c t i l i t y l e v e l ,
t h e T a k e d a a n d s he a r w a l l m o d e l d i s s i p a t e l e ss h y s t e r e t i c e n e r g y i n a
g i v e n n o n l i n e a r c y c l e t h a n d oe s t h e b i l i n e a r m o d e l . T h u s , o n e w o u l d
e x p e c t t h e T a k e d a a nd s h e a r w a l l m o d e l s t o h a v e s i m i l a r i n p u t s c a l e
f a c t o r s , F , f o r a g i v e n d u c t i l i t y l ev el a nd f o r t h e b i l i n e ar m o d el t o
h a v e a s i g n i f i c a n t l y h i g h e r i n p u t s c a l e f a c t o r , F . T o d e m o n s t r a t e t h i s
e x p e c t a t i o n , t h e F f a c t o r s w e r e d e t e r m i n e d f o r t h e P a r k f i e l d r e co r d f o r
l ow a nd hi g h d u c t i l i t y f a c t o r s o f y = 1 . 8 5 , an d y = 4 . 2 7 , r e s p e c t i v e l y ,
f o r a 5 . 3 4 H z s t r u c t u r e m o d e l w i t h b i l i n e a r , T a k e d a , an d s h e a r w a ll
r e s i s t a n c e f u n c t i o n s . F o r a ll t h r e e r e s i s t a n c e f u n c t i o n s , t h e s l o p e
p a r a m e t e r o f t h e p o s t - y i e l d l o ad i n g c u r v e w a s s = 0 . 1 . F o r t he T a k e d a
a nd s h e a r w a l l r e s i s t a n c e f u n c t i o n s , t h e u n l o a d i n g s t i f f n e s s p a r a m e t e r
D - 1

8/22/2019 6848574
http://slidepdf.com/reader/full/6848574 327/394
was a = 0.35, and the strength degradation parameter wa s Y = 0.95. The
only difference between the Takeda and shear wall resistance functions
was the pinched behavior of the shear wall mo de l. The resulting F
factors were:
Ductility Level
Input Sca le Fac tor, F
Bi 1i near
1.85 1.29
4.27 1.51
Takeda
1.24
1.33
Shear Wall
1.21
1.29
The conclus ion is that the shear wall resi stan ce funct ion model
conservati vely underestima tes the input scale fact or, F, for the Takeda
and bilinear models.
D.2 COMPARISON OF NONLINEAR RESPONSE FOR SHEAR WALL VERSUS
BRACED-FRAME MODEL
Diagonal bracing elements are the primar y lateral force-carrying
elements in braced-steel fr ame s. For nuclear struct ures , such elements
are usually angle s, wide flange sections or standard we ight or extra-
strong steel pipe with diameters ranging from 6-12 inche s. The limiting
behavior of braced elements with adequate con nections is governed by
yielding in tension and inelastic buckling in comp ress ion. When employed
as frame bracing elements for resisting reversin g lateral loads, the
braces can become subjected to severe axial cyclic loading causing the
braces to sequentially buckle and stretch ine lastica lly. Tests indicate
that the overall lateral force-d isplacement behavior of a braced frame is
also characterized by pinched hysteresis loo ps. The degrad ing, pinched
D-2

8/22/2019 6848574
http://slidepdf.com/reader/full/6848574 328/394
character of these loops is due primarily to the inelastic behavior of
the individual brac es under cyclic loading. During a cycle, once the
tension diagonal has inelastically lengthened and while the compression
brace has buckled upon load rev er sal , the system is softened until the
buckled braced is restr aighte ned and its axial stiffness is reco vere d.
The axial sti ffness of a buckled brace is smaller than the stiffness of a
straight membe r. The capacity of a member in compression is also greatly
reduced, either due to its bowed shape or previous inelastic strain
hist ory. A lateral load-displacement diagram obtained during a structural
frame test is shown in Figure l-9b which illustrates the reverse cycle
hysteretic behavior characterized by stiffness degradation and pinching
of the resulting hysteresis loops.
The number of investigations involving reversing load tests of
braced-fra me systems is very limited. Wakabayashi (1973, 1 9 7 7 ) * has
summarized the laboratory testing conducted on braced frames in Japan.
Maison (1980) and Popov (1980) have reported testing on half-scale and
one-sixth scale model braced fra mes . The hysteresis behavior of bracing
membe rs under cyclic axial loading has been reported by several inv esti
gators (Jain, 1980, 1978b; Gugerli, 1980; Popov, 1979, 1 9 8 1 ) .
To investigate the effect of the braced-frame resistance
function, an example, one-story, single bay, braced-steel-frame was
defined, as indicated in Figure D-1 . The example structure was modeled
directly with DRAIN-2D, utilizing the hysteresis model for steel members
developed by Jain (1979) and included in the DRAI N-2D program (Jain and
G o e l , 1 9 7 8 a ) . Buckling elem ent, EL 9, developed originally by Singh
( 1 9 7 7 ) , and modified by Jain ( 1 9 7 8 a ) , was utilized to model the yielding
and post-buckling behavior of the pin-connected bracing element (8"
diameter pip e) defined for the example braced frame . The cyclic loading
behavior of the frame model , obtained using DRAIN- 2D, is also shown in
Figure D- 1. As can be noted, the model reflec ts the pinched, degrading
stiffness behavior noted in testing of braced-fr ame str uctur es.
* All refer ence s in this appendi x are listed in the Refere nce list forthe main body of this repo rt.
D-3

8/22/2019 6848574
http://slidepdf.com/reader/full/6848574 329/394
Input scale f act ors , F, were obtained for both the shear wall
and the braced-frame resistance function models with a 5.34 Hz elastic
frequency and 7% elastic damp ing. The following input scale factors were
obtained for the Taft, Parkfield, and Melendy Ranch records.
Record
Taft
Parkfield
Melendy Ranch
Computed Input Scale Fac tor , F, for5.34 Hz Structure
y = 1.85 1
Shear Wall
1.25
1.21
1.96
Braced Frame
1.49
1.21
2.04
1 y = 4.27 1
Shear Wall
1.65
1.29
5.48
Braced Frame
2.17
1.40
5.44
One may note that for the Melendy Ranch record, t he input scale
factors are essentially identical for the shear wall and br aced-fra me
m o d e l s . Howev er, for the Taft reco rd, the braced -fram e model results in
significantly greater input scale factors than does the shear wall model.
Basica lly, the braced-frame model does not show as much degradation in
stiffness or pinched behavior as does the shear wall model.
In Chapter 4, it was shown for shear walls that the predicted
input scale factor (inelastic deamplification f a c t o r ) , F^, was influenced
by the number of strong nonlinear response cycles, N, and thus by the
strong motion durati on, T Q . It was recommended that F^ could be bestpredicted by Equation 4-3 for shear wal ls. This equation depends upon
the estimate of an effective frequency and an effective damping using
D-4

8/22/2019 6848574
http://slidepdf.com/reader/full/6848574 330/394
coefficient C p a n d C ^ from Table 4-2. These coefficients ar e shown t o b e
a function o f N f o r s he a r walls . Howev e r , f o r braced-frame and bilinear
m o d e l s , t h e F y does n o t appear t o b e a s much influenced b y N . T o investi
gate this effec t, t h e coefficients Cp = 1-5 and C^ = 0 . 30 f o r N = l were
used f o r t h e Taft and Parkfield re cord s. T h e predicted scale factors, F y ,
for t h e recommended procedure (Equation 4-3 and Table 4-2) f o r shear walls
is compared with t h e predicted scale factors obtained f o r 1 ) Equation 4-3
and C p = 1.50 and Cf^ = 0.30, 2 ) t h e Iwan Method , a nd 3 ) t h e Sozen Method .
Record
T a f t
Parkfield
Melendy Ranch
Predicted Input Scale Factor, F,
for 5.34 Hz Structures
y^ = 1.85
Eqn. 4-3 andTable 4-2
1.30
1.36
2.08
Eqn. 4-3 andCp = 1.50; C^ = 0.30
1.58
1.38
2.08
Iwan
1.78
1.51
2.29
Sozen
1.20
0.97
2.20
Record
Taft
Parkfield
Melendy Ranch
Predicted Input Scale Fact or, F,
for 5.34 Hz Structures
y|_ = 4. 27
Eqn. 4-3 and
Table 4-2
1.68
1.24
5.48
Eqn. 4-3 and
Cp = 1.50; C,^ = 0.30
2.38
1.77
5.48
Iwan
2.77
2.08
6.03
Sozen
1.62
0.85
7.12
D-5

8/22/2019 6848574
http://slidepdf.com/reader/full/6848574 331/394
E x c e p t f o r t h e l ow d u c t i l i t y ( y ^ = 1 . 8 5 ) P a r k f i e l d r e c o r d c a s e ,
t h e F y p r e d i c t e d b y E q u a t i o n 4 - 3 an d T a b l e 4 -2 u n d e r e s t i m a t e s t h e
n o n l i n e a r t i m e h i s t o r y a n al y s i s c o m p u t e d F v a l u e s f o r b r ac e d f r a m e s a nd
b i l i n e a r s t r u c t u r e s f o r t h e T a f t a n d P a r k f i e l d r e c o r d s . F o r M e l e n d yR a n c h , E q u a t i o n 4 - 3 an d T a b l e 4 - 2 a c c u r a t e l y p r e d i c t t h e t i m e h i s t o r y
c o m p u t e d F v a l u e s f o r b r a c ed f r a m e s . O n t h e o t h e r h a n d , t h e u s e o f
E q u a t i o n 4 - 3 w i t h t h e N = l v a l u e s o f C p = 1 .5 0 a n d C N = 0 . 3 0 c o n s i s t e n t l y
o v e r p r e d i c t s t h e t i m e h i s t o r y c o m p u t e d F v a l u e s f o r b r a ce d f r a m e s f o r t h e
T a f t and P a r k f i e l d r e c o r d s . T h i s b r i e f s t u d y s u g g e s t s t h e F v a l u e s f o r
b r a c ed f r a m e s a nd b i l i n e ar s t r u c t u r e m o d e l s l i e a p p r o x i m a t e l y m i d w a y
b e t w e e n t h e F y v a l u e s p r e d i c t e d u s i n g t h e C p a nd C M v a l u e s o f T a b l e 4 - 2
a n d t h o s e p r e d i c t e d w i t h C p = 1 . 50 a nd C ^ = 0 . 3 0
T h e I w a n m e t h o d c o n s i s t e n t l y s e v e r e l y o v e r p r e d i c t s ( u n c o n s e r v a -
t i v e ) t h e t i m e h i s t o r y c o m p u t e d F v a l u e s f o r b r a c e d f r a m e s f o r t h e r e a s o n s
d i s c u s s e d i n C h a p t e r 4 . T h e S o z e n m e t h o d i s l es s a c c u ra t e t h a n E q u a t i o n
4 - 3 a n d T a b l e 4 - 2 i n p r e d i c t i n g F v a l u e s f o r b r a c e d f r a m e s f o r t h e r e a s o n s
d i s c u s s e d i n C h a p t e r 4 .
T h e c o n c l u s i o n o f t h i s b r i e f s t u d y i s t h a t t h e C F a n d C N v a l u e s
g i v e n i n T a b l e 4 - 2 f o r s h ea r w a l l s t r u c t u r e s o v e r e m p h a s i z e t h e i m p o r t a n c e
o f s t r o n g m o t i o n d u r a t i o n , T p , o n F u f o r b r a c e d - f r a m e a nd b i l i n e a r
s t r u c t u r e m o d e l s . F o r t h i s r e a s o n , t h e u s e o f C p an d C N v a l u e s f r o m
T a b l e 4 - 2 w i l l t e n d t o u n d e r p r e d i c t ( c o n s e r v at i v e b i a s ) t h e F y v a l u e s f o r
t h e l o n g er d u r a t i o n r e c o r d s (N i 2 ) . T h i s u n d e r p r e d i c t i o n o c cu r s b e c a u s e
t h e b r a c e d - f r a m e a nd b i l i n e a r m o d e l s d o no t h a v e a s s e v e r e o f s t i f f n e s s
d e g r a d a t i o n a nd p i n c h e d b e h a v i o r a s d o t h e s h ea r w a ll m o d e l s u s ed i n t h i s
s t u d y . F o r b r a c e d - f r a m e a nd b i l i n e a r m o d e l s , a b e t t e r e s t i m a t e o f F y c an
b e o b t a i n e d b y a v e r a g i n g t h e F y v a l u e s o b t a i n e d f o r C p a n d C ^ v a l u e s f r o mT a b l e 4 - 2 w i t h t h o s e o b t a i n e d f o r C p = 1 . 50 a n d C^j = 0 . 3 0 .
J k D - 6

8/22/2019 6848574
http://slidepdf.com/reader/full/6848574 332/394
D . 3 I N F L U E N C E O F R E S I S T A N C E F U N C T I O N C O E F F I C I E N T S a A N D s
T h e d e t a i l e d s h a p e o f t h e s h e a r w a ll r e s i s t a n c e f u n c t i o n i s
s i g n i f i c a n t l y i n f l u e n c ed b y t he c o e f f i c i e n t s a a nd s w h e r e s r e p r e s e n t s
t h e r a t i o o f t h e p o s t - y i e l d i n g s t i f f n e s s t o t h e i n i t i a l s t i f f n e s s ( F i g u r e3 - 1 ) an d a r e p r e s e n t s t h e d e g r a d a t i o n i n s t i f f n e s s o n u nl o a d i n g ( F i g u r e
3 - 3 ) w i t h a = 0 i n d i c a t i n g n o u n l o a d i n g s t i f f n e s s d e g r a d a t i o n a n d
i n c r e a s i n g a i n d i c a t i n g i n c r ea s e d u n l o a d i n g s t i f f n e s s d e g r a d a t i o n .
M o s t r e a l s t r u c t u r a l s y s t e m s h a v e a n s r a t i o b e t w e e n a b o u t 0 . 0 3
a nd 0 . 1 5 . P r e v i o u s s t u d i e s h av e i n d i c a t e d v a r i a t i o n s o f s b e t w e e n 0 . 0 3
a nd 0 . 1 5 h a s l i t t l e e f f e c t o n t h e c o m p u t e d d u c t i l i t y l ev el s o l on g a s y i s
l e s s t h a n a b o u t 5 . F o r t h i s r e a s o n , s = 0 . 1 0 w h i c h i s m i d w a y w i t h i n t h i s
n o r m a l r a n g e w a s us ed i n t h i s s t u d y . F o r a g i v e n d u c t i l i t y , t h e i n p u t
s c a l e f a c t o r , F , i s no t e x p e c t e d t o i n c r e a s e s i g n i f i c a n t l y f o r s f r o m 0 . 0 3
t o 0 . 1 5 . H o w e v e r , a s s i n c r e a s e s b e y o n d a b o u t 0 . 1 5 , t h e F v a l u e is
e x p e c t e d t o b e g i n t o i n c r e a se s i g n i f i c a n t l y f o r a c o n s t a n t d u c t i l i t y
r a t i o . T h i s i s d e m o n s t r a t e d b y t h e f o l l o w i n g t a b l e w h i c h t a b u l a t e s t h e
t i m e h i s t o r y F v a l u e s r e q u i r e d t o d e v e l o p y , = 1 .8 5 f o r a s h e a r w a l l
r e s i s t a n c e f u n c t i o n s t r u c t u r a l m o d e l w i t h a n el a s t i c f r e q u e n c y o f 5 . 3 4 H z
a nd v a r i o u s s v a l u e s s u b j e c t e d t o t h e P a r k f i e l d r e c o r d .
s
0
0 . 0 3
0 . 1 0
0 . 1 5
0 . 2 0
0 . 5 0
1 . 0 0
F
1 . 1 6
1 . 1 7
1 . 2 1
1 . 2 6
1 . 3 2
1 . 5 4
1 . 8 5
D - 7

8/22/2019 6848574
http://slidepdf.com/reader/full/6848574 333/394
I t i s c o n c lu d e d t h a t s = 0. 10 g i v e s i n p u t s c a l e f a c t o r s , F , w h i c h
a r e a c c u r a t e f o r t h e r a n g e O f s l O . 1 5 . H o w e v e r , t h e F v a l u e s o b t a i n e d f o r a
r e s i s t a n c e f u n c t i o n w i t h s = 0 . 10 w i l l b e i n c r e a s i n g l y c o n s e r v a t i v e l y l o w
a s s i s i n c r e a s e d b e y o n d 0 . 1 5 .
N e x t , t h e i n f l u e n c e o f s t i f f n e s s d e g r a d a t i o n o n u n lo a d i n g w a s
s t u d i e d . F o r t h i s s t u d y , a w a s a s s i g n e d v a l u e s o f 0 . 0 , 0 . 3 5 , a n d 0 . 5 0
w h i c h c o v e r s t h e r a n g e f r o m no u n l o a d i n g s t i f f n e s s d e g r a d a t i o n t o v e r y
s e v e r e u n l o a d i n g s t i f f n e s s d e g r a d a t i o n . T h e s h e ar w a l l r e s i s t a n c e
f u n c t i o n m o d e l w i t h a n e l a s t i c f r e q u e n c y o f 5 . 3 4 H z w a s s u b j e c t e d t o t h e
P a r k f i e l d r e c o r d w i t h a n i n p u t s c a l e f a c t o r o f 1 .2 1 a nd t h e f o l l o w i n g
d u c t i l i t y r a t i o s w er e o b t a i n e d :
a
0
0 . 3 5
0 . 5 0
y
1 . 8 8
1 . 8 5
1 . 8 4
I t w a s c o n c l u de d t h a t i n c r e a s e s i n u n l o a d i n g s t i f f n e s s d e g r a d a
t i o n a c t u a l l y r e s u l t e d i n a t r i v i a l r e d u c t i o n i n t h e d u c t i l i t y f a c t o r .
T h e u s e o f a n u n l o a d i n g d e g r a d a t i o n c o e f f i c i e n t o f a = 0 .3 5 p r o d u c e s
r e s u l t s w h i c h a r e r e p r e s e n t a t i v e f o r t h e f u l l p r a c t i c a l r a n g e o f
0 i a l 0 . 5 0 .
D . 4 I N F L U E N C E O F E L A S T I C D A M P I N G
R i d d e l l ( 1 9 7 9 ) h a s sh o w n i n c r e a s es i n e l a s t i c d a m p i n g r e s u l t i n ar e d u c t i o n i n t h e i n e l a s t i c s p e c t r a l d e a m p l i f i c a t i o n f a c t o r , F . T h e
m e t h o d s r e c o m m e n d e d i n t h i s r e p o r t ( E q u a t i o n s 3 -1 4 o r 4 - 3 ) w i l l a ls o
r e s u l t i n a l e s s e r F y v a l u e w i t h i n c r e a s e d e l a s t i c d a m p i n g . T h i s
s i t u a t i o n r e s u l t s b e c a u s e b o t h e l a s t i c d a m p i n g a nd i n e l a s t i c r e s p o n s e a re
e n e r g y d i s s i p a t i o n m e c h a n i s m s a nd a b s o l u t e a d d i t i o n o f t h e t w o e f f e c t s
D - 8

8/22/2019 6848574
http://slidepdf.com/reader/full/6848574 334/394
will overstate the total reduction in res pons e. Ther efor e, the input
scale factors (inelastic deamplification fac tors ) presented in Chapter 4
for 7 percent elastic damped structures are conserva tively low for struc
tures with less than 7% damp ing. This point is illustrated by computingthe input scale factors, F, for ductilities of 1.85 and 4.27 for an
elastic structural freque ncy of 5.34 Hz with 3% elastic damping for the
Taft, Artificial, and Melendy Ranch record s. These 3% damped F values
are compared with tho se shown in Tab le 4-1 for 7 % damping:
Ductility
1.85
4.27
Record
Taft
Artificial
Melendy Ranch
Taft
Artificial
Melendy Ranch
Input Scale Factors DeamplificationFactors) 5.34 Hz
7 % Damping
Computed,
F
1.25
1.33
1.96
1.65
1.88
5.48
Predicted(Eq. 4- 3) , Fy
1.30
1.49
2.08
1.68
1.65
5.48
3% Damping
ComputedF
1.53
1.48
2.07
2.19
2.38
6.25
Predicted(Eq. 4- 3) , Fy
1.54
1.59
2.21
2.20
1.95
6.14
The above table also shows the inelastic deamplification factors
predicted by Equation 4-3 with coeffici ents from Table 4-2. The effective
damping val ues , B' * obtained from Equation 4-6 and Table 4-2 are:
D-9

8/22/2019 6848574
http://slidepdf.com/reader/full/6848574 335/394
Record
Taft
Artificial
Melendy Ranch
Effective Damping, 3^^ {% )
y = 1.85
e = 7 %
7. 5
7.5
10.5
3 = 3%
4.5
4.5
7.5
y = 4.27
B = 7%
9.5
9.5
12.5
B = 3%
6.5
6.5
10.0
Note that for these six cases (2 duct iliti es, 3 recor ds, 1
frequ ency) which represent a subset of the 96 cases (2 ductiliti es, 12
reco rds, 4 frequencie s) studied in Chapter 4 to develop Equation 4-3 and
Table 4- 2, the recommended prediction approach does as good a job of
predicti ng the computed F values at 3% elast ic damp ing as it did at 7 %
elastic damping. At 7% elastic damping, the ratio of predicted to
computed F values has a mean of 1.02 and a COV of 0.08 for these six
cases. At 3% elasti c dampi ng, this ratio has a mean of 0.99 and a COV of
0.09 for these six cases.
Two conclusions are reached from this brief study:
1. The inelastic deamplific ation factors are larger at 3%elastic damping than at 7 % elastic damping. Thus, Ffactors generated for 7% elastic damped structural modelscan be conservatively used for structures with damping
values less than 7% .
2 . The recommended prediction method (Equation 4-3 and Table4-2) works equally well for structures with 3% elasticdamping as it does for 7% elastic damping.
D-10

8/22/2019 6848574
http://slidepdf.com/reader/full/6848574 336/394
W 18 x 50
W 21 x 44
8 " *
( r
14.7 in^
13.0
8.4
2.94in, -^-
I
802 in.^
971
72.5
26.9 x 12
2.94O l O )
/6 = 714 x kips
(a) Struct ure Model Definition
b) Cyclic Loading Behavior Using DRAIN-2D Bracing Element 9 (Jain, 1978a)
F I G U R E D - 1 . B R A C E D - F R AM E S T R U C T U R E M O D E L
D-11

8/22/2019 6848574
http://slidepdf.com/reader/full/6848574 337/394

8/22/2019 6848574
http://slidepdf.com/reader/full/6848574 338/394
* — •
2 o
Gavilan
College
'^.aa V I . O O a . 0 0 1 2 . D O 1 6 . o o
F R E Q U E N C Y tC P S )2 0 . O O 2 4 . O O
u . 0 0 a . 0 0 1 3 . 0 0 1 6 . 0 0
F R E Q U E N C Y ( C P S J
( c ) T , l) < 2. 5 s e c .
( C o n t i n u e d )
F I G U R E B - 5 c . C U M U L A T I V E S P E C T R A L D E N S I T Y F U N C T I O N S O F E F F E C T I V EA C C E L E R O G R A M S E G M E N T D E F I N E D BY T ' = T - T Q ^
B - 3 9

8/22/2019 6848574
http://slidepdf.com/reader/full/6848574 339/394
•

8/22/2019 6848574
http://slidepdf.com/reader/full/6848574 340/394
APPENDIX E
STRUCTURAL EVALUATION OF EL CENTRO STEAM PLANT UNIT 4
SUBJ ECTE D TO THE 1979 IMPERIAL VALLEY EARTHQUAKE
E.l INTRODUCTION
The El Centro Steam Plant located in the northeast portion of
El Centro , was subjected to peak horizontal ground acc elerations est imated
to be about 0.5g (Reference E-1) as a result of the 1979 Imperial Vall ey
earthq uake. This plant consists of four uni ts. The seismic design basis
for Units 1, 2 and 3 built in 1949 , 1952 and 195 7, resp ecti vel y, is
unknown. Howeve r, review of the project specifications for Unit 4, which
was built in 196 8, indic ates that the steel fra ming was designed for a
lateral static equivalent seismic loading of 0.2g (dead and live l o a d s ) .
Even though the El Centro Steam Plant was subjected to earthquake ground
motion that was about 2.5 times the design seismic loadin g, there was
only minor damage observed at the plant following this earthquake. The
purpose of this evaluation is to correlate predicted structural damage
with observed structural damage for the El Centro Steam Plant Unit 4
subjected to the 1979 Imperial Valley earth quake.
Analys es of Unit 4 of the steam plant have been reported in
References E-1 and E-2 . Howev er, neither of these evaluations were
conducted for the express purpose of correlating predicted and observed
structural da mage. The analysis presented in Reference E-1 was performed
for the purpose of estimating equipment response levels and was based on
a simple structural mo de l. There was no evaluation of structural res ponse
and capacities in this refer ence. The analysis presented in ReferenceE-2 was conducted to demons trate that a particular set of conservative
design criteria would produce analytical results which would overpredict
observed Unit 4 structural resp onse . This analysis was based on a
detailed three- dimen sional model of the Unit 4 struc ture but which ignored
soil-structure interaction eff ect s. Data from each of these references
have been used in the preparation of this report.
E-1

8/22/2019 6848574
http://slidepdf.com/reader/full/6848574 341/394
The evaluation of the El Centro Steam Plant as presented herein
is based on a relat ivel y detailed structural model whi ch incorporate s
soil-structure interaction effects . Structural response is calculated
with this model by an elastic response spectrum ana lys is. The seismic
excitations are taken from response spectra computed from measured accel
eration time histories recorded close to the steam plant site. The calcu
lated structural resp onse is then compared to code-s pecifi ed ultimate
capacities (i.e., from AISC Part 2 and ACI building codes ) of structural
members and elements to assess predicted structural beh avior. The pre
dicted structural behavi or is then , in turn , compared with o bserva tions
of the plant following the earthquake in order to demonstrate how behavior
calculated from an elastic structural analysis based on elastic spectra
anchored to peak acceler ation from recorded motio ns corre lates with actual
observed behavior of this structu re.
E.2 DESCRIPTION OF THE STRUCTURE
The El Centro Steam Plant consists of four units that generate
power by burning oil or natural gas (Figure E- 1 ) . Units 1, 2 and 3 were
designed by Gibbs and Hill and built in 1949, 1952 and 19 57, resp ect ivel y.
Unit 4, the newest and largest with an 80 MW electri c ou tpu t, was designed
by Fluor Corpor atio n, Ltd. and built in 196 8. Combined output of all four
units is 174 MW. Each unit of the plant is stru ctur ally inde pendent and
contains three structur es: a turbine building, a turbine pedestal and a
boiler str uctu re. Each of these structures is founded on a single 12.2
foot-thick h ollow, honeycomb-like reinforced concrete foundation with
plan dimensi ons of 96 by 207 fee t. Soil at the site consists of very
deep alluvial deposits composed of stiff to hard clays interlain with
laminations of sllty clay loam and sandy loam (Reference E-1). Cross
sections of Unit 4 are shown in Figures E-2 and E-3 and a plan view of
the ground floor is shown in Figure E- 4.
The Unit 4 turbine building is a moment-r esisting steel f rame
with reinforced concrete shear walls cast monolithically with the exterior
steel frames on the eas t, west and south sides of the buildin g. The
turbin e building has plan dimen sions of 93 feet by 128 feet and a maxim um
E-2

8/22/2019 6848574
http://slidepdf.com/reader/full/6848574 342/394
height of 55 feet . As shown in Figures E-3 and E- 4, the turbine building
has four bays: auxil iary, heater, turbine and service. An operating
floor 20 feet above the ground floor extends through all four bays. This
floor contains a large opening for the turbine pedestal struc ture. There
is also a floor in the heater bay 14 feet a bove the opera ting flo or.
Both the operating and heater bay floors are constructed of metal d ecking
and concrete fi ll . Covering the a uxiliar y and heater bays is a roof of
metal decking and concrete fill . The roof covering the turbine and
service bays is composed of gypsum decking and composition roof ing.
The Unit 4 turbine pedestal is a reinforced concrete frame that
supports the turbine g enera tor. The pedestal is located within the
turbine buildin g but is isolated from the buildi ng by a one-inch expansion
joint at the operating floor . The pedestal has plan dimensions of 68
feet by 23 feet and is 20 feet hig h.
The boiler structure for Unit 4 is a braced-steel frame with
plan dime nsions of 31 by 51 feet and a height of 97 fee t. The boiler
structure and the turbine building are connected along Column Line G
between Colum n Lines 15 and 16 . The boiler is suspended from girders at
the top of the steel fra me . Lateral s upport for the boiler is provided
by seismic stops at various elevations of the fram e. The boiler
structure also supports a steel stack.
E.3 EARTHQUAKE GROUN D MOTION
On October 15, 1979, a strong earthqua ke shook the Imperial
Valley of California . As reported in Refer ence E -1 , this earthquake had
a local magni tude M^^, of 6.6 and a surface wav e mag nit ude , M^, of
6.9. The earthquake produced 30 km of predomi nantly strike-slip rupturealong the Imperial Fault (Figure E- 5 ) . There were many aftersh ocks,
three of which exceeded M, = 5 within the first 8 hour s.
E-3

8/22/2019 6848574
http://slidepdf.com/reader/full/6848574 343/394
As a result of the 1940 El Centro earthquake and other smaller
ear thq uak es, the Imperial Val ley was extensiv ely instrumented by a network
of strong motion a ccel erom eter s. A 13 station linear array straddling
the fault and passing through El Centro is shown in Figure E-5 . Included
in this array is Station No. 9, the original instrument that recorded the
1940 El Centro ground motion re cord. Also of interest , is a digital
recording differential array installed by the U. S. Geological Survey about
two weeks before the 1979 earthqu ake in a large vacant lot near Unit 4 of
the El Centro Steam Plant. Unfortunate ly, there were several malfunctions
in the operation of this system such that useful data was not obtained
from most of the instruments in this array. How ever , a good record was
obtained from the instrument labeled No. 5165 El Centro Differential
Array installed in a small building at the south end of the array.
The El Centro Steam Plant is located between Sta tions N o. 8,
No. 9 and the Differential Array as shown on Figures E-5 and E-6.
Stations 8, 9 and 5165 are about 4,000, 3,800 and 2,400 feet from Unit 4
with Station 8 closest to the Imperial Fault and Station 9 furthest from
the fault. Station 5165 is located at about the same distance from the
fault as the steam plant although this instrument is closer to the earth
quak e epic ente r. Good ground motion records were obtained for this
earthqu ake at Stations 8 and 516 5. Because of the age of Station No. 9,
there was difficulty in obtaining a complete time history from this
instrument. Also , there are questions about the free-field nature of
Station N o. 9 because it is situated on a large fo unda tio n.
For this evaluation, a digitized corrected version of the
recorded time history from Station 5165 was used as input excitation for
the analysis of the El Centro Steam Plant Unit 4 as reported herei n. Itis believed that this record is a reasonab le estima te of the ground motion
at the steam plant site for the following reasons:
E-4

8/22/2019 6848574
http://slidepdf.com/reader/full/6848574 344/394
a. The steam plant appears to be within a zone along theImperial Fault wher e ground motio n is relativ ely con stan t.Large at tenuation of the ground motion is not seen untilStation No. 10 located much further away from the fault.Recorded ground motion for the 1979 Imperial Valley Earth
quake at Statio ns 7 throug h 10 and 5165 are summarized inTable E-1.
b . A Wilmot Seis mosco pe with a period of 0.75 se c. situated atthe bottom floor of the steam plant itself registered amaxim um re sponse displacement of 6.57 cm and a maximumresponse velocity of 55 cm/s ec. These are approximatelyequivalen t to the maximum respon ses at 0.75 sec. period and1 0 % damping computed from the horizontal time histories atStation 5165 . The seismosco pe is believed to have adamping of about 10%.
The critical elements of the Unit 4 structure are primarily
sensitive to horizontal lateral forces and thus this evaluation considered
only the horizontal components of earthquake ground motion. The time
histories and response spectra of the north-south and east-west components
from Station 5165 are illustrated in Figures E -7 , E- 8, and E-9 . Note
that in Figures E-7 and E- 8, the 7 percent damped s pectra from Station
5165 and Reg. Guide 1.60 (Reference E- 6, anchored to the peak accele ration
from Station 51 65) are compare d. The spectra from the recorded eart hquake
motion general ly fall below the Reg. Guide 1.60 spectra with the exception
of the region between about 5 and 9 Hz where t he east-west moti on spectrum
from Station 5165 is greater than the Reg . Guide spect rum. The strong
motion dura tion , Tfj, defined in the mann er described in Chapte r 2 (i.e.,
"•"[) " "laximum of Tp ^ or T0 .7 5 m in us T0 .0 5 wh er e T Q . Q S and T0.75
are the times associated with 5 and 75 percent of the total cumulative
ener gy for the record and Tp^^ is the time a ssociate d with the first
zero crossing of the accelerog ram follow ing the maximum positive or
negative acceleration, whichever occurs later in time) are 2.8 seconds
for the north-south motion and 3.7 seconds for the east-west motion.
Qualitat ively, the Station 5165 motions are moderate duration records.
E-5

8/22/2019 6848574
http://slidepdf.com/reader/full/6848574 345/394
E.4 EARTHQUAKE DAMAGE
An NRC reconnaissance team visited the steam plant shortly after
the earthquake struck. Lawrence Livermore National Laboratory (LLNL)
personnel visited the site on March 18 , 1980 . At the request of LLN L, a
representative of Structural Mechanics Associates, Inc. (SMA) inspected
the plant and examined the plant log book for the day of the earthquake
and for the following day in Augus t, 19 80. Based upon the data gathered
from these site vis its , a record of the damage incurred at the steam
plant during the earthquake was presented in Reference E -1 . A brief
summary of the observed damage extracted from this reference is presented
in this section.
When the earthquake occur red. Units 3 and 4 of the El Centro
Steam Plant were operating and Units 1 and 2 were shut down for maint en
anc e. The operating units tripped off line when station power was lost
because of a short circui t res ulting from a broken ins ulator in a light
ning rod in Unit 1. Unit 3 was restored to service within 15 minut es
following the main shock and Unit 4 was restored to service within 2
hours . Much of the time was spent by plant personnel inspecting for
dam age . Later in the day and during the follow ing day, both Units 3 and 4
were removed from service to repair piping.
No significant structural damage was observe d. Minor concrete
cracking was generally apparent throughout the plant. More significant
cracki ng, on the order of 1 in. , was observed at a junction of a floor
diaphragm high in the structure and the turbine building shear wa ll . In
addition, concrete cracks were observed at upper elevations between the
various units , where larger deflections would be expected. However , in
all c ase s, this cracking was local in nature and overall structural
integrity was mainta ined. Structural steel, for the most part, was not
permanently deformed as a result of the earthquake. Significant stressing
wa s apparent on some members through obs ervati ons of cracked paint on
structural sections and the gouging of metal near conn ectio ns.
E-6

8/22/2019 6848574
http://slidepdf.com/reader/full/6848574 346/394
One of the few areas wher e structural damage was observed was the
Unit 4 boiler, which is hung in a pendulum fashion using rods supported
by a braced fram e. Lateral seismic restraints are mounted on the braced
frame to minimize excessive motion of the freely supported boiler.
Travel through the rest raint gap was evidenced by paint chipping in the
area and permanent deformation of the restr aint . In addition, four
diagonal bracing members on the boiler frame buckled (Figure E - 1 0 ) ,
apparently due to excessive compressive loads . These diagonals were
later replaced.
E.5 ANALYTICAL APPROACH
The structural evaluation of El Centro Steam Plant Unit 4 has
been conducted using an analytical approach which is consistent with that
used for the design of many critical faci liti es. The structural model
consists of beam elements and lumped masses representing the stiffness
and inertial charac teristi cs of the struc ture . Soil springs and radiation
damping have been used to account for soil-structure inte raction. Seismic
response has been computed by a response spectra dynamic analysis
employing modal superposition using the SMA version of computer program
MOD SAP . The computed respo nse is compared with code specified ultimate
capacities (i.e., ACI or AISC Part 2) to evaluate predicted behavi or.Details of the analytical method are briefly described b elow.
The structural model consisting of 44 nodes , 67 beam elements
and 5 spring elements is illustrated in Figure E- 11. This model is
capable of considering both north-south and east-west input motions
simulta neously. As mentioned pre viously , because the critical elements
of this structure are primarily sensitive to horizontal loads , neither
vertical d ynamic loads nor dead and live loads were consi dere d. In the
model shown in Figure E-11 , Beam Elements 1 through 19 represent the
boiler stru cture. Beam Element 44 represents the turbine pedestal and the
remaining beam elements represent the turbine building with Beam Elements
1 7 , 18 and 19 at the structural connection of the turbine building and
the boiler structure. Spring Elements 1 through 5 represent transla-
tional and rotational soil sti ffn ess es. Nodal coord inate s and beam
E-7

8/22/2019 6848574
http://slidepdf.com/reader/full/6848574 347/394
se ctio n prop ert i es and co nn ec tiv it i es are given on Tables E-2, E-3 and
E-4. Lumped masses and ro ta ti o n a l in e rt ia s are presented in Table E-5.
These inc lud e weights of s tr u c tu ra l members and equipment t r ib u ta r y to
each node. Un its are kip s and inches fo r these ta b le s . Note th at the
coo rdinate system used is shown in Figure E-1 1 , X = eas t-we st, Y = no rth -
sou th and Z = ve r t i ca l .
For north-south seismic exci tat ion, the re inforced concrete shear
w al ls at Column Lines A and G and the st ee l frame along Column Lines B, E,
F and H^ are rep rese nted by v e r t i c a l beam elements and diaphragms
provided by f l o o r s , ro ofs and ho riz on tal braced frames are represented by
ho riz on ta l beam elements at the app ropriate ele va tion s c onnecting no rt h -
south column l ines together s t r uc tu ra l ly . In th is manner, the d is t r ib u
t ion of seismic-induced forces along each column line accounting for
re la t i v e r ig id i t ie s and to rs ion is Inc luded in the model.
For east-west se ismic ex c i ta t io n , the Un i t 4 tu rb ine bu i ld in g
and b oi le r st ru ct ur e are a symmetrical mom ent-resist ing stee l frame and a
braced steel f rame, respect ively, with the except ion of the shear wal l
along Column Line 17 on the south side of the t ur bi ne b u il d in g . As a
r e s u l t , the v e r ti c a l beam elements at Column Lines A through H^ havelumped pro pert ie s fo r east-west d ir ec t io n ex ci ta t io n corresponding to the
cumulative st if fness of the structural steel members In the turbine
bu ild in g (columns) and b oi le r str uc tur e (braced frame) of Column Linds
1 4, 1 5, 16 and 1 7. In ad d it io n , v e rt ic a l beam elements repre sen ting the
south shear wall are included in the model at a southward offset from the
elements representing the steel members equal to one-half the building
wid t h . For east-west motion, horizontal members represent diaphragms
structural ly connect ing the shear wal l to the steel f rame and girders
runn ing in the east-west d i re c t io n . Note tha t to rs io na l s t i f fn es s o f the
bo i le r s t ruc ture is included in th is model. For east-west shaking, the
st ructura l mode l p roper ly accounts fo r the re la t ive r ig id i ty and to rs ion
of the steel frame and south shear w a l l .
E-8

8/22/2019 6848574
http://slidepdf.com/reader/full/6848574 348/394
The boiler is suspended from the top of the boiler structure and
will act as a pendul um under lateral seismi c moti on with little effect on
structural resp onse prior to impact with seismic restrai nts. When the
combined displ acem ents of the boiler and suppo rting structure are
sufficient to overco me the seismic gaps p rovided, the lateral respons e of
the boiler will influence the response of the struc ture. The boiler did
impact and damage the seismic restraints and the mass of the boiler has
been lumped to various nodes of the boiler structure for this evaluation.
Energy dissipation within the structures due to material and
structural damping has been represen ted by specify ing equival ent vi scou s
damping in accordance with the U. S. NRC Regulatory Guide 1.61 (Reference
E-7) used for design of nuclear power pla nt s. For the evaluat ion of
seismic-induced loads throughout the struc ture , 7 percent of critical
damping has been utilized. From the Regu lato ry Guid e, this damping is
appropriate for reinforced concrete (predominant behavior of turbine
building and turbine pedestal) and bolted steel structures (boiler
struct ure) subjected to Safe Shutdown Earthqua ke (SSE) mot ion . Soil
damping is predominantly the loss of energy through propagation of elas
tic waves from the immediate vicinity of the foundation (i.e., radiation
of energy from the structure to the surrounding s o i l ) . Radiation dampinghas been evaluated in the mann er descri bed bel ow.
In this evaluation of the El Centro Steam Plant, soil-structure
interaction is accounted for in an identical manner to that used in
Reference E- 1. By this approac h, the soil was treated as an elastic
half-space and soil springs and dashpots were developed using the rela
tions in Reference E- 3. The complex-shaped foundation was transformed to
an equivalent rec tangle with equal area for calculational pu rpo ses. Soilstiffnesses and dampings are based on soil she ar wave veloci ty of 650 fps
and shear modulus of 1600 ksf as average strain-compatible values over a
depth equal to the foundation width as reported in Reference E -1 . The
resul ting soil stiff nesse s evaluated by this approach are represent ed in
the analytical model by soil spring eleme nts attached to the rigid ground
E-9

8/22/2019 6848574
http://slidepdf.com/reader/full/6848574 349/394
f loo r-fo un da t ion elements as shown on Figure E-1 1 . Values fo r so i l s t i f f
nesses are presented i n Table E-6 fo r s o il sp ring element 1 through 5.
The re su lt i n g s o i l dashpot constants repre sen ting so i l ra d ia tio n damping
are Incorporated in to th is evaluat ion by ca lcu lat in g the f ra c t io n of
c r i t i c a l damping fo r each so il response mode ( i . e . , s l i d ing , rock ing and
to rs io n) and u t i l iz in g these so i l damping values along w i th st ru ct ur al
damping to determine modal damping values such that a response spectrum
dynamic ana lys is maty be pe rform ed . Soil damping r a ti o s are evaluated
from the assumption of a r ig id stru ctu re re st in g on an e la st ic hal f -space
such th at the so i l s t i f fn e ss and st ru c tu ra l mass are used to convert s o i l
dashpot constants to f ra c t io ns of c r i t i c a l damping. Frac t ions of c r i t i c a l
damping in each soil response mode ( i . e . , associated w i th so i l spr ing
elements 1 throug h 5) are presented in Ta ble E-6.
The so i l - s tr u ct u re in te ra ct io n approach employed fo r t h is e valua
ti o n of th e El Centro Steam pla nt is an approximate method i nc lu d in g
several s im p li fy in g assumptions. The treatment of the s o i l as an e la s ti c
hal f -space Ignores layering in the underly ing soi l which could poten
t i a l l y reduce the rad iat ion damping from that corresponding to an ela st ic
h al f-s p ac e. The fou nd atio n fo r th e El Centro steam pla nt is embedded
about 12 f e e t. Embedment ef fe ct s on s o i l -s tr u c tu re in te ra c tio n have beenignored he re in. A lso , f requency-independent re la t io ns for s o i l s t i f f ne ss
and damping are provided in Reference E-1 which are approxim ations w it h in
a c e rt a in frequency band since these so il Impedance fu nc tio ns vary wit h
frequ enc y. Furthermore, the conversion from so i l dashpot value to fr a c
t io n of c r i t i c a l damping depends upon an assumed fre qu en cy . As mentioned
above, this conversion was accomplished at frequencies corresponding to
s ing le-degree-of- f reedom o sc i l la to rs in which the r ig id s t r uc tur a l mass
or ro tat ion al in e r t ia is supported by the var ious so i l spr ing s t i f fn es se s.
In sp i te of the s im pl i f i ca t ion s employed fo r so1 1 -s t ruc ture I n te rac t ion
in th is e va lua t ion , i t is judged tha t adequate est imates of so i l s t i f fn es s
and damping at the frequencies of the soi l-structure system ( i . e . , at
frequencies between 3.5 and 5 Hz) have been obtained for this evaluation
of the steam plant.
E-10

8/22/2019 6848574
http://slidepdf.com/reader/full/6848574 350/394
For response spectrum dynamic an aly se s, i t is necessary to
evalu ate modal damping. To determ ine e qu iva len t modal damping, beam
elements were assigned 7 percent of c r i t i c a l damping and s o il sp rin g
elements were assigned the radiation damping values listed in Table E-6.
Composite modal damping values were then computed by an approach assuming
that element damping is proportional to the element stiffness for each
ele men t. However, modal damping values were not pe rm itt ed to exceed 20
percent of c r i t i c a l damping. Use of an upper l i m i t modal damping is
commonly used fo r the design of c r i t i c a l f a c i l i t i e s to obta in conservat ive
ca lc ula te d se ismic respo nse. Composite modal damping values wit h ve ry
high so il ra di at io n damping evaluated by the element st i f fn e ss we ighting
technique can be uncon servative w ith ou t an upper cu to ff because s tr u c tu ra l
response of combined soil-structure modes can be over-damped due to
smearing of s o il and s tr uc tu re damping. I t is our judgment th at an upper
c u t- o ff on damping w i l l lead to more accurate seismic response from
ca lcu lat io ns based on the approximate so i l -s t r u ct u re in ter ac t io n approach
used in t h i s stu dy . The ca lc u la te d modal damping values and the modal
damping values used in the response spectrum analysis are presented in
Table E-7 for all modes considered.
The freq ue nc ies of s tr u c tu ra l modes and the percentage of massp a r ti c ip a ti n g in each mode are presented in Table E-7. About 94 percent
of the to ta l st ru ct ur al mass is accounted fo r by the f i r s t 10 modes
ranging in frequency from 1.40 to 5.14 Hz. The f i r s t 10 modes are q u a li
t a t i v e l y d escribed i n Table E-8. By the 1 7th mode at 7.70 Hz, over 99
percent of the to ta l s tr u c tu ra l mass has been inc lud ed . T h ir ty -s ix modes
in c lu d in g frequen cies up to 1 8.63 Hz have been used fo r ev alu atin g s tr u c
tu ra l response in order to inclu de a l l loc al seismic vib ra t io n modes.
This number of modes enabled at least 98 percent of the mass for eachhorizontal degree of freedom to part icipate in the seismic response.
In di vi d ua l modal responses are combined to give a to t a l response for each
d ir e c t io n of e x c it a t i o n . Responses fo r each di re c t io n are then combined
t o giv e t o t a l seism ic resp onse . Modes are combined i n accordance wi th
Reg. Guide 1.92 Sec tion 1 .2.2 (Ten Percen t Method) which takes the abso
lu te sum of closely-space d modes and then sq ua re- roo t-of- the -su m -of- the -
E - 1 1

8/22/2019 6848574
http://slidepdf.com/reader/full/6848574 351/394
squares (SRSS) combination of other modes and summed closely-spaced modes.
To ta l se ism ic response was ev aluate d by SRSS com bina tion of combined
responses for each ex c i ta t ion d i r e c t io n .
E.6 ANALYTICAL RESULTS
Maximum seismic response displacements and accelerations are
prese nted i n Figure s E-12 and E-1 3. From Fig ur e E-1 2, i t may be seen
th a t maximum displacements are at the top of the b o i le r str uc tu re w ith
maximum values of 3.6 inches i n the ea st-wes t d ir e c ti o n and 5.5 inches in
the nor th-south d i r e c t io n . D isplacement of the turb ine bu i ld ing s tee l
frame at the top of the bui lding 1s 1.6 inches in the east-west direction
and from 1 to 2 Inches between Column Lines B and F in the no rth -s ou th
d ir e ct io n . North-south displacements of the concrete shear wa l ls at
Column Lines A and G and eas t-we st displacem ents of the concrete shear
w all along Column Line 17 are less than 0.5 Inch es. The large d i f f e r
ences in displacements and in accelerations as shown in Figure E-13, are
due to the large d i f ferences i n r ig id i t ie s of the var ious s t ru c tu ra l
components making up th is steam p la n t. The b o il e r s tr u ct u re is ve ry
f l e x ib le such th at large response displacements occur whi le the tu rb ine
bu i ld ing shear wa l ls are very s t i f f and have r e la t i v e ly low seismic
response d isp lacements . The f l e x i b i l i t y o f the turb ine bui ld ing s tee l
frame l ie s between th at of the bo i le r st ru ct ur e and the concrete shear
w a ll s . Based on the computed disp lace m en ts, i t is concluded th a t Un it 4
would not impact Unit 3 and the tu rb in e pede stal would not Impact the
operat ing f loor dur ing th is ear thquake.
Peak ac ce le ra tio n s, as shown in F igure E-1 3, are about 3 to 4g
in the n orth -sou th d ir e c tio n at the w al l along Column Line B in the upper
po rtio n of the turb in e b ui ld in g and at the heater bay f l o o r . Maximum
accelerat ion of the bo i ler s t ru c ture is about 2 .4g. I t i s In te re s t in g to
note th a t the maximum ac ce ler at ion of the fo un da tion is about 0.56g and
0.47g in the east-west and nor th-south d i re c t io n s, re sp ec t ive ly , wh i le
the maximum earthquake ground accelerations ( i . e . , ZPA va lues) are 0.35
and 0.49g in the east-west and north-sou th d i r e c t i o n s , re sp ec t ive ly.
E-12

8/22/2019 6848574
http://slidepdf.com/reader/full/6848574 352/394
Thus, there has been a si gn if i c an t am pl i f ic at ion f rom the ground accelera
t i o n fo r east-west earthquake shak ing. This am pl if ic at io n is due to s o i l -
stru ctu re i nt er ac t io n e f fec ts as t rea ted by th is an aly t ica l model and may
be an in di ca tio n of some overconservatism in t h is treatm ent. As state d
pr ev io us ly , the approach employed is th at t y p ic a ll y used fo r design
a nalyse s o f many c r i t i c a l f a c i l i t i e s .
In Figure E-13, i t is a lso in te re s t in g to note tha t the no rth -
south accelerat ions of the upper port ion of the boi ler st ructure a long
Column Line G are grea ter than those a long Column Line H^. At f i r s t
in sp ec tio n, i t would be expected tha t H^ response accelera t ions would
be grea ter since to rs io na l response should be greatest at th is column li n e
which is near the edge of the bu il d in g and because the bo il er st ru ct ur eis supported by the turb ine bu i ld ing shear wal l in th i s d i re ct ion a long
Column Line G. Closer ins pe ctio n reve als th at the no rth-s ou th response
o f Column Line H^ occurs at a frequ ency o f 1 .4 Hz and the no rth -s ou th
response of Column Lin e G occu rs at about 2 .7 Hz (See Tab le E-8) . At
frequencies of 1.4 and 2.7 Hz, the nor th-s ou th spe ctral acc elera t ions are
about 0.7 and l.O g, re sp ec tiv el y as shown in Figure E-7. This di ffe re nc e
in spectral accelerat ion is the reason that the seismic response accelera
t ion s at the upper po rt io n of the b o il e r str uc tur e along Column Line 6are la rge r than at the correspo nding ele va tio ns along Column Line H^.
The calculated seismic response moments and shears have been
used to e valu ate th e pr ed icte d performance o f El Centro Steam Pla nt U ni t
4. In the following discussion, the calculated seismic response and the
est imated ul t imate capacity for the structural e lements of the boi ler
st ru ct u re , turb ine bu i ld i ng and tur b in e pedestal are compared.
E.6.1 Bo ile r St ru ctu re Response
For the boiler structure, seismic response shears are obtained
from the beam element model shown in Figu re E -1 1 . The c r i t i c a l elements
are the diago nal braces along Column Lines 1 5, 1 6, G and H^ which car ry
lateral seismic loads from upper elevations to lower elevations of the
E-13

8/22/2019 6848574
http://slidepdf.com/reader/full/6848574 353/394
boiler structure and horizontal bracing member s which enable transfer of
seism ic loads in the north-south direction from Column Line H^ to G at
each elevation of the boiler stru ctur e. Shears in Elements 1 through 6
and 14 through 19 must be carried by diagonal braces which transfer
lateral seismic loads between various eleva tions of the boiler stru ctur e.
Shears in Elements 7 through 12 must be carried by horizontal bracing mem
bers which transfer north-south seismic loads between Column Lines H^
and G. For single diagonal br ace s, two shear capacities are provided
depend ing on whether the diagonal member is in tension or compre ssion.
The shear capac ity of an element in which lateral seismic resistan ce
consists of a single diagonal brace is the horizontal component of the
diagonal membe r force corres ponding to yield level for tension and
ultima te buckling capaci ty (AISC Part 2 criterion as given in Refere nce
E-4) for compression. For k-bracing or x-bracing, only a single shear
capa city has been evaluated. This shear capacity is the sum of the
horizontal components of the diagonal membe r forces corresponding to the
ultima te buckling capacit y for compression members and the ultimate
tensile capacity for tension mem ber s. For k-braces, the ultimate tensile
capacity is the lesser of the yield level or the maximum tensile force
which can be supported by the horizontal beam member whi ch must resist
the unbalanced load occurring if the forces in each of the k-brace
members are unequal .
The elastically computed seismic-induced shears and ultimate
shear capacities for diagonal members along Column Lines 15 and 16 in the
boiler structure are summarized in Figure E-1 4. For the diagonal members
between Elevations 1011 and 1031, the elastically calculated seismic-
induced shear is about 4.8 times the code specified ultimate shear
capacity and as shown in Figure E -1 0, these members did buckle as a
resul t of the 1979 Imperial Valley ear thq uak e. For most of the other
diagonal mem bers along Column Lines 15 and 1 6, the calculated load also
exceeded the capac ity but by a lesser amount . There was no evidence of
buckling for these members as a result of this earthquake including the
member s between Elevations 9 98 and 1011 for which the elast icall y
E-14

8/22/2019 6848574
http://slidepdf.com/reader/full/6848574 354/394
computed seismic exceeded the ultimate shear capacity by a factor of
about 3.5. Buckling of diagonal members subjected to oscillator y loading
such as earthquake excitation may not be apparent from post-earthquake
observat ions. For the boiler structure memb ers, the capacities are
governed by elastic buckling and during several cycles of seismic
resp ons e, the diagonal member might buckle and then straingten out under
tensile load. Only members which undergo significant deformation into
the inelastic range would remain permanently displaced such that their
buckling could be detected followi ng the earthqua ke. Furth ermor e, for
k-braces or x-braces in which one member is always in tensio n, the
deformations of a buckled member would be limited by the tensile mem ber .
As a result, it is possible that some of the diagonal members whose
calculated seismic response exceeded the code specified ultimate capacity
mao' have actually buckled during this earthquake even though there was no
evidence of buckling following the earthquake.
The elastically computed seismic-induced shears and ultimate
capacities for diagonal members along column Line H^ are summarized in
Figure E-1 5. Between Elevations 1031 and 1046 , the computed load/
capacit y ratio was 3.9 with no observed buckling and between Elevati ons
1011 and 103 1, the computed load/cap acity ratio was 4.0 and one of these
members was observed to have buckled followin g the 1979 eart hqua ke. All
other diagonal members along Column Line H^ had computed load/capac ity
ratios ranging from 1.4 to 2.6 with no buckling of these members observed
following the earthquake.
The calculated seismic shears and ultimate capacities for
diagonal members along Column Line G are shown in Figure E-16. There was
no buckling of these members observed fo llowi ng the 1979 earthquak e even
though the elastically computed seismic-induced shears exceeded the code
specified ultimate shear capaci ty by as much as a factor of 4.9.
E-15

8/22/2019 6848574
http://slidepdf.com/reader/full/6848574 355/394
At severa l e levat ions of the boi ler s t ruc ture, there are
horizontal braced frames acting as horizontal diaphragms as shown in
Figure E-1 7. At Elev ation 998, which is at the top of the r ein for ce d
concrete shear wall along Column Line G, the seismic-induced diaphragm
loads are the gr e at es t. The computed shears in t h is ho riz o nt a l braced
frame and the ult im ate shear ca pa cit ie s fo r the bo i le r st ru ct ur e diaphragm
at th is e leva t ion are summarized in Figure E-17. The e la s t i c a l l y ca lcu
la te d seismic-induced loads are as much as a fa ct o r of 3.9 grea ter than
the ultimate capacity although no buckling of these members was observed
at any e levat ion of the boi ler s t r uc tu re .
The columns throughout the boi ler structure are al l below their
y ie ld or buc kl ing capa cit ies based on th e ir ca lcula ted seismic response
f o r t he 1 979 Im pe ria l V al le y ea rthquake. No damage to these columns was
observed fol lowing the earthquake.
E.6 .2 TURBINE BUILDING RESPONSE
For the turbine bui ld ing reinforced concrete shear wal ls cast
m o no l i th ic al ly wi th the ex te r io r stee l frame on the so uth, east and west
s ides of the turb ine b u i ld in g , the u l t ima te shear capa ci ty has been
eva luate d in accordance w ith the ACI code (Reference E-5 ). For these
w a l l s , the seismic-induced shear load is carried by both the reinforced
concrete wa l l and the steel f ram e. Based on the re la t i v e r ig id i t ie s of
the w al l and fram e, 80 to 90 percen t of the shear load i s ca rr ie d by the
w all and 10 to 20 percent of the shear load is ca rr ie d by the fram e.
On Figure E -1 8, the elements in the s tr u c tu ra l model are
gra ph ica l ly represented on e leva t ion v iews of the turb ine bu i ld ing w a l ls .
Also shown on this figure, are the seismic-Induced shear loads and theult imate shear capacit ies from the ACI code for each of these elements.
A l l but one of the elements is below the ulti m at e ca pa city although the
seismic-induced loads are si g n if ic a n t such th at some crack ing might be
expected. For Element 19, at the lower region of the west w a l l , the
elastical ly computed seismic-induced load exceeds the code specif ied
E-16

8/22/2019 6848574
http://slidepdf.com/reader/full/6848574 356/394
ult im ate ca pacity by 11 pe rcen t. However, i t is recognized tha t the
ult imate capacity for shear walls as specif ied in the ACI code is conser
vat ive re la t i v e to labo rato ry tests on shear w al ls . Furthermore, the
ul tim at e ca pa city rep orte d i n Figure E-18 is based on minimum s pe ci fie d
ma teria l strengths and the actual s treng th of the concrete and re in fo rc in g
ste el f o r the tu rb in e bu ild in g w alls is l i k e l y to be more than the minimum
value s. As a r e s u l t , fo r the small amount of ca lcu lated seismic overload
in Element 1 9, no s ig n if ic a n t damage would be expec ted. I t should be
noted that shear stress in these walls are calculated to be generally
greater than UO psi ( i . e . , about 2 v f ^ such tha t some concrete cra ckin g
would be expected. The highest c alc ula ted shear stress fo r the tu rb ine
bu ild in g w alls is 255 ps i fo r element 19. A ll other wall elements have
ca lcu late d shear stresses less than about 200 p s i.
The tu rb in e b ui ld in g ste el frame is designed predominantly fo r
lateral forces in the east-west direct ion as the columns are loaded about
th e i r s t rong ax is fo r th is d i re ct i on mot ion . In ad d i t ion , the shear wa l l
a long the south side of the turb ine bu i ld ing c arr ie s a si gn if i ca n t po rt ion
of the east-west la t er a l fo rce s. As a re s u l t , the tu rb ine bu i ld ing
moment-resisting steel frame responds to the east-west component of the
1979 Imperial Valley earthquake below the yield stress level.
For la tera l fo rces in the nor th-south d i rect ion , the tu rb ine
bu ild in g ste el columns are loaded about th e ir weak axis but la te ra l
forces in th is d i re ct io n are ca rr ied by the re inforc ed concrete shear
wa lls along the east and west sides of the turb ine b u il d in g . There is a
problem in th is d irect ion in that the only ef fect ive d iaphragms for
t ra ns fe rr in g seismic- induced loads f rom the in te r i o r stee l frame to the
ex te rio r concrete w alls is the ope rating f l o o r which is 20 fe et above theground f loor and the concrete roof over the heater and auxil iary bays.
The roofs over the turbine and service bays are composed of gypsum
decking and composition roofing and are not as effective in diaphragm
action as the concrete f lo o rs and roo fs (see Figure E-1 9).
E-17

8/22/2019 6848574
http://slidepdf.com/reader/full/6848574 357/394
As a re su lt of the lack of ef fe ct iv e d iaphragms for t ra ns fe rr i ng
loads from the interior steel frame to the exterior concrete walls, some
of the frame elements above the o pe ra tin g f l o o r are computed to be
strained into the plast ic range when subjected to the north-south compo
nent of the 1979 Im pe ria l Va lle y earthquake . Along Column Line B, the re
is a shear wa ll as shown i n Figure E-19 fo r which seism ic response ac cel
era t ions of about 4 g's in the north-sou th di re c t io n (see Figure E-13) are
computed. The i n e r t i a l loads from t h is shear w al l must pass down through
the p ort ion of the ste el frame represented by Element 49 in the st ru ct u ra l
model to the operating floor and then out to the east shear w a l l . The re
s u lt in g seismic response moments in the s tee l columns at t h i s lo ca tio n are
about a fa ct o r of 1 .9 gre ate r than the p la s ti c moment ca pa city fo r these
column se c ti o n s . At Column Line s E and F, the heater bay f l o o r is com
puted to have seism ic response acc ele ratio ns of about 3 g's in the no rt h-
south d i re ct io n (see Figure E-13). The corresponding in e r t i a l loads for
the heater bay f l o o r must be tra ns fe rre d through the p or t io n of the s tee l
frame represented by Elements 27, 28 and 38 to the roo f or op era ting fl o o r
and out to the west shear w a l l . The resulting seismic response moments
in the s tee l columns at these lo ca tion s are from a fa c to r of 1 .2 to a
factor of 1.8 greater than these column sections as indicated in Figure
E-19. As mentioned p re v io u sl y , there was no s ig n if ic a n t damage in thetu rb in e b ui ld in g as a re s u lt of the 1979 Imp erial V all ey earthquake even
though the calculated seismic moments exceeded the plastic moment capacity
f o r some of the s te el columns by ne ar ly a fa c to r of 2.
The op era ting f l o o r , heater bay f l o o r and the roo f over the
a u x il ia r y and heater bays are e ff e c ti v e diaphragms made of metal decking
and concrete f i l l . The shear stresses calculated in the elements of the
structural model representing these diaphragm elements are summarized inTa ble E-9. The maximum shear s tre ss o f 253 ps i is i n Element 23 , which
transfers the roof loading from east-west shaking between the turbine
bu ild in g ste el frame and the south concrete shear w a l l . No s ign i f i can t
damage would be expected for any of the computed shear stresses shown in
Table E-9 although some concrete cracking might be expected for shear
stresses in excess of about UO psi ( i . e . , a b o u t 2 v / TT ) .
E-18

8/22/2019 6848574
http://slidepdf.com/reader/full/6848574 358/394
other less effective diaphragm action occurs at the roof of the
tu rb ine bay and se rvic e bays (Elements 41 and 52 fo r no rth- so uth m otion
and Elements 46 and 47 for east-west motion as shown in Figure E-11).
The primary load carrying elements of these diaphragm elements are single
angle x-br acin g in the ho rizo nta l plane . The ca lcula ted seismic-induced
loads i n these diago nal members are as much as 4 times th e y ie ld ca pa city
o f the member. However, th ere was no damage in the roof observed f o l
low ing the 1979 ea rthq uake. I t should be noted th a t some of the diaphragm
loa din g could have been tr a n sf e rr ed by the ro o f d ec king. The more complex
load pa tte rn of p ar t of the load through ro of decking and pa rt of the
load through horizontal bracing has not been considered herein.
E.6.3 Turbine Pedes tal ResponseThe turbine pedestal is calculated to respond to the 1979
Impe rial Val ley earthquake at a r e la t i v e ly low stress le v e l . Calculated
stres ses correspond to the e la s ti c behavior ran ge . There was no damage
observed at the turbine pedestal fo l lowing this earthquake.
E.7 SUMMARY AND CONCLUSIONS
The El Cen tro Steam Plant was subjec ted t o the Im pe ria l Val ley
earthquake which occurred on October 15, 1 979. I t is estimated th a t themaximum ho riz on ta l earthquake ground ac ce ler atio n at the p lan t s it e was
about 0.5g . The ste el fram ing throug hout U nit 4 of the plan t was designed
fo r an equiva lent la te ra l seismic loading of 0.2g although the plant had
ad di t ion al capaci ty due to turbine bu i ld in g rein force d concrete shear
w alls which are capable of re s is t i n g la te ra l seismic load ings . Because
of the lack of si g n if ic a n t damage at the plant as a re su lt of th is ea rth
quake even though earthquake motion spectral acceleration exceeded design
leve ls by a fa c to r of as much as 5 to 6 as shown in Figu res E-7 and E-8,a de tai le d s tr u ct u ra l eva luatio n of the El Centro Steam Plant subjected
to the 1979 Imperial Valley earthquake was performed and is reported
he rein as part of the NRC research p ro je ct on Eng ineering Cha racter
iz a ti o n of Ground M otio n. The purpose of t h is work was to dem onstrate,
fo r th is case, whether or not an e la s ti c an alys is based on recorded
E-19

8/22/2019 6848574
http://slidepdf.com/reader/full/6848574 359/394
earthquake ground motion would predict damage in excess of observed damage
fo l lo win g the ear thquake. In ad d i t io n , i t is o f in t er es t to eva luate the
fa ct or by which e la s t i c a l l y ca lculate d seismic response leve ls exceed
ult im ate ca pa cit ies . For example, studies of several st ruc tures s ubjected
to the 1 971 San Fernando earthquake ind ic at ed th a t the onset of s i g n if
ica nt s t ru ct ur al damage should not occur at e la s t i c a l l y ca lculate d forc e
le ve ls less than 2.5 t imes the u lt im ate ca pa city for San Fernando ea rth
quake ground m otio n. I t was expected th at th is ev alu atio n of the El
Centro Steam Plan t would provid e f u rt h e r evidence fo r the need to develop
a reasonable des ign and ana lys is bas is fo r c r i t i c a l f a c i l i t i e s wh ich
accounts fo r the "e f f e c t i v e " repeatable ground mot ion ac ce ler at io n, the
dur ation of the strong ground motion and the in e la s t i c energy ab sorption
ca p a b i l i t y o f d u c t i l e s t r u c t u re s .
Un it 4 of the El Centro Steam Plan t c on sis ts of a ste el braced
frame bo i le r st ru ctu re at tached to the tur b in e b ui ld ing which is a ste el
mom ent-resistant frame w ith three ex te rio r re inf or ce d cont:rete shear
wa l ls and a s tr u c tu ra l l y Independent re info rce d concrete frame tu rb ine
pede stal a l l on a common foun datio n mat. The un de rly ing s o il co ns ists of
deep al luvium.
The October 15, 1979 Imperial Valley earthquake had a local
magnitude of 6.6 . Ground motion measurements in the v i c i n i t y of th e
El Centro Steam Pla nt inclu ded Sta tion s 8 and 9 of the Im pe rial Vallfey
l ine ar array and Sta t ion 5165 of the USGS d if fe re n t i a l arra y. I t is
judged tha t S tat ion 5165 located about 2,400 fe et from Unit 4 provides a
reasonable estimate of the ground motion at the pla nt s it e and a di g it iz e d
version of th is recorded t ime h is to ry has been used fo r th is st ru ct ur al
eva luatio n of the steam p la n t. For the north-s outh component of m otio n,
the maximum ac ce ler at io n is 0.49g and the d ura tio n o f stro ng m oti on , T^,
is 2.8 seconds. For the east-w est component of m o ti o n , the maximum a ccel
er at io n is 0.35g and the du ratio n of strong m otio n, TA, is 3.7 seconds.
Thus, the El Centro Steam Plant was subjected to high a cc ele rat io n ea rth
quake ground shaking of moderate duration.
E-20

8/22/2019 6848574
http://slidepdf.com/reader/full/6848574 360/394
Ther e was no significant structural damage of the plant as a
result of the 1979 ear thqu ake . Most nota ble damage was at upper eleva
tions of the boiler structure where four diagonal bracing members buckled
and there was permanent deformation of boiler seismic rest rain ts. Other
damage noted was minor concrete cra cking. These structures were in no
danger of collapse as a result of the earthquake and, in fact, were
returned to operation on the same day of the earth quake . The buckled
diagonals were replaced.
A beam element , lumped mass structural model of Unit 4 was
developed for this evalu ation . So11-s tructu re interaction was accounted
for by soil springs attached to the foun dati on. Reg. Guide 1.61 damping
values for structural e lemen ts and calcu lated radiation damping for soil
elements were used to evaluate composite modal damping val ues . An upper
limit of 20 percent of critical dam ping was imposed in a mann er consi stent
with man y design analyses of critical faci liti es. Seismic respo nse was
evaluated by an elastic respo nse spectrum analysis using spectra from
Station 5165 horizontal recorded ground mot ion . Calculated seismic
response was then compared to code specified ultimate capacities to assess
analytically predicted structure behavior based on elastic analysis and
instrumental ground motion.
Based upon this evaluation of the El Centro Steam Pla nt, there
are two general conclusions which can be ma de :
1. The seismic capacit y or resistance of a structure cannot,in general , be directl y Inferred from the design levelearthquake motion.
2 . Elastic structural calculation s based upon Instrumentalground motion which are typically used for design analysesof many critical fac ilities do not lead to good correlationbetween calculated and observed structure be havior .
The seismic design basis for the El Centro Steam Plant was an
equivale nt lateral seismic coefficient corresponding to 0.2g. This
horizontal force coeffi cient was applied to live and dead loads and was
E-21

8/22/2019 6848574
http://slidepdf.com/reader/full/6848574 361/394
used to design the building steel frami ng. Detail s of the design approach
are unknown but because the design was performed around 1 968 , it is likely
that the design criterion correspond to working stress values plus one-
third increase for dynamic loading as allowabl e stress limits. In addi
tio n, exterio r reinforced concrete shear wall s on three sides of the
turbine building were added to the turbine building steel fra me which had
already been designed for the horizontal force coefficient of 0.2. As a
result of the above fac tor s, it may be seen that seismic re sistance cannot
be directly inferred from the design level earthquake mot ion . Although
the steam plant Unit 4 structure was designed for a horizontal forc e
coefficient of 0.2, that does not mean that structural failures or damage
would be expec ted for earthquake ground moti on greater than 0.2g. The
lateral force coefficient ignores dynamic amplification during seismicresponse of the structure such that inertial loads at higher elevations
in the structure for a 0.2g earthqu ake can be much greater than that
correspondin g to 0.2g. On the other hand, application of the lateral
coefficient to live loads as well as the usage of very conserva tive
allowable stress criteria enable the structure to resist seismic loads
signi fican tly greater than that correspon ding to a 0.2g ear thq uak e.
However, a primary reason that the steam plant can resist motion
exceeding 0.2g is the exterior concrete shear walls around the turbine
buildi ng. These walls are signific antly stronger than the steel frame
such that they actually dominate the seismic resistance capacity of the
turbine building even though they are additional to the basic lateral
resistance accounted for by the Unit 4 des ign er.
From the combination of factors described abo ve, it may be seen
that it is Impossible to infer the seismic capacity of the El Centro
Steam Plant Unit 4 from the design earthquake leve l. In this cas e, the
structure has considerably greater capacity than that corresponding to an
earthquake with peak acceleration of 0.2g due primarily to the presence of
additional con crete shear walls . It is our judgment that this situation
is not abn orm al. Most structures have additional c apacity above that
accounted for by the designer due to the existence of alternate load paths
E-22

8/22/2019 6848574
http://slidepdf.com/reader/full/6848574 362/394
not expl ic i t ly accounted for in the design, due to strength provided by
non-structural elements such as part i t ions, wal l c ladding, equipment or
p i p i n g , e t c . , and due to the usage of cons ervative design c r i t e r i a . These
fa c to rs may be one of the reasons th a t the conclusion s of Appendix A
( i . e . , th a t str uc tu re s behave much be tte r du ring actu al earthquakes than
would be expected based on their design cri teria) are seen.
Based upon the evaluation of El Centro Steam Plant Unit 4
repo rted h er ein , i t is a lso demonstrated tha t even i f the above fa cto rs
are accounted fo r by con side ring a ll s tr u c tu ra l re sist an ce mechanisms
a va i la b le , using code sp ec i f ied u l t ima te stren gth l im i t s and using re
corded earthquake motion at the si te of the structure considered, analyt
ic a l approaches which are ty p ic a l l y used fo r the design of many c r i t i c a l
f a c i l i t i e s such as nuclear power plants s t i l l underestimate the seismic
re sist an ce ca pa city o f the st ru ct ur e and p re d ic t more damage than was
seen during an actual earthquake.
The analyt ical ly predicted structural performance of the various
components of t he El Centro Steam Pla nt U nit 4 st ru ct u re is summarized i n
Table E-10 in terms of the ratio of seismic response to ult imate capacity
or by q u a l i t a t i v e d e sc rip tio n . The only damage occ urring to the steampl ant as a r e s u lt of the 1979 earthquake was bu ck ling of d iagona l members
at upper eleva t ions of the bo i le r str uc tu re . This represents lo cal ize d
minor damage which was e a s il y re p a ir a b le . Based upon pos t-earthq uake
examination of the structure, the steam plant was not in danger of
co l lap se . Ye t, based upon the e la s t ic a l l y calc ula ted seismic response as
summarized i n T able E-1 0, much more s ub s ta n ti a l damage than was observed
would be ex pe cted. For the members damaged du rin g the e arthq uake , the
r a ti o of ca lcu late d seismic response to ult im ate cap acity is 4.0 org re a te r. For the members undamaged du rin g the ea rthqu ake , the r a t i o o f
ca lcu late d seismic response to ult im ate cap acity is 4.9 or les s. Hence,
i t may be concluded th at fo r the Im pe rial V alle y earthquake and the steam
plant s tr uc tu re , the onset of s ig n i f i ca n t stru ctur e damage should not
occur at el a s t i c a l l y calcu lated force leve ls less than about 4.0 t imes
the u l t imate capac i ty .
E-23

8/22/2019 6848574
http://slidepdf.com/reader/full/6848574 363/394
A prim ary reason f o r the lac k of damage at the steam p la nt as a
re s u l t of the 1979 earthquake was tha t the str uc tur e had s ub st a nt ia l ly
greater capacity than the 0.2g design level for the steel frame because
of the e xt e rio r concrete shear wal ls on three sides of the tu rb ine
b u i l d i n g . However, the calculated seismic response based on recorded
motions from the 1979 earthquake of in d iv id u a l s tr u c tu ra l members exceeds
th e ir code sp ec if ie d ult im ate cap acit ie s by as much as a fa ct or of 4.0 or
more w itho ut any s ig n if ic a n t s tr u ct u ra l damage. Based upon e la s ti c a l l y
ca lcu lat ed seismic respo nse, b uck ling of more members of the b o ile r
st ru ct u re and some tu rb in e b u ild in g damage would have been pre dic ted fo r
the 1979 ear thqu ake . There are a number of reasons fo r th e lack of
damage seen in the bo i le r str uc tu re and tu rb ine bu i ld ing ste el framing
i n c l u d i n g :
1 . Inelast ic energy absorpt ion capabi l i ty is not accounted forby e la s t i c ana lys i s .
2. Foundation l ev el motion may be less than i s ca lcu lat ed bythe analysis performed due to:
a. sp at ia l va r ia t io n of ground mot ion over the founda t ionarea.
b. wave sc at te rin g or kinem atic in te ra ct io n phenomena.
c . more complex so i l - s t ru c t ur e In te rac t ion ef fe c ts thanassumed fo r t h is an aly sis in cl ud in g some embedmente f f e c t s .
3. The an al yt ica l technique of employing an upper l i m i t cu to ffto composite modal damping may not f u l l y account fo r s o ilradiation damping and thus give overly conservative seismicresponse.
I t is not known which of the above fac to rs are the mostimpo rtant reasons fo r diff er en ce s between ca lcu lat ed and observed
behavior of the El Centro Steam P la n t. In our judgment, a l l of these
fac tors are probably s ig n i f i ca n t .
E-24
8/22/2019 6848574
http://slidepdf.com/reader/full/6848574 364/394
I t is shown by th is ev alu atio n of th e El Centro Steam Plant th a t
the seismic resistan ce capa ci ty cannot be d i r e c t l y in fe rre d from the
design earthquake le v e l. Factors such as conservatism in the al lowa ble
stress c r i t e r io n and streng th of the str uc tur e which, fo r some reason, i s
not accounted for in the structural design, cause the structure to becapable of withsta nd ing higher ground motion than the design le v e l. I t
is b el ieve d tha t the steam pla nt is not abnormal in th is regard and th a t
th is conclusion is genera l ly t r u e . Another important conclusion to note
is tha t the an aly t ica l approach employed fo r th is ev alu at io n, which is
ge ne ra lly ty p ic a l of th at used fo r design analyses of many nuclear power
f a c i l i t i e s u t i l i z i n g e la s t i c ana lys i s and inst rumenta l ground mo t ion ,
does not lead to good co rr e la ti o n between ca lcu late d and observed seism ic
beh avior. This method of ev alu atio n und erpre dicts the seismic cap acityof the El Centro Steam Plan t by more than a fa c to r of 4. Hence, i t is
concluded th a t some or a l l of the fa ct o rs such as in e la s ti c energy absorp
t i o n ca p a b i l i t y wave sca tte r in g phenomena, more complex so i l - s tr u c tu re
in te ra c t i o n , e tc . should be Incorpora ted in to the approach used fo r design
analyses of nuclear power plants or other cr i t ical fac i l i t ies such that
r e a l i s t i c designs may be achieved.
E-25

8/22/2019 6848574
http://slidepdf.com/reader/full/6848574 365/394
Table E-1
PEAK ACCELERATIONS RECORDED DURING THE
1979 IMPERIAL VALLEY EARTHQUAKE
S t a t i o n
7
1 ^
1 5165
1 ^
1 °
A z i m u t h *
230
140
V e r t i c a l
230
140
V e r t i c a l
3 6 0
27 0
V e r t i c a l
3 6 0
0 9 0
V e r t i c a l
0 5 0
3 2 0
V e r t i c a l
U n c o r r e c t e d
.47g
.34g
.63g
.48g
.62g
.48g
.49g
.35g
.75g
, 4 0 g * *
. 2 7 g * *
. 3 8 g * *
.18g
.23g
• iig
C o r r e c t e d
• 4 6 g 1.33g
•51g
.47g 1
.61g
.41g
.49g 1
.35g
.66g
—
.17g
.23g
• iig
* Numbers are horizontal angle from north measured clockwise
** Estimated Values
E-26

8/22/2019 6848574
http://slidepdf.com/reader/full/6848574 366/394
Table E-2
NODE COORDINATES
C E N E R A T E O N O D A L C A T A
NOCEItUHBER
123
*967
a910
1112131415161718192021222324292b
2728
2 9303132333135363738394 0
41
42434 4
4S
BCUNOARVX00000000
c000
c0000000
c0
c000
c0
0000
c00000
c0
cc00
1
Y00000000
000000000000
c00
c0000
0000000000
c0
0
000
1
CONCITiON20
c0
cc00
c00
c0000c0000
c0
c000
c0
000010
c00c00
1000
1
XX00000000
00000000000000000000
000000000000
0000
1
CCCESYY
0
cc
220
ccc000
c0c0000
c0000000000000
0000
c00000
cc
0C 00 c0 0
1
NCOALX
Z1480£*0415360E*04214eOE*0419360E*0421480E«041S360£*0421480Et0421480E*04
21480E*04214eOE*0415360E40415360E«0419360E*0415360E'»04132C0E«0413200E*041C200£*0413200E«041C200E«0413200E*04I32C0E«0413200E*041C2C0£«04132C0E*0410200E«04132C0£*043tO0OEt033600CE*03
13200E»0418O00£«03I8000E*033tOCO£*03.7e0C0£«03.36000E*03.3t00CE«03.ieC0OE«O3.1800CE«03.180C0E*03.ieOOO£*03.36C00E*03
.780C0E*03
.7aOOOE*03
ROI»T COCRCINATES
0 .0 .0 .0 .0 .0 .0 .0 .
0 .0 .0 .0 .0 .0 .0.0 .0 .0 .0 .
0 .
0 .
o !
0.
-,
0 .0.0 .
-,0 .0 .0 .
0 .0 .0 .0 .
sseooE
Y
»C3
95800E*C3
55eO0E*C3
5)aOOE 03
S5800E*C3
S580CE*C3S5800E*C399800E*C3
55800ES5800E
>C3>C3
S5800E*C3
10000E*03
2.11640E*04.11640E*a4.9840CE*03.98400E*03.744C0E*03.74400E*03.S9640E*03.456C0E*O3
.240C0E*030 .
.59640E*03
.45600E«03
.240C0E*030 ..59640E*03.40aOOE*03.40a0OE*03
0 ..S9640E*03.S9640E*03.24000E*03.40aOOE*03.24000E«03.240COE*03
0 .C ..5964CE*03.99640E*03
.24000E«03
.24O00E*030 .C .C ..38040E«03.3a040E*03.38040E*03.24000E*03.240COE*03
C ..240C0E*O3
.27000E*03
.38040E*03
. ^ 4 0 C o e * e ^0 .
c.
* 0 - free
1 - fi xed
Note: Units a r e inches
E-27

8/22/2019 6848574
http://slidepdf.com/reader/full/6848574 367/394
Table E - 3
BEAM PROPERTIES
3 / C E A P E L E M E N T S
NUNBER OF BEAPS • 67NUMBER OF GEOPETRIC PROPERTY S E T S * 5 2NUPBER OF FIXEC ENO FORCE SETS - CNUMBER OF MATERIALS • 2
PATERIAL PROPERTIES
PATERIAL
NUMBER
YCUNC*SMCOULUS
.3C00£*C5
.31CCE*C4
POISSCN»SRATIO
.3C00
.2500
PASSDENSITY
HEIGHTDENSITY
0 .
0 .
0 .
c .
tEAP GEOMETRIC PROPERTIES
SECTIONNUMBER
12
34
!6789
IC1112131415It1718192C21
22232425262728293C313233343 !363738
394C414243444546474849909192
AXIAL AREAA ( l )
.1C0CE*C5
.100CE«09
.100CE*C5
.10CCE*05
.1CCCE«C5
.10CC£*C5
.1C0CE405
.100CE*C5
.100CE«C5
.1C0CE«CS
.10CCE*05
.100C£«C5
.1CCC£*C5
.1CCCE*C5
.1CCCE*C5
.1000E*C9
.1C0CE«09
.100CE*C5
.1C0CE«C5
.1C0CE«C9
.1C0CE«C9
.100CE*09.1C0CE4C5
.1C0CE*C5
.1CCCE*C5
.1000E«09
.100CE*C9
.1C0CE*05
.1000E«C9
.100CE*05
.1CCCE*C9
.IC0CE*09
.1CCCE4C5
.1C0CE4C5
.1C0CE*09
.1C0CE*C5
.tCCCE*C5
.100CE*09
.1CCCE«C5
.100CE*05
.10CCE«05
.100CE*CS
.1C0CE«09
.1C00E*C5
.1CCCE«C5
.1C0CE«C5
.100CE4C5
.10CCE4C9
.1000E*C9
.100CE»09
.100CE«05
.1C0CE*C9
SPEAR AREAA(2I
C ..1CC0E*02
.77O0E*Ol
.990CE*01
.1C0CE*02
.194CE«02
.1970E*02
.1CCCE*02
.770CE«01
.9900E*C1
.9CC0E«02
.173CE«03
.176CE«030 .C .C .C .C .C .C .0 .
c.C .C ..3140E»04.314CE«04.4870E*04
C .0 .C .C .0 ..134CE*05
C .C .0 ..115C£*04
C .
C .C ..276CE«04.1610E*04
0 .C .C ..£26CE*03.:76CE»03
C .0 .
c.c.c.
SHEAR AREAAI3I
0 ..1380E*02
.1COO£«02
.1110E«02
.2210E402
.2C40E«02
.1340E«02
.7700E401
.7400E*01
.9100E401
.8930E«04
.6400E404
.8930E«04
.2CaOE*03
.2C30E*03
.8810E«03
.4a00E*03
.8260E*03
.1460E401
.18a0E*Ol
.1660£«01
.20aOE*03.2030E403
.2C30E*030 .0 .0 ..1700E«01.2140E401.3560£«01.4700E«01
0 ..2C00E*O9.1930E*03.3730E«01.2500E*01.1710E«04.4600E*01
.2C30E*03
.2C30E*030 .0 ..5760E«03.6700E*04.6700E404
0 .0 ..7e00E*01.4600E*01
0 ..2750E«01.9C00E*01
TORSIONJill
.1000E«10
.3460E«C6
.2660E*06
.3430E4C6
.346CE*CE
.671CE«06
.6820E*06
.346CE*06
.266CE'»06
.3430E«C6
.311CE«C7
.6C4CE*C7
.614CE*C7
.1000E*00
.lOOOEtCO
.100CE*00
.1000E*00
.1C00E*00
.1C0OE4CO
.1000E«00
.1COOE«CO
.1000E«00.1Q0CE*C0
.1COOE*00
.1C00E«CC
.1000E«OC
.100CE«00
.1000E«CO
.1COCE*00
.1C00E*C0
.100CE«CO
.1COCE*00
.100CE*10
.1COOE«CO
.1C0CE«00
.1C0CE«C0
.100CE4CC
.10006*00
.1C0CE«CC
.1000E«00
.100CE«C0
.1000E«00
.1000E«00
.100CE4CC
.1000E*00
.1000E41C
.1C00E*10
.1000E«00
.1000E*00
. i c o c E * c e
.100CE*CO
.1000E«CO
INERTIA1(2)
.1000E*10
.1700E*07
.1700E*07
.2400E*07
.2400E*07
.9000E*07
.5000E407
.9000E*06
.1400£*07
.1400£*07
.1C00E«10
.1000E*10
.1000E*10
.1000E*10
.1000E«10
.100CE410
.1000E*10
.1COOE*10
.1C00E*10
.1000E410
.1000E*10
.1COOE*10.1000E*10
.1COOE«10
.1C00£*02
.1000E«02
.1000E«02
.1C00E410
.1CC0E*10
.1C00E*10
.1CC0£*10
.1000E*02
.1COOE*10
.1C00E*10
.1000E*10
.1COOE*10
.1000E*10
.1000E*10
.1C00E«10
.1000E*10
.1000E*02
.1000E*02
.1000E410
.1000E*10
.1000E*10
.1000E*02
.1000£*02
.1000E410
.1000E410
.3T90E*0»
.2C00E«0t
.4000E*06
INERTIA1(3)
.1000E*10
.35C0E407
.4100E407
.41C0E4C7
.94C0E4C7
.77C0E407
.1270E*0a
.39C0E407
.4100E4C7
.41C0E*07
.4a60E*ca
.6930E*C8
.1143E*09
.a3COE*04
.1450E*a9
.10COE*02
.1000E402
.10COE402
.97C0E404
.9700E*a4
.9700E404
.1020E4Q9.2340E4CS
.4030E*C5
.1000E*10
.1000E410
.10COE410
.16COE*04
.2390E4C5
.3640E*05
.16I0E4C5
.3750E*09
.10COE«10
.16C0E*04
.2350E*09
.3640E*09
.10C0E41C
.9aC0E*04
.4510E409
.4910E409
.10C0E410
.10C0E*10
.1000E*02
.4T00E*C9
.4700E*09
.10C0E410
.10C0E*10
.10C0E402
.1000E*02
.1CC0E4C2
.1CCOE*02
.1CCOE*02
Note: Units a r e kips a n d inchesE-28

8/22/2019 6848574
http://slidepdf.com/reader/full/6848574 368/394
Table E-4
BEAM CONNECTIVITY
3 /0 BEAM ELEPE NT DATA
B E A M
N U P B E R
123456789
1 0
111 21 31 419161 71 819
2 02 12 22 32 42 52 62 72 82 93 03 13 23 33 43 53 6J718
3 94 041S24 34 44 94 64 7
4 84 95 05 15 2S 35 45 55 69 7
5 85 96 06 16 26 36 46 56 66 7
N C C E- I
1357S9
13
«7
89
1 0246
1 11 21 3
1 11 31 4
1 5162 11 8
1 51 62 11 91 62 11 82 02 22 41 91 7
2 32 01 92 42 54 13 32 73 42 73 44 0
2 83 44 C3 83 23 9
3 9
3 63 C3 83 94 24 32 62 12 93 7
N O D E- J
35789
1 024
6
111 21 31 446
1 11 21 31 4
1 52 11 82 02 22 42 61 62 11 81 91 72 32 52 22 42 61 72 3
2 92 82 73 03 33 33 22 83 93 44 C3 2
3 94 23 84 33 94 43 6
3 03 13 C3 14 34 43 12 93 73 8
N O C E P A T E R I A L- K N U M B E R
1 6 21 5 21 9 21 5 1
2 8 22 8 22 8 2
3 5 1
2 0 1
3 9 12 8 1
2 0 2
2 0 1
2 0 22C 23 1 23 0 1
1 21 2
2 0 13 7 22 1 12 1 2
S E C T I O NN L M B E R
234567
5 15 2525 25 25 2189
1 0111 213
1 41 51
161 71 81
1 92 02 12 22 32 41
2 92 62 72 82 9
3 013 13 21
3 31
4 84 93 43 53 63 73 83 94 011
r
4 14 24 31
4 44 51
4 65 04 7
E L E M E N TA
00000000000000C0000
0000000
000000000000
0000000000000000000
0000
000000
B
00000000
00000000000
0000000000000000000
0000
000000000000000
0000
000000
E N C L O A D S
c
0
ccccccc0
c0
cccc000
cc0cc0
ccccc0
cc0
cc0
cc0c000
cc00
c0
c0000
cc0
cccccccccc
0
0000000000000000000
000
0000000000000000
0000000000000000000
0000000000
E N C C O D E S- I
00000000
0000
c0
00000
1100000
000000000000
01 1 1
00000000000000000
0000000000
- J
0000000000000000000
0000000000000000000
01 100000000000000000
0000000000
B A N
1 81 81 81 21 21 21 21 2
1 23 03 03 03 01 81 83 61 21 21 2
3 05 43 03 64 22 45 4
1 23 62 43 01 21 84 81 81 81 81 84 2
1 89 49 44 29 35 21 11 21 24 74 2S 34 7S 31 83 54 73 91 2
4 11 25 35 31 21 23 65 45 31 2
E-29

8/22/2019 6848574
http://slidepdf.com/reader/full/6848574 369/394
Table E - 5
LUMPED MASSES A N D ROTATIONAL INERTIA
N 0 C A L L C « C S ( S T A T I C ! 0 R P A S S E S ( C Y K A C I C I
KQCEhUrtBER
123
S
6789
111213ISIS161719202122232425262728293031333435
3637384041424344
LCACCASE
C0ccc0ccccCc
ccCccccc0cccccccccc
c0cc0
c0G0
X-AXISFORCE
.29300E«OC0 ..13570E«C1.1C9C0E40C.13(O0E«Ol.114C0E4CC.966COE*0C.12430E«C1.1S150E«01.143C0E4C1.39t00E*CC.242tOE4Cl.15C90E«0C
.33440E4CC
.39540E«CC
.14930E«CC
.2t7eOE«OC
.28350E«0C
.StS'iOE + CC
.28360E«0C
.1C270E«CC
.432SQE«0C0 ..18420E«CC.19e50E40C.e99C0E-01.ieC40E«0C.36390E4CC.1CC30E«0C.4S3C0E«02.17320E*0C.t82C0E-Cl.S23C0E-01.22200E40C.16920E«CC.71600E-C1.49870E*01.lie40E*0C
.3iceoE*cc
.21S80E*0C
Y-AXISFORCE
.613CCE*C0
.2StOCE*00
.4C00CE*C0
.3e<>0CE*00
.8700CE*C0
.6CC0CE«C0
.8950CE*CO
.8870CE«C0
.S910CE*C0
.1773CE*01
.9440CE*00
.3192CE+01
.19e6CEvC0
.3344CE»00
.3954CE*CC
.24C3CE400
.3ei4CE*00
.1365CE*C0
.6722CE*00
.1218CE*00
.4201C£*00
.5970CE«C0
.9460CE-01
.4190CE-01
.19e5CE*00
.8990CE-01
0 ..7940CE-01.4C9CCE-C1.4530CE*02.1732CE*00.7290CE-C1
0 .0 ..24C4CE*00.3833CE*00.4987CE*01.1591CE«00.4404CE«00.27e2CE*00
Z-AXISFORCE
.4530CE«00
.12eC0E«00
.87900E«G0
.2S300E*C0
.1115CE«Q1
.357CCE+00
.931CCE*00
.lCt5CE*01
.1C;30E*01
.15aC0E*01
.63500E*00
.2772CE*01
.1SC90E«C0
.3344CE»00
.39:40E4CO
.1493CE«00
.26760E*C0
.283S0E*C0
.62C8C£*0C
.2836CE«C0
.2CtOCE*00
.4325aE«C0
0 ..18420E*00.19eSCE*00.8990CE-01
C ..36390E*00.10C30E*00
0 ..17320E*C0.68200E-01
.S2300E-010 ..2CS0CE*00.23990E«00
0 ..1184CE«Q0.328SCE*C0.21880E«00
X-AXISnor<EKT
c .c .c .c .c .c .c .c .c ..10300E*05.16300E*05.17600E+05.116C0E*05
0.C.C .C .c.c.c.c.c.c.c..17200E«05
C .C .C .C ..48000E*07.16300E*05
C .
C .C .C .C .
.327Q0E406
.870a0E*04
.17500E*05
.16800E*05
Y - A X I SHCfENT
0 .0 .0 .0 .0 .0 .0 .0 .0 .0 .0 .0 .0 .
0 .0 .0 .
.SO00OE*O4
.143CCE«0S0 .
.14900E«0S0 .
.2210CE*0S0 .
.1910CE«0S0 .
.8600CE*030 .
.42900E+04
.2840CE*04
.2200CE*080 .
.470CCE*03
.17500E*040 .0 .0 .
.3690CE«0S0 .0 .0 .
Z-AXU
HCEHT
0 .0 .0 .0 .0 .0 .0 .0 .0 .0 .0 .0 .0 .
0 ..1180CF«05
0 .0 .
.35000F*04
.1030CF*05
.11000^*040 .
. 3 5 0 0 0 F * C ^0 .0 .0 .0 .0 .0 .0 .
.26000F*Oe0 .0 .
0 .0 .0 .0 .
.36400F«060 .0 .0 .
T O T A L P A S S
X-OIRECTIOh Y - D I R E C T I C I t 2-DIRECTIOfi.6t9t7E«02 .67487E*C2 .16e86E«02
Note: Units are k ips , inches and seconds
E-30

8/22/2019 6848574
http://slidepdf.com/reader/full/6848574 370/394
T a b l e E-6
SOIL ELEMENT PROPERTIES
ElementNumber
(See FigureE-11
1
23
4
5
Node(See Figure
E-11
33
3333
33
33
D i r e c t i o n *
x - T r a n s l a t i o n
y - T r a n s l a t i o nR o t a t i o n A b o u t x
Ro ta t i on Abou t z
R o t a t i o n A b o u t y
Spr ingS t i f f n e s s
( k / i n )
4.74 X 10^
5.32 X 10^2.32 X 10^°
3.47 X 10^°
5.46 X 10^°
Rad ia t i onDamping
( F r a c t i o no f C r i t i c a l )
0.89
0.950.78
0.49
0.69
* x = E a s t - W e s t
y = North-South
z = Vertical
E-31

8/22/2019 6848574
http://slidepdf.com/reader/full/6848574 371/394
T a b l e E-7
SUMMARY OF M O D E S . M A SS P A R T I C I P A T I O N AND M O D A L D A M P I N G
Mode
1 11 21 31 41 b
678
1 9
1 101 111 121 13
1 141 15
1 161 171 181 19
1 201 211 22
I 231 24
1 261 261 27
1 281 291 30
1 311 32
1 331 34
1 3536
Summat
F r e q . ( H z )
1.401.652M3 .02'i.223.653.974 .614 . 8 2
6.145.736.006 . 1 76 . 5 36 .627.247.70B . I 88 .708 . 8 59 . 6 /9.70
10.2610 . 6 011.1011.1612 . 0 712 . 2 41 4 . 1 615 . 6 015.$017.0917.5717.95
18.4318.63
. ion =
P e r c e n t of S t r u c t u r ei Mass P a r t i c i p a t i n g
N-S(Y)
6.261.66J .byU.U9y.U4
12.312.48
35.2916.65
8 .650.090.010 . 153 .350.210.291.480.230.020 .030.010.01
o.oz0
0.06000
0.01000
0000
100.00
E-W(X)
2.20
1 l & . O I1 u1 II.yy1 U.341 5.231 0.371 10.301 36.67
15.710.590.020.030.020 . 160.100.07
00.08
u0
O.OZ
0.030
0.02000
00.01
000 i
0.04 1
0 10
100.00
Modal DampingF r a c t i o n of C r i t i c a l I
C a l c u l a t e dVa lue
.0831 .099
1 .089
1 .1211 .105
. 178
.091
.489
.627
.360
.563
.080
.077
.152
.079
.086
.192
.0991 .1261 .073
.073
.072
.322
.070
.163
.071
.081
. 12 7
.084
. 13 8
.291
.091
.070
.085
.135.073
Value Used inResponse Analys s
.0 71 .10 1
1 .10 1
1 .10 1.10 1.1 5.1 0
1 .20 1.2 0.20.2 0.0 7
1 .07 1.1 5.0 7.07 1.20.1 0.10 1.0 7.0 7.0 7
.2 0
.07 1
.15 1
.07
.0 7
.1 0
.0 7
.1 5
.2 0
.1 0
.0 7
.0 7
.1 5
.0 7
Total Mass - N-S (Y) = 67.487 k-sec'/inE-W (X) = 66.987 k-sec2/ in
E - 3 2

8/22/2019 6848574
http://slidepdf.com/reader/full/6848574 372/394
T a b l e E - 8
D E S C R I P T I O N O F S I G N I F I C A N T M O D E S
M o d e
1
2
3
4
5
6
7
8
9
10
F r e q u e n c y ( H 2 )
1.40
1.65
2 . 6 8
3 . 0 2
3 . 2 2
3 . 6 5
3 . 9 7
4.61
4 . 8 2
5.14
P r e d o m i n a n t B e h a v i o r
N - S r e s p o n s e o f B o i l e r S t r u c t u r e a l o n gd o l u m n l i n e H - 9
E - W r e s p o n s e o f B o i l e r S t r u c t u r e a nd
T u r b i n e B u i l d i n g S t e e l F r a m e
N - S r e s p o n s e o f u p p e r B o i l e r S t r u c t u r e
a l o n g c o l u m n l i n e G
2 n d M o d e f o r E - W r e s p o n s e o f B o i l e r
S t r u c t u r e a n d T u r b i n e B u i l d i n g S t ee l
F r a m e
2 n d M o d e f o r N - S r e s p o n s e o f B o i l e r
S t r u c t u r e a l o n g c o l u m n l i n e H- 9
N - S r e s p o n s e a l o n g c o l u m n l i n e s E a n d F ,s o m e so il r e s p o n s e
N - S r e s p o n s e a l o n g c o l u m n l i n e B
N - S s oi l r e s p o n s e , N - S r e s p o n s e o f
c o l u m n l i n e s B , E an d F
E - W s o i l r e s p o n s e
N - S r e s p o n s e o f c o l u m n l i n e B
H i g h e r M o d e E -W T u r b i n e B u i l d i n g B o i l e r
S t r u c t u r e r e s p o n s e , so il r e s p o n s e
E ' . 3 3

8/22/2019 6848574
http://slidepdf.com/reader/full/6848574 373/394
T a b l e E - 9
S H E A R S T R E S S E S IN
METAL DECK-CONCRETE FILL DIAPHRAGM ELEMENTS
Element
(see Figure 11)
20
30
23
24
31
21
32
53
54
25
60
65
67
Direction
N-S
N-S
E-W
E-W
N-S
N-S
N-S
N-S
N-S
E-W
E-W
E-W
E-W
Description
heater and
auxiliary bay
roof
heater bay
floor
operating
floor
Elasticilly
Calculated
Shear Stress
(DSi)
83
55
253
103
45
14 5
55
122
127
158
81
114
119
E«34

8/22/2019 6848574
http://slidepdf.com/reader/full/6848574 374/394
Table E-10
SUMMARY OF CALCULATED SEISMIC BEHAVIOR
FOR EL CENTRO STEAM PLANT UNIT 4 SUBJECTED TO
THE 1979 IMPERIAL VALLEY EARTHQUAKE
Structure
1. Boiler Structure
a. Diagonal Bracing
b . Horizontal BracingDiaphragm
c. Boiler StructureColumns
2 . Turbine Building
a. Concret e ShearWalls
b . Steel Frame
c. Diaphragms
3. Turbi ne Pedestal
Calculated Behavior
For members that actually buckled duringthe earthquake, the response/capacityratio ranged from 4.0 to 4.8. For members
which did not buckle, response/capacitywas as high as 4.9 in one case, butbut generally below 4.0
Response/capacity ratios were as large as3.9 with no observed damage.
Elastic behavior below ultimate bucklingcapacity for seismic loading.
Elastic re sponse/capa city ratio was 1.11 at
bott om of west wall and below 1.0 for allo t h e r w a l l s .
Elastic behavio r for east-west exc itatio n.Seismic response nearly double plasticmoment capacity for weak axis bending ofinterior columns subjected to north-southexcitation with no observed damag e.
Concrete diaphragms have shear stressesranging from about 50 to 250 psi. Horizontal bracing angles exceed yield by asmuch as a factor of 4.0 with no observedd a m a g e .
Elastic behavior.
E-35

8/22/2019 6848574
http://slidepdf.com/reader/full/6848574 375/394
North
U Transformer yard
Pump No. 1
houses No. 2
Oil tanks
No. 4 o
No. 5
• '
o] i 1
\J^
FIGURE E-1 . PLOT PLAN O F T H E E L CENTRO STEAM PLANT (REFERENCE E - 1 )
E-36

8/22/2019 6848574
http://slidepdf.com/reader/full/6848574 376/394
E U t
1045-
1 0 3 0 -
Boiler
1 0 1 0 -
/ \ N —
DeaeratorTop of crane rail
9 8 3 -
9 6 9 -
( Evaporator IM l i l- i
fe^H U ^im
H. P. heater no. 4-3
Steam jetair ejector
9 4 9 -
- Turbine oilreservoir tank
©F I G U R E E - 2 . E L E V A T I O N D R A W I N G , L O OK I N G W E S T A T C O L U M N L I N E B , O F T H E
E L C E N T R O S T E A M P L A N T , U N I T 4 ( R E F E R E N C E E - 1 )
E - 3 7

8/22/2019 6848574
http://slidepdf.com/reader/full/6848574 377/394
1COCO
0- 2 6 -
Stackbay-o
Stack
El. 1 0 4 5
El. 1030
El. 1 0 1 0
El. 98 7
5s=sE!.949
- 5 1 -Boiler bay
-iG]
Elevations and di
mensions in feet
Auxiliary
18 (F >
liary bay I
25 0 -— bay V
55Turbine ba y
30 -
Servicebay •<?
High-pressurefeedwater heaters
rr * g"
•.' i • • • .1 r
g » t
. - - . — • - - , • .
• " • • ' • - • « ' - ••
Evaporator
Soiler feedwater pumps
• ' • • • • • •- • •• •
FIGURE E-3. ELEVATION DRAWING, LOOKING NORTH, O F T H E E L CENTRO STEAM PLANT, UNIT 4 (REFERENCE E - 1 )

8/22/2019 6848574
http://slidepdf.com/reader/full/6848574 378/394
I00I D
(C y —25—^Stack bay
I
51 -
Boiler bay
(G)—18 * ( ? ) ^ 25 ^ T )
Dimensions in ft
INI
Key
Auxiliarybay
Heater bay
M T ) Column line
Z Z : ^ Concrete shear wall
H - c r Steel column and f raming
Turbine pedestal
Generator pedestal
'M k ^» .
Base slab outline
V////A Reinforced concrete
G R O U N D F L O O R(El. 949)
31
®
31
FIGURE E-4 . SCHEMATI C PLAN VIEW O F T H E UNIT 4 GROUND FLOOR ( E L 9 4 9 FT) ( REFERENCE E-1)

8/22/2019 6848574
http://slidepdf.com/reader/full/6848574 379/394
115°45'W II B 'S C W
33°15'N -
Salton Sea
33''00'N
32''45'N
Nlland |
Calipatria Q I i ' I ' i 'i — H r
• Strong motionground stations
^ Differential array
Kilometers0 101^—1.—t-^
0 5
Miles
/
i W estmoreland
El Centre Steam Plant imperial ( )(USGS Station No. 5165)
Epicenter
10/15/79
FIGURE E-5 . MAP OF THE IMPERIAL VALLEY, CALIFORNIA, SHOWS THE IMPERIALFAULT AND THE EL CENTRO STEAM PLANT SITE . ALSO SHOWN ISTHE STRONG MOTION ARRAY THAT STRADDLES THE FAULT. (REFERENCEE
E-40

8/22/2019 6848574
http://slidepdf.com/reader/full/6848574 380/394
^ Indio 82 mi
iW»t«f rank' 1 _ 'J Sch_ ' __
\ _Imperial ygl lev ', _ i
C e n tral — •* j " ^ ^ | '^SSir^eT • . j ' i '
C
IWi'unn Sch ,
Harding
N M C pP l J l t I ;?—f—
:7 School
4
Radio S t *
• ^ K X O
3 2 ° 4 7 '
. • C E f ^ r / T A L
115° 34' C ol.i.co 9.6 n,.. ji 11 503 3' 115° 3 2
2 0 0 0 4 0 0 0
Scale in feet
El Centro - Terminal Substotion Q
USGS TopographicQuadrangle: El Centro, Cal i fo rnia .
Coordinotes; 3 2 ° 47 ' 4 2 " N115° 32 ' 5 5" W
Lo cation: N.W. corner of inters ectio n of
Third St. and Comm ercial Ave.
Stru cture : T *o story , heav y, reinforced concretebuilding.
S T A T IO N L O C A T I O N P L A N
- E L C E N T R O -
FIGURE E -6 . STEAM PLANT AND ADJACENT GROUND MOTION INSTRUMENT STATIONS
E-41

8/22/2019 6848574
http://slidepdf.com/reader/full/6848574 381/394
10 15 20 25 30
Time (s)
35
10 1 1—I I I I II I \ 1—I I I I 1 1—I I I M td
7 % Damping
0.01 J I I I I I I I I 1 I I I M i l l I I f I I I I
0.1 1 10
Frequency (Hz)
100
FIGURE E -7 . NORTH-SOUTH GROUND MOTION TIME HISTORY A N D RESPONSESPECTRUM F O R T H E OCTOBER 15, 1 9 7 9 IMPERIAL VALLEYEARTHQUAKE RECORDED A T U.S . GEOLOGICAL SURVEY STATIONNO. 5 1 6 5 (REFERENCE E - 1 )
E-42

8/22/2019 6848574
http://slidepdf.com/reader/full/6848574 382/394
lOp
0.01
" 1 1 — I I I I 1 1 T 1 — I I I I l l | 1 1 — I M M I d
7% Damping
R.G. 1.60
0.35 g-
' I i I I I i i I I I I I I 1 1 1 I 1 I I I I I I
0.1 1 10 100
Frequency (Hz)
FIGURE E-8 . EAST-WEST GROUND MOTION TIME HISTORY AND RESPONSE
SPECTRU M FOR THE OCTOBER 15, 1979 IMPERIAL VALLEY
EARTHQUAKE RECORDED AT U .S. GEOLOGICAL SURVEY STATION
MO. 5165 (REFERENCE E-1)
E-43

8/22/2019 6848574
http://slidepdf.com/reader/full/6848574 383/394
10- 5 6 7 89 iCT—I I • I I r 4 5 6 7 8 9 1 0
_i 1 I I I I r3 11 5 6 7 8 9 , 1 0 '
- I I I I • • ' "
O 1 0
UJoO mcr
o(n-co ocr -1.
°'UJ 10.
(n
DAMPING 0.070
0.100
0. 150
0.200
0.250
-CD
-in
10- 2—TTTTTnTrf I i i U H ^ o 'FREQUENCY IHERTZ)
EL CENTRO 19 7 9 . N-S
1 r^TTTTIPI^
10- 4 5 6 7 8 9 , 1 ofI I I r
3 4 5 6 7 8 9 1 0 ' 2_ i I i__i I I I r i_
3 4 5 6 7 8 9 1 0 *_ l 1 1 — I 1 I I - m
e-b
zo. — «
caU J_i
L U
<_)(_)crLLJ
(—r j_iC3in
CDcc
UJin0 .
w-iOD-l
f^-l
<D-|
*" 1
:»-l
<n-|
™ 1
~O^ ^0 ) - J
IO-4
in-
DAMPING 0 . 0 7 0
0 . 1 0 0
0 . 1 5 0
0 . 2 0 0
0 . 2 5 0
-i n
i^' I i~TTTTiiTtf 1 r m n T T FFREQUENCY (HERTZ)
EL CENTRO 1979. E-W
oOI
1 TTTTTH
44 FIGURE E-9 . ELASTIC RESPONSE SPECTRA, DIFFERENTIAL ARRAY (USGS STATION5165) IMPERIAL VALLEY EARTHQUAKE, OCTOBER 15,1979

8/22/2019 6848574
http://slidepdf.com/reader/full/6848574 384/394
1-PiCJ1
©
Buckled
Members
•
9I E l . 1 , 0 i * 6 '
/
/ E I . 9 9'7- /r
y ^
y .v
7- i r r ?
( j s ) (Js)
I E l . 1,0^6' j
Buckled
Members
T T T T yT T T
Column LineQ^ Column Line(T5) Column LinelH
FIGURE E-IO. DIAGONAL MEMBERS I N T H E UNIT 4 BOILER STRUCTURE WHICH BUCKLED DURING T H E 1979 IMPERIALVALLEY EARTHQUAKE

8/22/2019 6848574
http://slidepdf.com/reader/full/6848574 385/394
16 - Node Number
^ 9 ) - Beam Element
iTl- Soil Spring Element
Z (V e r t i ca l )
Y (N-S) \1 X (E-W)
nrp—(g
FIGURE E-11 . STRUCTURAL MODEL

8/22/2019 6848574
http://slidepdf.com/reader/full/6848574 386/394
Legend
(3.6, 2.9) =
•
3.6 inch max east-w est
displacement and 2.9
inch max no rth-south
displacement
1
--J
(N-S)
\1 •(E-W)
(0.3,1.9)
(3.6,2.9) (3.6,5.5)
(3.3,4.6)
•Maximum displacement of all foundation nodes
FIGURE E-12. MAXIMUM ELASTICALLY CALCULATED SEISMIC RESPONSE DISPLACEMENTS

8/22/2019 6848574
http://slidepdf.com/reader/full/6848574 387/394
Legend
(1.57,1.79) = 1.57g max imum east-west
acceleration and 1.79g
maximum north-south
acceleration
(N-S
M (E-W)
(0.63,4.02)
o5 (0.62,3.16)
(0.61,0.45)
(0.81,0.48)
(1.57,2.39)
(0.63,0.92)
.04.4.02)
(0.62,3.
(1.04,1
1.32,3.95) (0.90,2.92)
(Q.62,0.52)
(0.81,0.78)
(n ^fi.n A7)*
•Maximum acceleratio n of all foundation nodes
(1.57,1.79)
(1.29,1.20)
(1.21,1.05)
(1.04,1.07)
(0.67,1.08)
(0.76,0.85)
FIGURE E-13. MAXIMUM ELASTICALLY CALCULATED SEISMIC RESPONSE ACCE LERATION S
t

8/22/2019 6848574
http://slidepdf.com/reader/full/6848574 388/394
Calculated
Seismic
Response
V(kips)
131.8
548.1
723.9
545.4
630.6
676.6
Ultimate
Capacity
V^^y. (kips)
9 2 . 7 ( C ) *
283.0(T)
113.2
206.5
393.8
634.8
865.6
V/V
1.4(C)
0.5(T)
4.8^
3.5
1.4
1.0
0.8
Column L i n e ( l 5 ) & @
•Buckled Members
••(C) = Compression(T) = Tension
FIGURE E-14. SEISMIC RESPONSE SHEARS & SHEAR CAPACITI ES FOR COLUMN
L I N n s @ a n d < T | ) I N B OIL ER S TR UC TU RE
E-49

8/22/2019 6848574
http://slidepdf.com/reader/full/6848574 389/394
EL 1046
EL 1031
EL 9491
[CalculatedSeismic
Response1 V(kips)
378.2
5 10 . 9
564.6
578.2
699.6
726.5
753.4
UltimateCapacity
V cr
97 .1
126 .6
216 .4
330.7
5 1 1 . 1
477.8
520.0
V/V" ' " c r
3 .9
4 . 0 ^
2 .6
1 .7
1 .4
1 .5
1 .4
• B u c k l e d M e m b e r
C o l u m n L i n e v H - >
F I G U R E E - 1 5 . S E I S M I C R E S P O N S E S H E A R S & S H E A R C A P A C I T I E S F O R C O L U M NL I N E @ I N B O I L E R S T R U C T U R E
E - 5 0

8/22/2019 6848574
http://slidepdf.com/reader/full/6848574 390/394
EL 1046
EL 1031
EL 1 0 1 0
EL 9 9 8
CalculatedSeismic
ResponseV(kip§)
210.7
419.5
563.5
UltimateCapacityVj,^(kips)
78.5
85.0
224.1
V/Vcr 1
2.7
4.9
2.5
C o l u m n L i n e ^ )
FIGURE E-16. SEISMIC RESPONSE SHEARS & SHEAR CAPACITIES F O R COLUMNLINE(G)IN BOILER STRUCTURE
E-51

8/22/2019 6848574
http://slidepdf.com/reader/full/6848574 391/394
Calculated
Seismic
Response
V(fcips)
70.3
70.3
70.3
UltimateCapacityV^.^(kips)
1 9 . 7 ( C ) *54.9(T)
31.8(C)57.7(T)
17.8(C)45.6(T)
V/V"'"cr
3.6(C) *1.3(T)
2.2(C)1.2(T)
3.9(C)
i:5(T)
•(C) = Compression(T) = Tension
ST6W18
FIGURE E-17. SEISMIC RESPONSE SHEARS & SHEAR CAPACITIES FOR BOILERDIAPHRAGM BRACING AT EL 998 #
E-52

8/22/2019 6848574
http://slidepdf.com/reader/full/6848574 392/394
6" w a l l ,
#4 @ 12" e.w.
eater Bay
South Elevation
®
perating
Floor
1
•
[-1
el. 62
el.63
1 1
0
I—I
1
b. East Elevation
®
6" w a l l ,
#4 @ 12'
e.w.
Seismic Loads and
Ultimate Capacities
(kips)
el.
3435365158
5948/51
6263171819
V
457430795244246
287338162734989
1201
2205
frame
5358935234
6424188164107305
^wall
404372702192212
223314144653925
ri094
1900
^u
623623967228548
3208708238231706
1222
1706
^wall
Vu
0.65
0.60
0.73
0.84
0.39
0.700.36
0.18
0.79
0.54
0.90
1.11
34
(16;
West Elevation
frame
wall
- Element number of
structural, model
(see Figure 11)
- Total calculated
seismic shear
- Shear carried by
steel frame
- Shear carried by
concrete wall
- Ultimate shear
capacity(ACI Code )
FIGURE E-18. TURBINE BUILDING CONCRETE WALL LOADS AND CAPACITIES
E-53

8/22/2019 6848574
http://slidepdf.com/reader/full/6848574 393/394
^ -^Boi ler
ire-vt ructure-
WestShearWall
C o n c r e t e R o o f O v e rH e a t e r & A u x i l i a r yB a y s
T u r b i n e Bay R o o f
: \
el
el.
n
I Z e l . 3 3
z peratingFloor
'Shear Wall
•Heater Bay Floorr
^
© © ©
"•7.z
T u r b i n e P e d e s t a l
S h e a r W a l l
S e r v i c e B ay R o o f
e l . 4 9
) p e r at i n g F l o o r j j. ,,
E a s tS h e a r
T u r b i n e B g i l d i n g L o o k i n g N o r t h
e l e m e n t
49
38
27
28
S e i s m i c I n d u c e d M o m e n t
P l a s t i c M o m e n t C a p a c i t y
1.9
1.2
1.4
1.8
F I G U R E E - 1 9 . T U R B I N E B U I L D I N G S T E E L F R A ME N O R T H - S O U T H S E I S M I C R E S P O N S E

8/22/2019 6848574
http://slidepdf.com/reader/full/6848574 394/394
REFERENCES
E-1 T. A. Nels on , R. C. M ur ra y, e t a l , "Response of El Cen tro SteamPlant Equ ipment Dur ing the October 15 , 1979, Imper ia l Va l leyEarthquake" , Lawrence Livermore Laboratory, NUREG/CR-1665,UCRL-53005, September, 1980.
E -2 " An a l ys i s o f t he E l Cen t ro S team P la n t " , ( d ra f t r e po r t ) subm i t tedto PG&E by URS/John A. Blum e, May, 1 9 81 .
E-3 R ic h a r t , F. E.> J . R. Ha l l and R. 0. Woods, V ib ra t io ns o f S o i ls andF o u nd a tio n s P r e n t i c e - H a l l , I n c . , E n gle wo od C l i f f s , New J e r s e y , 1 9 7 0.
E -4 Am erican I n s t i t u te o f S tee l Co ns t ru c t i o n , M anual o f S tee l Cons t ruc t i o n , Eighth Edi t ion, 1980.
E-5 Bu ildin g Code Requirements fo r Reinforced Concrete (ACI 31 8-77 ),American Concrete Inst i tute, 1977.
E-6 USNRC Reg ula tory Guide 1 .60 , "D esign Response Spectra fo r Seism icDesign of Nuclear Power Pl a n ts ", Re vision 1 , December, 1973.
E-7 USNRC Regula tory Guide 1 .6 1 , "Damping Values fo r Se ismic Design ofNuclear Power Plant", October, 1973.


