July-December 2020 ISSN 2141-2340 DOI: 10.5897/JABSD www ...

24 January 2019 ISSN 1991-637X DOI: 10.5897/AJARwww.academicjournals.org
OPEN ACCESS
African Journal of
Agricultural Research

About AJAR
The African Journal of Agricultural Research (AJAR) is a double blind peer reviewed journal. AJAR
publishes articles in all areas of agriculture such as arid soil research and rehabilitation, agricultural
genomics, stored products research, tree fruit production, pesticide science, post-harvest biology and
technology, seed science research, irrigation, agricultural engineering, water resources management,
agronomy, animal science, physiology and morphology, aquaculture, crop science, dairy science,
forestry, freshwater science, horticulture, soil science, weed biology, agricultural economics and
agribusiness.
Indexing
Science Citation Index Expanded (ISI), CAB Abstracts, CABI’s Global Health Database
Chemical Abstracts (CAS Source Index), Dimensions Database, Google Scholar Matrix of Information for The Analysis of Journals (MIAR) Microsoft Academic
ResearchGate, The Essential Electronic Agricultural Library (TEEAL)
Open Access Policy
Open Access is a publication model that enables the dissemination of research articles to the global
community without restriction through the internet. All articles published under open access can be
accessed by anyone with internet connection.
The African Journal of Agricultural Research is an Open Access journal. Abstracts and full texts of all
articles published in this journal are freely accessible to everyone immediately after publication
without any form of restriction.
Article License
All articles published by African Journal of Agricultural Research are licensed under the Creative
Commons Attribution 4.0 International License. This permits anyone to copy, redistribute, remix,
transmit and adapt the work provided the original work and source is appropriately cited. Citation
should include the article DOI. The article license is displayed on the abstract page the following
statement:
This article is published under the terms of the Creative Commons Attribution License 4.0 Please
refer to https://creativecommons.org/licenses/by/4.0/legalcode for details about Creative Commons
Attribution License 4.0
Article Copyright
When an article is published by in the African Journal of Agricultural Research the author(s) of the
article retain the copyright of article. Author(s) may republish the article as part of a book or other
materials. When reusing a published article, author(s) should;
Cite the original source of the publication when reusing the article. i.e. cite that the article was
originally published in the African Journal of Agricultural Research. Include the article DOI
Accept that the article remains published by the African Journal of Agricultural Research (except in
occasion of a retraction of the article)
The article is licensed under the Creative Commons Attribution 4.0 International License.
A copyright statement is stated in the abstract page of each article. The following statement is an
example of a copyright statement on an abstract page.
Copyright ©2016 Author(s) retains the copyright of this article..
Self-Archiving Policy
The African Journal of Agricultural Research is a RoMEO green journal. This permits authors to
archive any version of their article they find most suitable, including the published version on their
institutional repository and any other suitable website.
Please see http://www.sherpa.ac.uk/romeo/search.php?issn=1684-5315
Digital Archiving Policy
The African Journal of Agricultural Research is committed to the long-term preservation of its content.
All articles published by the journal are preserved by Portico. In addition, the journal encourages
authors to archive the published version of their articles on their institutional repositories and as well
as other appropriate websites.
https://www.portico.org/publishers/ajournals/
Metadata Harvesting
The African Journal of Agricultural Research encourages metadata harvesting of all its content. The
journal fully supports and implements the OAI version 2.0, which comes in a standard XML
format. See Harvesting Parameter

Memberships and Standards
Academic Journals strongly supports the Open Access initiative. Abstracts and full texts of all articles
published by Academic Journals are freely accessible to everyone immediately after publication.
All articles published by Academic Journals are licensed under the Creative Commons Attribution 4.0
International License (CC BY 4.0). This permits anyone to copy, redistribute, remix, transmit and
adapt the work provided the original work and source is appropriately cited.
Crossref is an association of scholarly publishers that developed Digital Object Identification (DOI)
system for the unique identification published materials. Academic Journals is a member of Crossref
and uses the DOI system. All articles published by Academic Journals are issued DOI.
Similarity Check powered by iThenticate is an initiative started by CrossRef to help its members
actively engage in efforts to prevent scholarly and professional plagiarism. Academic Journals is a
member of Similarity Check.
CrossRef Cited-by Linking (formerly Forward Linking) is a service that allows you to discover how
your publications are being cited and to incorporate that information into your online publication
platform. Academic Journals is a member of CrossRef Cited-by.
Academic Journals is a member of the International Digital Publishing Forum (IDPF). The
IDPF is the global trade and standards organization dedicated to the development and
promotion of electronic publishing and content consumption.

Contact
Editorial Office: [email protected]
Help Desk: [email protected]
Website: http://www.academicjournals.org/journal/AJAR
Submit manuscript online http://ms.academicjournals.org
Academic Journals
73023 Victoria Island, Lagos, Nigeria
ICEA Building, 17th Floor, Kenyatta Avenue, Nairobi, Kenya

Editors
Prof. N. Adetunji Amusa
Department of Plant Science and Applied Zoology
Olabisi Onabanjo University
Nigeria.
Dr. Mesut YALCIN
Forest Industry Engineering, Duzce
University,
Turkey.
Dr. Vesna Dragicevic
Maize Research Institute
Department for Maize Cropping
Belgrade, Serbia.
Dr. Ibrahim Seker
Department of Zootecny,
Firat university faculty of veterinary medicine,
Türkiye.
Dr. Abhishek Raj
Forestry, Indira Gandhi Krishi Vishwavidyalaya,
Raipur (Chhattisgarh) India.
Dr. Ajit Waman
Division of Horticulture and Forestry, ICAR-
Central Island Agricultural
Research Institute, Port Blair, India.
Dr. Zijian Li
Civil Engineering, Case Western Reserve
University,
USA.
Dr. Mohammad Reza Naghavi
Plant Breeding (Biometrical Genetics) at
PAYAM NOOR University,
Iran.
Dr. Tugay Ayasan
Çukurova Agricultural Research Institute
Adana,
Turkey.

Editorial Board Members
Prof. Hamid Ait-Amar
University of Science and Technology
Algiers,
Algeria.
Prof. Mahmoud Maghraby Iraqi Amer
Animal Production Department
College of Agriculture
Benha University
Egypt.
Dr. Sunil Pareek
Department of Horticulture
Rajasthan College of Agriculture
Maharana Pratap University of Agriculture & Technology
Udaipur,
India.
Prof. Irvin Mpofu
University of Namibia
Faculty of Agriculture
Animal Science Department
Windhoek,
Namibia.
Prof. Osman Tiryaki
Çanakkale Onsekiz Mart University,
Plant Protection Department,
Faculty of Agriculture, Terzioglu Campus,17020, Çanakkale,
Turkey.
Dr. Celin Acharya
Dr. K.S. Krishnan Research Associate (KSKRA)
Molecular Biology Division
Bhabha Atomic Research Centre (BARC)
Trombay,
India.
Prof. Panagiota Florou-Paneri
Laboratory of Nutrition
Aristotle University of Thessaloniki
Greece.
Dr. Daizy R. Batish
Department of Botany
Panjab University
Chandigarh,
India.
Prof. Dr. Abdul Majeed
Department of Botany
University of Gujrat
Pakistan.
Dr. Seyed Mohammad Ali Razavi
University of Ferdowsi
Department of Food Science and Technology
Mashhad,
Iran.

Prof. Suleyman Taban
Department of Soil Science and Plant Nutrition
Faculty of Agriculture
Ankara University
Ankara, Turkey.
Dr. Abhishek Raj
Forestry, Indira Gandhi Krishi Vishwavidyalaya,
Raipur (Chhattisgarh) India.
Dr. Zijian Li
Civil Engineering,
Case Western Reserve University,
USA.
Prof. Ricardo Rodrigues Magalhães
Engineering,
University of Lavras,
Brazil
Dr. Venkata Ramana Rao Puram,
Genetics And Plant Breeding,
Regional Agricultural Research Station, Maruteru, West Godavari District,
Andhra Pradesh,
India.

Table of Content Management of the nematode of the nodule of Meloidogyne incognita in tomato (Solanum lycopersicum L.) with extracts in a biospace condition Aquino Bolaños T.*, Matadamas-Ortiz P. T., López Vásquez C. F. and Inés Vásquez S.
180
Mango (Mangifera indica L.) production practices and constraints in major production regions of Ethiopia Tewodros B. Neguse, Fredah K. R. Wanzala, Wassu M. Ali, Willis O. Owino and Githiri S. Mwangi
185
Growth and yield performance of selected upland and lowland rainfed rice varieties grown in farmers’ and researchers’ managed fields at Ifakara, Tanzania KITILU M. J. F., NYOMORA A. M. S. and CHARLES J.
197
Food Barley Land races Characterization in the Northwestern Highlands of Ethiopia Daniel Tadesse, Wuletaw Mekuria, Beyene Derso and Tazebachew Asres
209
Organic amendments applied to a degraded soil: Short term effects on soil quality indicators UNAGWU B. O.
218

Vol. 14(4), pp. 180-184, 24 January, 2019
DOI: 10.5897/AJAR2018.13602
Article Number: 4DD90B559985
ISSN: 1991-637X
Copyright ©2019
Author(s) retain the copyright of this article
http://www.academicjournals.org/AJAR
African Journal of Agricultural
Research
Full Length Research Paper
Management of the nematode of the nodule of Meloidogyne incognita in tomato (Solanum
lycopersicum L.) with extracts in a biospace condition
Aquino Bolaños T.*, Matadamas-Ortiz P. T., López Vásquez C. F. and Inés Vásquez S.
Instituto Politécnico Nacional, Centro Interdisciplinario de Investigación para el Desarrollo Integral Regional Unidad Oaxaca (CIIDIR Unidad Oaxaca, IPN). Calle Hornos 1003, Santa Cruz Xoxocotlan, C. P. 71230, Oaxaca, Mexico.
Received 4 October, 2018; Accepted 5 December, 2018
For the management of the nematode of Meloidogyne incognita nodule in plants of Solanum lycopersicum L., the effectiveness of plant extracts: Ruta graveolens, Eucalyptus spp., Ocimum basilicum, Acacia farnesiana, and Nicotiana tabacum, and as a control fungus Paecilomyces lilacinus 6.5x10
13 UFC/g were used. For each treatment, 5000 nematodes J2 of M. incognita/plant were used. The
extracts were applied per intervals of 10 days in three occasions. The assessed variables were: plant height, performance at eight cuts and efficiency of the extracts at 20 weeks after the transplant. The results show there were no significant differences among treatments for the plant height. Regarding the performance with A. farnesiana, it obtained the highest performance (18.46 kg m
-2), followed by P.
lilacinus (6.5x10¹³
UFC/g) with 16.46 kg m-2
. Both treatments are statistically different from the treatments, control (12.91 kg m
-2), R. graveolens and O. basilicum (13.03 and 13.8 kg m
-2), respectively.
Regarding the effectiveness for the reduction of the nematode in soil, A. farnesiana reduced it by 57% and P. lilacinum fungus by 50.5%. So, the use of vegetable extracts for the management of nematodes populations of the Meloidogyne gender is an alternative way because they act as repellents and cause the death of nematodes. Key words: Oils, nematodes, nodules, tomato, extracts, management, tomato, effectiveness.
INTRODUCTION S. lycopersicum L. tomato is considered the most important vegetable worldwide. Mexico takes the 12
th
place as a tomato producer, and the 2nd
as an exporter. It is the most important product according to the Mexican farming exports (1.43 million ton). The average worldwide consumption per capita has an increasing tendency from 15.4 kg in 2001 to 20.2 kg in 2011. In Mexico, the
tendency of the crop in the protected agriculture system SAGARPA (2016) has increased since 2005, by using different levels of crop technologies. In the state of Oaxaca, there is a register of 757.82 ha cultivated with this vegetable. However, 90% of the surface is grown in greenhouse soils of medium and low technology (Martínez-Gutiérrez et al., 2014).
*Corresponding author. E-mail: [email protected].
Author(s) agree that this article remain permanently open access under the terms of the Creative Commons Attribution
License 4.0 International License

It has caused several problems both as such in the management of the crop, and in the phytosanitary aspect. Concerning the phytosanitary problems in the tomato crop there are the nematodes, which are rounded microscopic worms present in the root-knots. They form nodules that affect the growing of the plant and cause economic losses of 40-100% in the performance (Quiroga et al., 2007). Nacobus aberrans is the principal nematode species that causes damages to the tomato crops from Mexico, and also to other crops like chilli, beans, spinaches, baby squashes, amaranth (Cristóbal et al., 2001). The species of Meloidogyne incognita, M. javanica and M. arenaria, common in the protected crop system (Arias et al., 2009), are even more important, and are present in several crop zones in Mexico and in the state of Oaxaca (Cid del Prado et al., 2001).
There have been several evaluated control methods for the phytopathogenic nematodes with the use of microorganisms, with good effects of the growing of the tomato plant (Khalil et al., 2012), the same as the use of plant extracts with nematicide effects such as Azadirachta indica, Tagetes spp., Brassica napus, Chrysanthemun spp, Calendula spp, Ricinus, Raphanus (Collange et al., 2011), to which there were extracted their metabolites with diverse techniques. Some lilaceae such as Allium cepa and Allium sativum which contain sulphur were also used. It is hydrolyzed to form a variety of isocyanates with pesticide effects, fungicides, antibiotics, nematicides and toxic effects (Bekhiet et al., 2010), and others such as Eucalyptus citriodora Hook (Choi et al., 2007; El-Rokiek and El-Nagdi, 2011).
Chemical pesticides are expensive and not effective, besides having harmful effects for human health, water, soil, and crop products (Brand et al., 2010). Natural products have been considered an alternative solution to environmental problems caused by chemical pesticides and many researchers have tried to identify the most effective natural products to integrate them as control strategies instead of using the traditional solutions (Kim et al., 2005).
The objective of this research was to evaluate wild plants from the study site, such as aqueous extracts of Ruta graveolens, Eucalyptus spp., Ocimum basilicum, A. fercian and Nicotiana tabacum, to determine the nematicidal effect against M. incognita in the culture of S. lycopersicum under greenhouse conditions in a biospace. MATERIALS AND METHODS
Study place
The research was conducted under greenhouse conditions by using a biospace of 300 m2 surface in the experimental field of the Centro Interdisciplinario de Investigación para el Desarrollo Integral Regional Unidad Oaxaca of the Instituto Politécnico Nacional from Mexico (CIIDIR Unidad Oaxaca IPN). Is geographical coordinates are 17°02’ north latitude and 96°44’ west longitude, with an altitude of 1,550 m above sea level.
Bolaños et al. 181 Collection of plants and preparation of the plant extracts The endemic plants of Ruda (R. graveolens), Eucalipto (Eucalyptus spp)., Albahaca (O. basilicum), Acacia (A. farnesiana), and Tabaco de Virginia (N. tabacum) were collected in the Central Valleys of Oaxaca, Mexico. The plants were dried in the shade per 10 days. Right away, 200 g of leaves from each plant were individually weighed, and 100 mL of distilled water was included and were blended per 30 s, except A. farnesiana where the pre-washed roots were used to remove any dust particles and were manually smashed in a mortar. The mixture of each preparation was put aside for 24 h. After this time, the mixture was filtered by using a multipore filter paper of 0.2 µm, and the concentrate was set in a 1000 mL beaker for its application. The extracts were prepared like the spore suspension of the entomopathogenic fungus P. lilacinus. The plants used in the experiments were deposited and identified in the herbarium of the CIIDIR Unidad Oaxaca IPN. Extraction of the nematodes from infected plants The extraction of the nematode’s eggs and juvenile J2 stage of M. incognita of the infected roots was done through the macerate-filtration method (Hooper et al., 2005), by dividing 25 g of roots in pieces of 2-3 cm, which were blended mechanically with 100 mL of distilled water per 30 s. The plant blended material was filtered through a series of sieves of 35, 100, 200 and 400 µm diameter. The particles which retained the sieves of 60 and 100 µm were disposed. The precipitate of the retained eggs in the sieves of 200 and 400 µm was transferred to a beaker by using a pipette. The extracted eggs were hatched in Petri dishes per 9-10 days for the emergence of juvenile J2 stage (Whitehead and Hemming, 1965). Both the eggs and juveniles just hatched eggs were used for the field tests and their application in every treatment. Experimental design and treatments
The experiment was established with seven treatments: T1: Control treatment (only nematodes); T2: Control treatment P. lilacinus fungus at 6.5x10¹³ UFC/g, and the extracts T3: R. graveolens; T4: Eucalyptus spp., T5: O. basilicum L.; T6: A. farnesiana, and T7: N. tabacum at the same doses of 35 mL per plant to each one. There were four repetitions per treatment, under a design per blocks completely aleatorized. There was used a variety of Reserve tomato of undetermined cycle at a planting density of 2 plants·m-2, distance among lines and plants of 1.25 m × 0.4 m, guided by a one single stem, and with a common management.
For each treatment, there were applied the amount of 5000 nematode eggs after 15 days of the transplant (ADT) to a depth of 10-15 cm right in the base of each plant. The fungus and the plant extracts were applied with an automated pipette of 1000 mL of capacity in three holes around the stem base of each plant at intervals of 10 days with a total of three applications from the 30 ADT.
The assessed variables were: The plant height, what was performed a destructive test after 20 weeks after the transplant (STD); the performance of the crop kg·m-2 considering 8 cuts and an effectiveness percentage of the treatments after 20 (SDT). The effectiveness of the applied treatments (EAT) with plant extracts was calculated as the percentage of reduction of the nematodes in 250 g soil according to the Henderson and Tilton Puntener’s formula (Puntener, 1981), as follows:
𝐸𝐴𝑇 = 𝐽2 𝑃𝑇𝐴 (𝐽2 𝑃𝐶𝐵)
𝐽2 𝑃𝑇𝐵 (𝐽2 𝑃𝐶𝐴)∗ 100
182 Afr. J. Agric. Res.
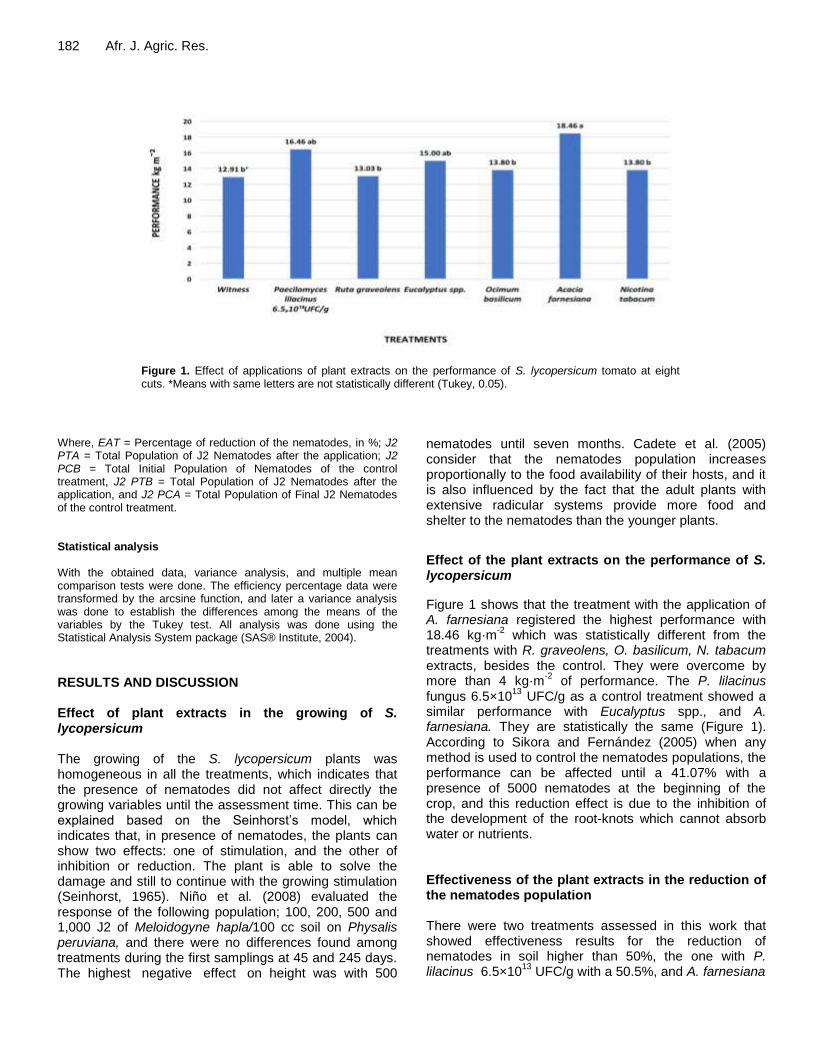
Figure 1. Effect of applications of plant extracts on the performance of S. lycopersicum tomato at eight cuts. *Means with same letters are not statistically different (Tukey, 0.05).
Where, EAT = Percentage of reduction of the nematodes, in %; J2 PTA = Total Population of J2 Nematodes after the application; J2 PCB = Total Initial Population of Nematodes of the control treatment, J2 PTB = Total Population of J2 Nematodes after the application, and J2 PCA = Total Population of Final J2 Nematodes of the control treatment. Statistical analysis With the obtained data, variance analysis, and multiple mean comparison tests were done. The efficiency percentage data were transformed by the arcsine function, and later a variance analysis was done to establish the differences among the means of the variables by the Tukey test. All analysis was done using the Statistical Analysis System package (SAS® Institute, 2004). RESULTS AND DISCUSSION Effect of plant extracts in the growing of S. lycopersicum The growing of the S. lycopersicum plants was homogeneous in all the treatments, which indicates that the presence of nematodes did not affect directly the growing variables until the assessment time. This can be explained based on the Seinhorst’s model, which indicates that, in presence of nematodes, the plants can show two effects: one of stimulation, and the other of inhibition or reduction. The plant is able to solve the damage and still to continue with the growing stimulation (Seinhorst, 1965). Niño et al. (2008) evaluated the response of the following population; 100, 200, 500 and 1,000 J2 of Meloidogyne hapla/100 cc soil on Physalis peruviana, and there were no differences found among treatments during the first samplings at 45 and 245 days. The highest negative effect on height was with 500
nematodes until seven months. Cadete et al. (2005) consider that the nematodes population increases proportionally to the food availability of their hosts, and it is also influenced by the fact that the adult plants with extensive radicular systems provide more food and shelter to the nematodes than the younger plants.
Effect of the plant extracts on the performance of S. lycopersicum
Figure 1 shows that the treatment with the application of A. farnesiana registered the highest performance with 18.46 kg·m
-2 which was statistically different from the
treatments with R. graveolens, O. basilicum, N. tabacum extracts, besides the control. They were overcome by more than 4 kg·m
-2 of performance. The P. lilacinus
fungus 6.5×10¹³
UFC/g as a control treatment showed a similar performance with Eucalyptus spp., and A. farnesiana. They are statistically the same (Figure 1). According to Sikora and Fernández (2005) when any method is used to control the nematodes populations, the performance can be affected until a 41.07% with a presence of 5000 nematodes at the beginning of the crop, and this reduction effect is due to the inhibition of the development of the root-knots which cannot absorb water or nutrients. Effectiveness of the plant extracts in the reduction of the nematodes population There were two treatments assessed in this work that showed effectiveness results for the reduction of nematodes in soil higher than 50%, the one with P. lilacinus 6.5×10
13 UFC/g with a 50.5%, and A. farnesiana

Bolaños et al. 183
Figure 2. Effectiveness of plant extracts for the reduction of on-soil nematodes populations.
with a 57.0%. This unique one was statistically different from all the treatments. The results of the other assessed treatments had between 40.3-49.5% of effectiveness (Figure 2). It must be mentioned and highlighted that, in the control treatment, the quantity of nematodes increased by 43.28% in the final population of M. incognita. The assessment on this study of the treatment with N. tabacum presented 49.5% of effectiveness in similar studies with plants having nematicide effects. This is same with the ones done by Wiratno et al. (2009) when they assessed the nematicide activity of extracts from 17 plant species. The results with N. tabacum in lab tests obtained a mortality of 94% when testing the extracts from leaves in doses of 5 mg·mL
-1 over a population of
150 J2 of M. incognita exposed for 24 h. Besides, there was registered a mean lethal concentration (LC50) with 3.9 mg·mL
-1. The toxic activity of N. tabacum was
reported by Nguyen et al. (2000), who mentioned that it has effects on the inhibition of the acetylcholinesterase just as it is the action of organophosphate and carbamate type of pesticides. Although our results showed that the extract of A. farnesiana was the best one compared to the others, it is not recommendable to apply it due to its high toxic activity that affects humans and mammals. Kamal et al. (2009) emphasized the nematicide activity of Eucalyptus camaldulensis against young stages of M. incognita under assessed in greenhouse conditions.
Hasabo and Noweer (2005) assessed O. basilicum for the control of M. incognita in Solanum melongena eggplant with a mortality percentage of 61% under laboratory conditions assessed at 24 h and of 46.1% in field conditions at 4 months, both to a concentration of 5%. Also, Elbadri et al. (2008) assessed 27 extracts from different plant species to determine their efficiency against juveniles of M. incognita in laboratory. As a conclusion, they said that all of them showed a level of toxicity over the nematodes, and specifically with Acacia
nilotica (the pods extract) there was a percentage of mortality of 94.7%, and for O. basilicum 66.5% with the extract of leaves, and 55.5% with the seeds extract assesses after 72 h, both treatments in doses of 500 ppm.
According to the obtained results, the use of the extracts can be useful for the management of the Meloidogyne nematodes populations, because they act as growing regulators, in the feeding, repellent inhibitors, distractors, attractors, or to kill them in the S. lycopersicum crops. The nematicide effect of the plant extracts could be attributed to its content of certain oxygenated compounds that are characterized by its lipophilic properties, which are capable to dissolve the cytoplasmic membrane from the nematodes cells (Knoblock et al., 1989).
The P. lilacinus fungus 6.5×10¹³
UFC/g showed a little higher effectiveness than the extracts (50.0%). The effectiveness of biological organisms, as the one used in this work has been documented on several research, such as Wen-Kun et al. (2016). When evaluating P. lilacinus in a mixture with Syncephalastrum rasemosum, it was found a 70% of ovicidal activity over M. incognita, and as a result, the reduction of gills in the roots in cucumber crops, and in tomato crops (Anastasiadis et al., 2008). So this is one of the most effective organisms in its parasitic action over the M. incognita eggs in the tomato crop. Oka (2010) suggests its application in more than one occasion during the crop cycle to keep the nematode population under control and to obtain a better effectiveness (Kiewnick and Sikora, 2006; Udo, et al., 2014). Conclusion The use of extract of A. farnesiana in at least three times

184 Afr. J. Agric. Res. during the early developing of the crop can improve the performance of tomato. With the application of the fungus P. lilacinus at concentration of 6.5×10
13 UFC/g, it is
possible to obtain good results regarding positive performance and controlling of nematodes on soil nodules. CONFLICT OF INTERESTS The authors have not declared any conflict of interests. REFERENCES Anastasiadis IA, Giannakou IO, Prophetou-Athanasiadou, DA (2008).
The Combined Effect of The Application of a Biocontrol Agent Paecilomyces lilacinus, with Various Practices for The Control of Root-knot Nematodes. Crop Protection 27:352-361.
http://dx.doi:10.1590/S0103- 84782009000500039. Arias Y, González I, Rodríguez M, Rosales C, Suárez Z, Peteira B
(2009). Aspectos generales de la interacción tomate (Solanum lycopersicon L.) Meloidogyne incognita. Revista de Protección Vegetal 24:1-13.
Bekhiet MA, Kella A, El-Ghindi AY, Hammad Eman A (2010). Effect of Certain Inorganic Acids and Garlic Cloves Oil for Controlling The Root-knot Nematode Meloidogyne javanica Infecting Banana Plant. Egyptian Journal of Agronematology 9(2):202-214.
Brand D, Soccol CR, Sabu A, Roussos S (2010). Production of Fungal Biological Control Agents through Solid State Fermentation: A Case Study on Paecilomyces lilacinus against Root-knot Nematodes. Micología Aplicada Internacional 22:31-48.
Cadet P, Masse D, Thioulouse J (2005). Relationships between Plant-parasitic Nematode Community, Fallow Duration and Soil Factors in the Sudano-Sahelian Area of Senegal. Agriculture, Ecosystems and Environment 108:302-317.
Choi IH, Shin SC, Park IK (2007). Nematicidal Activity of Onion (Allium cepa) Oil and Its Components against The Pine Wood Nematode (Bursaphelencus xylophilus). Nematology 9:231-235.
Cid Del Prado VI, Tovar-Soto AY, Hernández JA (2001). Distribución de especies y razas de Meloidogyne en México. Revista Mexicana de Fitopatología 19:32-39.
Collange B, Navarrete M, Peyre G, Mateille T, Tchamitchian M (2001). Root-knot Nematode (Meloidogyne) Management in Vegetable Crop Production: The Challenge of an Agronomic System Analysis. Crop Protection 30:1251-1262.
Cristóbal AJ, Cid del Prado VI, Sánchez GP, Marbán-Mendoza N, Manzanilla LRH, Mora-Aguilera G (2001). Alteraciones nutrimentales en tomate (Lycopersicon esculentum Mill.) por efecto de Nacobbus aberrans. Nematrópica 31:221-228.
Elbadri GAA, Lee DW, Park JC, Yu HB, Choo HY (2008). Evaluation of Various Plant Extracts for their Nematicidal Efficacies against Juveniles of Meloidogyne incognita. Journal of Asia-Pacific Entomology 11:99-102.
El-Rokiek K, El-Nagdi WM (2011). Dual Effects of Leaf Extracts of Eucalyptus citriodora on Controlling Purslane and Root-knot Nematode in Sunflower. Journal of Plant Protection Research 51:121-129.
Hasabo SA, Noweer EMA (2005). Management of Root-Knot Nematode Meloidogyne Incognita on Eggplant with Some Plant Extracts. Egyptian Journal of phytopathology 33(2):65-72.
Hooper DJ, Hallmann J, Subbotin SA (2005). Methods for extraction, processing and detection of plant and soil nematodes. Plant parasitic nematodes in subtropical and tropical agriculture 2:53-86.
Kamal AM, Abo-Elyousr AM, Award ME, Abdel-Gaid MA (2009). Management of Root-knot Nematode Meloidogyne incognita by Plant Extracts and Essential Oils. Journal of Plant Pathology 25:189-192
Khalil MS, Kenawy AA, Mohammed EE (2012). Impact of Microbial
Agents on Meloidogyne incognita Management and Morphogenesis of Tomato. Journal of Biopesticides 5:28-35.
Kiewnick S, Sikora RA (2006) Biological Control of the Root-knot Nematode Meloidogyne incognita by Paecilomyces lilacinus Strain 251. Biological Control 38:79-187. http://dx.doi: 10.1016/j.biocontrol.2005.12.006.
Kim D I, Park JD, Kim SG, Kuk H, Jang MJ, Kim S S (2005). Screening of Some Crude Plant Extracts for Their Acaricidal and Insecticidal Efficacies. Journal of Asia-Pacific Entomology 8:93-100.
Knoblock K, Weis N, Wergant R (1989). Mechanism of Antimicrobial Activity of Essential Oils. 37
th Ann. Cong. Med. Plant Res.
Braunschweig pp. 5-9. Martínez-Gutiérrez GA, Díaz-Pichardo GR, Juárez-Luis YD, Ortíz-
Hernández JY, López-Cruz. (2014). Caracterización de las unidades de producción de tomate en invernaderos de Oaxaca. (Characterization of Greenhouse Tomato Production Units in Oaxaca). Agricultura, Sociedad y Desarrollo 11:153-165.
Nguyen VT, Hall LL, Gallacher G, Ndoye A, Jolkovsky DL, Webber RJ, Buchli R, Grando SA (2000). Choline Acetyltrans-ferase, Acetylcholinesterase, and Nicotinic Acetylcholine Receptors of Human Gingival and Esophageal Epithelia. Journal of Dental Research 79:939-949.
Niño NE, Arbeláez G, Navarro R (2008). Efecto de diferentes densidades poblacionales de Meloidogyne hapla sobre uchuva (Physalis peruviana L.) en invernadero. Agronomía Colombiana. 26(1):58-67.
Oka Y (2010). Mechanisms of Nematode Suppression by Organic Soil Amendments-A Review. Applied Soil Ecology 44:101-115.
Puntener W (1981). Manual for Field Trials in Plant Protection. Agricultural Division, Ciba Geigy Limited, Basle, Switzerland 205 p.
Quiroga-Madrigal R, Rosales-Esquinca M, Rincón-Espinosa P, Hernández-Gómez YE (2007). Enfermedades causadas por hongos y nematodos en el cultivo de tomate Lycopersicon esculentum Mill.) en el Municipio de Villaflores, Chiapas, México. Revista Mexicana de Fitopatología 25:114-119.
SAGARPA Secretaría de Agricultura, Ganadería, Desarrollo Rural, Pesca y Alimentación (2016). Servicio de información agroalimentaria y pesquera http://infosiap.siap.gob.mx/aagricola_siap_gb/icultivo/index.jsp (Consulta, febrero 2018).
SAS® Institute. (2004). SAS/STAT 9.1 User's Guide. SAS Institute Inc., Cary, N.C.
Seinhorst JW (1965). The Relation between Nematode Densities and Damage to Plants. Nematologica 11:137-154.
Sikora RA, Fernández EE (2005). Nematodes Parasites of Vegetables. In: Luc, M., Sikora, R.A., Bridge, J. (Eds.), Plant Parasitic Nematodes in Subtropical and Tropical Agriculture. CAB International, Wallingford (GBR) 5:319-392.
Udo IA, Onoku EO, Agioliw D (2014). Management of Root-knot Disease on Tomato with Bioformulated Paecilomyces lilacinus and Leaf Extract of Lantana camara. Brazilian Archives of Biology and Technology 57:486-492.
Wen-Kun H, Cui JK, Liu SM, Kong LA, Wu QS, Peng H, Peng DL (2016). Testing Various Biocontrol Agents against the Root-knot Nematode (Meloidogyne incognita) in Cucumber Plants Identifies. A Combination of Syncephalastrum racemosum and Paecilomyces lilacinus as Being Most Effective. Biological Control 92:31-37.
Whitehead AG, Hemming JR (1965). A Comparison of Some Quantitative Methods of Extracting Small Vermiform Nematodes from Soil. Annals of Applied Biology 55:25-38.
Wiratno Taniwiryiono D, Van den Berg H, Riksen JAG, Rietjens IMCM, Djiwanti SR, Kammenga JE, Murk AJ (2009). Nematicidal Activity of Plant Extracts against the Root-Knot Nematode. The Open Natural Products Journal 2:77-85.

Vol. 14(4), pp. 185-196, 24 January, 2019
DOI: 10.5897/AJAR2018.13608
Article Number: E6FBB0859987
ISSN: 1991-637X
Copyright ©2019
Author(s) retain the copyright of this article
http://www.academicjournals.org/AJAR
African Journal of Agricultural
Research
Full Length Research Paper
Mango (Mangifera indica L.) production practices and constraints in major production regions of Ethiopia
Tewodros B. Neguse1*, Fredah K. R. Wanzala2, Wassu M. Ali1, Willis O. Owino3 and Githiri S. Mwangi2
1School of Plant Sciences, Haramaya University, Haramaya, Ethiopia.
2Department of Horticulture, Jomo Kenyatta University of Agriculture and Technology, Nairobi, Kenya.
3Department of Food Science and Technology, Jomo Kenyatta University of Agriculture and Technology, Nairobi,
Kenya.
Received 5 October, 2018; Accepted 5 December, 2018
Mango (Mangifera indica L.) is the second among fruit crops in Ethiopia in its production coverage and economical importance. However, compared to the countries’ potential, it is at the infant stage. This study was conducted to identify the main mango cultivars, production practices and constraints in east and western Ethiopia in 2016. Study areas were selected purposively based on their extensive mango production. Thirty-one cultivars of unknown origin were identified based on farmers’ characterization criteria. The majority of the farmers were found not to apply fertilizers (63.7%), supplementary irrigation (87.6%), nor prune their mangos (50%). About 50% of growers revealed fruit yield of 100-200 kg/tree and harvest fully ripe. Packaging and transportation of mangos were entirely below the standard. Availability of agricultural inputs such as fertilizers and pesticides, pest, knowledge and skill gap, and availability of improved varieties were the major constraints. Assessment of similarities in terms of farming system, mango production practices, harvest, post-harvest handling, marketing, and their constraints indicated that 76.9% of growers were similar. Therefore, improvement of the pre and post-production practices, utilization and/or conservation of the identified cultivars, and addressing the constraints will be crucial to improving the mango sector in Ethiopia. Key words: Interview, mango cultivars, tropical fruit, biodiversity.
INTRODUCTION Mango (Mangifera indica L.) is one of the 73 genera of the family Anacardiaceae and order Sapindales (Ahmed and Mohamed, 2015) which is one of the most versatile and widely grown fruit crops of tropical and subtropical regions (Vasugi et al., 2012). It is believed to have
originated from South East Asia and more than 1000 varieties have been identified all over the world (Rymbai et al., 2014). Mango is cultivated approximately on 3.7 million hectares worldwide, occupied the 2nd position among the tropical fruit crops (Jahurul et al., 2015) and
*Corresponding author. E-mail: [email protected]
Author(s) agree that this article remain permanently open access under the terms of the Creative Commons Attribution
License 4.0 International License

186 Afr. J. Agric. Res.
Figure 1. Geographic locations of surveyed districts in the east and western Ethiopia.
5th from fruit crops of the world after citrus, banana, grape, and apple (Shi et al., 2015). Asian countries share the largest (77%) of global production, followed by Americans (13%) and African countries (10%) (Rekhapriyadharshini, 2015). Mango is known as the king of the fruits due to its excellent flavor, delicious taste and high nutritive values (Ullah et al., 2010) that makes the crop valued for both food and nutritional security especially for developing countries like Ethiopia where the realization of food and nutritional security is still a challenge.
Mango is one of the most widely grown among the fruit crops cultivated in Ethiopia preceded only by banana in terms of economic importance (Fita, 2014). A total of 69,743.39 tons of mango is produced from 12,799 ha of land (CSA, 2015). Moreover, within the past 10 years (2003 to 2013), both area coverage and production of mango increased by 208.4 and 247%, respectively (Dessalegn et al., 2014). It is grown in several parts of the country where the western and eastern Ethiopia are among the major producing belt that accounts >50% of the total mango production in Ethiopia (CSA, 2015).
Despite the crop potential to contribute to improved nutritional status and health of the Ethiopian society, the national average production yield is about 7 ton/ha and, in some region like Amhara, it is estimated to be 3.5 ton/ha (Dessalegn et al., 2014). Though the productivity of the crop is governed by various factors like genetic and/or enviromental variables, the productivity in the country is very low compared to the crop potential, about 20-30 ton/ha (Griesbach, 2003; Tiwari and Baghel, 2014). The recently introduced export-oriented horticulture policy of the government is in the process of replacing farmers’
indigenous cultivars with the introduction of improved commercial mango varieties. There are few studies which have reported on the practices and constraints of mango production in Ethiopia in the past (Dessalegn et al., 2014; Fita, 2014; Hussein and Yimer, 2013). However, none of them identified the farmers’ mango cultivars and the depth of generated information with regard to pre and post production practices and marketing especially in the east and western Ethiopia was not sufficient to alleviate the challenges.
In order to come up with conservation strategies for a crop species at a country level, there is need of good knowledge of the existing diversity within the crop and traditional production system to understand the factors that affect this diversity (Bisht et al., 2007). Other than just for conservation, the locally adapted cultivars usually produce stable yields. Nonetheless, their production is generally lower at optimal conditions than ‘‘improved’’ cultivars (Yong’an et al., 2010; Xiahong et al., 2011), suitable for low input requirements, and have low susceptibility to pests and high drought tolerance (Shi et al., 2015) . This study was conducted with the objective of assessing the existing cultivars, production practices and constraints of mango in major production regions of Ethiopia. MATERIALS AND METHODS Study areas The study was conducted in four mango producing districts selected from two geographic regions, viz; Eastern and Western Ethiopia (Figure 1 and Table 1).

Neguse et al. 187
Table 1. Details of selected villages and districts.
S/N Village Code Region District GPS Coordinate
Altitude (m.a.s.l)
1. Abdibuch Maru BA1 Eastern Hararghe Zone, Oromia Regional State
Babile 09°17’59’’N
042° 17’26’’E
1778
2. Shekhussien Hajisuffe
BA2 Eastern Hararghe Zone, Oromia Regional State
Babile 09°09’59’’N
042°21’11’’E 1571
3. Sheckhussien-Walqebela
BA3 Eastern Hararghe Zone, Oromia Regional State
Babile 09°10’57’’N
042o21’33’’E
1601
4. Goromeskida ER1 Harari People's National Regional State, eastern Ethiopia
Erer-Woldia
09°20’39’’N
042°12’37’’E 1412
5. Konya ER2 Harari People's National Regional State, eastern Ethiopia
Erer-Woldia
09°21’34’’N
042°12’50’’E 1457
6. Ganda Bekere ER3 Harari People's National Regional State, eastern Ethiopia
Erer-Woldia
09°20’55’’N
042°12’57’’E 1403
7. Melka Hida ER4 Harari People's National Regional State, eastern Ethiopia
Erer-Woldia
09°21’22’’N
042°13’16’’E 1446
8. Nole HA1 Harari People's National Regional State, eastern Ethiopia
Sofi 09
o16’20’’N
042°10’44’’E 1589
9. Agemboy HA2 Harari People's National Regional State, eastern Ethiopia
Sofi 09°17’04’’N
042°10’15’’E 1679
10. Kalu HA3 Harari People's National Regional State, eastern Ethiopia
Sofi 09°15’45’’N
042°11’20’’E 1491
11. Bereser HA4 Harari People's National Regional State, eastern Ethiopia
Sofi 09°15’45’’N
042°10’24’’E 1594
12. Ura AS1 Benishangul Gumuz Regional State, western Ethiopia
Asosa 10°08’17.4’’N
034°39’29.8’’E 1485
13. Amba10 AS2 Benishangul Gumuz Regional State, western Ethiopia
Asosa 10°08’05’’N
034°39’17’’E 1488
Sampling and data collection Multi-stage purposive sampling technique was employed in the selection of the study sites based on their representativeness of mango production, geographical locations, experiences, and future prospects in consultation with the Regional/Zone agricultural offices. Accordingly, four districts that encompassed 13 villages were purposively selected (Table 1). A total of 113 mango grower households that represented 15% of the identified potential mango growers of each district, were randomly selected. A semi-structured questionnaire was prepared, pre-tested with trained enumerators and remedial action was made accordingly. Data were collected through individual farmer’s interviews using the questionnaire and field observation. It included socio-economics, existing farmers’ cultivars, pre, and post-production practices and overall production constraints.
Data analysis The collected data were summarized and analyzed using Statistical Package for Social Scientists (SPSS) Statistics for Windows, Version 20.0 (IBM, 2011). Chi-square test was computed to find if there was differences in production practices and constraints among the districts where the growers were located. The overall dissimilarity/similarity of growers regarding production practices and constraints were analyzed following the widely used Unweighted
Pair-Group Method with Arithmetic Mean (UPGMA) cluster analysis method (Sneath and Sokal, 1973)after the data were standardized using z-score transformation method (Ramette, 2007).
RESULTS AND DISCUSSION
Socio-economics of respondents and farming system
A significant number of respondents’ had an age range of 30-40 years but a total of 58.4% of respondents had >41 years of age. The majority of the respondents did not attend formal education and partly attended up to primary school (Table 2). Aged and illiterate farmers could be among the barriers to adopt improved technologies (Berg, 2013). Positive correlation between education and technology adoption was also noted by Ogada et al. (2014). Similar results were reported in other parts of Ethiopia like east and west Wolega zones of Oromia Regional State (Fita, 2014) and Amhara National Regional State (Dessalegn et al., 2014).
More than half of respondents owned less than 15 mango trees per household and 61.9% of the respondents had more than 15 up to 30 years mango

188 Afr. J. Agric. Res.
Table 2. Demographic characteristics of sampled respondents.
Variable
Districts
Total χ2a Eastern Ethiopia Western Ethiopia
Erer Sofi Babile Assosa
Age :
30-40 11.0 12.0 22.0 2.0 47(41.6%) 40.0***
41-50 8.0 8.0 10.0 7.0 33(29.2%)
>50 4.0 3.0 4.0 22.0 33(29.2%)
Mean 43.7 41.4 40.1 55.8 45.3
Education level:
No school 16.0 14.0 18.0 9.0 57(50.4%) 17.9***
Primary school 5.0 8.0 18.0 22.0 53(46.9%)
Secondary school 2.0 1.0 0.0 0.0 3(2.7%)
Table 3. Number of mango trees and cultivation experience of respondents.
Variable
Districts
Total χ2a Eastern Ethiopia Western Ethiopia
Erer Sofi Babile Assosa
Mango trees per farm:
<15 10 9 23 16 58(51.3%) 15.4**
15-30 10 8 13 6 37(32.7%)
>30 3 6 0 9 18(15.9%)
Mean 20.0 23.1 13.2 32.1 22.1
Farming experience in years:
<15 3 3 2 0 8(7.1%) 10.1ns
15-30 14 14 26 16 70(61.9%)
>30 3 6 0 9 18(15.9%)
Mean 27.5 27.5 25.2 34.2 28.6
Cultivation knowledge source:
Ancestors/family 23 19 25 19 86(76.1%) 16.2**
Neighbor’s 0 4 11 10 25(22.1%)
Extension agents 0 0 0 2 2(1.8%)
Reasons for cultivation:
Best money making 19 22 29 20 90(79.6%) 11.3*
Tradition 4 1 7 9 21(18.6%)
No alternatives 0 0 0 2 2(1.8%)
Planting material:
Seed 23 23 36 31 113(100%) -
Cropping system:
Mixed 23 23 36 31 113(100%) - aChi-square test, ns = not significant,* and ** Significant at α ≤ 0.05 and α ≤ 0.01, respectively.
cultivation experience. However, the highest proportion of respondents acquired mango farming knowledge from their ancestors of family members and neighbors,
whereas very small proportion (1.8%) of them obtained the knowledge from agriculture extension agents (Table 3). Mango production is an income earner for the majority

Neguse et al. 189
Figure 2. Estimates of mango yield (kg/tree) in the east and western Ethiopia.
of the respondents though some of them (18.6%) grew mango as a tradition. Hence, there is a need for capacity building of the growers by extension agents to improve the farming system (Dessalegn et al., 2014).
Mangos in the study sites were entirely propagated by seed and were under mixed cropping production system (Table 3). Mango can be propagated either by seed or through grafting. However, to guarantee the variety and maximum uniformity, it is essential to using grafting or another asexual method of propagation (Krishna and Singh, 2007). Therefore, the seed propagation might be the reason for the existing variability among the trees in the studied areas (Bally, 2011). The mixed cropping system, that was, growing mango with annual crops like maize, sorghum, beans, groundnut etc., vegetables, and perennial cash crop khat (Catha edulis L.), could be recommended to generate additional income, efficient use, and conservation of resources and diversification of their diet (Tiwari and Baghel, 2014). However, performance and profitability of the existing mango based cropping system should be further studied (Swain, 2014). Mango cultivars and productivity
Mango cultivars
The cultivars had various local names based on unique features of the fruits (shape, size, color, aroma, taste, and fiber content) and the person introduced in the localities (Table 4). The mango naming in most parts of the world also reflects the grower’s culture, languages, origins and spread of the mango tree along with the spread and settlement of communities (Bally, 2011). Due to such diversity in naming, the observed mango trees were mixed and difficult to identify. Consequently, two or more names could exist for the same cultivar. This scenario is similar to Sennhenn et al. (2013) who
reported confusion in the identification of Kenyan mango due to local naming.
Seven (22.58%) out of 31 mango cultivars identified in eastern and western Ethiopia were given the name of the person who introduced them to the villages. Since most of the trees were old (more than 50 years), the growers were not sure about the cultivars origin. However, some of the interviewed elders suspected the sources of local mangos in eastern Ethiopia could be from Arab countries introduced by Muslims who used to go to Mecca, and from other countries by traders and missionaries. Whereas the introduction route for western Ethiopia (Asosa) was assumed to be by traders from Sudan. Mango cultivars productivity
The average yield reported by the respondent farmers was 270 kg per tree where a majority reported 100-200 kg/tree while a few respondents reported more than 400 kg per tree (Figure 2). The reported range of yield was almost comparable with other countries where the productivity of mango ranges from 200 to 300 kg fruits per tree (5.5-33.1 tons/ha) depending on different factors such as variety, tree age, tree size, seasonal conditions, management and previous cropping history (Griesbach, 2003; Tiwariand Baghel, 2014). Therefore, it indicated the presence of high yielding farmers’ cultivars in the country that can be considered for future use and/or conservation activities. Production practices
Agronomic management practices
Planting patterns and fertilizer application: The mango trees in the study sites were planted irregularly (Table 5).
50.4
31.9
17.7
0
10
20
30
40
50
60
Erer Sofi Babile Assosa Total
Res
po
nd
ents
(P
erce
nt)
Districts
100-200 kg/tree 201-400 kg/tree > 400 kg/tree
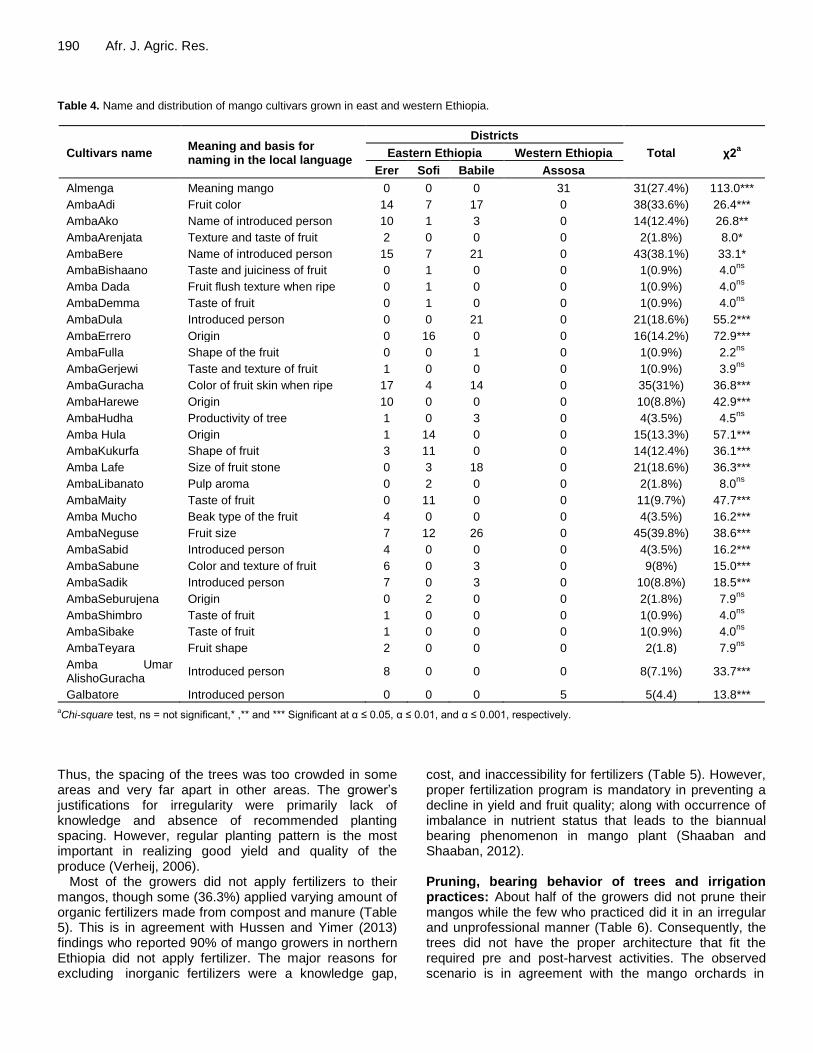
190 Afr. J. Agric. Res. Table 4. Name and distribution of mango cultivars grown in east and western Ethiopia.
Cultivars name Meaning and basis for naming in the local language
Districts
Total χ2a Eastern Ethiopia Western Ethiopia
Erer Sofi Babile Assosa
Almenga Meaning mango 0 0 0 31 31(27.4%) 113.0***
AmbaAdi Fruit color 14 7 17 0 38(33.6%) 26.4***
AmbaAko Name of introduced person 10 1 3 0 14(12.4%) 26.8**
AmbaArenjata Texture and taste of fruit 2 0 0 0 2(1.8%) 8.0*
AmbaBere Name of introduced person 15 7 21 0 43(38.1%) 33.1*
AmbaBishaano Taste and juiciness of fruit 0 1 0 0 1(0.9%) 4.0ns
Amba Dada Fruit flush texture when ripe 0 1 0 0 1(0.9%) 4.0ns
AmbaDemma Taste of fruit 0 1 0 0 1(0.9%) 4.0ns
AmbaDula Introduced person 0 0 21 0 21(18.6%) 55.2***
AmbaErrero Origin 0 16 0 0 16(14.2%) 72.9***
AmbaFulla Shape of the fruit 0 0 1 0 1(0.9%) 2.2ns
AmbaGerjewi Taste and texture of fruit 1 0 0 0 1(0.9%) 3.9ns
AmbaGuracha Color of fruit skin when ripe 17 4 14 0 35(31%) 36.8***
AmbaHarewe Origin 10 0 0 0 10(8.8%) 42.9***
AmbaHudha Productivity of tree 1 0 3 0 4(3.5%) 4.5ns
Amba Hula Origin 1 14 0 0 15(13.3%) 57.1***
AmbaKukurfa Shape of fruit 3 11 0 0 14(12.4%) 36.1***
Amba Lafe Size of fruit stone 0 3 18 0 21(18.6%) 36.3***
AmbaLibanato Pulp aroma 0 2 0 0 2(1.8%) 8.0ns
AmbaMaity Taste of fruit 0 11 0 0 11(9.7%) 47.7***
Amba Mucho Beak type of the fruit 4 0 0 0 4(3.5%) 16.2***
AmbaNeguse Fruit size 7 12 26 0 45(39.8%) 38.6***
AmbaSabid Introduced person 4 0 0 0 4(3.5%) 16.2***
AmbaSabune Color and texture of fruit 6 0 3 0 9(8%) 15.0***
AmbaSadik Introduced person 7 0 3 0 10(8.8%) 18.5***
AmbaSeburujena Origin 0 2 0 0 2(1.8%) 7.9ns
AmbaShimbro Taste of fruit 1 0 0 0 1(0.9%) 4.0ns
AmbaSibake Taste of fruit 1 0 0 0 1(0.9%) 4.0ns
AmbaTeyara Fruit shape 2 0 0 0 2(1.8) 7.9ns
Amba Umar AlishoGuracha
Introduced person 8 0 0 0 8(7.1%) 33.7***
Galbatore Introduced person 0 0 0 5 5(4.4) 13.8*** aChi-square test, ns = not significant,* ,** and *** Significant at α ≤ 0.05, α ≤ 0.01, and α ≤ 0.001, respectively.
Thus, the spacing of the trees was too crowded in some areas and very far apart in other areas. The grower’s justifications for irregularity were primarily lack of knowledge and absence of recommended planting spacing. However, regular planting pattern is the most important in realizing good yield and quality of the produce (Verheij, 2006).
Most of the growers did not apply fertilizers to their mangos, though some (36.3%) applied varying amount of organic fertilizers made from compost and manure (Table 5). This is in agreement with Hussen and Yimer (2013) findings who reported 90% of mango growers in northern Ethiopia did not apply fertilizer. The major reasons for excluding inorganic fertilizers were a knowledge gap,
cost, and inaccessibility for fertilizers (Table 5). However, proper fertilization program is mandatory in preventing a decline in yield and fruit quality; along with occurrence of imbalance in nutrient status that leads to the biannual bearing phenomenon in mango plant (Shaaban and Shaaban, 2012). Pruning, bearing behavior of trees and irrigation practices: About half of the growers did not prune their mangos while the few who practiced did it in an irregular and unprofessional manner (Table 6). Consequently, the trees did not have the proper architecture that fit the required pre and post-harvest activities. The observed scenario is in agreement with the mango orchards in

Neguse et al. 191
Table 5. Planting pattern and fertilizer application practices of mango grower in the east and western Ethiopia.
Tree management practices
Districts
Total χ2a Eastern Ethiopia Western Ethiopia
Erer Sofi Babile Assosa
Plant spacing:
Irregular 23 23 36 31 113(100%) -
Reasons for irregularity:
Lack of knowledge 20 18 16 25 79(69.9%) 17.8***
No recommended spacing 2 2 9 4 17(15.0%)
Shortage of land 1 3 11 2 17(15.0%)
Fertilizer use:
Organic fertilizer 5 13 23 0 41(36.3%) 35.7***
Do not apply fertilizer 18 10 13 31 72(63.7%)
Reasons for not applying fertilizer:
Lack of knowledge 10 10 17 31 68(60.2%) 36.3***
Fertilizers are expensive 13 9 17 0 39(34.5%)
Inaccessibility of fertilizers 0 4 2 0 6(5.3%) aChi-square test, ***Significant at α ≤ 0.001.
Table 6. Pruning, trees bearing behavior and irrigation practices of mango growers in east and western Ethiopia.
Tree management practices
Districts
Total χ2a Eastern Ethiopia Western Ethiopia
Erer Sofi Babile Assosa
Pruning:
Practice irregularly 10 15 26 5 56(49.6%) 23.9***
Not practicing 13 8 10 26 57(50.4%)
Reasons for not practicing pruning:
Lack of knowledge 9 6 11 21 47(41.6%) 19.2**
Lack of skill 9 11 10 2 32(28.3%)
Fear of losing yield 5 6 15 8 34(30.1%)
Trees’ bearing behavior:
Irregular/alternate 22 23 34 23 102(90.3%) 13.1**
Regular 1 0 2 8 11(9.7%)
Regulating bearing of trees:
Yes 0 8 14 5 27(23.9%) 14.2**
No 23 15 22 26 86(76.1%)
Irrigation practice:
Yes but irregularly 8 4 2 0 14(12.4%) 17.1**
No 15 19 34 31 99(87.6%)
Source of irrigation water:
Rain 15 19 34 31 99(87.6%) 21.1**
Borehole 7 2 2 0 11(9.7%)
River 1 2 0 0 3(2.7%) aChi-square test, ** and *** Significant at α ≤ 0.01 and α ≤ 0.001, respectively.

192 Afr. J. Agric. Res.
Table 7. Fruit harvesting practices of mango growers in the east and western Ethiopia.
Fruit harvesting practice
Districts
Total χ2a Eastern Ethiopia Western Ethiopia
Erer Sofi Babile Assosa
Harvesting criteria:
Fruit ripening 23 21 34 31 109(96%) 4.2ns
Market demand 0 2 2 0 4(3.5%)
Harvesting stage:
Full ripe 13 7 34 9 63(55.8%) 76.4***
Partially ripe 0 8 2 22 32(28.3%)
Full and half ripe 10 8 0 0 18(15.9%)
Harvesting method:
Hand picking 13 13 36 17 79(69.9%) 22.8***
Using stick 10 10 0 14 34(30.1%)
Harvesting time:
Morning 20 14 12 17 63(55.8%) 65.3***
Afternoon 1 8 24 0 33(29.2%)
Anytime of the day 2 1 0 14 17(15.0%) aChi-square test, ns = not significant, *** Significant at α ≤ 0.001.
Northeast Ethiopia (Hussen and Yimer, 2013). The mango tree, however, requires selective pruning of branches to encourage the growth of lateral branches and good tree architecture (Griesbach, 2003). This allows air and sunlight to penetrate, which reduces pests and diseases, and enhances yield and quality of the fruit (Bally, 2011; Nasution, 2013).
The alternate bearing was the common scenario in majority of the respondents’ farm. However, most of them did not have any intervention for the alternate bearing, while some growers tried to manage through the application of compost and supplementary irrigation during fruit setting stage of their mangos (Table 6). Alternate bearing is a common challenge for growers in the world that depend on environmental conditions and the genetic makeup of the mango cultivars (Kaur et al., 2014). Moreover, the exhaustion of trees during the period of crop load and vegetative growth at the time of flower differentiation and imbalance in carbon to nitrogen ratio is reported to be among the causes for irregular bearing in mango (Saxena et al., 2014).
Supplementary irrigation was lacking in most farms where the orchards were rainfed (87.6%). However, few growers irrigate their mangos while irrigating their intercrops from their borehole and nearby rivers (Table 6). Proper irrigation is mandatory during critical stages such as flowering, fruiting, and maturity for successful growth and development of mango orchard (Mirjat et al., 2011). Nevertheless, the irrigation amount and frequency is governed by various factors such as the age of the
tree, growth stage, climate (humidity, rainfall, and temperature) and soil factors (Mirjat et al., 2011; Sarker and Rahim, 2013)
Harvesting and post-harvest handling practices
Harvesting practices: The harvesting season varies with the location of growers, where it lasts from March to July in the west and May to September in eastern Ethiopia. Fruit ripening stage was the major criterion for harvesting by most growers, though few consider market demand (Table 7). However, growers did not have scientifically proven fruit maturity standards for harvesting. Thus, most growers harvest fully ripe fruits. While some harvest partially ripe or mixed fruits (Table 7). Mango fruit should be harvested at the right maturity stage; if not, the immature fruit will result in inferior quality while overripe fruits have short postharvest life (Sivakumar et al., 2011; Ahmed and Ahmed, 2014). Therefore, there is a need to determine the appropriate maturity indices of Ethiopian mango based on physical and chemical parameters in order to minimize the quantitative and qualitative losses.
Hand harvesting was the common harvesting method practiced by majorities (Table 7). However, due to lack of proper planting space and canopy management, the trees were too tall and the pickers had to climb on the tree to pick the fruits which were impractical in selecting proper quality fruits to harvest. This poor harvest and handling practices could result in various blemishes on the fruit skin that affect fruit quality and acceptability of

Neguse et al. 193
Table 8. Post-harvest and marketing practices of mango growers in the east and western Ethiopia.
Post-harvest and marketing practice
Districts
Total χ2a Eastern Ethiopia Western Ethiopia
Erer Sofi Babile Assosa
Storage type:
Shade under trees 11 9 28 18 66(58.4%) 10.1**
Storage house 12 14 8 13 47(41.6%)
Packaging:
Synthetic fiber sacks 22 23 36 7 88(77.9%) 77.8***
Plastic box (Crates) 0 0 0 9 9(8%)
Wooden box 1 0 0 3 4(3.5%)
Do not pack 0 0 0 12 12(10.6%)
Means of transport:
Car 12 12 8 24 56(49.6%) 36.0***
Animals (Donkey) 4 2 14 2 22(19.5%)
Human 1 7 5 5 18(15.9%)
All of the above 6 2 9 0 17(15%)
Fruit buyers:
Retailers 17 21 33 2 73 (64.6%) 69.2***
Wholesalers 6 2 2 19 29(25.7%)
Processors 0 0 1 10 11(9.7%) aChi-square test, ** and *** Significant at α ≤ 0.01 and α ≤ 0.001, respectively.
the produce by consumers (Mazhar et al., 2011). There were also differences in harvesting time where more than half of the growers harvest in the morning, some in the afternoon and about 15% of growers did not have a time frame for harvest (Table 7). However, harvesting in the morning is the best time to minimize the sap burn injury to the skin of mango (Amin et al., 2008). Post-harvest handling and marketing: The harvested fruits were mainly stored under mango trees (58.4%) or storehouse (41.6%) constructed from local materials but did not have control facility to regulate environmental variables such as temperature and relative humidity. The storage of matured mango fruit in open air condition and above or below the optimum temperature requirement of the crop shortens the postharvest life and decline of the fruit quality due to rapid softening of the fruits which make the fruits susceptible to handling damages and postharvest pathogen (Emongor, 2015). Therefore, the development of improved mango storage methods that can maintain the fruit quality and enhance its shelf life is mandatory for the growers.
Standard transport and packaging system for the harvested mangos were lacking in the entire studied areas. Accordingly, some growers used motor vehicles, some used animals (donkey) and human to transport their produce to the market. The synthetic fiber sacks
were the most common packaging material used and about 10.6% of the growers did not use packaging materials (Table 8). The improper packaging, transport, and inadequate field handling practices require intervention in Ethiopia since they have significant effect postharvest losses, organoleptic, nutritional and functional quality attributes of the fruits (Sivakumar et al., 2011) and marketing costs (Patel et al., 2013). The growers sell their products mainly to retailers followed by wholesalers (Table 8). However, few growers from the western part of Ethiopia sell to cooperative societies who are engaged in processing and value addition. Major production constraints Among several constraints reported by the respondents, accessibility to affordable agricultural inputs mainly fertilizers and pesticides were the major bottlenecks followed by pests and diseases. Moreover, knowledge and skill gap about pre and post production practices, poor marketing system, a limited number of improved varieties, flower and fruit drop and biennial bearing behaviors of the mangoes were also among the prioritized challenges (Table 9). The above-stated challenges are similar to those reported from the mango growers located in the northern (Dessalegn et al., 2014)
194 Afr. J. Agric. Res.
Table 9. Major mango production constraints in east and western Ethiopia.
Constraints
Districts
Total χ2a Eastern Ethiopia Western Ethiopia
Erer Sofi Babile Assosa
Input 23 23 24 9 79(69.9%) 44.6***
Pest 23 17 32 3 75(66.4%) 65.1***
Knowledge and skill 17 17 3 20 57(50.4%) 38.1***
Market 15 4 15 21 55(48.7%) 16.8***
Commercial cultivars 12 15 5 14 46(40.7%) 18.0***
Flower and fruit drop 9 1 23 0 33(29.2%) 41.7***
Alternate bearing 11 6 12 0 29(25.7%) 17.7***
Land shortage 4 0 7 1 12(10.6%) 8.6*
Drought 2 2 5 0 9(8.0%) 4.44ns
Transportation 2 0 4 0 6(5.3%) 5.96ns
aChi-square test, ns = not significant,* and *** Significant at α ≤ 0.05 and α ≤ 0.01, respectively.
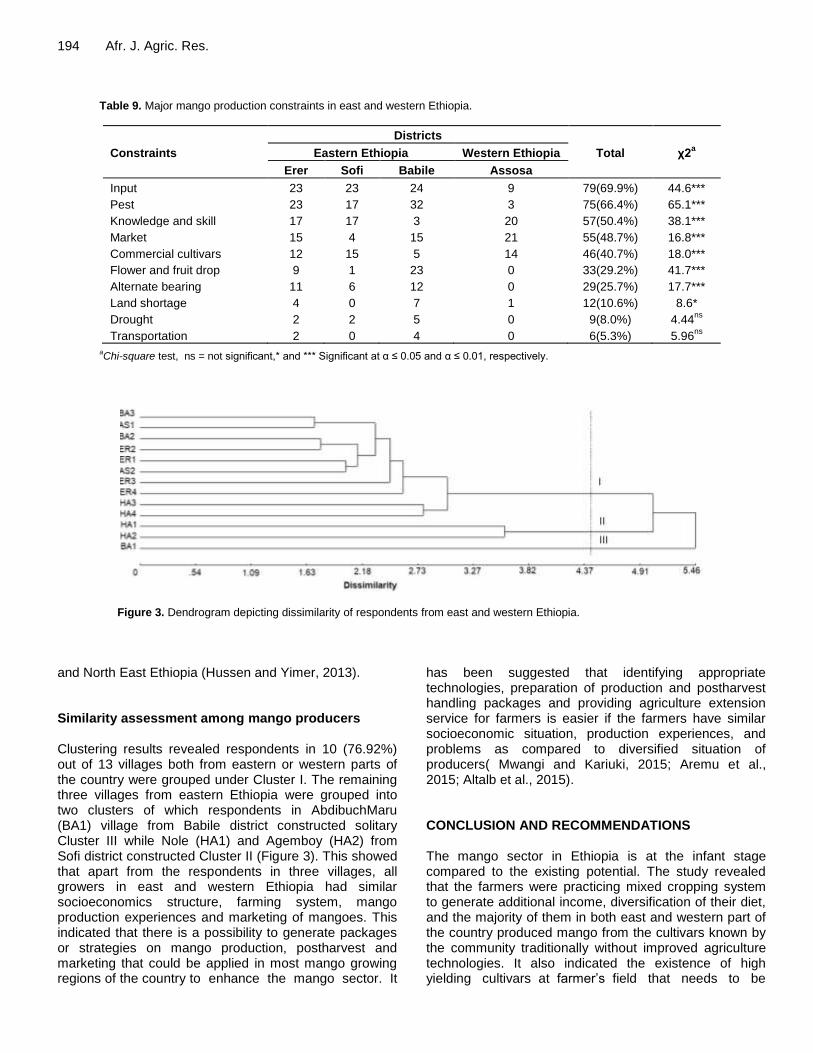
Figure 3. Dendrogram depicting dissimilarity of respondents from east and western Ethiopia.
and North East Ethiopia (Hussen and Yimer, 2013). Similarity assessment among mango producers Clustering results revealed respondents in 10 (76.92%) out of 13 villages both from eastern or western parts of the country were grouped under Cluster I. The remaining three villages from eastern Ethiopia were grouped into two clusters of which respondents in AbdibuchMaru (BA1) village from Babile district constructed solitary Cluster III while Nole (HA1) and Agemboy (HA2) from Sofi district constructed Cluster II (Figure 3). This showed that apart from the respondents in three villages, all growers in east and western Ethiopia had similar socioeconomics structure, farming system, mango production experiences and marketing of mangoes. This indicated that there is a possibility to generate packages or strategies on mango production, postharvest and marketing that could be applied in most mango growing regions of the country to enhance the mango sector. It
has been suggested that identifying appropriate technologies, preparation of production and postharvest handling packages and providing agriculture extension service for farmers is easier if the farmers have similar socioeconomic situation, production experiences, and problems as compared to diversified situation of producers( Mwangi and Kariuki, 2015; Aremu et al., 2015; Altalb et al., 2015). CONCLUSION AND RECOMMENDATIONS The mango sector in Ethiopia is at the infant stage compared to the existing potential. The study revealed that the farmers were practicing mixed cropping system to generate additional income, diversification of their diet, and the majority of them in both east and western part of the country produced mango from the cultivars known by the community traditionally without improved agriculture technologies. It also indicated the existence of high yielding cultivars at farmer’s field that needs to be

considered for conservation and improvement strategy. Moreover, unavailability of affordable agricultural inputs, improved varieties, marketing of fruits and low agriculture extension services were the major bottlenecks to the growers in Ethiopia. Therefore, the supply of affordable agricultural inputs and improved varieties, training of growers on technologies of mango production, harvest and postharvest handling is recommended to overcome the production constraints of mango. Safeguarding strategy should be urgently implemented for the identified potential mango cultivars which are on the verge of vanishing. In addition, diversity assessment and characterization of the cultivars is imperative to effectively utilize and/or conserve the genetic resources. However, this study included only the two major production regions (eastern and western Ethiopia) of the country; therefore, it is necessary to extend the similar in-depth research to identify the valuable farmers’ mango cultivars, production practices and constraints across the country to alleviate the challenges and move forward the mango sector in Ethiopia. CONFLICT OF INTERESTS The authors have not declared any conflict of interests. ACKNOWLEDGMENTS We thank Haramaya University (Ethiopia) and DAAD (German academic exchange service) for their financial support. We also grateful to Agriculture Bureau of eastern Hararghe Zone, Oromia Regional State, Harari People's National Regional State and Benishangul Gumuz Regional State, Ethiopia for their cooperation in providing the required informations. REFERENCES
Ahmed OK, Ahmed SET (2014). Determination of optimum maturity
index of mango fruits (Mangifera indica L.) in Darfur. Agriculture and Biology Journal of North America 5(2):97-103.
Ahmed THM, Mohamed ZMA (2015). Diversity of Mango (Mangifera indica L.) cultivars in Shendi area : morphological fruit characterization. International Journal of Research in Agricultural Sciences 2(4):2348-3997.
Altalb AAT, Filipek T, Skowron P (2015). The Role of agricultural extension in the transfer and adoption of agricultural technologies. Asian Journal of Agriculture and Food Sciences 3(5):500-507.
Amin M, Malik AU, Mazhar MS, Din IU, Khalid MS, Ahmad S (2008). Mango fruit de-sapping in relation to time of harvesting. Pakistan Journal of Botany 40(4):1587-1593.
Aremu PA, Kolo IN, Gana AK, Adelere FA (2015). The crucial role of extension workers in agricultural technologies transfer and adoption. Global Advanced Research Journal of Food Science and Technology 4(2):14-18.
Bally ISE (2011). Advances in research and development of mango industry. Revista Brasileira de Fruticultura 33:57-63.
Begum H, Reddy MT, Malathi S, Reddy BP, Narshimulu G, Nagaraju J, Siddiq EA (2013). Morphological and microsatellite analysis of
Neguse et al. 195
intravarietal heterogeneity in ‘Beneshan’ Mango (Mangifera indicaL.). International Journal of Biotechnology Research and Practice 1(1):1-18.
Berg J. Van Den (2013). Socio-economic factors affecting adoption of improved agricultural practices by small-scale farmers in South Africa. African Journal of Agricultural Research 8(35):4490-4500.
Bisht IS, Mehta PS, Bhandari DC (2007). Traditional crop diversity and its conservation on-farm for sustainable agricultural production in Kumaon Himalaya of Uttaranchal state : a case study. Genetic Resources and Crop Evolution 54:345-357.
Central Statistical Agency (CSA) (2015). Agricultural sample survey time series data for national and regional level. Addis Ababa, Ethiopia. Retrieved from www.csa.gov.et/index.php/26-news/hot-issues.
Dessalegn Y, Assefa H, Derso T, Tefera M (2014). Mango production knowledge and technological gaps of smallholder farmers in Amhara region, Ethiopia. American Scientific Research Journal for Engineering, Technology, and Sciences 10(1):28-39.
Emongor VE (2015). The effects of temperature on storage life of mango (Mangifera indica L.). American Journal of Experimental Agriculture 5(3): 252-261. https://doi.org/10.9734/AJEA/2015/12174
Fita T (2014). White mango scale, Aulacaspis tubercularis, distribution and severity status in east and west wollega zones, western Ethiopia. Science, Technology and Arts Research Journal 3(3):1-10.
Griesbach J (2003). Mango growing in Kenya. World Agroforestry Center (ICRAF). Nairobi, Kenya.
Hussen S, Yimer Z (2013). Assessment of production potentials and constraints of mango (Mangifera indica) at Bati, Oromia zone, Ethiopia. International Journal of Sciences: Basic and Applied Research 11(1):1-9.
IBM Corp. Released (2011). IBM SPSS Statistics for Windows, Version 20.0. Armonk, NY: IBM Corp.
Jahurul MHA, Zaidul ISM, Ghafoor K, Al-Juhaimi FY, Nyam KL, Norulaini NAN, Mohd Omar AK (2015). Mango (Mangifera indica L.) by-products and their valuable components: A review. Food Chemistry 183:173-180.
Kaur M, Bal JS, Bali SK, Sharma LK, Bali SK (2014). An evaluation of mango (Mangifera indica L.) germplasm for future breeding programme. African Journal of Agricultural Research 9(20):1530-1538.
Krishna H, Singh SK (2007). Biotechnological advances in mango (Mangifera indica L.) and their future implication in crop improvement - A review. Biotechnology Advances 25(3):223-243.
Mazhar MS, Amin M, Malik AU, Campbell J, Johnson P (2011). Improved harvest and de-sapping practices affect mango fruit quality along the supply chains. International Journal of Agriculture and Biology 13:776-780.
Mirjat MS, Jiskani MM, Siyal AA, Mirjat MU (2011). Mango production and fruit quality under properly managed drip irrigation system. Pak. J. Agri., Agril. Engg. Veterinary Sciences 27(1):1-12.
Mwangi M, Kariuki S (2015). Factors determining adoption of new agricultural technology by smallholder farmers in developing countries. Journal of Economic and Sustainable Development 6(5):208-216.
Nasution F (2013). The pruning on mango (Mangifera indica L.). ARPN Journal of Agricultural and Biological Science 8(2): 1990-1992.
Ogada M J, Mwabu G, Muchai D (2014). Farm technology adoption in Kenya: a simultaneous estimation of inorganic fertilizer and improved maize variety adoption decisions. Agricultural and Food Economics 2(12):1-18.
Patel P, Singh S, Chavda JC, Patel KA (2013). Effect of grading and packaging with transportation on fruit quality and shelf life of mango fruits. The Asian Journal of Horticulture 8(1):234-237.
Ramette A (2007). Multivariate analyses in microbial ecology. FEMS Microbiology Ecology 62(2):142-160.
Rekhapriyadharshini (2015). A study on the export performance of fresh mangoes from India. International Journal of Interdisciplinary and Multidisciplinary Studies 2(6):134-140.
Rymbai H, Laxman RH, Dinesh MR, Sunoj VSJ, Ravishankar KV, Jha AK (2014). Diversity in leaf morphology and physiological characteristics among mango (Mangifera indica) cultivars popular in different agro-climatic regions of India. Scientia Horticulturae

196 Afr. J. Agric. Res.
176:189-193. Sarker BC, Rahim MA (2013). Mangifera indica. Bangladesh Journal of
Agricultural Research 38(1): 145-154. Saxena P, Singh VK, Pathak N (2014). Antioxidative enzymes and
biochemical changes in paclobutrazol induced flowering in mango (M. indica) cultivars. Journal of Enviromental Biology 35:1061-1066.
Sivakumar D, Jiang Y, Yahia EM (2011). Maintaining mango (Mangifera indica L.) fruit quality during the export chain. Food Research International 44:1254-1263.
Sneath PHA, Sokal RR (1973). Numerical taxonomy. The principles and practice of numerical classification. (D. Kennedy and R. B. Park, Eds.). W.H. Freeman and Company. San Francisco. Retrieved from http://www.jstor.org/stable/2412767?origin=crossref
Swain SC (2014). Performance and profitability study of different mango based intercropping systems in Eastern Ghat high land zone of Odisha. Journal of Crop and Weed 10(2):170-178.
Tiwari R, Baghel BS (2014). Effect of intercropping on plant and soil of Dashehari mango orchard under low productive environments. Asian Journal of Horticulture 9(2):439-442.
Ullah H, Saeed A, Thompson AK, Ahmad W, Azher Nawaz M (2010). Storage of ripe mango (Mangifera indica L.) cv. alphonso in controlled atmosphere with elevated CO2. Pakistan Journal of Botany 42(3):2077-2084.
Vasugi C, Dinesh MR, Sekar K, Shivashankara KS, Padmakar B, Ravishankar KV (2012). Genetic diversity in unique indigenous mango accessions (Appemidi) of the Western Ghats for certain fruit characteristics. Current Science 103(2):199-207. https://doi.org/10.1007/s13592-011-0065-1.24.
Verheij E (2006). Fruit growing in the tropics (Third). Digigrafi, Wageningen, the Netherlands: Agromisa Foundation and CTA, Wageningen.
Xiahong HE, Yan SUN, Dong GAO, Fugang WEI, Lei PAN, Cunwu
GUO, Youyong ZHU (2011). Comparison of agronomic traits between rice landraces and modern varieties at different altitudes in the paddy fields of Yuanyang terrace, Yunnan province. Journal of Resources and Ecology 2(1):46-50.
Yong’an L, Quanwen D, Zhiguo C, Deyong Z (2010). Effect of drought on water use efficiency, agronomic traits and yield of spring wheat landraces and modern varieties in Northwest China. African Journal of Agricultural Research 5(13):1598-1608.
Sennhenn A, Prinz K, Gebauer J, Whitbread A, Jamnadass R, Kehlenbeck K (2013). Identification of mango (Mangifera indica L.) landraces from Eastern and Central Kenya using a morphological and molecular approach. Genetic Resources and Crop Evolution 61(1): 7-22.
Shaaban SHA, Shaaban MM (2012). Impact of the nutritional status on Yield of nine mango cultivars grown under farm conditions at Giza Governorate, Egypt. Journal of American Science 8(5):304-310.
Shi S, Ma X, Xu W, Zhou Y, Wu H, Wang S (2015). Evaluation of 28 mango genotypes for physicochemical characters, antioxidant capacity, and mineral content. Journal of Applied Botany and Food Quality 88:264-273.

Vol. 14(4), pp. 197-208, 24 January, 2019
DOI: 10.5897/AJAR2018.13611
Article Number: 83E1A0859989
ISSN: 1991-637X
Copyright ©2019
Author(s) retain the copyright of this article
http://www.academicjournals.org/AJAR
African Journal of Agricultural
Research
Full Length Research Paper
Growth and yield performance of selected upland and lowland rainfed rice varieties grown in farmers’ and
researchers’ managed fields at Ifakara, Tanzania
KITILU M. J. F.1,2*, NYOMORA A. M. S.1 and CHARLES J.1
1Department of Botany, College of Natural and Applied Sciences, University of Dar Es Salaam, Tanzania.
2Tanzania Research Institute, Ifakara Centre, Tanzania.
Received 6 October, 2018; Accepted 17 December, 2018
Bridging the yield gaps is of major concern to rice breeders and agronomists under rainfed rice cultivation. The yield performance of lowland and upland rainfed rice varieties was investigated in farmers’ and researchers’ field conditions at four locations in Ifakara. Selected agronomic practices namely; recommended fertilizer (80 kgN/ha), spacing of 20 cm × 20 cm, weed free fields and high yielding varieties of TXD306, Komboka and Tai for lowland rainfed, and NERICA1, NERICA2 and NERICA4 for upland rainfed rice. Moreover, farmer selected varieties Supa India and WahiPesa were used as the local control in this research. The study revealed that yield performance of lowland rainfed rice varieties and in farmers’ fields ranged between 2.9 and 6.9 t ha
-1, while in the upland rainfed rice the
yield ranged between 2.5 and 5.4 t ha-1
. This was similar to yield that was obtained from the researchers’ fields which ranged between 2.4 and 8.5 t ha
-1 in lowland and between 1.8 and 4.8 t ha
-1 in upland fields.
The yield gap analysis revealed that the gap of between 35 and 60% previously reported in lowland rice was narrowed to 0 to 12.1%, while in the upland rice from 24.5 to 28.6% previously reported to 0% and excess yield over the potential yields and yields previously reported by farmers. The performance of all improved rice varieties at farmers and researchers’ field were significantly higher compared to the local check varieties Supa India and WahiPesa. It was concluded that, providing farmers with selected good agronomic practices and supervision of farmers in field management activities enhanced rice productivity under farmers’ conditions and narrowed or bridged the yield gaps that existed. Key words: Upland rice, good agronomic practices (GAPs), lowland rice, productivity, yield gaps.
INTRODUCTION Rice (Oryza sativa L.) is one of the most important cultivated crops in the world. Rice has been reported to
be grown on more than 162 million hectares worldwide by 2010 (GRiSP, 2013). In Tanzania, rice is the second
*Corresponding author. E-mail: [email protected]. Tel: +225 -755259776.
Author(s) agree that this article remain permanently open access under the terms of the Creative Commons Attribution
License 4.0 International License

198 Afr. J. Agric. Res. Table 1. Characteristics of 8 rice varieties, their yield potentials, farmer realised yield and established yield gap.
S/N Variety (year of release) Aroma Agro-ecological system
Days to Maturity
Researcher Potential
yield (t/ha)
Farmer realised
yield (t/ha)
Yield gap
analysed (t/ha)
1 Super India (50s) farmers variety) Aromatic Lowland rainfed 120 -135 2.0 - 3.0 0.5 - 1.5 1.5
2 TXD306 (2002) Semi-aromatic Lowland rainfed 120 - 125 7.0 - 8.5 4.5 - 5.5 2.5 - 3.0
3 Komboka (2012) Semi-aromatic Lowland rainfed 100 - 110 5.0 - 6.5 3.0 - 4.0 2.0 - 2.5
4 Tai (2012) Non-aromatic Lowland rainfed 100 - 110 5.5 - 6.8 3.5 - 4.5 20 - 2.3
5 NERICA1 (2009) Semi-aromatic Upland rainfed 93 - 101 3.0 - 4.5 2.5 - 3.0 0.5 - 1.5
6 NERICA2 (2009) Non-aromatic Upland rainfed 90 - 95 3.0 - 4.0 2.0 - 3.0 1.0
7 NERICA4 (2009) Non-aromatic Upland rainfed 93 - 98 4.5 - 6.0 3.5 - 4.5 1.0 - 1.5
8 WahiPesa (farmers variety) Semi-aromatic Upland rainfed 110 -120 XX 0.5 - 1.0 XX
XX: Yield potential and gap not known. Sources: KATRIN (2013); Cholima Agro-Scientific Research Centre’s.
important staple cereal crop next to maize in terms of production and consumption (MAFSC, 2009; Mghase et al., 2010; USDA, 2013) and ranks first in Ifakara area, Kilombero district. A total area of 330,000 ha of land is suitable for rice cultivation in the country (MAFSC, 2009). About 72% of the land for rice is under rainfed lowland rice ecosystem, while 20% of it is under upland rainfed rice ecosystem, making a total of about 92% rice production in Tanzania from rainfed ecosystems. Only 8% rice cultivation in Tanzania is under irrigated rice ecosystem. However, rice yield under rainfed ecosystems in Tanzania is always lower due to moisture stress as well as use of low yielding local varieties grown with or without fertilizer application in farmers’ fields (GRiSP, 2013).
Despite the release and dissemination of improved rice varieties in the rainfed rice ecosystem such as NERICAs (New Rice for Africa), that is, NERICA1, NERICA2, NERICA4, and NERICA7 with potential yields ranging between 3.0 and 7.0 t/ha in upland ecosystem and TXD306, TXD 88, TXD 85, Tai and Komboka with potential yields ranging between 5.0 and 8.5 t/ha in lowland ecosystem which was released between 2000 and 2012, the farmers have not yet bring their yield close to the yield potentials realized by researchers (Katrin, 2013). The rice yields in farmers’ fields have been reported far below the potential yield. For example, a report by GRiSP (2013) which showed yields from farmers fields ranged between 0.8-1.0 and 1.5-2.0 t/ha in the upland and lowland rainfed ecosystems, respectively. These yields are far lower from the potential yields established by researchers (Katrin, 2013).
Another report established by Agricultural research institutes KATRIN and Cholima Agro-Scientific Research centres (Table 1), showed that the yields from farmer fields ranged between 0.5 and 5.5 t/ha in lowland rice depending on the variety used. While in the upland rice ecosystem yield ranged between 0.5 and 4.5 t/ha with
use of improved NERICA rice varieties. Crop production capacity can be evaluated by estimating potential yield and water-limited yield levels as benchmarks for crop production under rainfed conditions. The differences between these theoretical yield levels and actual farmers’ yields define the yield gaps (Van Ittersum et al., 2013), and particularly explicit knowledge about these yield gaps is essential to guide sustainable agricultural intensification. However, specific constraints reported to dictate the productivity and yield potential of different locations, and therefore location specific management changes and interventions are required to close the observed yield gap (Mueller et al., 2012). In order to boost rice productivity and reduce yield gaps in Ifakara the ecosystem specific analyses of yield gaps were very potential in addressing the yield production constraints of selected rice varieties under rainfed environment.
The study analyzed the upland rainfed and lowland rainfed rice varieties separately to quantify the yield gap (Yg), that is, the difference between water-limited yield potential at researchers’ field (Yw) and actual yield (Ya) at farmers’ field. The study found a yield gap of between 35 and 60% in lowland rainfed rice ecosystem. While in the upland rainfed rice ecosystem a yield gap of between 24.5 and 28.6% was found between farmers obtained yields and the researchers yield potentials (Katrin, 2013; Merlos et al., 2015). Therefore, intervention plans to boost farmer yield outputs closer to expected yield potentials established by researchers was found essential at the study site in Ifakara.
Previous studies on use of good agronomic practices reported that good plant spacing, use of improved varieties, and use of fertilizers increased the yields under farmers’ field conditions in other areas (Zaman et al., 2013; Saito et al., 2010; Meertens et al., 2003). However, the low level of rice production and productivity at Ifakara and Tanzania in general are caused by several reasons including small holder farmers’ limited access to rice

information (Ronald et al., 2014; Mkanthama, 2013). According to Chapman and Tripp (2003), there are concerns with poor performance of public extension, including its inability to consistently deliver useful information to resource-poor farmers. The good agronomic practices and technologies reported were not very well known to most farmers cultivating rice on small scale in Ifakara. In order to increase their production, access to good agronomic practices (GAPs) such as improved seed varieties, plant spacing, fertilizer and application rate, weeding time and frequency practices were needed.
The resulting growth and yield performances of selected eight rice varieties under farmers and researcher growing condition were analyzed to investigate how (GAPs) is effective on closing or narrowing the previously reported yield gap. MATERIALS AND METHODS
Description of the study sites
The study was undertaken in Ifakara area, Kilombero district, which lies between 8° 04’ to 8° 15’ South and 36° 65’ to 36° 69’ East, at an altitude ranging between 257 and 330 m above sea level. The field experiments were carried out at the following four locations in rainfed conditions. Two farmers managed fields were at Kibaoni (08° 07’ S and 36° 68’ E) and Michenga (08° 12’ S and 36° 66’ E). The two researcher managed fields were at the Agriculture Research Institute KATRIN (08° 04’ S and 36° 68’ E) and Lumemo substation (08° 15’ S and 36° 67’ E).
In an attempt to bridge the yield gaps between farmers and researchers yields, the farmers and researchers applied the same agronomic practices (GAPs) such as rice varieties, spacing of 20 × 20 cm2, fertilizer at same rate of 80 kg N/ha, weeding frequency of two time in a season, seeding in line, and thinning to two seedling per hill. The researcher was monitoring all the field management activities accomplished. Ifakara site is considered to have high potential for rice productivity growth; its climate reported to be sub-humid tropical, with an average of 1400 mm per annum and the annual temperature ranged between 28 and 33°C (Katrin, 2012). The area is generally gently sloping with an alluvial sandy loam soils on the flat area and the upper zone is dominated by pale sand of granitic gneiss origin (Katrin, 2012).
Experimental design and crop management The experiments were carried out under the field condition in a randomized complete block design (RCBD) layout, in plot sizes of 40 m2 with four replications. Experimental units comprised twenty-rows of 10 m length each, with row-to-row spacing of 20 cm and plant-to-plant spacing of 20 cm. Spacing between blocks and between plots were 1 and 0.5 m, respectively. Five seeds were directly sown per hill. After germination the seedlings were thinned to two plants per hill for both farmers field and researcher field conditions in the upland rice and lowland rice ecosystems.
The yield potential and yield gap previously reported for the varieties used in this study are summarized in Table 1. The soil status of the plots before sowing is shown in Table 2. All plots in farmers managed field and researcher managed fields were fertilized with a standard rate of 80 kg N/ha of urea applied at the effective tillering stage by broadcasting method. Weeding was done
Kitilu et al. 199 twice at vegetative and at maximum tillering stages. Data collection and sampling techniques Data were collected on some phenological growth and yield components traits such as days to 50% flowering and 90% maturity, and above ground biomass (SDt), number of tillers, and plant height. Others traits were yield and yield components including number of panicles, total number of spikelets per panicle, number of fertile spikelets per panicle, thousand grain weight and grain yield. Measurement of yield and yield components An area of 1 m2 was sampled for yield and yields components analyses. The total number of panicles, number of fertile and sterile spikelet per panicle was counted from 5 randomly selected panicles in the 1 m2 plot areas. The 1000 grains were physically counted and weighed to get the 1000 grains weight in (g) at 14% grain moisture content using the procedures described by (Gomez, 1972). Biomass yield The total sun-dry weight of the above ground biomass of plants occupying the 1 m2 area were weighed at maturity, then converted to tons per hectare (tha-1) as described by Fageria (2010), whereby plants in a sampling area were cut at 4 cm above the ground and sun dried for three days and weighed to get the total biomass weights above the ground then threshed to get the grain weight. Then the straws were dried at 80°C until a constant dry weight obtained. Grain yield This was taken as the total grain weight per plot in grams after threshing then converted to tons per hectare (tha-1). The grain yields of the selected rice varieties were determined according to (Yoshida, 1981) as follows: GY= (P × SP × FS × 1000GW × 10-5) (1) where GY is grain yield (tha-1), P is number of panicles (m-2), SP is number of spikelets per panicle, FS is percentage filled spikelets or grain and GW is 1000-grain weight (g). Grain harvest index (HI) This was taken as the ratio of grain weight to the total above ground biomass yield computed from an area of 1 m2. This index was obtained using the relationship established by Fageria (2010) where, HI = Grain weight (g) / Total weight above ground (Grain + Straw) g (2) Data analysis The data obtained in the experimental field trials were subjected to analysis of variance (ANOVA) using (GenStat, 2011) 14th edition and Excel (Microsoft) for graphs and tables. Mean separation was done using Tukey’s significance difference test, and the treatments were compared at (P≤ 0.05).

200 Afr. J. Agric. Res. Table 2. Agro-ecology and Soil characteristics for the rainfed ecosystems used in the experiment.
Site
Soil texture
Soil pH
EC OC Total
N
Available (P)
Exchangeable Cations (meq/100 g soil)
CEC
Class H2O mS/cm g/kg g/kg mg/kg K Na Ca Mg Cmol/kg
Katrin (RU) Sandy loam 6.40 0.10 11.90 0.65 88.46 0.11 0.04 5.45 1.08 10.80
Kibaoni (RU) Sandy loam 6.10 0.09 5.70 0.60 42.37 0.24 0.08 0.71 0.26 1.52
Lumemo (RL) Clay loam 5.40 0.18 20.20 1.80 43.40 0.35 0.39 9.04 4.53 21.40
Michenga (RL) Clay loam 5.40 0.18 20.10 1.80 50.60 0.31 0.36 9.94 4.68 20.80
EC= Electro-conductivity, OC= Organic Carbon, CEC= Cation Exchange Capacity, RU=Rainfed Upland, RL=Rainfed lowland
Table 3. Days to 50% flowering and 90% physical maturity of selected Rainfed rice at Ifakara rainfed ecosystem.
Ecology Sites Rice varieties Days to 50%
flowering
Days 90%
physical maturity
Lowland rice
Michenga
Komboka 69 ± 0.4 108 ± 0.4
Tai 71 ± 0.4 110 ± 0.4
TXD 306 78 ± 0.4 125 ± 0.8
Supa India 87 ± 0.5 128 ± 0.7
Lumemo
Komboka 78 ± 0.4 102 ± 0.6
Tai 80 ± 0.7 104 ± 0.4
TXD 306 87 ± 0.4 123 ± 1.1
Supa India 98 ± 0.5 125 ± 0.7
Upland rice
Kibaoni
NERICA1 63 ± 0.9 98 ± 0.4
NERICA2 60 ± 1.3 95 ± 0.8
NERICA4 61 ± 1.0 96 ± 0.8
WahiPesa 68 ± 0.7 117 ± 0.4
ARI-KATRIN
NERICA1 67 ± 0.8 95 ± 0.4
NERICA2 64 ± 1.1 92 ± 0.4
NERICA4 66 ± 1.1 94 ± 0.8
WahiPesa 72 ± 1.4 114 ± 0.7
Data are means of four replications; ± = Standard error of means. RESULTS Phenological and growth characteristics of selected rice varieties Phenological characteristics The selected improved rice varieties and two local rice varieties varied over genotype and environment (Table 3). For example, the 50% flowering time in upland and lowland rainfed rice ecosystems, varied among rice genotypes and the site, respectively. The period to 50% flowering was longer in the lowland rainfed rice ecosystem than in the upland rainfed rice ecosystem (Table 3). Flowering for Michenga lowland site was about
69 to 87 days depending on the rice genotypes, and was shorter than that of Lumemo site about 9 to 11 days, while in the Upland rice sites; the days to 50% flowering of all rice genotypes at Kibaoni were shorter by 4 to 5 days compared to that at KATRIN site although such differences were not statistically significant. NERICA 2 had slightly the shortest 50% flowering than all other upland rice genotypes at both Kibaoni and KATRIN sites. The farmers variety (WahiPesa) delayed by 8 to 9 days to reach 50% flowering compared to NERICA2, which was earliest variety at Kibaoni and KATRIN sites (Table 3).
The 90% physical maturity time in both upland and lowland rainfed rice ecosystems varied among rice genotypes and the sites (Table 3). Varieties Komboka and Tai were matured earlier compared to TXD 306

Kitilu et al. 201
Nu
mb
er o
f t
ille
rs
0
50
100
150
200
250
300
350
400
Komboka Tai TXD 306 Supa India
MICHENGA
LUMEMO
A
0
20
40
60
80
100
120
140
160
Komboka Tai TXD 306 Supa India
Pla
nt
heig
ht
(cm
)
MICHENGA
LUMEMO
B
Figure 1. Growth performance of lowland rice at Farmer and researcher fileds (A) number of tillers per m-2 of lowland rice at maturity, (B) plant heights of lowland rice at maturity; Bars indicate standar error (SE).
(SARO5) and Supa India by 15 to 18 and 19 to 23 days at Michenga and Lumemo sites, respectively (Table 3). The farmers’ variety Supa India matured relatively same as TXD 306 (SARO5) though delayed by 3 to 2 days.
For the Upland rice ecosystem, the 90% physical maturity was relatively the same at Kibaoni and at KATRIN upland rice sites, though delayed by 2 to 3 days longer at Kibaoni. NERICA 2 had the shortest 90% maturity than all other upland rice genotypes both at Kibaoni and KATRIN. The local variety (WahiPesa) delayed by 22 days to reach 90% physical maturity compared to NERICA2, the earlier variety at Kibaoni and KATRIN sites, respectively (Table 3). Growth characteristics In the lowland rainfed ecosystem, the number of tillers in the lowland rainfed rice ecosystems was significantly greater at the Lumemo researcher managed site for the improved rice varieties Komboka, Tai and TXD 306 than at Michenga farmer managed site. However, at both sites the local variety Supa India produced significantly lower number of productive tillers compared to other rice varieties tested (Figure 1A). At Michenga farmer managed site, there was no significant difference between Komboka and Tai varieties in the number of tillers per unit area, where a decreasing trend in number of tillers from Komboka, Tai, TXD306 and Supa India was observed (Figure 1A).
Rice plant height under lowland rainfed rice ecosystem were not significantly different regardless of sites for Komboka, Tai and Supa India, while TXD 306 variety showed significant difference among the sites (Figure 1B). At Michenga farmer managed site, TXD 306 was significantly taller than at Lumemo researcher managed site. This characteristic was against the normal plant height behavior for TXD 306. Supa India, the local check
variety of the farmers showed the tallest plants regardless of sites (Figure 1B).
In upland rainfed rice ecosystem, the number of tillers varied significantly with varieties both at Kibaoni farmer managed site and at ARI-KATRIN researcher managed site. The local check variety, WahiPesa produced relatively similar small number of tillers both at Kibaoni (farmer managed) and ARI-KATRIN researcher managed sites (Figure 2A).
The plant height in upland rainfed ecosystem significantly differed among the sites (Figure 2B). At Kibaoni all varieties showed no difference in plant heights, while at ARI-KATRIN researcher managed site, WahiPesa local check variety was the tallest than all other upland rainfed rice varieties grown. All NERICA’s varieties showed no significant difference in plant heights regardless of sites (Figure 2B). Yield and yield components Biomass yield (Dry weights) The total biomass yield (straw plus grain weights) in the lowland rainfed rice ecosystem was significantly different among sites (Figure 3A). The total biomass yield of all selected lowland rainfed rice plus the local check variety produced significantly larger biomass yield at Lumemo researcher managed site compared to Michenga farmer managed site. However, the farmers’ variety Supa India produced the smallest total biomass yield at both Michenga and Lumemo sites. The improved lowland varieties TXD 306, Komboka and Tai produced significantly larger total biomass yield than the local variety Supa India at Lumemo researcher managed site, and Michenga farmer managed sites (Figure 3A).
In the upland rainfed rice ecosystem, the total biomass yield of all selected upland rice varieties including the

202 Afr. J. Agric. Res.
0
20
40
60
80
100
120
NERICA1 NERICA2 NERICA4 WahiPesa
Pla
nt h
eig
ht (cm
)
KIBAONI
KATRIN B
0
50
100
150
200
250
NERICA1 NERICA2 NERICA4 WahiPesa
KIBAONI
KATRIN
Nu
mb
er o
f tille
rs
A
Figure 2. Growth performance of upland rainfed rice (A) number of tillers per m-2 of upland rice at maturity, (B) plant height of upland rice at maturity; Bars indicate standar errors (SE).
0
10
20
30
40
50
60
Komboka Tai TXD 306 Supa India
To
ta
l b
iom
ass d
ry
w
eig
hts
(to
ns/h
a)
MICHENGA
LUMEMO
A
0
10
20
30
40
50
60
NERICA1 NERICA2 NERICA4 WahiPesa
Total
Bio
mass d
ry w
eig
hts
(ton
s/h
a)
KIBAONI
KATRIN
B
Figure 3. Total biomass yield performance of lowland and upland rainfed rice, (A) total biomass dry weight (tons ha-1) of lowland rice, (B) total biomass dry weight (tons ha-1) of upland rice. Bars indicate standar error (SE).
farmers local check variety, showed significantly higher total biomass yield at Kibaoni farmer managed site than that produced at ARI-KATRIN researcher managed site (Figure 3B). NERICA2 produced the largest total biomass yield at Kibaoni followed by NERICA1 and NERICA4, WahiPesa the farmers’ local check variety produced the smallest total biomass yield. NERICA2 had a significantly larger biomass yield compared to that from the farmers’ local check variety WahiPesa. The farmers managed upland rainfed rice site at Kibaoni produced significantly higher total biomass yield than the researcher managed upland rainfed rice site at AR-KATRIN (Figure 3B). Grain yield In the lowland rainfed rice ecosystem, the grain yields of
TXD 306 were significantly higher at Michenga and Lumemo (Table 4). TXD 306 had a yield of 6.86 t/ha at Michenga farmer managed field and 8.45 t/ha at Lumemo researcher managed field. These yields were significantly higher than the grain yields of other lowland rainfed rice investigated, followed by Komboka and Tai which showed relatively similar grain yield performance (Table 4). Supa India variety which was selected by farmers as a local check produced the lowest grain yields 2.88 and 2.43 t/ha at Michenga and Lumemo sites, respectively.
In the upland rainfed rice ecosystem, the results showed that the grain yield of improved rice varieties NERICA1 produced 4.35 and 4.00 t/ha, NERICA2 produced 3.92 and 3.73 t/ha and NERICA4 produced 5.39 and 4.75 t/ha at farmer and researcher fields, respectively (Table 5). These yields were significantly higher than those of the local check WahiPesa rice

Kitilu et al. 203
Table 4. Grain yield and yield components of four selected rice varieties grown in rainfed lowland ecosystem under Farmer and Researcher field condition.
Site location (S)
Varieties (V)
Grain yield (t ha
-1)
Harvest index (HI)
Total number of panicle
(m-2
)
Number of Spikelet
panicle-1
#of Fertile Spikelet panicle
-1
Fertility (%)
1000grain weight (g)
Michenga
Komboka 5.26c 0.52
b 193
ab 171
a 113
abc 66.40
ab 24.51
c
Tai 6.00bc
0.61a 181
ab 154
a 120
ab 78.16
a 27.78
b
TXD 306 6.86b 0.63
a 154
b 171
a 134
a 79.66
a 33.79
a
Supa India 2.88d 0.44
c 131
b 130
a 81
c 62.03
b 27.56
b
Lumemo
Komboka 6.08bc
0.15de
256 a 150
a 98
abc 65.95
ab 24.53
c
Tai 5.94bc
0.16de
231a 133
a 91
bc 68.35
ab 29.00
b
TXD 306 8.45a 0.20
d 255
a 162
a 105
abc 64.16
ab 33.28
a
Supa India 2.43d 0.10
e 122
b 123
a 74
c 60.61
b 27.29
b
ANOVA
V * * * NS * * *
S * * * NS NS NS NS
S × V * * * NS * * NS
*Indicate Significant at 5% level by ANOVA. NS indicate not Significant. Values followed by the same letter in a column within each treatment are not significantly different at P≤ 0.05. (Michenga =Farmers field). (Lumemo = Researchers field). S = site effects, V= varieties, (S × V) = Site and varieties interactions.
variety which performed poorly with grain yield of 2.83 and 1.83 t/ha at Kibaoni farmer managed field and at ARI-KATRIN researcher managed field, respectively (Table 5). The interactions in grain yields per unit area were observed to be significant at both lowland and upland rainfed ecosystems, between sites and rice varieties, respectively (Tables 4 and 5). Yield components The yield components such as harvest index, number of panicles per unit area, number of spikelets per panicle, fertile spikelets per panicle, fertility percentage ratio and 1000 grain weight varied on genotypes and the sites (Tables 4 and 5).
The harvest index (HI) in the lowland rainfed rice ecosystem, at Michenga farmer managed site were significantly higher than the harvest index at Lumemo reasearcher managed site. At Michenga farmer managed site, TXD 306 and Tai produced the highest harvest index ratio than all other varieties used with ratio of 0.6, followed by Komboka, and Supa India with ratio of 0.4 produced the lowest harvest index (Table 4). At Lumemo researcher managed site, TXD 306 had a significantly higher harvest index than Supa India but was not significantly different from Tai and Komboka (Table 4).
In upland rainfed ecosystem, the havest index at ARI- KATRIN researcher managed site were significantly higher than those at Kibaoni farmer managed site (Table 5). At both sites NERICA4 had a significantly higher harvest index ratio (HI), followed by NERICA2 and NERICA1 which were not statistically significant different
in harvest index, and the local check variety WahiPesa indicated significantly lower harvest index at ARI-KATRIN and Kibaoni sites, respectively (Table 5). The interactions in harvest index ratio were observed to be significant at both lowland and upland rainfed ecosystems between sites and rice varieties (Tables 4 and 5).
The number of panicles per unit area in the lowland ecosystem was significantly different between Michenga farmer managed site and Lumemo researcher managed site (Table 4). At Michenga panicles per unit area were not statistically significant different though Komboka and Tai produced relatively higher panicles per unit area followed by TXD 306 and lastly Supa India. At Lumemo site Komboka, TXD 306 and Tai were not significantly different from each other in the number of panicles per unit area, but significantly had higher number of panicles per unit area than Supa India variety (Table 4). In the upland rainfed ecosystem, the number of panicles per unit area was not significantly different between Kibaoni farmer managed site and ARI-KATRIN researcher managed site. All rice varieties used were statistically similar in the number of panicles per unit area at each site except for NERICA 4 and WahiPesa at Kibaoni which differed significantly (Table 5). The interactions in the number of panicles per unit area were observed to be significant at both lowland and upland rainfed ecosystems between sites and rice varieties (Tables 4 and 5).
The number of spikelets per panicle in the lowland rainfed rice ecosystem was not significantly different between Michenga and Lumemo sites and among varieties (Table 4). In the upland rainfed rice ecosystem,

204 Afr. J. Agric. Res.
Table 5. Grain yield and yield components of four selected rice cultivars grown in rainfed upland ecosystem under farmer and researcher field conditions.
Site (S) Varieties (V)
Grain yield
(t ha-1
)
Harvest index
(HI)
Total# Panicle
m-2
# Spikelet
panicle-1
# Fertile Spikelet panicle
-1
Fertility (%)
1000grain weight (g)
Kibaoni
NERICA1 4.35ab
0.21ef 164
ab 127
bc 88
bc 70.04
a 30.77
a
NERICA2 3.92b 0.19
ef 173
ab 114
c 78
c 69.17
a 29.74
a
NERICA4 5.39a 0.27d
e 198
a 129
bc 94
bc 72.85
a 29.44
a
WahiPesa 2.45c 0.16
f 114
b 108
c 72
c 67.12
a 30.05
a
ARI-KATRIN
NERICA1 4.00b 0.42
bc 170
ab 141
abc 88
bc 61.23
a 28.40
a
NERICA2 3.73b 0.46
ab 151
ab 164
ab 102
bc 62.02
a 24.46
bc
NERICA4 4.75ab
0.53a 170
ab 173
a 113
a 65.85
a 24.85
b
WahiPesa 1.83c 0.35
cd 114
b 137
abc 74
c 54.76
a 22.16
c
ANOVA V * * * * * NS *
S NS * NS * * NS *
S x V * * * * * NS *
*Indicate Significant at 5% level by ANOVA. NS indicate not Significant. Values followed by the same letter in a column within each treatment are not significantly different at P≤0.05. Kibaoni =Farmer field; ARI-KATRIN = Researcher field; S = site effects; V= varieties; (S × V) = Site and varieties interactions.
there was a significantly higher number of spikelets per panicle at ARI-KATRIN site ranging between 137 and 141 than at Kibaoni site with number of spikelets per panicle ranging between 108 and 129. There was no statistically significant difference among the varieties in the number of spikelets per panicle at Kibaoni and ARI-KATRIN (Table 5). The interactions in the number of spikeletes per panicle were significant in the upland rainfed ecosystem between sites and rice varieties (Table 5).
The fertile spikelets per panicle in the lowland rainfed ecosystem were not statistically different between Michenga farmer managed and Lumemo researcher managed sites (Table 4). However, there was a significant difference among rice varieties in the number of fertile spikelets per panicle at Michenga and Lumemo sites (Table 4).
In the upland rainfed rice ecosystem the number of fertile spikelets per panicle were significantly different between Kibaoni farmer managed and ARI-KATRIN researcher managed sites. At Kibaoni there were no significant differences in the number of fertile spikelets per panicle. While at ARI-KATRIN highly significant differences in the number of fertile spikelets per panicle was observed among the rice varieties (Table 5). NERICA4 had significantly higher number of fertile spikelets per panicle than all other upland rice varieties used, followed by NERICA2 and NERICA1, while WahiPesa was the least (Table 5). The interactions in the number fertile spikelets per panicle were observed to be significant at both lowland and upland rainfed ecosystems, between sites and rice varieties (Tables 4 and 5).
In the lowland rainfed ecosystem, the fertility percentage ratio was not significantly different between Michenga farmer managed site and Lumemo researcher managed site (Table 4). However, there were significant differences in fertility percentage ratio among the rice varieties at Michenga farmer managed site and Lumemo researcher managed site (Table 4). At both sites the local check Supa India indicated significantly lower fertility percentage ratio (Table 4). In the upland rainfed ecosystem, the fertility percentage ratio among improved rice varieties was not significantly different between Kibaoni farmers managed site and ARI-KATRIN researchers managed site (Table 5). The interactions in the fertility percentage ratio between sites and rice varieties were observed to be significant at both lowland and upland rainfed ecosystems (Tabls 4 and 5).
In the lowland rainfed ecosystem, 1000 grain weight was not significant different between Michenga farmers managed site and Lumemo researcher managed site (Table 4). There were varietal significant differences at both Michenga and Lumemo sites respectively (Table 4). TXD 306 variety had significantly the heaviest 1000 grains weights 33.8 and 33.3 g at Michenga and Lumemo sites, respectively. The local check Supa India variety indicated the lightest 1000 grain weight at both sites (Table 4).
In the upland rainfed ecosystem; a 1000 grain weights was significantly heavier at Kibaoni farmer managed site than at ARI-KATRIN researcher managed site (Table 5). At kibaoni, there was no significant differences between the rice varieties tested, while at ARI-KATRIN, NERICA1 had significantly heavy 1000 grain weight (28.4 g) than all other rice varieties, followed by NERICA4 (24.9 g),

Kitilu et al. 205
Table 6. Correlation coefficients between yield components and yield in selected lowland rice and upland rice varieties at different sites.
Parameter LUMEMO
Grain yields (t/ha)
MICHENGA
Grain yields (t/ha)
ARI-KATRIN
Grain yields (t/ha)
KIBAONI
Grain yields (t/ha)
Grain yields(t/ha) 1 1 1 1
1000 grain weight 0.58* 0.51* 0.64* -0.27
% grain filled ratio 0.55* 0.91** 0.98** 0.98**
fertile spk/panicle 0.97** 1.00** 0.88** 0.95**
spikelet/panicle 0.91** 0.85** 0.74** 0.92**
Panicles/m2 0.91** 0.52* 0.97** 0.96**
**Significant at P≤0.01, *significant at P≤0.05.
NERICA2 (24.5 g) and WahiPesa had the lowest 1000 grain weight (22.2 g) (Table 5). The interactions in a 1000 grain weight between sites and rice varieties were significant at the upland rainfed ecosystems (Table 5).
Correlation between yield and yield components of selected rice varieties
A highly positive correlation between yield components and grain yields of selected lowland and upland rainfed rice varieties was observed (Table 6), and the correlation varied significantly with sites location and the yield components. In the lowland rainfed rice ecosystem; the grain yields at Lumemo researcher managed site was highly correlated with the fertile spikelets per panicle, number of spikelet per panicle, and number of panicles per unit area. However, 1000grain weight and grain filled ratio percentage contributed less to the final yield differences between the rice varieties (Table 6). At Michenga farmer managed site, the yield correlated well with the fertile spikelets per panicle, the percentage grain filled ratio, and the number of spikelet per panicle (Table 6). While the number of panicles per unit area and a 1000 grain weights contributed less to the final yield differences among the rice varieties.
In the upland rainfed rice ecosystem, yield at ARI-KATRIN researcher managed site was highly correlated with the percentage grain fertility ratio, number of panicles per unit area, fertile spikelets per panicle and number of spikelet per panicle (Table 6), but a 1000 grain weight contributed less to the final yield differences among the rice varieties. At Kibaoni farmer managed site, the yield correlated well with the percentage grain filled ratio, number of panicles per unit area, fertile spikelets per panicle and number of spikelet per panicle (Table 6), but was negatively correlated to the 1000 grain weight (Table 6).
Yield gap analysis after implementation of selected GAPs in farmers’ fields Yield gap is defined as the difference between maximum
attainable yield and actual yield obtained by farmers. Maximum attainable yield refers to the highest yield that could be reached by a crop in a given environment. In the present study analyses of average yield obtained under farmers’ field management in comparison to the previous reported yield potentials by research institution and farmers’ realised yields (Table 7), which showed that, the yield gap particularly in the lowland rainfed rice ecosystem was reduced and in the upland the analysis showed a closed or excess yield were obtained.
In the lowland rainfed ecosystem the local check Supa India variety produced significantly higher grain yields under farmer field management in excess about 0.38 t/ha from the previous researchers yield potentials reported in ARI-KATRIN and Cholima Agro-Scientific Research Centers (2013), while the varieties Komboka, Tai and TXD 306 indicated reduction in the yield gap from between 2.2 and 2.8 t/ha previously reported gap from 0.2 to 0.9 t/ha in the present study (Table 7). While in the upland rainfed ecosystem, the gap analysis indicated that after application of the selected good agronomic practices the yields was significantly higher in farmers’ field. The local check WahiPesa variety produced an excess yield of about 1.65 t/ha from the initial farmers yield reported. All NERICA varieties produced excess yield of between 0.09 and 0.55 t/ha. Implying that the negative gap value meant the yield produced at farmers field were in excess of the potential yields reported by researchers (Table 1), for all the rice varieties investigated in the study (Table 7). DISCUSSION Agronomic traits perfomance In general, the agronomic performance of improved rice varieties both in lowland and upland ecosystem was earlier in terms of 50% flowering and 90% physical maturity than the local check traditional varieties selected by farmers. These finding were in line with those of Heuer et al. (2003), who found better agronomic performance of Oryza sativa (IR 64) × Oryza glaberrima (TOG5681)

206 Afr. J. Agric. Res.
Table 7. Yield gap analysis between potential yield and farmers realised yieldafter using of selected GAPs for the yield performance study in Ifakara.
Varieties analysed
Average initial
yield potential
(t/ha)
Average
Initial farmer
yield (t/ha)
Previous
yield gap
t/ha (%)
Present
Farmer yield
(t/ha)
Present
yield gap
(t/ha)
Supa India 2.5 1.0 1.5 (60.0) 2.88 -0.38
Komboka 5.8 3.5 2.3 (39.7) 5.26 0.54 (9.3)
Tai 6.2 4.0 2.2 (35.5) 6.00 0.20 (3.2)
TXD 306 7.8 5.0 2.8 (35.9) 6.86 0.94 (12.1)
NERICA1 3.8 2.8 1.0 (26.3) 4.35 -0.55
NERICA2 3.5 2.5 1.0 (28.6) 3.92 -0.42
NERICA4 5.3 4.0 1.3 (24.5) 5.39 -0.09
WahiPesa xx- 0.8 xx 2.45 -1.65
Highlighted number in brackets are percentage (%) yield gap, and the highlighted negative value is the excess yields in t/ha, referring that the yield gap was closed and excess yield was obtained.
interspecific progenies within Back cross one (BC1) and Back cross two (BC2) populations compared to their O. sativa parent in irrigated lowland conditions in the Sahel. However, the upland rice varieties tested in the present study were the earliest in flowering and maturing, therefore are suitable for areas with short growing seasons due to short growth duration compared to the lowland rice varieties investigated by the present study. Yield and yield components traits The higher performance in total biomass yield of improved rice varieties (Figure 3A and 3B) in the present study were associated with higher productivity of selected rice varieties, the varieties with the highest accumulated shoot dry weight had the highest grain yields (Tables 4 and 5). Similar findings were reported by Yun et al. (1997), that the superior yield of Japonica indica hybrids was associated with the higher capability of reserve formation under the upland condition. Higher total biomass accumulation characteristics in all improved rice varieties investigated in this study were also in line with the results by Katsura et al. (2007), who reported rice yield mainly depends on ability of dry matter production of the variety. Thus low number of tillers was responsible for the reduction in total biomass yield of farmers selected varieties Supa India and WahiPesa varieties under lowland and upland rainfed ecosystem.
In the present study, the grain yield of improved lowland and upland rainfed rice varieties were significantly higher than the local check varieties both at farmers and researchers’ fields (Tables 4 and 5). Higher yielding varieties are responsive to fertilizer application, in the present study use of 80 kgN/ha of nitrogen fertilizer applied at the effective tillering stage, increased the yields in farmers’ field condition relatively the same as that of researcher managed fields. These findings were in
partial agreement with those of Meertens et al. (2003) and Fageria et al. (2006) who reported that use of fertilizer application in fields increased the grain yield of rainfed rice ecosystem. Moreover, broadcasting seeds as the traditionally ways of sowing seeds used by most farmers in rainfed rice ecosystem has been reported to give low plant population and as a misuses of land resources, which leads to low yields (GRiSP, 2013). Therefore, sowing seeds or planting in spacing of 20 cm × 20 cm used in the present study for all rice varieties investigated increased tremendously the yields of farmers field relatively same as that obtained by the researcher fields, making the production in farmers fields attain the yield potentials established by research institution. These results were in partial agreement to those reported by Zaman et al. (2013) who found that the yields of spacing of 30 × 15 cm was higher compared to the grain yield in spacing 30 × 20 cm which had lower plant population per unit area.
The rice performance in both lowland and upland rainfed ecosystems investigated in terms of grain yields and yields components was found to vary considerably with rice genotypes and sites. Yoshida et al. (2006) and Matsunami et al. (2009) reported positive correlations between grain yields and number of spikelets per panicle when evaluating the high yielding varieties in lowland and upland ecosystem. These results are in partial agreement with the findings of the present study, whereby the high yields of improved and local check varieties were highly correlated with the number of spikelet per panicle. Moreover, the number of harvestable tillers is as good as the number of panicles per plant and according to Zou et al. (1991) tillering capacity of varieties is one of the most important characters determining yield potentials. These findings are in partial agreement to the present findings in which the number of panicles per unit area was proportional to the number of effective tillers per plant. Thus, the number of panicles per plant was among the

yield parameters responsible in determining yields of the selected rainfed rice varieties in both upland and lowland rainfed rice ecosystem (r = 0.96** and 0.97**) in the upland rice at Kibaoni and ARI-KATRIN respectively, and in the lowland rice (r = 0.52* and 0.91**) at Michenga and Lumemo sites. Yield gap narrowing or bridging Understanding the small-scale farm production constraints is essential in designing intervention plans and targeting to boost smallholder farm yield output (Arias et al., 2013). As specific constraints dictate the productivity and yield potential of different regions, region-specific management changes and interventions are required to close the observed yield gap (Mueller et al., 2012). The yield performance analysis of selected rice varieties under lowland and upland ecosystem in the present study showed that after application of the provided good agronomic practices (GAPs) such as improved rice varieties, spacing of 20 cm × 20 cm, sowing seeds in line (or in rows), two weeding times, and 80 kgN/ha urea fertilizer application bridged the yield gaps for some of the rice varieties investigated and reduced in others. The farmers yield increased significantly in both lowland and upland rainfed rice ecosystems relatively same as that of the researchers (Tables 4 and 5). Thus, good field crop management is an important key in rice production and was responsible in bridging the yield gaps between farmers and researchers yields. These observations are in line with those reported by Affholders et al. (2016) who analysed the yield gaps of various crops and found that the share of yield variation due to crop management was greater or equal to the share of yield variation due to the main climatic drivers of crop production, and that variation in soil fertility, weed infestation and agronomic management were factors that explains the yield gaps.
In the lowland rainfed ecosystem application of GAPs increased the yield and narrowed the yield gaps previous reported. For example, the yield gap in TXD 306 variety the gap dropped from 35.9 to 12.1% yield gap remained between farmers’ realised yields and the researcher yield potentials. It is therefore that 23.8% gap reduction realized yields in the study. Komboka variety indicated about 30.4% gap reduction, and narrowed the previously yield gap reported from 39.7 to 9.3% yield gap. Tai variety had the highest percent of reduction in yield gap from 35.5% yield gap previously reported in previous study to 3.2% yield gap remained in this study. This is about 32.3% reduction in the yield gap from the previous one. However, the local check variety Supa India in this study produced higher yield than the potential yield reported, and therefore the application of good agronomic practices used found to bridge the gap existed between farmers and researchers yields and gave excess yield of0.38 t/ha (Table 7).
Kitilu et al. 207 The yield gaps of 24.5 to 28.6% previously reported between farmers realized yield and researchers yield potentials in the upland rainfed rice ecosystem was found to drop to zero and excess yield were observed in all improved NERICA rice. The local check WahiPesa rice variety also produced excess yield about 1.7 t/ha comparing to the reported yields under farmers (Table 7). Conclusion The study revealed that the yield performance of lowland rainfed rice varieties was higher than that of the upland rainfed rice varieties at farmers and researcher managed fields. The performance of all improved lowland and upland rice varieties at farmers and researchers managed sites were significantly higher compared to the local check varieties (Supa India and WahiPesa) selected by farmers.
The GAPs applied in the study narrowed the yield gap from 35.5 to 60% in lowland rainfed rice from 3.2 to 12.1% , while in the lowland local check variety Supa India was closed and excess yield of about 15.2% was realized. The GAPs in the upland rainfed rice ecosystem bridged or closed the yield gap and excess yield in all the improved upland varieties was obtained, while the local check WahiPesa yielded 1.7 t/ha in excess of the previous reported yields was obtained.
Thus, it was recommended that, provisioning farmers with GAPs such as improved rice varieties, plant spacing of 20 cm × 20 cm, early weeding and recommended fertilizer application accompanied with farmers supervision in field management, enhanced the high productivity and narrowed the yield gap that existed between farmers realised yields and researchers’ yields potentials in rainfed rice ecosystems in Ifakara. CONFLICT OF INTERESTS The authors have not declared any conflict of interests. ACKNOWLEDGEMENTS
The authors thank Joshua’s Family and the University of Dar es salaam (UDSM) for providing funds to the first author to study at the University of Dar es Salaam. REFERENCES Affholder F, Poeydebat C, Corbels M, Scopel E, Tittonell P (2016). The
yield gap of major food crops in family agriculture in the tropics: Assessment and analysis through field surveys and modelling. Field Crop Research 143:106-118.
Arias P, Hallam D, Krivonos E, Morrison J (2013). Smallholder integration in changing food markets. Food and Agriculture Organization of the United Nations Rome 45 p.
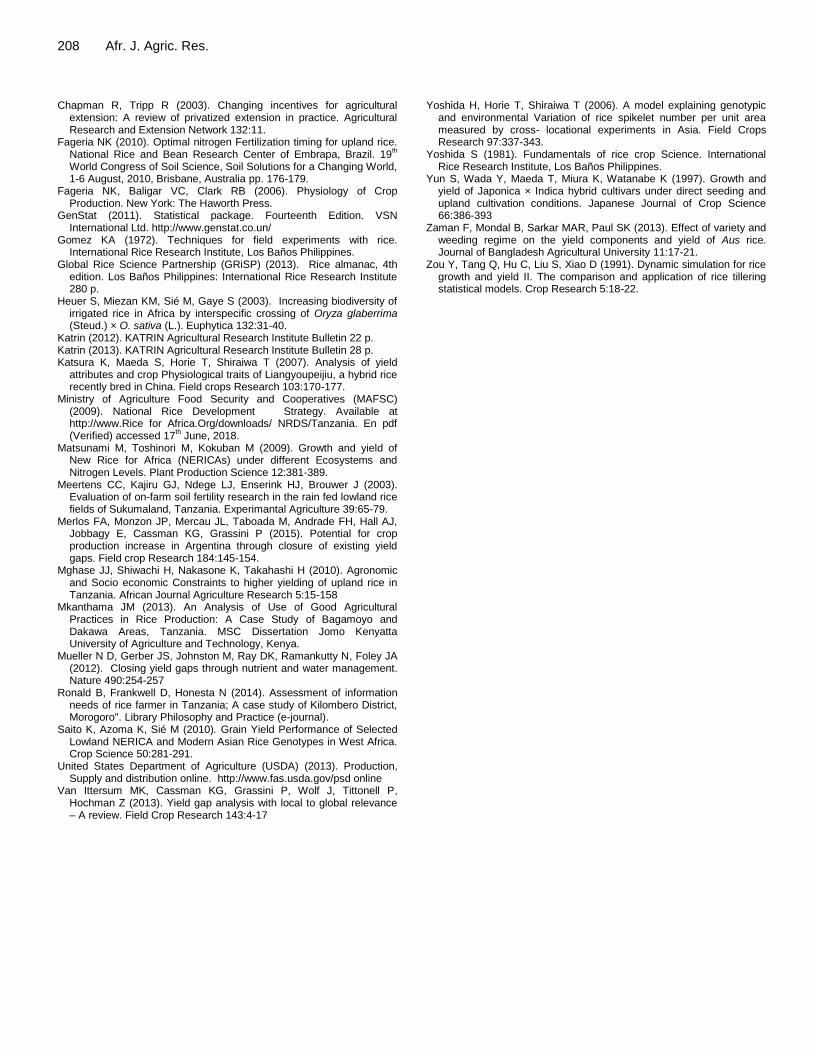
208 Afr. J. Agric. Res. Chapman R, Tripp R (2003). Changing incentives for agricultural
extension: A review of privatized extension in practice. Agricultural Research and Extension Network 132:11.
Fageria NK (2010). Optimal nitrogen Fertilization timing for upland rice. National Rice and Bean Research Center of Embrapa, Brazil. 19
th
World Congress of Soil Science, Soil Solutions for a Changing World, 1-6 August, 2010, Brisbane, Australia pp. 176-179.
Fageria NK, Baligar VC, Clark RB (2006). Physiology of Crop Production. New York: The Haworth Press.
GenStat (2011). Statistical package. Fourteenth Edition. VSN International Ltd. http://www.genstat.co.un/
Gomez KA (1972). Techniques for field experiments with rice. International Rice Research Institute, Los Baños Philippines.
Global Rice Science Partnership (GRiSP) (2013). Rice almanac, 4th edition. Los Baños Philippines: International Rice Research Institute 280 p.
Heuer S, Miezan KM, Sié M, Gaye S (2003). Increasing biodiversity of irrigated rice in Africa by interspecific crossing of Oryza glaberrima (Steud.) × O. sativa (L.). Euphytica 132:31-40.
Katrin (2012). KATRIN Agricultural Research Institute Bulletin 22 p. Katrin (2013). KATRIN Agricultural Research Institute Bulletin 28 p. Katsura K, Maeda S, Horie T, Shiraiwa T (2007). Analysis of yield
attributes and crop Physiological traits of Liangyoupeijiu, a hybrid rice recently bred in China. Field crops Research 103:170-177.
Ministry of Agriculture Food Security and Cooperatives (MAFSC) (2009). National Rice Development Strategy. Available at http://www.Rice for Africa.Org/downloads/ NRDS/Tanzania. En pdf (Verified) accessed 17
th June, 2018.
Matsunami M, Toshinori M, Kokuban M (2009). Growth and yield of New Rice for Africa (NERICAs) under different Ecosystems and Nitrogen Levels. Plant Production Science 12:381-389.
Meertens CC, Kajiru GJ, Ndege LJ, Enserink HJ, Brouwer J (2003). Evaluation of on-farm soil fertility research in the rain fed lowland rice fields of Sukumaland, Tanzania. Experimantal Agriculture 39:65-79.
Merlos FA, Monzon JP, Mercau JL, Taboada M, Andrade FH, Hall AJ, Jobbagy E, Cassman KG, Grassini P (2015). Potential for crop production increase in Argentina through closure of existing yield gaps. Field crop Research 184:145-154.
Mghase JJ, Shiwachi H, Nakasone K, Takahashi H (2010). Agronomic and Socio economic Constraints to higher yielding of upland rice in Tanzania. African Journal Agriculture Research 5:15-158
Mkanthama JM (2013). An Analysis of Use of Good Agricultural Practices in Rice Production: A Case Study of Bagamoyo and Dakawa Areas, Tanzania. MSC Dissertation Jomo Kenyatta University of Agriculture and Technology, Kenya.
Mueller N D, Gerber JS, Johnston M, Ray DK, Ramankutty N, Foley JA (2012). Closing yield gaps through nutrient and water management. Nature 490:254-257
Ronald B, Frankwell D, Honesta N (2014). Assessment of information needs of rice farmer in Tanzania; A case study of Kilombero District, Morogoro". Library Philosophy and Practice (e-journal).
Saito K, Azoma K, Sié M (2010). Grain Yield Performance of Selected Lowland NERICA and Modern Asian Rice Genotypes in West Africa. Crop Science 50:281-291.
United States Department of Agriculture (USDA) (2013). Production, Supply and distribution online. http://www.fas.usda.gov/psd online
Van Ittersum MK, Cassman KG, Grassini P, Wolf J, Tittonell P, Hochman Z (2013). Yield gap analysis with local to global relevance – A review. Field Crop Research 143:4-17
Yoshida H, Horie T, Shiraiwa T (2006). A model explaining genotypic
and environmental Variation of rice spikelet number per unit area measured by cross- locational experiments in Asia. Field Crops Research 97:337-343.
Yoshida S (1981). Fundamentals of rice crop Science. International Rice Research Institute, Los Baños Philippines.
Yun S, Wada Y, Maeda T, Miura K, Watanabe K (1997). Growth and yield of Japonica × Indica hybrid cultivars under direct seeding and upland cultivation conditions. Japanese Journal of Crop Science 66:386-393
Zaman F, Mondal B, Sarkar MAR, Paul SK (2013). Effect of variety and weeding regime on the yield components and yield of Aus rice. Journal of Bangladesh Agricultural University 11:17-21.
Zou Y, Tang Q, Hu C, Liu S, Xiao D (1991). Dynamic simulation for rice growth and yield II. The comparison and application of rice tillering statistical models. Crop Research 5:18-22.

Vol. 14(4), pp. 209-217, 24 January, 2019
DOI: 10.5897/AJAR2018.12989
Article Number: 90A5ACB59991
ISSN: 1991-637X
Copyright ©2019
Author(s) retain the copyright of this article
http://www.academicjournals.org/AJAR
African Journal of Agricultural
Research
Full Length Research Paper
Food Barley Land races Characterization in the Northwestern Highlands of Ethiopia
Daniel Tadesse*, Wuletaw Mekuria, Beyene Derso and Tazebachew Asres
College of Agriculture and Rural Transformation, University of Gondar, Ethiopia.
Received 12 January, 2018; Accepted 10 April, 2018
Barley is an important crop for the North Gondar highlands of Amhara Region, Ethiopia. To assess the characterization of barley landraces, 180 farmers from six villages in three districts of north Gondar zone were selected and surveyed. With regard to distribution status, most of the recorded landraces of barley were endangered. The main end uses of barley in the study area were kolo, beso, tela, injera, korefe, kita and kinche. According to farmers, the main criteria for selecting a variety were varietal characteristics mainly in the pre-harvest operation. The main characteristics for doing so are length of the spike, size of the seed, amount of seed per spike, ability to withstand disease, stand of the plant, tillering ability, number of rows, and germination ability. The majority of farmers renew the seed mostly between 1 and 3 years. The main reasons for renewing are production decline, to prevent landraces from elimination and to increase productivity. The majority of the farmers stated that they do not store seeds for long period of time associated with the fact that they hardly produce any surplus that can be stored for longer years. In barley production, women have roles of joint decisions on number and types of varieties to grow, plot allocation, and storage. However, postharvest processing is mainly decided by women. Farmers have proverbs associated with how much women are important in saving and maintaining barley landraces and make ready when the need arises. Hence, barley genetic resources should be conserved before they are lost and farmers’ variety selection criteria should be incorporated in the modern breeding of barley. The active involvement of women in the maintenance and improvement of landraces should not be undermined in the modern crop improvement programs. Key words: Ethiopia, barley, landrace, characterization, traits.
INTRODUCTION Local knowledge of landraces/farmer‟s varieties develops over generations of first-hand observation of crucial features, their appearance and performance in a variety of environments, through good and bad rainy seasons
(Guarino, 1995). Extended and continuous cultivation as well as maintenance and use of indigenous crop varieties by local farmers have led them to better understand the traits; environmental requirements (soil qualities, rainfall,
*Corresponding author. E-mail: [email protected].
Author(s) agree that this article remain permanently open access under the terms of the Creative Commons Attribution
License 4.0 International License

210 Afr. J. Agric. Res. altitude, temperature, etc.), special features of productivity and post harvest processes as well as the special utility values of the varieties have carefully been maintained for years in a very innovative way both as individuals and as members of an interacting community (Asfaw, 1997).
Access to a range of crop genetic variability is critical to the success of breeding programs and consequently to food security and human nutrition (Toledo and Burlingame, 2006). Landraces are considered more locally adapted and genetically variable than modern cultivars (Ceccarelli and Grando, 2000). They contribute to agricultural production around the world, particularly for the rural poor in marginal environments as source of seed for next season planting (Ceccarelli and Grando, 2000). Farmers make crop maintenance decisions based on combinations of factors including adaptability, yield, socio-cultural values and food traditions as well as nutritional values. These decisions affect the genetic diversity of crop populations (Ranjil, 2010). Farmers‟ maintenance approaches have allowed the continual evolution of landraces diversity in their area of adaptation. This diversity has been the key to food security for generations and an invaluable resource for crop improvement activities around the world.
The value of the evolutionary services delivered by on-farm conservation, while grounded at the community level, is connected to broader social and ecological landscapes where diverse landraces are maintained by different farming communities and interlinked to various degrees through seed systems (Samberg et al., 2013). These landraces are distributed across different types of environments, thus facing diverse selection pressures from environmental factors as well as from human management and preferences.
Smallholder farmers, both men and women, continuously carry out experimentation on the crops grown in their locality based on gastronomic criteria (Oosterhout, 1993) and storability (Teshome et al., 1999) as well as agro-morphological characters. While performing various field activities, farmers carry out evaluation progressively to assess the performance of the crops throughout the growing period (Berg, 1993). Small-scale farmers‟ choose to grow more than one variety of a given crop simultaneously reflecting their need to address numerous concerns, which no single variety would satisfy (Bellon, 1996). Farmers have multiple concerns that are reflected in multiple criteria for selection and variety ranking. Thus, farmer‟s management of their varieties and their role in seed selection activities are crucial to agricultural production, conservation and enhancement of the genetic resources. Farmers often noted varieties that had become „„tired‟‟ and needed replacing; they gave their tired seed to farmers in cooler and more fertile areas for multiplication (Almekinders et al., 1994).
The culinary and varietal preferences, generally
maintained by women, have a major influence on knowledge, selection, and use of agricultural biodiversity (Howard, 2003). Researchers are now finding that women‟s contribution is greater than previously perceived. In the literature, few studies investigate specifically the role of women in seed processing, storage, and exchange. Other researchers have focused on specific aspects of women‟s work in seed management, such as selection (Mulatu and Zelleke, 2002). However, the gender dimensions in the intra household decision-making process were seldom addressed in seed management research.
There are a number of studies that deal with how local farmers manage their seed, select varieties, renew tired seeds and decision making of the varieties in the family. An experiment conducted at Koga of West Gojjam Zone in Ethiopia confirmed diversity among 49 malt barley genotypes (Tilahun and Alemu, 2017). Many studies have shown that farmers in developing countries have intimate knowledge of environmental processes and make rational resource management decisions based on that knowledge (Olango et al., 2014). Although the northern Gondar highlands are potential barley production areas and harbor great diversity of land races, there is no documented study. For this reason, it is important to study and document diversity of barley, farmers‟ variety selection criteria, management of seeds, renewal of tired seeds, contribution of barley in the livelihood, local seed exchange systems and intra-household decision making systems. MATERIALS AND METHODS Description of the study areas North Gondar zone is selected for the following reasons: (i) barley is one of the first food crops in the zone in terms of area coverage, production and importance, (ii) the zone is one of the micro-center of diversity for barley, and hence ideal sites for studying. In North Gondar, the highland districts of major barley producers are Wogera, Dabat, Debark, Janamora, Lay Armachiho, and Gondar Zuria. Among these six districts three of them namely Wogera, Dabat and Debark were selected purposively due to high production potential. Six kebeles, Adisgie Miligebsa and Gomia from Debark, Woken and Talak mesik from Dabat and Daber Lideta and kossoye from Wogera were selected purposively for the purpose of study. In order to assess on farm characterization barley landraces, survey research was undertaken. These were semi-structured interviews (a household survey through structured questionnaire) and focused group discussion.
Research design The design of the study was non-experimental types based on various data collection methods. With respect to the objectives and nature of the research questions of the study, both qualitative and quantitative data collection methods were employed.
The survey design consisted of three stages. In the first stage, three study districts were purposively selected in consultation with North Gondar Zone Department of Agriculture and Field

Observations. The three representative districts (Debark, Dabat and Wogera) were purposively selected from the potential barley producing districts of the zone in terms of large coverage for barley. In the second stage, two villages were purposively selected from each district in consultation with district agricultural experts with the major criteria being higher importance of barley in terms of area coverage and consumption preference. Finally, respondent households were selected randomly in each kebele in probability proportional to size.
In the third stage, 180 farmers were selected by equal distribution method which means 60 from each districts or 30 household heads were randomly selected from a list of farmers in each selected Kebeles. Women household heads and elders were purposely involved to ensure the representativeness or household diversity in terms of knowledge and seed management.
Both qualitative and quantitative data types were collected in this study. The data used were collected from both primary and secondary sources. Informal and formal surveys were used to collect the primary data. The informal survey was conducted through focus group discussions, interviewing key informants and development agents. The discussions were entirely participatory. The structured and semi-structured questionnaire were pre-tested and used to perform the formal survey. An interval schedule was pre-tested and necessary amendments were made. In the formal survey, farmers were interviewed by the pre-tested questionnaire after interpreted to the local language (Amharic). The survey was conducted from February to March, 2016. Six enumerators who had the local knowledge and language were trained and recruited. The trained enumerators under the supervision of the researcher interviewed those sampled farmers.
At the household level, information were collected on reasons for selecting a variety over the others, when in the seed and varietal selection take place, how seed of barley is renewed and replaced and role of women in barley production. The respondent farmers were also asked to list all the varieties they know, classify and evaluate their varieties based on their name, number of rows, meanings, preferred/non preferred characteristics and uses. Sayings associated with barley were documented. In addition, respondents classified their varieties as popular (abundant), rare, and endangered on the basis of area shared yields of varieties. „„Popular‟‟ is defined as those varieties grown by many households over large areas. „„Rare‟‟ types are those grown by few households on very small plots, and „„endangered‟‟ types are grown either in mixed cultures or by only a few households in neighboring kebeles.
Key-informant interviews were conducted with development agents of the districts. Focus-group discussion was conducted with selected farmer groups, especially elders and female heads to document farmers‟ knowledge of the barley varieties and their ranking preference. The issue of women‟s role in seed management was addressed not only during the household survey but also in the group discussions.
RESULTS AND DISCUSION Farmers’ choice of barley varieties Farmers in the study districts purposely maintain landraces to address various needs. The main traits farmers use to prefer a given variety over the other were maturity, yield potential, suitability for animal feed, grain size, grain color, spike length, tillering capacity, market demand, condition of the soil and product volume. According to Eticha et al. (2008), the selection criteria for landraces of barley reflect adaptations to changing
Tadesse et al. 211 farming conditions, and responses to the socio-economic and cultural factors that shape farmers priorities. With regard to distribution status, most of the recorded landraces of barley were endangered, some are rare and only three varieties are popular (Table 1). This indicates that the need for conservation of the landraces found in the farmers‟ hand. Diversity in end-uses is one of the important factors that influence the maintenance and genetic diversity of a particular crop. Different landraces are preferred for specific end-use. The main end uses of barley in the study area were kolo, beso, tela, injera, korefe, kita and kinche. A study made on enset showed that the biggest uses of landraces are for kocho, bulla, amicho, fiber and medicine (Zerihun et al., 2016). A study made on wheat indicated a wide range of variations among landraces for the traits studied which help farmers with an opportunity to make a choice of genotypes that fit their purpose (Zewdie et al., 2014).
Kolo is roasted grain prepared from dehulled barley. Beso is solid food prepared from roasted barley flour and water. Tela is alcoholic beverage prepared from gesho, malt, roasted grain and kita. Tela is the most common and preferred local beverage which is made mainly from barley. Injera is leaven bread made from raw grain flour with the dough fermented for 2 to 4 days and baked on clay pan. Korefe is alcoholic beverage prepared from gesho, malt and lightly roasted barley grain and kita. The study district inhabitants drink korefe early in the morning and it act as a food though it is a beverage. Kita is instant bread baked from unfermented dough of raw grain flour. Kinche is a dish prepared from cracked raw barley grains. Most of the landraces are suitable for kolo, beso, tela, and injera. The preferred landraces for korefe are Derg gebs, Weremenie, Semeno, Andita and Nech gebs. Abat gebs, Tegedie belga and Nech gebs are the preferred landraces for kita. The landrace Tegedie belga is preferred for kinche. Kinche is not a common diet for north Gondar highlands.
According to farmers‟ response, the choice to select a variety depends on a number of factors including seasonal condition, varietal characteristics, multiple uses, market demand, a combination of the aforementioned factors and other reasons as well. Of these, varietal characteristics (31.7%) play the major role (Table 2).
Farmers may undergo seed and variety selection during different stages of the plant. They stated that, seed and varietal selection occur during pre harvest (45%), post harvest (35.6%) and both pre-harvest and post-harvest (19.4%). During post harvest, seed may be selected before threshing, during threshing, after threshing, during storage and a combination of the above. Almost half (54.5%) of the respondents select seed after threshing (Table 3).
The traits mainly used by farmers to select barley varieties in the field (pre harvest) are length of the spike, size of seed, amount of seed per spike, ability to withstand disease, stand of the plant, tillering ability,

212 Afr. J. Agric. Res. Table 1. Characteristics of major barley varieties in relation to preferred and non preferred traits.
Variety name Distribution status Preferred traits Non preferred traits End uses
Teklie gebs Rare Early maturing; suitable for variety of soil types; palatable straw quality; high-medium grain yield
Attacked by birds; lodging problem
Kolo, beso
Derg gebs Endangered High-medium grain yield; early maturity; large grain size; palatable straw quality
More straw; low flour; prefers fertile soil
Korefe, beso, kolo
Woremene Rare
Early maturity; high product volume; long spike; drought tolerant;
palatable straw quality
Low grain yield; prefers fertile soil; not palatable for injera
Injera, beso, korefe, kolo
Semeno Endangered Long spike; high tillering capacity; high grain yield;
palatable straw quality; early maturing
More awns and less flour; short stature
Injera, tela, kolo, korefe, beso
Andeta Endangered The product is good both by its quantity and quality; demanded by market; long spike; mature early
Small flour; more awns; straw is not palatable; shattering problem during harvest; attacked by birds
Korefe, kolo, injera, tela, beso
Abat gebs Endangered/Rare High grain yield; long spike; palatable straw quality; tolerates water logging; mature early
Prefers fertile soil; more awns and less yield
Kita, tela, injera, kolo
Nech gebs Endangered/Rare Demanded by market specially by its color; not attacked by birds; taller in height; high grain yield
Sensitive to lodging; does not need heavy rain; sensitive to frost and weed; prefers fertile soil
Beso, kolo, korefe, injera
Awura gebs Rare High grain yield; palatable for food More awns; small flour Injera, beso, kolo
Shegie gebs Rare Demanded by market mainly by the color of its grain; long spike
Low grain yield; lodging problem
Beso, tela
Netela belga Rare/Popular Early maturity; drought tolerant//drought relief crop/; suitable for double cropping
More awns; low grain yield
Tela, injera, kolo
Shewa gebs Endangered High yielder; long spike; tolerant to frost; white seed Small product volume; late maturity; prefers fertile soil
Injera, tela
Akiya/senef kolo Endangered/Rare High yielder; used mainly for kolo; early maturing; frost tolerant
Single row; prefers fertile soil Kolo

Tadesse et al. 213 Table 1. Contd.
Tikur gebs Endangered/Rare High yielder; tolerate wind and frost; preferred for tela Not preferred by market and is cheap; prefers fertile soil; injera is black; more awns
Kolo, tela, injera
Bozie belga Popular/Rare Early maturity; tolerate frost and drought Not preferred by market; more awns
Tela, beso
Marwey Rare Early maturing; preferred by the market Prefers fertile land; needs fertilizer
Tela, injera, animal feed
Belga Rare Grow over large area; high yielder; early maturing The product is not quality since attacked by weed
Injera, beverage, animal feed
Tegedie belga Popular Early maturing; withstand frost and heavy rain by bending the spike down; long spike
Low yielder; the injera is hard
Tela, kolo, injera, kita, kinche, beso
Dinble nech gebs Rare High yielder; early maturing; tolerate to wind, frost, drought
Prefers fertile soil Injera, Tela, kita, kolo
Table 2. Choice to select a variety.
Reason to select and plant a given variety N %
Seasonal condition 22 12.2
Varietal characteristics 57 31.7
Multiple use 30 16.7
Market demand 23 12.8
Seasonal condition and multiple use 6 3.3
Varietal characteristics and multiple use 12 6.7
Other reason 5 2.8
Seasonal condition, varietal characteristics, multiple use and market demand 25 13.9
Total 180 -
number of rows, and germination ability. They also used the traits early maturity, ability to withstand wind, ability to withstand drought,
inability to be attacked by birds, color of the seed, and weight of spike into consideration when selecting barley varieties.
The traits mainly used by farmers to select barley varieties after harvest but before threshing are weight of seed, length of the spike, ability to

214 Afr. J. Agric. Res.
Table 3. Seed and variety selection.
Stage in the crop for undertaking seed and varietal selection N %
Pre- harvest 81 45.0
Post- harvest 64 35.6
Both pre-harvest and post-harvest 35 19.4
Total 180 -
Seed and varietal selection during postharvest
Before threshing 14 14.1
During threshing 9 9.1
After threshing 54 54.5
During storage 10 10.1
Before threshing, during threshing, after threshing and during storage 10 10.1
During threshing, after threshing and during storage 2 2.1
Total 99 -
Table 4. Renewal of seed.
Renewal/Replacement of seeds N %
Yes 165 91.7
No 15 8.3
Total 180 100.0
Frequency of renewal of seeds
1-3 years 135 81.8
4-6 years 27 16.4
7-10 years 3 1.8
Total 165 -
withstand shattering during harvest, number of rows, not damaged by disease, and having large harvested products per a given area. The traits mainly used by farmers to select barley varieties during threshing are ability of the seed to immediately separate from the husk by using cattle threshing and wind, weight of the seed, quality of the product (without husk), usability of the byproduct for feed, length of the spike, having uniform size and color of the seed.
The traits mainly used by farmers to select barley varieties after threshing are weight of the seed, quality of the seed for various purposes, quality of the floor, size of the seed, uniformity of the seed, purity of the seed, and color of the seed. The traits mainly used by farmers to select barley varieties during storage are inability to be damaged by various means (like pests, diseases), weight of the seed by checking with their hand, ability to store for
long period of time without damage, quality of the seed, and amount of the floor during milling.
Although farmers may select barley varieties at different stages of the growth, they give more attention to some traits more than others. The main traits are suitability for food, high yield potential, early maturity, suitability for feed, many end uses, large number of rows (4-6) and tillering ability. In order to differentiate one landrace from another, farmers use a variety of traits. The main traits are maturity, yield, number of rows, suitability for feed, spike length, and seed color.
The majority of farmers (91.7%) renew seed while some (8.3%) do not renew seed. From those that renew seed, seed renewal mostly occurs between 1 and 3 years (Table 4). Farmers stated that the main reasons to renew barley landraces are when the ability to give product decline, in order to prevent landraces from elimination, to
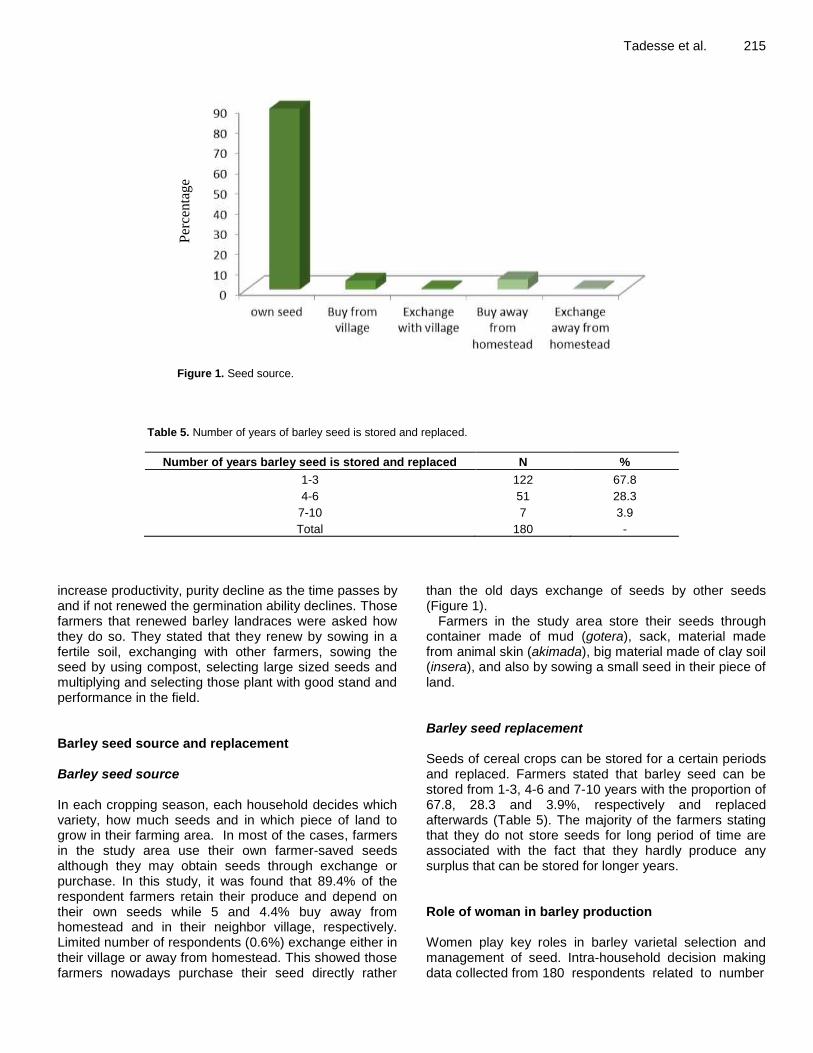
Tadesse et al. 215
Per
cen
tag
e
Figure 1. Seed source.
Table 5. Number of years of barley seed is stored and replaced.
Number of years barley seed is stored and replaced N %
1-3 122 67.8
4-6 51 28.3
7-10 7 3.9
Total 180 -
increase productivity, purity decline as the time passes by and if not renewed the germination ability declines. Those farmers that renewed barley landraces were asked how they do so. They stated that they renew by sowing in a fertile soil, exchanging with other farmers, sowing the seed by using compost, selecting large sized seeds and multiplying and selecting those plant with good stand and performance in the field. Barley seed source and replacement Barley seed source In each cropping season, each household decides which variety, how much seeds and in which piece of land to grow in their farming area. In most of the cases, farmers in the study area use their own farmer-saved seeds although they may obtain seeds through exchange or purchase. In this study, it was found that 89.4% of the respondent farmers retain their produce and depend on their own seeds while 5 and 4.4% buy away from homestead and in their neighbor village, respectively. Limited number of respondents (0.6%) exchange either in their village or away from homestead. This showed those farmers nowadays purchase their seed directly rather
than the old days exchange of seeds by other seeds (Figure 1).
Farmers in the study area store their seeds through container made of mud (gotera), sack, material made from animal skin (akimada), big material made of clay soil (insera), and also by sowing a small seed in their piece of land. Barley seed replacement Seeds of cereal crops can be stored for a certain periods and replaced. Farmers stated that barley seed can be stored from 1-3, 4-6 and 7-10 years with the proportion of 67.8, 28.3 and 3.9%, respectively and replaced afterwards (Table 5). The majority of the farmers stating that they do not store seeds for long period of time are associated with the fact that they hardly produce any surplus that can be stored for longer years. Role of woman in barley production Women play key roles in barley varietal selection and management of seed. Intra-household decision making data collected from 180 respondents related to number

216 Afr. J. Agric. Res.
Table 6. Intra household decision making (%) on barley production activities.
Intra household decision making Number of
varieties
Type of
varieties
Plot
allocation Storage
Postharvest
processing
Women 1.1 1.7 2.8 41.1 49.3
Men 12.8 20.0 29.4 4.4 3.4
Both 86.1 78.3 67.8 54.5 47.3
and type of varieties to grow, plot allocation, storage and postharvest processing is presented in Table 6.
The decisions on number of varieties to grow (86.1%), types of varieties to grow (78.3%), plot allocation (67.8%), and storage (54.5%) were mostly decided jointly (Table 6). However, postharvest processing is largely decided by women (49.3%). This result is mainly in agreement with Fetien et al. (2008) who stated that number of varieties to grow and plot allocation were mainly decided by both while post harvest processing is decided mainly by women. This result showed that though farming is mainly believed to be mainly the work of men; most decisions are made jointly by husband and wife. Though the type of variety to sow is decided jointly, in the focus group discussion they stressed that where to sow the different varieties varies between the two groups. Women usually want early maturing varieties to be sown near their home so that they will use it for hunger relief. They also consider whether they have program in the coming season or not and base their variety choice to sow. On the other hand, men give priority to sow their barley plot of land with no weed infestation, accessible for keeping away from birds attack and animal damage, and an area where there is another barley crop in the vicinity. Men believe that if there is another crop in the vicinity, damage caused by birds will be minimized and they will have common threshing ground.
From our focus group discussion, the role of women in seed management and sayings associated with them are discussed as follows. “If there is no woman, there is no barley.” This is to show that women play a role in conservation of barley. “The beauty of barley relies on woman.” This is to show that women make barley ready for various purposes. “Intelligent women say to her husband that there is no barley to eat in order to keep secretly for sowing purpose.” This is to show that women keep seed for sowing purpose rather than using the whole product for food or sale for market. “The owner of barley is woman.” This is to show that women make barley whatever she wants. “If summer is not coming all are houses, if May is not coming all are wives.” This is to show that an intelligent wife is the one who keep seed and deliver to her husband for sowing purpose. “The use of barley and wife is clearly shown in the kitchen.” This is to show that barley is used for so many things prepared in the kitchen and at the same time wife in the kitchen covers everything. “Good wife is icon for her husband.”
This is because the wife saves seed and delivers when the need arrives. It will not cause the husband to suffer when the need for barley arises during the sowing time. All the aforementioned sayings show how much women are important in saving and maintaining barley and make ready when the need arises. CONCLUSION AND RECOMMENDATION Farmers purposely maintain landraces to address various needs. The main traits farmers use to prefer a given variety over the other were maturity, yield potential, suitability for animal feed, grain size, grain color, spike length, tillering capacity, market demand, condition of the soil and product volume. Most of the recorded landraces of barley were endangered indicating the need for conservation of the landraces. The main end uses of barley in the study area were kolo, beso, tela, injera, korefe, kita and kinche.
The main factor that farmers consider to select a given variety over the others was varietal characteristics. The main varietal characteristics traits were length of the spike, size of seed, amount of seed per spike, ability to withstand disease, stand of the plant, tillering ability, number of rows, and germination ability.
The majority of farmers renew barley landraces mostly between 1 and 3 years. The main reasons were to prevent decline in product, to prevent landraces elimination, and to increase productivity, since a reduction in the purity of product over time and its nonrenewal causes decline in germination ability. Farmers renew landraces by sowing in a fertile soil, exchanging with other farmers, sowing the seed by using compost, selecting large sized seeds and multiplying and selecting those plants with good stand and performance in the field.
In each cropping season, each household decides which variety, how much seeds and in which piece of land to sow in their farming area. Both men and women pass decisions jointly in agricultural activities. Based on this, number of varieties to grow, types of varieties to grow, plot allocation, and storage were mostly decided jointly. Postharvest processing was largely decided by women. This result showed that though farming is believed to be mainly the occupation of men; husband and wife make most decisions jointly.

From this study it is recommended that: breeding should be participatory by including traits farmers are interested to be incorporated in their varieties, endangered barley landraces should be collected and conserved for future improvement and the role of women should not be undermined in the conservation, selection and improvement of barley. Besides, this indigenous knowledge of the farmers should be incorporated in modern breeding. CONFLICT OF INTERESTS The authors have not declared any conflict of interests. ACKNOWLEDGEMENTS The authors thank all the farmers of the study area who were involved in the survey and shared their valuable knowledge. They thank University of Gondar for granting this study. REFERENCES Almekinders CJM, Louwaars N, Bruijn G (1994). Local seed systems
and their importance for an improved seed supply in developing countries. Euphytica 78:207-216.
Asfaw Z (1997). Ethnobiology in enhancement and utilization of landraces. In: Fassil K., Abebe D. and Seyfu K. (Eds), Community Biodiversity Development and Conservation. Proceedings of the first meeting of the national project advisory and overseeing committee (NPAOC), coordinating unit and partner institutions. Addis Ababa, Ethiopia pp. 62-71.
Bellon MR (1996). The dynamics of crop infraspecific diversity: a conceptual framework at the farmer level. Economic Botany 50:26-39.
Berg T (1993). The science of plant breeding-support or alternative to traditional practices? In: De Boef W., Amanor K., Wellard K. and Bebbington A. (eds), Cultivating Knowledge: Genetic Diversity, Farmer Experimentation and Crop Research. Intermediate Technology Publications Ltd., UK. pp. 72-77.
Ceccarelli S, Grando S (2000). Barley landraces from the Fertile Crescent: a lesson for plant breeders. In Genes in the Field: On-farm Conservation of Crop Diversity. Edited by: Brush SB. Boca Raton: Lewis Publishers 51-76.
Eticha F, Berghofer E, Grausgruber H (2008). Characterization and Utilization of barley (Hordeum vulgare L.) landraces in the highlands of West Shewa, Ethiopia. Plant Genetic Resources 7:154-162.
Tadesse et al. 217 Fetien A, Waters-Bayer A, Bjørnstad A (2008). Farmers‟ Seed
Management and Innovation in Varietal Selection: Implications for Barley Breeding in Tigray, Northern Ethiopia. Ambio 37:312-320.
Guarino L (1995). Secondary sources on cultures and indigenous knowledge systems. In: Guarino L., Rao V.R. and Reid R. (Eds), Collecting Plant Genetic Diversity Technical Guidelines. CAB International, Wallingford, UK. pp. 195-228.
Howard PL (2003). Women and Plants: Gender Relations in Biodiversity Management and Conservation. Zed Books, London/St. Martin‟s Press, New York.
Mulatu E, Zelleke H (2002). Farmers‟ high maize (Zea mays L.) selection criteria: Implications for maize breeding for the Haraghe highlands of eastern Ethiopia. Euphytica 127:11-30.
Olango T, Tesfaye B, Marcello C, Mario E (2014). Indigenous Knowledge, use and on-farm management of Enset (Ensete ventricosum (Welw) Cheesman) diversity in Wolaita, Southern Ethiopia. Journal of Ethnobiology and Ethnomedicine 10:1-18.
Oosterhout VS (1993). Sorghum genetic resources of small-scale farmers in Zimbabwe. In: De Boef W., Amanor K., Wellard K. and Bebbington A. (Eds), Cultivating Knowledge: Genetic Diversity, Farmer Experimentation and Crop Research. Intermediate Technology Publications Ltd., UK. pp. 89-95.
Ranjil DK (2010).Role of food tradition in conserving crop landraces on-farm. Journal of Agriculture and Environment 11:107-119.
Samberg LH, Fishman L, Allendorf FW (2013). Population genetic structure in a social landscape: Barley in a traditional Ethiopian agricultural system. Evolutionary Applications 6:1133-1145.
Teshome A, Torrance JK, Baum BR, Fahrig L, Lambert JH, Amase TJ (1999). Traditional farmers‟ knowledge of sorghum [Sorghum bicolour [Poaceae] landrace storability in Ethiopia. Economic Botany 53:69-78.
Tilahun A, Alemu F (2017). Traits Diversity Analysis of Malt Barley (Hordeum vulgare L.) Genotypes under Irrigation at Koga of West Gojjam in Ethiopia. Molecular Biology 6:1-6.
Toledo A, Burlingame B (2006). Biodiversity and nutrition: A common path toward global food security and sustainable development. Journal of Food Composition and Analysis 19:477-483.
Zerihun Y, Kassahun T, Awole Z, Guy B (2016). Exploiting indigenous knowledge of subsistence farmers‟ for the management and conservation of Enset (Ensete ventricosum (Welw.) Cheesman) (musaceae family) diversity on-farm. Journal of Ethnobiology and Ethnomedicine 12(1):34.
Zewdie B, Paul CS, Anthony JGG (2014). Assessment of on-farm diversity of wheat varieties and landraces; evidence from farmer‟s fields in Ethiopia. African Journal of Agricultural Research 9:2948-2963.

Vol. 14(4), pp. 218-225, 24 January, 2019
DOI: 10.5897/AJAR2018.13457
Article Number: D1626DF59993
ISSN: 1991-637X
Copyright ©2019
Author(s) retain the copyright of this article
http://www.academicjournals.org/AJAR
African Journal of Agricultural
Research
Full Length Research Paper
Organic amendments applied to a degraded soil: Short term effects on soil quality indicators
UNAGWU B. O.
Department of Soil Science, Faculty of Agriculture, University of Nigeria, Nsukka, Nigeria.
Received 12 August, 2018; Accepted 5 September, 2018
Low agricultural productivity is a threat to achieving global food security. Improving productivity of degraded soils is key to achieving sustainable food production. This study investigated the effects of four organic amendments (OAs) (Mushroom Compost, MC; PAS-100 compost, PAS; Anaerobic Digestate Solid Waste, AD_SW; and Poultry Manure, PM), applied at 10 t ha
-1 and 30 t ha
-1 on the
physical, chemical and biological Soil Quality Indicators (SQIs) of a degraded sandy loam soil. The OAs had about 76 and 49.1% (p < 0.05) increase in the Olsen P and soil organic matter compared to control (un-amended) treatment respectively. There were significant percent increases in the microbial biomass C, total organic C and available K associated with the OAs treatments relative to the control treatment. Applying MC, PAS, AD_SW and PM at 30 t ha
-1 best improved the soil physical, chemical and biological
SQIs. Long term field study is recommended to further evaluate the effects of these OAs on the overall soil health. Key words: Soil quality indicators, microbial biomass, organic matter, degraded soil.
INTRODUCTION Soil is a finite resource that is crucial to human wellbeing (Lal, 2015). However, agricultural lands are currently under threats of soil degradation. Soil degradation is characterised by declining soil organic matter, nutrient depletion and loss of soil fertility (Lal, 2015). Soil degradation has been identified as a major cause of low agricultural productivity in many developing countries (Hüttil and Frielinghaus, 1994). Loss of soil organic matter specifically affects soil biological, chemical and physical properties. Changes in soil properties due to loss of organic matter have negative impact on soil biodiversity, soil buffering capacity, cation exchange capacity, nutrient availability and water infiltration, and can also lead to increased soil compaction and erosion (Karami et al.,
2012). Annually, 3 gigatonnes (Gt) of grain crops residues are
produced globally. However, these residues are often removed from the farms for alternate uses such as fuel, hay and other uses (Lal, 2004). In sub-Saharan Africa, nutrient depletion caused by low-input and extractive farming was estimated to be 40 kg of NPK ha
-1 on
cultivated land (Lal, 2004). Low crop production due to increasingly degraded agricultural soils is a threat to achieving global food security. Therefore, to satisfy the food demand of the current world population (7.3 billion and rising) and cope with the future food demand there is need to adopt techniques that maximise food production from our agricultural soils whilst improving soil quality,
E-mail: [email protected].
Author(s) agree that this article remain permanently open access under the terms of the Creative Commons Attribution
License 4.0 International License

using available organic amendments. Currently, there are major agricultural developments in Africa South of the Sahara to increase crop productivity and eradicate hunger. However, such transformation can only be sustainable through improvements in soil quality rather than simply increasing the use of new crop varieties and inorganic chemical fertilizers (Sanchez, 2015). Periodic application of fresh organic matter either as litter or crop residue is an effective way of rehabilitating degraded soils (Abiven et al., 2009).
Soil organic matter is an important regulator of many environmental processes that affect crop productivity (Tejada et al., 2008) through its beneficial effects at improving soil physical properties, increasing plant growth and crop yields (Karami et al., 2012). Application of organic amendments in terms of the quantity and quality applied is critical to improve fertility of degraded soils (Abiven et al., 2009). This is because soil biological processes are influenced by the soil physical and chemical characteristics, plant communities and agricultural practices which can negatively or positively affect soil fertility. Hence, soil organic matter management through the use of organic amendments is key to alleviating soil degradation by maintaining soil organic matter, thus reclaiming degraded soils and supplying plant nutrients (Tejada et al., 2008; Unagwu et al., 2013). Also, organic matter has been reported to improve soil water retention, nutrient retention ability, soil pH, and increase soil aggregation; consequently preventing and even reversing soil degradation (Karami et al., 2012). It is therefore suggested that improving the biological, chemical, and physical soil quality indicators (SQIs) can be critical to overcoming the global soil degradation challenge. Studies on the effect of organic amendments with or without inorganic fertilizer to improve soil productivity suggest that soil management practices improve SOM, increase crop productivity and have positive effects on the soil physical, chemical, biological properties (Unagwu et al., 2013; Nwite and Okolo, 2016; Mbah et al., 2017).
The degraded soil used in this study was characterised by poor soil structure, inadequate levels of NPK, low soil organic carbon and low microbial biomass. Unless the relevant SQIs are improved (Arthur et al., 2011) such low SQIs will affect its potential use for agricultural purposes. Hence, this study investigated the effects of Mushroom Compost, MC; PAS-100 compost, PAS; Anaerobic Digestate Solid Waste, AD_SW; and Poultry Manure, PM; applied at 10 and 30 t ha
-1 on selected physical,
chemical and biological SQIs. METHODOLOGY Soil sampling
The experiment was set up in a glasshouse at Cranfield University, UK, following a completely randomized design with four replications.
Unagwu 219 Soils were sampled from a 0-150 cm depth of a non-agricultural field. The soil was sandy loam, it had a pH of 8.2, associated with low levels of total oxides of nitrogen, 0.45 (mg kg-1); Olsen-P (32.9 mg kg-1) and available-K (82.7 mg kg-1) (Table 1). Prior to organic amendment application, a baseline soil samples (6 composite samples) were collected from the bulk test soil for physicochemical and biological analyses (Table 1). Postharvest, soil samples were collected for physicochemical and biological analyses. An intact soil cores (5.0cm depth x 5 0cm internal diameter) were collected from each experimental replicate for determination of bulk density. Further, a 400g 3-point composite soil sample was taken from the top 10 cm of each of the experimental treatment replicates. A portion (250 g) of the soil sample was air-dried and ground to <2.00mm for chemical analysis. The remaining portion (150 g) of
each sample was stored at 4⁰C prior to determination of microbial biomass carbon (MBc). Experimental procedure The treatments used in the study were four types of organic amendments namely: Mushroom Compost, MC; PAS-100 compost (compost produced based on UK standard composting regulations), PAS; Anaerobic Digestate Solid Waste, AD_SW; and Poultry Manure, PM. Prior to application, the organic amendments were air dried, ground and then to pass through a 2 mm mesh for the determination of chemical, while the fresh samples were sieved with a 4 mm mesh for the determination of biological properties. The physico-chemical and biological properties of the organic amendments are presented in Table 2. Each organic amendment was applied at two different rates 235 and 705 g pot-1 which is equivalent to 10 and 30 t ha-1 respectively. Thereafter, a 10 kg air-dried soil sample was weighed into polythene bags containing a pre-weighed amount of each of the organic amendments. Subsequently, the treatments were thoroughly mixed in the polythene bag and then transferred into 10 litre plastic pots and incubated at a moisture content of 35% for two weeks prior to sowing of the maize crop.
Laboratory analyses Soil bulk density was calculated from the volume of soil cores (5.0 cm depth × 50 cm internal diameter) and oven-dry mass of soil cores (ISO 11272:1998).
The particle size distribution was determined using the sieving and sedimentation method (ISO 112777:1998). Soil organic matter (SOM) was determined following loss on ignition by dehydrating the soil at 105°C and then ashing it at 450°C in a Carbolite furnace (British Standard BS EN 13039:2000). Soil pH was measured in a water extract at soil:distilled water = 1:5 (w/v); using pH meter (ISO 10390:2005) method. Also the EC was measured in water extract at soil:distilled water = 1:5 (w/v) using a pH and conductivity meter (ISO 11265:1994) method. Soil total organic carbon (TOC) was determined following ISO 10694:1995 method. Total nitrogen (Total_N) was determined using the British Standard method (BS EN 1364-2:2001). The ammonium-N (NH4-N) and total oxides of nitrogen (TON) analysis were determined following the potassium chloride extraction method (MAFF reference book 427:1986). In addition, the available K (Av. K) was determined following British Standard method (BS 3882:1994) with soil microbial mass carbon
Bulk Density =Oven_dry soil g
volume cm3

220 Afr. J. Agric. Res.
Table 1. Baseline characteristics of the test soil prior to application of the organic amendments.
Parameter Values
Total sand (%w/w) 77 (± 1.24)
Coarse sand (%w/w) 8 (± 1.56)
Medium sand (%w/w) 46 (± 2.11)
Fine sand (%w/w) 23 (± 1.15)
Silt (%w/w) 17 (± 0.9)
Clay (%w/w) 6 (± 0.88)
Texture Sandy loam
pH 8.2 (± 0.03)
EC (μS cm-1
) 130 (± 0.003)
Olsen-P (mg kg-1
) 32.9 (± 0.6)
TON (mg k g-1
) 0.45 (±0.08)
NH4-N (mg kg-1
) 4.17 (± 0.33)
Available K (mg kg-1
) 87.3 (± 1.96)
Soil organic matter (%) 2.33 (± 0.08)
Total N (%) 2.27 (± 0.093)
C:N 0.11 (± 0.03)
Total organic C (%) 0.25 (± 0.011)
Microbial biomass C (mg kg-1
) 17.6 (± 0.06)
Values in parentheses represent +/- 1 standard error of the mean.EC = Electrical conductivity, SOM = soil organic matter; TON = Total oxides of nitrogen.
Table 2. Baseline compositions of the organic amendments.
Parameter Amendments
MC AD_SW PAS PM
pH 7.3a 10.3
d 8.7
c 8.0
b
Olsen-P (mg kg-1
) 380a 1190
b 260
a 2420
c
TON (mg k g-1
) 96.2b 0.20
a 0.45
a 0.18
a
NH4-N (mg kg-1
) 120b 700
c 96.7
a 900
c
Available K (mg kg-1
) 1370a 1500
a 4600
b 9140
c
Organic matter (%) 61.8c 85.8
a 37.4
b 83.8
a
Total N (%) 1.90a 1.99
a 0.98
b 3.14
c
Total organic C (%) 25.7b 37.0
c 15.4
a 39.0
d
C:N 14.1ab
19.7d 15.6
b 12.8
a
Microbial biomass C (mg kg-1
) 1358d 20972
a 1929
c 23943
a
MC = Mushroom compost; AD_SW = Anaerobic digestate solid waste, PAS = PAS 100:2005 Quality Protocol compliant compost; PM = Poultry manure. TON = Total oxides of nitrogen. Within each column values followed by a different letter denote statistical differences (p ≤ 0.05) following One-way ANOVA and a post-hoc Fisher LSD analysis.
(MBc) determined following the fumigation-extraction method (ISO 14240-2:1997). Statistical analysis
Data were subjected to Analysis of Variance (ANOVA) using Statistica 12 software version 12.1. The differences between the
means were tested using Duncan’s multiple range test at p < 0.05.
RESULTS AND DISCUSSION
The soil is sandy loam and somewhat gritty texture and belongs to Tectonic series. The baseline soil

Unagwu 221
Table 3. Effect of organic amendment treatments on selected SQIs.
Treatments pH SOM
(%)
Olsen-P
(mg kg-1
)
Av. K
(mg kg-1
)
TN
(mg kg-1
)
TOC
(mg kg-1
)
MBc
(mg kg-1
)
BD
(mg cm-3
)
Control 8.10a 1.97
b 28.8
a 86
a 374
a 830
a 22
a 1.86
c
PM 8.14a 3.74
a 121
e 188
b 1597
c 8220
b 371
c 1.36
ab
PAS 8.29b 3.22
c 47.3
b 215
b 963
b 7480
b 150
b 1.40
ab
AD_SW 8.10a 3.64
a 85.0
d 475
d 1161
b 9320
c 432
c 1.26
a
MC 8.10a 3.39
ac 59.4
c 365
c 1136
b 9890
c 141
b 1.56
b
Rates NS * * * * * * NS
T x R * * * * * * * *
PM = Poultry manure, PAS = PAS 100:2005 compliant compost; AD_SW = Anaerobic digested solid, waste; MC = Mushroom compost; SOM = soil organic matter; Av. K = available K; TN = total N; Rates = treatment applications rates (10 t ha
-1 and 30 t ha
-1); T x R =
Treatment xApplication rate-interaction MBc= Microbial biomass C, BD = bulk density. Within each column values followed by a different letter denote statistical differences (p ≤ 0.05) following Two-way ANOVA and post-hoc Fisher LSD analysis. NS = not significant; * = significant at (P<0.05).
characteristics are shown in Table 1. The soil is alkaline with a pH of 8.2 and has low levels of TON, Olsen-P and Av. K, TOC and MBc. Soil response-changes in chemical SQIs pH Fourteen weeks after the amendments were added to the soil, no significant difference (p < 0.05) in the soil pH was observed between the amended treatments and the un-amended control except for the PAS treatment which had a significantly higher (p < 0.05) pH as compared with all other treatments (Table 3). Similarly, treatment application rates were not associated with significant difference (p < 0.05) in the soil pH. There was a significant interaction effect (p < 0.05) between amendment type and application rate on soil pH, because the soil pH is associated with the PAS treatment. The non-significant difference in the pH observed for the treatments except the PAS treatment may be due to the buffering capacity of the soil which resisted change in the soil pH. Bedada et al. (2014) found no significant difference in the soil pH with the application of compost manure. However, Arthur et al. (2011) reported a significantly higher pH of 0.5 pH unit with the long term application of 30 m
3 ha
-1 of
composts as compared with the un-amended acid soil. The long term compost application in addition to the high compost application rates and acidic soil (pH of 5.5) may account for the observed significant increase in soil pH reported by Arthur et al. (2011). Soil organic matter (SOM) and total organic carbon (TOC) Across both application rates, PM, PAS, AD_SW and MC treatments had significantly (p < 0.05) higher SOM than
the Control treatment (Table 3). The PM treatment, across both application rates, recorded the highest (3.74%); although that was not significantly higher (p < 0.05) as compared with the AD_SW and MC treatments. The PM, PAS, AD_SW and MC treatments, across application rates, had 47.3, 38.8, 46 and 42% higher (p < 0.05) SOM as compared with the Control treatment respectively. The significantly higher SOM values recorded for the organic amendment treatments were due to the high organic matter levels associated with the amendments applied (Tables 1 and 2). This result is similar to the findings of Hati et al. (2006) who reported 41% increase in organic carbon content after three years application of 10 t ha
-1
farmyard manure. Compared with an untreated plot, Guo et al. (2016) reported that the SOM in cattle manure compost fertilized plots increased significantly (p < 0.05) by more than 28% at 0-20 cm soil depth.
Furthermore, across both application rates, the organic amendments significantly increased (p < 0.05) soil TOC. The Control treatment recorded a significantly lower (p < 0.05) TOC content as compared with all amended treatments. The result indicated that TOC content was in the order: MC = AD_SW > PM = PAS > Control (Table 3).
The high TOC associated with these amended treatments can be attributed to the high OM content associated with the organic amendments (Table 2). Hati et al. (2007) reported similar findings following long time (28 years) application of farm yard manure at 15 Mg ha-1, with or without inorganic fertilizer. Lal (2015) suggested that restoring the soil organic carbon (SOC) pool to a threshold level of about 11 to 15 g kg−1 (1.1-1.5% by weight) within the root zone was critical to reducing soil degradation and protecting the environment from potential degradation risks. Guo et al. (2016) found that the 5-year application of cattle manure compost resulted in a 28% increase in TOC as compared with the control. Studies have reported higher TOC with organic fertilizer application as compared with the un- amended control treatment (Hati et al., 2007; Ding et al., 2012; Guo

222 Afr. J. Agric. Res.
Table 4. Correlation between selected SQIs.
MBc TN TOC C:N Olsen-P AvailableK NH4-N TON
SOM 0.78* 0.86* 0.95* 0.78* 0.80* 0.67* 0.43* 0.57*
MBc 0.73* 0.73* 0.57* 0.77* 0.62* 0.23ns
0.63*
TN 0.85* 0.56* 0.86* 0.54* 0.38* 0.71*
TOC 0.85* 0.70* 0.77* 0.36* 0.51*
C:N 0.45* 0.69* 0.23ns
0.24ns
Olsen-P 0.46* 0.42* 0.79*
AvailableK 0.19ns
0.40*
NH4-N
0.04ns
* = significant (p < 0.05); ns = No significant difference; MBc = Microbial biomass C; TN = Total nitrogen, TOC = Total organic carbon, C:N= Carbon to nitrogen ratio, NH4-N = Ammonium-N, TON = Total oxides of nitrogen, SOM = Soil organic matter.
et al., 2016). Furthermore, the results indicated that treatment application rates significantly affected the TOC due to a greater supply of carbon by the organic amendments at higher application rates. This is evident by the significantly strong and positive (p < 0.05) correlation (r = 0.95) between TOC and SOM (Table 4). Our result clearly shows that organic amendment application has positive impacts on soil organic matter and soil organic carbon. Olsen-P Similarly, the organic amended treatments showed
significantly higher (p < 0.05) soil Olsen-P as compared to the Control treatment across both treatment type and application rate (Table 3). The PM treatment recorded the highest soil Olsen-P value (120.6 mg kg
-1) which was
significantly higher than all other treatments. Olsen-P values were subsequently in the order: PAS > AD_SW > MC > PAS > Control. The high Olsen-P associated with the PM treatment is largely due to the significantly higher Olsen-P in the PM amendment (Table 2). These findings corroborate those of Bedada et al. (2014) and Unagwu (2014) who reported significantly higher soil Olsen-P values following organic treatments application. The present result demonstrates the potentials of organic amendments in improving the Olsen-P content of a degraded soil. Available-K
The organic amended treatments, across both application rates, resulted in significantly higher Available-K as compared with the Control treatment. The AD_SW treatment recorded the highest (475 mg kg
-1) Available-K
value as compared with the Control treatment and all other treatments (Table 3). No doubt, the high residual Available-K observed for the organic amended treatments
was due to the high level of Available-K associated with the organic amendments as compared with the baseline soil values (Table 1). In addition, since soil organic matter is associated with exchange sites to bind available cations in the soil exchange complex, it is likely that the high Available-K recorded for the organic amended treatments is due to the high organic matter associated with the organic treatments. The significantly strong positive (p < 0.05) correlation between SOM and Available-K (r = 0.67; p < 0.05) thus confirmed that the organic matter contributed to the observed higher Available-K associated with the amended treatments (Table 4). Soil total nitrogen (TN) content
Compared with the un-amended control treatment, the organic amended treatments across both application rates had significantly higher (p < 0.05) total nitrogen (TN). The PM treatment recorded the highest TN content (~ 1600 mg kg
-1; p < 0.05) as compared with all other
treatments as well the as un-amended treatment. Soil TN content in the control treatment was more than 60% lower as compared with all the organic amended treatments. The soil TN was in the order: PM > AD_SW = MC = PAS > Control. The significantly higher TN recorded for the amended treatments were linked to the higher SOM associated with the applied organic amendments. This is evident by a significant and positive correlation (r = 0.86; p < 0.05) between the SOM and the TN content (Table 4). This relationship explains why the organic amended treatments were associated with higher soil TN than the Control treatment. Furthermore, treatment application rates had a significant effect on the soil TN. This was no doubt due to the higher supply of N with increasing rates of organic amendment applied. This result is similar to the findings of Guo et al. (2016) who reported significant increases in soil TN with cattle manure compost application.

Unagwu 223
Figure 1. Effect of treatments on Total oxides of nitrogen and Ammonium-N across treatment application rates.
Total oxides of nitrogen (TON) and Ammonium-N (NH4-N) Across both treatment application rates, no significant difference in soil TON values was observed between treatments (Figure 1). Since N is a critical and important nutrient for maize growth, it is likely that the post-harvest non-significant difference in TON between the organic amended treatments and the control was due to plant N uptake. Further, a similar trend was observed for ammonium-N (NH4-N). The PM, AD_SW, PAS and MC treatments across treatment were not significantly different as compared with the Control treatment. The non-significant difference in the NH4-N between treatments and control could be due to either direct uptake by the maize plant or due to indirect uptake of NH4-N because of microbial conversion of NH4-N to nitrite and nitrate. More so, the wide variability in the TON and NH4-N mean values could account for the non-significance observed between the amended treatments. Soil response-changes in biological SQI Microbial biomass C (MBc) The microbial biomass carbon (MBc) in the organic amended treatments was significantly higher (p < 0.05) than that observed in the Control treatment (p < 0.05). This could be attributed to the significantly higher OM associated with the applied organic amendments which enriched the soil microbes with organic C (the energy source of soil microbes). The SOC pool is a critical component of soil quality (Lal, 2015). Microbial biomass
(population) is affected by several factors such as temperature, nutrient source, water content and the type of organic matter applied. Hence, the type of OM applied could have a significant effect on the MBc depending on C-availability. Labile OM is a readily available energy source which is more easily degraded by the soil microbes than the less labile or non-labile (recalcitrant) OM. The supply of readily metabolizable C from organic amendments was suggested to be the most influential factor contributing to increases in biomass-C. This was because the soil microbial biomass responds rapidly to readily available C (Tejada et al., 2006). Also, the significantly higher MBc observed for the PM and AD_SW treatments as compared with the PAS and MC treatments could suggest the comparative availability of metabolizable C. Furthermore, the significant (p < 0.05) positive correlation (r = 0.73) observed between TOC and MBc confirmed that the higher MBc (Table 4) recorded for the organic amended treatments was attributable to their higher TOC which provided easily degradable carbon that stimulated the autochthonous microbial activities (Tejada et al. 2006). A similar result was reported by Tejada et al. (2008) who observed a progressive increase in soil MBc with higher application of organic matter. Soil response-changes in soil physical SQIs Bulk density Across both application rates, the bulk density recorded for the organic amended treatments were significantly lower (p < 0.05) as compared with the Control treatment
Mean Mean±SE
Control PM PAS AD_SW MC
Treatments
0
1
2
3
4
5
6
7
8
9T
ota
l o
xid
es
of
nit
rog
en
(m
g k
g-1
)
F(4,35) = 1.6481, p = 0.1842
Mean Mean±SE
Control PM PAS AD_SW MC
Treatments
0.0
0.1
0.2
0.3
0.4
0.5
0.6
Am
mo
niu
m-N
(m
g k
g-1
)
F(4,35) = 1.406, p = 0.2523

224 Afr. J. Agric. Res. (Table 3). The AD_SW treatment had lowest soil bulk density (1.26 g cm-3) followed by the PM treatment (1.36 g cm-3) though both treatments were not significantly different. Organic materials are associated with low bulk density (0.8 g cm-3). Hence mixing organic materials (less dense materials) with soil (a denser material) reduced the soil bulk density. Guo et al. (2016) reported that soil bulk density was significantly and inversely related to rates of cattle manure compost applied. The significantly lower bulk density associated with the organic amended treatments could partly be due to the effect of the plant roots. Hati et al. (2006) and Guo et al. (2016) found significant reductions in the bulk density with NPK application which they attributed to increased root growth. In addition, treatment application rates had significant effects on the soil bulk density. This could suggest that the quantity of organic amendment applied to soil had significant effects on the soil bulk density probably due to the effect of higher organic matter content. Celik et al. (2004) reported a similar result. They observed that the soil bulk density decreased with increasing application of compost and manure treatments due to increased soil organic matter concentrations. Also, a significantly lower soil bulk density following application of cattle compost and manure at 25 t ha-1 in a long term study was reported (Celik et al., 2010). However, in the present study, the bulk density did not strongly correlate with SOM (r = 0.24). This could probably be due to the short duration of the study. D’Hose et al. (2014) had a similar result with application of farm compost. They found a weak correlation between bulk density and SOC (R2 = 0.25) which they attributed to the limited range of SOCs (1.07-1.25%) in their experiment.
Conclusion The study observes the effectiveness of the OAs in improving soil physical, chemical and biological SQIs. The results obtained indicate that the OA types have varied significant effects on the SQIs. This suggests that the type of OAs applied plays a crucial role in improving the soil properties of a degraded soil. The application of PM, PAS, AD_SW and MC at 30 t ha
-1 best improved the
soil physical, chemical and biological SQIs, which are crucial to increasing crop yield production. This study advocates for further field study to evaluate the potency of these OAs to improve the SQIs of a degraded soil.
CONFLICT OF INTERESTS
The author has not declared any conflict of interests.
ACKNOWLEDGEMENT The authors are grateful to the Tertiary Education Trust
fund (TETfund) through the support of University of Nigeria, Nsukka for funding this research. REFERENCES
Abiven S, Menasseri S, Chenu C (2009). The effects of organic inputs over time on soil aggregate stability – A literature analysis. Soil Biology and Biochemistry 41(1):1-12.
Arthur E, Cornelis M, Vermang J, De Rocker E (2011). Amending a loamy sand with three compost types: Impact on soil quality. Soil Use and Management 27(1):116-123.
Bedada W, Karltun E, Lemenih M, Tolera M (2014). Long-term addition of compost and NP fertilizer increases crop yield and improves soil quality in experiments on smallholder farms.Agriculture, Ecosystems and Environment 195:193-201.
Celik I, Gunal H, Budak M, Akpinar C (2010). Effects of long-term organic and mineral fertilizers on bulk density and penetration resistance in semi-arid Mediterranean soil conditions. Geoderma, 160(2):236-243.
Celik I, Ortas I, Kilic S (2004). Effects of compost, mycorrhiza, manure and fertilizer on some physical properties of a Chromoxerert soil. Soil and Tillage Research 78(1):59-67.
D’Hose T, Cougnon M, De Vliegher A, Vandecasteele B, Viaene N, Cornelis W, Van Bockstaele E, Reheul D (2014). The positive relationship between soil quality and crop production: A case study on the effect of farm compost application. Applied Soil Ecology 75:189-198.
Ding X, Han X, Liang Y, Qiao Y, Li L, Li N (2012). Changes in soil organic carbon pools after 10 years of continuous manuring combined with chemical fertilizer in a Mollisol in China. Soil and Tillage Research 122:36-41.
Guo L, Wu G, Li Y, Li C, Liu W, Meng J, Liu H, Yu X, Jiang G (2016). Effects of cattle manure compost combined with chemical fertilizer on topsoil organic matter , bulk density and earthworm activity in a wheat – maize rotation system in Eastern China. Soil and Tillage Research 156:140-147.
Hati KM, Mandal K G, Misra A K, Ghosh P K, Bandyopadhyay KK (2006). Effect of inorganic fertilizer and farmyard manure on soil physical properties, root distribution, and water-use efficiency of soybean in Vertisols of central India. Bioresource technology, 97(16):2182-2188.
Hati KM, Swarup A, Dwivedi AK, Misra AK, Bandyopadhyay KK (2007). Changes in soil physical properties and organic carbon status at the topsoil horizon of a vertisol of central India after 28 years of continuous cropping, fertilization and manuring. Agriculture Ecosystems and Environment 119:127-134.
Hüttil RF, Frielinghaus M (1994). Soil fertility problems — an agriculture and forestry perspective. Science of The Total Environment, 143(1):63-74.
Karami A, Homaee M, Afzalinia S, Ruhipour H, Basirat S (2012). Organic resource management: Impacts on soil aggregate stability and other soil physico-chemical properties. Agriculture, Ecosystems and Environment 148:22-28.
Lal R (2004). Soil carbon sequestration impacts on global climate change and food security. Science 304 (5677):1623-1627. Available at: http://science.sciencemag.org/content/sci/304/5677/1623.full.pdf (Accessed: 10 May 2016).
Lal R (2015). Restoring soil quality to mitigate soil degradation, Sustainability (Switzerland) 7(5):5875-5895.
Mbah CN, Njoku C, Okolo CC, Attoe E, Osakwe UC (2017). Amelioration of a degraded Ultisol with hardwood biochar: Effects on soil physico-chemical properties and yield of cucumber (Cucumis sativus L). African Journal of Agricultural Research 12(21):1781-1792.
Nwite JN, Okolo CC (2016). Soil Water Relations of an Ultisol amended with Agro-wastes and its effect on grain yield of maize (Zea Mays L.) in Abakaliki, Southeastern Nigeria. European Journal of Scientific Research 141:126-140.
Sanchez PA (2015). En route to plentiful food production in Africa. Nature Plants 1(1):14014.

Tejada M, Garcia C, Gonzalez JL, Hernandez MT (2006). Organic
Amendment Based on Fresh and Composted Beet Vinasse. Soil Science Society of America Journal 70:880-900.
Tejada M, Gonzalez JL, García-Martínez AM, Parrado J (2008). Effects of different green manures on soil biological properties and maize yield. Bioresource Technology 99(6):1758-1767.
Unagwu BO (2014). Maize performance in a sandy loam ultisol amended with NPK 15-15-15 and poultry manure. African Journal of Agricultural Research 9(12):1020-1024.
Unagwu 225 Unagwu BO, Asadu CLA, Ezeaku PI (2013). Residual Effects of
Organic and NPK Fertilizers on Maize Performance at Different Soil pH Levels. Journal of Agriculture and Veterinary Science 5(5):47-53.

Related Journals:
www.academicjournals.org
O PE N ACCE S S
O PE N ACCE S S
O PE N ACCE S S
O PE N ACCE S S
O PE N ACCE S S
Journal of
Agricultural Extension
and Rural Development
International Journal of
Fisheries and Aquaculture
Journal of
Cereals and Oilseeds
Journal of Agricultural
Biotechnology and
Sustainable Development
International Journal of
Livestock Production
African Journal of
Agricultural Research
O PE N ACCE S S
O PE N ACCE S S O PE N ACCE S S O PE N ACCE S S
Journal of Plant Breeding and Crop Science
Journal of Stored Products and Postharvest Research
Journal of
ent
Soil Science and Environmental Managem