July 2019 ISSN 1996-0786 DOI: 10.5897/AJEST www ...
44
July 2019 ISSN 1996-0786 DOI: 10.5897/AJEST www.academicjournals.org OPEN ACCESS African Journal of Environmental Science and Technology
Transcript of July 2019 ISSN 1996-0786 DOI: 10.5897/AJEST www ...

July 2019ISSN 1996-0786 DOI: 10.5897/AJESTwww.academicjournals.org
OPEN ACCESS
African Journal of
Environmental Science and
Technology

About AJEST
African Journal of Environmental Science and Technology (AJEST) provides rapid publication
(monthly) of articles in all areas of the subject such as Biocidal activity of selected plant
powders, evaluation of biomass gasifier, green energy, Food technology etc. The Journal
welcomes the submission of manuscripts that meet the general criteria of significance and
scientific excellence. Papers will be published shortly after acceptance. All articles are peer-
reviewed
Indexing
The African Journal of Environmental Science and Technology is indexed in:
CAB Abstracts, CABI’s Global Health Database, Chemical Abstracts (CAS Source Index), China
National Knowledge Infrastructure (CNKI), Dimensions Database, Google Scholar, Matrix of
Information for The Analysis of Journals (MIAR), Microsoft Academic
AJEST has an h5-index of 14 on Google Scholar Metrics
Open Access Policy
Open Access is a publication model that enables the dissemination of research articles to the
global community without restriction through the internet. All articles published under open
access can be accessed by anyone with internet connection.
The African Journal of Environmental Science and Technology is an Open Access journal.
Abstracts and full texts of all articles published in this journal are freely accessible to everyone
immediately after publication without any form of restriction.
Article License
All articles published by African Journal of Environmental Science and Technology are licensed
under the Creative Commons Attribution 4.0 International License. This permits anyone to copy,
redistribute, remix, transmit and adapt the work provided the original work and source is
appropriately cited. Citation should include the article DOI. The article license is displayed on the
abstract page the following statement:
This article is published under the terms of the Creative Commons Attribution License 4.0
Please refer to https://creativecommons.org/licenses/by/4.0/legalcode for details about Creative
Commons Attribution License 4.0

Article Copyright
When an article is published by in the African Journal of Environmental Science and Technology,
the author(s) of the article retain the copyright of article. Author(s) may republish the article as
part of a book or other materials. When reusing a published article, author(s) should;
Cite the original source of the publication when reusing the article. i.e. cite that the article was
originally published in the African Journal of Environmental Science and Technology. Include the
article DOI Accept that the article remains published by the African Journal of Environmental
Science and Technology (except in occasion of a retraction of the article)
The article is licensed under the Creative Commons Attribution 4.0 International License.
A copyright statement is stated in the abstract page of each article. The following statement is an
example of a copyright statement on an abstract page.
Copyright ©2016 Author(s) retains the copyright of this article.
Self-Archiving Policy
The African Journal of Environmental Science and Technology is a RoMEO green journal. This
permits authors to archive any version of their article they find most suitable, including the
published version on their institutional repository and any other suitable website.
Please see http://www.sherpa.ac.uk/romeo/search.php?issn=1684-5315
Digital Archiving Policy
The African Journal of Environmental Science and Technology is committed to the long-term
preservation of its content. All articles published by the journal are preserved by Portico. In
addition, the journal encourages authors to archive the published version of their articles on their
institutional repositories and as well as other appropriate websites.
https://www.portico.org/publishers/ajournals/
Metadata Harvesting
The African Journal of Environmental Science and Technology encourages metadata harvesting
of all its content. The journal fully supports and implement the OAI version 2.0, which comes in a
standard XML format. See Harvesting Parameter

Memberships and Standards
Academic Journals strongly supports the Open Access initiative. Abstracts and full texts of all
articles published by Academic Journals are freely accessible to everyone immediately after
publication.
All articles published by Academic Journals are licensed under the Creative Commons
Attribution 4.0 International License (CC BY 4.0). This permits anyone to copy, redistribute,
remix, transmit and adapt the work provided the original work and source is appropriately cited.
Crossref is an association of scholarly publishers that developed Digital Object Identification
(DOI) system for the unique identification published materials. Academic Journals is a member of
Crossref and uses the DOI system. All articles published by Academic Journals are issued DOI.
Similarity Check powered by iThenticate is an initiative started by CrossRef to help its members
actively engage in efforts to prevent scholarly and professional plagiarism. Academic Journals is
a member of Similarity Check.
CrossRef Cited-by Linking (formerly Forward Linking) is a service that allows you to discover
how your publications are being cited and to incorporate that information into your online
publication platform. Academic Journals is a member of CrossRef Cited-by.
Academic Journals is a member of the International Digital Publishing Forum (IDPF). The
IDPF is the global trade and standards organization dedicated to the development and
promotion of electronic publishing and content consumption.

Contact
Editorial Office: [email protected]
Help Desk: [email protected]
Website: http://www.academicjournals.org/journal/AJEST
Submit manuscript online http://ms.academicjournals.org
Academic Journals 73023 Victoria Island, Lagos, Nigeria
ICEA Building, 17th Floor, Kenyatta Avenue, Nairobi, Kenya.

Editors
Prof. Sulejman Redzic Faculty of Science University of Sarajevo Bosnia and Herzegovina. Dr. Guoxiang Liu Energy & Environmental Research Center (EERC) University of North Dakota (UND) North Dakota 58202-9018 USA
Associate Editors
Prof. Okan Külköylüoglu Faculty of Arts and Science Department of Biology Abant Izzet Baysal University Turkey.
Editorial Board Members
Dr. Manoj Kumar Yadav Department of Horticulture and Food Processing Ministry of Horticulture and Farm Forestry India. Dr. Baybars Ali Fil Environmental Engineering Balikesir University Turkey.
Dr. Antonio Gagliano Department of Electrical, Electronics and Computer Engineering University of Catania Italy. Dr. Yogesh B. Patil Symbiosis Centre for Research & Innovation Symbiosis International University Pune, India. Prof. Andrew S Hursthouse University of the West of Scotland United Kingdom. Dr. Hai-Linh Tran National Marine Bioenergy R&D Consortium Department of Biological Engineering College of Engineering Inha University Korea. Dr. Prasun Kumar Chungbuk National University, South Korea. Dr. Daniela Giannetto Department of Biology Faculty of Sciences Mugla Sitki Koçman University Turkey. Dr. Reem Farag Application department, Egyptian Petroleum Research Institute,
Egypt.

Table of Content
Pit latrine faecal sludge solid waste quantification and characterization to inform the design of treatment facilities in peri-urban areas: A case study of Kanyama James Madalitso Tembo, Richard Matanda, Ian Nzali Banda, Erastus Mwanaumo, Edwin Nyirenda, Mwewa Mambwe and Imasiku Anayawa Nyambe
260
Reported driving factors of land-use/cover changes and its mounting consequences in Ethiopia: A Review Mathewos Muke
273
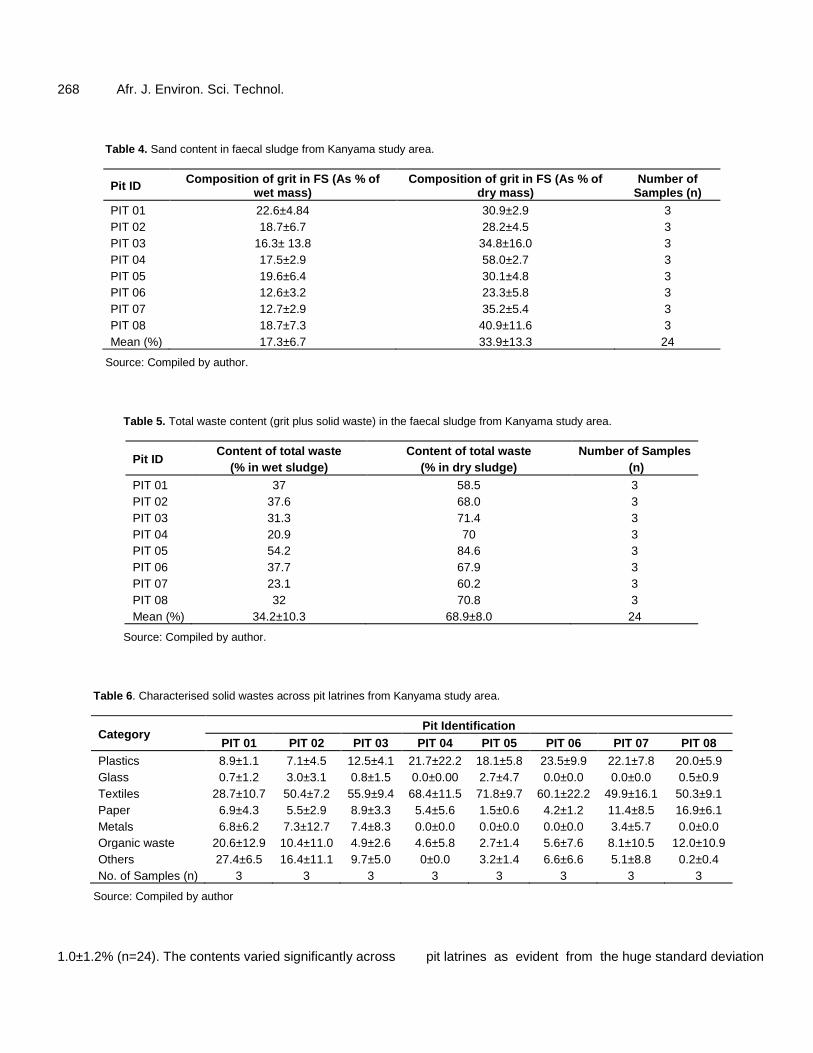
Balancing land management under livestock keeping regimes: A case study of Ruvu and Zigi catchments in Tanzania Almas KASHINDYE, Richard GILIBA, Maximillian SEREKA, Damas MASOLOGO, Gertrude LYATUU and Mathew MPANDA
281
Residues of the transformation of halieutics products: An alternative substrate for energy valorization of wastes by methanisation for a local sustainable development (preliminary results) N. N. Kebe, P. A. Fall, D. Ndiaye and D. Diouf
291

Vol. 13(7), pp. 260-272, July 2019
DOI: 10.5897/AJEST2019.2694
Article Number: DF8655561153
ISSN: 1996-0786
Copyright ©2019
Author(s) retain the copyright of this article
http://www.academicjournals.org/AJEST
African Journal of Environmental Science and
Technology
Full Length Research Paper
Pit latrine faecal sludge solid waste quantification and characterization to inform the design of treatment
facilities in peri-urban areas: A case study of Kanyama
James Madalitso Tembo1*, Richard Matanda1, Ian Nzali Banda1, Erastus Mwanaumo1, Edwin Nyirenda1, Mwewa Mambwe1 and Imasiku Anayawa Nyambe2
1Department of Civil and Environmental Engineering, School of Engineering, University of Zambia, Zambia.
2Integrated Water Resources Management Centre, University of Zambia, Zambia.
Received 23 April, 2019; Accepted 14 May, 2019
The purpose of the study was to quantify waste content in faecal sludge using an appropriate method and characterise the solid wastes inherent with the faecal sludge into categories. A total of eight (8) domestic pit-latrines were analysed in the peri-urban area of Kanyama settlement in Lusaka from July to October, 2018. From each latrine, three (3) samples were obtained for analysis of solid waste and sand/grit quantities. The quantified solid waste was further characterised to generate its composition. The method of estimation involved separation of the excreta from the solid waste and grit/sand of the faecal sludge by means of washing and drying of the contents. The results indicated high content of total waste, taken as the summation of all the solid waste including grit/sand which averaged 34.2±10.3% (n=24) per wet mass of faecal sludge and 68.9±8.0% (n=24) per dry mass of faecal sludge. Characterisation of the solid waste in the faecal sludge (n=24) showed a composition of 54.4±13.3% textiles, 16.7±6.4% plastics, 8.6±9.3% others, 8.6±5.8% organic waste, 7.6±4.8% paper, 3.1±3.6% metal and 1.0±1.2% glass. The high content of waste has an implication on the handling of faecal sludge especially at the stages of desludging, treatment and disposal/re-use. The study proposed and recommended implementation of user education, improving solid waste management systems in peri-urban areas and studying the feasibility of placing some facilities like biogas digesters above ground to facilitate removal of grit, which is usually problematic with underground facilities. The study also proposed and recommended strengthening the regulation on the construction and operations of latrines, which should be supported by enacting a responsive regulatory framework to ensure all measures, are effectively implemented. Key words: Faecal sludge,
peri-urban area,
pit latrine, solid waste management.
INTRODUCTION Strande et al. (2014) reports that between 65 and 100% of the urban population in most Sub-Sahara African countries access sanitation exclusively through onsite systems. Of the onsite facilities used, pit latrines are the
most prevalent especially in low cost areas of large cities (Jenkins et al., 2015; Templeton et al., 2015; WHO/UNICEF, 2014; Thye et al., 2011). This is because pit latrines are the cheapest means of excreta disposal

and provide the most inexpensive means of improving sanitation coverage especially in developing countries (Graham and Polizzotto, 2013). Worldwide, it has been acknowledged that one of the biggest shortcomings of pit-latrines is their finite capacity which leads them to fill up within a few months or years of usage (Murungi and van Dijk, 2014; Still and O‟Riordan, 2012; Still et al., 2005). Management of the full latrine is through either burying or replacement with a new one or if it is desired to continue using the same latrine, it can then be emptied and put back into service (Jenkins et al., 2015; Still and O‟Riordan, 2012; Pickford and Shaw, 1997). The option of burying works well in areas where there is sufficient space that allows for digging of new replacement latrines when the old ones fill up. For Peri-Urban Areas (PUAs) in large cities, pit emptying is a more practical option since most of these areas are normally faced with lack of space (Akumuntu et al., 2017). In addition to space constraints, high costs associated with the construction of a decent new latrine superstructure make emptying a more attractive option (O‟Riordan, 2009; Muller and Rijnsburger, 1994).
Emptying a single pit latrine can cause a serious health hazard if not properly handled Mwale, 2013, as the freshly deposited sludge at the top of the latrine contain pathogenic microorganisms, hence the need for Faecal Sludge Management (FSM) systems. FSM is the process of managing faecal sludge from onsite sanitation facilities like pit latrines and septic tanks at all stages of the sanitation service chain which includes storage, desludging, transportation, treatment, disposal and/or re-use (Strande et al., 2014). This means, appropriate means
of faecal sludge containment, desludging, treatment and disposal or re-use need to be sought. In addition, there is need for an enabling environment especially as it relates to faecal sludge and solid waste management regulation.
Torondel (2010) defines faecal sludge as a mixture of human excreta, water and solid wastes that are disposed of in the pits, tanks or vaults of onsite sanitation systems such as anal cleansing materials, menstrual hygiene materials, diapers, plastics, paper. Some of these materials like plastics are non-biodegradable. Other non- biodegradable materials are deliberately disposed of in pit latrines. For PUAs in Lusaka, which are defined as “Areas within the jurisdiction of the local authority, having high population density and low cost housing units
Tembo et al. 261 lacking basic services such as water supply, roads and sewerage (MLGH, 2014; NWASCO/ DTF, 2005), Tembo et al., (2016), contend that one of the reasons for the disposal of solid waste in pit latrines is the absence of functional solid waste management systems in these areas which leaves residents with no other option of solid waste disposal. Regardless of the source, solid waste usually poses a challenge in processing of faecal sludge. The diversity of this material influences the decomposition process that occurs in the pit latrines. The accumulation of these solid wastes can be significant, causing problems with desludging and resulting in clogged pipes and pumps within the treatment facilities. The solid waste also takes up space in reactors effectively reducing reactor retention times and consequently affecting the quality of the treatment products (Strande et al., 2014). Strande et al. (2014) further submit that grit/sand concentrations are also important to consider in the treatment of faecal sludge as their presence influence the required size of treatment facilities. This is because grit affects the filling rates of treatment facilities and can increase the frequency of clogging in pipes and pumps.
Lusaka, the capital city of Zambia has about 70% of its population residing in PUAs (MLGH, 2014). According to SMEC (2016), about 90% of people residing in PUAs use unimproved pit latrines. This is indicative of the need for an effective FSM system in the city. In recent years, Zambia‟s FSM, landscape, has been improving fast with the advent of the Lusaka Sanitation Programme (LSP), which is a five year initiative by the Lusaka Water and Sewerage Company (LWSC). This initiative partly seeks to improve onsite sanitation and FSM in Lusaka City. This has led to development of strategies for enhanced provision of onsite sanitation and FSM services. For instance, in 2018, the framework for provision of urban onsite sanitation and FSM was launched to assist with the creation of a regulatory framework for onsite sanitation and FSM that supports the proper functioning of an integrated management system covering the whole sanitation chain (NWASCO, 2018). However, solid waste management has not received the same attention and has therefore continued to lag behind. In his study, Sibanda (2010) indicated that the existing regulatory framework for solid waste management in Zambia was comprehensive but enforcement was weak. He also submitted that most people in Zambia are not
*Corresponding author. E-mail: [email protected]. Tel: +260973190310.
ABBREVIATIONS: CBD: Central business district; FSM: Faecal sludge management; LWSC: Lusaka water and sewerage
company limited; PUAs: Peri-urban areas.
Author(s) agree that this article remain permanently open access under the terms of the Creative Commons Attribution
License 4.0 International License
262 Afr. J. Environ. Sci. Technol. environmentally conscious, which promotes indiscriminate waste disposal.
Generally, implementation of an effective FSM system requires availability of quality and quantity data on the faecal sludge to be managed to aid in the design of facilities (Strande et al., 2014; Bassan et al., 2013). Data on quantities of solid waste is also cardinal in the design of FSM facilities. Worldwide, it has been acknowledged that solid waste content in the faecal sludge heavily impacts on the performance of the FSM especially at desludging, treatment and disposal/re-use stages. In the FSM being piloted in Lusaka under LWSC in Zambia, mechanical desludging of faecal sludge is impossible due to high content of solid waste. This has resulted in the use of modified garden tools as a means of desludging (Mikhael and Drabble, 2014).
Strande et al. (2018) submit that governments and other stakeholders have started to acknowledge the importance of FSM. However, they observe that efforts to enhance FSM predominantly focus on FSM infrastructure development. The required studies on quantities and qualities of faecal sludge are usually rare despite the fact that this is critical requirement in the design of adequate faecal sludge treatment facilities (Fanyin-Martin et al., 2017). With this status on the availability of the general faecal sludge quantity and quality, specific data on the relative quantities and characteristics of the solid waste contained in pit latrine faecal sludge are even more obscure. This means that the design of appropriate faecal sludge treatment facilities becomes a challenge because of lack of exact data of physiognomies and quantities of the solid waste present in the pit latrines (Mwale, 2013). Secondly, accepted methodologies for representative characterisation and quantification of the solid waste in pit latrine faecal sludge do not exist. In line with aforementioned, the purpose of this study was therefore to come up with a suitable method to employ in the generation of the quantities and characteristics of solid waste found in domestic pit latrines in PUAs of Lusaka using Kanyama as a study area. The study ultimately designed a suitable method and quantified and characterized the solid waste inherent with pit latrine faecal sludge. The generated data will inform the appropriate designs of FSM facilities to adequately address challenges associated with the presence of solid waste and grit in faecal sludge. METHODOLOGY
Overview
The study sought to design a method for and quantifying solid waste and grit in pit latrine faecal sludge. A quantitative
methodology utilizing experimental methods was therefore employed. The main steps taken in ensuring successful execution of the study included, selecting the study area, designing a sampling frame, selecting pit latrines to be sampled, sample collection, determination of the content of various constituents of waste in the sludge and data analysis as detailed in the ensuing sections.
In this study, solid waste in the faecal sludge was put in two categories; as either grit/sand; and other forms of solid waste including plastics, glass, textiles (sacks, rugs, sanitary pads and diapers), paper, metals, organic waste (including vegetation matter like grass and logs) and others. Therefore, in the rest of the paper, solid waste will refer to the inorganic constituents found in pit latrines excluding grit/sand, which is also considered separately.
Study area
The study area, Kanyama settlement, is an improvement area, which was legalized in 1999 by the Ministry of Local Government under the statutory and improvement areas act of 1999. The settlement is located 7 km west of the Central Business District (CBD). It is bordered by Los Angeles and Mumbwa roads on the western and eastern sides respectively (Figure 1). The settlement covers an estimated area of 14.25 km2. According to the Central Statistics Office (CSO), the 2010 population density of Kanyama was approximately 5,636 people/ km2 (Brinkhoff, 2018). The population is estimated at 366,170 (CSO, 2010) with 78, 995 informal housing units that rely on onsite sanitation facilities for excreta disposal (Nyambe, et al., 2014). Most of the residents live in rented multi-roomed dwellings that accommodate more than one family. Its proximity to the city‟s CBD is responsible for its big size and high population density as most of its residents are primarily migrants from the rural areas coming to seek employment opportunities in the city especially the CBD. Access to adequate sanitation and the existence of service like solid waste collection is very poor in the settlement. The low access to sanitation facilities, unavailability of an effective FSM system, a porous geology as the area is sited on dolomite and a high water table perpetuates outbreaks of water borne diseases such as cholera and typhoid. During the 2017/2018 cholera outbreak in the city of Lusaka, Kanyama PUA alone accounted for over 1,000 cholera cases (WHO/MoH, 2018), making it one of the worst affected areas in the country.
Selection of Kanyama settlement as a study area was dictated by availability of an FSM enterprise in the area. In the study area, Kanyama Water Trust offers faecal sludge desludging services. Since samples were collected as the pit latrines were being desludged (as detailed under sample collection), it was imperative that the study area be an area where formal pit latrine desludging services were available hence the selection of Kanyama Settlement.
Sampling frame and selection of pit latrines to be sampled
The sampling frame for this study included all households within the study area utilising pit latrines for disposal of excreta. Selection of pits to be sampled was random. As it was only possible to collect samples as the pit latrines were being desludged, the pits sampled were not pre-selected. Rather, they were selected by virtue of them having been earmarked for desludging by the desludging enterprise. A total of eight (08) pits were sampled for this purpose.

Tembo et al. 263
Figure 1. Location Map of the Kanyama study area in Lusaka, capital city of Zambia.
Equipment and materials The study required the collection of samples from pit latrines which were consequently to be separated through washing into the various constituents which were then dried and weighed to determine the composition of the various components as required. Equipment and materials employed in the study are presented subsequently. At desludging stage Desludging tools included shovels, picks and modified tools for scooping of sludge, disinfectants for cleaning the desludging tools and sanitising the area after desludging 60 L barrels for collection of samples and 250 mL plastic containers for collection of samples for laboratory determination of moisture content. At the separation stage Scales for weighing of sludge and the respective constituents; a hosepipe to aid with the washing of the sludge in the separation process, a source of water and a polythene sheet for storage of separated waste components.
At the stage of laboratory moisture content determination Crucibles; a laboratory scales for weighing samples for moisture content determination; an oven with a provision for temperature setting at 103°C to 105°C; and a desiccator. Sample collection All samples were collected from pit latrines that were being desludged by the Water trust. Sampling was conducted from July to October, 2018 which was during the dry season. Prior to the desludging process, an assessment on the structural integrity of the structure was first carried out by the Kanyama water trust personnel. After certification that the structure was sound enough, a hole measuring approximately 30 to 50 cm was made on the side to provide access to the pit latrine contents. This process involved removal of a few blocks from the side of the latrine‟s vault to create access. The faecal sludge was then scooped out using modified garden tools and a „Kanjote‟, which is a tin attached to a long metallic handle (Figure 2).
The sampling was designed based on the number of barrels that were to be desludged. The desludging team offered three options for desludging as follows (Holm et al., 2015): 12 barrels of 60 L capacity; 24 barrels of 60 L capacity; and 32 barrels of 60 L

264 Afr. J. Environ. Sci. Technol.
Figure 2. Sample collection: Left: A hole made on the side of the latrines; Middle: Some of the desludging tools including a modified garden rake and a „Kanjote‟; Right: Filling the barrel in the Kanyama study area.
Table 1. Barrels to be collected for waste content analysis depending on the number of barrels being desludged.
Number of barrels to be desludged Number of barrels collected per pit Sequencing of barrels collected for analysis
12 3 4th
, 8th and 12
th
24 3 4th
, 14th
and 24th
32 3 4th
, 18th
and 32nd
Source: Designed by author.
Figure 3. Faecal sludge sampling for analysis (Left: Collection of three 60 liter barrels per Pit latrine; Right: Three samples collected from each barrel for Moisture Content analysis).
capacity. Depending on the number of barrels being desludged, a sampling criterion was devised for the selection of barrels to be collected for analysis as presented in Table 1. The rationale for this criterion was in order to have representative samples covering the full depth profile of the pits.
Therefore, from each pit that was being emptied, three 60 L barrels were collected. The selected barrels were properly labelled and were later transported to the Kanyama faecal sludge treatment plant where separation of the grit, solid waste and excreta components of the faecal sludge was done. From each of the three barrels earmarked for quantification and characterization, three
smaller samples were collected for analysis of moisture content (Figure 3). This moisture content was intended to help in the approximation of the dry excreta component of the faecal sludge. The collection of these samples was therefore done in a way that avoided collection of solid waste and grit as far as it was possible. Procedure for laboratory moisture content analysis The laboratory analysis of moisture content for all the collected samples was carried out at University of Zambia Environmental

Tembo et al. 265
Figure 4. Weighing of the barrel together with the faecal sludge before separation, Kanyama study area.
Figure 5. Washing of faecal sludge to separate the sludge from grit and solid waste, Kanyama study area.
Engineering Laboratory. The analysis was done in accordance with the standard protocols specified in the Standard Methods for the Examination of Water and Wastewater (APHA, 1998). Procedure for quantification of the solid waste and grit The quantification started with the weighing of the faecal sludge contained in the barrels (Figure 4). This was done by weighing the total mass of barrel filled with sludge, which was recorded as mass (A). The mass of the dry barrel was also recorded after all the contents had been removed, which was recorded as (B). Separation of the excreta component of the faecal sludge from the grit and solid waste Separation of the excreta component of the faecal sludge from the rest of the contents (that is, grit and solid waste) was done using water. In order to reduce on chances of washing out the solid waste and grit due to agitations as the water was flowing out, the contents of the barrel were first divided into two portions to create enough
room for expansion of the FS bed during washing. Each portion was then washed separately and gently using a hosepipe in each respective barrel. The washing continued until all the excreta component was washed off from the sand/grit and the solid waste. This separation was facilitated by the differences in densities, the agitation and continued injection of water into the barrels. The overflowing water, which carried with it the excreta component of the faecal sludge was channelled into the anaerobic digester (Figure 5). Quantification of the solid waste and grit During the washing of the faecal sludge, the solid waste was manually separated from the contents. After all the excreta had been washed off, the remaining solid waste that could not be separated during washing was manually sorted out from the grit. The solid waste was then thoroughly air dried for two days. The dried waste was then weighed and the mass was recorded (Mass C). Total Mass of Sludge = A – B
Anaerobic Digester

266 Afr. J. Environ. Sci. Technol. Total Mass of Dry Solid Waste = C
(1) After the thorough washing and removal of all the solid waste, the grit that remained was also air dried for two days as was the case for the solid waste. The air dried grit was then weighed in the field and the mass was recorded (Mass E). As the drying of grit was not thorough, samples were then collected from the air dried grit for moisture content analysis in the laboratory. The mass of the dried grit was then computed as in the Equation 2. Mass or air dried grit = E Moisture content of air dried grit = X%
(2) The grit content in the wet sludge expressed as a percent was then computed using Equation 3.
(3) Both solid waste and grit content in the dry faecal sludge was computed by expressing the masses of the computed dry solid waste and grit as a percentage of the total mass of dry faecal sludge. The total dry mass was computed by summing up the masses of the dried solid waste, the dried grit and the dry mass of excreta, which was approximated by multiplying the mass of the excreta component of the faecal sludge by the solids content percentage. Thus, the excreta component of the dry faecal sludge was computed as per Equation 4.
(4) where, MC is the moisture content of the faecal sludge.
Characterisation of the solid waste After the solid waste was quantified as explained previously, it was sorted into the following categories: plastics, glass, textiles, paper, metals, organic waste and others (Figure 6). The sorting was done manually. The separated fractions were then weighed and their masses were computed as percentages of the total dry mass of the solid waste.
Data analysis
For each pit latrines, mean results were computed from the three sets of results that were obtained for the three samples collected from each latrine. Sample standard deviation was computed to measure the degree of spread of the data. The overall mean for both solid waste and grit was computed by summing up all the individual results. Solid waste characterisation results were manipulated using excel software to generate graphs. Limitations The major limitation of the study was on the inflexibility of sampling. It was not possible to pre-select the latrines to be sampled as the
study team had to follow the program for desludging as designed by the water trust. Secondly, it would have been ideal to have samples collected over the whole pit latrine depth profile. However, this was not possible as all latrines that were sampled were only partially desludged. The study was also limited to the dry season (July to October) implying that impacts of seasonal variations on the results could not be assessed.
RESULTS The results are herein presented.
Moisture content As presented in the methodology section, moisture content in this study was analysed to aid the conversion of the excreta and grit components to their respective dry masses. The mean moisture content in the faecal sludge and the air dried grit from respective pit latrines is presented in Table 2.
The results of the mean moisture content of the faecal sludge and the air dried grit (n=24) were found to be 81.1±6.4% and 26.0±5.8%, respectively.
Solid waste content The solid waste content ranged between 3.4±2.3% and 34.6±8.5% (n=3) in wet sludge and was between 12.0±7.8% and 54.5±2.9% (n=3) in dry sludge. The means were 17.6±10.4% and 31.1±13.5% in wet and dry sludge, respectively (Table 3).
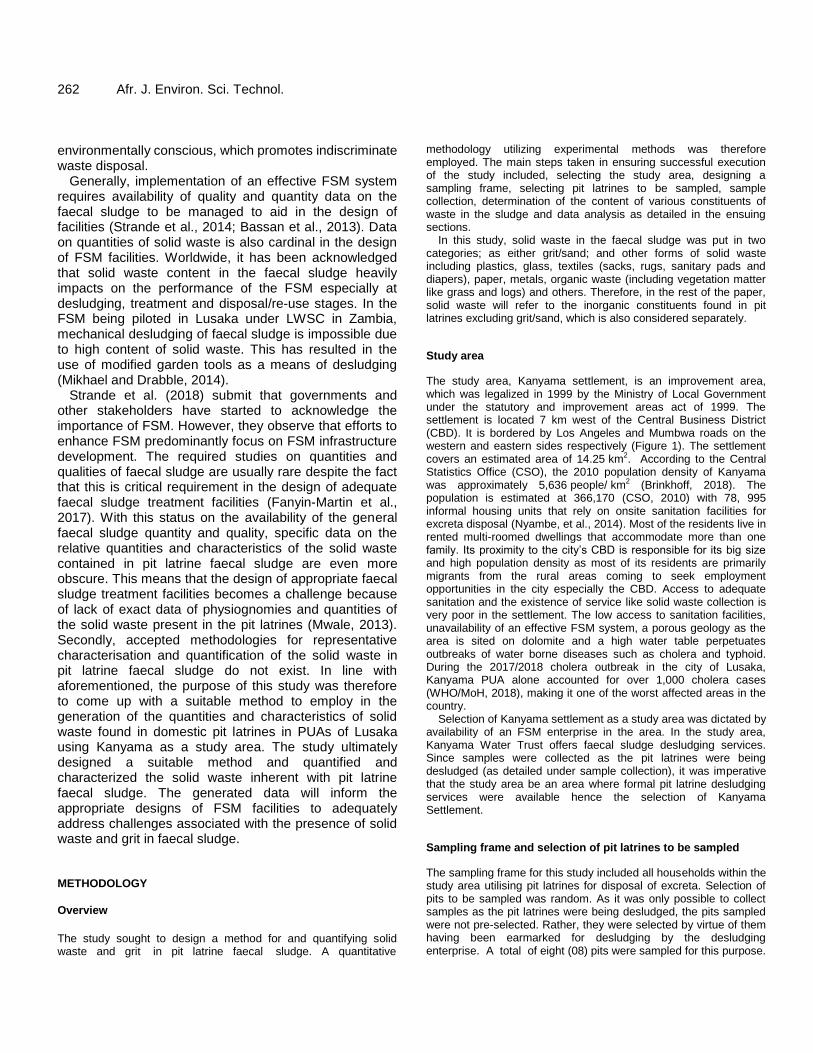
Grit content Grit content ranged between 12.6±3.2% and 22.6±4.8% (n=3) in wet sludge and 23.3±5.2% and 58.0±2.7% (n=3) in dry sludge. The averages were 17.3±6.7 and 33.9±13.3% (n=24) in the wet and dry sludge, respectively (Table 4).
Total waste content in faecal sludge The total waste content in the sludge, which was a summation of the solid waste and grit/sand content in each of the respective sampled latrines presented ranges of 20.9% to 54.2% and 58.5% to 84.6% (n=3) in wet and dry faecal sludge respectively. The computed averages were 34.2±10.3% in wet sludge and 68.9±8.0% (n=24) in dry sludge (Table 5).
Solid Waste Content (D as % of wet sludge) = (C/(A-B)) x 100
Mass of dried grit (F) = (E x (1-X/100))
Grit content (G as % of wet sludge) = (F/(A-B)) x 100
Mass of dry excreta component of FS = ((A-B)-(C+F))* (1-MC/100)

Tembo et al. 267
Figure 6. Examples of some constituents from the fractionated solid waste (Left: Plastics; Middle: organic waste; Right: Textiles (note the high content of diapers within the textile component), Kanyama study area.
Table 2. Mean moisture content results in the FS and the air dried grit from respective pit latrines, Kanyama study area.
Pit ID Moisture Content in the FS
(%)
Moisture Content in the Air Dried Sand
(%)
Number of Samples
(n)
PIT 01 74.5±4.2 24.9±3.8 3
PIT 02 84.9±5.5 25.3±6.7 3
PIT 03 84.5±2.0 25.9±3.3 3
PIT 04 88.2±2.8 24.9±1.8 3
PIT 05 80.4±2.4 23.7±2.2 3
PIT 06 72.9±1.1 33.5±1.4 3
PIT 07 81.8±3.6 25.8±7.6 3
PIT 08 81.0±3.1 23.4±4.8 3
Mean (%) 81.1±6.4 26.0±5.8 24
Source: Compiled by author.
Table 3. Solid waste composition content in faecal sludge from Kanyama Study area.
Pit ID Composition of solid waste in FS (As
% of wet mass) Composition of solid waste in FS (As
% of dry mass) Number of
Samples (n)
PIT 01 14.4±1.6 27.6±1.3 3
PIT 02 18.9±6.3 39.8±3.1 3
PIT 03 15±4.6 36.6±3.45 3
PIT 04 3.41±2.3 12.0±7.8 3
PIT 05 34.6±8.5 54.5±2.9 3
PIT 06 25.1±11.0 44.6±14.0 3
PIT 07 10.4±9.4 25.0±16.8 3
PIT 08 13.3±6.3 29.9±13.9 3
Mean (%) 17.6±10.4 31.1±13.5 24
Source: Compiled by author.
Solid waste characterization Solid waste characterisation showed a general trend across all the surveyed pits with textiles registering the
highest values and glass and metals registering the least (Table 6).
On average textiles registered the highest composition at 54.4±13.3% (n = 24) with glass registering the least at
268 Afr. J. Environ. Sci. Technol.
Table 4. Sand content in faecal sludge from Kanyama study area.
Pit ID Composition of grit in FS (As % of
wet mass) Composition of grit in FS (As % of
dry mass) Number of
Samples (n)
PIT 01 22.6±4.84 30.9±2.9 3
PIT 02 18.7±6.7 28.2±4.5 3
PIT 03 16.3± 13.8 34.8±16.0 3
PIT 04 17.5±2.9 58.0±2.7 3
PIT 05 19.6±6.4 30.1±4.8 3
PIT 06 12.6±3.2 23.3±5.8 3
PIT 07 12.7±2.9 35.2±5.4 3
PIT 08 18.7±7.3 40.9±11.6 3
Mean (%) 17.3±6.7 33.9±13.3 24
Source: Compiled by author.
Table 5. Total waste content (grit plus solid waste) in the faecal sludge from Kanyama study area.
Pit ID Content of total waste
(% in wet sludge)
Content of total waste
(% in dry sludge)
Number of Samples
(n)
PIT 01 37 58.5 3
PIT 02 37.6 68.0 3
PIT 03 31.3 71.4 3
PIT 04 20.9 70 3
PIT 05 54.2 84.6 3
PIT 06 37.7 67.9 3
PIT 07 23.1 60.2 3
PIT 08 32 70.8 3
Mean (%) 34.2±10.3 68.9±8.0 24
Source: Compiled by author.
Table 6. Characterised solid wastes across pit latrines from Kanyama study area.
Category Pit Identification
PIT 01 PIT 02 PIT 03 PIT 04 PIT 05 PIT 06 PIT 07 PIT 08
Plastics 8.9±1.1 7.1±4.5 12.5±4.1 21.7±22.2 18.1±5.8 23.5±9.9 22.1±7.8 20.0±5.9
Glass 0.7±1.2 3.0±3.1 0.8±1.5 0.0±0.00 2.7±4.7 0.0±0.0 0.0±0.0 0.5±0.9
Textiles 28.7±10.7 50.4±7.2 55.9±9.4 68.4±11.5 71.8±9.7 60.1±22.2 49.9±16.1 50.3±9.1
Paper 6.9±4.3 5.5±2.9 8.9±3.3 5.4±5.6 1.5±0.6 4.2±1.2 11.4±8.5 16.9±6.1
Metals 6.8±6.2 7.3±12.7 7.4±8.3 0.0±0.0 0.0±0.0 0.0±0.0 3.4±5.7 0.0±0.0
Organic waste 20.6±12.9 10.4±11.0 4.9±2.6 4.6±5.8 2.7±1.4 5.6±7.6 8.1±10.5 12.0±10.9
Others 27.4±6.5 16.4±11.1 9.7±5.0 0±0.0 3.2±1.4 6.6±6.6 5.1±8.8 0.2±0.4
No. of Samples (n) 3 3 3 3 3 3 3 3
Source: Compiled by author
1.0±1.2% (n=24). The contents varied significantly across pit latrines as evident from the huge standard deviation

Tembo et al. 269
Figure 7. Solid waste characterization results with standard deviations for each category from Kanyama study area.
values especially for glass and metals (Figure 7). DISCUSSION The study set out to formulate a method to generate reliable data on quantities of waste in faecal sludge from pit latrines in PUAs using Kanyama settlement as a case study area. Generally, results showed higher contents of both solid waste and grit. Solid waste averaged 17.6±10.4% (n=24) in wet sludge. This result closely agrees with the findings by Parker et al. (2015) of 12% using a similar method as the one used in this study. The mean content in dry mass of the faecal sludge was almost at 34 percent (n=24). The observed high content of waste can be attributed to the socio-cultural perceptions and the socioeconomic setup of PUAs. Culturally, there is stigma attached to menstruation in most of the Zambian cultures where pads and materials used during menstruation have to be disposed of in a manner that ensures maximum secrecy. Secondly, the introduction of diapers to replace napkins has also exacerbated the situation. Although diapers can be disposed of together with the other forms of solid waste, in PUAs, they also end up in pit latrines and is one of the biggest contributor to textile component as is evident in Figure 6 above. Solid waste disposal in pit latrines is also a result of unavailability of functional solid waste management systems in these areas (Tembo et. al., 2016).
The observed high content of grit results from a number of sanitation practices, which include construction and
usage of pit latrines. Some latrines in the study area are constructed with large squatting holes beyond the 25 cm recommended by WHO (1996) making them dangerous for young children. Others are just not accessible to children due to the way they are constructed (Figure 8).
Following from these inadequacies in construction, children are allowed to defeacate on the ground within the household premises after which the excreta is picked and deposited into the latrine. A shovel or hoe is usually used to pick the excreta. When the excreta is picked, an appreciable amount of soil is also collected and this ends up in the latrine. Grit also comes from the unlined portions of the latrines (Tembo et al., 2016). However, the majority of the grit ending up in the emptied sludge was observed to have been from the desludging method used. Desludging was observed to be a “two-stage” scooping system. The sludge was first scooped from the pit using modified garden tools into a temporary pit that was dug to receive the sludge from the pit. The sludge was then scooped from the temporary pit into the barrels (Figure 2). As the temporally pit was unlined with a lot of loose sand, it was a source of most of the grit.
High contents of both solid waste and grit content complicates treatment processes especially if adequate units are not put in place to address the challenges inherent with the waste. High content of solid waste leads to system blockages, which result in high frequency of reactor maintenance. This requires putting the reactor out of service for some time hence disrupting the treatment process. This was observed for the two pilot plants managed for LWSC by the water trusts in Kanyama and Chazanga. At re-use stage, high solid waste content also

270 Afr. J. Environ. Sci. Technol.
Figure 8. Example of latrine construction and interfaces that discourage direct latrine usage by young children from Kanyama study area.
poses challenges. For example, in the valorisation of faecal sludge to generate power, demineralised water and ash using an Omni processor, grit serious hampers the processes. For sludge with grit content in excess of 5 percent of the dry mass, the Omni processor‟s operations are impaired (Malo, 2017, Dakar, Senegal, personal communication). This implies that with the current grit content in desludged sludge, the Omni processor technology is not an option for the pit latrine faecal sludge from PUAs. Non-biodegradable waste like rags and plastics, which were found to be present in large quantities in this study is an aspect that compromises the ultimate re-use of the sludge in agricultural activities. When present in form of sharp objects, solid waste may also pose health and safety risks especially to workers handling the sludge (IWMI, 2003).
From the foregoing, it is evident that the high content of waste in pit latrine faecal sludge is an aspect that culminates from number of aspects including social-cultural, lack of understanding on the part of residents, absence of adequate solid waste management systems and the construction and operation aspects of the latrines, which result in introduction of waste. For grit, the adopted means of desludging, which is due to the unregulated construction exaggerates the amounts. The latrines are constructed without any provision for desludging. Non availability of standards for construction of pit latrines results in construction of facilities that are not user friendly especially to children resulting in practices that introduce grit into the pit contents. Grit content is exacerbated by the adopted method of desludging, which is due to inappropriate construction of latrines. High solid waste content in the sludge due to indiscriminate disposal of waste into the latrines was another problem that was observed. All these challenges point to the need for regulation of latrine construction, awareness creation and usage to enhance the desludging and treatment of the sludge. It is imperative at design stage to adequately take cognisance of the high content of solid waste in pit latrine faecal sludge to have units that are adequately designed to address the
challenges inherent with the observed quality of the pit latrines faecal sludge as well as to create awareness among the users of the facilities. CONCLUSION AND RECOMMENDATIONS The study aimed at coming up with a method for the estimation and characterisation of solid waste and grit in pit latrine faecal sludge. This was achieved. The developed method was gravimetric making its application universal. The obtained results indicated high content of both solid waste and grit with textiles contributing the highest percentage for the solid waste content. From these results, it is evident that these high values of waste have implications on the method of desludging employed as well as on the treatment efficiencies and effectiveness of plants and the ultimate disposal/re-use of the faecal sludge. The limitations imposed on the study arising from the inflexibility of sampling and the inability to sample the full depth profile of the pit latrines as highlighted in the limitations section do not result in significant impacts on the results as these are not variables that have a bearing on the content of solid waste. However, quantities of both grit and solid waste may vary with seasons as in partially lined pit latrines, moisture content is likely to increase in the rainy season thereby reducing the solids content of the excreta component.
Based on the findings, it was clear that the latrines in PUAs do not only serve as excreta disposal facilities, but also as receptors of solid waste. If the management of the faecal sludge from these facilities is to be improved measures for reducing high waste in faecal sludge need to be implemented. These include: implementation of user education in PUAs as a way of averting challenges inherent with solid waste disposal; operationalizing alternative solid waste management systems in PUAs so that the collection and disposal of the waste in these areas is improved; and to regulate the construction of latrines so that all facilities are constructed with easy means of desludging to avoid desludging methods that

increase sand/grit content in the sludge that ends up at the treatment plant. It would also be important to investigate the feasibility of building some of the critical facilities in the treatment of faecal sludge, like biogas digesters, above ground for easy removal of accumulated grit and solid waste, which is usually a challenge when the unit is underground as is usually the case with biogas digesters. Ultimately, there is need for a responsive regulatory framework to ensure that all measures are effectively implemented. ACKNOWLEDGEMENTS The authors gratefully acknowledge the financial support provided to the University of Zambia IWRM Centre under the Sanitation Research Fund for Africa (SRFA) Project, a joint fund established by the Water Research Commission and the Bill & Melinda Gates Foundation. The authors also acknowledge the Department of Civil and Environmental Engineering for the access to laboratory facilities. CONFLICT OF INTERESTS The authors have not declared any conflict of interests. REFERENCES Akumuntu JB, Wehnb U, Mulenga M, Brdjanovic D (2017). Enabling the
sustainable Faecal Sludge Management service delivery chain-A case study of dense settlements in Kigali, Rwanda. International Journal of Hygiene and Environmental Health 220(6):960-973.
American Public Health Association (APHA) (1998). Standard Methods for the Examination of Water and Wastewater. 20
th Edition, American
Public Health Association/American Water Works Association/Water Environment Federation, Washington DC.
Bassan M, Tchonda T, Yiougo L, Zoellig H, Mahamane M, Mbeguere M, Strande L (2013). Characterisation of faecal sludge during dry and rainy seasons in Ouagadougou, Burkina Faso. Refereed paper presented at the 36
th WEDC International Conference, Nakuru,
Central Statistics Office (CSO) (2010). Population and Housing, 1990-2010, Zambia. Central Statistics Office, Lusaka.
Fanyin-Martin A, Tamakloe W, Antwi E, Ami J, Awarikabey E, Apatti J, Mensah M, Chandran K (2017). Chemical characterization of faecal sludge in the Kumasi metropolis, Ghana. Gates Open Research P 1.
Graham JP, Polizzotto ML (2013). Pit latrines and their impacts on groundwater quality: a systematic review. Journal of Environmental Health Perspectives 121(5):521-530.
Holm R, Tembo JM, Thole B (2015). A comparative study of faecal sludge management in Malawi and Zambia: Status, challenges and opportunities in pit latrine emptying. African Journal of Environmental Science and Technology 9(11):783-792.
IWMI (2003). Co-composting of Faecal Sludge and Solid Waste for Urban and Peri-urban Agriculture in Kumasi, Ghana. Programme « Gestion durable des déchets et de l‟assainissement urbain» Action A09. Final Report.
Jenkins MW, Cumming O, Cairncross S (2015). Pit Latrine Emptying
Tembo et al. 271
Behavior and Demand for Sanitation Services in Dar Es Salaam, Tanzania. International Journal of Environmental Research and Public Health 12(3): 2588-2611.
Malo (2017). Dakar, Senegal, personal communication). Verbal presentation on the operations of the Omni-Processor Plant in Dakar, Senegal. Presentation by Engineer Malo, Plant Operator. 17/10/2017.
Mikhael G, Drabble S (2014). FSM services in Lusaka: moving up the excreta management ladder. WSUP Practice Note, DFID, London.
Ministry of Local Government and Housing (MLGH) (2014). National Urban Sanitation Strategy. Ministry of Local Government and Housing, Republic of Zambia, Lusaka.
Muller M, Rijnsburger J (1994). MAPET: A neighbourhood based pit emptying service with locally manufactured hand pump equipment in Dar es Salaam, Tanzania. WASTE: Nieuwehaven, the Netherlands..
Murungi C, Van Dijk P (2014). Emptying, Transportation and Disposal of faecal sludge in informal settlements of Kampala Uganda: The economics of sanitation. Habitat International 42:69-75.
Mwale J (Ed) (2013). Faecal Sludge Management in Africa, Development, Research and Innovation. A Sanitation Matters Magazine for Southern Africa, Issue 4-March 2013. P. 14.
Nyambe IA, Kawamya VM, Lyamba K, Yondela G (2014). Do Existing National Policies Strategies and Guidelines take into Account the Characteristics of Peri-urban Areas in Zambia, Lusaka? Open Research Gate.
NWASCO/DTF (2005). Reaching the Millennium Development Goals for Water Supply and Sanitation in Zambia - The Urban Perspective. Devolution Trust fund and National Water and Sanitation Council. Lusaka, Zambia.
NWASCO (2018). Urban Onsite Sanitation and Faecal Sludge Management: Framework for Provision and Regulation in Zambia. National Water and Sanitation Council, Lusaka, Zambia.
O‟Riordan M (2009). Investigation into Methods of Pit Latrine Emptying. WRC Project 1745 Management of sludge accumulation in VIP latrines, University of KwaZulu Natal, Durban.
Parker A, Cruddas P, Rose C (2015). Faecal Sludge Management in Lusaka. Lusaka, Zambia.
Pickford J, Shaw R (1997). Technical brief no. 54: Emptying latrine pits. Waterlines 16(2):15-18.
Sibanda E (2010). How Effective is the Legal Framework in Counteracting the Effects of Solid Waste Management in Zambia? University of Zambia, Lusaka.
SMEC (2016). Feasibility Studies and Preliminary Engineering Design Report Volume 3: On-Site Sanitation Final Report. Lusaka Water and Sewerage Company Limited, Lusaka, Zambia.
Still D, O‟Riordan M (2012). Tackling the Challenges of Full Pit Latrines. Volume 3: The development of pit emptying technologies. WRC Report No. 1745/3/12, Set No. 978-1-4312-0294-2.
Still DA, Salisbury RH, Foxon KM, Buckley CA, Bhagwan JN (2005). The challenges of dealing with full VIP latrines. Water Research Commission, South Africa.
Strande L, Schoebitz L, Bischoff F, Ddiba D, Okello F, Englund M, Ward JB, Niwagaba CB (2018). Methods to reliably estimate faecal sludge quantities and qualities for the design of treatment technologies and management solutions. Journal of Environmental Management 223:898-907.
Strande L, Ronteltap M, Brdjonovic D (2014). Faecal Sludge Management: System approach for implementation and operation. IWA Publishing, London.
Tembo JM, Nyirenda E, Nyambe I (2016). Enhancing faecal sludge management in peri-urban areas of Lusaka through faecal sludge valorisation: challenges and opportunities. International Conference on Recent Trends in Physics, IOP Conference. Series: Earth and Environmental Science 60(2017):012025
Templeton MR, Hammoud AS, Butler AP, Braun L, Foucher J, Grossmann I, Boukari M, Faye S, Jourda JP (2015). Nitrate pollution of groundwater by pit latrines in developing countries. AIMS Environmental Science 2(2):302-313.

272 Afr. J. Environ. Sci. Technol. Thye YP, Templeton MR, Ali M (2011). A Critical Review of
Technologies for Pit Latrine Emptying in Developing Countries. Journal Critical Reviews in Environmental Science and Technology 41(20):1793-1819.
Torondel B (2010). Sanitation Venture Literature Review: On-site Sanitation Waste Characteristics. London School of Hygiene and Tropical Medicine, London, UK.
WHO (1996). Fact Sheets on Environmental Sanitation: Fact sheet 3.4. WHO. http://helid.digicollection.org/pdf/s13461e/s13461e.pdf
WHO/MoH (2018). Cholera Situational Report. 96, Ministry of Health,
Lusaka.https://www.afro.who.int/countries/zambia/situation-reports/cholera
WHO/UNICEF (2014). Progress on Drinking Water and Sanitation-2014 Update. The World Health Organization; Genera, Switzerland.. https://www.unicef.org/publications/files/JMP_report_2014_webEng.pdf

Vol. 13(7), pp. 273-280, July 2019
DOI: 10.5897/AJEST2019.2680
Article Number: 388FE0061155
ISSN: 1996-0786
Copyright ©2019
Author(s) retain the copyright of this article
http://www.academicjournals.org/AJEST
African Journal of Environmental Science and
Technology
Full Length Research Paper
Reported driving factors of land-use/cover changes and its mounting consequences in Ethiopia: A Review
Mathewos Muke
Department of Environmental Science, College of Natural and Computational Science, Wolaita Sodo University,
Ethiopia.
Received 21 March, 2019; Accepted 23 April, 2019
Obviously, there is land-use/cover change with multifaceted driving factors and associated adverse impacts out there in different parts of Ethiopia. Evidence from published journals justifies this fact but not yet compiled in a manner to convey information on the trend of change and its criticality with the aim to handle the problems. Thus, filing up all the driving factors and its adverse out come from different corners of Ethiopia together under one reviewed journal would help for policy measures and management aspects. In view of this, critical driving factors of land-use/cover change and all its possible consequences bridged together by reviewing highly relevant published journals. Deforestation, high human and livestock population, investment (coffee, tea plantations), agricultural activities ranging from small-scale subsistence agriculture to large-scale commercial agricultural schemes, urban sprawling, charcoal production, woodland collection, poor law enforcement, land rotation searching for better grazing land, resettlement (spontaneous and planned), prevalence of drought, were the leading drivers of land-use/cover change in Ethiopia. In response to these driving factors, the following are major identified adverse effects such as loss of biodiversity and ecosystem service degradation, deterioration of wetlands, creation of new landscape, rainfall variability, reduction in stream flow, increase frequent extreme in weather, conflicts of interest due to resource scrambling, soil and land degradation, prevalence of drought, increase in runoff and sedimentations, increased risk of desertification and woody land cover reduction. In general, these systematic reviews hopefully uncover all the existing scenarios and give mental picture of wide range driving factors of land-use/cover change and associated problems for stakeholders across the country as they might develop ways to end/reduce further vulnerabilities. Key words: Land-use/cover change, driving factors, adverse impacts, Ethiopia.
INTRODUCTION Obviously, there is land-use/cover change with multifaceted driving factors and associated adverse impacts out there in different parts of Ethiopia. Evidence
from published journals justifies this fact but not yet compiled in a manner to convey information on the trend of change and its criticality with the aim to handle
E-mail: [email protected].
Author(s) agree that this article remain permanently open access under the terms of the Creative Commons Attribution
License 4.0 International License

274 Afr. J. Environ. Sci. Technol. the problems. Hence, understanding factors that drives land-use/cover change and its impacts in general is important for modeling, predicting environmental change and help respond to the change in most positive way to benefit the people (Tilahun and Teferi, 2015; Rawat and Kumar, 2015). Different places have different pushing factors and its consequences too. Causes for land-use/cover change are broadly grouped in to two namely; Natural and human with diverse driving forces. However, we sense natural effects like climate effect in the long run but impacts due to human intervention is most of immediate when compared with natural effects (Woldeamlak, 2002). Filing up all the driving factors and its out come from different corners of Ethiopia together under one reviewed journal would help for policy measures and management aspects. Hence, these systematic reviews could identify its wide range discrepancy, level of criticality and give mental picture particularly for experts dedicated in conservation role.
Change in land-use/cover in some localities might bring some benefits but less weighted when compared with consequences in the long run particularly in rural areas. The adverse impact of land-use/cover change also varies from place to place as the fashion of the people in approaching and causing land-use/cover change varies.
To better understand the driving factors of land-use/cover change and its wide range adverse impacts, these study systematically reviewed recently published journals related with these issues. In the courses of review, different places of the country were characterized depending on the existing situations: from identification of driving factors to consequences of its change. This study therefore bridges drivers of land-use/cover change to intermingled adverse impacts of its change in Ethiopia. It was also aimed to bring together the potential consequences of various places under one theme so as to make easy understanding of management strategies and assist policy makers for better interventions. To this end, driving factors and its consequences each treated/ reviewed section by section and pinpointed under one file in way to support better management strategies.
Data sources and methods
Driving factors and adverse impacts of land-use/cover change were logically assessed and each multifaceted driving factors and adverse impacts were pinpointed by reviewing reliable literatures touching different parts of the country. Information used to reinforce the evidence with the logical reasoning were collected from different ranges of journals dealt with land-use/cover change using geospatial data backed by GIS and Remote Sensing technology and other methods to minimize uncertainties in the study. Two themes/components separately assessed and some overlapping of publication citations could be appeared repeatedly mainly to support the discussion more lively.
Limitations One cannot find a published scientific research in every corners of the country in all aspects. This area is not yet fully researched and scientific research findings on these issues are at the infant stage in most cases. Hence, for areas where there is lack of published research findings, other variables like agro-climatic conditions, livelihood styles , population settlements and land-use/cover -patterns were considered in order to inference and minimize bias against established knowledge. The study also assumes the present scenarios as valid for the future and doesn’t consider shift in technology that best welcomes the adverse changes and converts it to other fortune. This is because of the fear that the future is uncertain and mostly in state of changing (Verburg et al., 2010) that might bring fallacies against the established knowledge. Hence, the assessments and implications of different review are based on the existing status-quo keeping other possible opportunities and change kept constant.
Driving factors of land-use/cover change in Ethiopia
There are many studies pin-pointing the driving factors of land-use/cover changes identified via different scientific approaches. The driving factors were multifaceted by their nature due to different governing reasons and vary largely from place to palace.
Causes for land-use/cover change attributed to resource scrambling and forest land grabbing often misquoted as bare land or lacks signs of agriculture for investment like coffee, tea plantations and agricultural activities (small-scale subsistence agriculture to large-scale commercial agricultural schemes), poor law enforcement, resettlement (spontaneous and planned), land tenure policy, shifting cultivation have been significant drivers identified in SW Ethiopia and to some extent in Gambella and Benishangul regions (Brhane and Zemenu, 2018; Obang et al., 2017; Alemayehu, 2015; Azeb et al., 2018; Azeb, 2018; Henok et al., 2016; Kefelegn et al., 2017; Teshome et al., 2019; Semeneh et al., 2016; Yenenesh et al., 2018; Kero et al., 2018). Figure 1
While over grazing and charcoal production as means of livelihood income are dominantly seen drivers in Afar and Somali regions. These regions almost share common agro-climate, livelihood and living style fashion (Anteneh et al., 2018). The recent studies made by Wakshum et al. (2018), identified Prosopis juliflora invasions effects as one of the unique driving factors of land-use/cover change in South Afar, Northeast Ethiopia.
Common causes in eastern parts of Ethiopia particularly in Diredawa administration and Harari regional state were collection of woods for fuel consumption, population growth, agricultural expansion, charcoal production,

Muke 275
Figure 1. Sheka forest and cover change indicating how dense forest cover converted to other land-use/cover type (Atlas of maps land cover change 1973 to 2013).
A B
Figure 2. (a) Illegal charcoal production in Arsi Negele district. Source: Mikias (2014); (b) Deforestation in activities in Kanchama, Arbaminch zone. Source: Habtamu et al. (2017).
livestock ranching and settlement expansion (Amisalu and Toru, 2018). Factors like farmland expansion, population pressure, deforestation and collection of woods for construction and charcoal production for fuel consumption, poor land tenure policy and land fragmentations have been significant driving factors in Southern Nations, Nationalities and Peoples Regional (SNNPR) state, central and southern Oromiya regional states (Berhan and Woldeamlak, 2014; Habtamu et al., 2018; Habtamu et al., 2017; Mikias, 2014; Gebrekidan et al., 2014; Hagos, 2014) Figure 2a and b.
Driving factors prevailed in Tigray and Amhara regional states were associated with deforestations, high human and livestock population, charcoal production, agricultural expansion, prevalence of drought, resettlement (Samuale
et al., 2014; Kebrom and Hedlund, 2000; Binyam et al., 2015; Miheretu and Yimer, 2017; Negasi et al., 2018; Mesfin et al., 2016; Worku and Csaplovies, 2015).
Expansion in urbanization and urban sprawling by itself is cause and effects of land-use/cover change in most of parts of the developed and developing countries (Hassan et al., 2016; Mohan et al., 2011; Duguma, 2017). Currently urban expansion mostly unplanned advancement is the highest among zonal, regional and capital city of the country often resulted in converting rural landscape to urban landscape. This urban sprawling considered usually as sign of economic influence despite the expansion is at the expense of encroaching potential rural areas (Afera et al., 2018; Sisay et al., 2016).

276 Afr. J. Environ. Sci. Technol. Unlike to other places, land-use/cover change in pastoral areas were largely imposed by large number of livestock population leading to overgrazing, recurrent drought due to rain fall variability, poor policy, land rotation for searching better grazing land (Teka et al., 2018). Adverse impacts of land-use/cover change in Ethiopia Causes for land-use/cover change dynamics were diverse as extensively reviewed above and likewise, its adverse impacts are also diverse and differ largely from place to place. A review from different journals evidenced that there are a wide range of adverse impacts so far identified due to land-use/cover changes. The adverse impacts ever identified/reviewed hereunder were attributed to environmental qualities while some others are associated to socio- economic impacts.
Major underlying consequences due to land-use/cover change in Gambella, Benishangul and most parts of Southwestern Ethiopia were loss of biodiversity and ecosystem service degradation (Figure 1), deterioration of wetlands, creation of new landscape, rainfall variability, reduction in stream flow, increase frequent extreme in weather, conflicts of interest, soil lose and decline in soil fertility (Henok et al., 2016; Mathewos and Bewuketu, 2018; Getachew et al., 2014)
Amahara, North eastern parts of Benishangul, and South western parts of Tigray having similar agro-climate, landscape and livelihood of the communities experienced common problems. Hence, according to the evidence from different journal, the impacts dominantly seen were soil and land degradations, prevalence of drought, rainfall variability, decrease in wetland, increase in runoff resulting in soil and land degradation and sedimentations (Woldeamlak, 2002; Eleni et al., 2013; Woldeamlak and Solomon , 2013; Miheretu and Yimer, 2017; Negasi et al., 2018; Tesfa et al., 2018; Jacob et al. 2015; Mesfin et al., 2016; Menberu, 2014, Kassahun and Yitbarek, 2018). Figure 4
Southern Nations, Nationalities and Peoples Regional (SNNPR) state and around central and southern parts of Oromia regional state, major identified effects of land-use/cover were loss of biodiversity, soil fertility decrease, land fragmentations, forest resource deteriorations (Mikias, 2015; Mohammed et al., 2017; Shegenaet al., 2016; Desalegn et al., 2014; Terefe et al., 2017; Adane and Mezgebu, 2017)
The problems dominantly reviewed in Tigray, Afar and Somali regional states were land fragmentations, fluctuations in rainfall patterns and extremisms, incidence of extremisms in weather conditions leading to drought, soil and land degradations, decrease in stream flow, wetland deterioration, increased risk of desertification (Samuale et al., 2014; Diress et al., 2010). Rugged topography with inappropriate agricultural practice is also the reasons behind land degradation particularly in
Amhara and Tigray regions. Whereas high livestock population pressure fueled with overgrazing in Afar, Harari and Somali regions facilitated the loss of soil due to erosion, decline in soil fertility and land degradation Figure 3.
There is significant woody land cover reduction in pastoral areas due to large livestock population. In areas where there is overgrazing, the density of wood land cover largely decreased and often resulted in shifting to other places (Teka et al., 2018). On the other hand, the invasion of woody plants referred to as Prosopis juliflora to rangelands becomes a potential threat to pastoral production in South Afar, Northeast Ethiopia ( Wakshum et al., 2018). Currently, Prosopis juliflora is advancing in alarming rate to eastern parts of Ethiopia including Somalia, Afar, Harari regions and around Diredawa.
Study made by Yohannes et al. (2017), identified ecosystem deterioration due to land-use/cover change leading to disturbance of an aquatic animals and species around central rift valley lakes regions, Ethiopia. Despite all these effects, the degree of criticality however varies from place to place and ranges from localized to global level impacts. The important note here we should underline is that one impact by itself can be cause and effects for others if left for long period of time without any management schemes in placed. For example, poverty by itself is cause and effects of climate change (prolonged decrease in stream flow, rainfall variability) and this if left unmanaged lead to other adverse crises and effects like deterioration of environmental quality as a whole. RESULTS AND DISCUSSION This study is evidence based identifications of driving factors of land-use/cover change and its level of impacts on the environment and socioeconomic activities. We should not always attribute/give negative connotations to land-use/cover change for the fact it has also positive impacts. However, land-use/cover change induced by human for human need satisfaction often competed with yielding adverse impacts on human and the environment. Because of these, causes and effects are often complex to fully understand due to multi pushing factors such as natural and human induced factors and varies among localities, regions and largely at country level. Diversity in land-use/cover change caused by numerous factors and its adverse effects becoming a big challenge to make a distinction and the undergoing process is intermingled (Thi-Thanh-Hien et al., 2015). For instance, there are many direct and indirect impacts associated with forest deforestations. But if you ones sense the presence of deforestations, you can expect diverse associated consequences (Solomon, 2016).
In general, demographic, socioeconomic, and cultural changes were the leading drivers in most parts of

Muke 277
Figure 3. Overgrazing and its effects on wetlands (From Lecture Slides-Integrated River Basin Management MSc courses).
Figure 4. Soil and land degradation in North western parts of Ethiopia, Koga catchment. Source: Eleni et al. (2013).
Ethiopia resulting change in cover and land use pattern. In response to these driving factors of land-use/cover change, the adverse impacts ever identified and reviewed were attributed to environmental qualities while some others are associated to socio- economic, cultural and political impacts.
Resource scrambling and forest land grabbing for investment, agricultural activities (small-scale subsistence agriculture to large-scale commercial agricultural schemes), poor law enforcement, resettlement (spontaneous and planned), land lease policy, shifting cultivation have been significant drivers identified in south western parts of Ethiopia in general. Associated with these driving factors, loss of biodiversity and ecosystem service degradation, deterioration of wetlands, creation of new landscape, rainfall variability, reduction in stream flow, increase frequent extreme in weather, conflicts of interest, soil lose and decline in soil fertility were underlying causes ever reported in south western parts of Ethiopia.
Some driving factors like charcoal production and livestock production are common but it is one of the key livelihood incomes for Somali, Afar and Harari regions resulting in woody land cover reduction. Despite other places, these regions also uniquely threaten by the invasion of Woody plants referred to as Prosopis juliflora to rangelands as a potential threat to pastoral production. Unlike to other places, study made by Yohannes et al. (2017) identified ecosystem deterioration due to land-use/cover change leading to disturbance of an aquatic animals and species around central rift valley lakes regions.
Common driving factors so far identified in most parts of Oromia, Amahra and Southern and central parts of Ethiopia were agricultural expansion, population pressure and deforestation often resulted in land fragmentation, soil and land degradation, forest and woodland cover reduction. The ups and down curvature of the surface nature in Amahara and Tigray regions resulted in soil and land degradation often fueled by inappropriate agricultural

278 Afr. J. Environ. Sci. Technol.
expansion, population pressure and overgrazing. As a result, increase in runoff, soil fertility loss and stream flow reduction is the case in most cases.
Unplanned urban expansion in the form of lease policy in every parts of the country is another big causes and effects of land-use/cover change. Due to urban sprawling, rural lands are now becoming parts of residential areas resulting in significant changes in land use patterns. In areas where there is shortage of rainfall particularly in pastoral areas, land-use/cover change were largely determined by large number of livestock population leading to overgrazing, recurrent drought due to rain fall variability, poor governing policy, land rotation for searching better grazing land (Teka et al., 2018).
The worst case scenario is that some changes in land-use/cover were irreversible or take long period of time to restore back (Afera et al., 2018; Thompson, 2017). For instance, loss of biodiversity and soil and land degradation may take several decades to restore back. This early warning might help to save UNESCO registered biosphere reserves in the unique landscape of Sheka and Majang zone, south western parts of Ethiopia. This place among other is a biodiversity-rich ecosystem area but threaten recently by investment (tea and coffee plantation), poor and narrowly conceived policy regarding land awarding to investors and tenure, settlement (mostly spontaneous) and cereal crop based agricultural expansions. Many research findings ensured all these identified common driving factors behind land-use/cover change and easy to think of mounting impacts on ecosystem services in general Figure 1.
Some effects of land-use/cover change are only confined to particular places but effect on the environment is common to all places despite the criticality varies (Hu and Nacun, 2018; Verburget al., 2010). Moreover, agricultural expansion is also common to all parts of the country as one of the major causal factors for land–use/cover changes. But one should not be misquoted in valuing only its positive aspects because the expansion is to compensate the soil infertility. Journals reviewed so far pointed out that one of the land-use cover change effect is loss of soil fertility due to erosion and this imposed farmers to practice extensive than intensive farming in most of the highland places. Hence, despite the expansion in agricultural practice; there is very limited yield to support the growing population demand. Thus, this study was built from systematic meta-analysis based on wide range of reviewed studies including different perspectives, approaches and provides a common national framework for taking corrective measures with the aim to end the management challenges. Valid and timely information on land-use/cover change and its associated driving factors is indispensable strategies for national or regional based conservation strategies (Mathewos and Bewuketu, 2018; Teshome, et al., 2019; Temesgen et al., 2017). It is therefore important to bridge established knowledge with
designed policy for better environmental management. CONCLUSIONS The dynamics of land-use/cover change is complex due to its multivariate nature made up of intermingled proximate and underlying factors. This complexity is fueled by scattered findings across the country and challenged in drafting common and widely accepted frame work or applicable policy to manage the causes. For common understanding, all the causes and effects of each part of the country was reviewed. Generally, demographic, socioeconomic, and cultural changes were the leading drivers in most parts of Ethiopia resulting change in cover and land use pattern. In response to driving factors of land-use/cover change, the adverse impacts ever identified and reviewed were attributed to environmental qualities while some others are associated to socio- economic, cultural and political impacts. Thus, this review brought all the reported geospatial evidence based drivers, of land-use/cover change and its associated impacts, under one theme for better understanding and management of the problems in place. But, it should be noted here, that, these adverse effects in the future will be handed and cannot be threats due to technological advancement and thus might create fallacies against established knowledge. Moreover, these studies also don’t considered future uncertainties as we are living in dynamic and steadily changing world.
CONFLICT OF INTERESTS
The author has not declared any conflict of interest. REFERENCES Adane M, Getachew W (2017). Changes and drivers of afro-alpine
forest ecosystem: future trajectories and management strategies in Bale eco-region, Ethiopia. Ecological Processes 6:42.
Afera H, Asirat T, Ermias S, Imran A (2018). Dynamics of Land Use and Land Cover Change Using Remote Sensing and GIS: A Case Study of Debre Tabor Town, South Gondar, Ethiopia. Journal of Geographic Information System 10:165-174.
Alemayehu KT (2015). Land Use Land Cover Change and Its Implication on Surface Runoff: A Case Study of Baro River Basin in South Western Ethiopia. Journal of Environment and Earth Science 5(8):53-57.
Amisalu M, Toru T (2018). Assessment of Land Use Land Cover Change Drivers and Its Impacts on above Ground Biomass and Regenerations of Woody Plants: A Case Study at Dire Dawa Administration, Ethiopia. Atmospheric and Climate Sciences 8:111-120.
Anteneh W, Efrem G, Fantaw Y (2018). Assessment of Land Use Land Cover Change and Its Implication on Agro-Pastoral Area of Gode District, Somali Regional State, Ethiopia. Journal of Environment and Earth Science 8(1):80-90.
Azeb WD (2018). Assessment of Land Use and Land Cover Change Using GIS and Remote Sensing Techniques: A Case Study of Abobo District, Gambella Region, Ethiopia. Paper prepared for presentation at the “2018 World Bank Conference on land and poverty” The World Bank - Washington DC, March 19-23, 2018.

Azeb WD, Zabel F, Mauser W (2018). Assessing land use and land
cover changes and agricultural farmland expansions in Gambella Region, Ethiopia, using Landsat 5 and Sentinel 2a multispectral data. Heliyon 4(2018):e00919.
Berhan G, Woldeamlak B (2014). Drivers and Implications of Land Use and Land Cover Change in the Central Highlands of Ethiopia: Evidence from Remote Sensing and Socio-demographic Data Integration. EJOSSAH X(2):1-23.
Binyam A, Efrem G, Zewdu E, Habtemariam K (2015). Land Use and Land Cover Changes and Associated Driving Forces in North Western Lowlands of Ethiopia. International Research Journal of Agricultural Science and Soil Science 5(1):28-44.
Brhane MG, Zemenu AA (2018). Impacts of Resettlement on Land Use Land Cover Changes and Natural Vegetation Conservation Practices of Resettlers in Abobo Woreda, Gambella, Ethiopia. An International Peer-reviewed Journal 40:20-28.
Desalegn T, Cruz F, Kindu M, Turrión MB, Gonzalo J (2014) Land-use/land-cover (LULC) change and socioeconomic conditions of local community in the central highlands of Ethiopia, International Journal of Sustainable Development and World Ecology 21(5):406-413.
Diress T, Stein RM, Vedeld P, Ermias A (2010). Land-use/cover dynamics in Northern Afar rangelands, Ethiopia. Agriculture, Ecosystems and Environment 139:174-180.
Duguma E (2017). Remote Sensing-Based Urban Land Use/Land Cover Change Detection and Monitoring. Journal of Remote Sensing & GIS 6(2):1-5.
Eleni Y, Wagner W, Exner-Kittridge M, Dagnachew L, Blöschl G (2013). Identifying Land Use/Cover Dynamics in the Koga Catchment, Ethiopia, from Multi-Scale Data, and Implications for Environmental Change. ISPRS International Journal of Geo-Information 2:302-323.
Gebrekidan W, Amare B, Habtamu T (2014). Land use and land cover change in Ameleke Watershed, South Ethiopia. Journal of Natural Sciences Research 4(14):42-47.
Getachew T, Erika Z, Shennan C, FitzSimmons M (2014). Policy and demographic factors shape deforestation patterns and socio-ecological processes in southwest Ethiopian coffee agroecosystems. Applied Geography 54:149-159.
Habtamu T, Casper IM, Joel OB,Abubeker H, Ayana A, Yared M (2018). Evaluation of land use land cover changes usingmremote sensing Landsat images and pastoralists’ perceptions on range cover changes in Borana rangelands, Southern Ethiopia. International Journal of Biodiversity and Conservation 10(1):1-11.
Habtamu WE, Debela HF, Serekebirhan T (2017). Impacts of deforestation on the livelihood of smallholder farmers in Arba Minch Zuria Woreda, Southern Ethiopia. African Journal of Agricultural Research12(15):1293-1305.
Hassan Z, Shabbir R, Ahmad ShS, Malik AH, Aziz N,Butt A, Erum S (2016). Dynamics of land use and land cover change (LULCC) using geospatial techniques: a case study of Islamabad Pakistan. Springer Plus 5(812):1-11.
Hagos G (2014). Land Use-Land Cover dynamics of Huluka watershed, Central Rift Valley, Ethiopia. International Soil and Water Conservation Research 2(4):25-33.
Henok K, Dondeyne S, Poesen J, Frankl A, Nyssen J (2016). Transition from forest-based to cereal-based agricultural systems: A review of the drivers of land use change and degradation in southwest Ethiopia. Land Degrad. Develop. Published online in Wiley Online Library.
Hu Y, Nacun B (2018). An Analysis of Land-Use Change and Grassland Degradation from a Policy Perspective in Inner Mongolia, China, 1990–2015. Sustainability 10(4048):1-22.
Kassahun G, Yitbarek M (2018). Rethink the interlink between land degradation and livelihood of rural communities in Chilga district, Northwest Ethiopia. Journal of Ecology and Environment 42(17):1-11.
Jacob M, Frankl A, Beeckman H, Gebrekidan M, Hendrickx M, Etefa G, Nyssen J (2015). North Ethiopian afro-alpine tree line dynamics and forest cover change since the early 20th century. Land Degradation & Development 26:654-664.
Kero AD, Abiyot L, Serene D (2018). Monitoring Deforestation in South Western Ethiopia Using Geospatial Technologies. Journal of Remote Sensing and GIS 7(1):1-5.
Kebrom T,Hedlund L (2000). Land Cover Changes Between 1958 and
Muke 279
1986 in Kalu District, Southern Wello, Ethiopia. Mountain Research and Development 20(1):42-51.
Kefelegn G, Poesen J, Rompaey AV (2017). Impacts of Resettlement Programs on Deforestation of Moist Evergreen Afromontane Forests in Southwest Ethiopia. An international, peer-reviewed open access journal published by the International Mountain Society (IMS) 37(4):474-486.
Mathewos M, Bewuketu H (2018). Land-use/cover change analysis using Remote Sensing techniques in the landscape of Majang Zone of Gambella Region, Ethiopia. African Journal of Environmental Science and Technology 12(4):141-149.
Menberu T (2014) Population Growth and Cultivated Land in Rural Ethiopia: Land Use Dynamics, Access, Farm Size, and Fragmentation. Resources and Environment 4(3):148-161.
Mesfin AW, Mohammed A, Nicolau MD (2016). Patterns, causes and consequences of land use/cover dynamics in the Gumara watershed of lake Tana basin, Northwestern Ethiopia. Environmental Systems Research 5(8):1-12.
Miheretu Y (2017). Land use/land cover changes and their environmental implications in the Gelana sub-watershed of Northern highlands of Ethiopia. Environmental Systems Research 6(7):1-13.
Mikias BM (2014). Land Use/ land cover dynamics in the Central Rift Valley Region of Ethiopia: The Case of Arsi Negele District. African Journal of Agricultural Research 10(5):434-449.
Mohan M, Pathan SK, Narendrareddy K, Kandya A, Pandey S (2011). Dynamics of Urbanization and Its Impact on Land-Use/Land-Cover: A Case Study of Megacity Delhi. Journal of Environmental Protection 2:1274-1283.
Mohammed M, Habtamu T, Yared M (2017). Land use/cover change analysis and local community perception towards land cover change in the lowland of Bale rangelands, Southeast Ethiopia. International Journal of Biodiversity and Conservation 9(12):363-372.
Negasi S, Hadgu H, Annang T, Pabi O, Asante IK, Emiru B (2018). Forest Cover Change, Key Drivers and Community Perception in Wujig Mahgo Waren Forest of Northern Ethiopia. Land 7(32):1-16.
Obang OO, Sintayehu LG, Dessalegn OG (2017). Analyzing the Rate of Land Use and Land Cover Change and Determining the Causes of Forest Cover Change in Gog District, Gambella Regional State, Ethiopia. Journal of Remote Sensing and GIS 6(4):1-13.
Rawat JS, Kumar M (2015). Monitoring land use/cover change using remote sensing and GIS techniques: A case study of Hawalbagh block, district Almora, Uttarakhand, India. The Egyptian Journal of Remote Sensing and Space Sciences18:77-84.
Samuale T, Etefa G, Raj AJ, Emiru B, Gebeyehu TW (2014). Land Use and Land Cover Change, and Woody Vegetation Diversity in Human Driven Landscape of Gilgel Tekeze Catchment, Northern Ethiopia. International Journal of Forestry Research pp. 1-10.
Semeneh B, Fekadu B, Bekele H, Degye G, Yigardu M (2016). Land use/land cover change and its effects on bamboo forest in benishangul gumuz region, Ethiopia. International Journal of Sustainable Development and World Policy 5(1):1-11.
Shegena Z, Suryabhagavan KV, Balakrishnan M (2016). Land-use/land-cover dynamics in Sego Irrigation Farm, southern Ethiopia: A comparison of temporal soil salinization using geospatial tools. Journal of the Saudi Society of Agricultural Sciences15:91-97.
Wakshum S, Demissew S, Bekele T (2018). Effects of Prosopis juliflora invasions on land use/cover change detections in South Afar, Northeast Ethiopia. International Journal of Molecular Biology 3(6):252-264.
Sisay NH, Teshome S, Demel T (2016). Land Use and Land Cover Change in the Bale Mountain Eco-Region of Ethiopia during 1985 to 2015. Land 5(41):1-22.
Solomon MM (2016). Effect of Land Use Land Cover Changes on the Forest Resources of Ethiopia. International Journal of Natural Resource Ecology and Management 1(2):51-57.
Temesgen G, Tafa T, Mekuria A, Abeyou WW (2017). Evaluation and prediction of land use/ land cover changes in the Andassa watershed, Blue Nile Basin, Ethiopia. Environmental Systems Research 6(17): 1-15.
Terefe T, Feyera S, Moges K (2017). The impact of land use/land cover change on ecosystem services in the central highlands of Ethiopia. Ecosystem Services 23:47-54.

280 Afr. J. Environ. Sci. Technol. Tesfa GA, Gizew B, Adebabay G (2018) Land Use Change Detection
Using Remote Sensing Technology. Journal of Earth Science and Climatic Change 9(10):1-6.
Teshome B, Motuma T, Kefyalew S, Habtemariam K (2019). Trends and drivers of land use/land cover change in Western Ethiopia. Applied Geography104:83-93.
Thi-Thanh-Hien P, Turner S Andtrincsi K (2015). Applying a Systematic Review to Land Use Land Cover Change in Northern Upland Vietnam: The Missing Case of the Borderlands. Geographical Research 53(4):419-435.
Thompson JR, Plisinski JS, Olofsson P, Holden CE, Duveneck MJ (2017). Forest loss in New England: A projection of recent trends. PLoS One 12(12):e0189636.
Tilahun A, Teferi B (2015). Accuracy Assessment of land use land cover classification using Google Earth. American Journal of Environmental Protection 4(4):193-198.
Verburg PH, Neumann K, Nol L (2010). Challenges in using land use and land cover data for global change studies. Global Change Biology 17:974-989.
Woldeamlak B,Solomon A (2013). Land-use and land-cover change and its environmental implications in a tropical highland watershed, Ethiopia, International Journal of Environmental Studies70(1):126-139.
Woldeamlak B (2002). Land Cover Dynamics since the 1950s in
Chemoga Watershed, Blue Nile Basin, Ethiopia. Mountain Research and Development 22(3):263-269.
Worku Z, Csaplovies E (2015). Remote Sensing based multitemporal land cover classification and change detection in northwestern Ethiopia, European Journal of Remote Sensing 48(1):121-139.
Yenenesh H, Tilahun B, Kerebeh H, Tafese T (2018). Land use land cover change detection in Gibe Sheleko National Park, Southwestern Ethiopia. Agricultural and Resource Economics: International Scientific E-Journal 4(4):20-30.
Yohannes H, Mohammed A, Elias E (2017). Land Use/Land Cover Dynamics and Its Impact on Biodiversity Resources in the Abijata Shalla National Park, Central Rift Valley Lakes Region, Ethiopia www.tsijournals.com 13(5):1-14.

Vol. 13(7), pp. 281-290, July 2019
DOI: 10.5897/AJEST2018.2648
Article Number: 1D8BD1761159
ISSN: 1996-0786
Copyright ©2019
Author(s) retain the copyright of this article
http://www.academicjournals.org/AJEST
African Journal of Environmental Science and
Technology
Full Length Research Paper
Balancing land management under livestock keeping regimes: A case study of Ruvu and Zigi catchments in
Tanzania
Almas KASHINDYE1*, Richard GILIBA1, Maximillian SEREKA2, Damas MASOLOGO3, Gertrude LYATUU3 and Mathew MPANDA4
1Forestry Training Institute-Olmotonyi, P. O. Box 943, Arusha, Tanzania.
2Department of Water Resources, Ministry of Water and Irrigation, Tanzania.
3United Nations Development Programme (UNDP), Tanzania.
4Independent Researcher, P.O Box 6114,Dar es Salaam Tanzania.
Received 30 December, 2018; Accepted 10 May, 2019
Land degradation has become a global concern that requires countries to take prompt actions. The objective of the study was to assess land management in respect to activities of livestock keeping in the Ruvu and Zigi river basins in Eastern Tanzania. The two basins attract a huge number of livestock from nearby and relatively distant areas in pursuit of pasture and water resources. The results indicated that modes of livestock keeping differs with more free grazing in the lowland and zero grazing in the mountainous areas. Overall, the free grazing in the lowland is dominated by seasonal movement of livestock in and out of the basins in various times of the year. Of the two basins, Ruvu is highly affected by haphazard livestock keeping compared to Zigi. Challenges associated with excessive number of livestock include forest degradation, increased incidences of wildfire, soil degradation, poor maintenance of water resources and ensued conflicts with crop farmers. The number of livestock involved in both basins is under reported due to the non-cooperation received from the pastoralists during livestock census. Pastoralists in the two basins often times defies the government decrees prohibiting movement of livestock from district to another. Limited conflicts have been reported among pastoralists from different tribes while the situation is critical with crop farmers. This study observed that monitoring of livestock movement in the two basins is crucial. The study recommends assessment of the carrying capacities of the basins and subsequent development of the basin-wide rangeland management plans.
Key words: Rangeland management, livestock management, land degradation, water catchment.
INTRODUCTION Land degradation (LD) has become a global concern that requires countries to undertake immediate measures to mitigate the situation. Depletion of the natural resource base triggered by human-induced disturbances and some
natural processes contribute to LD. The LD remain the important discussion point as it entails not only loss of productivity but accelerate biodiversity loss and directly linked to climate change. Water catchments and wetland

282 Afr. J. Environ. Sci. Technol. areas are among areas that have been affected by LD, leading to water scarcity. It is estimated that by 2025, about 1.8 billion people will be expected to live in countries or regions with absolute water scarcity, and two-thirds of the world population could be under water stress conditions (WWAP, 2006). In Tanzania, freshwater is abundantly distributed in form of surface water which account for about 615,000 km
3 (URT,
1 2010). Water
bodies traverses through various land uses including reserved lands, village lands and general lands, which attracts various access and user rights. Freshwater for productive use remain plenty in the country but face challenges due to unequal distribution and access by various stakeholders, hence creating frequent conflicts among users.
Climatic factors as influenced by precipitation, temperature and wind cause people to feel comfortable or not comfortable in the area because the planning and management aspects. Some of studies show that there is the range of bioclimatic comfort zone which people feel comfortable. Drought evaluation is very important as well as climatic ranges. Drought assessments give people an active scenario in the landscape to protect the damaging socioeconomic and politic problems (Yigit et al., 2016b; Cetin and Sevik, 2016a, b; Cetin, 2015a; Cetin et al., 2018a, b; Yucedag et al., 2018; Kaya et a;., 2018).
Land use change is due to human activities and natural factors. Land cover is one of the most important data used to demonstrate the effects of land use changes, especially human activities. Production of land use maps can be done by using different methods on satellite images. By using land cover maps, the changes in urban development and green areas over time have been evaluated. At the same time, the relationship between changes in the land cover over time and changes in the urban population has been examined (Cetin, 2015a, b, c, d; Cetin and Sevik, 2016a, b; Cetin, 2016a, b; Cetin et al., 2018a, b; Yucedag et al., 2018; Kaya et al., 2018).
In Tanzania areas with large number of livestock are vulnerable to LD. Tanzania ranks third in Africa in terms of number of livestock. The country has 25 million cattle, 16.7 million goats, 8 million sheep, 2.4 million pigs, and 36 million chickens. Traditional breeds and processes dominate the Tanzania livestock sector. Distribution of the livestock is dominated by the agro-pastoralists (80%), pastoral communities (14%) and the remaining commercial ranches and dairy sector (6%) (URT, 2010).
The country has extensive rangelands and diverse natural vegetation that support livestock development. About 60 million (ha) of land are suitable for grazing countrywide (URT, 2007). However, distribution of the livestock may not necessarily reflect the distribution of the grazing land but rather skewed and concentrated in some few areas. The rangelands in the country faces dual pressure of over-exploitation and land conversion.
1 URT = United Republic of Tanzania
Rangelands are increasingly converted to other land uses by farming or other development.
Livestock activities contribute 7.4% to the country’s GDP. The annualized growth rate of the sector is low at 2.2%, characterized by increase in livestock numbers rather than productivity gains. Domestic livestock populations have been increasing by 5% per annum over the past 15 years. The livestock sector is severely constrained by low livestock reproductive rates, high mortality and high disease prevalence (URT, 2010).
Despite the fact that the LD and livestock might not be a cause-effect relationship, but this represent widespread perception. Areas such as Shinyanga in central Tanzania are known to be highly affected by overgrazing to the extent of triggering national emergency plan for restoration. In mid 1980s the government and development partners launched a program for land restoration popularly known as Hifadhi Ardhi Shinyanga (HASHI) literally soil conservation in Shinyanga, which was meant to address issue of land degradation specifically soil erosion and vegetation depletion through use of traditional rangeland management system called Ngitili
2 (Duguma et al., 2013).
Policy and legal instrument to support livestock management are very weak, as they are overridden by other land management legal instruments. This has led the livestock management to remain under restrictive measures including prohibition of free livestock movement from one place to another. There is no harmonization of the bylaws by adjacent district authorities hence subjecting livestock keepers to multiple and varied bylaws. The objectives of the current study were to i) assess the livestock management regimes in the Ruvu and Zigi river basins, and ii) assess vulnerability livestock management system in the two basins and can be used to develop in-depth studies and interventions to address land degradation that may be caused by pastoralism. METHODOLOGY
Study sites
The study sites include the Zigi River Basin in the East Usambara Mountains and the Ruvu River Basin in the Uluguru Mountains (Figure 1). The two basins are important landscapes with mosaics of multiple land uses, and they form part of the larger Eastern Afromontane biodiversity hotspot of Tanzania. Zigi River Basin is composed of three main sub-catchments, which are (i) Zigi, (ii) Kihuhwi and (iii) Muzi; while Ruvu River Basin is composed of five main sub-catchments,( i) Mgeta, including Msoro, (ii) Ngerengere, (iii) Upper Ruvu, (iv) Middle Ruvu, and (v) Lower Ruvu.
2Ngitili is an Agrosilvopasture technique common among the Sukuma tribe of
North Western Tanzania “ngitili” (i.e. dry-season fodder reserves) is kind of
fodder bank among the Sukuma agropastoralists of Shinyanga which is a key practice in range management and forest restoration.

Kashindye et al. 283
Figure 1. Composite map showing location of Zigi and Ruvu basins in Tanzania.
Description of Zigi and Ruvu River Basins General characteristics of the study sites (Table 1) include mountainous zone and lowland flat area and the flood plains.
Data collection
Socio-economic data related to livestock management were collected through Key Informant Interview (25 individuals were interviewed), Focused Groups Discussion (246 individual participated) and Individual Questionnaire Survey (128 individuals were interviewed). Key informants interviewed included people with broad knowledge in the local settings related to the livestock management including leaders in the villages, wards and experts from District Authorities. Feed Assessment Tool (FEAST) developed by ILRI (https://www.ilri.org/feast)3 was used in conducting Focus Group Discussions (FGD), involving about 12 to 16 people selected objectively from different categories of livestock
3The Feed Assessment Tool (FEAST) is a systematic method to assess local
feed resource availability and use. It helps in the design of intervention
strategies aiming to optimize feed utilization and animal production. The tool comprises two main elements: (a) a focused PRA exercise which provides an
overview of the farming system with particular emphasis on livestock feed
aspects. and (b) a simple and brief quantitative questionnaire, designed to be completed by experts under the guidance of the Feast facilitator.
keepers. As per FEAST protocol, the Individual Questionnaire Survey was administered among participants of the FGD to gather further insights about livestock management at household level as recommended by Mangesho et al. (2013).
Participatory field observations were done in selected areas villages (Table 2) through Transect Walk method, 5 and 3 transect walks were done at Ruvu and Zigi Basin respectively. Establishment of the transects were done in collaboration with local leaders taking into account areas designated for livestock grazing as per existing village land use plans. In absence of land use plans, areas designated and used for grazing were also identified, visited and assessed and recorded. Participatory GIS was used to allow local people familiar with long term historical narrative of the area to record spatial details of existing land cover and land use (URT, 2015). It was also used to pinpoint areas affected by degradation, the extent of land that is currently under settlement and later correlate this with population sizes and densities; and the extent of land in each basin used for grazing migration routes. It was further used in mapping seasonal movements of livestock and identify (by type, location and scale), a suite of prospective sustainable livestock management technologies.
Data analysis
Standard methods for data analyses were applied for both socio-economic and biophysical information. Description statistics were computed for mean, standard deviation, standard error, maximum
284 Afr. J. Environ. Sci. Technol.
Table 1. Description of the study sites in Ruvu and Zigi River basins.
Description Ruvu River Basin Zigi River Basin
Location 60°05´ and 70°45´S and 37°15´and39°00´ E 4°48 and 5°14S and 38°32 and 38°48E
Altitudinal range
150 m and 2,638 m. 300 and 1174 m
Size 17,700 km2 1,082 km
2
Rainfall distribution
Rainfall varies in different places ranging from 900 mm per annum on the north-western slopes to 1200- 3100 mm on the drier western slopes to 2500-4000 mm on the wetter eastern slopes.
1918 mm with up to 2262 mm near Kwamkoro on the Amani plateau.
Rain season
Rainfall on the eastern side is continuous throughout the year with no distinct dry season, while in the western part there are two rains seasons distinguished as long rains from February to June, and short rains in October to January; with dry season extending between July to October.
Rainfall distribution is bi-modal peaking between March and May and between September and December. The dry seasons are from June to August and January to March
Temperature
Average monthly minimum and maximum temperatures are almost the same throughout the basin; the coldest month is August (about 18°C) and the hottest month is February (about 32°C). The annual average temperature is about 26°C.
The mean annual temperature at about 900 m altitude is 20.6°C with a mean daily maximum temperature of 24.9°C and a mean daily minimum temperature of 16.3°C
Soil condition
Soils are acidic Lithosols and Ferralitic red, yellow and brown latosols, which have developed from Precambrian granulite, Gneiss and Migmatite rocks. The soils in the sub-basin range from sandy clay with excessive drainage to sandy loam with excessive drainage in the highlands of the Uluguru. In the middle of the sub-basin the soils range from sandy loam to sandy clay loam, both with imperfect drainage. As the sub-basin drains towards the coastal area, soils range from loamy sand with good drainage to sandy with moderate drainage.
The soils of the East Usambara Mountains are largely clay and clay-loams usually between 1-5 m in depth. Soils at lower altitudes have more or less the same visual appearance as at the higher altitude, but are less leached and much less acidic. Soil pH falls off from about pH 7 at 300 m to about pH 6.5 at 850 m and then diminishes rapidly below pH 5 at 900 m and to about pH 4 at 1050 m
Human population
High populated areas include those close to urban areas especially around Morogoro municipal and Bagamoyo town. It is also similar to peri-urban areas such as Kiroka, Mlali, Vigwaza and Kiwangwa which are very popular for agricultural production and livestock management. They also attract off-farm businesses due to their accessibility and links to the major markets.
Population density in the basin is relatively higher in the highlands compared to the lowland, with highest one reported in Amani plateau standing at 140 people/km
2, with
some villages estimated at 300 people/km2.
Crop farming
Multi-strata agroforestry system is dominant in the mountainous areas comprised of trees-crops-livestock. In the lowland, dominant crop includes maize, cassava and paddy rice.
Agroforestry is the main farming practice in the highland with dominated by spices such as cardamom, cloves, cinnamon and black pepper. The main food crops cultivated are maize, cassava, bananas and beans. Other crops which are popular include sugarcane and production of fruits such as mango and oranges
Source: IUCN (2010a).
and minimum. Combination of multiple tools/software was used including SPSS and excel spreadsheet for socio-economic and simple arithmetic data, while FEAST tool version 2.2 and R-software (https://www.r-project.org/)4 were used. Remote sensed data were analyzed using IMPACT software developed by the EU Joint Research Centre. Narratives from local people were useful in
4R Core Team (2013). R: A language and environment for statistical
computing. R Foundation for Statistical Computing, Vienna, Austria. (URL
http://www.R-project.org/.) Accessed 24th April 2018.
providing understanding of the socio-economic forces behind land use and land cover modifications. The land degradation map was generated by using weighted overlay tool in ArcGIS. The tool combines the following four steps:
(i) Identification of the input rasters. The major factors which were used for the weighted multi-criteria evaluation includes; distance from rivers, distance from roads, distance from cultivated lands. (ii) Reclassification of values in the input raster into a common evaluation scale of risk. All the raster were reclassified into a common risk scale of 1 to 3, with 3 being the most vulnerable and 1

Kashindye et al. 285
Table 2. Sampled villages in the study sites.
Basin Villages/streets/township
Zigi River Basin Sakale, Mlesa, Amani (Shebomeza), Kwemwewe, Kihara site, Ubiri, Longuza
Ruvu River Basin Mkonowa Mara, Mvuha, Kongwa, Bonye, Kibangile, Mbwade, Tandai, Kalundwa, Amini, Bagilo, Tegetero, Mifulu and Hewe, Nyandira, Mgeta Kibaoni, Bunduki, Mlali, Kinyenze, Tangeni, Mzumbe
being the lowest vulnerable to land degradation. (iii) Assigning of weights to factors. Weights were assigned to each factor in order of its importance (distance from river = 0.4, distance from major road = 0.3, distance from cultivated lands = 0.3) and a total score was obtained for each alternative by multiplying the importance weight assigned to each attribute by the scaled value. (v) Overlay analysis. Add the resulting cell values together to produce the output raster indicating high, medium and low vulnerable areas to land degradation. The landscape degradation was limited to distance from rivers, from roads and cultivated lands only because of the study objective was to undertake a comprehensive biophysical resources assessment of the Ruvu and Zigi catchments for development of decision support tools to enable effective management, with emphasis on: (i) Updating land-cover data for Ruvu and Zigi catchments (ii) Identifying and map badly degraded areas both within and outside of protected areas, especially those that might require specific rehabilitation measures (iii) Assessing the extent of land that is currently under settlement and correlate this with population sizes and densities Under such circumstance it was important to focus on a key predictors that enabled to isolate key drivers of land degradation.
RESULTS Livestock concentration in Ruvu and Zigi catchments Livestock is unevenly distributed in the two catchments (Table 3) with higher number in the Ruvu compared to Zigi. The number of cows and goats in Ruvu is almost double that of Zigi catchment. The livestock density in Ruvu catchment has been indicated to be around 2.25 to 8 ha per livestock unit (LU) per year (Millao, pers. comm. 2018). The overall current carrying capacity ranges from 2 to 8 LU per ha per year. This state of affair has rendered the catchment into large livestock population.
The management strategies of livestock in the catchment is diverse because of the aggregate nature of the study area and the livestock keeping practices (Table 4). There are basically two predominant practices which are nomadic and zero grazing. The management strategies employed are either stand alone or a combination of more than one strategy. Results
from stakeholders’ consultations indicated that livestock migration in Ruvu and Zigi River basins occurs in three patterns; i) inward flow, ii) outward flow and iii) internal movements within the basins (Figure 2). The migration occurs mainly from the onset of dry season, and the distance ranges from few to tens of kilometres while time ranges from weeks to months.
Land degradation in the Ruvu and Zigi Basins
Results from combination of tools including participatory mapping, remote sensing and geographic information system (GIS), and stakeholders’ consultations have indicated that some areas in the Ruvu and Zigi basins have been degraded and remain vulnerable to further degradation (Figures 3 and 4) due to rapid population growth, natural resources exploitation and abject poverty (USAID, 2008). It should be noted that the extend of land degraded in specific wards of the study areas were classified using the rank to indicate from less degraded to more degraded in hectare as was observed during baseline survey of the Sustainable Land Management (SLM) project, it does not rank degradation as severe or less severe. The area range is just indicative of the extent for ease aggregation of the extent.
DISCUSSION
Number of livestock vs. carrying capacity
Livestock keeping in Tanzania is dominated by agro-pastoral communities that engage in both crop farming and animal husbandry (URT, 2015). Due to this dual livelihood practices, most of the communities are attracted to areas that are fertile to enable crop farming but also access to grazing land (Engida et al., 2015).
The Ruvu and Zigi basins provide best landscapes to the realization of these agro-pastoral communities IUCN, 2010a). In terms of livestock, the two basins harbour a considerable number of livestock (Table 4).
*Corresponding author. E-mail: [email protected].
Author(s) agree that this article remain permanently open access under the terms of the Creative Commons Attribution
License 4.0 International License

286 Afr. J. Environ. Sci. Technol.
Table 3. Livestock population in the catchments.
S/N Catchment Cows Goats Sheep
1 Ruvu 363,519 75,624 33,428
2 Zigi 151,414 37,409 4,106
Total 514,933 113,033 37,534
Table 4. Management strategies applied for livestock.
S/N Management Strategy Extent Practice
1 Free range grazing Common and wide spread Nomadic pastoralists
2 Fodder bank Very limited Nomadic pastoralists notable
3 Fodder fetching Common and wide spread Zero grazing
4 Tethering Common and wide spread Zero grazing
5 Planting fodder Common and wider spread Zero grazing
6 Manageable livestock Minimal Nomadic and zero grazing
7 Seasonal Migration Common during drought period Nomadic pastoralists
Figure 2. Sketch map showing livestock migration routes during dry season.
(However, Ruvu basin accommodate more livestock compared to Zigi basin due to its large size and
connectivity to other livestock rich areas (IUCN, 2010a). At current levels, the number of livestock in Ruvu basin

Kashindye et al. 287
Figure 3. The extent of degraded land in specific wards in Ruvu Catchment.
exceeds its carrying capacity (it should be noted that the average carrying capacity for both catchments ranges from 2 - 8 LU per ha per year), mainly with large amount of livestock located in the lowland areas. In contrast, the livestock keeping in Zigi basin is much more lucrative compared to the Ruvu basin, partly contributed by use of improved breeds and presence of formalized milk trade (AECF, 2011).
The terrain of these two basins influence the management practices of livestock keeping, whereby in the mountainous areas it is mostly zero grazing while in the lowland is mostly free grazing (Mangesho et al., 2013, Covarrubias et al., 2012). Sharp contrast exists in Ruvu and Zigi basins in terms of livestock keeping as different management strategies are employed. While
Ruvu is dominated by free range, extensive and seasonal migration model, the situation is different in Zigi basin which exhibits zero grazing and limited stock size. In the Ruvu basin, large rangeland plains are found throughout the southern part of the basin, extending in Ngerengere plains, around Wami-Mbiki Wildlife Management Area and Chalinze woodland area (IUCN, 2010b). This vast area contains forests and woodlands that are less inhabited by humans hence provide extensive ground for livestock grazing.
Livestock grazing under free range in Ruvu basin have contributed to the accelerating reduction of the tree cover of the basin through tree cuts in favour of grasses (IUCN, 2010a). The strategy of undertaking tree cuts to allow creation of open spaces for grasses to flourish have been
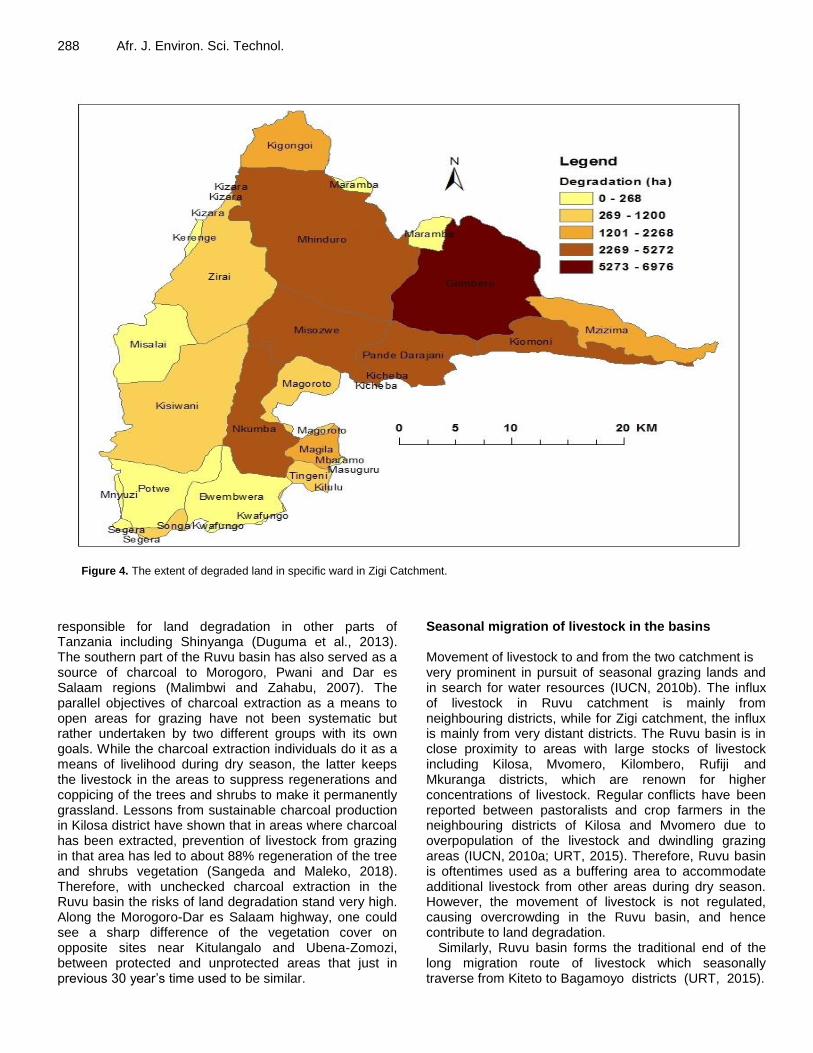
288 Afr. J. Environ. Sci. Technol.
Figure 4. The extent of degraded land in specific ward in Zigi Catchment.
responsible for land degradation in other parts of Tanzania including Shinyanga (Duguma et al., 2013). The southern part of the Ruvu basin has also served as a source of charcoal to Morogoro, Pwani and Dar es Salaam regions (Malimbwi and Zahabu, 2007). The parallel objectives of charcoal extraction as a means to open areas for grazing have not been systematic but rather undertaken by two different groups with its own goals. While the charcoal extraction individuals do it as a means of livelihood during dry season, the latter keeps the livestock in the areas to suppress regenerations and coppicing of the trees and shrubs to make it permanently grassland. Lessons from sustainable charcoal production in Kilosa district have shown that in areas where charcoal has been extracted, prevention of livestock from grazing in that area has led to about 88% regeneration of the tree and shrubs vegetation (Sangeda and Maleko, 2018). Therefore, with unchecked charcoal extraction in the Ruvu basin the risks of land degradation stand very high. Along the Morogoro-Dar es Salaam highway, one could see a sharp difference of the vegetation cover on opposite sites near Kitulangalo and Ubena-Zomozi, between protected and unprotected areas that just in previous 30 year’s time used to be similar.
Seasonal migration of livestock in the basins Movement of livestock to and from the two catchment is very prominent in pursuit of seasonal grazing lands and in search for water resources (IUCN, 2010b). The influx of livestock in Ruvu catchment is mainly from neighbouring districts, while for Zigi catchment, the influx is mainly from very distant districts. The Ruvu basin is in close proximity to areas with large stocks of livestock including Kilosa, Mvomero, Kilombero, Rufiji and Mkuranga districts, which are renown for higher concentrations of livestock. Regular conflicts have been reported between pastoralists and crop farmers in the neighbouring districts of Kilosa and Mvomero due to overpopulation of the livestock and dwindling grazing areas (IUCN, 2010a; URT, 2015). Therefore, Ruvu basin is oftentimes used as a buffering area to accommodate additional livestock from other areas during dry season. However, the movement of livestock is not regulated, causing overcrowding in the Ruvu basin, and hence contribute to land degradation.
Similarly, Ruvu basin forms the traditional end of the long migration route of livestock which seasonally traverse from Kiteto to Bagamoyo districts (URT, 2015).

Currently, the National Land Use Planning Commission (NLUPC) of Tanzania is developing a pilot scheme to allow gazettement of livestock migration route in the eastern zone traversing the eastern part of the Ruvu basin. The effort will address land use conflicts due to improper tenure regime between pastoralists and agriculture. The government of Tanzania has also launched a countrywide program to label and mark livestock per each district to restrict unwarranted movements. Livestock vs. land degradation
Landscape degradation in the two basins is eminent mainly due to excessive human induced disturbances (USAID, 2014, Yanda and Munishi, 2007). Scale of degradation differs among various categories of land uses in the landscape, for instance, the highlands vs. lowland, protected vs. unprotected areas, farming practices and charcoal extraction. Within the protected areas, degradation is mostly due to encroachment of human activities which are considered to be illegal and should be contained by effective law enforcement. Incidences of livestock grazing within protected areas such as forest reserves and Wami-Mbiki WMA have been very common in the Ruvu basin. Detrimental effect of grazing in the forest reserves has been related to trampling of the seed banks and regenerants hence compromising natural recruitment of the trees and shrubs similar to the observation by Armour et al. (1994) in Western Riparian Ecosystem. However, the degradation within protected areas is relatively small in terms of magnitude but significant. Despite that some of the degradation are not easily recorded or conceptualized in terms of vegetation cover, but they interfere with the functioning of the ecosystems. It has also been noted that high risks for land degradation face areas that are closer to the main access roads, close proximity to rivers and where there is intensive cereal crops cultivation, this observation matches with what was observed by Yanda and Munishi (2007).
In the zone outside protected areas, management of land uses falls under the jurisdiction of village government, town and district councils, municipals and/or city’s authorities. The challenge of land degradation outside protected areas is a result of improper planning of the land uses and its enforcement (URT, 2009). Key drivers include; Overgrazing: Livestock keeping in the lowland areas of the two river catchments are exercised by free range. However, there signs of overgrazing due to excessive opening up of areas that are neither cultivation land nor used in other economic activities (URT, 2009). This trend further exacerbates land degradation due to soil compaction and erosion, damage to water sources and impairs biodiversity. Two types of grazing are experienced in the basins; one is the permanent inhabitation of the livestock with amounts to hundreds of
Kashindye et al. 289 thousands, and secondly is the seasonal influx of livestock looking for pasture and water from other distance areas. It is recognized that during certain seasons, livestock from outside the basin as far as Simanjiro and Kiteto cross all the way to part of Tanga and then to the Coast regions, ending up spreading to the lower parts of the two catchments (Msuya, 2009). The seasonal influx of livestock is very detrimental as the numbers are very large herds of cattle, beyond the carrying capacity of the land. Conclusion The Ruvu and Zigi basins are important in hydrological and biodiversity perspective in supporting human livelihood. The two basins are renowned for their state of ecosystem services, regarded as part of the water towers in the eastern bloc of the country. In pursuit for pasture and water, concentration of livestock in the basins has exceeded the carrying capacity, and thus threatening their ecosystem integrity. Uncontrolled influx of livestock from nearby and distant areas, has contributed to the deterioration of the state of ecosystem services. Range lands are not delineated, grazing is done all over the catchments, these situations have been causing frictions in the community between farmers and pastoralists. The outcome of the uncontrolled livestock management is increasing degradation of the land resources in various areas within the two basins. The study recommends agroforestry practices in the mountainous areas, and development and enforcement of land use plans in the lowland areas. Range land for grazing should be delineated, with subsequence installation of necessary infrastructures and markets for livestock products. The rangeland carrying capacity should be maintained to avoid excessive number of livestock. Use of both modern and indigenous knowledge on maintenance of pasture area should be stressed. CONFLICT OF INTERESTS The authors have not declared any conflict of interests. REFERENCES Armour C, Duff D, Elmore W (1994). The Effects of Livestock Grazing
on Western Riparian and Stream Ecosystem. Fisheries 19(9):912. Cetin M, Onac AK, Sevik H, Canturk U, Akpinar H (2018a). Chronicles
and geoheritage of the ancient Roman city of Pompeiopolis: a landscape plan. Arabian Journal of Geosciences 11:798.
Cetin M, Sevik H, Canturk U, Cakir C (2018b) Evaluation of the recreational potential of Kutahya Urban Forest. Fresenius Environmental Bulletin 27(5):2629-2634.
Cetin M, Sevik H (2016a). Evaluating the recreation potential of Ilgaz Mountain National Park in Turkey. Environmental Monitoring and Assessment 188(1):52.
Cetin M, Sevik H (2016b). Assessing Potential Areas of Ecotourism through a Case Study in Ilgaz Mountain National Park, In Tech,
290 Afr. J. Environ. Sci. Technol.
Chapter 5, Eds: Leszek Butowski 190:81- 110. http://www.intechopen.com/books/tourism-from-empirical-research-towards-practical-application/assessing-potential-areas-of-ecotourism-through-a-case-study-in-ilgaz-mountain-national-park
Cetin M (2015a). Determining the bioclimatic comfort in Kastamonu City. Environmental Monitoring and Assessment 187(10):640
Cetin M (2015b). Evaluation of the sustainable tourism potential of a protected area for landscape planning: a case study of the ancient city of Pompeipolis in Kastamonu. International Journal of Sustainable Development and World Ecology 22(6):490-495.
Cetin M (2015c). Using GIS analysis to assess urban green space in terms of accessibility: case study in Kutahya. International Journal of Sustainable Development and World Ecology 22(5):420-424.
Cetin M (2015d). Consideration of permeable pavement in Landscape Architecture. Journal of Environmental Protection and Ecology 16(1):385-392.
Covarrubias K, Nsiima L, Zezza A (2012). Livestock and livelihoods in rural Tanzania. A descriptive analysis of the 2009 National Panel Survey.
Duguma LA, Minang PA, Kimaro AA, Otsyina R, Mpanda M (2013). Climate Smart Landscapes: Integrating Mitigation, Adaptation and Development in Shinyanga Region, Tanzania: 4.
Engida E, Guthiga P, Karugia J (2015). The Role of Livestock in the Tanzanian Economy: Policy Analysis Using a Dynamic Computable General Equilibrium Model for Tanzania. 29th International Conference of Agricultural Economists. Agriculture in an Interconnected World. Universta Degli Di Milano. 8 - 14 August 2015.
IUCN Eastern and Southern Africa Programme (2010a). The Ruvu Basin: A Situation Analysis., xvi + 96 pp https://portals.iucn.org/library/node/9603
IUCN Eastern and Southern Africa Programme (2010b). The Wami Basin: A Situation Analysis., xviii + 92 pp.
Kaya E, Agca M, Adiguzel F, Cetin M (2018). Spatial data analysis with R programming for environment. Human and ecological risk assessment: An International Journal, pp. 1-10.
Malimbwi RE, Zahabu EM (2007). Woodlands and the charcoal trade: the case of Dar es Salaam City. Research and development for sustainable management of semiarid miombo woodlands in East Africa. Working Papers of the Finnish Forest Research Institute 98:93-114.
Mangesho WE, Loina R, Bwire J, Maass BL, Lukuyu B, Wassena FJ (2013). Report of a Feed Assessment 3 – Lushoto District, Tanga Region, the United Republic of Tanzania. Report. International Center for Tropical Agriculture (CIAT). https://cgspace.cgiar.org/handle/10568/51747
Msuya AJ (2009). Analysis of Pastoralists and Farmers in Northern Part of Tanzania from Land Administration Perspective. A Thesis Submitted to ITC as Partial Fulfillment for the Requirement of the Degree of Masters of Science in Geonformatic Science and Earth Observation.
Sangeda AZ, Maleko DD (2018). Regeneration Effectiveness Post Tree
Harvesting in Natural Miombo Woodlands, Tanzania. Journal of Plant Science and Agricultural Research 2(1):10.
The Africa Enterprise Challenge Fund (AECF) (2011). Tanga Fresh AECF Case Study.
United Republic of Tanzania (URT) (2007). National Adaptation Programme of Action (NAPA). Vice President's Office, Division of Environment. https://unfccc.int/resource/docs/napa/tza01.pdf
United Republic of Tanzania (URT) (2009). Fourth National Report on Implementation of Convention on Biological Diversity (CDB). Published by the Vice President’s Office, Division of Environment, United Republic of Tanzania (URT), Dar es Salaam 2009. ISBN: 9987-8990- https://www.cbd.int/doc/world/tz/tz-nr-04-en.pdf
United Republic of Tanzania URT (2010). Livestock Sector Development Strategy. Government Printer -Dar es Salaam.
United Republic of Tanzania (URT) (2015) Tanzania livestock modernization initiative. Dar es Salaam, Tanzania: Ministry of Livestock and Fisheries Development. https://cgspace.cgiar.org/handle/10568/67749
USAID (2008). A Profile of the Wami River Sub-Basin. Prepared by the Coastal Resources Center at the University of Rhode Island for Tanzania. Coastal Management Partnership for Sustainable Coastal Communities and Ecosystems in Tanzania. https://www.crc.uri.edu/download/wami_profile_tagged_final_Nov08.pdf
USAID (2014).Wami River Basin, Tanzania, Environmental Flow Assessment Phase II, GLOWIS-FIS. Tanzania Integrated Water, Sanitation and Hygiene (iWASH) program.
WWAP (United Nations World Water Assessment Programme) (2006). Water: a shared responsibility; the United Nations world water development report 2. United Nations Educational, Scientific and Cultural Organization (UNESCO). UNESCO Digital Library. https://unesdoc.unesco.org/ark:/48223/pf0000145405
Yanda PZ, Munishi PKT (2007). Hydrologic and Land Use/Cover Change Analysis for the Ruvu River (Uluguru) and Sigi River (East Usambara) Watersheds. Report to WWF/CARE for the Equitable Payment for Watershed Services Project. 87p. http://repository.udsm.ac.tz:8080/xmlui/handle/123456789/834
Yigit N, Sevik H, Cetin M, Kaya N (2016b). Determination of the Effect of Drought Stress on the Seed Germination in Some Plant Species. Chapter 3, Intech Open, Water Stress in Plants, Eds: Ismail Md. Mofizur Rahman, Zinnat Ara Begum, Hiroshi Hasegawa, pp. 43-62.
Yucedag C, Kaya LG, Cetin M (2018). Identifying and assessing environmental awareness of hotel and restaurant employees’ attitudes in the Amasra District of Bartin. Environmental Monitoring and Assessment 190(2):60.

Vol. 13(7), pp. 291-295, July 2019
DOI: 10.5897/AJEST2018.2549
Article Number: 3DA09D261220
ISSN: 1996-0786
Copyright ©2019
Author(s) retain the copyright of this article
http://www.academicjournals.org/AJEST
African Journal of Environmental Science and
Technology
Full Length Research Paper
Residues of the transformation of halieutics products: An alternative substrate for energy valorization of wastes by methanisation for a local sustainable
development (preliminary results)
N. N. Kebe1*, P. A. Fall2, D. Ndiaye1 and D. Diouf1
1Laboratory of Electronics, Computer science, Telecommunications and Renewable Energy, Gaston Berger
University, Senegal. 2Environmental consultant, Biogas specialist, Senegal.
Received 15 August 2018, Accepted 26 October 2018
The purpose of this study is to evaluate the biogas productivity potential of residues of the transformation of halieutics products. Experiments were conducted in two digesters of PUXIN model of 20 m
3, where the temperature is 35°C. Multirae analyser was used to know the composition of biogas
produced. A gas counter was also used for counting the amount of biogas produced during the experiment. There was also a balloon of storage of 10 m
3 downstream from the digester, for storing the
biogas produced. The total volume with 2970 kg of substrate was 9.67 m3. The maximum daily volume
of produced biogas was 1.561 m3 at the 5th day after the installation of the gas counter. The potential
biogas is then, 3.25 m3/T of wastes. While the potential biogas found in earlier study is 53 m
3/T of
wastes. For analyses of produced biogas, maximum percentages of methane, oxygen, carbon monoxide and hydrogen sulfide are, respectively 91%, 20.9%, 196 ppm and 44.7 ppm. Method of cooking halieutics products with biogas takes much time than that using wood of heating. Key words: Substrate, biogas, potential biogas, digester.
INTRODUCTION
Since the crisis of agriculture caused by years of drought, fishing season occupies an important place in the economy of Senegal, in terms of export earnings. Thus, it strongly contributes to the reduction of the
unemployment rate and the need for the animal protein populations. Conscious of this fact, the state of Senegal with the assistance of its partners sets up transformation units of halieutics products, in all regions where the
*Corresponding author. E-mail: [email protected].
Abbreviations: %, Percentage; °C, degree Celsius; kg, kilogramme; m3, cube meter; m3/T, cube meter per ton; ppm, parts
per million.
Author(s) agree that this article remain permanently open access under the terms of the Creative Commons Attribution
License 4.0 International License
292 Afr. J. Environ. Sci. Technol. fishing season is practiced. These units currently employ many women, and make it possible to these last to take part in the development of our country.
In the region of St-Louis, 700 women work at the site of the transformation of halieutics products. They transform every day (that is to say 10 months out of 12) 6000 tons of fish per year, for obtaining different products like dried fermented products, dried salted fishes, dried braised fishes, and dried smoked fishes (Le Partenariat, 2015). This last, which is transformed the most, requires much energy at the time of the stage of cooking of fish. Generally, women use wood of heating and even, as of time, plastics. What created pollution of the atmosphere and in particular health problems for these women. Also, wastes coming from the transformation are not used, and then are most often dumped in the river or the sea, or exposed to free air. However, these wastes can be used as substrate for a biogas unit for example.
To meet the energy needs of the grouping, but also the need for cleansing for the site, “The Partnership”, technical partner of National Program of Domesticated Biogas of Senegal, accounts to help the transformer women to develop waste halieutics present in the site by the installation of a collective unit of methanisation. This project lies within the scope of the biogas project of St-Louis.
Biogas comes from anaerobic digestion of organic
wastes from animal or vegetable origin. It is composed of
methane CH4 (50 to 75%), carbon dioxide CO2 (25 to
40%), water H2O, oxygen O2, hydrogen sulfide H2S
(Abdoulaye Fall, 2013). This fermentation is done in the absence of air in a fermenter called digester. The digestate which is also a byproduct of digestion can be used as fertilizer for crops. Among the waste that can be methanized, we can cite cow dung, livestock effluents, sludge, cultures, etc (Chen and Neibling 2014). Cow dung is the most used substrate by National Program of domesticated biogas of Senegal, due to its availability across the country (Abdou Ndour 2014). The choice of the substrate used during anaerobic digestion is important. To maximize methane production, it is better to use products rich in lipids, carbohydrate and proteins. This is why we’re interested in residues of the transformation of fish products for biogas production; because they are substrates rich in lipids and proteins (Kaffe and Kim, 2012), which can speed up the process of forming methane during anaerobic digestion.
This work was done within the framework of technical, social and organizational feasibility of project of installation of digesters at the site of transformation of halieutics products MATERIALS AND METHODS
Substrate
Residues of the transformation of halieutics products are the
substrate used for anaerobic digestion in this experimentation. They were collected at the site of transformation of halieutics products of Hydrobase at St-Louis. The components of fish wastes are nonfresh fish, head, internal organs, a n d guts. They decompose themselves rapidly due to their high composition of lipids and proteins. These wastes come from the transformation of fishes by women who constitute themselves in small enterprises. Women who work in the site, can transform around 20 cases per day according to the woman, that is, 1000 kg of fishes per woman and per day, and this generates 500 kg of wastes per day in period of strong season (Le Partenariat, 2015). All this to say that the amount of fish wastes generated in the site is very important and would allow to develop biomethanisation using fish wastes. Experimental setup For having biogas using residues of transformation of halieutics products, the experimentation took place on two digesters of PUXIN model, which has b e e n developed by a Chinese society named PUXIN (Figure 1).
The volume of each digester is 10 m3. In each digester, we have a mixture of residues of halieutics products with water in the same proportion. And when the gas is produced, it leaves the digester, passes by the gas pipes and arrives at the balloon of storage, which has a volume of 10 m3. If the amount of biogas in the balloon is sufficient, to be used for the transformation of halieutics products, furnaces will be connected to the balloon. And the biogas from residues of halieutics products will be tested by women who work in the site, to compare it with their old cooking method.
For a first filling of the digesters, on 18th May 2017, each of them were placed in 1000 kg of residues of halieutics products, mixed with the same amount of water. Which represents on the whole, 2000 kg of residues of halieutics products in the two digesters. Nineteen days after the first filling, it was noticed that there was no gas in the balloon. This is due to the fact that with Puxin model, water must be above the gasometer to avoid gas leakage. It was then necessary to increase the amount of water, to have a change of state of the balloon.
RESULTS AND DISCUSSION Volume of biogas produced and its composition After the first filling of the two digesters with 2000 kg of substrate, the gas generation has not started at once. It was then necessary, at the 19th day after the first filling, to increase the amount of water until it reaches the bell. And the gas starts to pass in the balloon of storage at the 19th day and gas generation continues then 63 days later.
According to the work of Salam et al. (2009), the gas generation started on the 7th day with anaerobic digestion of fish waste, and fish waste in co digestion with cow dung. Which means that much gas was lost during the time of first filling and on the 19th day.
At the 28th day, the gas counter was installed. Figure 2 shows the volume of produced gas for residues of transformation of halieutics products during the 63 days. The total volume of produced gas is 9.67 m
3.
The filling has been repeated during the experience on different dates. Table 1 shows some information

Figure 1. 2 Digesters of PUXIN model.
12
10
8
6
4
2
0
0 20 40
Time (days)
60
Tota
l vo
lum
e o
f p
rod
uce
d
gas
(m3 )
Time (days)
12
10
8
6
4
2
0
0 20 40
Time (days)
60
Tota
l vo
lum
e o
f p
rod
uce
d
gas
(m3 )
Time (days)
Figure 2. Total volume of produced gas.
Table 1. Quantity of susbstrate put into the disgester.
Date Amount of susbstrate (kg)
18th May 2017 2000
13th June 2017 600
02nd July 2017 40
10th July 2017 20
02nd August 2017 200
10th August 2017 35
16th August 2017 75
Total 2970
about the quantity of substrates put in the digesters during the experiment.
To have the amount of gas produced during the experience, upstream of the balloon of storage, has been installed a gas counter. That allows us to know with precision, the amount of gas that have passed through the balloon of storage.
The produced gas needs to be analyzed to know its composition in different gas. This is why a MULTI RAE ANALYSER, which gave the rate of four gases found in
Kebe et al. 293
Figure 3. Daily volume of produced gas.
the biogas, was used. These gases are carbon monoxide
(CO), methane (CH4), dioxygen (O2) and hydrogen
sulfide (H2S) with different proportion in the biogas. After the gas has been produced, tests of cooking have
been done by two women to compare two manners of cooking: one using biogas and the other using wood of heating. It is clear that cooking with biogas respect more the environmental procedures and is more ecological than using the wood of heating. But we have searched for the manner of cooking that takes less time between biogas and wood of heating.
Figure 3 shows the daily volume of produced gas with residues of transformation of halieutics products. Figure 3 shows greater production at the 5th day with 1.561 m
3 and at the 54th day with 0.82 m3.
For Figures 2 and 3, time is counted starting from the assembly of gas meter. These information could not be obtained only after the installation of gas meter. The greater gas production was obtained at: (1) 5, 6, 7 and 9th day: at the beginning of the experiment, the balloon of storage was not installed. The biogas which was in the gasometer have passed thus in the balloon of storage. (2) 19 and 26th day: there was a filling of the digesters with the residues of the transformation of halieutics products. (3) 52, 54, 55, 56 and 57th day: there was also a filling of the digesters with more than 200 kg of residues of the transformation of halieutics products. During the experiment, without counting the gas lost, the amount of gas produced is about 9.67 m
3. The
potential biogas is then, 3.25 m3/T of wastes. However,
the potential biogas found in the work of Tomczak-Wandzel et al. (2013), is 53 m
3/T of wastes. There is a
great difference between these two results; this could be due to the fact that much gas was lost during the

294 Afr. J. Environ. Sci. Technol.
Table 2. Comparison of two methods of cooking, with biogas and wood heating.
Method of cooking Biogas Wood heating
Water to be heated (L) 15 15
Quantity of fish (kg) 25 25
Time of heating of water (min) 37 30
Time of cooking of fish (min) 164 41
Quantity of biogas for all the transformation (m3) 2.491 -
Quantity of wood heating for all the transformation (kg) - 4
experiment.
The biogas obtained after fermentation of residues of transformation of halieutics products was analyzed in order to know its composition in different gas such as
methane (CH4), carbon monoxide (CO), oxygen (O) and
hydrogen sulfide (H2S). For many analyses that were done, different rate of gas
was found composing of biogas. For each gas, different values were found varying: (1) Methane: 80 to 91% (2) Carbon monoxide: 22 to 196 ppm (3) Oxygen: 10 to 20.9% (4) Hydrogen sulfide: 0 to 44.7 ppm. These values proved that the biogas produced with residues of transformation of halieutics products is rich in methane. And the other gas like hydrogen sulfide is not an important component due to their low rate.
All this to say that anaerobic digestion using fish waste as a substrate is quite possible, but the volume of gas produced is not sufficient compared to the experiments made previously with fish wastes or co-digestion of fish wastes with other substrates.
Test of cooking Biogas produced by fermentation of residues of transformation of halieutics products was tested by two transformers women. The purpose of these tests was to evaluate the cooking time and the volume of gas used and to compare the method of cooking of halieutics products with biogas and using wood of heating.
Table 2 gives information about the two methods of cooking of halieutics products. A difference was observed between the two methods of cooking; transformation with biogas being too slow. This would not be due to a low pressure of biogas, because during the transformation, a pump was used for recording the pressure of gas. This slowness would then be due to the stove used for the transformation of fish with biogas. The design of the stoves should then be remade to improve the output of the transformation with biogas.
Conclusion The production of biogas with residues of the transformation of halieutics products is possible. With this substrate, the amount of gas for cooking test was 9.63 m
3 during the experiment. These tests were done at the site of transformation of
halieutics products to test the capability of the residues of transformation of halieutics products to produce biogas. During this test, some information were collected, such as the amount of total biogas produced and the daily biogas produced, and the composition of the biogas produced. Tests of cooking were also done to know if it is possible to use this gas for cooking halieutics products. The total retention time in this study is about 65 days.
But these information are not sufficient scientifically. Different parameters like the temperature of the digesters, the composition of the substrate, the pH, the pressure of gas, and the composition of the digestate were not determined.
This is the reason why subsequent studies will be carried out for more information on this. And these parameters are essential for increasing the anaerobic efficiency of residues of the transformation of halieutics products. Co-digestion of residues of halieutics products with other substrate will also be done soon to enhance the anaerobic efficiency of this substrate (Kassuwi et al., 2012; Serrano et al., 2013).
CONFLICT OF INTERESTS The authors have not declared any conflict of interests. ACKNOWLEDGEMENTS
This work was done with the support of “The partnership”, an association that promotes the development of biogas in north of Senegal. It was also done within the framework of technical, social and organizational feasibility of project of installation of digesters at the site of transformation of halieutics products of Hydrobase at St-Louis. The authors express deep gratitude to the

CEA MITIC for granting permission to attend the conference Casamansun 2018 at Ziguinchor (Senegal) and to present this work. REFERENCES Abdoulaye Fall P (2013). The biogas-definition, principles and
applications, Senegal. Abdou Ndour (2014). La méthanisation au Sénégal : biogaz domestique
et semi-industriel. INFORSE International Network for Sustainable Energy 28 April – 01 May 2014 Lome Togo.
Chen L, Neibling H (2014). Anaerobic Digestion Basics. University of Idaho Extension. 6. http://cals.uidaho.edu/edcomm/pdf/CIS/CIS1215.pdf
Le Partenariat (2015). Potential and limits of the valorization of halieutics wastes at Hydrobase, Saint-Louis.
Kaffe GK, Kim SH (2012). Evaluation of the biogas Productivity Potential of Fish Waste : A lab Scale Batch Study. Journal of Biosystems Engineering 37(5):302-313.
Kebe et al. 295 Kassuwi SA, Mshandete AM, Kivaisi AK (2012). Anaerobic co-digestion
of biological pre-treated nile perch fish solid waste with vegetable fraction of market solid waste. ARPN Journal of Agricultural and Biological Science 7:12.
Salam B, Islam M, Rahman MT (2009). Biogas from anaerobic digestion of fish waste, Proceedings of the International Con- ference on Mechanical Engeneering 26-28 Dhaka, Bengladesh.
Serrano A, Siles JA, Chica AF, Martín MÁ (2013). Agri-food waste valorization through anaerobic co-digestion: fish and strawberry residues. Journal of cleaner production 54:125-32.
Tomczak-Wandzel R, Levlin E, Ekengren Ö (2013). Biogas production from fish wastes in co-digestion with sewage sludge. InIWA Specialist Conference Holistic Sludge Management 6-8 May 2013 Västerås Sweden 2013 May. Svenska miljöinstitutet (IVL).

Journal of
Microbiology and Antimicrobials
Journal of Microbiology and Antimicrobials
International Journal of
Biotechnology and Molecular
Biology Research
African Journal of
Microbiology Research
African Journal of
Microbiology Research
www.academicjournals.org
African Journal of
Biochemistry Research
African Journal of
Biochemistry Research
Journal of
Bioinformatics and Sequence Analysis
Journal of
Biophysics and Structural Biology