
10 May, 2019 ISSN: 1990-3839 DOI: 10.5897/ERR www ...
41
10 May, 2019 ISSN: 1990-3839 DOI: 10.5897/ERR www.academicjournals.org OPEN ACCESS Educational Research and Reviews
Transcript of 10 May, 2019 ISSN: 1990-3839 DOI: 10.5897/ERR www ...

10 May, 2019ISSN: 1990-3839DOI: 10.5897/ERRwww.academicjournals.org
OPEN ACCESS
Educational Research and Reviews

About ERR Educational Research and Reviews (ISSN 1990-3839) is published bi-monthly (one volume per year) by Academic Journals. Educational Research and Reviews (ERR) is an open access journal that publishes high-quality solicited and unsolicited articles, in English, in all areas of education including education policies and management such as Educational experiences and mental health, the effect of land tenure system on resource management, Visualization skills and their incorporation into school curriculum, Gender, education and child labour etc. All articles published in ERR are peer-reviewed.
Contact Us
Editorial Office: [email protected]
Help Desk: [email protected]
Website: http://www.academicjournals.org/journal/ERR
Submit manuscript online http://ms.academicjournals.me/.

Editors
Dr. Peter W. Wong Southern Cross University Australia.
Associate Editors
Dr. Melissa Vick School Of Education James Cook University Townsville, Australia. Dr. Maniam Kaliannan Faculty of Adminstrative Science & Policy Studies Universiti Teknologi MARA (UiTM) Selangor, Malaysia. Dr. Tavis D. Jules Cultural and Educational Policy Studies School of Education Loyola University Chicago Chicago, USA. Dr. Adams Onuka Centre for Peace and conflict Studies (CEPACS) University of Ibadan Nigeria. Dr. Yambo John M. Onyango University of Eastern Africa Kamagambo Adventist College Campus Baraton, Kenya. Dr. Tolga Gök Torbali Vocational School of Higher Education Dokuz Eylul University Izmir, Turkey.
Assoc. Prof. Manjula Vithanapathirana Faculty of Education University of Colombo Colombo, Sri Lanka.
Prof. Ogunsakin R. Ebenezer Department of Statistics Ekiti State University Ado Ekiti, Nigeria.
Dr. A. Kadir Maskan Dicle University Ziya Gokalp Education Faculty Department of Physics Education Diyarbakir, Turkey.
Dr. Mohd Akhtar Siddiqui Institute of Advanced Studies in Education Faculty of Education Jamia Millia Islamia Central University New Delhi, India.

Editorial Board
Prof. García Mayo, María del Pilar Departamento de Filología Inglesa y Alemana y de Traducción e Interpretación Universidad del País Vasco (UPV/EHU) Paseo de la Universidad 5 Vitoria, Spain.
Prof. Frank Witlox Ghent University Department of Geography Gent, Belgium.
Prof. Georgios D. Sideridis University of Crete Department of Psychology Rethimno, Greece.
Prof. Andreas Veglis Department of Journalism and Mass Media Aristotle University of Thessaloniki Thessaloniki, Greece.
Prof. Mutendwahothe Walter Lumadi Curriculum & Instructional Studies College of Education UNISA, South Africa.
Dr. Miriam McMullan Faculty of Health and Social Work University of Plymouth Plymouth, UK.
Prof. Moshe Barak Graduate Program for Science and Technology Education Ben-Gurion University of the Negve, Beer Sheva, Israel.
Dr. Hiam Zein Psychology and Education Lebanese American University Chouran-Beirut, Lebanon.
Dr. Joel O. Eriba Faculty of Education Benue State University Makurdi, Nigeria. Prof. Bingjun Yang School of Foreign Languages Southwest University Chongqing, China. Dr. Ernest W. Brewer The University of Tennessee Educational Administration and Supervision Tennessee, USA. Prof. Gail Derrick Regent University School of Education Virginia Beach, USA. Dr. Evridiki Zachopoulou Department of Early Childhood Care and Education Thessaloniki, Greece. Dr. Francesco Pastore Seconda Università di Napoli Italy, Dr. Syed Iftikhar Hussain Shah Technical Education and Vocation TEVTA Secretariat Lahore, Pakistan. Dr. Ravi Kant College of Teacher Education Maulana Azad National Urdu University Darbhanga, India.

Editorial Board Dr. Dibakar Sarangi Directorate of Teacher Education and State Council for Educational Research and Training (DTE & SCERT) Odisha, India. Dr. Elisa Backer Faculty of Business Federation University Australia Australia. Dr. Ahmad Alkhawaldeh Department of Curriculum and instruction University of Jordan Jordan. Dr. Mehmet Akif Sözer Department of Primary Education Gazi Faculty of Education Gazi University Turkey.
Table of Content
An investigation into the effects of anxiety sensitivity in adolescents on childhood depression and anxiety disorder Ismail Seçer, Arzu Gülbahçe and Sümeyye Ulaş
293
The effectiveness of an educational program in enhancing parents’ level of knowledge about normal growth indicators in the development of children and determining the indicators which delay development in children from birth to three years old Sabah Hasan Hamdan Al-Onizat
300
Modeling the relationships between practitioner capacity-building practices and the behavior and development of young children with disabilities and delays Carl J. Dunst, Deborah W. Hamby and Melinda Raab
309
Impact of job searches on self-control at social media Aliye MENEVŞE
320

Vol. 14(9), pp. 293-299, 10 May, 2019
DOI: 10.5897/ERR2018.3659
Article Number: 45E040A60899
ISSN: 1990-3839
Copyright ©2019
Author(s) retain the copyright of this article
http://www.academicjournals.org/ERR
Educational Research and Reviews
Full Length Research Paper
An investigation into the effects of anxiety sensitivity in adolescents on childhood depression and
anxiety disorder
Ismail Seçer*, Arzu Gülbahçe and Sümeyye Ulaş
Department of Guidance and Counseling, Faculty of Education, Atatürk University, Turkey.
Received 8 November, 2018; Accepted 1 April, 2019
The purpose of this study is to investigate the effects of anxiety sensitivity in adolescents on childhood depression and anxiety disorder. Mood disorders and anxiety disorders in children and adolescents can be given examples of important research topics in recent years. The participants of the study consist of 670 students in Erzurum city. The data were collected through anxiety sensitivity index and anxiety and depression index for children and adolescents. For data analysis, correlation analysis and structural equation model were used. The results revealed that anxiety sensitivity impacts anxiety disorder and childhood depression through direct and indirect effects in a positive way. The results are discussed in line with the relevant literature. Key words: Anxiety sensitivity, anxiety, anxiety disorder, depression, structural equation.
INTRODUCTION Depression as one of the fundamental psychological disorders which disrupts life processes from all age groups is defined as a mental disorder which causes dysfunctional thinking, speaking and physiology, and in which feelings of worthlessness, inadequacy and hopelessness predominate as well as being a state mood with deep sadness (APA, 2013). These disorders which are pervasive among adults have become a field of study in children and adolescents. Childhood depression has become a problem that has been seriously dealt with and discussed in recent years. Although depression is a problem that is handled particularly in adulthood, research shows that it is a common problem in childhood, too (Butcher et al., 2011; Durukan et al., 2010; Seçer, 2016; Costello et al., 2006; Köroğlu, 2015). However,
some researchers claim that childhood depression is masked by symptoms of other psychological problems and is indirectly explained with such symptoms as enuresis, temper tantrum, skipping school, learning disabilities (Kaslow and Thompson, 1998; Kazdin and Marciano, 1998). Childhood depression, though sharing many similarities with adulthood depression, also shows particular differences. Birmaher et al. (1996), maintained that depression in children is reflected through physical problems like hyperactivity, stomach ache, nausea, vomiting, headache, arthralgia. Karaçetin et al., (2010), stated that weight loss is one of the most obvious symptoms of depression, it turns into not reaching the average weight in children and moreover, somatic symptoms and social isolation are more frequent in
*Corresponding author. E-mail: [email protected].
Author(s) agree that this article remain permanently open access under the terms of the Creative Commons Attribution
License 4.0 International License
294 Educ. Res. Rev.
children compared to adults. On the other hand, Butcher et al. (2011) found out that dysthymic disorder, instead of major depression, are more frequent in children and adolescents unlike adults. Durukan et al. (2010), expressed that auditory hallucination, physical complaints, introversion and decrease in self-confidence are the most often observed symptoms in childhood (before adolescence), not enjoying life, serious psychomotor regression, delirium and sense of hopelessness are more dominant in adolescence and adulthood. It has also been asserted that symptoms such as suicidal ideation, irritable mood, sleeping problems and distraction in concentration in children also show similarities compared with adults.
The studies on children and adolescents reveal that depression is a rather common and serious problem among children and adolescents. Butcher et al. (2011), determined that depression is common among school-age children at a rate of 1 to 3%. Costello et al. (2006), referred to the prevalence of depression in the pre-adolescence period as 2.8% and in the post-adolescence period as 5.6%. Doménech-Llaberia et al. (2009), determined the prevalence of depression among preschoolers as 1.2%. Bodur and Küçükkendirci (2009), determined the prevalence of depression among adolescents in Turkey to be 9.9%. Lewinsohn et al. (1998) suggested that the impacts of psychosocial dysfunction caused by depression in adolescence period on interpersonal relations, general standard of living and work life may persist in adult life, as well. Kessler et al. (2009) also asserted that there is a high probability of recurrence of depression, seen in adolescence period and in adulthood.
Another psychiatric disorder, which has been frequently studied recently and examined in a multi-dimensional approach on children and adolescents, can be considered as anxiety disorder. Anxiety can be defined as a reaction against stress. Distress, tension and uneasiness arising out of fear and apprehension are usual elements of growth. This fear and anxiety accepted as common place and adaptive in babyhood turn into some neurotic fears in mid-boyhood period, associated with imaginative creatures and other events (Beesdo et al., 2009). Kauffman and Landrum (2013), state that if the severity of anxiety hinders the child from social interaction, sleeping, attending the school, and discovering the environment, anxiety should be assessed and dealt with as impairment. The studies show that 5 to 8% of children and adolescents constantly suffer from anxiety (Curry et al., 2004). Some research findings, on the other hand, show that 15 to 20% of children and adolescents may have suffered from anxiety at some level in their lives (Andersen, 1994; Beesdo et al., 2009). Anxiety disorders in general, share similarities with many disorders such as depression, behavioral disorder and learning disabilities (Kauffman and Landrum, 2015; Silvermann and Rabian, 1995).
Anxiety sensitivity can be considered among the
characteristics that are closely connected with depression and anxiety disorder in children and adolescents. Reiss and McNally (1985), define anxiety sensitivity as a state of extreme fear which is the result of the sense of unease and symptoms with negative effects. Anxiety sensitivity is considered as among the cognitive risk factors in terms of anxiety disorders and depression (Calamari et al., 2008; Seçer, 2014). Although there are not many studies focusing on the effect of anxiety sensitivity on mood and anxiety disorders, the results of these studies show that anxiety sensitivity has a significant effect on panic attack, obsessive compulsive disorder (OCD), agoraphobia and depression (Cox et al., 1991; Grant et al., 2007; Freeston et al., 1996; Seçer, 2014; Sandin et al., 2015; Waszczuk et al., 2015). Mantar et al. (2010), Cox et al. (1991) and Grant et al. (2007), stated that anxiety sensitivity has a negative effect on the occurrence and continuity of many disorders such as panic attack, agoraphobia and especially OCD. Freeston et al. (1996), suggested that anxiety sensitivity, especially its cognitive dimension, can have a negative role in the occurrence and continuity of OCD, the findings of Zimbarg et al. (2009), support this. The related research findings show that there is not a significant difference between individual with OCD and individual without OCD in the physical and social sensitivity dimensions of anxiety sensitivity, in spite of that, there is significant difference between individual with OCD and individual without OCD in its cognitive dimension, and the cognitive sensitivity scores of the individuals diagnosed with OCD are significantly higher. Calamari et al. (2008), determined that there are positive relation between the obsessions of washing, and between the compulsions of checking and aggression.
As previously stated, anxiety sensitivity can be said to be a significant risk source in terms of depression and anxiety disorders. Further, the relationships between the variables have been seen to focus on adults. This causes a significant limitation in terms of determining the role of anxiety sensitivity in the occurence of depression and anxiety disorders in childhood and adolescence in which the priliminary signs of the psychological disorders reveal. Therefore it is thought that the determination of the relationships between anxiety sensitivity and anxiety disorders can provide significant insights for the processes of prevention and rehabilitation. Through this perspective, the following research questions have been sought to answer:
(1) Is there a significant relationship between the anxiety sensitivity, anxiety disorders and depressive symptoms? (2) Does anxiety sensitivity predict anxiety disorders and despressive symptoms?
METHODOLOGY
In this study, correlational descriptive survey was used (Büyüköztürk et al., 2014). This model enables the researcher to

make predictions related to different variables based on the information obtained from one or more variables. In this direction, is to make predictions considering anxiety disorder and childhood depression based on anxiety sensitivity. For this purpose, latent variable and structural equation model was used in analysis process. Structural equation model is an analysis method which enables the identification of direct and indirect effects by determining the relationship between observable and latent variables and testing their effects on a single model. Comparative fit index (CFI), root mean square residual (RMR), standardized root mean square residual (RMSEA) and standardized root mean square residual (SRMR), which are commonly accepted fit indices in structural equation model, were used (Marcoulides and Schumacher, 2001; Schumacher and Lomax, 2004).
Participants
The participants of the study were 670 secondary and high school students studying in one city center. The participants were chosen based on convenience sampling. The participants were between the ages of 13 and 18 (M=15.7, Ss=1.35) and 355 were males and 315 were females.
Data collection instruments
Anxiety and depression index for children
Ebesutani et al. (2012), designed an instrument which is used to determine the symptoms of anxiety disorder and depression, was adapted to the Turkish context by Seçer and Şimşek (2015), and psychometric features were analyzed. The instrument included 25 items. In the process of developing the instrument, it was found that the structure had a two-factor form. The first dimension, anxiety disorder, included 15 items and the childhood depression included 10 items. In the process of adapting the instrument, model fit was analyzed through confirmatory factor analysis and it was found that the model fit indices of the two factor model was enough and provided a good fit (RMSEA (0.071), RMR (0.067), SRMR (0.070), CFI (0.98), and Incremental Fit Index (IFI, 0.98)). The findings related to the reliability of the instrument, in terms of two-factor model, 0.91 for the whole instrument and 0.89 and 0.92 for the sub-dimensions.
Anxiety sensitivity ındex for children
Developed by Silverman et al. (1991), and adapted into Turkish by Seçer and Gülbahçe (2013). The 18-item Likert scale was developed to determine anxiety sensitivity of adolescents by self-report. As a result of Exploratory Factor Analysis (EFA), it was found out that the scale has a three-factor structure and the model fit of the scale is adequate (REMSEA (0.023), RMR (0.032), CFI
(0.99), SRMR (0.023), 2/Sd=1.06). For criterion related validity, the correlation between the child version of OCI and children’s depression ınventory and state-trait anxiety ınventory was analyzed, and significant correlations were found. It was obtained that the internal consistency of the scale is 0.86 and the reliability of test-retest is 0.84.
As part of this study, the factor structure of Anxiety Sensitivity Index for Children was reviewed and it was found that the three-factor structure explains 57.21% of the variance and the model fit indices related to the two factor structure were found as REMSEA
(0.037), RMR (0.035), CFI (0.95), SRMR (0.037), 2/df= 1.95. Besides, in terms of reliability values the internal consistency was found as 0.85 and half split reliability was found as 0.83.
Seçer et al. 295 Procedure and data analysis To collect data, scales were implemented to 710 subjects, but, since too many blanks were seen in 17 subjects' responses, they were excluded. The blanks up to 2% in the data set were filled by means of the mean value of the sampling group. Whether the data set meets the parametric criteria was investigated for structural equation modelling and for this purpose, extreme value analysis was conducted. As a result of kurtosis and skewness analysis, since 13 subjects' data had extereme value, they were excluded from the data set. In order to determine the multivariate normality Mahalanobis ve Cook’s distance was calculated and the data of 10 subjects who were determined to influence the data set were also excluded. The normality analyses on the 670 subjects were checked and it was found that the data set was parametric. FINDINGS The relations between the anxiety sensitivity, anxiety disorder and childhood depression, and the findings according to the structural equation modelling are shown later. To find out whether there was a significant Pearson correlation between the anxiety sensitivity and anxiety disorder and childhood depression, correlation analysis findings are shown in Table 1.
Table 1 shows that there is a significant positive correlation between anxiety disorder and physical sensitivity (r=0.619, p<0.01), psychological sensitivity and social sensitivity (r=0.526, p<0.01), childhood depression, physical sensitivity (r=0.580, p<0.01), psychological sensitivity (r=0.537, p<0.01) and social sensitivity (r=0.471, p<0.01). Subsequent to determination of the signifciant relationship in the correlation analysis, in order to investigate the predicting effect of anxiety sensitivity on anxiety and childhood depression, a measuring model was firstly established and tested. The findings obtained from this modelling were displayed in Figure 1 and the fit indices data were given in Table 2.
Following the determination of these statistically significant correlations, a measuring model to investigate the predictive effect of anxiety sensitivity on anxiety and childhood depression was established and tested. The obtained findings from the measurement model and the data about fit indices are displayed in Table 2.
Given the Figure 1 and Table 2, fit indices of the confirmatory measurement model seem to be satisfactory. Furthermore, it is seen that the anxiety sensitivity has a significant positive correlation with anxiety and childhood depression (r=0.79). Two different latent variables were then defined and structural equation was established. While one of these latent variable represents anxiety sensitivity (ANXSEN), the other latent variable represents anxiety and childhood depression (DEPANX). Latent variable is the type of variable used in the structural equation mode (Hu and Bentler, 1999). The findings related to structural equation model established through implicit variables were shown in Figure 2 and the data related to fit indices are displayed in Table 3.
There are some significant criteria to interprete the fit

296 Educ. Res. Rev.
Table 1. The relationship between the anxiety sensitivity, anxiety disorder and childhood depression.
Parameter Physical sensitivity Psychological sensitivity Social sensitivity
Anxiety disorder 0.619** 0.609** 0.526**
Childhood depression 0.580** 0.537** 0.471**
Table 2. The goodness of fit indices values of the model.
2 Sd
2/Sd CFI RMR RMSEA SRMR
73.36 35 2,09 0.97 0.044 0.049 0.049
Figure 1. Confirmatory measurement model for the tested model.
Figure 2. The Standardized Structural Equation Model between anxiety sensitivity and anxiety and childhood depression.
Anxiety
sensitivity
Anxiety &
depression
Physical sensitivity
Psychological
Social sensitivity
Depression
Anxiety

Seçer et al. 297
Table 3. The fit indices values of the tested model.
Sd 2/Sd AGFI GFI NFI NNFI RFI CFI IFI RMR REMSEA
6.75 4 1.68 0.97 0.99 0.99 0.99 0.98 0.99 0.99 0.034 0.040
Table 4. Coefficients of determination about the observed variables of the implicit variables.
Fit parameter Coefficient value
X1, Physical sensitivity 0.73
X2, Psychological sensitivity 0.73
X3, Social sensitivity 0.46
Y1, Anxiety 0.82
Y2, Depression 0.68
ξ1, η1 0.61
indices given in Table 3. Hu and Bentler (1999) and Schumacher and Lomax (2004) state that the values should be less than >0.90 for the acceptable fit as for RFI, CFI, NFI, NNFI and IFI, the values should be ≥ 0.90 and over for the perfect fit, as for SRMR, RMR, and REMSEA, the values should be ≤0.08 for the acceptable fit, and for the perfect fit, the values should be ≤0.50 and below. Given the values in Table 3, it can be said that the fit indices showing anxiety sensitivity having a predicting effect on childhood depression and anxiety have a perfect fit level and it is seen that this established structural model has been confirmed.
The coefficients of determination in a structural modeling
The coefficient of determination in a structural modeling shows the explained variance level in each implicit variable. The explained variance levels of the implicit variables in their own indicator variables for anxiety sensitivity (ANXSEN), childhood depression and anxiety disorder (DEPANX) are shown in Table 4.
Table 4 shows that anxiety sensitivity explains 61% of variance in anxiety and childhood depression. In the measurement model as for the anxiety sensitivity, it is seen that anxiety sensitivity explains 73% of variance in physical sensitivity, 73% of variance in psychological sensitivity, and 46% of variance in social sensitivity. As for the measuring model about anxiety disorder and childhood depression, the depression-anxiety implicit variable (DEPANX) explains 82% of variance in anxiety disorder and 68% of variance in childhood depression.
The findings about total and indirect effects in structural equation model
The total and indirect effects of the anxiety sensitivity,
anxiety disorder and childhood depression implicit variables on the observed variables are shown subsequently. Table 5 shows that the implicit variable established for anxiety sensitivity has direct effects on its own indicator variables, and the second implicit variable established for depression and anxiety disorder has direct effects on its on indicator variables and anxiety sensitivity determined as the predictor variable has indirect effects the indicator variables of depression and anxiety disorder. DISCUSSION This study has handled the predictive effect of anxiety sensitivity on childhood depression and anxiety disorder which has recently become an important research question. For this purpose, the predictive effect of anxiety sensitivity on anxiety disorders and childhood depression has been investigated by means of structural equation modelling.
This finding can be considered as that anxiety sensitivity can be a significant risk source in terms of children's and adolescents’ anxiety disorder experience. This finding is consistent with relevant research highlighting that in case the anxiety sensitivity increases then the OCD and panic attack increase too (Calamari et al., 2008; Mantar et al., 2010; Freeston and Robinson, 1996; McLaughlin et al., 2007; Seçer, 2014; Schmidt et al., 1997; Wheaton et al., 2012; Sandin et al., 2015).
The adolescents’ experience of anxiety can be attributed to anxiety sensitivity. The studies conducted by Reiss and McNally (1985), Mantar et al. (2010) and Seçer (2014), and the other studies showing that individuals who have high anxiety sensitivity become immediately alert even in the case of a probable anxious situation appear to support this argument. Moreover, the findings obtained from Maller and Reiss (1992), a

298 Educ. Res. Rev.
Table 5. Findings about total and indirect effects.
Parameter Total effect Indirect effect
Anxiety Sens. Depression anxiety Anxiety sens.
Physical sens. 0.86 - -
Psychological sens. 0.86 - -
Social sens. 0.68 - -
Anxiety disorder 0.17 0.91 0.21
Childhood depression 0.17 0.82 0.19
longitudinal research study indicating individuals with higher anxiety sensitivity tend to develop anxiety disorder five times more often than the individuals with lower anxiety sensitivity, and the study finding conducted by Ghasempour et al. (2012) and Grant et al. (2007) stating that the individuals with high anxiety sensitivity feel themselves under more threat and tend to much more avoid the situations which cause anxiety support this consideration.
As a result, anxiety sensitivity can be claimed to be a significant risk source in terms of anxiety disorder in children and adolescents and high level of anxiety sensitivity can increase the possibility of occurrence of anxiety disorders (e.g. panic attack, OCD and phobias). The second finding is that physical, social and psychological anxiety sensitivity positively predicts childhood depression. It can be said that anxiety sensitivity is an important component in children's and adolescents’ depression experiences and in case anxiety sensitivity increases then their depressive symptoms increase as well. Though relevant research into the relationship between anxiety sensitivity and childhood depression is inadequate, the findings seem to support this claim (Grant et al. 2007; Taylor et al. 1996). Given that depression appears to be one of the most frequent and severe psychological disorders and its pervasiveness is seen between 5 and 20% in diverse research findings the obtained finding in the current study becomes more important (Helena et al., 2012; Martin et al., 2014; Schmidt et al., 2010).
It is possible that depression seen in childhood and adolescence periods can be a significant risk source for future life. Some researchers claim that depression seen in adolescence period can initiate disability and suicide (Eskin et al., 2008; Liu and Tein, 2005; Waszczuk et al., 2015). Therefore, it can be said that anxiety sensitivity considered to be a significant and predictive throughout the depression experiences of both children and adolescents should be taken place during their treatment and intervention planning. Conclusion This study presents significant findings about the correlation between anxiety sensitivity and anxiety
disorder and childhood depression. Given that physical, social and psychological anxiety sensitivity positively and with high level (63%) predict anxiety disorder and childhood depression, then, determining children and adolescents with high anxiety sensitivity and planning and conducting preventive implementations can be suggested. Therefore, these studies which have been carried out to reduce anxiety sensitivity can be said to be an important opportunity to prevent anxiety disorder and childhood depression.
As for the interpretation of the findings about anxiety disorder and childhood depression, certain limitations of the research studies are also significant. Since this study was conducted on the healthy individuals has a disadvantage in terms of generalizability. That is why testing of the hypotheses in samplings with psychiatrically diagnosed individuals in further research will be beneficial. Moreover, the replication of the research on a larger group of sampling at Turkish context can strongly contribute to the generalizability of the results. CONFLICT OF INTERESTS
The authors have not declared any conflict of interests.
REFERENCES Andersen JC (1994). Epidemiological issues. TH Ollendick, NJ King,
Yule W (Eds.) International handbook of phobic and anxiety disorders in children and adolescents. New York: Plenum Press.
APA (American Psychiatric Association) (2013). Diagnostic and statistical manual of mental disorders (Vth ed.)Washington, DC.
Beesdo K, Knaple S, Pine SD (2009). The Position of Anxiety Disorders in Structural Models of Mental Disorders. Psychiatric Clinics of North America 32(3):483-524.
Birmaher B, Ryan ND, Williamson DE, Brent DA, Kaufman J, Dahl RE, Perel J, Nelson B (1996). Childhood and adolescent depression: A review of the past 10 years. Part 1. Journal of American Academy of Child and Adolescent Psychiatry 35:1427-1439.
Butcher JN, Mineka S, Hooley JM (2011). Abnormal psychology. Boston: Allyn & Bacon
Büyüköztürk Ş, Çakmak E, Akgün Ö, Karadeniz Ş, Demirel F (2014). Bilimsel araştırma yöntemleri. Ankara: PegemA Yayınları.
Bodur S, Küçükkendirci H (2009). Prevalence of depressive symptoms in Turkish adolescents. Eurasian Journal of General Medical 6(2):4-12.
Calamari JE, Rector NA, Woodard JL, Cohen RJ, Chik HM (2008). Anxiety sensitivity and obsessive compulsive disorder. Assesment 15(3):351-363.

Costello EJ, Erkanli A, Angold A (2006). Is there an epidemic of child or
adolescent depression? Journal of Child Psychology and Psychiatry 47(12):1263-1271.
Cox BJ, Endler NS, Norton GR, Swinson RP (1991). Anxiety sensitivity and nonclinical panic attacks. Journal of Behaviour Research and Therapy 29(4):367-369.
Curry JF, Mash JS, Hervey AS (2004). Comorbidity of childhood and adolescent anxiety disorders. Prevalance and implication. In: R. J. McMahon & R.D. Peters (Eds), The effect of parental dysfunction on children. New York: Kluwer.
Doménech-Llaberia E, Viñas F, Pla E, Jané MC, Mitjavila M, Corbella T (2009). Prevalence of major depression in preschool children. European Childhren and Adolescent Psychiatry 18(10):597-604.
Durukan İ, Erdem M, Tufan AE, Türkbay T (2010). Coping strategies and relation of coping strategies with depression and anxiety levels of mothers of children with pervasive developmental disorder. Turkish Journal of Child and Adolescent Mental Health 17(2):75-82.
Eskin M, Ertekin K, Harlak H, Dereboy Ç (2008). Lise öğrencisi ergenlerde depresyonun yaygınlığı ve ilişkili olduğu etmenler. Türk Psikiyatri Dergisi 19(4):382-389.
Ebesutani C, Reise S, Chorpita B, Ale C, Regan J, Young J, Weisz J (2012). The revised child anxiety and Depression Scale-Short Version: Scale Reduction via Exploratory Bifactor Modeling of the Broad Anxiety Factor. Psychological Assessment 24(4):833-845.
Ghasempour A, Akbari E, Azimi Z, Ilbeygi R, Hassanzadeh S (2012). Predicting obsessive-compulsive disorder on the basis of emotion regulation and anxiety sensitivity. Zahedan Journal of Research in Medical Sciences 15(2):94-97.
Grant DM, Beck JG, Davila J (2007). Does anxiety sensitivity predict symptoms of panic, depression, and social anxiety? Journal of Behaviour Research and Therapy 45(9):2247-2255.
Freeston MH, Rhéaume J, Ladouceur R (1996). Correcting faulty appraisals of obsessional thoughts. Behavior Research and Therapy 34(5-6):433-446.
Hu LT, Bentler PM (1999). Cutoff criteria for fit indexes in covariance structural analysis: Conventional criteria versus new alternatives. Structural Equation Modeling 6(1):55-65.
Helena ZM, Rijsdrick S, Frühling V, Thalia CE (2012). A longitudinal, genetically informative, study of associations between anxiety sensitivity, anxiety and depression. Behavior Genetics 42(4):592-602.
Karaçetin G, Doğangün B, Kocabaşoğlu N (2010). Tıbbî Duruma Bağlı Anksiyete Bozukluğu İle İlgili Bir Gözden Geçirme. Yeni Symposium, 48(4):292-298
Kaslow NJ, Thompson M (1998). Applying the criteria for empirically supported treatments to studies of psychosocial interve¡- tions for child and adolescent depression. Journal of Clinical Childhren Psychology 27(14):55-66.
Kazdin AE, Marciano PL (1998). Childhood and adolescent depression. In: E. J. Mash & R.A. Barkley (Edes), Treatment of chilhood disorders. New York: Guilford.
Kauffman JM, Landrum JT (2013). Characteristics of Emotional and Behavioral Disorders of Children and Youth. London: Pearson
Kessler RC, Avenevoli S, Costello EJ, Green JG, Gruber MJ, Heeringa S, Merikangas KR, Pennell BE, Sampson NA, Zaslavsky AM (2009). National comorbidity survey replication adolescent supplement (NCS-A): II. Overview and design. Journal of the American Academy Children and Adolescent Psychiatry 48(4):380-388.
Köroğlu E (2015). Klinik psikiyatri. Ankara: HYN Press. Lewinsohn PM, Rohde P, Seeley JR (1998). Major depressive disorder
in older adolescents: prevalence, risk factors, and clinical implications. Clinic Psychology Rewiev 18:765-794.
Liu X, Tein JY (2005). Life events, psychopathology, and suicidal behavior in Chinese adolescents. Journal of Affective Disorders 86(2):195-203.
.
Seçer et al. 299 Maller RG, Reiss S (1992). Anxiety sensitivity in 1984 and panic attacks
in 1987. Journal of Anxiety Disorders 6:241-247. Mantar A, Yemez B, Alkın T (2010). Anksiyete duyarlılığı indeksi-3’ün
Türkçe formunun geçerlik ve güvenilirlik çalışması. Türk Psikiyatri Dergisi 21(3):225-234.
Marcoulides G, Schumache R (2001). New developments and technıques ın structural Equatıon modelıng. London: Lawrence Erlbaum Assocıates, Publıshers.
McLaughlin EN, Stewart SH, Taylor S (2007). Childhood anxiety sensitivity index factors predict unique variance in DSM-IV anxiety disorder symptoms. Cognitive Behaviour Therapy 36(4):210-219.
Martin L, Viljoen M, Kidd M, Seedat S (2014). Are childhood trauma exposures predictive of anxiety sensitivity in school attending youth. Journal of Affective Disorders 168:5-12.
Schmidt NB, Keough ME, Mitchell MA, Reynolds K, Michael J (2010). Anxiety sensitivity: Prospective prediction of anxiety among early adolescents. Journal of Anxiety Disorders 24:503-508.
Reiss S, McNally RJ (1985). Expectancy model of fear. Theoretical issues in behavior therapy. S Reiss, RR Bootzin (Eds). San Diego, CA: Academic Press.
Sandin B, Sanchez C, Chorot P, Valiente RM (2015). Anxiety sensitivity, catastrophic misinterpretations and panic self-efficacy in the prediction of panic disorder severity: towards a tripartite cognitive model of panic disorder. Behaviour research and theraph 67(30):30-40.
Schumacher R, Lomax R (2004). A beginner’s guide to structual equation modelling. London: Lawrence Erlbaum Assocıates, Publıshers.
Seçer İ, Gülbahçe A (2013). Çocuk ve ergenlerde anksiyete duyarlılık ölçeğinin Türkçeye uyarlanması: güvenirlik ve geçerlik çalışması. Middle Eastern and African Journal of Educational Research (MAJER). Özel sayı 91-106.
Seçer İ, Şimşek MK (2015). Çocuklar için depresyon ve anksiyete ölçeğinin Türkçeye uyarlanması: güvenirlik ve geçerlik çalışması. Ejer Congress, 6-8 Haziran, 2015.
Seçer İ (2014). Analysis of the Relations between Obsessive Compulsive Symptoms and Anxiety Sensitivity in Adolescents with Structural Equation Modeling. Education and Science 39(176):369-382.
Seçer İ (2016). Üniversite Öğrencilerinde Okul Tükenmişliği ile Psikolojik Uyumsuzluk Arasındaki İlişkinin İncelenmesi. Atatürk Üniversitesi, Sosyal Bilimler Enstitüsü Dergisi 19(1):81-100.
Silverman WK, Fleisig W, Rabian B, Peterson RA (1991). Childhood anxiety sensitivity index. Journal of Clinical Child Psychology 20(2):162-168.
Silverman WK, Rabian B (1995). Test-retest reliability of DSM-III-R childhood anxiety disorders and symptoms using the anxiety disorders interview schedule for children. Journal of Anxiety Disorders 9:139-150.
Taylor S, Koch WJ, Woody S (1996). Anxiety sensitivity and depression: How are they related? Journal of Abnormal Psychology 105(3):474-479.
Waszczuk MA, Zavos HM, Antonova E, Haworth CM, Plomin R, Eley TC (2015). A multıvarıate twın study of traıt mındfulness, depressıve symptoms, and anxıety sensıtıvıty. Depression and Anxiety 32(4):254-261.
Wheaton M, Mahaffey B, Timpano K, Berman N, Abramowitz J (2012). The relationship between anxiety sensitivity and obsessive-compulsive symptom dimensions. Journal of Behavior Therapy and Experimental Psychiatry 4(3):891-896.
Zimbarg ER, David B, Brown AT (2009). Hierarchical structure and general factor saturation of the Anxiety Sensitivity Index: Evidence and implications. Psychological Assessment 9(3):277-284.

Vol. 14(9), pp. 300-308, 10 May, 2019
DOI: 10.5897/ERR2019.3719
Article Number: A79E20760901
ISSN: 1990-3839
Copyright ©2019
Author(s) retain the copyright of this article
http://www.academicjournals.org/ERR
Educational Research and Reviews
Full Length Research Paper
The effectiveness of an educational program in enhancing parents’ level of knowledge about normal growth indicators in the development of children and
determining the indicators which delay development in children from birth to three years old
Sabah Hasan Hamdan Al-Onizat
Department of Special Education, Faculty of Educational Sciences, World Islamic Sciences and Education University,
Jordan.
Received 28 February, 2019; Accepted 29 April, 2019
The aim of this study is to investigate the effectiveness of an educational program in improving the level of knowledge of parents about natural growth indicators in the development of children and determining the indicators which delay development in children from birth to three years old. The sample of the study consisted of 60 volunteers who were randomly and equally assigned to control and experimental groups. The educational program consists of 15 sessions; each session’s duration is two hours. The results of the study showed that the level of parents' knowledge of natural growth indicators for children from birth to three years is low. There were differences on the level of knowledge of parents about developmental delay indicators due to the educational program. The study recommended the need for further studies on the importance of raising the level of knowledge of parents about development risk indicators of natural growth of children. Key words: Educational program, early normal growth indicators, indicators delaying development of children.
INTRODUCTION Human growth is affected by a combination of genetic and environmental factors, and one or more of these factors lead to a disorder or malfunction in a child's growth and development. The disorder appears in the form of an illness or developmental delay compared to that of peers of the same age group. Growth is a systematic and integrated process consisting of
successive and interrelated phases. Each stage is the result of the previous stage and the start of the next stage; it is a process that includes quantitative and qualitative changes that will last a lifetime from the moment of fertilization to the moment of death (Kafafi, 2009).
Growth is done in several connected and interrelated
E-mail: [email protected].
Author(s) agree that this article remain permanently open access under the terms of the Creative Commons Attribution
License 4.0 International License

aspects: physical growth means gradual changes, weight and size increase for different body organs and appropriate motor responses. Mental growth is the improvement and growth of mental abilities and capabilities, thinking ability, problem solving and so on. Emotional growth is the development and growth of different emotions and the ability to judge emotional expressions and interpret emotional stimuli and confront different psychological conflicts. Social growth refers to the ability of the individual to acquire socially acceptable behavior, which qualifies one to interact with others; and language development is a gradual acquisition of an individual vocabulary and expressions and language structures, concepts, and increase in vocabulary to be able to communicate with others and express oneself clearly (Ajaj, 2008).
The process of identifying and measuring developmental requirements and indicators according to the age range of children has received medical, psychological and educational attention. These requirements have been divided into three categories, from birth to the beginning of the three years; from three years to the beginning of five years and from five to eight years (Kafafi, 2009). Problem of the study Family‟s participation in the early detection of disabilities is considered an important and effective one in recognizing children with abnormal development indicators. Hence they are referred to as the right diagnoses in order to get suitable medical and educational treatment. Parents‟ role, especially the mother, is clear in recognizing abnormal and deviated growth indicators through viewing and understanding the natural developmental aspects of the children in different fields: Kinetic, mental, emotional, social and linguistic.
The process of providing information to parents is very important, for its paramount effect in facilitating child‟s development process, and its role in reducing stress for families. In order for parents to do the expected role they need a supporting system which helps them in gaining necessary knowledge and skills to rise and educate their children effectively. That can be through information, physical, psychological and social support, which will make them feel, appreciate and care for others. Objectives of the study 1). The objective of the program is to improve parents' knowledge of developmental indicators for children from birth to three years. 2). The study aims to improve parents' knowledge of developmental indicators for children by age group (from birth to 3 months), (from 4 months to 7 months) and (from
Al-Onizat 301 8 to 12 months) and from different, interrelated and connected aspects of growth: Mental, emotional growth, social growth, and linguistic growth. Hypotheses of the study The researcher proposed the following hypotheses: 1). The educational program is effective in improving the cognitive level of parents about normal growth indicators and indicators delaying development of children from birth to three years. 2). Parents' level of knowledge of the developmental indicators of the children from birth to three years depends upon, (a) Educational program (b) Gender of the parents (c) Interaction between both genders (d) Educational qualifications of the parents (e) Interaction between the more qualified and the less qualified parents. (f) Kind of educational program training offered LITERATURE REVIEW A study by Safadi et al. (2016) aimed to detect Jordanian mothers‟ knowledge of child rearing exercises and milestones of development, the socio-demographic relevance to knowledge variables, and the information source that guide childrearing exercises. They use a design that is cross-sectional with a modified version of MacPhee‟s „Knowledge of Infant Development Inventory‟ to evaluate 400 mothers‟ knowledge of infants‟ childrearing and milestones of development, in Amman, Jordan. Mothers were found to be more knowledgeable in safety, physical skills and less in emotional, parent-infant interaction, and cognitive skills. Parental education, age-parity and of the pregnancy planned had limited impact on milestones of development of knowledge. Different information sources were used for observing traditional societies. In the study of eerden 0 6 a different method-
com ination design was used to study the effect of parental training „ e are Parents‟ on approved parenting practices, such as responsiveness, stimulation and affection. Pre- plus post-test data of 31 parents with children less than 18 years were collected using a questionnaire (quantitative), and interviews (qualitative) from 10 parents after the training. The results showed that parents remarkably increased their positive parenting practices, as better outcomes were found between pre-test plus post-test data for positive and approved parenting as a whole, and each of the components of responsiveness, stimulation and affection. Interviews did

302 Educ. Res. Rev. support the high outcome in positive parenting. Parents‟ feedback was that they had learned many things, and were able to make changes in their parenting practices, with regard to responsiveness, stimulation and affection. The recent study shows the evidence of effective programs of parenting in developing countries, and offers useful applications for more comprehensive research in the parenting field. In addition, the study shows the possibility for enhancing positive parenting in developing countries y the use of parenting programs like „ e are Parents‟ for oth parents.
Dukhan and Hasballah (2015) conducted a study aimed at measuring the effectiveness of a skills training program for mothers of autistic children. The study focused on helping mothers in measuring the level of communication for their children with autism. The sample consisted of (12) mothers of an autistic child from Gaza Strip in Palestine. The sample was selected based on their low scores in the non-verbal communication scale; the age and educational levels of mothers of the children were also considered. The researcher used the non-verbal communication scale of the researcher, which consists of 4 domains: (Tradition, common attention, recognition and understanding, and reference to what is desirable), a training program built on the PECS image exchange program. The study showed statistically significant differences in the mean scores between the tribal measurement and the telemetry in favor of the post measurement of the mothers of children with autism disorder. The results also showed statistically significant differences between post-measurement and follow-up and in favor of a training program.
Al – Hawarneh (2012) conducted a study entitled "Studying some of the variables associated with the delayed development of language in kindergarten children". This study aimed at identifying the variables associated with the delayed development of the language of Kindergarten children, such as: "Socioeconomic level of family, intelligence, gender, family size, fears, Gregorian order." The battery of psycho-linguistic tests of the kindergarten children was applied to 100 children, of 4-6 years. Four children were selected, the first and the second children who received the best degree in psycho-linguistic abilities, the third and fourth children, who received the lowest level of psychosocial abilities, and conducted a case study on them. The following results were obtained: The lower the cultural level of the family, the slower the development of language in the children; the lower the socio-economic level, the slower the development of language in the children; the lower the socio-economic level of the family, the slower the development of language in the children; the lower the intelligence, the slower the growth of language in children; the higher their fears, the slower the growth of language in children; the language of the children who are late in language development is characterized by brief, unspecified answers, short sentence length, low
vocabulary, lack of communicative competence, and low use of names. study by Jarrah et al. (2012) aimed to explore the
knowledge level and infants‟ caring practices of Jordanian mothers during and after birth period. This study used quota sampling method to illustrate the geographical regions (center, north and south) in Jordan. The sample of n= 240 mothers was chosen from the maternal and child health care centers and face-to-face interviews were taken between January and April 2009. A specially designed structured tool that contained eight infants‟ health pro lems with 39 appended items of possible caring practices was used for the data collection. Responses varied from 1 (disagree) to 3 (agree), where 3 denoted a correctly positive caring practice. The results showed that mothers had somewhat low level of knowledge (60%) and a combination of traditional and iomedical infants‟ caring practices. Some of the traditional (using herbs) and biomedical (using un-prescribed medicine) practices were considered harmful. Additionally, mothers were using problem solving strategies to solve infants‟ health pro lems efore asking for help of doctors, mothers or mothers-in-laws. Plus there were a limited differences of infants‟ caring practices n=8 in relation to mothers‟ unity family income, and level of education. Results showed nurses need to understand mothers‟ healthcare practices of their infants‟ health pro lems and develop health education programs and policies to prevent harmful practices and increase beneficial ones. Al-Hassan and Lansford 0 assessed the “Better
Parenting Program BPP ” which has een conducted nationally in Jordan to improve parents‟ knowledge behaviors and attitudes that are related to caring for young children. Participants consisting of N = 337, 94% female were randomly allocated to either experimental group or control group. The first group, experimental group participated in the BPP and the control group did not. All parents answered questionnaires to evaluate their knowledge in important areas of child development, discipline practices, activities with their children, and perceptions regarding behaviors that compose child neglect and abuse, before and after BPP. Gradually, experimental group participants only improved their parenting knowledge, spending more time with their children playing and reading, using more negotiating techniques during the course of disciplining their child, and correctly perceiving behaviors that compose child neglect. Results pointed out good beneficial effects of participation in the Better Parenting Program.
Al-Ayed 0 0 evaluated the level of mothers‟ understanding on certain characteristics of child health care and if there is any relation etween mothers‟ level of knowledge and the formal education they have. He used a questionnaire of two-parts. The 1st part contained information about mothers' age, nationality, level of education, work and number of children, besides sourcing
health information and the role of school education in the matters of child health. Second part included 40 statements of different features of child‟s health matters. A well-structured interview conducted with the mothers who came with their children at the clinic of pediatric outpatients of King Khalid University Hospital in Riyadh during July and August 2007 was directed by a non-medical trained research assistant using the statements and items of the questionnaire. A score on knowledge level was gathered from the number of correct answers. The highest score was 40. A 25 score was considered satisfactory. The results were that three-hundred-seventy-three questionnaires were conducted successfully. The average score of the total sample was 25 (out of 40), the least score calculated was 14, and the maximum was 36. So, 58% scored 25 or higher. Survey of individual items on the questionnaire showed high and serious gaps in the mothers' knowledge. There was no statistically important correlation found etween mothers‟ knowledge of child health related matters and age, level of education, or number of children.
STUDY METHODOLOGY
Semi-experimental approach was used in this study.
Population of the study
The study community consists of all parents of children with disabilities who enrolled in the eight special education centers in ShafaBadran area, north of the capital, Amman in 2017/2018 academic year.
Sample of the study
To determine the sample of the study, three centers of special education were selected in the random manner, and the number of parents of children with disabilities who are able to read and write was limited to 300 fathers and mothers.
In order to identify the parents who had little knowledge of developmental indicators for children in the developmental stage (birth to 3 years), the parents' knowledge scale was distributed to the sample of 300 mothers and fathers. The number of questionnaires retrieved was 240; 80% of them were from 135 mothers and 105 fathers.
Study tools
To achieve the objectives of the study, the researcher used the following tools.
Checklist of parents' knowledge of development indicators for children in the developmental stage (birth - 3 years)
The scale is based on the Developmental Checklists - Birth to Five of the Early Childhood Direction Center of Syracuse University in New York, USA and the scale includes 60 paragraphs. The scale was divided into five developmental stages:
From birth to 3 months: includes (12) paragraphs.
Al-Onizat 303 4 - 7 months: includes (12) paragraphs. 8 - 12 months: includes (12) paragraphs. 12 - 24 months: includes (12) paragraphs. 24 - 36 months: includes (12) paragraphs. These paragraphs cover the different developmental aspects of each stage: motor growth, language development, mental development, emotional / social growth, with three paragraphs per side in each developmental stage. And the scale consists of two parts: Part 1: Includes information about the parents‟ age, and educational level. The second part includes the scale paragraphs of (60). Validity of the scale The indicators of the validity of the scale were extracted by using the virtual truth; the scale in its preliminary form was presented to a group of 17 arbitrators from the teaching staff of the Jordanian universities and the private education employees. This was done to judge the clarity of the paragraphs and their relevance, formulation, accuracy and suitability for the purpose which they were designed for. And 80% of the agreement proportion was adopted. Reliability of the scale In order to verify the stability of the scale, the researcher used the internal consistency method of the paragraphs using the Cronbach Alpha formula. The stability coefficient arrived at is 0.94. The regression method was applied to a sample of 25 parents from outside the study sample, with a time interval of two weeks, and a stability factor reached was (0.95). These values were considered suitable for the objectives of the study. Checklist of indicators of developmental delay in children from birth to three years
The scale is based on the Developmental Checklists (Birth to Five) of the Early Childhood Direction Center of Syracuse University in New York, USA and may be in the final form of 61. A section represents potential risk indicators according to the developmental stage of the children and in different aspects of growth: motor development, linguistic growth, mental development, emotional / social growth:
From birth to 3 months: includes 11 paragraphs. 4 - 7 months: includes 17 paragraphs. 8-12 months: includes 11 paragraphs. 12 - 24 months: includes 11 paragraphs. 24 - 36 months: includes 11 paragraphs. Answering process takes 30 min.
The scale needs answers to be given by yes / no to each of the scale paragraphs, where (yes = 1 mark, no = 0). Validity of the scale The validity of the measure was obtained by using the virtual truth, which presents the standard in its preliminary form to a group of 17 arbitrators from the faculty members of the Jordanian universities and private education workers. This was done for the purpose of judging the clarity of the paragraphs, their suitability, formulation, accuracy and suitability for the purpose for which they were designed, and (80%) of the proportion of the agreement was adopted.

304 Educ. Res. Rev. Table 1. Program sessions.
Program session Procedural objectives of the session
Session 1
(i) Identify the researcher herself and introduce participants to each other.
(ii) Finding the objectives and content of the program.
(iii) Introduce participants to the rules that will be followed during the program.
(iv) Identify the goals that parents hope to achieve by attending this program.
Session 2 Introducing the basic concepts: growth, development, behavior, maturity, learning, Personal.
Session 3 Theories of Human Development and Growth
Session 4 Factors of human growth: - Genetics and biological factors - Environmental factors.
Session 5 Factors of human growth: - Psychological factors - Family factors.
Session 6 Factors of human growth: - Economic and technological factors - Social factors.
Session 7 Characteristics and importance of developmental stage from birth to 3 years, And the early intervention.
Session 8 Growth in the developmental stage from birth to 3 years: its manifestations, How to observe and measure it.
Session 9 Psychological growth in the developmental stage from birth to 3 years: Manifestations and how to observe and measure.
Session 10 Social growth in the developmental stage from birth to 3 years: Manifestations and how to observe and measure.
Session 11 Knowledge growth in the developmental stage from birth to 3 years: Manifestations and how to observe and measure.
Session 12 Linguistic growth in the developmental stage from birth to 3 years: Manifestations and how to observe and measure.
Session 13 Parent's role in dealing with human development stages of all kinds.
Session 14 Parent's role in dealing with human development stages of all kinds.
Session 15 Introducing participants to the mother and child centers in the capital Amman And its activities.
Reliability of the scale
In order to verify the reliability of the scale, the researcher used the internal consistency method of the paragraphs using the Cronbach Alpha formula. The stability coefficient reached 0.93. The regression method was applied to a sample of 25 parents from outside the study sample, with a time interval of two weeks; the stability factor reached 0.96. These values were considered suitable for the objectives of the study. Educational program for developmental indicators for children from birth to three years The researcher adopted theoretical literature on child development and the psychology of growth and development, as well as previous relevant studies, educational programs and early intervention programs. Target groups of the program were parents with little information about developmental indicators for children from birth to three years (Table 1). The number of sessions of the program: (15) session, the duration of each session is two hours. The researcher used the following strategies: lecture, discussion and dialogue, brainstorming, working in groups. The teaching means used were: slide projector, video display, posters, pamphlets, brochures, educational flyers. Program validity The program was presented in its preliminary form to (15) arbitrators in the field of specialists of children, women and obstetrics in the Faculty of Medicine and Nursing at the University of Jordan, and in the field of special education and the field of psychology of growth and psychology in Jordanian universities. This was done to take their opinion on the appropriateness of the content of the program, methods used, the duration of the program and any amendments they consider appropriate. The amendments proposed by the arbitrators were made to finalize the program.
Study procedures
(i) Preparation of study tools: 1. a measure of parents' knowledge of developmental indicators for children in the developmental stage (birth - 3 years). 2. Indicators of developmental delay in children in the age group (birth - 3 years), and 3. Educational program for child development indicators (from birth to three years) (ii) Limit parents' number according to their abilities to read and write and identify their educational level by communicating with them via telephone. (iii) Perform a pre-application of the developmental indicators scale about knowledge of children by parents (birth - 3 years). Parents whose average performance on the scale was high and medium were excluded and low-average parents were retained. The program was applied to the experimental group at a rate of (15) sessions, and the duration of each session is an hour and a half. The total educational hours were 30. After completing the application of the program, the scale of knowledge of developmental indicators for children in the developmental stage (birth - 3 years) was re-applied to both groups: Experimental and control, and the developmental delay indicators in children in the age group (from birth to three years) on the experimental group. Questionnaires were collected, discharged and processed using the SPSS system. Mean and standard deviations were used; T test was used for independent samples, and binary variance analysis test was performed.
HYPOTHESES VERIFICATION AND RESULTS ANALYSIS
In relation to Hypothesis 1
The mean and standard deviations of parents' level of knowledge were calculated using developmental indicators for children in the developmental stage from

Al-Onizat 305
Table 2. Parents' level of knowledge about developmental indicators of the children.
Parents knowledge level Arithmetic mean Standard deviation Rank Arithmetic mean level
1-3 Months 1.95 0.71 5 Low
4-7 Months 2.11 0.60 4 Low
8-12 months 2.29 0.68 3 Low
12-24 months 2.33 0.70 2 Low
24-36 months 2.40 0.73 1 Low
Mean of All stages 2.22 0.66 - Low
Table 3. Level of parental knowledge of normal growth indicators according to the performance in the post-test.
Group Mean Standard deviation
Experimental 3.64 0.79
Control 2.95 0.30
birth to three years (Table 2).
Table 2 shows that the total arithmetic mean of parents' level of developmental indicators was 2.22, with a standard deviation of 0.66; it indicates that parents' knowledge of developmental indicators is low.The parents' knowledge of the developmental indicators in the developmental stage (24 - 36 months) was better with first rank and an arithmetic mean of 2.40 and a standard deviation of 0.73. While the parents' knowledge of developmental indicators in the developmental stage (1 -3 months) was low and came in fifth place with a mean of 1.95 and a standard deviation of 0.71. This low result can be explained by the lack of awareness and education of parents about the natural aspects of child development. This may be due to the lack of awareness and education services provided by health centers, hospitals, media, lack of experience of parents and training to observe development aspects.
The lack of knowledge among parents is particularly evident in the early developmental stages of the child; this may be due to the child's small age, the rapid growth and the difficulty in observing the developmental aspects by parents, where most parents tend to explain any imbalance or difference in growth that the child is still growing and developing. Comparing the means of Table 2 with the details of program sessions, it can be found that the results indicate that parents have a lack of knowledge of all aspects of growth: physical, mental, emotional, social and linguistic. In relation to Hypothesis 2(a) The arithmetical means and standard deviations of the parents' performance were calculated on the level of knowledge of the natural growth indicators in the post-
test (Table 3). Table 3 shows that there are differences in the arithmetic means between the experimental and control groups on the knowledge scale of the indicators of normal growth in the post-test where experimental group ranked better with arithmetic mean of 3.64. The educational program includes experiences and activities that affected the parents. The activities match the parents‟ a ilities. Parents' seriousness, follow-up, and desire to attend educational sessions continuously provide feedback on their understanding and acquisition of the required information. In relation to Hypothesis 2(b) Table 4 shows that there are differences in the arithmetic mean which neatly show the gender-wise differences in the level of knowledge of the normal growth indicators in the development of children. For females, the post test mean was 3.25 and for males, the post- test mean was 2.88. In relation to Hypothesis 2(c) Table 5 shows that there are differences in arithmetic means for both males and females in the level of knowledge of normal growth indicators in post-test due to exposure to the educational program. Both fathers and mothers have benefited equally from the program, because the program sessions were designed to suit the abilities and needs of both parents and were presented in a simplified manner suitable to their abilities and experiences. They were provided with basic and necessary information in an equal manner, and the activities and dialogues were provided in a participatory
306 Educ. Res. Rev.
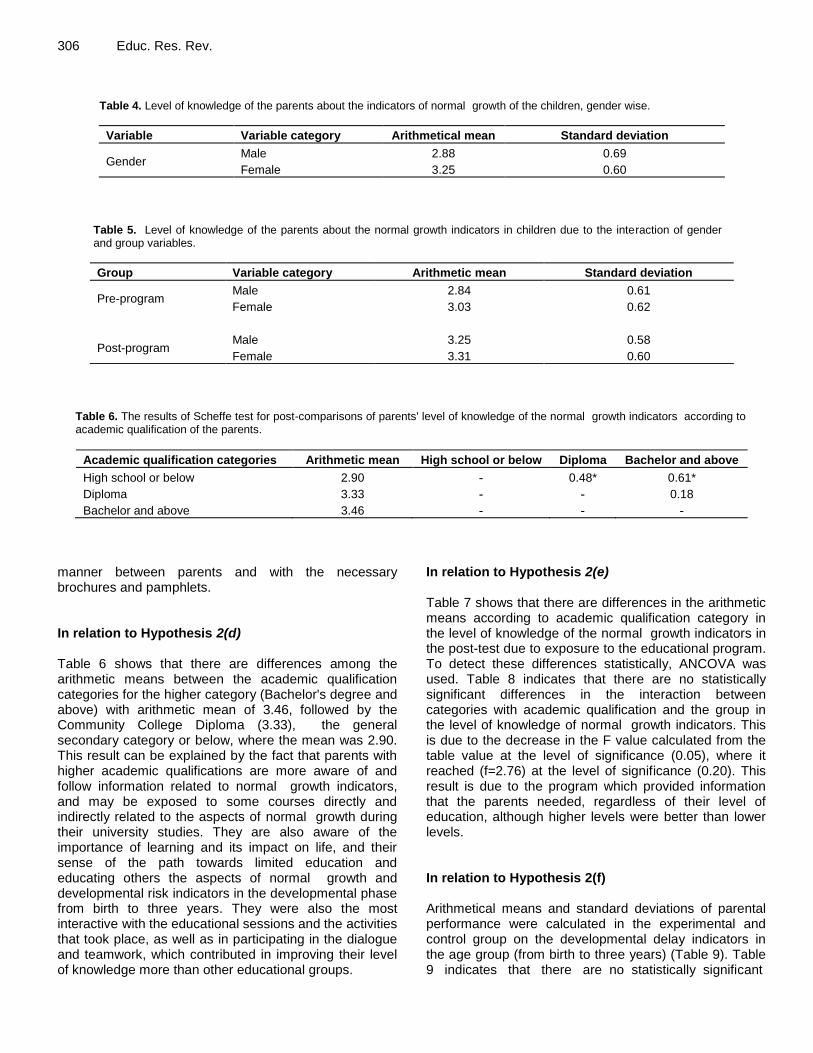
Table 4. Level of knowledge of the parents about the indicators of normal growth of the children, gender wise.
Variable Variable category Arithmetical mean Standard deviation
Gender Male 2.88 0.69
Female 3.25 0.60
Table 5. Level of knowledge of the parents about the normal growth indicators in children due to the interaction of gender and group variables.
Group Variable category Arithmetic mean Standard deviation
Pre-program Male 2.84 0.61
Female 3.03 0.62
Post-program Male 3.25 0.58
Female 3.31 0.60
Table 6. The results of Scheffe test for post-comparisons of parents' level of knowledge of the normal growth indicators according to academic qualification of the parents.
Academic qualification categories Arithmetic mean High school or below Diploma Bachelor and above
High school or below 2.90 - 0.48* 0.61*
Diploma 3.33 - - 0.18
Bachelor and above 3.46 - - -
manner between parents and with the necessary brochures and pamphlets. In relation to Hypothesis 2(d) Table 6 shows that there are differences among the arithmetic means between the academic qualification categories for the higher category (Bachelor's degree and above) with arithmetic mean of 3.46, followed by the Community College Diploma (3.33), the general secondary category or below, where the mean was 2.90. This result can be explained by the fact that parents with higher academic qualifications are more aware of and follow information related to normal growth indicators, and may be exposed to some courses directly and indirectly related to the aspects of normal growth during their university studies. They are also aware of the importance of learning and its impact on life, and their sense of the path towards limited education and educating others the aspects of normal growth and developmental risk indicators in the developmental phase from birth to three years. They were also the most interactive with the educational sessions and the activities that took place, as well as in participating in the dialogue and teamwork, which contributed in improving their level of knowledge more than other educational groups.
In relation to Hypothesis 2(e) Table 7 shows that there are differences in the arithmetic means according to academic qualification category in the level of knowledge of the normal growth indicators in the post-test due to exposure to the educational program. To detect these differences statistically, ANCOVA was used. Table 8 indicates that there are no statistically significant differences in the interaction between categories with academic qualification and the group in the level of knowledge of normal growth indicators. This is due to the decrease in the F value calculated from the table value at the level of significance (0.05), where it reached (f=2.76) at the level of significance (0.20). This result is due to the program which provided information that the parents needed, regardless of their level of education, although higher levels were better than lower levels. In relation to Hypothesis 2(f) Arithmetical means and standard deviations of parental performance were calculated in the experimental and control group on the developmental delay indicators in the age group (from birth to three years) (Table 9). Table 9 indicates that there are no statistically significant

Al-Onizat 307
Table 7. Level of knowledge of the parents with academic qualification categories and group variables about the normal growth indicators in the Development of children.
Variable Variable category Arithmetic mean Standard deviation
Academic qualification
High school or below 2.90 0.79
Diploma 3.33 0.70
Bachelor and higher 3.46 0.68
The group variable Pre-program 2.87 0.63
Post-program 3.88 0.59
Table 8. Covariation analysis of the interaction between categories of the academic qualifications and the group in the level of knowledge of the normal growth indicators.
Variance source Freedom degree Total squares Squares mean F-Value Level of significance
Prior group 1 1.04 1.04 0.10 0.80
Academic qualification 2 7.13 3.57 *5.22 0.00
The group 1 11.20 11.20 *5.55 0.00
Gender × the group 2 3.90 1.95 2.76 0.20
Error 55 43.50 0.79
Total 59 66.77
*Statistical significance at significance level of α≤0.05 .
Table 9. Parents' performance on developmental delay indicators scale of knowledge to the age group (birth to three years) in the pre and post-test.
Test The group Number Arithmetic mean Standard deviation
Pre
Experimental 30 2.57 3.20
Control 30 2.73 4.40
Total 60 2.65 3.26
Post
Experimental 30 5.33 4.22
Control 30 2.97 2.62
Total 60 4.15 3.10
differences in the pre-test for parents of Control and Experimental groups in the level of knowledge about the developmental delay indicators in children in the age group (from birth to three years). There are statistically significant differences in post-test in favour of the experimental group which has been through the educational program. To determine whether these apparent differences between the experimental and control groups were statistically significant, the co-variation analysis was performed as shown in Table 10.
Table 10 shows statistically significant differences between the experimental and control groups of parents in the level of knowledge of developmental delay indicators in the age group (from birth to three years) in the post-test and for the benefit of the experimental
group. This indicates that increasing parents' knowledge of the natural growth indicators in the age group (from birth to three years) will increase their ability to identify indicators of developmental delay in their children in the same age group. The researcher attributed this result to the effectiveness of the educational program in providing parents with the necessary information and training and the methods to determine the risk indicators of their children. The educational program also provided an opportunity for parents to discuss their ideas and beliefs about natural growth, and eliminate some of the traditional habits and ideas about child development, and how to deal with any differences or variances in child- growth; it also contributed in enhancing parents' ability of early detection and referral process in the event of
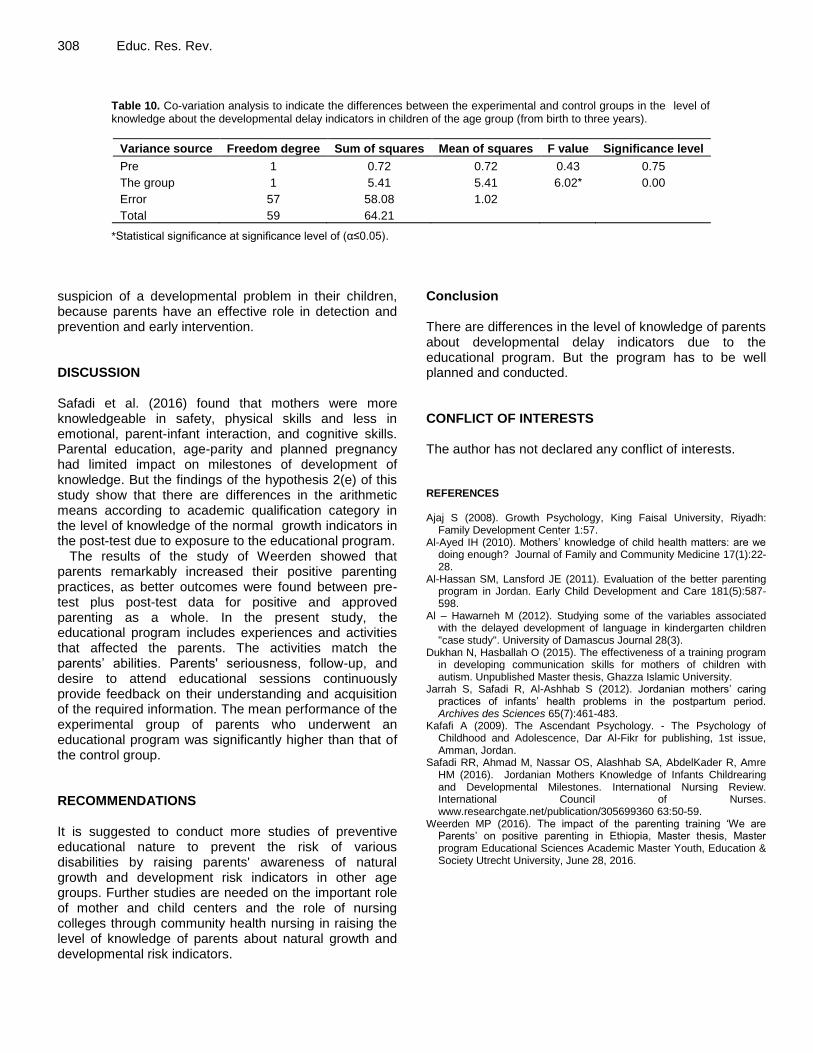
308 Educ. Res. Rev.
Table 10. Co-variation analysis to indicate the differences between the experimental and control groups in the level of knowledge about the developmental delay indicators in children of the age group (from birth to three years).
Variance source Freedom degree Sum of squares Mean of squares F value Significance level
Pre 1 0.72 0.72 0.43 0.75
The group 1 5.41 5.41 6.02* 0.00
Error 57 58.08 1.02
Total 59 64.21
*Statistical significance at significance level of α≤0.05 . suspicion of a developmental problem in their children, because parents have an effective role in detection and prevention and early intervention. DISCUSSION Safadi et al. (2016) found that mothers were more knowledgeable in safety, physical skills and less in emotional, parent-infant interaction, and cognitive skills. Parental education, age-parity and planned pregnancy had limited impact on milestones of development of knowledge. But the findings of the hypothesis 2(e) of this study show that there are differences in the arithmetic means according to academic qualification category in the level of knowledge of the normal growth indicators in the post-test due to exposure to the educational program.
The results of the study of Weerden showed that parents remarkably increased their positive parenting practices, as better outcomes were found between pre-test plus post-test data for positive and approved parenting as a whole. In the present study, the educational program includes experiences and activities that affected the parents. The activities match the parents‟ a ilities. Parents' seriousness follow-up, and desire to attend educational sessions continuously provide feedback on their understanding and acquisition of the required information. The mean performance of the experimental group of parents who underwent an educational program was significantly higher than that of the control group. RECOMMENDATIONS It is suggested to conduct more studies of preventive educational nature to prevent the risk of various disabilities by raising parents' awareness of natural growth and development risk indicators in other age groups. Further studies are needed on the important role of mother and child centers and the role of nursing colleges through community health nursing in raising the level of knowledge of parents about natural growth and developmental risk indicators.
Conclusion There are differences in the level of knowledge of parents about developmental delay indicators due to the educational program. But the program has to be well planned and conducted. CONFLICT OF INTERESTS The author has not declared any conflict of interests. REFERENCES Ajaj S (2008). Growth Psychology, King Faisal University, Riyadh:
Family Development Center 1:57. Al-Ayed IH (2010). Mothers‟ knowledge of child health matters: are we
doing enough? Journal of Family and Community Medicine 17(1):22-28.
Al-Hassan SM, Lansford JE (2011). Evaluation of the better parenting program in Jordan. Early Child Development and Care 181(5):587-598.
Al – Hawarneh M (2012). Studying some of the variables associated with the delayed development of language in kindergarten children "case study". University of Damascus Journal 28(3).
Dukhan N, Hasballah O (2015). The effectiveness of a training program in developing communication skills for mothers of children with autism. Unpublished Master thesis, Ghazza Islamic University.
Jarrah S, Safadi R, Al-Ashhab S (2012). Jordanian mothers‟ caring practices of infants‟ health pro lems in the postpartum period. Archives des Sciences 65(7):461-483.
Kafafi A (2009). The Ascendant Psychology. - The Psychology of Childhood and Adolescence, Dar Al-Fikr for publishing, 1st issue, Amman, Jordan.
Safadi RR, Ahmad M, Nassar OS, Alashhab SA, AbdelKader R, Amre HM (2016). Jordanian Mothers Knowledge of Infants Childrearing and Developmental Milestones. International Nursing Review. International Council of Nurses. www.researchgate.net/publication/305699360 63:50-59.
Weerden MP (2016). The impact of the parenting training „ e are Parents‟ on positive parenting in Ethiopia Master thesis Master program Educational Sciences Academic Master Youth, Education & Society Utrecht University, June 28, 2016.

Vol. 14(9), pp. 309-319, 10 May, 2019
DOI: 10.5897/ERR2019.3742
Article Number: D0F8F5D60903
ISSN: 1990-3839
Copyright ©2019
Author(s) retain the copyright of this article
http://www.academicjournals.org/ERR
Educational Research and Reviews
Full Length Research Paper
Modeling the relationships between practitioner capacity-building practices and the behavior and development of young children with disabilities
and delays
Carl J. Dunst*, Deborah W. Hamby and Melinda Raab
Orelena Hawks Puckett Institute, United States.
Received 28 March, 2019; Accepted 7 May 2019
The manner in which family-centered capacity-building practices and parenting efficacy beliefs were directly and indirectly related to parent-child interactions and child behavior and development was investigated using meta-analytic structural equation modeling. The participants were 6507 caregivers of young children with identified disabilities and developmental delays in 13 studies. Results showed that capacity-building practices were directly related to parenting efficacy beliefs and indirectly related to parent-child interaction mediated by belief appraisals; parenting efficacy beliefs were directly related to parent-child interactions and indirectly related to child social competence mediated by parenting practices; and parent-child interactions were directly related to both child behavior and child development. Results also indicated these relationships were not moderated by parents’ education, severity of child disability, or frequency of practitioner-parent contacts. Implications for investigating the influences of social and family systems intervention practices on parent, family, and child outcomes of early childhood intervention are described. Key words: Family-centered practices, capacity-building, parenting efficacy, parenting practices, child social behavior, child cognitive development.
INTRODUCTION Early childhood intervention involves the experiences afforded infants, toddlers, and preschoolers with identified disabilities or developmental delays and children at-risk for poor developmental outcomes to influence child behavior and development (Groark et al., 2011). This type of intervention also includes the supports provided by young children’s parents and other caregivers to promote child learning and development (Powell, 1988).
The latter type of parent involvement has been described as the “experiences and opportunities afforded infants, toddlers, [and preschoolers] by children’s parents and other primary caregivers that are intended to promote children’s acquisition and use of behavioral competencies to…influence prosocial interactions with people and objects” (Dunst, 2007: 162).
It is now generally recognized that this is best
*Corresponding author. E-mail: [email protected].
Author(s) agree that this article remain permanently open access under the terms of the Creative Commons Attribution
License 4.0 International License

310 Educ. Res. Rev. accomplished when practitioners use family-centered capacity-building practices that not only benefit young children but which also support and strengthen parenting confidence and competence (Dunst and Espe-Sherwindt, 2016). Family capacity-building practices are a particular type of family-centered help giving used by early childhood intervention practitioners to engage parents and other family members in informed decision making and actions to strengthen existing capabilities and promote acquisition of new capabilities (Dunst, 2010), including, but not limited to, parenting beliefs and practices to affect child learning and development (Powell, 2003). Family-centered capacity-building practices are described in the early childhood intervention literature as enabling practices (Summers and Jenkins, 2001), participatory practices (Dunst and Espe-Sherwindt, 2016), engaging practices (Buckingham et al., 2016), collaborative practices (Espe-Sherwindt, 2008), and empowering practices (Dunst et al., 1988) as well as by other terms (Dunst and Espe-Sherwindt, 2016).
Findings from meta-analyses and systematic reviews of family-centered practices studies indicate that these particular types of practices are related to a host of parent, family, and child outcomes (Dempsey and Keen, 2017; Dunst et al., 2008; Thompson et al., 1997). Dunst et al. (2008), in a comprehensive review of family-centered practices research, found that participatory help giving was related to parents’ self-efficacy beliefs and both confidence and competence belief appraisals. These types of beliefs are personal judgments of one’s ability to execute actions in order to achieve desired outcomes (Bandura, 1997).
Self-efficacy beliefs have been used widely as a measure of the consequence or outcome of capacity-building practices and experiences (Dunst et al., 2007; Hohlfeld et al., 2018). Findings from structural equation modeling studies indicate that these belief appraisals mediate the relationship between family-centered practices and parent and child outcomes (Dunst et al., 2007; Dunst and Trivette, 2009; Thompson et al., 1997). Investigators of these studies, however, did not separate out the effects of family-centered capacity-building practices and other types of family-centered help giving and therefore the results may be confounded. The study described in the paper is part of a line of research spanning almost 40 years. This research has focused on the relationships between family-centered practices and child, parent, and family outcomes, and the manner in which these relationships are mediated by intervening variables including, but not limited to, parents belief /appraisals about executing courses of action to achieve desired goals or outcomes (Bandura, 1997; Skinner and Greene, 2008). This research has included the systematic evaluation of the manner in which family-centered capacity-building practices are directly and indirectly related to outcomes of interest using social and family systems frameworks (Dunst, 2017) as frames of
reference for testing basic tenets of these systems frameworks (Bronfenbrenner, 1994; Emery, 2014; Friedman and Allen, 2010). The outcome of this research-to-practice line of research has been the identification of the pathways of influence of family-centered capacity-building practices on parenting practices and child behavior and development. Hypotheses The study focused on the investigation of the relationship between family-centered capacity-building practices and parenting efficacy beliefs, and the manner in which belief appraisals mediated the influences of capacity-building practices on parent-child interactions and child behavior and development. This was accomplished using meta-analytic structural equation modeling (MASEM; Cheung, 2015) where results from different studies were combined and the structural equation model (SEM) shown in Figure 1 was the focus of investigation. MASEM combines meta-analysis and structural equation modeling in order to build a dataset and test the fit of a hypothesized model to the relationships between the variables in the model (Cheung and Chan, 2009). The hypothesized pathways of influence are highlighted in Figure 1 where the pathways are informed from prior research on the relationships among the variables in the model (Trivette et al., 2010). (i) Family-centered capacity-building practices were expected to be directly related to parenting beliefs (Dunst and Dempsey, 2007; Dunst et al., 2007) and indirectly related to parent-child interactions mediated by belief appraisals (Dunst et al., 2008; Trivette et al., 2010). (ii) Parenting belief appraisals were expected to be directly related to parent-child interactions (Coleman et al., 2002; Guzell and Vernon-Feagans, 2004) and indirectly related to child behavior and development mediated by parents’ interactional practices (Teti et al., 1996; Trivette et al., 2010). (iii) Parent-child interactions were expected to be directly related to both child behavior and development (Landry et al., 2001; Steelman et al., 2002). In addition to testing both the direct and mediated effects of the variables in the SEM, a number of moderator effects of the relationships among the SEM variables were evaluated. The moderators were parent education, severity of child disability, and frequency of practitioner-parent contacts. The extent to which each of these variables moderated the relationship between (a) family-centered capacity-building practices and parenting efficacy beliefs and (b) parenting efficacy beliefs and parent-child interactions were the focus of investigation because previous research studies and reviews have yielded contradictory findings and conclusions (Bailey

Dunst et al. 311
Figure 1. Hypothesized structural equation model for the relationships between the study variables.
et al., 2007; Crossman et al., 2018; Dempsey and Keen, 2008; Dunst et al., 2007; Dunst and Trivette, 2009; Nievar et al., 2010). The tests for moderator effects were expected to produce evidence to reconcile differences reported in previous research. MATERIALS AND METHODS Search strategy
Candidate studies were located using the search terms shown in Table 1 for each of the SEM constructs in a series of separate searches (e.g., family-centered AND capacity-building AND parenting efficacy AND early intervention; parenting efficacy AND parent-child interactions AND early childhood intervention). The names of specific scales and instruments that have been widely used to assess each of the Figure 1 constructs were also searched to identify candidate studies [e.g., Family-Centered Practices Scale (Dunst and Trivette, 2002); Parenting Sense of Competence Scale (Rogers and Matthews, 2004); Maternal Behavior Rating Scale (Mahoney et al., 1986); Conners ChildBehavior Rating Scales (Conners, 1997); and Bayley Scales of Infant and Toddler Development (Bayley, 2006). More than 100 different combinations of search terms were used to identify candidate studies in each of the sources described next.
Controlled vocabulary and both keyword and natural language terms were used to search 12 different electronic databases (PsychInfo, ERIC, MEDLINE, Web of Science, CINAHL Plus, ProQuest Central, Academic Search Elite, Google Scholar, etc.). These searches were supplemented by examination of studies included in previous research syntheses and reviews as well as the reference sections of all located research papers. Unpublished and grey literature was located through searches of Dissertation Abstracts International, ProQuest Dissertations and Theses, Google, and 10 different grey literature databases (e.g., GreyNet International, Grey Literature Network Service, OpenGrey Database). Where possible, results were sorted by relevance in order to identify candidate studies where the results were examined until 25 consecutive research reports did not meet the inclusion
criteria described below. In cases where results could not be sorted by relevance, the first 100 results from each search were examined to determine if any of the studies included relevant data.
Inclusion criteria No limitation was placed on candidate studies in terms of year of publication or type of research report. The abstracts of all located papers were examined to determine if the variables of interest were the focus of investigation. If no abstract was included or the relevance of the study could not be determined from the abstract, the methods section of the research reports were examined to determine if a study included the variables in Figure 1. Studies were included if at least 3 of the 5 variables on interest in Figure 1 were included, and the correlations among the measures were reported in the research reports. A unique feature of a MASEM is the fact that a study does not need to include all of the variables of interest as long as the correlations among the measures that were used are reported or can be computed (Jak, 2015). Studies that did not include all of the correlations between measured variables were excluded due to problems and concerns in estimating missing effect sizes (Cheung, 2015).
Search results
An initial pool of 157 studies was identified as candidate studies based on the review process described above. Each study was first examined to determine if three or more of the constructs of interest were the focus of investigation. Second, the studies were examined to determine if the correlations among the measures were included in the research reports. The majority of studies (69%) were excluded because they did not include measures of at least three of the relevant variables or no correlations were reported among the measures. Most of the studies were excluded because they did not include family-centered capacity-building and parenting efficacy belief measures and at least one other variable of interest.
The remaining studies were examined further to determine if they met the inclusion criteria. An additional 35 studies were excluded because they either did not include the correlations among all study
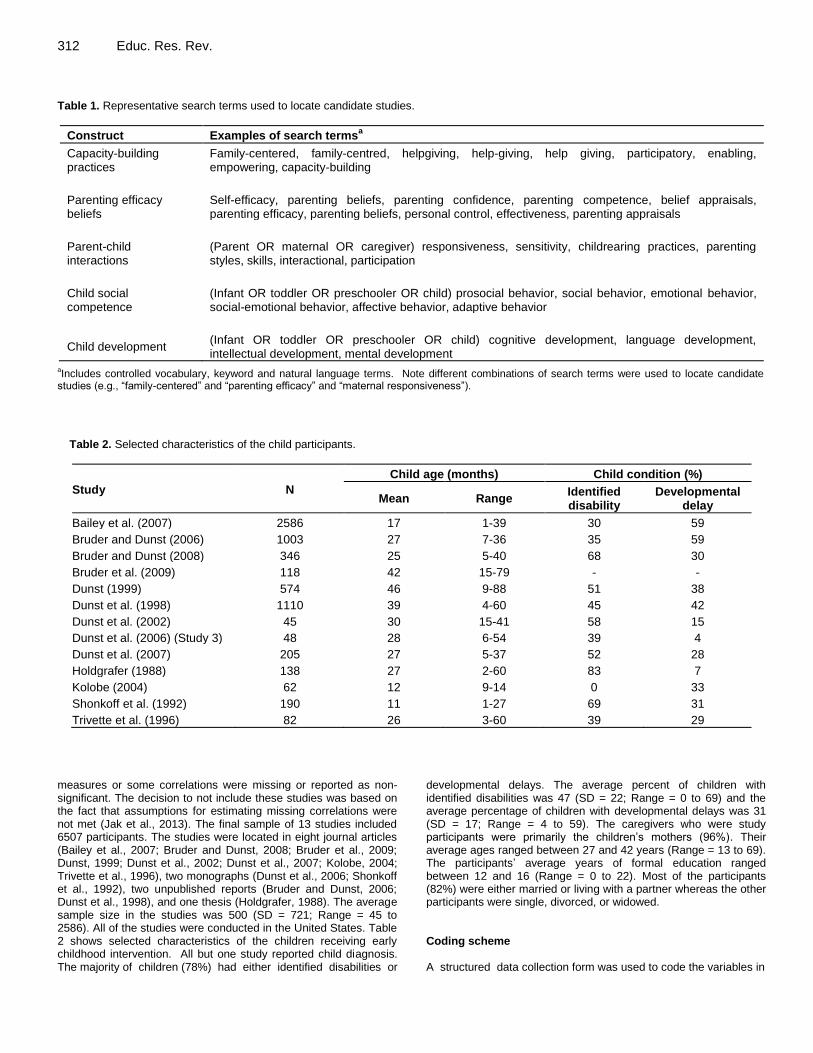
312 Educ. Res. Rev. Table 1. Representative search terms used to locate candidate studies.
Construct Examples of search termsa
Capacity-building practices
Family-centered, family-centred, helpgiving, help-giving, help giving, participatory, enabling, empowering, capacity-building
Parenting efficacy beliefs
Self-efficacy, parenting beliefs, parenting confidence, parenting competence, belief appraisals, parenting efficacy, parenting beliefs, personal control, effectiveness, parenting appraisals
Parent-child interactions
(Parent OR maternal OR caregiver) responsiveness, sensitivity, childrearing practices, parenting styles, skills, interactional, participation
Child social competence
(Infant OR toddler OR preschooler OR child) prosocial behavior, social behavior, emotional behavior, social-emotional behavior, affective behavior, adaptive behavior
Child development (Infant OR toddler OR preschooler OR child) cognitive development, language development, intellectual development, mental development
aIncludes controlled vocabulary, keyword and natural language terms. Note different combinations of search terms were used to locate candidate
studies (e.g., “family-centered” and “parenting efficacy” and “maternal responsiveness”).
Table 2. Selected characteristics of the child participants.
Study N
Child age (months) Child condition (%)
Mean Range Identified disability
Developmental delay
Bailey et al. (2007) 2586 17 1-39 30 59
Bruder and Dunst (2006) 1003 27 7-36 35 59
Bruder and Dunst (2008) 346 25 5-40 68 30
Bruder et al. (2009) 118 42 15-79 - -
Dunst (1999) 574 46 9-88 51 38
Dunst et al. (1998) 1110 39 4-60 45 42
Dunst et al. (2002) 45 30 15-41 58 15
Dunst et al. (2006) (Study 3) 48 28 6-54 39 4
Dunst et al. (2007) 205 27 5-37 52 28
Holdgrafer (1988) 138 27 2-60 83 7
Kolobe (2004) 62 12 9-14 0 33
Shonkoff et al. (1992) 190 11 1-27 69 31
Trivette et al. (1996) 82 26 3-60 39 29
measures or some correlations were missing or reported as non-significant. The decision to not include these studies was based on the fact that assumptions for estimating missing correlations were not met (Jak et al., 2013). The final sample of 13 studies included 6507 participants. The studies were located in eight journal articles (Bailey et al., 2007; Bruder and Dunst, 2008; Bruder et al., 2009; Dunst, 1999; Dunst et al., 2002; Dunst et al., 2007; Kolobe, 2004; Trivette et al., 1996), two monographs (Dunst et al., 2006; Shonkoff et al., 1992), two unpublished reports (Bruder and Dunst, 2006; Dunst et al., 1998), and one thesis (Holdgrafer, 1988). The average sample size in the studies was 500 (SD = 721; Range = 45 to 2586). All of the studies were conducted in the United States. Table 2 shows selected characteristics of the children receiving early childhood intervention. All but one study reported child diagnosis. The majority of children (78%) had either identified disabilities or
developmental delays. The average percent of children with identified disabilities was 47 (SD = 22; Range = 0 to 69) and the average percentage of children with developmental delays was 31 (SD = 17; Range = 4 to 59). The caregivers who were study participants were primarily the children’s mothers (96%). Their average ages ranged between 27 and 42 years (Range = 13 to 69). The participants’ average years of formal education ranged between 12 and 16 (Range = 0 to 22). Most of the participants (82%) were either married or living with a partner whereas the other participants were single, divorced, or widowed. Coding scheme A structured data collection form was used to code the variables in

each study and the particular scales, instruments, or methods used to measure each SEM construct. We had access to the raw data in all but one study (Kolobe, 2004). This permitted the use of different sets of study items to construct measures of a number of SEM variables where the correlations among measures could be computed. The primary variables of interest were family-centered capacity-building practices; parenting efficacy beliefs; responsive and sensitive parent interactional behavior; child social competencies; and child cognitive development. Capacity-building practices Family-centered capacity-building practices were assessed in terms of parent-reported practitioner use of help giving practices that involved informed family decision-making and active family involvement in acting on those decisions (Espe-Sherwindt and Serrano, 2016). Capacity-building was measured by the participatory help giving practices subscales on the Family-Centered Practices Scale (Dunst and Trivette, 2002), Help-Giving Practices Scale (Dunst et al., 1996), and investigator-developed measures. The latter included primarily subsets of items on existing family-centered practices scales that were administered to study participants. Parenting efficacy beliefs Parenting efficacy was assessed in terms of parents’ judgments of their abilities to organize and execute parenting roles and responsibilities to have intended or expected child behavior consequences (Wittkowski et al., 2017). Parenting efficacy beliefs were measured by the Parenting Experiences Scale (Trivette and Dunst, 2004), Personal Assessment of Control Scale (Boyd and Dunst, 1996), Confidence in Parenting Scale (Bailey et al., 2007), and investigator-developed measures. Parent-child interactions Parenting practices were assessed in terms of caregiver behavior known to have development-enhancing characteristics and consequences (Richter, 2004; van IJzendoorn, 1995). This included primarily parenting sensitivity and responsiveness to child behavior initiations and interactions (Dunst and Kassow, 2008; Nievar and Becker, 2008). Parent-child interactions were measured by the Nursing Child Assessment Teaching Scale (Barnard and Kelly, 1990), Parent-Child Play Scale (Dunst, 1986), Parent Behavior Rating Scale (Dunst, 1990), and investigator-developed measures. Child social interactive behavior Child behavior competence was assessed in terms of prosocial behavior used by a child to initiate and sustain interactions with parents and other caregivers (Whiting et al., 1992). Prosocial child competence was measured using behavioral indicators of child interactive competencies in individual studies. This included, but was not limited to, the frequency of child positive affect, child behavior initiations, and affection toward others. Child cognitive development Child cognitive development was assessed using standardized measures of intellectual development (Ellingsen, 2016). This included the Bayley Scales of Infant Development (Bayley, 1993), Griffiths’ Mental Development Scales (Griffiths and Huntley, 1996),
Dunst et al. 313 McCarthy Scales of Children’s Abilities (McCarthy, 1972), and Wisconsin Behavior Rating Scales (Song et al., 1979). Each child’s cognitive developmental quotient was computed as mental age divided by chronological age multiplied by 100. Moderator variables The moderators of the relationships between the variables in the SEM were mothers’ education, frequency of parent-practitioner contacts, and child disability. Mothers’ education was measured in terms of years of formal schooling. Frequency of contacts was coded on a continuum from 4 to 5 days per week to once every 2 or 3 months. Child disability was measured on a continuum from multiple disabilities to at-risk for poor outcomes for family socioeconomic reasons. Contrast coding (Cohen et al., 2003) was used to code child disability on a continuum from multiple disabilities to at-risk for poor developmental outcomes. Data preparation The correlations among the variables of interest in each candidate study were first examined to determine which correlations were reported for which variables or could be computed from available data. Matrices for variables missing at random were retained for further analysis, whereas studies with variables not missing at random were excluded from further analysis. Data is considered missing at random if one or more variables of interest werenot the focus of investigation in a primary study. In this case, “the missingness of the effect sizes in considered missing at random; that is, the missingness may depend on observed data but not on unobserved data, and the proposed SEM approach is unbiased and efficient” (Cheung and Chan, 2009). In contrast, missing data is considered non-random when variables of interest were included in a study but the correlations are reported as non-significant or not reported at all. Method of analysis A two-stage SEM approach was used to produce a weighted pooled correlation matrix and to perform the SEM using the pooled matrix (Cheung and Chan, 2009). The analyses were performed using the metaSEM package in R (Cheung, 2014b). At Stage 1, the homogeneity of the correlations in the different studies was evaluated in order to produce a weighted pooled correlation matrix. At Stage 2, the Figure 1 SEM was fitted to the pooled correlation matrix where different fit indices (Kenny, 2015) were used to evaluate the adequacy of the fit of the model to the data and to obtain the standardized structural equation coefficients between the variables in the SEM to determine pathways of influence. The fit indices included the chi-square test of the SEM model, the root mean square error of approximation (RMSEA), the standardized root mean square residual (SRMR), the comparative fit index (CFI), and the Tucker-Lewis index (TCI). A non-significant chi-square test indicates an adequate fit of the SEM to the data. An RMSEA and SRMR close to zero, and a CFI and TLI close to 1.0, indicates an excellent fit of an SEM to the data.
Random-effects analyses were performed at both Stages 1 and 2 because a Stage 1 fixed-effects analysis indicated that the correlations between certain pairwise variables were heterogeneous across studies (see results below). A Stage 1 random-effects analysis takes into consideration both between study and within study variability in estimating a weighted pooled correlation matrix (Cheung, 2014a). At Stage 2, the random-effects pooled correlation matrix is used as the input where an SEM is fitted to the patterns of relationships among the variables in the model.

314 Educ. Res. Rev.
Table 3. Weighted pooled correlations among the study variables (above diagonal) and the indices of heterogeneity between the study variables (below diagonal).
Study variable Study variables
FCB PEB PCI CSC CCD
Family-Centered Capacity-Building (FCB) - 0.422**** 0.171** 0.160*** 0.148*
Parenting Efficacy Beliefs (PEB) 0.913 - 0.341*** 0.218**** 0.187**
Parent-Child Interactions (PCI) 0.000 0.911 - 0.271* 0.298****
Child Social Competence (CSC) 0.537 0.000 0.928 - 0.109
Child Cognitive Development (CCD) 0.000 0.000 0.831 0.000 -
*p<0.05. **p < 0.01, *** p < 0.001, **** p < 0.0001.
In instances where a Stage 1 fixed-effects analysis indicates a less-than-adequate goodness-of-fit between the correlations matrices in the different studies, a Stage 1 random-effects analysis is used to identify the sources of heterogeneity using the I2 statistic which can vary between zero and 100, where values greater than 75 indicate inconsistency in the average sizes of effects between the correlation matrices in the different studies (Higgins et al., 2003). I2is “interpreted as the proportion of total variance that is due to differences between studies” (Jak, 2015: 27). RESULTS The results for both the Stage 1 and 2 analyses are described next to show how the pooled correlation matrix was computed and how the correlation matrix was used to fit the proposed structural model. The analyses illustrate how findings from different studies can be combined and used to investigate the relationships among the variables of interest using MASEM as a data analytic strategy for identifying those relationships. Stage 1 analysis The goodness-of-fit indices for the Stage 1 fixed-effects analysis was χ
2 (27, 6507) = 153.84, p = 0.0000, RMSEA
= 0.10 (95% CI = 0.08, 0.11), SRMR = .08, CFI = 0.91, and TLI = 0.88. Because these fit indices are marginally adequate, a random-effects Stage 1 analysis was run in order to obtain the appropriate weighted pooled correlation matrix among the SEM variables. The Q statistic for the homogeneity of effect sizes was 171.69, df = 27, p = 0.0000, indicating that there was heterogeneity in the correlation matrices in the studies in the SEM. The SEM includes 10 pairwise correlations among the five primary variables of interest. Five of the pairwise correlations had I
2 = 0, one pairwise correlation
had an I2 = 0.54, and four pairwise correlations had I
2
values between 0.83 and 0.93. These results indicate heterogeneity among half of the study variables.
Table 3 shows the random-effects pooled correlations among the study variables above the diagonal. The I
2
between the pairwise correlations are shown below the
diagonal. The sizes of effects between the primary variables were generally as expected. The size of effect between family-centered capacity-building practices and the other SEM variables was largest for parenting efficacy beliefs. The size of effects between parenting efficacy beliefs and the other SEM variables was largest for parent-child interactions. The sizes of effects between parent-child interactions and the two child outcome measures were also as expected. The size of effect between child social competence and child cognitive development was the smallest and unexpected.
Stage 2 analysis
The goodness-of-fit indices for the fit of the Figure 1 SEM to the data were χ
2 (2, 6507) = 2.62, p = 0.2695, RMSEA
= 0.01 (95% CI = 0.00, 0.03), SRMR = 0.03, CFI = 0.99, and TLI = 0.99. The results indicate an excellent fit of the model to the data. The standardized structural coefficients for the pathways of influence among the variables in the model are shown in Figure 2. The sizes of effects for the hypothesized pathways are β = 0.43, p = 0.0000, for the relationship between family-centered capacity-building practices and parenting efficacy beliefs; β = 0.27, p = 0.0000, for the relationship between parenting efficacy and parent-child interactions; and β = 0.25, p = 0.0000, and β = 0.27, p = 0.0000, for the relationships between parent-child interactions and child social competence and child cognitive development, respectively.
In addition to the hypothesized pathways in the SEM, parenting efficacy beliefs were directly related to child social competence, β = 0.14, p = 0.0011, but only marginally related to child cognitive development, β = 0.10, p = 0.0700. The only pathway in the model that did not approach statistical significance was between family-centered capacity-building and parent-child interactions, β = 0.07. p = 0.2262 (Figure 2).
Table 4 shows the effects decomposition for the direct, indirect, and total effects for the relationships among the variables in the SEM. The direct effects are the same as those in Figure 2. As expected, family-centered capacity-

Dunst et al. 315
Figure 2. Standardized structural coefficients for the relationships among the MASEM variables.
Table 4. Effects decomposition for the relationships among the study variables.
Outcome variable Predictor variables Direct effects Indirect effects Total effects
β p-value β p-value β p-value
Parenting efficacy beliefs Capacity-building practices 0.43 0.0000 - - 0.43 0.0000
Parent-child interactions Capacity-building practices 0.07 0.2262 0.12 0.0281 0.19 0.0376
Parenting efficacy beliefs 0.27 0.0137 - - 0.27 0.0137
Child social competence Parenting efficacy beliefs 0.14 0.0011 0.07 0.1251 0.21 0.0025
Parent-child interactions 0.25 0.0245 - - 0.25 0.0025
Child cognitive development Parenting efficacy beliefs 0.10 0.0700 0.07 0.0694 0.17 0.0233
Parent-child interactions 0.27 0.0002 - - 0.27 0.0002
building was indirectly related to parent-child interactions mediated by parenting efficacy beliefs, β = 0.12, p = 0.0281. Contrary to expectation, parenting efficacy beliefs were not indirectly related to the two child outcome measures mediated by parent-child interactions. The results for the total effects for the relationships among the SEM variables indicate that a combination of direct and indirect effects best explain the patterns of relationships among the study measures. All of the βs for the total effects are statistically significant and highlight how the variables of interest are related in discernable ways consistent with the hypothesized patterns of relationships guiding the conduct of the MASEM. Moderator analyses The standardized structural coefficients from the tests of moderator analyses were all small and statistically non-
significant. The βs were all 0.06 or smaller. The results indicated that the relationships among the primary variables of interest shown in Figure 1 and Table 4 were not influenced by parent education, severity of child disability, or frequency of practitioner-parent contacts. DISCUSSION Results from the MASEM were consistent with the hypothesized relationships among the variables in the SEM. The effects of practitioner use of family-centered capacity-building practices were traced to variations in child social competence and child cognitive development through both parenting efficacy beliefs and responsive and sensitive parenting practices. The hypothesized patterns of results were confirmed by the sizes of effects between capacity-building practices and parenting efficacy beliefs; parenting beliefs and parent-child
Figure 2.Standardized structural coefficients for the relationships among the MASEM variables.
Table 4 shows the effects decomposition for the direct, indirect, and total effects for the relationships among the
.25 .25
.07 .07
.27 .01
.10
.14
.27
.43
Family-centered
capacity-building
practices
Parent-child
interactions
Child social competence
Parenting efficacy
beliefs
Child cognitive
development

316 Educ. Res. Rev. interactions; and parenting practices and child behavior and child development (Figure 1). The effects decomposition showed that a combination of direct and indirect effects best explained the relationships among the study variables (Table 4). The MASEM is part of a line of research and practice on investigating the manner in which family- centered practices in general, and family-centered capacity-building practices in particular, are related to parent, family, and child outcomes (Dunst, 2012; Dunst and Trivette 2010). Previously completed SEMstudies (Dunst et al., 2007, 2013), meta-analyses (Dunst et al., 2007; Dunst et al., 2008), and MASEMs (Dunst and Trivette, 2009; Trivette et al., 2010), however, included measures of different kinds of family-centered practices and measures of different kinds of self-efficacy beliefs. This was addressed in the present study by including measures of only family-centered capacity-building practices and measures of only parenting efficacy beliefs. This permitted a better determination of how these particular variables were empirically related.
As noted in the introduction, family-centered practices are a particular type of help giving used by practitioners (help givers) to support and strengthen help receiver competence and confidence (Dunst and Trivette, 1996; Dunst et al., 1988). Family-centered early childhood intervention practices include the help giving practices used by practitioners with parents of infants, toddlers, and preschoolers of children with and without disabilities and delays (Rouse, 2012; Tomasello et al., 2010). Capacity-building early childhood intervention practices are used by practitioners to both support and strengthen parents’ abilities to (1) provide their children development-enhancing learning opportunities (Dunst and Espe-Sherwindt, 2016; Swanson et al., 2011) and (2) obtain the resources and social supports for carrying out parenting responsibilities (Dunst and Trivette, 2011; Dunst et al., 1994).
Family-centered capacity-building practices are how early childhood intervention practitioners promote parents’ use of different kinds of intervention practices. The distinction between how and what continues to be misunderstood in the early childhood intervention literature (Dunst and Espe-Sherwindt, 2016). The difference between how and what was examined in the MASEM by differentiating between practitioner capacity-building (help giving) practices and parent interactional practices. The latter has been a primary focus of early childhood intervention for more than 50 years (Dyches et al., 2012) but without explicit consideration as to how practitioners support and strengthen parenting practices. Results from the MASEM indicated that family-centered capacity-building practices are indirectly related to variations in how parents interact with their children mediated by parenting efficacy beliefs. Stated differently, capacity-building practices bolster parenting beliefs, where belief appraisals, in turn, result in more effective use of parenting practices.
Implications for research Meta-analyses of the sort described in this paper can be especially informative in terms of investigating the relationships among variables of interest. The MASEM, however, proved challenging for a number of reasons. Several are highlighted. First, only about a dozen studies were located that included at least 3 of the 5 variables that were the focus of investigation. As noted in the search results section, only 13 out on an initial pool of 150+ studies met the inclusion criteria. Second, studies that included measures of the variables of interest had quite different scales, instruments, and methods to assess the MASEM constructs. Examination of the correlation matrices in individual studies indicated considerable variability in the patterns of relationships among the study variables, contributing to the heterogeneity among the pooled correlations (Table 3). Third, the standard errors for several of the parameter estimates of the variables in the SEM were noticeably large for certain standardized structural coefficients. This would have likely suppressed the strength of relationships among measures.
The line of research and practice guiding the conduct of the MASEM is based on social and family systems theories where basic tenets have been used to formulate the hypothesized relationships among variables of interest (Bronfenbrenner, 1979; Emery, 2014; Friedman and Allen, 2010). These types of theories are used widely in early childhood intervention to build a case for systems intervention models and practices (Darling, 1989; Seligman and Darling, 2016; Sukkar et al., 2017). There is, however, a lag gap between these theories and research to support basic tenets as evidenced by the small number of studies that were located and used to conduct the MASEM. Early childhood intervention researchers interested in testing complex relationships among systems variables, and especially where variable of interest differ in terms of the focus of investigation (e.g., practitioner, parent, parent-child, and child), are advised to carefully consider which variables need to be included in a study and which measures are best suited for evaluating systems effects. Otherwise, explanatory paths of influence may be overlooked where results may not capture systems complexities.
At least two limitations of the MASEM need to be highlighted since they have implications for further research. First, the studies in the MASEM included primarily young children with identified disabilities and developmental delays. Whether the pattern of results would be similar or different for children without disabilities or delays needs to be independently established. There is, however, no reason not to expect similar results since meta-analyses of the same or similar variables are more alike than different (Brown et al., 2008; de Wolff and van IJzendoorn, 1997; Pinquart and Teubert, 2010). The second limitation has to do with the

fact that all the studies were conducted in the United States. Replication of the results would therefore need to be done in other countries to be assured the findings can be generalized to families in other countries and especially among families with diverse cultural backgrounds. CONFLICT OF INTERESTS The authors have not declared any conflict of interests. ACKNOWLEDGEMENTS The study described in this paper was supported, in part, by funding from the U.S. Department of Education, Institute of Education Sciences (#H324A110025). The opinions expressed, however, are those of the authors and no endorsement should be inferred or implied by either the Department or Institute. REFERENCES
Bailey DB Jr, Nelson L, Hebbler K, Spiker D (2007). Modeling the
impact of formal and informal supports for young children with disabilities and their families. Pediatrics 120:992-1001.
Bandura A (1997). Self-efficacy: The exercise of control. New York: Freeman.
Barnard KE, Kelly JF (1990). Assessment of parent-child interaction. InSJ Meisels JP Shonkoff Eds Handbook of early childhood intervention. New York, NY: Cambridge University Press pp. 278-302.
Bayley N (1993). Bayley Scales of Infant Development 2nd ed. San Antonio, TX: Psychological Corporation.
Bayley N (2006). Bayley Scales of Infant and Toddler Development 3rd ed. San Antonio, TX: Psychological Corporation.
Boyd K, Dunst CJ (1996). Personal assessment of control scale. Asheville, NC: Winterberry Press.
Bronfenbrenner U (1979). The ecology of human development: Experiments by nature and design. Cambridge, MA: Harvard University Press.
Bronfenbrenner U (1994). Ecological models of human development. In T Husen, TN Postlethwaite Eds. International encyclopedia of education 2nd Ed. 3:1643-1647. Oxford, UK: Elsevier.
Brown CH, Wang W, Sandler I (2008). Examining how context changes intervention impact: The use of effect sizes in multilevel mixture meta-analysis. Child Development Perspectives 2:198-205.
Bruder MB, Dunst CJ (2006). Birth to three intervention systems evaluation study (Unpublished study). Farmington CT: AJ Pappanikou Center for Excellence, University of Connecticut Health Center.
Bruder MB, Dunst CJ (2008). Factors related to the scope of early intervention service coordinator practices. Infants and Young Children 21(3):176-185.
Bruder MB, Dunst CJ, Mogro-Wilson C (2009). Child factors associated with enrollment in Part C early intervention among adopted children from China. Journal of Early Intervention 32:54-67.
Buckingham SL, Brandt NE, Becker KD, Gordon D, Cammack N (2016). Collaboration, empowerment, and advocacy: Consumer perspectives about treatment engagement. Journal of Child and Family Studies 25(12):3702-3715.
Cheung MW-L (2014a). Fixed- and random-effects meta-analytic structural equation modeling: Examples and analyses in R. Behavior Research Methods 46:29-40.
Dunst et al. 317 Cheung MW-L (2014b). metaSEM: An R package for meta-analysis
using structural equation modeling. Frontiers in Psychology 5:1521-1535.
Cheung MW-L (2015). Meta-analysis: A structural equation modeling approach. Chichester, U. K.: John Wiley and Sons.
Cheung MW-L, Chan W (2009). A two-stage approach to synthesizing covariance matrices in meta-analytic structural equation modeling. Structural Equation Modeling 16:28-53.
Cohen J, Cohen P, West SG, Aiken LS (2003). Applied multiple regression/correlation analysis for the behavioral sciences. 3rd ed. Mahwah, NJ: Erlbaum.
Coleman PK, Trent A, Bryan S, King B, Rogers N, Nazir M (2002). Parenting behavior, mothers' self-efficacy beliefs, and toddler performance on the Bayley Scales of Infant Development. Early Child Development and Care 172:123-140.
Conners CK (1997). Conners' parent rating scale. North Tonawanda, NY: Multi-Health Systems.
Crossman MK, Warfield ME, Kotelchuck M, Hauser-Cram P, Parish S (2018). Associations between early intervention home visits, family relationships and competence for mothers of children with developmental disabilities. Maternal and Child Health Journal 22(4):599-607.
Darling RB (1989). Using the social system perspective in early intervention: The value of a sociological approach. Journal of Early Intervention 13:24-35.
de Wolff MS, van IJzendoorn MH (1997). Sensitivity and attachment: A meta-analysis on parental antecedents of infant attachment. Child Development 68:571-591.
Dempsey I, Keen D (2008). A review of processes and outcomes in family-centered services for children with a disability. Topics in Early Childhood Special Education 28:42-52.
Dempsey I, Keen D (2017). Desirable outcomes associated with family-centred practices for young children with disabilities. In H Sukkar, CJ Dunst, J Kirkby Eds. Early childhood intervention: Working with families of young children with special needs (61-73). Abingdon, Oxfordshire: Routledge.
Dunst CJ (1986). Parent-child play scale: A rating scale for assessing parent-child play opportunities. Asheville, NC: Winterberry Press.
Dunst CJ (1990). Parent behavior rating scale. Asheville, NC: Winterberry Press.
Dunst CJ (1999). Placing parent education in conceptual and empirical context. Topics in Early Childhood Special Education 19:141-147.
Dunst CJ (2007). Early intervention with infants and toddlers with developmental disabilities. In Odom SL, Horner RH, Snell M, Blacher J Eds. Handbook of developmental disabilities. New York: Guilford Press pp. 161-180.
Dunst CJ, Trivette (2010). Family capacity-building in early childhood intervention: Effects on parent and child competence and confidence. Presentation made at the 8th National Congress on Early Intervention with Young Children and their Families, Aveiro, Portugal. Retrieved from http://puckett.org/presentations/FamilyCapBuildEarlyChildInt_11_2010.pdf2010.
Dunst CJ (2012). Capacity-building family-centered practices: Characteristics and evidence base. Presentation made at the National Council on Family Relations Annual Conference, Phoenix, AZ Retrieved from http://puckettorg/presentations/CapacityBldgFamilyCntrd%20Practices_Arizonapdf.
Dunst CJ (2017). Family systems early childhood intervention. InH Sukkar CJ Dunst J Kirkby Eds Early childhood intervention: Working with families of young children with special needs (38-60). Abingdon, Oxfordshire: Routledge.
Dunst CJ, Boyd K, Trivette CM, Hamby D (2002). Family-oriented program models and professional helpgiving practices. Family Relations 51:221-229.
Dunst CJ, Brookfield J, Epstein N (1998). Family-centered early intervention and child, parent and family benefits: Final report Harrisburg, PA: Pennsylvania Department of Public Welfare, Office of Mental Retardation.
Dunst CJ, Dempsey I (2007). Family-professional partnerships and parenting competence, confidence, and enjoyment. International

318 Educ. Res. Rev.
Journal of Disability, Development and Education 54:305-318. Dunst CJ, Espe-Sherwindt M (2016). Family-centered practices in early
childhood intervention. InB Reichow BA Boyd EE Barton SL Odom Eds Handbook of early childhood special education (37-55). Switzerland: Springer International.
Dunst CJ, Hamby DW, Brookfield J (2007). Modeling the effects of early childhood intervention variables on parent and family well-being. Journal of Applied Quantitative Methods 2:268-288.
Dunst CJ, Kassow DZ (2008). Caregiver sensitivity, contingent social responsiveness, and secure infant attachment. Journal of Early and Intensive Behavior Intervention 5:40-56.
Dunst CJ, Trivette CM (1996). Empowerment, effective helpgiving practices and family-centered care. Pediatric Nursing 22:334-343.
Dunst CJ, Trivette CM (2002). Family-centered practices scale. Asheville, NC: Winterberry Press.
Dunst CJ, Trivette CM (2009). Meta-analytic structural equation modeling of the influences of family-centered care on parent and child psychological health. International Journal of Pediatrics pp.1-9.
Dunst CJ, Trivette CM (2010). Family-centered helpgiving practices, parent-professional partnerships, and parent, family and child outcomes. InSL Christenson AL Reschley Eds Handbook of school-family partnerships (362-379). New York: Routledge.
Dunst CJ, Trivette CM (2011). Capacity-building family systems intervention practices. InG Singer D Biegel P Conway Eds Family support and family caregiving across disabilities. New York, NY: Routledge pp. 33-57.
Dunst CJ, Trivette CM, Deal AG (1988). Enabling and empowering families: Principles and guidelines for practice. Cambridge, MA: Brookline Books.
Dunst CJ, Trivette CM, Deal AG (1994). Supporting and strengthening families: Methods, strategies and practices. Cambridge, MA: Brookline Books.
Dunst CJ, Trivette CM, Hamby DW (1996). Measuring the helpgiving practices of human services program practitioners. Human Relations 49:815-835.
Dunst CJ, Trivette CM, Hamby DW (2006). Family support program quality and parent, family and child benefits. Asheville, NC: Winterberry Press.
Dunst CJ, Trivette CM, Hamby DW (2007). Meta-analysis of family-centered helpgiving practices research. Mental Retardation and Developmental Disabilities Research Reviews 13:370-378.
Dunst CJ, Trivette CM, Hamby DW (2008). Research synthesis and meta-analysis of studies of family-centered practices. Asheville, NC: Winterberry Press.
Dunst CJ, Trivette CM, Raab M (2013). Pathways of influence of early intervention on family, parent and child outcomes. Presentation made at the Division for Early Childhood 29th Annual International Conference on Young Children with Special Needs and Their Families, San Francisco. Retrieved from http://puckettorg/presentations/Pathway_%20Influ_Early_Interv_Family%20Parent_Child_Outcomespdf.
Dyches TT, Smith TB, Korth BB, Roper SO, Mandleco B (2012). Positive parenting of children with developmental disabilities: A meta-analysis. Research in Developmental Disabilities 33:2213-2220.
Ellingsen KM (2016). Standardized assessment of cognitive development: Instruments and issues. In A Garro Ed Early childhood assessment in school and clinical child psychology. New York: Springer Science+Business Media pp. 26-49. doi:10.1007/978-1-4939-6349-2_2
Emery RE (2014). Families as systems: Some thoughts on methods and theory. In SM McHale P Amato A Booth Eds Emerging methods in family research. Switzerland: Springer International Publishing pp. 109-124.
Espe-Sherwindt M (2008). Family-centred practice: Collaboration, competency and evidence. Support for Learning 23:136-143.
Espe-Sherwindt M, Serrano AM (2016). It takes two: The role of family-centered practices in communication intervention. Revista de Logopedia, Foniatría y Audiología 36(4):162-169.
Friedman BD, Allen KN (2010). Systems theory. In Brandell JR Ed Theory and practice in clinical social work 2nd ed (3-20). Thousand Oaks, CA: SAGE.
Griffiths R, Huntley M (1996). Griffiths mental development scales-
revised: Birth to 2 years. Oxford, England: Hogrefe. Groark CJ, Eidelman SM, Maude S, Kaczmarek L (2011). Early
childhood intervention: Shaping the future for children with special needs and their families. Santa Barbara, CA: Praeger.
Guzell JR, Vernon-Feagans L (2004). Parental perceived control over caregiving and its relationship to parent-infant interaction. Child Development 75:134-146.
Higgins JP, Thompson SG, Deeks JJ, Altman DG (2003). Measuring inconsistency in meta-analyses. British Medical Journal 327:557-560.
Hohlfeld AS, Harty M, Engel ME (2018). Parents of children with disabilities: A systematic review of parenting interventions and self-efficacy. African Journal of Disability 7:437-448.
Holdgrafer MS (1988). The influence of social support on parent, family and child functioning (Unpublished master's thesis). University of Alberta, Edmonton, Canada.
Jak S (2015). Meta-analytic structural equation modelling. New York: Springer.
Jak S, Oort FJ, Roorda DL, Koomen HM (2013). Meta-analytic structural equation modelling with missing correlations. Netherlands Journal of Psychology 65(4):132-139.
Kenny DA (2015). Measuring model fit. Retrieved fromhttp://davidakenny.net/cm/fit.htm.
Kolobe TH (2004). Childrearing practices and developmental expectations for Mexican-American mothers and the developmental status of their infants. Physical Therapy 84:439-453.
Landry SH, Smith KE, Swank PR, Assel MA, Vellet S (2001). Does early responsive parenting have a special importance for children's development or is consistency across early childhood necessary? Developmental Psychology 37:387-403.
Mahoney G, Powell A, Finger I (1986). The Maternal Behavior Rating Scale. Topics in Early Childhood Special Education 6(2):44-55.
McCarthy D (1972). Manual for the McCarthy Scales of Children's Abilities. New York, NY: Psychological Corporation.
Nievar MA, Becker BJ (2008). Sensitivity as a privileged predictor of attachment: A second perspective on De Wolff and van IJzendoorn's meta-analysis. Social Development 17:102-114.
Nievar MA, van Egeren LA, Pollard S (2010). A meta-analysis of home visiting programs: Moderators of improvements in maternal behavior. Infant Mental Health Journal 31:499-520.
Pinquart M, Teubert D (2010). Effects of parenting education with expectant and new parents: A meta-analysis. Journal of Family Psychology 24:316-327.
Powell D (2003). Parenting beliefs and behaviors: What matters most. Schools and Families 6(1):1-4.
Powell D (1988). Parent education as early childhood intervention: Emerging directions in theory, research and practice. Norwood, NJ: Ablex.
Richter L (2004). The importance of caregiver-child interactions for the survival and healthy development of young children: A review. Geneva, Switzerland: World Health Organizationt. Retrieved from http://apps.who.int/iris/bitsteam/10665/42878/1/924159134X.pdf.
Rogers H, Matthews J (2004). The parenting sense of competence scale: Investigation of the factor structure, reliability, and validity for an Australian sample. Australian Psychologist 39(1):88-96.
Rouse L (2012). Family-centred practice: Empowerment, self-efficacy, and challenges for practitioners in early childhood education and care. Contemporary Issues in Early Childhood 13(1):17-26.
Seligman M, Darling RB (2016). Ordinary families, special children: A systems approach to childhood disability 3rd ed. New York: Guilford Press.
Shonkoff J, Hauser-Cram P, Wyngarden-Krauss MW, Upshur CC (1992). Development of infants with disabilities and their families: Implications for theory and service delivery. Monographs of the Society for Research in Child Development 57:6 Serial No. 230.
Skinner E Greene T (2008). Perceived control: Engagement, coping, and development. In TLGood Ed 21st century education: A reference handbook. Newbury Park, CA: Sage Publications pp. 131-130.
Song A, Jones S, Lippert J, Metzgen K, Miller J, Borreca C (1979). Wisconsin behavior rating scale. Madison, WI: Central Wisconsin Center for the Developmentally Disabled.
Steelman LM, Assel MA, Swank PR, Smith KE, Landry SH (2002). Early maternal warm responsiveness as a predictor of child social skills:

Direct and indirect paths of influence over time. Applied Developmental Psychology 23:135-156.
Sukkar H, Dunst CJ, Kirkby J (2017). Early childhood intervention: Working with families of young children with special needs. Abingdon, Oxfordshire: Routledge.
Summers N, Jenkins C (2001). Enabling practice: Investigation into the support of families with children with learning disabilities. Journal of Intellectual Disabilities 5:57-67.
Swanson J, Raab M, Dunst CJ (2011). Strengthening family capacity to provide young children everyday natural learning opportunities. Journal of Early Childhood Research 9:66-80.
Teti DM, O'Connell MA, Reiner CD (1996). Parenting sensitivity, parental depression and child health: The mediational role of parental self-efficacy. Early Development and Parenting 5:237-250.
Thompson L, Lobb C, Elling R, Herman S, Jurkiewicz T, Hulleza C (1997). Pathways to family empowerment: Effects of family-centered delivery on early intervention services. Exceptional Children 64:99-113.
Tomasello NM, Manning AR, Dulmus CN (2010). Family-centered early intervention for infants and toddlers with disabilities. Journal of Family Social Work 13(2):163-172.
Dunst et al. 319 Trivette CM, Dunst CJ (2004). Evaluating family-based practices:
Parenting experiences scale. Young Exceptional Children 7(3):12-19. Trivette CM, Dunst CJ, Hamby D (1996). Factors associated with
perceived control appraisals in a family-centered early intervention program. Journal of Early Intervention 20:165-178.
Trivette CM, Dunst CJ, Hamby DW (2010). Influences of family-systems intervention practices on parent-child interactions and child development. Topics in Early Childhood Special Education 30:3-19.
van IJzendoorn M (1995). Adult attachment representations, parental responsiveness, and infant attachment: A meta-analysis on the predictive validity of the adult attachment interview. Psychological Bulletin 117:387-403.
Whiting BB, Edwards CP, Ember CR (1992). Children of different worlds: The formation of social behavior. Cambridge, MA: Harvard University Press.
Wittkowski A, Garrett C, Calam R, Weisberg D (2017). Self-report measures of parental self-efficacy: A systematic review of the current literature. Journal of Child and Family Studies 26:2960-2978.

Vol. 14(9), pp. 320-326, 10 May, 2019
DOI: 10.5897/ERR2019.3700
Article Number: 428A25660910
ISSN: 1990-3839
Copyright ©2019
Author(s) retain the copyright of this article
http://www.academicjournals.org/ERR
Educational Research and Reviews
Full Length Research Paper
Impact of job searches on self-control at social media
Aliye MENEVŞE
Department of Couching Education, School of Physical Education and Sport, Istanbul Esenyurt University, Turkey.
Received 1 February, 2019; Accepted 30 April, 2019
This study aims to investigate how job search affects self-control of students using social network. This study was conducted on students studying in different departments and within the departments of Physical Education and Sports (BESB). A total of 600 students in the 21 ± 25 age group participated in the employment questionnaire. The statistics of the data were evaluated using Chi-square analysis for the relationship between 0.05 significance level and categorical variables in SPSS 21 package program. According to the participants’ responses to the question "How much time do you spend on social media in a day?" it was observed that students in different departments (FB), (226 people, 75.3%) and BESB students (228 people, 76.0%) spend "6-10 h" daily on social media; whereas students of both departments (84.0%) used social networks intensively to seek employment. As regards the question ’’Do you think the human resources departments of companies should use social media to get ideas about the applicants in the recruitment process? “FB students (218 people, 72.7%) and PESB students (244 people, 81.3%) responded as "No"; and with the highest average score of X2 = 6.362; p = 0.012 < 0.05 there was a significant difference in the BESB section. Also, for the question ''Do you use social media for the job search?'', FB students (171 people, 57.0%) and BESB students (272 people, 90.7%) answered "yes" with the stated rates; with a significant difference among BESB students determined, X2 = 88.002; p = 0.000; < 0.05. Further, as regards ''Do you find social media useful in job search?'', FB students (180 people, 60.0%) and BESB students (287 people, 95.7%) replied "yes" at the stated rates; and a significant difference among BESB students has been detected, X2 = 88.002; p =0.000; <0.05. As a result, the participants stated that the time spent on social media for employment search or digital socialization activities (about 6-10 h a day) prevented them from socialising in other physical activities; they also indicated that they had implemented auto-control in compliance with university regulations and restrictions in their accounts. Also, they were worried about HR identifying their profile on the social networks. Therefore, it is thought that the candidates may exhibit a very different personality in the social media networks than their real-life personalities, and they even tend to share them according to the personality of the institution. Key words: University student, employment, social network, self-control.
INTRODUCTION Human resources (HR) department remains one of the main departments of every corporation ranging from
E-mail: [email protected].
Author(s) agree that this article remain permanently open access under the terms of the Creative Commons Attribution
License 4.0 International License

small enterprises to large companies. With the advent of computer technology and the quick adoption of social network such as FaceBook, HR has started to evaluate the adaptation of social network accounts for new job applicants. During the evaluation process of job applications received via social networks, career sites or CVs, HR departments aim to get an idea about the employees by examining their accounts on social media platforms. In this way, in addition to contacting CVs and references, it is believed that HR departments prefer to get a quick idea about the applicant through social media platforms aiming to make inferences from different perspectives such as personal life, ideas and thoughts, attitude and style in a particular situation and a specific subject. Therefore, HR studies are focused on social networks and self-control (Yılmaz, 2018). Posts shared on popular social media platforms by the candidates, likes, and even the qualities of followers and followed can be reviewed by Human Resources (log.youthall). The shares that users make on social media provide highly detailed data about candidate employees to employers / managers / human resources employees. In fact, it is almost impossible to obtain this information through interview or references. For this reason, Human Resources Departments generally take social media accounts and shares into consideration because the social media are used at such high rates. In this way, they have realistic information about the candidates because they can obtain information on what people do not say. As a result, applicants may either be successful in interviews or may be disadvantaged in their applications (sosyalmedyaajansi.org).
According to the rules applicable in the European Union (EU) country, employers must obtain the candidates‟ consent to sign a waiver before checking their online accounts, including Facebook, Instagram, Snapchat, Twitter and Linkedin. If there is no waiver document, the companies in question may be acting in violation of the European Union data protection rules. Data collection from social media accounts is only possible when necessary and relevant. Therefore, companies may have to change their hiring process (inlinetweet prefix).
Human resources management in the future can be seen to operate with technology that will take up more space every day. Collecting information about the candidate using the internet search engines in the recruitment process is almost a standard recruitment step. Clark (2014) stated that from a candidate's Facebook profile, his personality traits could be obtained from close contact with personality tests. When the use of Social Media is evaluated in terms of Human Resources, there are observed disadvantages as well as advantages, including being used for procurement of candidates and for dismissals. With sharing on sharing sites, negative and slang comments can cause an employee to be
Menevşe 321 dismissed, which leads to a short position. It is stated that when employees share in the social environment they can cause a negative situation in the workplace to spread to thousands of people at the same time. In addition to monitoring and recruitment processes, human resources should be given more responsibility for employees in terms of training in the privacy policy (Erhan, 2018). In addition, training of employees to prevent data loss should be one of the issues handled by human resources management, and employees should be careful about ğı cyber security insan, which is of great importance for data loss prevention (Göçoğlu, 2018).
Assuming that Social shares are thought to be indicative of people's ideas; to see how a personality and point of view with self-confidence that is supported by sports is reflected in self-control, this study aims to compare students in different departments and in the School of Physical Education and Sports. METHODS
This study which encompasses universities in Istanbul employed a descriptive and simple random sampling technique. 600 students (300 from different departments and 300 from the Department of Physical Education and Sports) within the 21 ± 25 age group conducted a questionnaire that borders on questions about employment in social media prepared by Merve YILMAZ in her thesis under the supervision of Asuman KUTLU. The findings are grouped according to the gender of participants (F = 121, M = 179), BESB (K = 130, E = 170); marital status - the FBI (Married = 22, 7.3%; Single = 278, 92.7%), BESB (Married = 18, 6.0%, Single = 282, 94.0%); working status - the FBI (Yes = 83, 27.7%; No = 217, 72.3%), BESB (Yes = 100, 33.3%; No = 200, 66.7%) (Table 1). The questionnaire was distributed to the Faculty of Business and Management Sciences, Faculty of Engineering and Architecture, Health Sciences, Social Sciences, Faculty of Science and Faculty of Letters as students of different departments group.
The data obtained in the study were evaluated by descriptive statistics, mean, standard deviation, frequency, percent and chi-square analysis for the relationship between categorical variables with 95% confidence interval and 5% significance level, with the help of SPSS for Windows 21.0 program.
In the responses, FB (226 people, 75.3%) and BESB (228 people, 76.0%) were found to spend 6-10 h a day on social media. Participants stated that they used facebook, twitter and instagram actively; FB (107 people, 35.7%), BESB (188 people, 62.7%) with X2 = 72.578, p = 0.000 < 0.05 significant difference was found. It was seen that participants used „intensively‟ to search for social networks; FB (253 people, 84.3%), BESB (252 people, 84.0%). Participants stated that they use social media for 1. Personal Branding, 2. CV dissemination, 3. Professional Networking, 4. Job Search - Application, 5. Contacting Recruiters, 6. Examining potential employers' pages, 7. Checking comments of others about potential employers, 8. Gathering information about company employees, and 9. Contacting employees of the company. All of the above FB (182 persons, 60.7%), BESB, (243 persons, 81.0%) X2 = 31.399; p =0.000 <0.05 significant differences were found.
“Do you think the human resources departments of companies should use social media to obtain ideas about the applicants in the recruitment process?” The above

322 Educ. Res. Rev.
Table 1. Participants' variables related to social media usage.
Different departments
Physical education and
sports
p
N % n %
How much time do you spend on social media during the day?
1-3 h 9 3.0 7 2.7
X2
=3.032
p= 0.387
3-6 h 46 15.3 54 18.0
6-10 h 226 75.3 228 76.0
10-20 h 19 6.3 11 3.7
What social media site do you actively use?
Facebok-Twitter 105 35.0 43 14.3
X2
=72.578
p=0.000
Twitter-Instagram 41 13.7 48 16.0
Facebook-Twitter-Instagram 107 35.7 188 62.7
Linkedin, Kariyer.net, Xing 43 14.3 10 3.3
Others(Secretcv.com,Yenibiris.com,Eleman.Net
Careerjet.com, Cvyolla.com, Unisbul.com
Jobnak.com, Kariyerzirvesi.com)
4 1.3 11 3.7
How often do you use social networks to search for jobs?
Sometimes 0 0.0 5 1.7 X
2 =5.180
p= 0.075 Frequently 47 15.7 43 14.3
Intensively 253 84.3 252 84.0
For which professional life activities below do you use social media most?
1-2 0 0.0 0 0.0
X2
=31.399
p= 0.000
1-2-3 0 0.0 0 0.0
1-2-3-4 0 0.0 0 0.0
1-2-3-4-5 0 0.0 0 0.0
1-2-3-4-5-6 25 8.3 17 5.7
1-2-3-4-5-6-7 93 31.0 40 13.3
All 182 60.7 243 81.0
p<0.05. 1. Personal Branding, 2. CV dissemination, 3. Professional Networking, 4. Job Search - Application, 5. Contacting Recruiters, 6. Examining potential employers' pages, 7. Checking comments of others about potential employers, 8. Gathering information about company employees, 9. Contacting company employers.
question was answered as o by all participants, with the highest average (F , x = 1.7267; E , x = 1.8133); whereas, the other 13 questions were answered "Yes" by all participants.
Students in Physical Education and Sports Department answered the questions, Do you use social media to search for jobs? with an average of (x =1.4300), and “Do you find social media useful in job search?” with an average of (x = 1.400), as Yes , more than the students from other departments.
“Do you think the human resources departments of companies should use social media to obtain ideas about the applicants in the recruitment process?” With F (218 people, 72.7%); E (244 people, 81.3%), there was a significant difference in favor of BESB observed due to the answers "No" to the above question; X2 =6.362 p=0.012<0.05. As regards the question “'Do you use social media for the job search?”, with F (171 people, 57.0%); E , (272 people, 90.7%), there was a significant difference in favor of BESB observed for the above question; X2 = 88.002 p = 0.000; <0.05. “Do you find social media useful in job search?” With F (180 people, 60.0%); BESB (287 people, 95.7%), there was a significant difference in favor of BESB observed for the above question; X2 = 110.59 p= 0.000 <0.05. In all the other questions, the entire participants stated that they had a number of restrictions on
social media during the job application period, giving the answer "Yes" at 80% level (Table 2).
DISCUSSION
While employing job vacancies through resume or CV through social networks, employers' human resources (HR) have led to self-regulation in social networks, thinking that they would recognize candidates differently. Therefore, the candidates explicitly stated that they had to make changes or restrictions on their social profiles and accounts. They stated that while they had published their photographs and videos in which they were tagged and when sharing with political groups, friends or ideas, they had made re-arrangements in their content with the idea that they would be opposite or contradictory to the employer institution's company profiles and policies, and they had opened accounts with different or shortened names.
In our study, it was found that participants spent 6-10 h on social media per day - FB (226 people, 75.3%); BESB

Menevşe 323
Table 2. The average of the participants on the impact of social media on employment.
Variable
Different departments
n=300
Physical education and sports
n= 300
Avg. SS Avg. SS
1. Do you use social media to search for jobs? 1.0933 0.49590 1.4300 0.29139
2. Do you find social media useful in job search? 1.0433 0.49072 1.4000 0.20395
3. Do you think the human resources departments of companies should use social media to get ideas about the applicants in the recruitment process?
1.7267 0.44642 1.8133 0.39029
4. Do you also have social media accounts for professional life? 1.0433 0.20395 1.1100 0.31341
5. The Internet is important for my image, my business life and therefore my future. Therefore, I am trying to draw a professional image online.
1.2733 0.44642 1.2300 0.42154
6. I try to keep my social media accounts as secret as possible. I'm careful not to leave my profile open to searches.
1.1867 0.39029 1.1467 0.35436
7. Companies are investigating social media accounts in the recruitment process and therefore I have to go through restrictions on my shares.
1.1400 0.34757 1.1867 0.39029
8. There were cases when the company's human resources officer contacted me through my social media account.
1.2900 0.45452 1.2767 0.44810
9. There were times when I had to rearrange my social media accounts in the job application process.
1.1833 0.38759 1.1167 0.32156
10. As companies review social media accounts, I have to restrict the publication of photos and videos that I have been tagged by others.
1.0700
0.25557
1.0833
0.27685
11. There were times when I had to close my social media accounts during the job applications.
1.1767 0.38202 1.1367 0.34407
12. I open a new social media account during the job application process.
1.0800 0.27175 1.1700 0.37626
13. I refrain from sharing the political group, page, person and ideas that are of interest to me through my social media accounts with the idea that it is against company policy.
1.0800
0.27175
1.1100
0.31341
14. I use accounts with different and shortened names in my social media accounts.
1.0733 0.26112 1.0800 0.27175
(228 people, 76.0%). It was found that FB (253 people, 84.3%); BESB (252 people, 84.0%) of the participants use social networks "intensively" for job search.
“Do you think the human resources departments of companies should use social media to get ideas about the applicants in the recruitment process?” he above question was answered as o by all participants, with the highest average (F , x = 1.7267; E , x = 1.8133). The other 13 questions were answered "Yes" by all participants.
For “Do you use social media for the job search?”, E (x =1.4300)(x = 1.400), E has answered Yes more than F . Regarding “Do you think the human resources departments of companies should use social media to get ideas about the applicants in the recruitment process?”;
with FB (218 people, 72.7%); BESB (244 people, 81.3%), there was a significant difference in favor of BESB observed due to the answers “ o” to the above question; X
2 = 6.362 p=0.012<0.05. On “Do you use social media for the job search?” with
FB (171 people, 57.0%); BESB (272 people, 90.7%), there was a significant difference in favor of BESB observed to the above question; X
2 = 88.002 p=0.000; <0.05.
“Do you find social media useful in job search?”; with FB (180 people, 60.0%); BESB (287 people, 95.7%), there was a significant difference in favor of BESB observed for the above question; X
2 = 110.59 p= 0.000<0.05. In all the other
questions, all the participants stated that they had a number of restrictions on social media during the job application period, giving the answer "Yes" at 80% level.
324 Educ. Res. Rev.
Altunbaş and Kul (2015) stated that the most widely used social media tool was with Facebook (82.6%); 75.2% of students use social media continuously; 57.8% of the respondents had false addresses; with lack of confidence (to control the other party in mutual relations), to hide their true identity, to be concerned with socialization (in order to become the person they wanted but could not be in real life), and also to think about not being able to freely share their ideas as prominent factors for using false accounts. According to another study conducted by Kocaeli University lecturers, 31% of students have multiple accounts in social media ( aştürk-Akca et al., 2015).
Vardarlier (2014) stated that human resources specialists should assess and analyse the employees or jobseekers in terms of the use of social media for professional carrier or job seeking. Tüfekçi (2015) found that social media posts of the candidates serve as a reason for the exclusion of candidates rather than a reason for the hiring of a candidate during the recruitment process. It was detected that professional recruiters are negatively affected by inappropriate content posted on social media of candidates; however, they are distant to posts that are considered as positive. In their study, Yücel and Bal (2018) demonstrated that using social media for recruitment process enables recruiters to reach a larger pool of candidates in short time; nonetheless, they are unable to evaluate the quality of the candidates or whether they have access to right candidates. Yılmaz (2018) reached the conclusion that employees had to re-arrange their social media accounts during the job application process, to restrict the publication of photos and videos they are tagged by others, to avoid sharing the political groups, page, people and ideas that draws their attention in social media accounts with the idea that it would be contrary to company policies, and those working in the public sector are regulating their social network accounts in the same and similar ways as those in the private sector. The results of this study are similar to those of Yılmaz (2018) which showed that they had to undergo self-regulation by ensuring regulations and restrictions in their accounts due to their examination of social networks.
Different approaches have emerged in recruitment processes in the social media. To address some of these, görüş iş artificial intelligence değin „has begun to be used in business interviews in a very useful way. A few minutes of interview video, artificial intelligence applications from the candidate's word choices to facial movements, constitute a large data set for the evaluators. Artificial intelligence based applications such as HireVue and Talent Pitch can determine the individual who is suitable for the job by comparing the talents of the candidates and success rates at the same job after examining the past success records of the person to be hired (Malhotra, 2017). According to many social media
experts, the increasing rate of social media utilization in the recruitment process in our country shows that the clout score which means art activity noted in social media will gain more importance in the long term. According to “Yenibiris.com” Board Member Kamil Özörnek, in the upcoming period, the clout score is stated to be a more sought-after criterion in recruitment (Büyükköşdere, 2014). In some published job advertisements, having a certain level of clout score is among the qualifications sought in candidates. For example, in 2013, a company called “Salesforce.com” operating in the United States of America has one of the features it will look for in the job posting for its "Community Manager" position (Horriga, 2013).
The most widely used social networking platforms are Facebook, Youtube, Myspace, Twitter, LinkedIn and Google + paylaş. According to the results of Jobvite's research, it was stated that LinkedIn came first as the most used social network in social media. This social network, which brings together professionals from business life, is used in 2010 by 78% of companies, 87% in 2011 and 93% in 2012. The most used social network, Facebook, was used for recruitment in 2010 for 55%, whereas in 2012 it was 66%. In Twitter, this rate was 54% in
2012. These three social media tools are reportedly followed by personal blogs with 21%, Google with 20% and YouTube with 19% (Koçer and Öksüz, 2015).
According to a survey conducted by Secretcv's 235 firms and 15,800 candidates, employers are searching for personal pages of candidates on social networks in order to get to know the candidate to be recruited (social-media-psychological-effect.html). According to the Bullhorn Research Company, 98% of companies in the USA check social media sites during their personnel selection processes. According to this research data, Twitter is the third place with 49% for personnel search, while Facebook is second with 51%. LinkedIn at the top of this ranking is stated to be the leader with 98% (Cülcüloğlu, 2013). Most frequently used social networks in the recruitment process were LinkedIn with 70.4%, other networks (career sites, instagram, cv bank) with 21.5%, and Facebook with 4.3%. In addition, 69.4% of the employers stated that they would do social media research and 13% of them planned to do social media research. Businesses use the social media to create a candidate pool and communicate with the appropriate candidates. They also indicated that they chose the right candidate for the properties of job and for the company via the interview (Nizamoğlu, 2018). Erdal and Aydıntan (2018) stated that 94.21% of the
participants who use social media networks in their recruitment and selection processes prefer LinkedIn, 33.88% of them prefer Facebook, 17.36% of them prefer Instagram and 15.70% of them prefer Twitter (Table 3).
Therefore, thanks to the digital footprints they leave on the internet, the candidates are more easily identified and

Menevşe 325
Table 3. Comparison of participants‟ variables related to the effect of social media on employment.
Variable
Different departments
Physical education and sports pdf= 1
n % n %
1. Do you use social media to search for jobs? Yes 171 57.0 272 90.7 X
2 =88.002
p= 0.000 No 129 43.0 28 9.3
2. Do you find social media useful in job search? Yes 180 60.0 287 95.7 X
2 =110.59
p= 0.000 No 120 40.0 13 4.3
3. Do you think the human resources departments of companies should use social media to get ideas about the applicants in the recruitment process?
Yes 82 27.3 56 18.7 X2
=6.362
p=0.012 No 218 72.7 244 81.3
4. Do you also have social media accounts for professional life?
Yes 287 95.7 267 89.0 X2
=9.418
p=0.002 No 13 4.3 33 11.0
5. The Internet is important for my image, my business life and therefore my future. Therefore, I am trying to draw a professional image online.
Yes 218 72.7 231 77.0 X2
=1.496
p=0.221 No 82 27.3 69 23.0
6. I try to keep my social media accounts as secret as possible. I'm careful not to leave my profile open to searches.
Yes 244 81.3 256 85.3 X2
=1.728
p=0.189 No 56 18.7 44 14.7
7. Companies are making reviews of social media accounts in the recruitment process and therefore I have to restrict my shares.
Yes 258 86.0 244 81.3 X2
=2.390
p=0.122 No 42 14.0 56 18.7
8. There were cases when the company's human resources officer of a company that I have applied, contacted me through my social media account.
Yes 213 71.0 217 72.3 X2
=.131
p=0.717 No 87 29.0 83 27.7
9. There were times when I had to rearrange my social media accounts in the job application process.
Yes 245 81.7 265 88.3 X2
=5.229
p=0.022 No 55 18.3 35 11.7
10. As companies review social media accounts, I have to restrict the publication of photos and videos that I have been tagged by others.
Yes 279 93.0 275 91.7 X2
=.377
p=0.539 No 21 7.0 25 8.3
11. There were times when I had to close my social media accounts during the job applications.
Yes 247 82.3 259 86.3 X2
=1.816
p=0.178 No 53 17.7 41 13.7
12. I open a new social media account during the job application process.
Yes 276 92.0 249 83.0 X2
=11.109
p=0.001 No 24 8.0 51 17.0
13. I refrain from sharing the political group, page, person and ideas that are of interest to me through my social media accounts with the idea that it is against company policy.
Yes 276 92.0 267 89.0 X
2 =1.570
p=0.210 No 24 8.0 33 11.0
14. I use accounts with different and shortened names in my social media accounts.
Yes 278 92.7 276 92.0 X2
=.094
p=0.759 No 22 7.3 24 8.0
p<0.05.
are more likely to encounter content suitable for their demographic characteristics, tastes, preferences and interests. Erdal and Aydıntan (2018) stated that with this opportunity, organizations can reach their target audience
more easily through sponsored content, targeted job posts or advertisements and increase the quality and quantity of the candidate pools. According to the survey conducted by Absolventa, 81% of jobseekers are looking

326 Educ. Res. Rev. for work via laptops and desktop computers, and 43% of them on smart phones (Absolventa, 2014).
In Menevşe and Ablay (2018) study conducted with sports executives and sports media employees, sports executives answered the statement “ he state sufficiently uses media tools to encourage women to sport.” as I do not agree with the highest average value of (E; x = 3,68). Menevşe (2018) stated that the tendency of the private university to exercise in exercise stages was 12.0%, continuity 22.7%, tendency to move in the state universities 24.7% and continuity 37.3% in physical activity. It seems that 6 to 10 h a day, social media compulsion or addiction may indicate that young people's job searches or digital socialization in these networks shadow socialization in physical activities, and even prevents them.
As a result, the students studying in the departments of Physical Education and Sports stated that they used social media more for job search, and found that social media were more useful in terms of job search than other departments. It has been stated that all participants have been searching for jobs in social media for 6-10 h every day, and due to the possibility of HR officers to examine their social networks in recruitment processes, they re-arranged their accounts and have applied some restrictions. Therefore, it is thought that the candidates may exhibit a personality very different from the real-life personalities in social media networks and may even lead to the shares that are appropriate for the characteristics of the institution.
As a suggestion, during job search in social media, the self-regulation of human resources abstracts employees from their real personalities. Religion, language, race, thought, ideas and shares should be freely available in social networks. The quality, quality and efficiency of the work to be evaluated by thought and opinion discrimination will prevent occupational and field knowledge in the recruitment process. It is thought that the freedom of thought and ideas will increase the quality with critical approaches. In addition, human resources should be given more responsibility for the recruitment processes, along with monitoring and training in the privacy policy. The training of employees to prevent loss of data due to the increasing rate of social media utilization is thus recommended. Also, Artificial Intelligence approaches should make informative orientations in the new approaches which mean activity note in social media.
CONFLICT OF INTERESTS
The author has not declared any conflict of interests.
REFERENCES
Absolventa (2014). Generation Mobile 2014.
https://www.markenfrische.de/2016-04/mobiles-recruiting-personaldienstleistung-zeitarbeit/large1407330942/
Altunbaş F, Kul M (2015). he Measurement of ocial Media Using
Habits of Undergraduate Students: A Research on Van Yüzüncü Yıl University. Academic Sight, International Refereed Online Journal of Social Sciences, September – October 2015.
aştürk AE, Sayimer İ, Ergül (2015). he ocial Media Using Habits of Middle School Students and Cyber-Mobbing: A Research in Ankara, Global Media Journal 5(10):71-86.
üyükköşdere Ş (2014). Klout Less Than 55. Date of access: 03.04.2019 http://www.aksam.com.tr/yasam/kloutun-55ten-azsa-c2ise-hic-basvurma/haber-277869
Clark K (2014). You Are What You Facebook: Social Media Profiles Can Be Good Resources For Selecting Employees-With A Catch SIOP- Society for Industrial and Organizational Psychology. http://www.siop.org/article_view.aspx?article=1242. Date of access: 03.04.2019
Cülcüloğlu E (2013). A ew Era for Human Resources. Turkish Informatics Association Journal of Informatics Year 41:153-19.
Erdal M, Aydintan B (2018). Personnel Sourcing And Selection In Social Media: A Research Regarding Generations - Journal of Business Research-Turkish DOI: 10.20491/isarder.393
Erhan E (2018). The Role of Demographic Characteristics of Human Resources Managers in Using Social Media in Recruitment, Istanbul Commerce University, Institute of Social Sciences, Human Resources Management Department of Human Resources Management, Istanbul, Turkey.
Göçoğlu, V (2018). "Public Policy Analysis in the Evaluation of Turkey's Cyber Security Policy Framework", PhD Thesis, Hacettepe University, Ankara.
Horriga S (2013). Is Social Media Clout a New Job Criteria? Scores usher in era of „quantified employee‟. Date of access: 03.04.2019, https://blog.shrm.org/trends/is-social-media-clout-a-new-job-criteria
Koçer S, Öksüz G (2015). Elektronik İşe Alma ürecinde Özel İstihdam ürolarının Rolü: Adecco ürkiye ve Kariyer. et İncelemesi. Uluslararası Yönetim İktisat ve İşletme Dergisi 11(24):181-203.
Malhotra M (2017). “Digital ransformation in HR”, International Journal of Interdisciplinary and Multidisciplinary Studies 4(3):536-544.
Menevse A (2018). The Effect of Physical Education and Sports Departments on Behavioral Changes towards Exercising. Educational Research and Reviews 13(13):518-525., July 10, 2018 DOI: 10.5897/ERR2018.3499 Article Number: F9D1FAA57638 ISSN: 1990-3839 Copyright ©
Menevşe A, Ablay ME (2019). An Investigation of the Attitudes Of Sports Media Towards Women's Sports. Universal Journal of Educational Research 7(1):87-94, DOI: 10.13189/ujer.2019.070112
izamoğlu Ö (2018). Pamukkale University Institute of ocial Sciences Non-Thesis Master's Program Project Department of Business Administration, Management and Organization Program, January, Denizli.
Tüfekçi ÖF (2015). The Use of Social Media In the Recruitment Process And A Research On Its Role In This Process. Master‟s hesis, Istanbul University, Institute of Social Sciences, Department of Business Administration, Subdepartment of Human Resources, Istanbul.
Vardarlier P (2014). The Role of Social Media on Human Resources Management. Doctoral Thesis, Beykent University, Institute of Social Sciences, Department of Business Management, Subdepartment of Business Management, Istanbul.
Yilmaz M (2018). The Use of Social Media in Recruitment and its Impact on Candidates. Master's Thesis, Institute of Social Sciences Department of Media and Communications Subdepartment of Media and Communication Systems, Istanbul.
Yücel ÇP, Bal Y (2018). The use of Social Networking Sites As An E-Recruitment Tool The Journal of International Social Research 11(5):1307-9581.

International Journal of English and Literature
OPEN ACCESS
Journal of
African Studies and Development
Philosophical Papers and Review
Journal of Languages and Culture
Journal of
Music and Dance
www.academicjournals.org
International Journal of
Library and Information
Science
Journal of Media and
Communication Studies
Journal of
Fine and Studio Art
OPEN ACCESS OPEN ACCESS
OPEN ACCESSOPEN ACCESSOPEN ACCESS
OPEN ACCESS OPEN ACCESS OPEN ACCESS
International Journal of
Educational Administration and
Policy Studies