22. Dryland Systems - Millennium Ecosystem Assessment
40
Chapter 22 Dryland Systems Coordinating Lead Authors: Uriel Safriel, Zafar Adeel Lead Authors: David Niemeijer, Juan Puigdefabregas, Robin White, Rattan Lal, Mark Winslow, Juliane Ziedler, Stephen Prince, Emma Archer, Caroline King Contributing Authors: Barry Shapiro, Konrad Wessels, Thomas Nielsen, Boris Portnov, Inbal Reshef, Jillian Thonell, Esther Lachman, Douglas McNab Review Editors: Mohammed El-Kassas, Exequiel Ezcurra Main Messages ............................................. 625 22.1 Introduction ........................................... 625 22.1.1 Definition and Subtypes of Dryland Systems 22.1.2 Ecosystems in Drylands 22.2 Ecosystem Services ..................................... 626 22.2.1 Supporting Services 22.2.2 Regulating Services 22.2.3 Provisioning Services 22.2.4 Cultural Services 22.2.5 Biodiversity and the Provision of Dryland Services 22.2.6 Integration: Services, Biodiversity, Livelihoods, and Aridity 22.3 Condition and Trends in Dryland Systems .................... 636 22.3.1 Land Degradation 22.3.2 Condition and Trends of Rangelands 22.3.3 Condition and Trends of Cultivated Drylands 22.3.4 Condition and Trends of Alternative Livelihoods 22.3.5 Condition and Trends of Dryland Biodiversity 22.4 Drivers of Change ...................................... 645 22.4.1 Conceptual Framework of Dryland Drivers: The Desertification Paradigm and Its Counterpart 22.4.2 Socioeconomic and Policy Drivers 22.4.3 Biophysical Indirect and Direct Drivers 22.5 Trade-offs, Synergies, and Interventions ...................... 651 22.5.1 Traditional Dryland Livelihoods 22.5.2 Drylands and Other Systems 22.5.3 Climate Change and Carbon Sequestration 22.6 Human Well-being in Dryland Systems ....................... 653 22.6.1 Indicators of Human Well-being in Drylands 22.6.2 Human Well-being Components in Drylands 22.6.3 The Relative Dependence of Human Well-being on Ecosystems and Socioeconomic Drivers 22.6.4 Responses to Improve Human Well-being in Drylands 22.6.5 Services, Degradation, and Human Well-being REFERENCES .............................................. 656 623
Transcript of 22. Dryland Systems - Millennium Ecosystem Assessment
Chapter 22
Dryland Systems
Coordinating Lead Authors: Uriel Safriel, Zafar AdeelLead Authors: David Niemeijer, Juan Puigdefabregas, Robin White, Rattan Lal, Mark Winslow, Juliane
Ziedler, Stephen Prince, Emma Archer, Caroline KingContributing Authors: Barry Shapiro, Konrad Wessels, Thomas Nielsen, Boris Portnov, Inbal Reshef, Jillian
Thonell, Esther Lachman, Douglas McNabReview Editors: Mohammed El-Kassas, Exequiel Ezcurra
Main Messages . . . . . . . . . . . . . . . . . . . . . . . . . . . . . . . . . . . . . . . . . . . . . 625
22.1 Introduction . . . . . . . . . . . . . . . . . . . . . . . . . . . . . . . . . . . . . . . . . . . 62522.1.1 Definition and Subtypes of Dryland Systems22.1.2 Ecosystems in Drylands
22.2 Ecosystem Services . . . . . . . . . . . . . . . . . . . . . . . . . . . . . . . . . . . . . 62622.2.1 Supporting Services22.2.2 Regulating Services22.2.3 Provisioning Services22.2.4 Cultural Services22.2.5 Biodiversity and the Provision of Dryland Services22.2.6 Integration: Services, Biodiversity, Livelihoods, and Aridity
22.3 Condition and Trends in Dryland Systems . . . . . . . . . . . . . . . . . . . . 63622.3.1 Land Degradation22.3.2 Condition and Trends of Rangelands22.3.3 Condition and Trends of Cultivated Drylands22.3.4 Condition and Trends of Alternative Livelihoods22.3.5 Condition and Trends of Dryland Biodiversity
22.4 Drivers of Change . . . . . . . . . . . . . . . . . . . . . . . . . . . . . . . . . . . . . . 64522.4.1 Conceptual Framework of Dryland Drivers: The Desertification Paradigm
and Its Counterpart22.4.2 Socioeconomic and Policy Drivers22.4.3 Biophysical Indirect and Direct Drivers
22.5 Trade-offs, Synergies, and Interventions . . . . . . . . . . . . . . . . . . . . . . 65122.5.1 Traditional Dryland Livelihoods22.5.2 Drylands and Other Systems22.5.3 Climate Change and Carbon Sequestration
22.6 Human Well-being in Dryland Systems . . . . . . . . . . . . . . . . . . . . . . . 65322.6.1 Indicators of Human Well-being in Drylands22.6.2 Human Well-being Components in Drylands22.6.3 The Relative Dependence of Human Well-being on Ecosystems and
Socioeconomic Drivers22.6.4 Responses to Improve Human Well-being in Drylands22.6.5 Services, Degradation, and Human Well-being
REFERENCES . . . . . . . . . . . . . . . . . . . . . . . . . . . . . . . . . . . . . . . . . . . . . . 656
PAGE 623
623
................. 11432$ CH22 10-11-05 15:04:45 PS
624 Ecosystems and Human Well-being: Current State and Trends
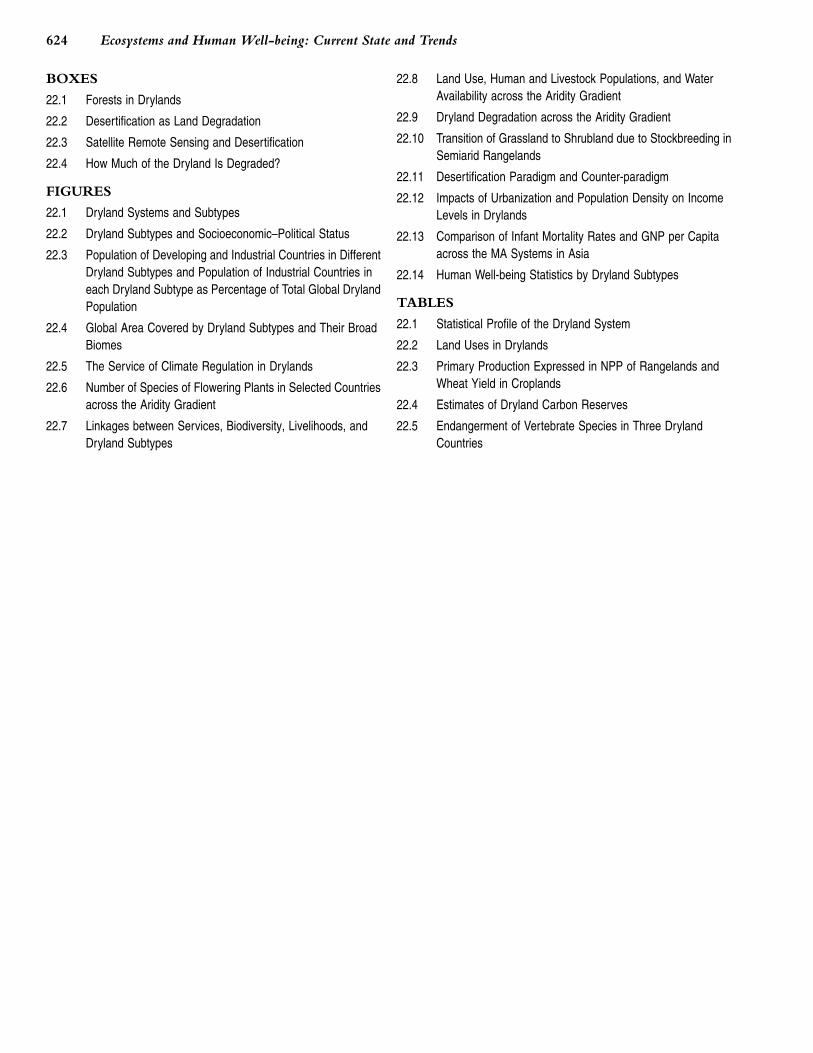
BOXES
22.1 Forests in Drylands
22.2 Desertification as Land Degradation
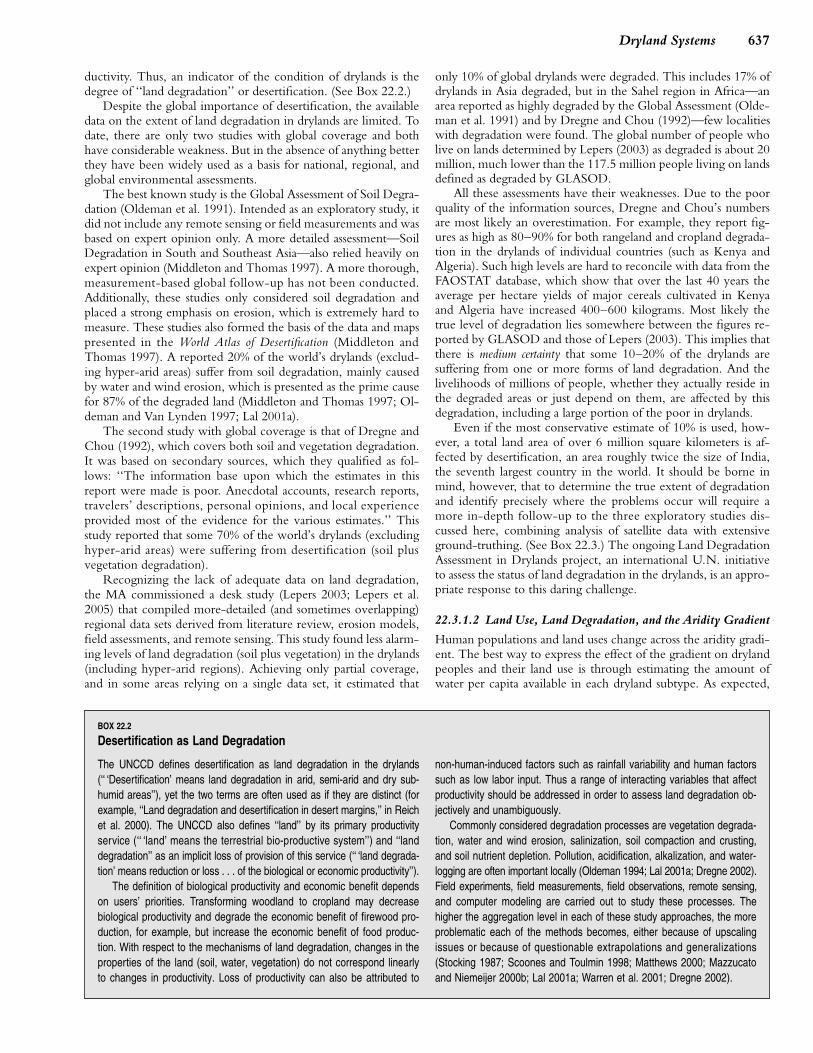
22.3 Satellite Remote Sensing and Desertification
22.4 How Much of the Dryland Is Degraded?
FIGURES
22.1 Dryland Systems and Subtypes
22.2 Dryland Subtypes and Socioeconomic–Political Status
22.3 Population of Developing and Industrial Countries in DifferentDryland Subtypes and Population of Industrial Countries ineach Dryland Subtype as Percentage of Total Global DrylandPopulation
22.4 Global Area Covered by Dryland Subtypes and Their BroadBiomes
22.5 The Service of Climate Regulation in Drylands
22.6 Number of Species of Flowering Plants in Selected Countriesacross the Aridity Gradient
22.7 Linkages between Services, Biodiversity, Livelihoods, andDryland Subtypes
PAGE 624
22.8 Land Use, Human and Livestock Populations, and WaterAvailability across the Aridity Gradient
22.9 Dryland Degradation across the Aridity Gradient
22.10 Transition of Grassland to Shrubland due to Stockbreeding inSemiarid Rangelands
22.11 Desertification Paradigm and Counter-paradigm
22.12 Impacts of Urbanization and Population Density on IncomeLevels in Drylands
22.13 Comparison of Infant Mortality Rates and GNP per Capitaacross the MA Systems in Asia
22.14 Human Well-being Statistics by Dryland Subtypes
TABLES
22.1 Statistical Profile of the Dryland System
22.2 Land Uses in Drylands
22.3 Primary Production Expressed in NPP of Rangelands andWheat Yield in Croplands
22.4 Estimates of Dryland Carbon Reserves
22.5 Endangerment of Vertebrate Species in Three DrylandCountries
................. 11432$ CH22 10-11-05 15:04:45 PS
625Dryland Systems
Main Messages
Drylands cover about 41% of Earth’s land surface and are inhabited bymore than 2 billion people (about one third of world population). Drylandsare limited by soil moisture, the result of low rainfall and high evaporation, andshow a gradient of increasing primary productivity, ranging from hyper-arid,arid, and semiarid to dry subhumid areas. Deserts, grasslands, and woodlandsare the natural expression of this gradient.
Dryland populations on average lag far behind the rest of the world onhuman well-being and development indicators (high certainty). The currentsocioeconomic condition of dryland peoples, about 90% of whom are in devel-oping countries, lags significantly behind that of people in other areas.
Existing water shortages in drylands are projected to increase over timedue to population increase, land cover change, and global climatechange. From 1960 to 2000, global use of fresh water (drylands included)expanded at a mean rate of 25% per decade. The availability in drylands isprojected to decline further from the current average of 1,300 cubic meters perperson per year (in 2000), which is already below the threshold of 2,000 cubicmeters required for minimum human well-being and sustainable development.This increased water stress will lead to reduced productivity of croplands andavailability of fresh water, resulting in further adverse impacts on human well-being in drylands. There is a high degree of certainty that global climatechange, land use developments, and land cover changes will lead to an accel-erated decline in water availability and biological production in drylands.
Transformation of rangelands and other silvipastoral systems to culti-vated croplands is leading to significant, persistent decrease in overalldryland plant productivity. Extreme reduction of rangeland vegetation coverthrough grazing of forage and collection of fuelwood exposes the soil to ero-sion. Transformation of rangelands to cultivated systems (approximately 15%of dryland grasslands, the most valuable dryland range, were converted be-tween 1950 and 2000), in combination with inappropriate dryland irrigation andcultivation practices has led to soil salinization and erosion. These processesreduce the provision of water-related services, which affects the provision ofmany other significant dryland services and goods, culminating in persistentreduction of primary production.
Among dryland subtypes, ecosystems and populations of semiarid areasare the most vulnerable to loss of ecosystem services (medium certainty).Population density within drylands decreases with increasing aridity from 10persons per square kilometer in the hyper-arid drylands to 71 persons in drysubhumid drylands. Conversely, the sensitivity of dryland ecosystems tohuman impacts that contribute to land degradation increases with increasingaridity. Therefore, the risk of land degradation is greatest in the median sectionof the aridity gradient (mostly the semiarid drylands), where both sensitivity todegradation and population pressure (expressed by population density) are ofintermediate values.
It is thought that some 10–20% of the world’s drylands suffer from oneor more forms of land degradation (medium certainty). Despite the globalconcern aroused by desertification, the available data on the extent of landdegradation in drylands (also called desertification) are extremely limited. Inthe early 1990s, the Global Assessment of Soil Degradation, based on expertopinion, estimated that 20% of drylands (excluding hyper-arid areas) was af-fected by soil degradation. A recent MA commissioned desk study (Lepers2003) based on regional data sets (including hyper-arid drylands) derived fromliterature reviews, erosion models, field assessments and remote sensingfound much lower levels of land degradation in drylands. Coverage was notcomplete, but the main areas of degradation were estimated to cover 10% of
PAGE 625
global drylands. Most likely the true level of degradation lies somewhere be-tween the 10% and 20% figures. To identify precisely where the problemsoccur and the true extent of degradation will require a more in-depth follow-upto these exploratory studies.
Desertification, which by definition occurs only in drylands, causes ad-verse impacts on non-dryland ecosystems (high certainty). Desertificationhas both direct and indirect impacts on non-dryland ecosystems and peoples.For example, dust storms resulting from wind soil erosion, driven by degrada-tion of the dryland vegetation cover, may affect people and ecosystems else-where. Similarly, transport of sediments, pesticides, and nutrients from drylandagricultural activities affects coastal ecosystems. Droughts and loss of landproductivity are considered predominant factors in the migration of people fromdrylands to other areas (medium certainty).
Traditional and other current management practices contribute to thesustainable use of ecosystem services. Many existing practices help pre-vent desertification. These include enhanced and traditional water harvestingtechniques, water storage and conservation measures, reuse of safe andtreated wastewater for irrigation, afforestation for arresting soil erosion andimproving ground water recharge, conservation of agrobiodiversity through di-versification of crop patterns, and intensification of agriculture using technolo-gies that do not increase pressure on dryland services. Policies that involvelocal participation and community institutions, improve access to transport andmarket infrastructures, and enable land users to innovate are essential to thesuccess of these practices.
Alternative livelihoods have a lower impact on dryland ecosystem ser-vices. These livelihoods still depend on the condition of drylands services butrely less on vulnerable services and make use of the competitive advantagesdrylands can offer over other systems. They can include dryland aquaculture forproduction of high-value food and industrial compounds, controlled-environmentagriculture (such as greenhouses) that requires relatively little land, and tourism-related activities.
Depending on the level of aridity, dryland biodiversity is relatively rich,still relatively secure, and is critical for the provision of dryland services.Of 25 global ‘‘biodiversity hotspots’’ identified by Conservation International, 8are in drylands. The proportion of drylands designated as protected areas isclose to the global average, but the proportion of dryland threatened speciesis lower than average. At least 30% of the world’s cultivated plants originatedin drylands and have progenitors and relatives in these areas. A high speciesdiversity of large mammals in semiarid drylands supports cultural services(mainly tourism); a high functional diversity of invertebrate decomposers in ariddrylands supports nutrient cycling by processing most arid primary production;a high structural diversity of plant cover (including microphyte diversity of soilcrusts in arid and semiarid areas) contributes to rainfall water regulation andsoil conservation, hence to primary production and its generated diversity ofthe dryland wild and cultivated plants.
22.1 IntroductionThis chapter describes the current condition of dryland systemswith respect to the services they provide and the drivers that de-termine trends in their provision. Within the context of themounting global concern caused by land degradation in drylands(defined as desertification in the text of the United Nations Con-vention to Combat Desertification), the chapter assesses deserti-fication as a persistent reduction in the services provided bydryland ecosystems, leading to unsustainable use of the drylandsand their impaired development. The chapter also explores op-
................. 11432$ CH22 10-11-05 15:04:46 PS
626 Ecosystems and Human Well-being: Current State and Trends
tions for the sustainable use of drylands and points to human andsocietal responses that have succeeded or failed.
‘‘Desertification’’ means land degradation in arid, semiarid,and dry subhumid areas resulting from various factors, includingclimatic variations and human activities. Land degradation meansreduction of or loss in the biological or economic productivityand complexity of rain-fed cropland, irrigated cropland, range,pasture, forest, or woodlands resulting from land uses or fromprocesses arising from human activities and habitation patterns(UNCCD 1992). Though this definition excludes the hyper-ariddrylands, this chapter explores land degradation in all global dry-lands, including the hyper-arid areas.
22.1.1 Definition and Subtypes of Dryland Systems
Drylands are characterized by scarcity of water, which constrainstheir two major interlinked services—primary production andnutrient cycling. Over the long term, natural moisture inputs(that is, precipitation) are counterbalanced by moisture lossesthrough evaporation from surfaces and transpiration by plants(evapotranspiration). This potential water deficit affects both nat-ural and managed ecosystems, which constrains the production ofcrops, forage, and other plants and has great impacts on livestockand humans.
Drylands are not uniform, however. They differ in the degreeof water limitation they experience. Following the UNEP termi-nology, four dryland subtypes are recognized in this assessment—drysubhumid, semiarid, arid, and hyper-arid—based on an increasinglevel of aridity or moisture deficit. The level of aridity typical foreach of these subtypes is given by the ratio of its mean annualprecipitation to its mean annual evaporative demand, expressed aspotential evapotranspiration. The long-term mean of this ratio istermed the aridity index.
This chapter follows the World Atlas of Desertification (Middletonand Thomas 1997) and defines drylands as areas with an aridityindex value of less than 0.65. The UNCCD, although excludingthe hyper-arid dryland from its consideration, adopted the classi-fication presented in the World Atlas, which is based on a globalcoverage of mean annual precipitation and temperature data col-lected between 1951 and 1980. The temperature data, togetherwith the average number of daylight hours by month, were usedto obtain a global coverage of corrected Thornthwaite’s potentialevapotranspiration values (Middleton and Thomas 1997). Aridityindex values lower than 1 indicate an annual moisture deficit, andthe World Atlas drylands are defined as areas with AI � 0.65—thatis, areas in which annual mean potential evapotranspiration is atleast �1.5 greater than annual mean precipitation.
Using index values, the four dryland subtypes can be posi-tioned along a gradient of moisture deficit. Together, these covermore than 6 billion hectares, or 41.3% of Earth’s land surface.(See Table 22.1.) Though the classification of an area as a drylandsubtype is determined by its aridity index, which relates to themean values of precipitation, it is important to remember thatthese areas do experience large between-year variability in precip-itation.
Dryland subtypes can also be described in terms of their landuses: rangelands, croplands, and urban areas. (See Table 22.2.)Rangelands and croplands jointly account for 90% of drylandareas and are often interwoven, supporting an integrated agropast-oral livelihood.
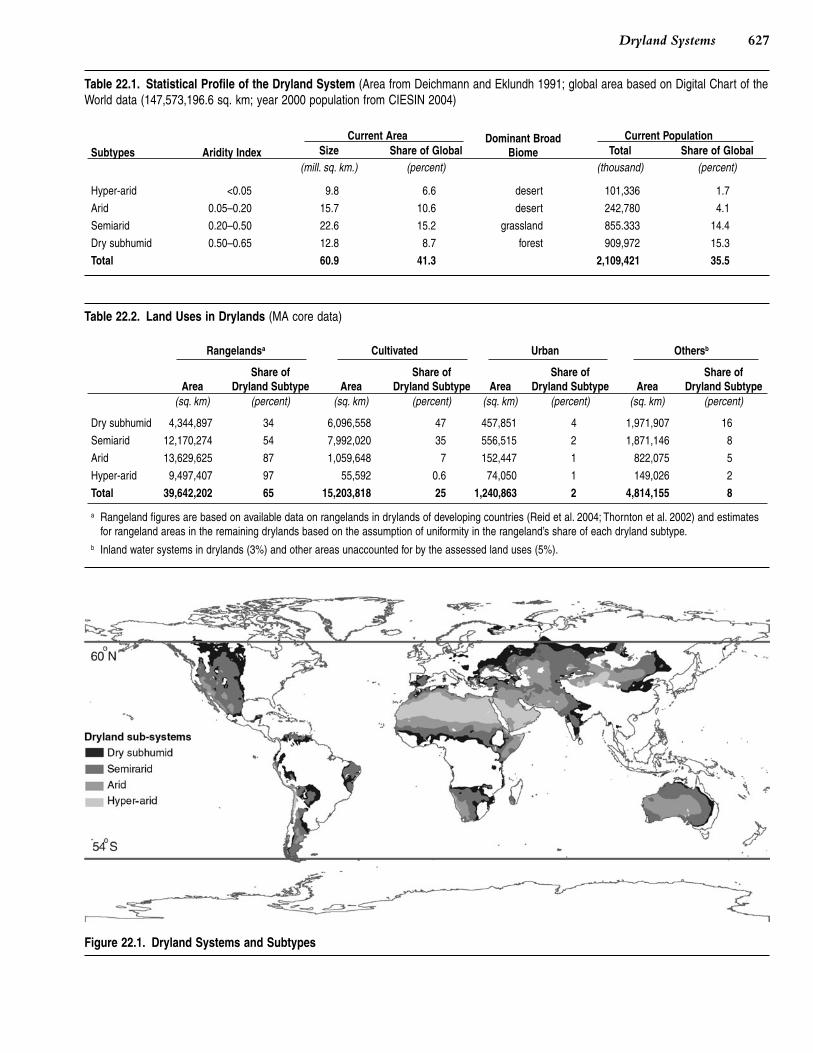
Drylands occur on all continents (between 63� N and 55� S;see Figure 22.1) and collectively comprise nearly half of the globallandmass. The rest of the land area is primarily taken up by polar
PAGE 626
and by forest and woodland systems (the latter overlapping withthe dryland system; see Box 22.1).
Drylands are not spread equally between poor and rich coun-tries: 72% of the global dryland area occurs within developingcountries and only 28% within industrial ones. Furthermore, theproportion of drylands occupied by developing countries in-creases with aridity, reaching almost 100% for the hyper-aridareas. (See Figure 22.2.) Consequently, the majority of drylandpeoples live in developing countries (that is, from 87% to 93%,depending on how the former Soviet Union countries are catego-rized), and only 7–15% reside in industrial countries. (See Figure22.3.)
22.1.2 Ecosystems in Drylands
Although there are only four dryland subtypes, there are a greaternumber of dryland ecosystems within the subtypes. These are ag-gregated into large, higher-order units known as biomes, whichare characterized by distinctive life forms and principal plant spe-cies (such as tundra, rainforest, grassland, or desert biomes).Whereas the MA dryland subtype boundaries are determined bytwo climatic factors (precipitation and evaporation), many envi-ronmental factors are used to delineate the boundaries of the dif-ferent biomes. Many different systems of biome classification arepresently used. Five well-recognized classification systems of ter-restrial biomes identify 12–17 biomes within drylands, dependingon the scheme adopted. (See Chapter 4.)
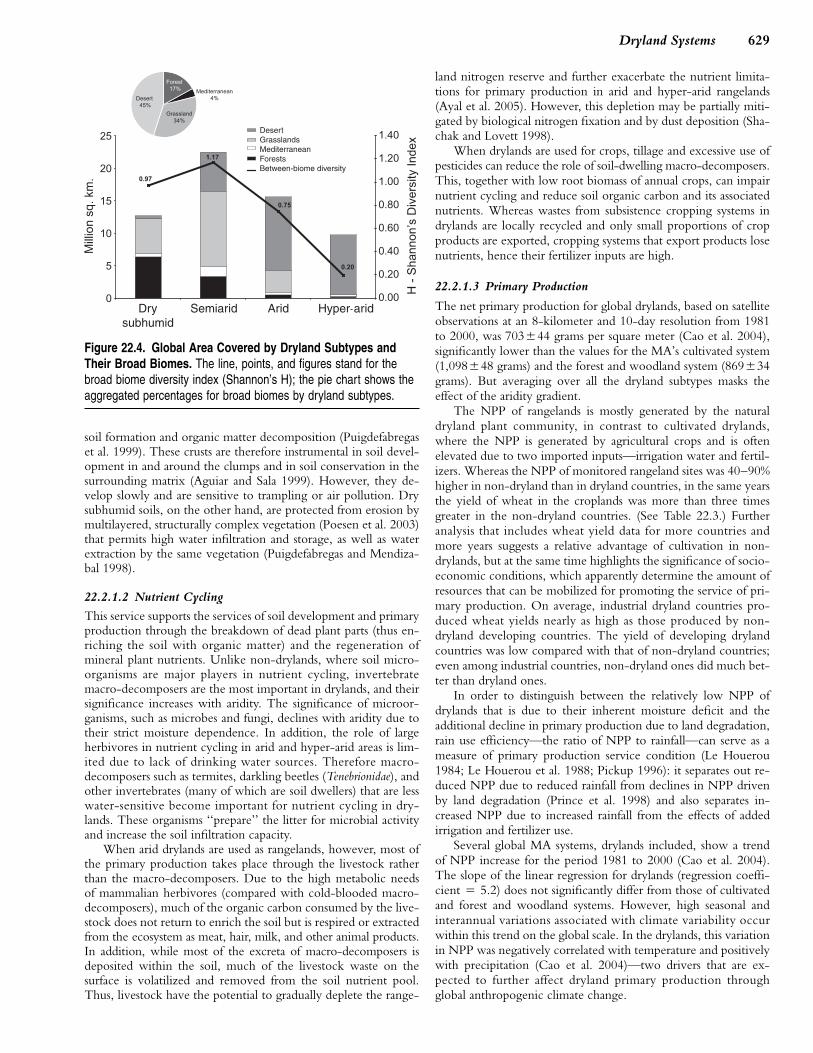
This chapter uses the classification of the World Wide Fundfor Nature that designates terrestrial biomes as ‘‘terrestrial eco-regions.’’ Each ecoregion delineates large land units containing adistinct assemblage of ecosystems, with boundaries approximatingthe extent of natural ecosystems prior to major land use change(Olson et al. 2001). These are further aggregated into four‘‘broad’’ dryland biomes—desert, grassland, Mediterranean(mainly scrubland), and forest (mainly woodland)—that succes-sively replace each other along the aridity gradient (see Figure22.4), with decreased aridity leading to an increase in plant cover,stature, and architectural complexity. However, there is no exactmatch between the four dryland subtypes and the four broad dry-land biomes, such that forest and grassland, for example, mayoccur at different areas of the same dryland subtype. The numberof broad biomes that may occur within a dryland subtype in-creases with reduced aridity, and the diversity of biomes peaks inthe semiarid subtype, which also covers the largest area of thevarious subtypes.
The presence of different biomes within each dryland subtypedemonstrates that biological species respond not only to overallmoisture deficit but also to other environmental variables, such assoils and geomorphological and landscape features. Furthermore,a greater degree of species richness and diversity of ecosystemservices is observed as aridity declines. Although dryland servicesare provided by the biomes’ ecosystems, the MA opted to reporton ecosystems, or simply ‘‘systems,’’ unified primarily by theirrange of aridity. This approach is justified for two reasons. First,it bypasses the many inherent differences in biome classificationsystems. Second, it better reflects current trends, as many drylandecosystems have been and continue to be transformed into moresimplified, cultivated ecosystems whose functioning is over-whelmingly dominated by the moisture deficit.
22.2 Ecosystem ServicesThe MA categorized ecosystem services into supporting, provi-sioning, regulating, and cultural services. (See Chapter 1.) The
................. 11432$ CH22 10-11-05 15:04:47 PS
627Dryland Systems
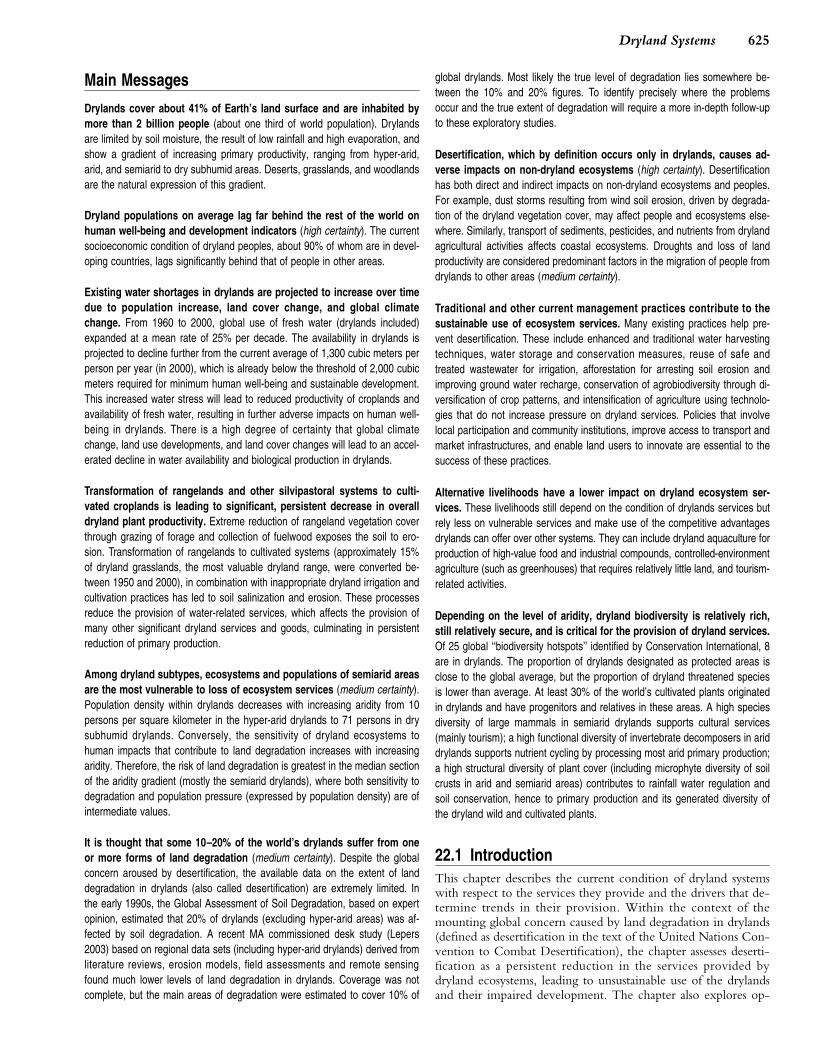
Table 22.1. Statistical Profile of the Dryland System (Area from Deichmann and Eklundh 1991; global area based on Digital Chart of theWorld data (147,573,196.6 sq. km; year 2000 population from CIESIN 2004)
Subtypes Aridity IndexCurrent Area Dominant Broad
BiomeCurrent Population
Size Share of Global Total Share of Global(mill. sq. km.) (percent) (thousand) (percent)
Hyper-arid <0.05 9.8 6.6 desert 101,336 1.7
Arid 0.05–0.20 15.7 10.6 desert 242,780 4.1
Semiarid 0.20–0.50 22.6 15.2 grassland 855.333 14.4
Dry subhumid 0.50–0.65 12.8 8.7 forest 909,972 15.3
Total 60.9 41.3 2,109,421 35.5
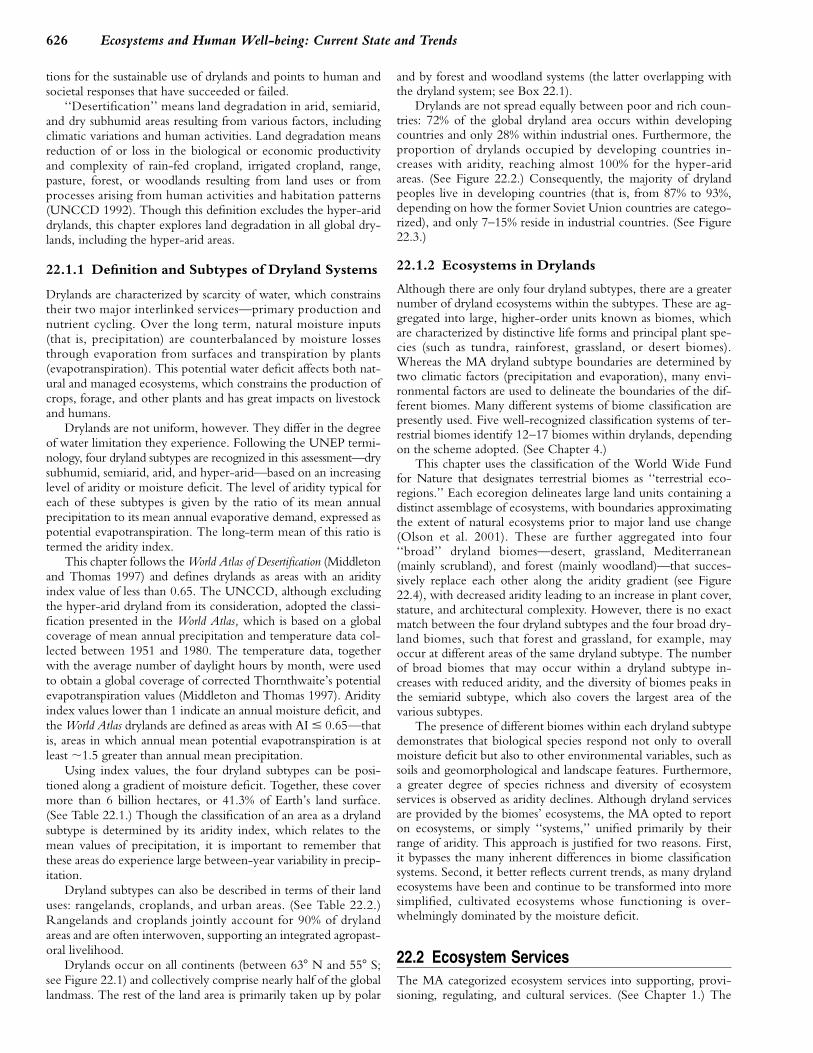
Table 22.2. Land Uses in Drylands (MA core data)
Rangelandsa Cultivated Urban Othersb
AreaShare of
Dryland Subtype AreaShare of
Dryland Subtype AreaShare of
Dryland Subtype AreaShare of
Dryland Subtype(sq. km) (percent) (sq. km) (percent) (sq. km) (percent) (sq. km) (percent)
Dry subhumid 4,344,897 34 6,096,558 47 457,851 4 l 1,971,907 16
Semiarid 12,170,274 54 7,992,020 35 556,515 2a 1,871,146 8
Arid 13,629,625 87 1,059,648 7 152,447 1a 822,075 5
Hyper-arid 9,497,407 97 55,592 0.6 74,050 1a 149,026 2
Total 39,642,202 65 15,203,818 25 2a 4,814,155 8
a Rangeland figures are based on available data on rangelands in drylands of developing countries (Reid et al. 2004; Thornton et al. 2002) and estimatesfor rangeland areas in the remaining drylands based on the assumption of uniformity in the rangeland’s share of each dryland subtype.
b Inland water systems in drylands (3%) and other areas unaccounted for by the assessed land uses (5%).
1,240,863
Figure 22.1. Dryland Systems and Subtypes
PAGE 627................. 11432$ CH22 10-11-05 15:05:04 PS
628 Ecosystems and Human Well-being: Current State and Trends
BOX 22.1
Forests in Drylands
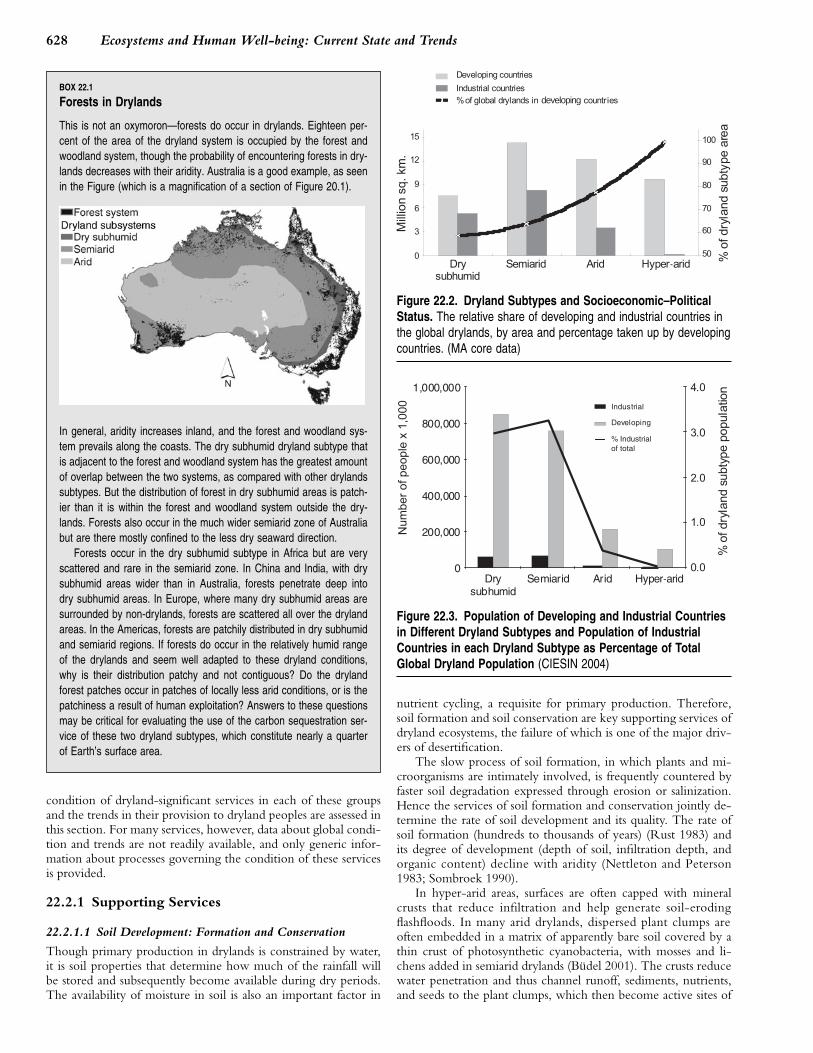
This is not an oxymoron—forests do occur in drylands. Eighteen per-cent of the area of the dryland system is occupied by the forest andwoodland system, though the probability of encountering forests in dry-lands decreases with their aridity. Australia is a good example, as seenin the Figure (which is a magnification of a section of Figure 20.1).
In general, aridity increases inland, and the forest and woodland sys-tem prevails along the coasts. The dry subhumid dryland subtype thatis adjacent to the forest and woodland system has the greatest amountof overlap between the two systems, as compared with other drylandssubtypes. But the distribution of forest in dry subhumid areas is patch-ier than it is within the forest and woodland system outside the dry-lands. Forests also occur in the much wider semiarid zone of Australiabut are there mostly confined to the less dry seaward direction.
Forests occur in the dry subhumid subtype in Africa but are veryscattered and rare in the semiarid zone. In China and India, with drysubhumid areas wider than in Australia, forests penetrate deep intodry subhumid areas. In Europe, where many dry subhumid areas aresurrounded by non-drylands, forests are scattered all over the drylandareas. In the Americas, forests are patchily distributed in dry subhumidand semiarid regions. If forests do occur in the relatively humid rangeof the drylands and seem well adapted to these dryland conditions,why is their distribution patchy and not contiguous? Do the drylandforest patches occur in patches of locally less arid conditions, or is thepatchiness a result of human exploitation? Answers to these questionsmay be critical for evaluating the use of the carbon sequestration ser-vice of these two dryland subtypes, which constitute nearly a quarterof Earth’s surface area.
condition of dryland-significant services in each of these groupsand the trends in their provision to dryland peoples are assessed inthis section. For many services, however, data about global condi-tion and trends are not readily available, and only generic infor-mation about processes governing the condition of these servicesis provided.
22.2.1 Supporting Services
22.2.1.1 Soil Development: Formation and Conservation
Though primary production in drylands is constrained by water,it is soil properties that determine how much of the rainfall willbe stored and subsequently become available during dry periods.The availability of moisture in soil is also an important factor in
PAGE 628
developing
-
Figure 22.2. Dryland Subtypes and Socioeconomic–PoliticalStatus. The relative share of developing and industrial countries inthe global drylands, by area and percentage taken up by developingcountries. (MA core data)
-
Figure 22.3. Population of Developing and Industrial Countriesin Different Dryland Subtypes and Population of IndustrialCountries in each Dryland Subtype as Percentage of TotalGlobal Dryland Population (CIESIN 2004)
nutrient cycling, a requisite for primary production. Therefore,soil formation and soil conservation are key supporting services ofdryland ecosystems, the failure of which is one of the major driv-ers of desertification.
The slow process of soil formation, in which plants and mi-croorganisms are intimately involved, is frequently countered byfaster soil degradation expressed through erosion or salinization.Hence the services of soil formation and conservation jointly de-termine the rate of soil development and its quality. The rate ofsoil formation (hundreds to thousands of years) (Rust 1983) andits degree of development (depth of soil, infiltration depth, andorganic content) decline with aridity (Nettleton and Peterson1983; Sombroek 1990).
In hyper-arid areas, surfaces are often capped with mineralcrusts that reduce infiltration and help generate soil-erodingflashfloods. In many arid drylands, dispersed plant clumps areoften embedded in a matrix of apparently bare soil covered by athin crust of photosynthetic cyanobacteria, with mosses and li-chens added in semiarid drylands (Budel 2001). The crusts reducewater penetration and thus channel runoff, sediments, nutrients,and seeds to the plant clumps, which then become active sites of
................. 11432$ CH22 10-11-05 15:05:14 PS
629Dryland Systems
-
Figure 22.4. Global Area Covered by Dryland Subtypes andTheir Broad Biomes. The line, points, and figures stand for thebroad biome diversity index (Shannon’s H); the pie chart shows theaggregated percentages for broad biomes by dryland subtypes.
soil formation and organic matter decomposition (Puigdefabregaset al. 1999). These crusts are therefore instrumental in soil devel-opment in and around the clumps and in soil conservation in thesurrounding matrix (Aguiar and Sala 1999). However, they de-velop slowly and are sensitive to trampling or air pollution. Drysubhumid soils, on the other hand, are protected from erosion bymultilayered, structurally complex vegetation (Poesen et al. 2003)that permits high water infiltration and storage, as well as waterextraction by the same vegetation (Puigdefabregas and Mendiza-bal 1998).
22.2.1.2 Nutrient Cycling
This service supports the services of soil development and primaryproduction through the breakdown of dead plant parts (thus en-riching the soil with organic matter) and the regeneration ofmineral plant nutrients. Unlike non-drylands, where soil micro-organisms are major players in nutrient cycling, invertebratemacro-decomposers are the most important in drylands, and theirsignificance increases with aridity. The significance of microor-ganisms, such as microbes and fungi, declines with aridity due totheir strict moisture dependence. In addition, the role of largeherbivores in nutrient cycling in arid and hyper-arid areas is lim-ited due to lack of drinking water sources. Therefore macro-decomposers such as termites, darkling beetles (Tenebrionidae), andother invertebrates (many of which are soil dwellers) that are lesswater-sensitive become important for nutrient cycling in dry-lands. These organisms ‘‘prepare’’ the litter for microbial activityand increase the soil infiltration capacity.
When arid drylands are used as rangelands, however, most ofthe primary production takes place through the livestock ratherthan the macro-decomposers. Due to the high metabolic needsof mammalian herbivores (compared with cold-blooded macro-decomposers), much of the organic carbon consumed by the live-stock does not return to enrich the soil but is respired or extractedfrom the ecosystem as meat, hair, milk, and other animal products.In addition, while most of the excreta of macro-decomposers isdeposited within the soil, much of the livestock waste on thesurface is volatilized and removed from the soil nutrient pool.Thus, livestock have the potential to gradually deplete the range-
PAGE 629
land nitrogen reserve and further exacerbate the nutrient limita-tions for primary production in arid and hyper-arid rangelands(Ayal et al. 2005). However, this depletion may be partially miti-gated by biological nitrogen fixation and by dust deposition (Sha-chak and Lovett 1998).
When drylands are used for crops, tillage and excessive use ofpesticides can reduce the role of soil-dwelling macro-decomposers.This, together with low root biomass of annual crops, can impairnutrient cycling and reduce soil organic carbon and its associatednutrients. Whereas wastes from subsistence cropping systems indrylands are locally recycled and only small proportions of cropproducts are exported, cropping systems that export products losenutrients, hence their fertilizer inputs are high.
22.2.1.3 Primary Production
The net primary production for global drylands, based on satelliteobservations at an 8-kilometer and 10-day resolution from 1981to 2000, was 703�44 grams per square meter (Cao et al. 2004),significantly lower than the values for the MA’s cultivated system(1,098�48 grams) and the forest and woodland system (869�34grams). But averaging over all the dryland subtypes masks theeffect of the aridity gradient.
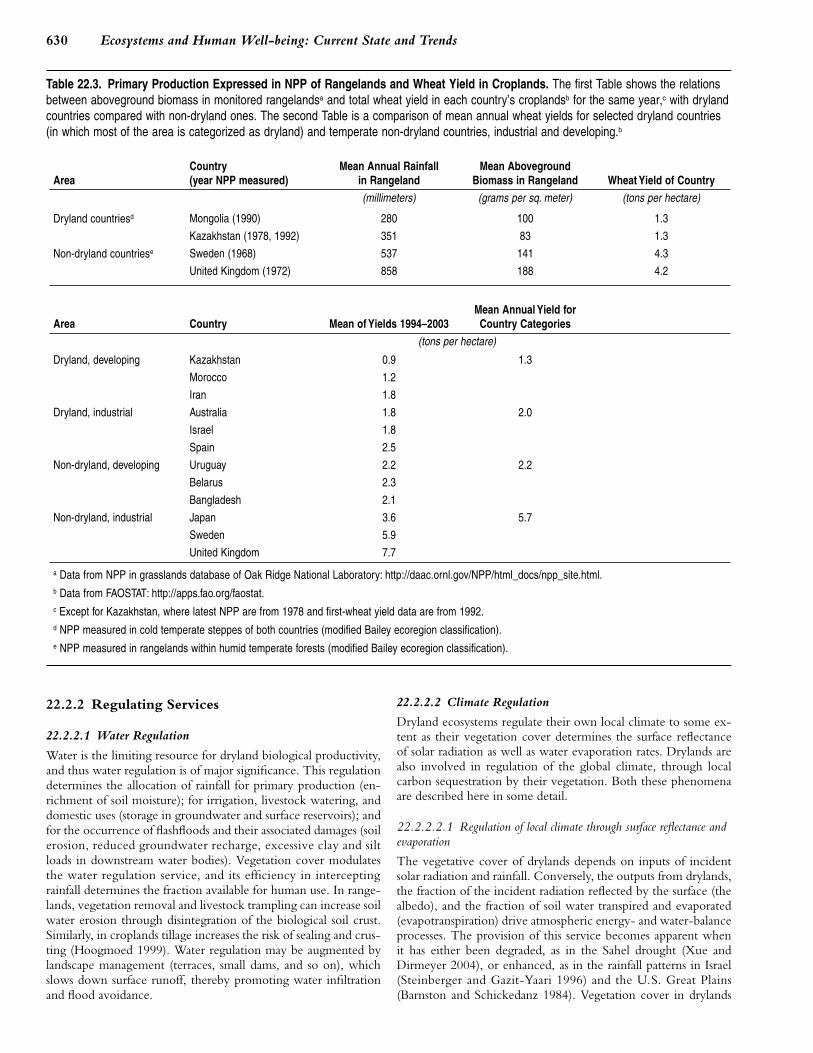
The NPP of rangelands is mostly generated by the naturaldryland plant community, in contrast to cultivated drylands,where the NPP is generated by agricultural crops and is oftenelevated due to two imported inputs—irrigation water and fertil-izers. Whereas the NPP of monitored rangeland sites was 40–90%higher in non-dryland than in dryland countries, in the same yearsthe yield of wheat in the croplands was more than three timesgreater in the non-dryland countries. (See Table 22.3.) Furtheranalysis that includes wheat yield data for more countries andmore years suggests a relative advantage of cultivation in non-drylands, but at the same time highlights the significance of socio-economic conditions, which apparently determine the amount ofresources that can be mobilized for promoting the service of pri-mary production. On average, industrial dryland countries pro-duced wheat yields nearly as high as those produced by non-dryland developing countries. The yield of developing drylandcountries was low compared with that of non-dryland countries;even among industrial countries, non-dryland ones did much bet-ter than dryland ones.
In order to distinguish between the relatively low NPP ofdrylands that is due to their inherent moisture deficit and theadditional decline in primary production due to land degradation,rain use efficiency—the ratio of NPP to rainfall—can serve as ameasure of primary production service condition (Le Houerou1984; Le Houerou et al. 1988; Pickup 1996): it separates out re-duced NPP due to reduced rainfall from declines in NPP drivenby land degradation (Prince et al. 1998) and also separates in-creased NPP due to increased rainfall from the effects of addedirrigation and fertilizer use.
Several global MA systems, drylands included, show a trendof NPP increase for the period 1981 to 2000 (Cao et al. 2004).The slope of the linear regression for drylands (regression coeffi-cient � 5.2) does not significantly differ from those of cultivatedand forest and woodland systems. However, high seasonal andinterannual variations associated with climate variability occurwithin this trend on the global scale. In the drylands, this variationin NPP was negatively correlated with temperature and positivelywith precipitation (Cao et al. 2004)—two drivers that are ex-pected to further affect dryland primary production throughglobal anthropogenic climate change.
................. 11432$ CH22 10-11-05 15:05:16 PS
630 Ecosystems and Human Well-being: Current State and Trends
Table 22.3. Primary Production Expressed in NPP of Rangelands and Wheat Yield in Croplands. The first Table shows the relationsbetween aboveground biomass in monitored rangelandsa and total wheat yield in each country’s croplandsb for the same year,c with drylandcountries compared with non-dryland ones. The second Table is a comparison of mean annual wheat yields for selected dryland countries(in which most of the area is categorized as dryland) and temperate non-dryland countries, industrial and developing.b
AreaCountry (year NPP measured)
Mean Annual Rainfall in Rangeland
Mean AbovegroundBiomass in Rangeland Wheat Yield of Country
(millimeters) (grams per sq. meter) (tons per hectare)
Dryland countriesd Mongolia (1990) 280 100 1.3
Kazakhstan (1978, 1992) 351 83 1.3
Non-dryland countriese Sweden (1968) 537 141 4.3
United Kingdom (1972) 858 188 4.2
Area Country Mean of Yields 1994–2003 Mean Annual Yield forCountry Categories
(tons per hectare)
Dryland, developing Kazakhstan 0.9 1.3
Morocco 1.2
Iran 1.8
Dryland, industrial Australia 1.8 2.0
Israel 1.8
Spain 2.5
Non-dryland, developing Uruguay 2.2 2.2
Belarus 2.3
Bangladesh 2.1
Non-dryland, industrial Japan 3.6 5.7
Sweden 5.9
United Kingdom 7.7
a Data from NPP in grasslands database of Oak Ridge National Laboratory: http://daac.ornl.gov/NPP/html_docs/npp_site.html.b Data from FAOSTAT: http://apps.fao.org/faostat.c Except for Kazakhstan, where latest NPP are from 1978 and first-wheat yield data are from 1992.d NPP measured in cold temperate steppes of both countries (modified Bailey ecoregion classification).e NPP measured in rangelands within humid temperate forests (modified Bailey ecoregion classification).
22.2.2 Regulating Services
22.2.2.1 Water Regulation
Water is the limiting resource for dryland biological productivity,and thus water regulation is of major significance. This regulationdetermines the allocation of rainfall for primary production (en-richment of soil moisture); for irrigation, livestock watering, anddomestic uses (storage in groundwater and surface reservoirs); andfor the occurrence of flashfloods and their associated damages (soilerosion, reduced groundwater recharge, excessive clay and siltloads in downstream water bodies). Vegetation cover modulatesthe water regulation service, and its efficiency in interceptingrainfall determines the fraction available for human use. In range-lands, vegetation removal and livestock trampling can increase soilwater erosion through disintegration of the biological soil crust.Similarly, in croplands tillage increases the risk of sealing and crus-ting (Hoogmoed 1999). Water regulation may be augmented bylandscape management (terraces, small dams, and so on), whichslows down surface runoff, thereby promoting water infiltrationand flood avoidance.
PAGE 630
22.2.2.2 Climate Regulation
Dryland ecosystems regulate their own local climate to some ex-tent as their vegetation cover determines the surface reflectanceof solar radiation as well as water evaporation rates. Drylands arealso involved in regulation of the global climate, through localcarbon sequestration by their vegetation. Both these phenomenaare described here in some detail.
22.2.2.2.1 Regulation of local climate through surface reflectance andevaporation
The vegetative cover of drylands depends on inputs of incidentsolar radiation and rainfall. Conversely, the outputs from drylands,the fraction of the incident radiation reflected by the surface (thealbedo), and the fraction of soil water transpired and evaporated(evapotranspiration) drive atmospheric energy- and water-balanceprocesses. The provision of this service becomes apparent whenit has either been degraded, as in the Sahel drought (Xue andDirmeyer 2004), or enhanced, as in the rainfall patterns in Israel(Steinberger and Gazit-Yaari 1996) and the U.S. Great Plains(Barnston and Schickedanz 1984). Vegetation cover in drylands
................. 11432$ CH22 10-11-05 15:05:17 PS
631Dryland Systems
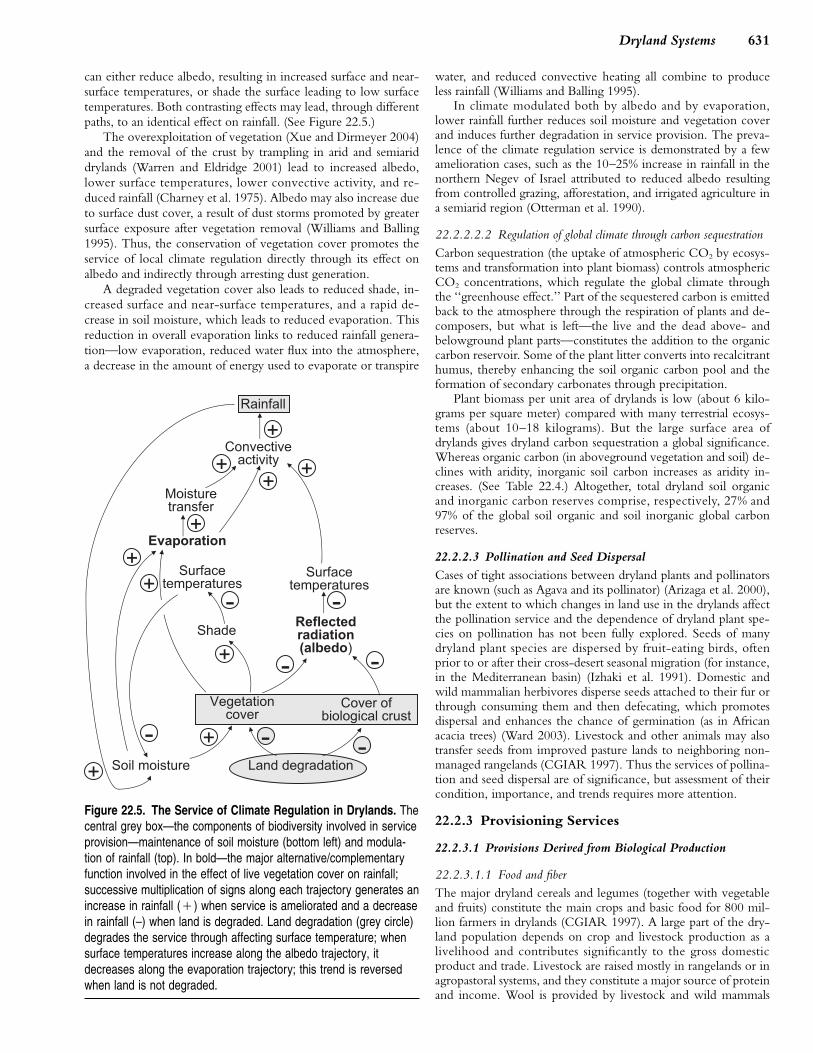
can either reduce albedo, resulting in increased surface and near-surface temperatures, or shade the surface leading to low surfacetemperatures. Both contrasting effects may lead, through differentpaths, to an identical effect on rainfall. (See Figure 22.5.)
The overexploitation of vegetation (Xue and Dirmeyer 2004)and the removal of the crust by trampling in arid and semiariddrylands (Warren and Eldridge 2001) lead to increased albedo,lower surface temperatures, lower convective activity, and re-duced rainfall (Charney et al. 1975). Albedo may also increase dueto surface dust cover, a result of dust storms promoted by greatersurface exposure after vegetation removal (Williams and Balling1995). Thus, the conservation of vegetation cover promotes theservice of local climate regulation directly through its effect onalbedo and indirectly through arresting dust generation.
A degraded vegetation cover also leads to reduced shade, in-creased surface and near-surface temperatures, and a rapid de-crease in soil moisture, which leads to reduced evaporation. Thisreduction in overall evaporation links to reduced rainfall genera-tion—low evaporation, reduced water flux into the atmosphere,a decrease in the amount of energy used to evaporate or transpire
Figure 22.5. The Service of Climate Regulation in Drylands. Thecentral grey box—the components of biodiversity involved in serviceprovision—maintenance of soil moisture (bottom left) and modula-tion of rainfall (top). In bold—the major alternative/complementaryfunction involved in the effect of live vegetation cover on rainfall;successive multiplication of signs along each trajectory generates anincrease in rainfall (�) when service is ameliorated and a decreasein rainfall (–) when land is degraded. Land degradation (grey circle)degrades the service through affecting surface temperature; whensurface temperatures increase along the albedo trajectory, itdecreases along the evaporation trajectory; this trend is reversedwhen land is not degraded.
PAGE 631
water, and reduced convective heating all combine to produceless rainfall (Williams and Balling 1995).
In climate modulated both by albedo and by evaporation,lower rainfall further reduces soil moisture and vegetation coverand induces further degradation in service provision. The preva-lence of the climate regulation service is demonstrated by a fewamelioration cases, such as the 10–25% increase in rainfall in thenorthern Negev of Israel attributed to reduced albedo resultingfrom controlled grazing, afforestation, and irrigated agriculture ina semiarid region (Otterman et al. 1990).
22.2.2.2.2 Regulation of global climate through carbon sequestrationCarbon sequestration (the uptake of atmospheric CO2 by ecosys-tems and transformation into plant biomass) controls atmosphericCO2 concentrations, which regulate the global climate throughthe ‘‘greenhouse effect.’’ Part of the sequestered carbon is emittedback to the atmosphere through the respiration of plants and de-composers, but what is left—the live and the dead above- andbelowground plant parts—constitutes the addition to the organiccarbon reservoir. Some of the plant litter converts into recalcitranthumus, thereby enhancing the soil organic carbon pool and theformation of secondary carbonates through precipitation.
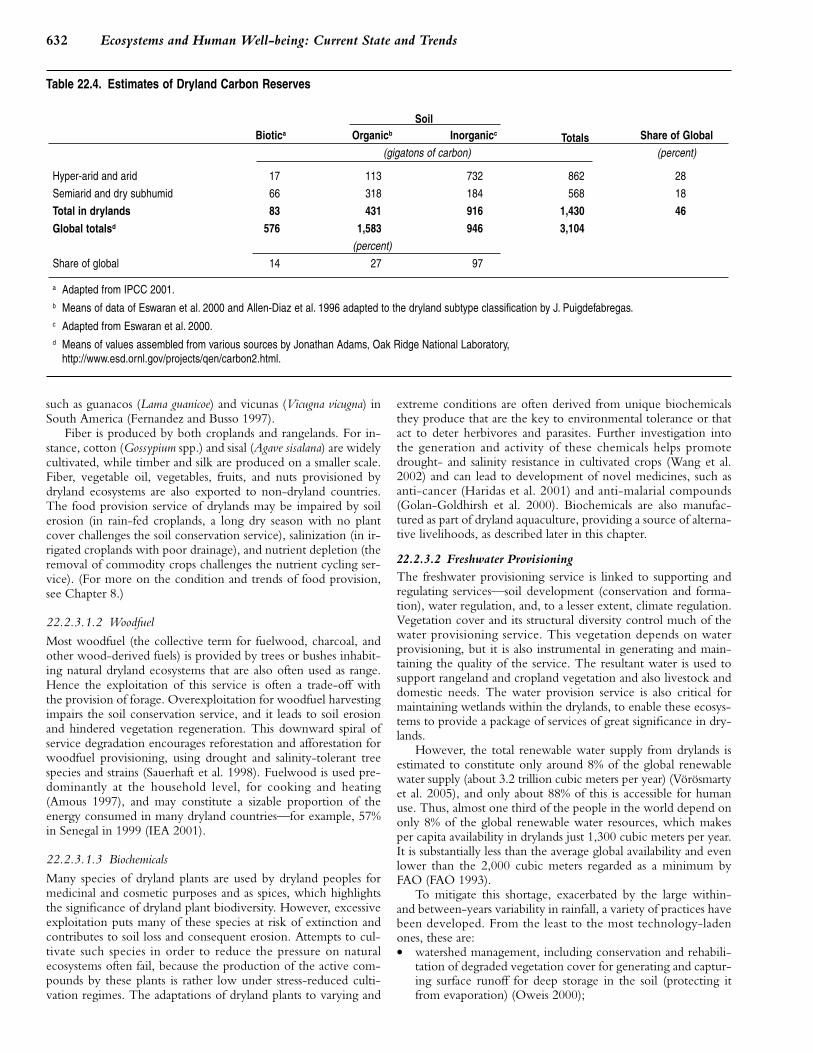
Plant biomass per unit area of drylands is low (about 6 kilo-grams per square meter) compared with many terrestrial ecosys-tems (about 10–18 kilograms). But the large surface area ofdrylands gives dryland carbon sequestration a global significance.Whereas organic carbon (in aboveground vegetation and soil) de-clines with aridity, inorganic soil carbon increases as aridity in-creases. (See Table 22.4.) Altogether, total dryland soil organicand inorganic carbon reserves comprise, respectively, 27% and97% of the global soil organic and soil inorganic global carbonreserves.
22.2.2.3 Pollination and Seed Dispersal
Cases of tight associations between dryland plants and pollinatorsare known (such as Agava and its pollinator) (Arizaga et al. 2000),but the extent to which changes in land use in the drylands affectthe pollination service and the dependence of dryland plant spe-cies on pollination has not been fully explored. Seeds of manydryland plant species are dispersed by fruit-eating birds, oftenprior to or after their cross-desert seasonal migration (for instance,in the Mediterranean basin) (Izhaki et al. 1991). Domestic andwild mammalian herbivores disperse seeds attached to their fur orthrough consuming them and then defecating, which promotesdispersal and enhances the chance of germination (as in Africanacacia trees) (Ward 2003). Livestock and other animals may alsotransfer seeds from improved pasture lands to neighboring non-managed rangelands (CGIAR 1997). Thus the services of pollina-tion and seed dispersal are of significance, but assessment of theircondition, importance, and trends requires more attention.
22.2.3 Provisioning Services
22.2.3.1 Provisions Derived from Biological Production
22.2.3.1.1 Food and fiberThe major dryland cereals and legumes (together with vegetableand fruits) constitute the main crops and basic food for 800 mil-lion farmers in drylands (CGIAR 1997). A large part of the dry-land population depends on crop and livestock production as alivelihood and contributes significantly to the gross domesticproduct and trade. Livestock are raised mostly in rangelands or inagropastoral systems, and they constitute a major source of proteinand income. Wool is provided by livestock and wild mammals
................. 11432$ CH22 10-11-05 15:05:20 PS
632 Ecosystems and Human Well-being: Current State and Trends
Table 22.4. Estimates of Dryland Carbon Reserves
Biotica Totals Share of GlobalOrganicb Inorganicc
(gigatons of carbon) (percent)
Hyper-arid and arid 17 113 732 862 28
Semiarid and dry subhumid 66 318 184 568 18
Total in drylands 83 431 916 1,430 46
Global totalsd 576 1,583 946 3,104(percent)
Share of global 14 27 97
a Adapted from IPCC 2001.b Means of data of Eswaran et al. 2000 and Allen-Diaz et al. 1996 adapted to the dryland subtype classification by J. Puigdefabregas.c Adapted from Eswaran et al. 2000.d Means of values assembled from various sources by Jonathan Adams, Oak Ridge National Laboratory,
http://www.esd.ornl.gov/projects/qen/carbon2.html.
Soil
such as guanacos (Lama guanicoe) and vicunas (Vicugna vicugna) inSouth America (Fernandez and Busso 1997).
Fiber is produced by both croplands and rangelands. For in-stance, cotton (Gossypium spp.) and sisal (Agave sisalana) are widelycultivated, while timber and silk are produced on a smaller scale.Fiber, vegetable oil, vegetables, fruits, and nuts provisioned bydryland ecosystems are also exported to non-dryland countries.The food provision service of drylands may be impaired by soilerosion (in rain-fed croplands, a long dry season with no plantcover challenges the soil conservation service), salinization (in ir-rigated croplands with poor drainage), and nutrient depletion (theremoval of commodity crops challenges the nutrient cycling ser-vice). (For more on the condition and trends of food provision,see Chapter 8.)
22.2.3.1.2 Woodfuel
Most woodfuel (the collective term for fuelwood, charcoal, andother wood-derived fuels) is provided by trees or bushes inhabit-ing natural dryland ecosystems that are also often used as range.Hence the exploitation of this service is often a trade-off withthe provision of forage. Overexploitation for woodfuel harvestingimpairs the soil conservation service, and it leads to soil erosionand hindered vegetation regeneration. This downward spiral ofservice degradation encourages reforestation and afforestation forwoodfuel provisioning, using drought and salinity-tolerant treespecies and strains (Sauerhaft et al. 1998). Fuelwood is used pre-dominantly at the household level, for cooking and heating(Amous 1997), and may constitute a sizable proportion of theenergy consumed in many dryland countries—for example, 57%in Senegal in 1999 (IEA 2001).
22.2.3.1.3 Biochemicals
Many species of dryland plants are used by dryland peoples formedicinal and cosmetic purposes and as spices, which highlightsthe significance of dryland plant biodiversity. However, excessiveexploitation puts many of these species at risk of extinction andcontributes to soil loss and consequent erosion. Attempts to cul-tivate such species in order to reduce the pressure on naturalecosystems often fail, because the production of the active com-pounds by these plants is rather low under stress-reduced culti-vation regimes. The adaptations of dryland plants to varying and
PAGE 632
extreme conditions are often derived from unique biochemicalsthey produce that are the key to environmental tolerance or thatact to deter herbivores and parasites. Further investigation intothe generation and activity of these chemicals helps promotedrought- and salinity resistance in cultivated crops (Wang et al.2002) and can lead to development of novel medicines, such asanti-cancer (Haridas et al. 2001) and anti-malarial compounds(Golan-Goldhirsh et al. 2000). Biochemicals are also manufac-tured as part of dryland aquaculture, providing a source of alterna-tive livelihoods, as described later in this chapter.
22.2.3.2 Freshwater ProvisioningThe freshwater provisioning service is linked to supporting andregulating services—soil development (conservation and forma-tion), water regulation, and, to a lesser extent, climate regulation.Vegetation cover and its structural diversity control much of thewater provisioning service. This vegetation depends on waterprovisioning, but it is also instrumental in generating and main-taining the quality of the service. The resultant water is used tosupport rangeland and cropland vegetation and also livestock anddomestic needs. The water provision service is also critical formaintaining wetlands within the drylands, to enable these ecosys-tems to provide a package of services of great significance in dry-lands.
However, the total renewable water supply from drylands isestimated to constitute only around 8% of the global renewablewater supply (about 3.2 trillion cubic meters per year) (Vorosmartyet al. 2005), and only about 88% of this is accessible for humanuse. Thus, almost one third of the people in the world depend ononly 8% of the global renewable water resources, which makesper capita availability in drylands just 1,300 cubic meters per year.It is substantially less than the average global availability and evenlower than the 2,000 cubic meters regarded as a minimum byFAO (FAO 1993).
To mitigate this shortage, exacerbated by the large within-and between-years variability in rainfall, a variety of practices havebeen developed. From the least to the most technology-ladenones, these are:• watershed management, including conservation and rehabili-
tation of degraded vegetation cover for generating and captur-ing surface runoff for deep storage in the soil (protecting itfrom evaporation) (Oweis 2000);
................. 11432$ CH22 10-11-05 15:05:21 PS
633Dryland Systems
• floodwater recharge and construction of dams and weirs forminimizing impact of floods and water loss;
• irrigation, to circumvent the temporal variability in provision(often based on extraction from aquifers, with frequent over-pumping leading to salinization)—however, the transporta-tion of water from other ecosystems that may be severelyaffected and the salinization of the irrigated drylands oftenmake this option unsustainable;
• mining of nonrenewable fossil aquifers (which are quite com-mon in drylands), for cultivation that is otherwise impossible;
• treatment of wastewater, mainly from urban sources, and reus-ing it for irrigation—a promising practice provided that con-cerns about adverse impacts on human health, crops, soils, andgroundwater can be overcome (Karajeh et al. 2000); and
• desalination of brackish water and seawater for all uses (whichis safe and uses renewable sources but has a high energy de-mand and is relatively costly, and the accumulated brine oftenposes a salinization risk).These interventions are critical for relieving pressure on the
water systems of drylands.
22.2.4 Cultural Services
22.2.4.1 Cultural Identity and Diversity
Dryland peoples identify themselves with the use of their sur-rounding ecosystem and create their own unique ecosystem-inspired culture. (See Chapter 17.) Drylands have high culturaldiversity, in keeping with the ecosystem diversity along the ariditygradient. One expression of this is that 24% of global languagesare associated with the drylands’ grassland, savanna, and shrublandbiomes. Typical to drylands are the diverse nomadic cultures thathave historically played a key role in development of drylandfarming systems (Hillel 1991). Ecosystem functions and diversitygenerate cultural identity and diversity that in turn conserve eco-system integrity and diversity. A negative feedback loop is there-fore expected between land degradation and cultural degradationin drylands.
22.2.4.2 Cultural Landscapes and Heritage Values
The term ‘‘cultural landscape’’ is a socioeconomic expression ofthe biophysical features of ecosystems that mutually contribute tothe development of a characteristic landscape, and it signifies aheritage value. (See Chapter 17.) In drylands, the heritage valuecan be nurtured either by landscapes that reflect the human striv-ing for ‘‘conquering the desert’’ or by ones reflecting aspirationsto ‘‘live with the desert.’’ Transformation of rural to urban ecosys-tems is an expression of changed livelihoods that modify the land-scape and its cultural values and often degrade cultural heritages.Actions to conserve outstanding Cultural Heritage Sites that arecultural landscapes are under way (UNESCO 2004), and 21 suchsites have been identified, of which 8 are in drylands.
22.2.4.3 Servicing Knowledge Systems
Dryland ecosystems also contribute to human culture throughboth formal (‘‘scientific’’) and traditional knowledge systems. (SeeChapter 17.) Drylands have generated significant contributions toglobal environmental sciences. Arid Cultural Heritage Sites (suchas Lake Turkana National Park and Ngorongo ConservationArea) have generated knowledge of paleo-environments and ofhuman evolution (UNESCO 2004); studies of desert organismshave revealed adaptations to extreme environmental stresses (e.g.,Schmidt-Nielsen 1980); and studies of desert ecology have in-
PAGE 633
spired modern community and ecosystem ecology (e.g. Noy-Meir 1973, 1974; Rosenzweig 1995).
Dryland traditional knowledge has co-evolved with the cul-tural identity of dryland peoples and their environment and itsnatural resources and has generated many unique systems of waterharvesting, cultivation practices, climate forecasting, and the useof dryland medicinal plants. The degradation of this knowledgein many cases has often led to adoption of unsustainable technolo-gies. The exploration, conservation, and integration of drylandtraditional knowledge with adapted technologies have been iden-tified as priority actions by the Committee of Science and Tech-nology of the UNCCD (ICCD 2000).
22.2.4.4 Spiritual Services
Many groves, tree species, and individual trees have spiritual sig-nificance to dryland peoples due to their relative rarity, high visi-bility in the landscape, and ability to provide shade. In ancienttimes in the Middle East and North Africa, spiritually significantsocial and religious activities took place under tree canopies. Thesites of individual trees have been used for anointing rulers, host-ing legal hearings, burial of community and religious dignitaries,and religious rituals, and individual trees themselves have becomesacred and named after deities. For instance, the Hebrew namesof Quercus and Pistacia (the dominant species of the eastern Medi-terranean shrubland and woodland biomes)—Alon and Ela—derive from the words for God and Goddess respectively.Protected from grazing and cutting, these sacred trees havereached dimensions far larger than they ever attain in their naturalclimax community (Zohary 1973: 505–07). These sacred grovesoften conserve islands of indigenous ecosystems in a transformedlandscape and contribute to a unique cultural landscape. Similarservices are also provided by other drylands, such as the religious,ceremonial, and historical sites of Native Americans (Williams andDiebel 1996) and aboriginal Australians. (See Chapter 17.) Inhyper-arid drylands, trees are far rarer, and indigenous nomadicpeople do not generally identify individual trees as sacred, al-though they can have spiritual values.
22.2.4.5 Aesthetic and Inspirational Services
There are outstanding literary and historical examples for inspira-tion generated by dryland landscapes (such as the Old and NewTestaments). The stark contrast between inland wetlands and sur-rounding dryland areas, linked with the significance of water bod-ies to the well-being of dryland people, could have generated theassociation of the Mesopotamian marshlands with the Garden ofEden (Hamblin 1987). Dryland ecosystems are also a source ofinspiration for non-dryland people. The 1950s Walt Disney film‘‘The Living Desert’’ brought desert ecosystems and biodiversityto the attention of millions prior to the television era and wasdeclared ‘‘culturally significant’’ in the year 2000 by the U.S. Li-brary of Congress.
The popular conception of dryland peoples among non-dryland groups is one of human struggle against harsh natural con-ditions producing rich cultures nurtured by strong moral values,as well as naive romantic notions of life in the desert (Fernandezand Busso 1997). However, while the media has largely promotedthe conservation of desert heritage in recent years, others haveresponded by trying to ‘‘green’’ desert areas or make them‘‘bloom,’’ which has often resulted in an aesthetically appealinglandscapes of oasis-like patches of agricultural land set in sharplycontrasting surrounding desert (Safriel 1992)—but with a loss ofdryland biodiversity.
................. 11432$ CH22 10-11-05 15:05:22 PS
634 Ecosystems and Human Well-being: Current State and Trends
22.2.4.6 Recreation and Tourism
Large, sparsely populated, low-pollution arid and hyper-arid areasprovide attractive holiday destinations for many. There are sig-nificant constraints to dryland tourism, however, including thegeneral remoteness and isolation, which increases the cost oftravel; lack of recreation amenities and security; the harsh climate,which means residential facilities have high energy demands; thehigh water demand of tourists, which places already scarce waterunder extra pressure; and often a direct competition with otherlivelihoods over the use of natural resources and energy. Theseissues are being addressed through various approaches, includingtreatment and reuse of local wastewater (Oron 1996), construc-tion and architectural solutions for passive cooling and heating(Etzion et al. 1999), and the use of the dryland-abundant solarenergy as a power source (Faiman 1998).
Drylands are also attractive for cultural tourism associated withhistorical and religious sites, for coastal tourism (such as Mediter-ranean beaches), and for health-related tourism (such as the DeadSea). Dryland biodiversity is also a major draw for ecotourism.Paradoxically, this is because most drylands are devoid of wood-lands and dense high vegetation and hence free of obstructions toview wildlife. For instance, African savanna safaris are generallydesigned around a few ‘‘charismatic’’ large mammal species andmass seasonal migrations of large herbivores, and many touristspack resorts along the route of the spectacular seasonal trans-Saharan bird migration. The significance of the dryland culturalservice to tourism is demonstrated by Kenya, where 90% of tour-ists visit a game park (White et al. 2000). Finally, although eco-tourism generates income for dryland peoples, it often causeshabitat degradation, as described later (White et al. 2000).
22.2.5 Biodiversity and the Provision of DrylandServices
22.2.5.1 Dimensions, Structure, and Composition of DrylandBiodiversity
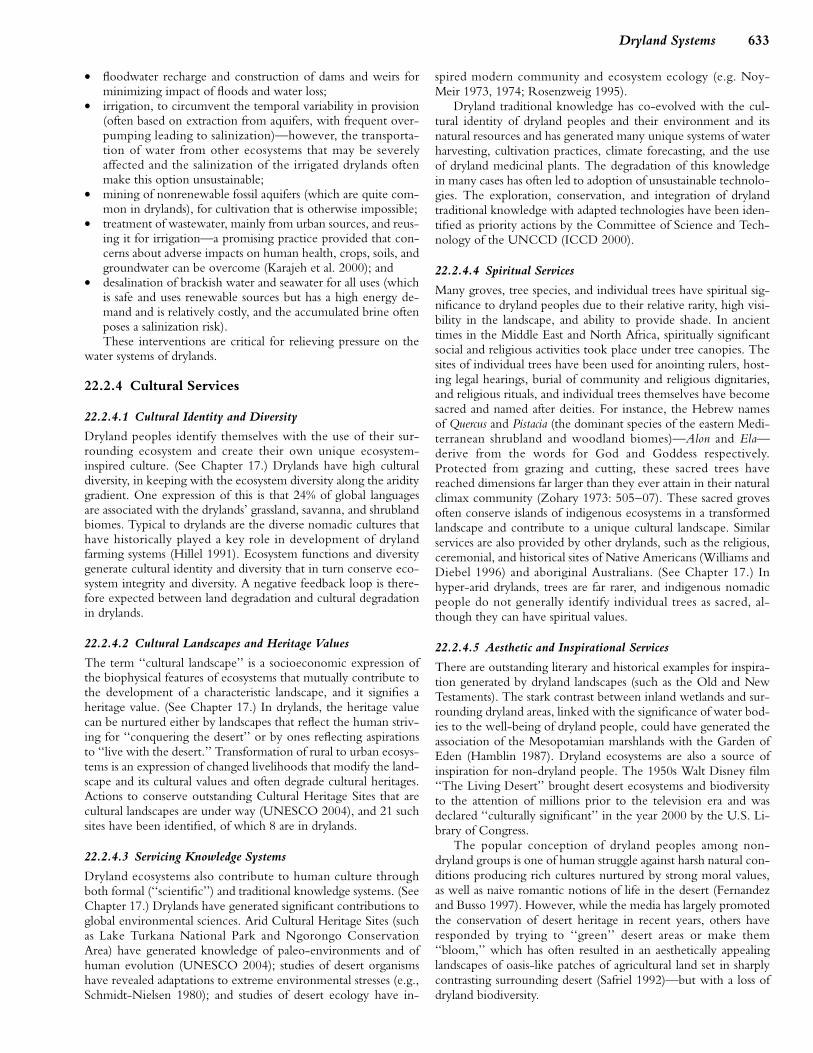
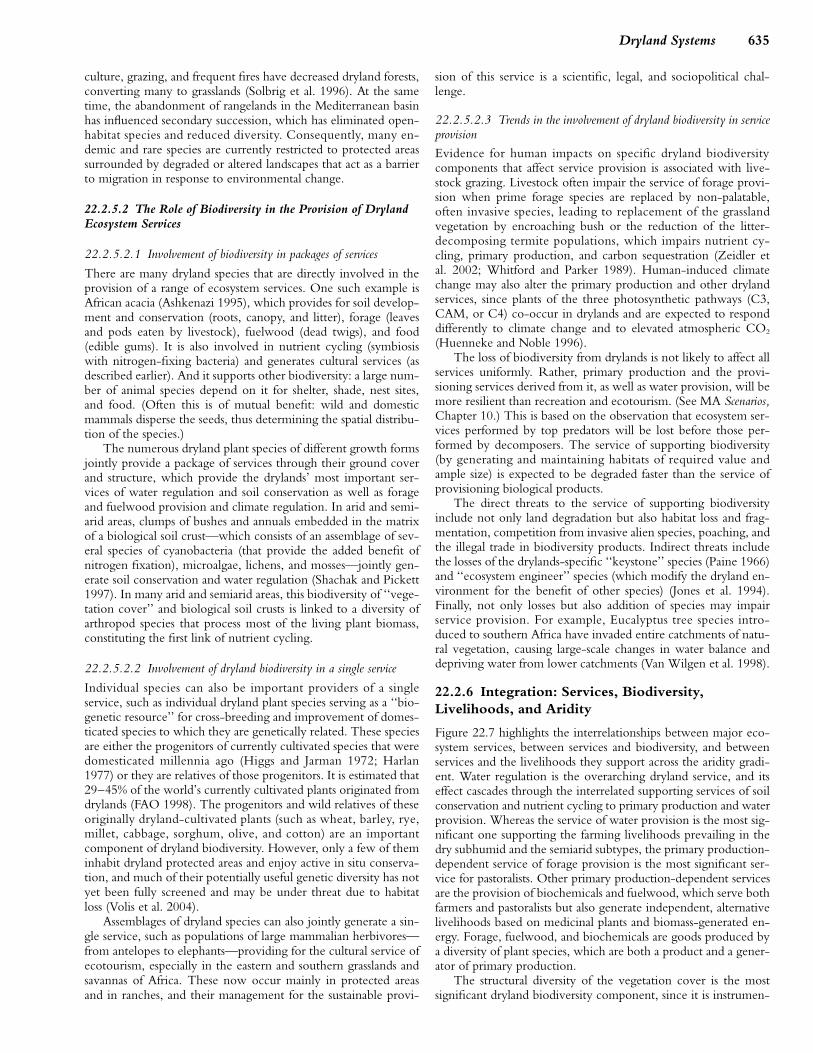
Species richness declines with decreasing primary productivity(Rosenzweig and Abramsky 1993) and vice versa (Tilman et al.2001); hence dryland species richness should decrease with aridity.Indeed, the low number of flowering plant species in the hyper-arid subtype rapidly increases with reduced aridity (in agreementwith an increase of between-‘‘broad biome’’ diversity) and peaksin the dry subhumid subtype. However, contrary to expectation,species diversity declines in non-dryland temperate humid areas.But as might be expected, it is nearly half that of tropical areas.(See Figure 22.6.) The significance of biodiversity for each of themajor dryland biomes is discussed in this section. (See also Chap-ter 4.)
22.2.5.1.1 Deserts
Some 7,000 terrestrial amphibian, reptile, bird, and mammal spe-cies live in the desert biome. This covers 25% of global terrestrialfauna of these groups—22% of which also live in other biomesand 3% are found exclusively in deserts. For comparison, the rich-est terrestrial biome—tropical and sub-tropical moist broadleafforests—supports around 70% of global terrestrial fauna, 28% ofwhich are species endemic to that biome. Thus species richnessof desert vertebrates is as much as a third of the most vertebrate-rich biome on Earth, signifying that desert biodiversity may bequite high in spite of harsh conditions. Because functional groupsin deserts may each have only a few species, however, the redun-dancy in service provision is low, and human pressure may reduceit further (Huenneke 2001). Indeed, in spite of the remoteness
PAGE 634
--
Figure 22.6. Number of Species of Flowering Plants in SelectedCountries across the Aridity Gradient (per 1,000 sq. km). Eachcolumn represents a mean of two countries. Selected dryland coun-tries are at least 95% dryland, either of one subtype, or two of roughlysimilar dimensions. Grey columns indicate non-dryland countries.(WRI 2004; CIA 2004)
and isolation, human impact on deserts in the form of settlementsand infrastructure is mounting, and there has been a 6% loss ofhabitat between 1950 and 1990.
22.2.5.1.2 Grasslands
Grasslands (the temperate grasslands, savannas, and shrublandbiome and the tropical and sub-tropical grasslands, savannas, andshrubland biome) occur in the semiarid and the dry subhumiddryland subtypes, and their biodiversity is richer than that ofdeserts (12% and 28% respectively of the global terrestrial verte-brate fauna are found in these two biomes). Much is known ofthe functioning of natural grasslands, many of which function asrangelands: plant diversity increases productivity (Tilman et al.2001), and communities with many functional groups generatehigher production than those with fewer groups. Yet within agrassland community a few abundant species account for a largefraction of grassland ecosystem functions, whereas the many rarespecies account for a small fraction of its functions (Sala et al.1996; Solbrig et al. 1996).
It is important to note that the relationships between diversityand function are not linear, and a threshold in species richnesshas been identified below which ecosystem function declines andabove which it does not change (Vitousek and Hooper 1993).Unfortunately, many natural grasslands have been transformed tocroplands and most dryland cultivated lands are in these biomes.This transformation continues, and some 15% and 14% of thenatural habitats in the semiarid and dry subhumid subtypes weretransformed between 1950 and 1990.
22.2.5.1.3 Mediterranean forests, woodlands, and shrublands biome
The Mediterranean biome, comprising xeric woodlands andshrublands, occurs within semiarid and dry subhumid areas witha Mediterranean climate and is subjected to intensive human im-pact, especially in the Mediterranean basin, resulting in plant ad-aptations to clearing, grazing, fires, and drought (Davis et al.1996). Species richness is high (Mooney et al. 2001), with theMediterranean basin supporting 25,000 vascular plants (10% ofglobal species), of which 60% are endemic; 10% of the globalvertebrates species inhabit the Mediterranean biome.
The biome’s biodiversity is threatened by its small geographiccoverage, fragmentation, high human population density, aban-donment of traditional practices, tourism, continued habitat con-version (2.5% of Mediterranean habitat was lost between 1950and 1990), and invasive alien species (Mooney et al. 2001). Agri-
................. 11432$ CH22 10-11-05 15:05:25 PS
635Dryland Systems
culture, grazing, and frequent fires have decreased dryland forests,converting many to grasslands (Solbrig et al. 1996). At the sametime, the abandonment of rangelands in the Mediterranean basinhas influenced secondary succession, which has eliminated open-habitat species and reduced diversity. Consequently, many en-demic and rare species are currently restricted to protected areassurrounded by degraded or altered landscapes that act as a barrierto migration in response to environmental change.
22.2.5.2 The Role of Biodiversity in the Provision of DrylandEcosystem Services
22.2.5.2.1 Involvement of biodiversity in packages of services
There are many dryland species that are directly involved in theprovision of a range of ecosystem services. One such example isAfrican acacia (Ashkenazi 1995), which provides for soil develop-ment and conservation (roots, canopy, and litter), forage (leavesand pods eaten by livestock), fuelwood (dead twigs), and food(edible gums). It is also involved in nutrient cycling (symbiosiswith nitrogen-fixing bacteria) and generates cultural services (asdescribed earlier). And it supports other biodiversity: a large num-ber of animal species depend on it for shelter, shade, nest sites,and food. (Often this is of mutual benefit: wild and domesticmammals disperse the seeds, thus determining the spatial distribu-tion of the species.)
The numerous dryland plant species of different growth formsjointly provide a package of services through their ground coverand structure, which provide the drylands’ most important ser-vices of water regulation and soil conservation as well as forageand fuelwood provision and climate regulation. In arid and semi-arid areas, clumps of bushes and annuals embedded in the matrixof a biological soil crust—which consists of an assemblage of sev-eral species of cyanobacteria (that provide the added benefit ofnitrogen fixation), microalgae, lichens, and mosses—jointly gen-erate soil conservation and water regulation (Shachak and Pickett1997). In many arid and semiarid areas, this biodiversity of ‘‘vege-tation cover’’ and biological soil crusts is linked to a diversity ofarthropod species that process most of the living plant biomass,constituting the first link of nutrient cycling.
22.2.5.2.2 Involvement of dryland biodiversity in a single service
Individual species can also be important providers of a singleservice, such as individual dryland plant species serving as a ‘‘bio-genetic resource’’ for cross-breeding and improvement of domes-ticated species to which they are genetically related. These speciesare either the progenitors of currently cultivated species that weredomesticated millennia ago (Higgs and Jarman 1972; Harlan1977) or they are relatives of those progenitors. It is estimated that29–45% of the world’s currently cultivated plants originated fromdrylands (FAO 1998). The progenitors and wild relatives of theseoriginally dryland-cultivated plants (such as wheat, barley, rye,millet, cabbage, sorghum, olive, and cotton) are an importantcomponent of dryland biodiversity. However, only a few of theminhabit dryland protected areas and enjoy active in situ conserva-tion, and much of their potentially useful genetic diversity has notyet been fully screened and may be under threat due to habitatloss (Volis et al. 2004).
Assemblages of dryland species can also jointly generate a sin-gle service, such as populations of large mammalian herbivores—from antelopes to elephants—providing for the cultural service ofecotourism, especially in the eastern and southern grasslands andsavannas of Africa. These now occur mainly in protected areasand in ranches, and their management for the sustainable provi-
PAGE 635
sion of this service is a scientific, legal, and sociopolitical chal-lenge.
22.2.5.2.3 Trends in the involvement of dryland biodiversity in serviceprovision
Evidence for human impacts on specific dryland biodiversitycomponents that affect service provision is associated with live-stock grazing. Livestock often impair the service of forage provi-sion when prime forage species are replaced by non-palatable,often invasive species, leading to replacement of the grasslandvegetation by encroaching bush or the reduction of the litter-decomposing termite populations, which impairs nutrient cy-cling, primary production, and carbon sequestration (Zeidler etal. 2002; Whitford and Parker 1989). Human-induced climatechange may also alter the primary production and other drylandservices, since plants of the three photosynthetic pathways (C3,CAM, or C4) co-occur in drylands and are expected to responddifferently to climate change and to elevated atmospheric CO2
(Huenneke and Noble 1996).The loss of biodiversity from drylands is not likely to affect all
services uniformly. Rather, primary production and the provi-sioning services derived from it, as well as water provision, will bemore resilient than recreation and ecotourism. (See MA Scenarios,Chapter 10.) This is based on the observation that ecosystem ser-vices performed by top predators will be lost before those per-formed by decomposers. The service of supporting biodiversity(by generating and maintaining habitats of required value andample size) is expected to be degraded faster than the service ofprovisioning biological products.
The direct threats to the service of supporting biodiversityinclude not only land degradation but also habitat loss and frag-mentation, competition from invasive alien species, poaching, andthe illegal trade in biodiversity products. Indirect threats includethe losses of the drylands-specific ‘‘keystone’’ species (Paine 1966)and ‘‘ecosystem engineer’’ species (which modify the dryland en-vironment for the benefit of other species) (Jones et al. 1994).Finally, not only losses but also addition of species may impairservice provision. For example, Eucalyptus tree species intro-duced to southern Africa have invaded entire catchments of natu-ral vegetation, causing large-scale changes in water balance anddepriving water from lower catchments (Van Wilgen et al. 1998).
22.2.6 Integration: Services, Biodiversity,Livelihoods, and Aridity
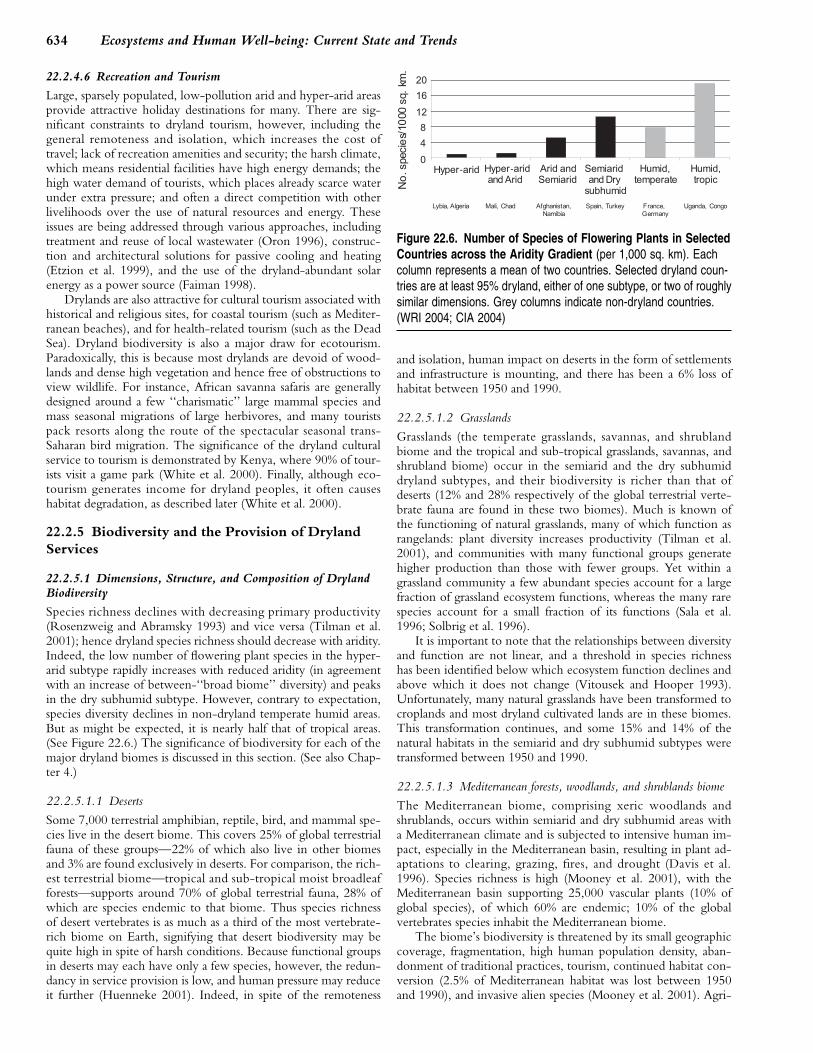
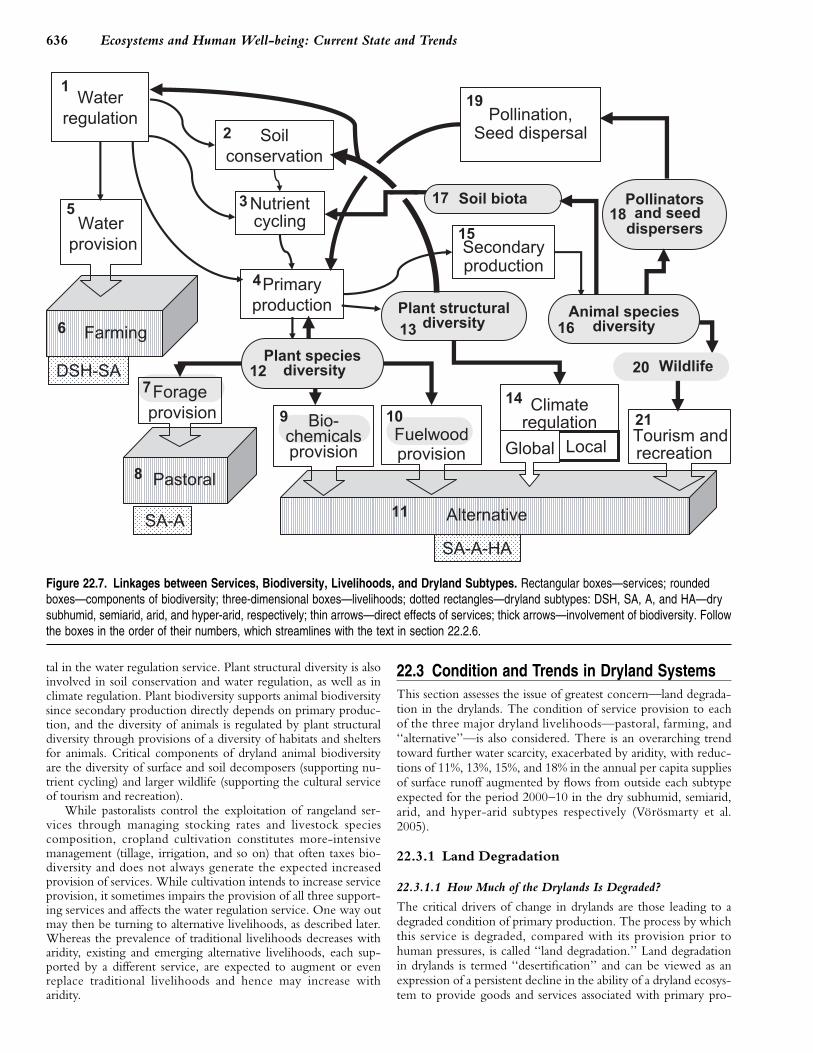
Figure 22.7 highlights the interrelationships between major eco-system services, between services and biodiversity, and betweenservices and the livelihoods they support across the aridity gradi-ent. Water regulation is the overarching dryland service, and itseffect cascades through the interrelated supporting services of soilconservation and nutrient cycling to primary production and waterprovision. Whereas the service of water provision is the most sig-nificant one supporting the farming livelihoods prevailing in thedry subhumid and the semiarid subtypes, the primary production-dependent service of forage provision is the most significant ser-vice for pastoralists. Other primary production-dependent servicesare the provision of biochemicals and fuelwood, which serve bothfarmers and pastoralists but also generate independent, alternativelivelihoods based on medicinal plants and biomass-generated en-ergy. Forage, fuelwood, and biochemicals are goods produced bya diversity of plant species, which are both a product and a gener-ator of primary production.
The structural diversity of the vegetation cover is the mostsignificant dryland biodiversity component, since it is instrumen-
................. 11432$ CH22 10-11-05 15:05:27 PS
636 Ecosystems and Human Well-being: Current State and Trends
Figure 22.7. Linkages between Services, Biodiversity, Livelihoods, and Dryland Subtypes. Rectangular boxes—services; roundedboxes—components of biodiversity; three-dimensional boxes—livelihoods; dotted rectangles—dryland subtypes: DSH, SA, A, and HA—drysubhumid, semiarid, arid, and hyper-arid, respectively; thin arrows—direct effects of services; thick arrows—involvement of biodiversity. Followthe boxes in the order of their numbers, which streamlines with the text in section 22.2.6.
tal in the water regulation service. Plant structural diversity is alsoinvolved in soil conservation and water regulation, as well as inclimate regulation. Plant biodiversity supports animal biodiversitysince secondary production directly depends on primary produc-tion, and the diversity of animals is regulated by plant structuraldiversity through provisions of a diversity of habitats and sheltersfor animals. Critical components of dryland animal biodiversityare the diversity of surface and soil decomposers (supporting nu-trient cycling) and larger wildlife (supporting the cultural serviceof tourism and recreation).
While pastoralists control the exploitation of rangeland ser-vices through managing stocking rates and livestock speciescomposition, cropland cultivation constitutes more-intensivemanagement (tillage, irrigation, and so on) that often taxes bio-diversity and does not always generate the expected increasedprovision of services. While cultivation intends to increase serviceprovision, it sometimes impairs the provision of all three support-ing services and affects the water regulation service. One way outmay then be turning to alternative livelihoods, as described later.Whereas the prevalence of traditional livelihoods decreases witharidity, existing and emerging alternative livelihoods, each sup-ported by a different service, are expected to augment or evenreplace traditional livelihoods and hence may increase witharidity.
PAGE 636
22.3 Condition and Trends in Dryland SystemsThis section assesses the issue of greatest concern—land degrada-tion in the drylands. The condition of service provision to eachof the three major dryland livelihoods—pastoral, farming, and‘‘alternative’’—is also considered. There is an overarching trendtoward further water scarcity, exacerbated by aridity, with reduc-tions of 11%, 13%, 15%, and 18% in the annual per capita suppliesof surface runoff augmented by flows from outside each subtypeexpected for the period 2000–10 in the dry subhumid, semiarid,arid, and hyper-arid subtypes respectively (Vorosmarty et al.2005).
22.3.1 Land Degradation
22.3.1.1 How Much of the Drylands Is Degraded?
The critical drivers of change in drylands are those leading to adegraded condition of primary production. The process by whichthis service is degraded, compared with its provision prior tohuman pressures, is called ‘‘land degradation.’’ Land degradationin drylands is termed ‘‘desertification’’ and can be viewed as anexpression of a persistent decline in the ability of a dryland ecosys-tem to provide goods and services associated with primary pro-
................. 11432$ CH22 10-11-05 15:05:30 PS
637Dryland Systems
ductivity. Thus, an indicator of the condition of drylands is thedegree of ‘‘land degradation’’ or desertification. (See Box 22.2.)
Despite the global importance of desertification, the availabledata on the extent of land degradation in drylands are limited. Todate, there are only two studies with global coverage and bothhave considerable weakness. But in the absence of anything betterthey have been widely used as a basis for national, regional, andglobal environmental assessments.
The best known study is the Global Assessment of Soil Degra-dation (Oldeman et al. 1991). Intended as an exploratory study, itdid not include any remote sensing or field measurements and wasbased on expert opinion only. A more detailed assessment—SoilDegradation in South and Southeast Asia—also relied heavily onexpert opinion (Middleton and Thomas 1997). A more thorough,measurement-based global follow-up has not been conducted.Additionally, these studies only considered soil degradation andplaced a strong emphasis on erosion, which is extremely hard tomeasure. These studies also formed the basis of the data and mapspresented in the World Atlas of Desertification (Middleton andThomas 1997). A reported 20% of the world’s drylands (exclud-ing hyper-arid areas) suffer from soil degradation, mainly causedby water and wind erosion, which is presented as the prime causefor 87% of the degraded land (Middleton and Thomas 1997; Ol-deman and Van Lynden 1997; Lal 2001a).
The second study with global coverage is that of Dregne andChou (1992), which covers both soil and vegetation degradation.It was based on secondary sources, which they qualified as fol-lows: ‘‘The information base upon which the estimates in thisreport were made is poor. Anecdotal accounts, research reports,travelers’ descriptions, personal opinions, and local experienceprovided most of the evidence for the various estimates.’’ Thisstudy reported that some 70% of the world’s drylands (excludinghyper-arid areas) were suffering from desertification (soil plusvegetation degradation).
Recognizing the lack of adequate data on land degradation,the MA commissioned a desk study (Lepers 2003; Lepers et al.2005) that compiled more-detailed (and sometimes overlapping)regional data sets derived from literature review, erosion models,field assessments, and remote sensing. This study found less alarm-ing levels of land degradation (soil plus vegetation) in the drylands(including hyper-arid regions). Achieving only partial coverage,and in some areas relying on a single data set, it estimated that
BOX 22.2
Desertification as Land Degradation
The UNCCD defines desertification as land degradation in the drylands non-human-induced factors such as rainfall variability and human factors(‘‘ ‘Desertification’ means land degradation in arid, semi-arid and dry sub- such as low labor input. Thus a range of interacting variables that affecthumid areas’’), yet the two terms are often used as if they are distinct (for productivity should be addressed in order to assess land degradation ob-example, ‘‘Land degradation and desertification in desert margins,’’ in Reich jectively and unambiguously.et al. 2000). The UNCCD also defines ‘‘land’’ by its primary productivity Commonly considered degradation processes are vegetation degrada-service (‘‘ ‘land’ means the terrestrial bio-productive system’’) and ‘‘land tion, water and wind erosion, salinization, soil compaction and crusting,degradation’’ as an implicit loss of provision of this service (‘‘ ‘land degrada- and soil nutrient depletion. Pollution, acidification, alkalization, and water-tion’ means reduction or loss . . . of the biological or economic productivity’’). logging are often important locally (Oldeman 1994; Lal 2001a; Dregne 2002).
The definition of biological productivity and economic benefit depends Field experiments, field measurements, field observations, remote sensing,on users’ priorities. Transforming woodland to cropland may decrease and computer modeling are carried out to study these processes. Thebiological productivity and degrade the economic benefit of firewood pro- higher the aggregation level in each of these study approaches, the moreduction, for example, but increase the economic benefit of food produc- problematic each of the methods becomes, either because of upscalingtion. With respect to the mechanisms of land degradation, changes in the issues or because of questionable extrapolations and generalizationsproperties of the land (soil, water, vegetation) do not correspond linearly (Stocking 1987; Scoones and Toulmin 1998; Matthews 2000; Mazzucatoto changes in productivity. Loss of productivity can also be attributed to and Niemeijer 2000b; Lal 2001a; Warren et al. 2001; Dregne 2002).
PAGE 637
only 10% of global drylands were degraded. This includes 17% ofdrylands in Asia degraded, but in the Sahel region in Africa—anarea reported as highly degraded by the Global Assessment (Olde-man et al. 1991) and by Dregne and Chou (1992)—few localitieswith degradation were found. The global number of people wholive on lands determined by Lepers (2003) as degraded is about 20million, much lower than the 117.5 million people living on landsdefined as degraded by GLASOD.
All these assessments have their weaknesses. Due to the poorquality of the information sources, Dregne and Chou’s numbersare most likely an overestimation. For example, they report fig-ures as high as 80–90% for both rangeland and cropland degrada-tion in the drylands of individual countries (such as Kenya andAlgeria). Such high levels are hard to reconcile with data from theFAOSTAT database, which show that over the last 40 years theaverage per hectare yields of major cereals cultivated in Kenyaand Algeria have increased 400–600 kilograms. Most likely thetrue level of degradation lies somewhere between the figures re-ported by GLASOD and those of Lepers (2003). This implies thatthere is medium certainty that some 10–20% of the drylands aresuffering from one or more forms of land degradation. And thelivelihoods of millions of people, whether they actually reside inthe degraded areas or just depend on them, are affected by thisdegradation, including a large portion of the poor in drylands.
Even if the most conservative estimate of 10% is used, how-ever, a total land area of over 6 million square kilometers is af-fected by desertification, an area roughly twice the size of India,the seventh largest country in the world. It should be borne inmind, however, that to determine the true extent of degradationand identify precisely where the problems occur will require amore in-depth follow-up to the three exploratory studies dis-cussed here, combining analysis of satellite data with extensiveground-truthing. (See Box 22.3.) The ongoing Land DegradationAssessment in Drylands project, an international U.N. initiativeto assess the status of land degradation in the drylands, is an appro-priate response to this daring challenge.
22.3.1.2 Land Use, Land Degradation, and the Aridity Gradient
Human populations and land uses change across the aridity gradi-ent. The best way to express the effect of the gradient on drylandpeoples and their land use is through estimating the amount ofwater per capita available in each dryland subtype. As expected,
................. 11432$ CH22 10-11-05 15:05:31 PS
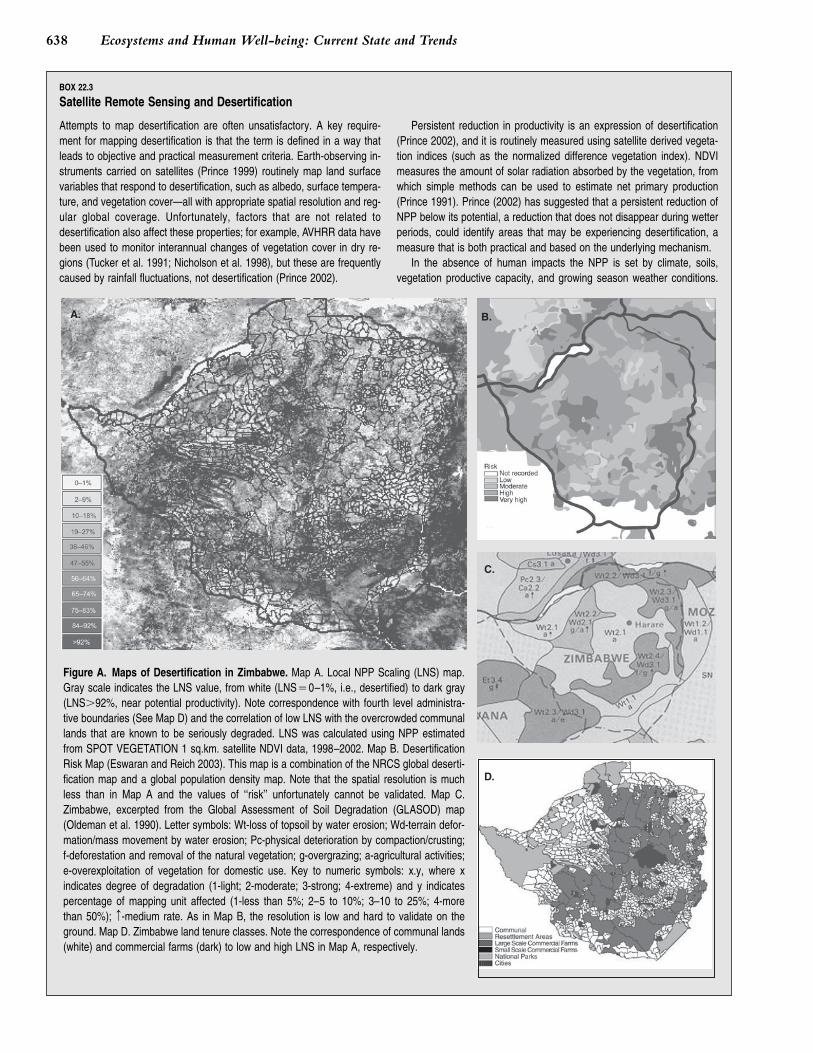
638 Ecosystems and Human Well-being: Current State and Trends
BOX 22.3
Satellite Remote Sensing and Desertification
Attempts to map desertification are often unsatisfactory. A key require- Persistent reduction in productivity is an expression of desertificationment for mapping desertification is that the term is defined in a way that (Prince 2002), and it is routinely measured using satellite derived vegeta-leads to objective and practical measurement criteria. Earth-observing in- tion indices (such as the normalized difference vegetation index). NDVIstruments carried on satellites (Prince 1999) routinely map land surface measures the amount of solar radiation absorbed by the vegetation, fromvariables that respond to desertification, such as albedo, surface tempera- which simple methods can be used to estimate net primary productionture, and vegetation cover—all with appropriate spatial resolution and reg- (Prince 1991). Prince (2002) has suggested that a persistent reduction ofular global coverage. Unfortunately, factors that are not related to NPP below its potential, a reduction that does not disappear during wetterdesertification also affect these properties; for example, AVHRR data have periods, could identify areas that may be experiencing desertification, abeen used to monitor interannual changes of vegetation cover in dry re- measure that is both practical and based on the underlying mechanism.gions (Tucker et al. 1991; Nicholson et al. 1998), but these are frequently In the absence of human impacts the NPP is set by climate, soils,caused by rainfall fluctuations, not desertification (Prince 2002). vegetation productive capacity, and growing season weather conditions.
Figure A. Maps of Desertification in Zimbabwe. Map A. Local NPP Scaling (LNS) map.Gray scale indicates the LNS value, from white (LNS�0–1%, i.e., desertified) to dark gray(LNS�92%, near potential productivity). Note correspondence with fourth level administra-tive boundaries (See Map D) and the correlation of low LNS with the overcrowded communallands that are known to be seriously degraded. LNS was calculated using NPP estimatedfrom SPOT VEGETATION 1 sq.km. satellite NDVI data, 1998–2002. Map B. DesertificationRisk Map (Eswaran and Reich 2003). This map is a combination of the NRCS global deserti-fication map and a global population density map. Note that the spatial resolution is muchless than in Map A and the values of ‘‘risk’’ unfortunately cannot be validated. Map C.Zimbabwe, excerpted from the Global Assessment of Soil Degradation (GLASOD) map(Oldeman et al. 1990). Letter symbols: Wt-loss of topsoil by water erosion; Wd-terrain defor-mation/mass movement by water erosion; Pc-physical deterioration by compaction/crusting;f-deforestation and removal of the natural vegetation; g-overgrazing; a-agricultural activities;e-overexploitation of vegetation for domestic use. Key to numeric symbols: x.y, where xindicates degree of degradation (1-light; 2-moderate; 3-strong; 4-extreme) and y indicatespercentage of mapping unit affected (1-less than 5%; 2–5 to 10%; 3–10 to 25%; 4-morethan 50%); X-medium rate. As in Map B, the resolution is low and hard to validate on theground. Map D. Zimbabwe land tenure classes. Note the correspondence of communal lands(white) and commercial farms (dark) to low and high LNS in Map A, respectively.
PAGE 638................. 11432$ CH22 10-11-05 15:05:47 PS
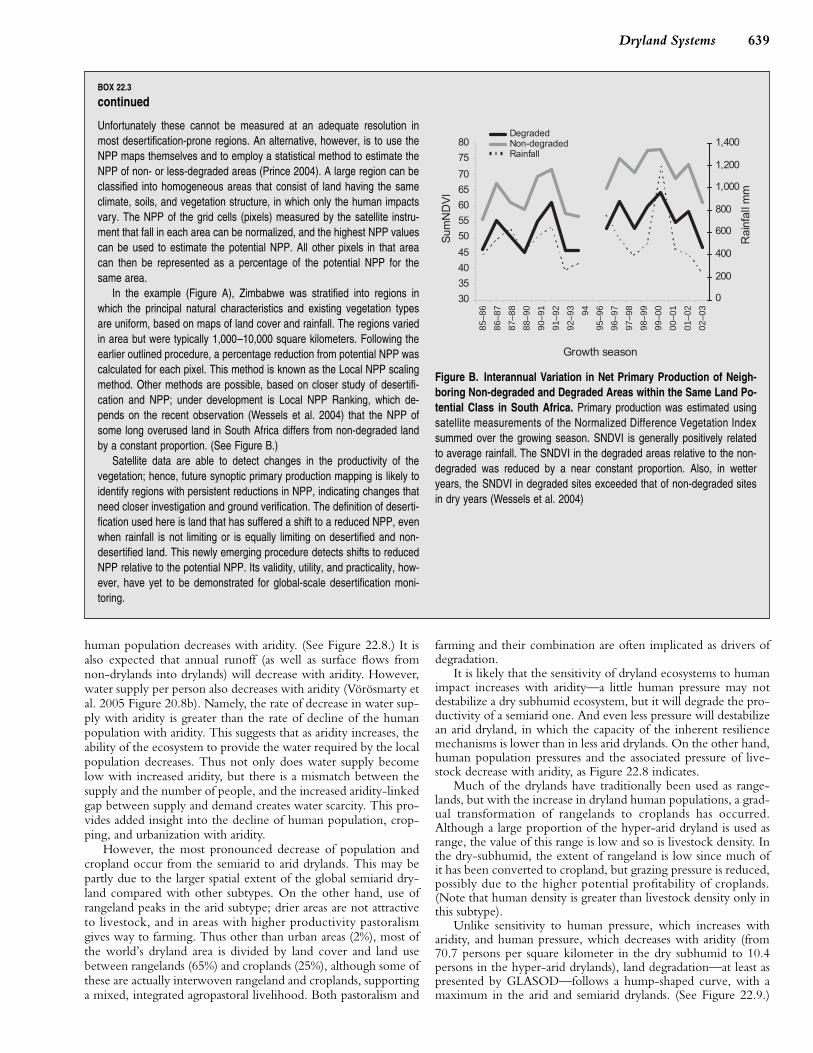
639Dryland Systems
BOX 22.3
continued
Unfortunately these cannot be measured at an adequate resolution inmost desertification-prone regions. An alternative, however, is to use theNPP maps themselves and to employ a statistical method to estimate theNPP of non- or less-degraded areas (Prince 2004). A large region can beclassified into homogeneous areas that consist of land having the sameclimate, soils, and vegetation structure, in which only the human impactsvary. The NPP of the grid cells (pixels) measured by the satellite instru-ment that fall in each area can be normalized, and the highest NPP valuescan be used to estimate the potential NPP. All other pixels in that areacan then be represented as a percentage of the potential NPP for thesame area.
In the example (Figure A), Zimbabwe was stratified into regions inwhich the principal natural characteristics and existing vegetation typesare uniform, based on maps of land cover and rainfall. The regions variedin area but were typically 1,000–10,000 square kilometers. Following the
85–8
6
86–8
7
87–8
8
88–9
0
90–9
1
91–9
2
92–9
3 94
95–9
6
96–9
7
97–9
8
98–9
9
99–0
0
00–0
1
01–0
2
02–0
3
earlier outlined procedure, a percentage reduction from potential NPP wascalculated for each pixel. This method is known as the Local NPP scaling
Figure B. Interannual Variation in Net Primary Production of Neigh-method. Other methods are possible, based on closer study of desertifi-
boring Non-degraded and Degraded Areas within the Same Land Po-cation and NPP; under development is Local NPP Ranking, which de-
tential Class in South Africa. Primary production was estimated usingpends on the recent observation (Wessels et al. 2004) that the NPP of
satellite measurements of the Normalized Difference Vegetation Indexsome long overused land in South Africa differs from non-degraded land
summed over the growing season. SNDVI is generally positively relatedby a constant proportion. (See Figure B.)
to average rainfall. The SNDVI in the degraded areas relative to the non-Satellite data are able to detect changes in the productivity of the
degraded was reduced by a near constant proportion. Also, in wettervegetation; hence, future synoptic primary production mapping is likely to
years, the SNDVI in degraded sites exceeded that of non-degraded sitesidentify regions with persistent reductions in NPP, indicating changes that
in dry years (Wessels et al. 2004)need closer investigation and ground verification. The definition of deserti-fication used here is land that has suffered a shift to a reduced NPP, evenwhen rainfall is not limiting or is equally limiting on desertified and non-desertified land. This newly emerging procedure detects shifts to reducedNPP relative to the potential NPP. Its validity, utility, and practicality, how-ever, have yet to be demonstrated for global-scale desertification moni-toring.
human population decreases with aridity. (See Figure 22.8.) It isalso expected that annual runoff (as well as surface flows fromnon-drylands into drylands) will decrease with aridity. However,water supply per person also decreases with aridity (Vorosmarty etal. 2005 Figure 20.8b). Namely, the rate of decrease in water sup-ply with aridity is greater than the rate of decline of the humanpopulation with aridity. This suggests that as aridity increases, theability of the ecosystem to provide the water required by the localpopulation decreases. Thus not only does water supply becomelow with increased aridity, but there is a mismatch between thesupply and the number of people, and the increased aridity-linkedgap between supply and demand creates water scarcity. This pro-vides added insight into the decline of human population, crop-ping, and urbanization with aridity.
However, the most pronounced decrease of population andcropland occur from the semiarid to arid drylands. This may bepartly due to the larger spatial extent of the global semiarid dry-land compared with other subtypes. On the other hand, use ofrangeland peaks in the arid subtype; drier areas are not attractiveto livestock, and in areas with higher productivity pastoralismgives way to farming. Thus other than urban areas (2%), most ofthe world’s dryland area is divided by land cover and land usebetween rangelands (65%) and croplands (25%), although some ofthese are actually interwoven rangeland and croplands, supportinga mixed, integrated agropastoral livelihood. Both pastoralism and
PAGE 639
farming and their combination are often implicated as drivers ofdegradation.
It is likely that the sensitivity of dryland ecosystems to humanimpact increases with aridity—a little human pressure may notdestabilize a dry subhumid ecosystem, but it will degrade the pro-ductivity of a semiarid one. And even less pressure will destabilizean arid dryland, in which the capacity of the inherent resiliencemechanisms is lower than in less arid drylands. On the other hand,human population pressures and the associated pressure of live-stock decrease with aridity, as Figure 22.8 indicates.
Much of the drylands have traditionally been used as range-lands, but with the increase in dryland human populations, a grad-ual transformation of rangelands to croplands has occurred.Although a large proportion of the hyper-arid dryland is used asrange, the value of this range is low and so is livestock density. Inthe dry-subhumid, the extent of rangeland is low since much ofit has been converted to cropland, but grazing pressure is reduced,possibly due to the higher potential profitability of croplands.(Note that human density is greater than livestock density only inthis subtype).
Unlike sensitivity to human pressure, which increases witharidity, and human pressure, which decreases with aridity (from70.7 persons per square kilometer in the dry subhumid to 10.4persons in the hyper-arid drylands), land degradation—at least aspresented by GLASOD—follows a hump-shaped curve, with amaximum in the arid and semiarid drylands. (See Figure 22.9.)
................. 11432$ CH22 10-11-05 15:05:49 PS
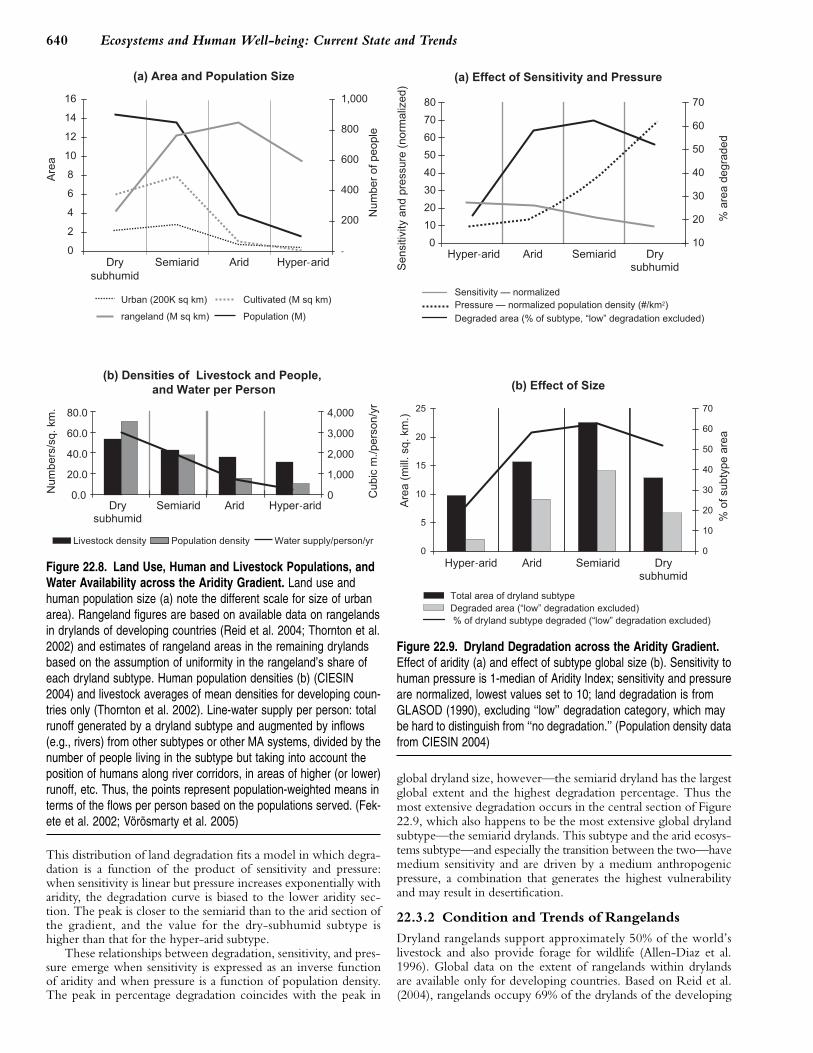
640 Ecosystems and Human Well-being: Current State and Trends
-
-
Figure 22.8. Land Use, Human and Livestock Populations, andWater Availability across the Aridity Gradient. Land use andhuman population size (a) note the different scale for size of urbanarea). Rangeland figures are based on available data on rangelandsin drylands of developing countries (Reid et al. 2004; Thornton et al.2002) and estimates of rangeland areas in the remaining drylandsbased on the assumption of uniformity in the rangeland’s share ofeach dryland subtype. Human population densities (b) (CIESIN2004) and livestock averages of mean densities for developing coun-tries only (Thornton et al. 2002). Line-water supply per person: totalrunoff generated by a dryland subtype and augmented by inflows(e.g., rivers) from other subtypes or other MA systems, divided by thenumber of people living in the subtype but taking into account theposition of humans along river corridors, in areas of higher (or lower)runoff, etc. Thus, the points represent population-weighted means interms of the flows per person based on the populations served. (Fek-ete et al. 2002; Vorosmarty et al. 2005)
This distribution of land degradation fits a model in which degra-dation is a function of the product of sensitivity and pressure:when sensitivity is linear but pressure increases exponentially witharidity, the degradation curve is biased to the lower aridity sec-tion. The peak is closer to the semiarid than to the arid section ofthe gradient, and the value for the dry-subhumid subtype ishigher than that for the hyper-arid subtype.
These relationships between degradation, sensitivity, and pres-sure emerge when sensitivity is expressed as an inverse functionof aridity and when pressure is a function of population density.The peak in percentage degradation coincides with the peak in
PAGE 640
-
-
Figure 22.9. Dryland Degradation across the Aridity Gradient.Effect of aridity (a) and effect of subtype global size (b). Sensitivity tohuman pressure is 1-median of Aridity Index; sensitivity and pressureare normalized, lowest values set to 10; land degradation is fromGLASOD (1990), excluding ‘‘low’’ degradation category, which maybe hard to distinguish from ‘‘no degradation.’’ (Population density datafrom CIESIN 2004)
global dryland size, however—the semiarid dryland has the largestglobal extent and the highest degradation percentage. Thus themost extensive degradation occurs in the central section of Figure22.9, which also happens to be the most extensive global drylandsubtype—the semiarid drylands. This subtype and the arid ecosys-tems subtype—and especially the transition between the two—havemedium sensitivity and are driven by a medium anthropogenicpressure, a combination that generates the highest vulnerabilityand may result in desertification.
22.3.2 Condition and Trends of Rangelands
Dryland rangelands support approximately 50% of the world’slivestock and also provide forage for wildlife (Allen-Diaz et al.1996). Global data on the extent of rangelands within drylandsare available only for developing countries. Based on Reid et al.(2004), rangelands occupy 69% of the drylands of the developing
................. 11432$ CH22 10-11-05 15:05:54 PS
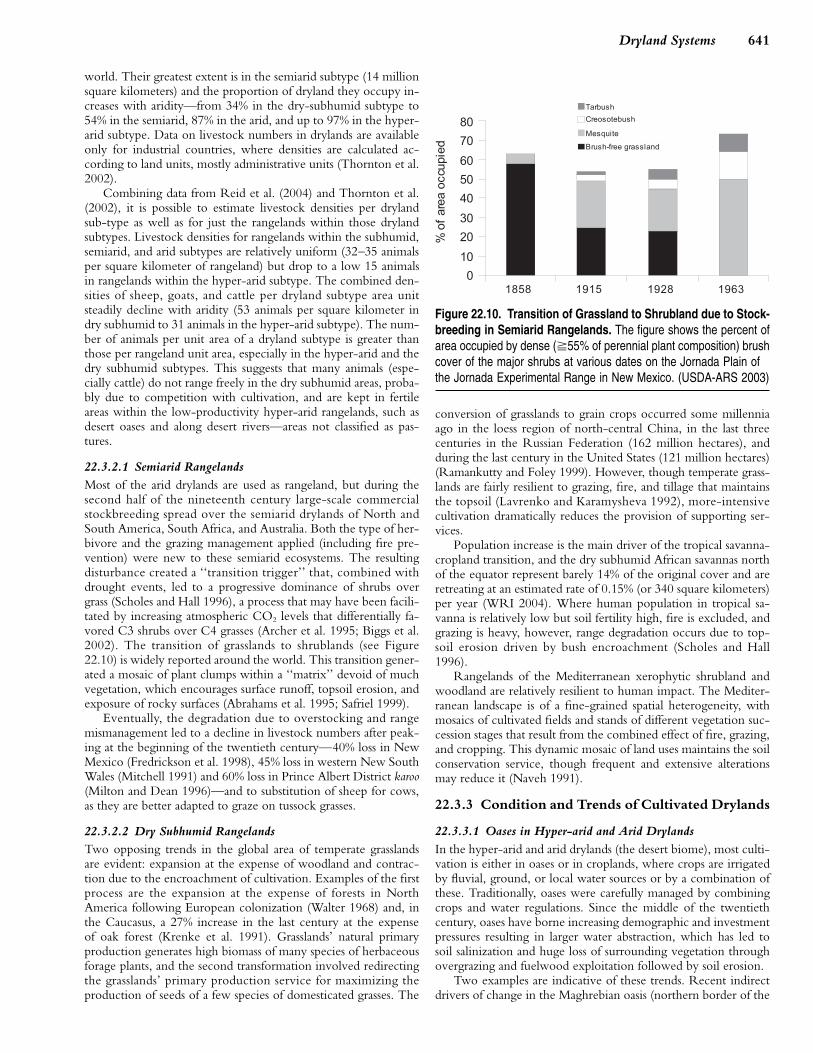
641Dryland Systems
world. Their greatest extent is in the semiarid subtype (14 millionsquare kilometers) and the proportion of dryland they occupy in-creases with aridity—from 34% in the dry-subhumid subtype to54% in the semiarid, 87% in the arid, and up to 97% in the hyper-arid subtype. Data on livestock numbers in drylands are availableonly for industrial countries, where densities are calculated ac-cording to land units, mostly administrative units (Thornton et al.2002).
Combining data from Reid et al. (2004) and Thornton et al.(2002), it is possible to estimate livestock densities per drylandsub-type as well as for just the rangelands within those drylandsubtypes. Livestock densities for rangelands within the subhumid,semiarid, and arid subtypes are relatively uniform (32–35 animalsper square kilometer of rangeland) but drop to a low 15 animalsin rangelands within the hyper-arid subtype. The combined den-sities of sheep, goats, and cattle per dryland subtype area unitsteadily decline with aridity (53 animals per square kilometer indry subhumid to 31 animals in the hyper-arid subtype). The num-ber of animals per unit area of a dryland subtype is greater thanthose per rangeland unit area, especially in the hyper-arid and thedry subhumid subtypes. This suggests that many animals (espe-cially cattle) do not range freely in the dry subhumid areas, proba-bly due to competition with cultivation, and are kept in fertileareas within the low-productivity hyper-arid rangelands, such asdesert oases and along desert rivers—areas not classified as pas-tures.
22.3.2.1 Semiarid RangelandsMost of the arid drylands are used as rangeland, but during thesecond half of the nineteenth century large-scale commercialstockbreeding spread over the semiarid drylands of North andSouth America, South Africa, and Australia. Both the type of her-bivore and the grazing management applied (including fire pre-vention) were new to these semiarid ecosystems. The resultingdisturbance created a ‘‘transition trigger’’ that, combined withdrought events, led to a progressive dominance of shrubs overgrass (Scholes and Hall 1996), a process that may have been facili-tated by increasing atmospheric CO2 levels that differentially fa-vored C3 shrubs over C4 grasses (Archer et al. 1995; Biggs et al.2002). The transition of grasslands to shrublands (see Figure22.10) is widely reported around the world. This transition gener-ated a mosaic of plant clumps within a ‘‘matrix’’ devoid of muchvegetation, which encourages surface runoff, topsoil erosion, andexposure of rocky surfaces (Abrahams et al. 1995; Safriel 1999).
Eventually, the degradation due to overstocking and rangemismanagement led to a decline in livestock numbers after peak-ing at the beginning of the twentieth century—40% loss in NewMexico (Fredrickson et al. 1998), 45% loss in western New SouthWales (Mitchell 1991) and 60% loss in Prince Albert District karoo(Milton and Dean 1996)—and to substitution of sheep for cows,as they are better adapted to graze on tussock grasses.
22.3.2.2 Dry Subhumid RangelandsTwo opposing trends in the global area of temperate grasslandsare evident: expansion at the expense of woodland and contrac-tion due to the encroachment of cultivation. Examples of the firstprocess are the expansion at the expense of forests in NorthAmerica following European colonization (Walter 1968) and, inthe Caucasus, a 27% increase in the last century at the expenseof oak forest (Krenke et al. 1991). Grasslands’ natural primaryproduction generates high biomass of many species of herbaceousforage plants, and the second transformation involved redirectingthe grasslands’ primary production service for maximizing theproduction of seeds of a few species of domesticated grasses. The
PAGE 641
Figure 22.10. Transition of Grassland to Shrubland due to Stock-breeding in Semiarid Rangelands. The figure shows the percent ofarea occupied by dense (�55% of perennial plant composition) brushcover of the major shrubs at various dates on the Jornada Plain ofthe Jornada Experimental Range in New Mexico. (USDA-ARS 2003)
conversion of grasslands to grain crops occurred some millenniaago in the loess region of north-central China, in the last threecenturies in the Russian Federation (162 million hectares), andduring the last century in the United States (121 million hectares)(Ramankutty and Foley 1999). However, though temperate grass-lands are fairly resilient to grazing, fire, and tillage that maintainsthe topsoil (Lavrenko and Karamysheva 1992), more-intensivecultivation dramatically reduces the provision of supporting ser-vices.
Population increase is the main driver of the tropical savanna-cropland transition, and the dry subhumid African savannas northof the equator represent barely 14% of the original cover and areretreating at an estimated rate of 0.15% (or 340 square kilometers)per year (WRI 2004). Where human population in tropical sa-vanna is relatively low but soil fertility high, fire is excluded, andgrazing is heavy, however, range degradation occurs due to top-soil erosion driven by bush encroachment (Scholes and Hall1996).
Rangelands of the Mediterranean xerophytic shrubland andwoodland are relatively resilient to human impact. The Mediter-ranean landscape is of a fine-grained spatial heterogeneity, withmosaics of cultivated fields and stands of different vegetation suc-cession stages that result from the combined effect of fire, grazing,and cropping. This dynamic mosaic of land uses maintains the soilconservation service, though frequent and extensive alterationsmay reduce it (Naveh 1991).
22.3.3 Condition and Trends of Cultivated Drylands
22.3.3.1 Oases in Hyper-arid and Arid DrylandsIn the hyper-arid and arid drylands (the desert biome), most culti-vation is either in oases or in croplands, where crops are irrigatedby fluvial, ground, or local water sources or by a combination ofthese. Traditionally, oases were carefully managed by combiningcrops and water regulations. Since the middle of the twentiethcentury, oases have borne increasing demographic and investmentpressures resulting in larger water abstraction, which has led tosoil salinization and huge loss of surrounding vegetation throughovergrazing and fuelwood exploitation followed by soil erosion.
Two examples are indicative of these trends. Recent indirectdrivers of change in the Maghrebian oasis (northern border of the
................. 11432$ CH22 10-11-05 15:05:56 PS
642 Ecosystems and Human Well-being: Current State and Trends
Sahara) have been population increase, policies to settle nomadicpopulations, investments generated by migrants working abroad,and transformation of self-sufficiency to open-market economiesin countries of the Maghreb. The expansion of cultivated areasirrigated by water from deep aquifers and a lack of drainage (deHaas et al. 2001) led to spreading shallow water tables and subse-quent soil salinization (Mtimet and Hachicha 1995). In the Niledelta, traditional water management of the summer flood kept thewater table at 5–7 meters below the surface during the low flowseason. But nineteenth- and twentieth-century water manage-ment policies and practices, including construction of the Aswandam, enabled year-round irrigation and the growth of out-of-season crops, such as cotton. These reduced the water table depth,however, resulting in soil salinization and a dramatic decline incrop yield (Ruf 1995).
22.3.3.2 Semiarid and Dry Subhumid Agriculture
Where massive agricultural encroachment into temperate grass-lands has occurred, and where drylands are exposed to freezingand thawing and suffer a relatively high recurrence of droughtand strong winds, topsoil is at risk of being lost and with it all theprovisioning services. This happened in the Chinese loess plateausouth of the Yellow River bend millennia ago and in NorthAmerican central plains in the first quarter of the twentieth cen-tury. Once the topsoil is lost to wind, the underlying layers—richin calcium carbonate and poor in organic matter—develop cruststhat impede infiltration and foster further soil loss through gullyerosion (Mainguet 1996). In the United States, temperate grass-land soils can lose up to 50% of their original carbon within thefirst 50 years of cultivation (Conner et al. 2002). In parallel tocarbon loss, conversion of grasslands to croplands can result inloss of fertility, increased soil erosion, and decreased water qualitythrough larger sedimentation and non-point chemical pollutionby salts, nutrients, and pesticides.
When agricultural encroachment of tropical savannas occurs,there is a risk of soil impoverishment through erosion and nutri-ent depletion (Stoorvogel and Smaling 1990; Drechsel et al. 2001)unless nutrients and water are carefully managed. Subsequent ero-sion may leave the subsurface soil horizon with its limited waterinfiltration capacity exposed, resulting in further soil loss by gullyerosion. However, if land husbandry practices are properly ad-justed, the increased crop production required to meet a growingpopulation does not necessarily have to lead to nutrient depletion(Scoones 2001; Niemeijer and Mazzucato 2002; Mortimore andHarris 2004).
The long, traditional agricultural use of Mediterranean shrub-lands and woodlands in the Mediterranean basin has preventedsoil loss through sophisticated terrace systems used across hillslopes. But the pulse of rural population increase that started atthe end of the nineteenth century occurred too fast to allowwidespread land conditioning, and it triggered extensive soillosses. The outcome was large upstream areas of exposed rock(Roquero 1990) and accretion pulses in river deltas (Hoffmann1988).
22.3.4 Condition and Trends of AlternativeLivelihoods
Rather than grappling with drylands’ low biological productivity,dryland peoples have explored ways to exploit other ecosystemfunctions that can serve them better, even better than if they ex-ploited the same functions in non-drylands. Such emerging ‘‘al-ternative livelihoods’’ do not depend on traditional land uses andare generally undemanding on land and natural resource use. Al-
PAGE 642
ternative livelihoods have minimal dependence on land primaryproductivity for producing subsistence products; do not impairthe provision of other services of dryland ecosystems; generatemore income per investment from local dryland resources, com-pared with the traditional, land biological production-dependentlivelihoods; and provide people with a competitive edge overothers who follow the same practices outside drylands. Five majoralternative livelihoods are discussed, in order of decreasing depen-dence on land primary productivity and hence decreasing deserti-fication risk and increasing likelihood of sustainability.
22.3.4.1 Dryland Afforestation
Silviculture and rain-fed horticulture are not very common in dry-lands and depend on labor-intensive construction and maintenanceof runoff-harvesting structures (Evenari et al. 1982; Droppelmannet al. 2000). However, dryland silviculture and horticulture pro-vide better soil protection than agriculture because tree canopiesare denser and tree root system deeper and more extensive thanthose of agricultural crops and because trees continue to providesoil conservation after harvest, unlike agricultural crops, wherevery little is left to cover the soil after harvest.
Dryland afforestation for firewood production is a livelihoodthat depends on the biological production service. Unlike grazingor cropping, afforestation provides a superb soil conservation ser-vice for an area greater than that occupied by the forest itselfsince flashfloods are not generated by dryland forests. Drylandafforestation will qualify as an alternative livelihood if it generatesmore income than a traditional dryland land use and, even better,if it can generate more income than non-dryland silviculture.
Carbon sequestration by forests and their contribution toabove- and belowground carbon reserves and the recent emer-gence of ‘‘carbon trading’’ under the Clean Development Mecha-nism may make the required difference. This is because mostnon-dryland ecosystems with good provision of the biologicalproductivity service are already either cultivated or afforested. Onthe other hand, though the global drylands are less efficient thannon-drylands in carbon sequestration, their potential for furthercarbon sequestration is high and has not yet been developed,while non-dryland capacity is already close to the maximum. Ex-periences in Israel have shown that a mean annual addition to thecarbon reserve of drylands of 150 grams of carbon per squaremeter per year is possible, generated mainly during winter (ratherthan during summer in non-drylands), thus storing twice as muchcarbon as the adjacent nonforested rangeland (Gruenzweig et al.2003).
Dryland afforestation only counters desertification in thosecases where it is used as an alternative for unsustainable croppingand grazing practices. It is not a suitable alternative for rangelands,agroforestry systems, and areas under natural plant cover, as theseoffer equal or better protection against desertification. Also, in thecase of degraded croplands, the benefits are quickly lost if treesare watered through irrigation (with its potential for salinizationand water resource depletion) rather than through runoff har-vesting.
22.3.4.2 Controlled Environment’s Cash Crop Agriculture
There are dryland agriculture practices that can qualify as alterna-tive livelihoods by employing plastic covers in agrotechnology.The plastic cover allows nearly full light penetration and at thesame time offers options for locally manipulating many othercrop-relevant environmental factors (Arbel et al. 1990). Thispractice ranges from covering individual rows of low-staturecrops, with no additional intervention and for only a part of the
................. 11432$ CH22 10-11-05 15:05:57 PS
643Dryland Systems
growing season (mainly in the least dry drylands), to coveringplots within ‘‘growth houses’’ or ‘‘greenhouses,’’ within whichseveral of the internal environmental conditions are artificiallymanipulated to the extent that the crop is virtually separated fromthe outer dryland environment (mainly in the driest drylands).The plastic enclosure reduces evapotranspiration and thus maxi-mizes water use efficiency (Pohoryles 2000); it reduces insecticideuse and makes CO2 fertilization feasible.
Often the crops are grown on artificial substrates, with nutri-ents supplied and water provided by irrigation that incorporatesfertilizer application (‘‘fertigation’’), and pollination may be pro-vided by commercially raised and marketed pollinators (BioBee2000). Together these enable intensification of biological produc-tivity while economizing on land resources. This approach usesthe dryland’s abundant incident light and winter warmth, but it isotherwise nearly independent of local ecosystem services. Pro-vided that it does not deplete local water resources and that salin-ity is controlled and not allowed to leach into groundwater, thispractice does not generate desertification.
However, this livelihood requires investment in infrastructure,such as energy for ventilation and cooling, making it more suit-able for industrial countries. The intensification of crop growthgenerates more yield per unit of investment, but the crops needto have high market value—namely, cash crops. The productionof cash crops in drylands may be more profitable than in the non-drylands, on account of two physical/climatic features of most(but not all) drylands: high irradiation due to relatively infrequentcloud cover and higher ambient winter temperatures relative tothose in the nearest non-dryland areas. Indeed, the gross valueadded and the cash generated per unit area from that part of thehyper-arid dryland of Israel in which intensive greenhouse agri-culture is widely practiced is higher than those of all other typesof Israeli agriculture, including those of the least dry areas of thecountry (Portnov and Safriel 2004).
22.3.4.3 Aquaculture in Drylands
Dryland aquaculture is inherently advantageous to dryland agri-culture because although aquatic organisms live in water they donot transpire it, so water losses from aquaculture are predomi-nately from evaporation rather than raised evapotranspiration.Furthermore, many more aquatic species than terrestrial crop spe-cies are tolerant of salinity and even thrive in it. Thus, drylandaquaculture can prosper on fossil aquifers (quite common in dry-lands) whose high salinity greatly curtails their use by drylandagriculture.
When dryland aquaculture borrows the technology of drylandgreenhouses (as just described), water conservation is even greaterthan it is in agricultural greenhouses due to zero transpiration ofaquatic organisms. At the same time, dryland aquaculture doesnot compete for water with dryland agriculture due to the diver-gent salinity tolerances of terrestrial plants and aquatic organisms(Kolkovsky et al. 2003). Since dryland aquaculture is always moreeconomic on land than dryland agriculture, land use as well aswater use efficiencies are high. Thus dryland aquaculture, likedryland controlled-environment cash crop agriculture, does notdepend on local ecosystem services and need not cause desertifi-cation.
Dryland aquaculture is based on aquatic animals and plants(mostly micro-algae) or some combination of these. The produc-tivity of aquatic animals is not light- and CO2-dependent, hencethe costs of feeding the animals are greater than those of fertilizingthe plants. There is, however, an added cost of water filtrationdue to the enrichment of the water by the surplus organic load of
PAGE 643
animal feed and animal excretions. This cost can be reduced byintegrating animal and plant aquaculture, in which algae thrive onthe animal waste-enriched water, or the enriched water can beused for irrigation of crops. Plant aquaculture is advantageous onanimal aquaculture in that feeding is not required and organicload is not a problem. Also, given that most aquatic plants areeither very small or unicellular, their growth is much faster thanthat of terrestrial plant crops, and the ratio of harvested to nonhar-vested biomass of the crop is much higher than that of terrestrialplants.
Dryland aquaculture of both plants and animals is more advan-tageous than aquaculture elsewhere due to the abundance of lightfor aquatic plants (Richmond 1986) and of winter warmth forboth plants and animals (Kolkovsky et al. 2003). An added benefitis the higher availability and hence the lower price of land indrylands than in non-drylands and the reduced competition withagriculture on land in the drylands. Most of the products of drylandaquaculture are cash crops, such as ornamental fish, high-qualityedible fish and crustaceans, and industrially valuable biochemicalsproduced by micro-algae, such as pigments, food additives, healthfood supplements, and pharmaceutical products.
22.3.4.4 Urban Livelihoods
Though ‘‘dryland development’’ and ‘‘rural development’’ areoften used synonymously, dryland cities as an alternative to dry-land villages may be a sustainable option for settling more peoplein drylands because the cities consume, and hence affect, fewerland resources than dryland farming and pastoral livelihoods do.However, this depends on the potential of dryland cities to pro-vide livelihoods as well as living conditions that are advantageouscompared with those provided by other cities.
A combination of appropriate building materials, architecturaldesign (Etzion et al. 1999), and urban planning (Pearlmutter andBerliner 1999) can provide living conditions in drylands that areas comfortable as and much cheaper than those provided by non-dryland cities. This is because drylands are endowed with twoclimatic features that are highly conducive to ‘‘passive’’ (energy-saving) climate control. The very low air humidity in the driestdrylands makes summer evaporative cooling very efficient andcost-effective, and the low dryland cloud overcast means that solarradiation (aided by appropriate positioning, dimensions, and tech-nological design of glass windows) provides efficient and cost-effective winter warming (Etzion and Erell 2000).
Thus the use of fossil fuels for cooling, and of fossil or biomassfuels for warming, can be much lower in driest dryland cities thanelsewhere. Furthermore, fossil fuels can be nearly completely re-placed by solar energy-generated power (Faiman 1998) due tothe high year-round intense solar radiation coupled with the lowovercast of many drylands. Given the potential (though rarely re-alized) advantages of living in dryland cities and their relativelylow impact on dryland services, a policy of encouraging urbanlivelihoods in appropriately designed and functioning drylandcities could significantly contribute to sustainable dryland man-agement. Dryland tourism may be one such livelihood.
22.3.4.5 Dryland Tourism
Dryland tourism is driven by the increasing affluence, free time,and mobility of a relatively large segment of the global populationcoupled with the growing craving for uncongested, unpolluted,pastoral, pristine landscapes. Drylands offer many unique scenic,wildlife, biodiversity, historical, cultural, and spiritual services.Hence employment in the tourist industry may become an in-
................. 11432$ CH22 10-11-05 15:05:58 PS
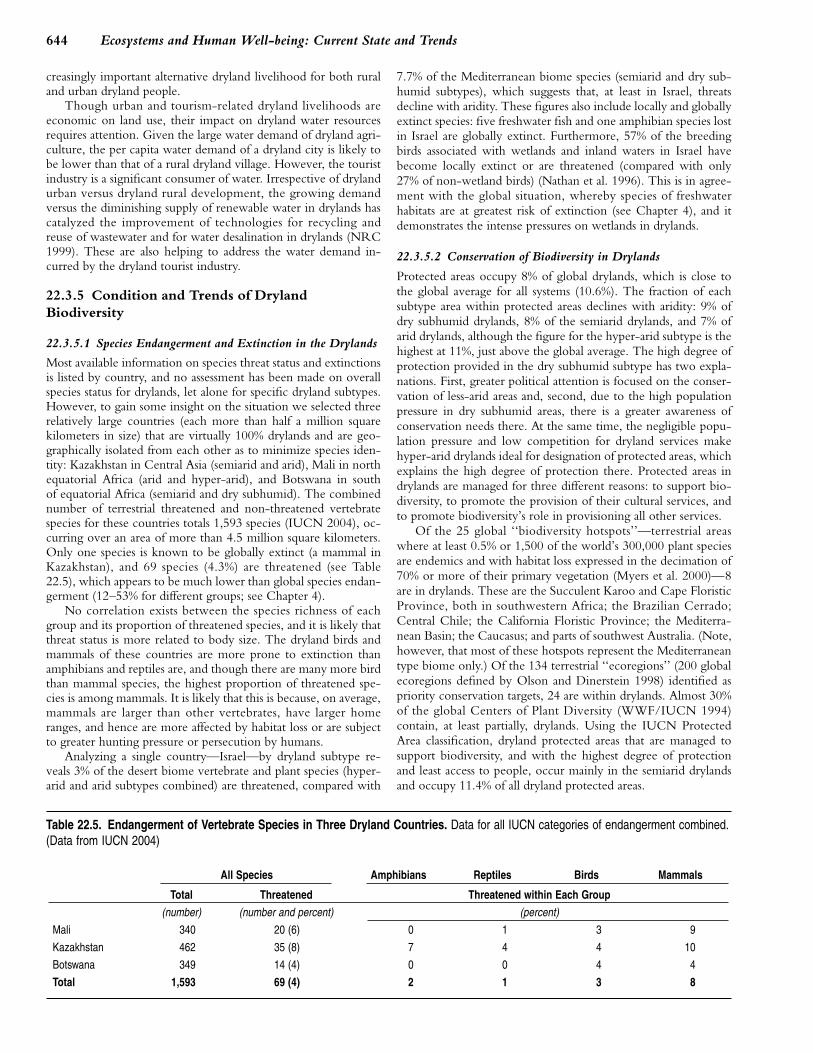
644 Ecosystems and Human Well-being: Current State and Trends
creasingly important alternative dryland livelihood for both ruraland urban dryland people.
Though urban and tourism-related dryland livelihoods areeconomic on land use, their impact on dryland water resourcesrequires attention. Given the large water demand of dryland agri-culture, the per capita water demand of a dryland city is likely tobe lower than that of a rural dryland village. However, the touristindustry is a significant consumer of water. Irrespective of drylandurban versus dryland rural development, the growing demandversus the diminishing supply of renewable water in drylands hascatalyzed the improvement of technologies for recycling andreuse of wastewater and for water desalination in drylands (NRC1999). These are also helping to address the water demand in-curred by the dryland tourist industry.
22.3.5 Condition and Trends of DrylandBiodiversity
22.3.5.1 Species Endangerment and Extinction in the Drylands
Most available information on species threat status and extinctionsis listed by country, and no assessment has been made on overallspecies status for drylands, let alone for specific dryland subtypes.However, to gain some insight on the situation we selected threerelatively large countries (each more than half a million squarekilometers in size) that are virtually 100% drylands and are geo-graphically isolated from each other as to minimize species iden-tity: Kazakhstan in Central Asia (semiarid and arid), Mali in northequatorial Africa (arid and hyper-arid), and Botswana in southof equatorial Africa (semiarid and dry subhumid). The combinednumber of terrestrial threatened and non-threatened vertebratespecies for these countries totals 1,593 species (IUCN 2004), oc-curring over an area of more than 4.5 million square kilometers.Only one species is known to be globally extinct (a mammal inKazakhstan), and 69 species (4.3%) are threatened (see Table22.5), which appears to be much lower than global species endan-germent (12–53% for different groups; see Chapter 4).
No correlation exists between the species richness of eachgroup and its proportion of threatened species, and it is likely thatthreat status is more related to body size. The dryland birds andmammals of these countries are more prone to extinction thanamphibians and reptiles are, and though there are many more birdthan mammal species, the highest proportion of threatened spe-cies is among mammals. It is likely that this is because, on average,mammals are larger than other vertebrates, have larger homeranges, and hence are more affected by habitat loss or are subjectto greater hunting pressure or persecution by humans.
Analyzing a single country—Israel—by dryland subtype re-veals 3% of the desert biome vertebrate and plant species (hyper-arid and arid subtypes combined) are threatened, compared with
Table 22.5. Endangerment of Vertebrate Species in Three Dryland Countries. Data for all IUCN categories of endangerment combined.(Data from IUCN 2004)
All Species Amphibians Reptiles Birds Mammals
Total Threatened Threatened within Each Group(number) (number and percent) (percent)
Mali 340 20 (6) 0 1 3 9
Kazakhstan 462 35 (8) 7 4 4 10
Botswana 349 14 (4) 0 0 4 4
Total 1,593 69 (4) 2 1 3 8
PAGE 644
7.7% of the Mediterranean biome species (semiarid and dry sub-humid subtypes), which suggests that, at least in Israel, threatsdecline with aridity. These figures also include locally and globallyextinct species: five freshwater fish and one amphibian species lostin Israel are globally extinct. Furthermore, 57% of the breedingbirds associated with wetlands and inland waters in Israel havebecome locally extinct or are threatened (compared with only27% of non-wetland birds) (Nathan et al. 1996). This is in agree-ment with the global situation, whereby species of freshwaterhabitats are at greatest risk of extinction (see Chapter 4), and itdemonstrates the intense pressures on wetlands in drylands.
22.3.5.2 Conservation of Biodiversity in Drylands
Protected areas occupy 8% of global drylands, which is close tothe global average for all systems (10.6%). The fraction of eachsubtype area within protected areas declines with aridity: 9% ofdry subhumid drylands, 8% of the semiarid drylands, and 7% ofarid drylands, although the figure for the hyper-arid subtype is thehighest at 11%, just above the global average. The high degree ofprotection provided in the dry subhumid subtype has two expla-nations. First, greater political attention is focused on the conser-vation of less-arid areas and, second, due to the high populationpressure in dry subhumid areas, there is a greater awareness ofconservation needs there. At the same time, the negligible popu-lation pressure and low competition for dryland services makehyper-arid drylands ideal for designation of protected areas, whichexplains the high degree of protection there. Protected areas indrylands are managed for three different reasons: to support bio-diversity, to promote the provision of their cultural services, andto promote biodiversity’s role in provisioning all other services.
Of the 25 global ‘‘biodiversity hotspots’’—terrestrial areaswhere at least 0.5% or 1,500 of the world’s 300,000 plant speciesare endemics and with habitat loss expressed in the decimation of70% or more of their primary vegetation (Myers et al. 2000)—8are in drylands. These are the Succulent Karoo and Cape FloristicProvince, both in southwestern Africa; the Brazilian Cerrado;Central Chile; the California Floristic Province; the Mediterra-nean Basin; the Caucasus; and parts of southwest Australia. (Note,however, that most of these hotspots represent the Mediterraneantype biome only.) Of the 134 terrestrial ‘‘ecoregions’’ (200 globalecoregions defined by Olson and Dinerstein 1998) identified aspriority conservation targets, 24 are within drylands. Almost 30%of the global Centers of Plant Diversity (WWF/IUCN 1994)contain, at least partially, drylands. Using the IUCN ProtectedArea classification, dryland protected areas that are managed tosupport biodiversity, and with the highest degree of protectionand least access to people, occur mainly in the semiarid drylandsand occupy 11.4% of all dryland protected areas.
................. 11432$ CH22 10-11-05 15:05:59 PS
645Dryland Systems
In protected areas maintained primarily for the provision ofcultural services, human exploitation and occupation are re-stricted, but visitors are welcome and tourism is encouraged andhence they offer potential economic benefits to local people. Intotal, these account for 44.7% of all dryland protected areas com-bined and are most common in the arid subtype. Many of theseare national parks or (officially non-protected) private game farms,which provide many of the same cultural services. In many of thenational and private parks, especially in Africa, management isgeared to maximizing the number of large game species for visi-tors, which may lead to trampling and overgrazing due to over-population of game.
It is increasingly difficult to set aside formally protected areasthat largely exclude human populations, especially in drylandcountries with high poverty levels. In some regions, historicallyprotected areas have been associated with oppressive political re-gimes and the exclusion of local inhabitants, where wildlife con-servation goals have been put ahead of human needs. This imageof protected area use has been challenged over the past decade,especially through increased efforts to promote community-basednatural resource management. Protected areas managed for theirprovisioning services, which allow for controlled exploitation ofecosystem goods, account for 43.9% of dryland protected areasand are most common in the semiarid drylands.
22.4 Drivers of Change
22.4.1 Conceptual Framework of Dryland Drivers:The Desertification Paradigm and Its Counterpart
The overarching change in drylands is land degradation definedas a persistent decrease in provisioning of ecosystem services—alsofrequently termed desertification, as described earlier. A numberof phenomena are tied in through various links, interactions, andfeedbacks, which jointly make up the ‘‘desertification paradigm.’’This section assesses the validity of the desertification paradigm bypresenting the relevant direct and indirect drivers, including bothbiophysical and socioeconomic drivers. More-recent research hasled to the development of an alternative ‘‘counter-paradigm’’concerning drylands processes; this approach identifies interven-tions that prevent the occurrence of desertification. Between thetwo paradigms there is general agreement on the role of the directbiophysical drivers discussed in the next section. Where thecommon ‘‘desertification paradigm’’ and the emerging ‘‘counter-paradigm’’ differ is in the proposed role of indirect drivers. Thisis the subject of the subsequent two sections.
22.4.1.1 Direct Bioclimatic DriversThe relatively low productivity and low soil moisture content ofdrylands are often exacerbated by the uni-modal pattern of rain-fall, resulting in a long period during which soil moisture falls.Low and infrequent precipitation patterns and radiation-inducedevaporation jointly and directly drive a linear sequence of bio-physical processes. In this cycle, low soil moisture leads to lowplant productivity, poor soil development, and high runoff, re-sulting in a high susceptibility of drylands to soil erosion.
The same two bioclimatic factors that are drivers of vulnera-bility to erosion are also drivers of vulnerability to salinization.Low rainfall does not leach the surface salts into deeper soil layers,down below the root zone of plants, hence the dryland topsoil isvulnerable to salinization. These natural conditions make drylandecosystems vulnerable to land degradation, while both droughtand human activities can further exacerbate existing vulnerabili-ties.
PAGE 645
22.4.1.2 The Desertification ParadigmThe desertification paradigm holds that bioclimatic drivers andanthropogenic drivers that traditionally maintain dryland ecosys-tems in a stable state become drivers of change, pushing the transi-tion from sustainable exploitation of ecosystem goods and servicesto a new ecosystem state of much lower level of service provision.Extremes of direct bioclimatic drivers, rainfall fluctuations leadingto droughts, and extensive, intensive, and frequent fires, whencoupled with indirect anthropogenic drivers, jointly becomedrivers of change that through an intricate chain of processes leadto a downward spiral of productivity ending in irreversible landdegradation—that is, desertification.
Human population growth in drylands, which increased18.5% between 1990 and 2000, has been the highest of any MAsystem (CIESIN 2004). Increased aspirations for raised standardsof living are driving an increase in the exploitation of ecosystemservices, often accompanied by an increased use of labor and newtechnologies. This is expressed as a proliferation of livestock andexpansion of agriculture and through the adoption of intensivefarming practices. The adverse impacts are further amplified whenintensification of human activities coincides with droughts, whichtemporarily but drastically reduce soil and plant productivity.
Cropland in drylands has lower productivity than ‘‘wetter’’croplands. Farmers attempt to address this through supplementssuch as additional water, fertilizers, and pesticides. If they cannotafford these, rain-fed dryland croplands are left fallow, but landshortages reduce fallow length, often leaving the land insufficienttime to recover. Irrigation increases productivity, maintains vege-tation cover, and helps protect soil from erosion. However, dry-land irrigation accelerates soil salinization due to the often highsalinity of available irrigation water and high evaporation. Salini-zation in croplands directly affects plant growth, dramatically im-pairing the provision of the soil’s productivity service. Over time,soil erosion and salinization reduce productivity to the pointwhere cropland has to be abandoned. In a similar way, rangelandsmay be degraded due to overgrazing.
The indirect anthropogenic drivers of change in drylands arediverse and act on several scales. They include demographic driv-ers, such as local population growth or immigration resultingfrom regional population growth; economic drivers, such as localand global market trends; and sociopolitical drivers, such as localand regional land tenure policies as well as scientific and techno-logical innovations and transfer. According to the desertificationparadigm, these combined drivers intensify pressure on drylands(in areas already in use and ‘‘virgin’’ territory) in anticipation ofincreased provision of ecosystem services. However, this pressurefor increased productivity frequently fails and, worse, can lead todecreased productivity.
The impact of reduced land productivity is manifest throughreduced income, malnutrition, and poor health, culminating infamine and increased mortality rates. People frequently abandondegraded land in order to avoid this impact and either intensifythe use of other intact but lower-quality land or transform morerangeland to cropland, practices that may delay but not avoid fur-ther land degradation. Since alternative livelihood opportunitiesare few, migration from rural to urban areas and transfrontier mi-gration often follows. These migrations often create environmen-tal refugees, a situation that exacerbates poverty and urban sprawland can bring about internal and transboundary social, ethnic, andpolitical strife. These may encourage foreign intervention, whichhas the potential for destabilizing local, regional, and even globalpolitical and economic systems. This chain of processes driven byanthropogenic drivers of change leads to a downward spiral ofproductivity loss and increasing poverty.
................. 11432$ CH22 10-11-05 15:06:00 PS

646 Ecosystems and Human Well-being: Current State and Trends
Furthermore, the paradigm implies that since soil degradationand vegetation degradation are linked to increased aridity as partof a negative feedback loop, desertification is practically irreversible,and its inevitability increases with aridity (Cleaver and Schreiber1994). And since desertification takes place mainly where agricul-ture is the major source of local livelihoods, agricultural practicesare often blamed for desertification and the associated decline inthe provision of ecosystem services and rise of poverty. Finally,the paradigm claims that investments are usually required to makedryland agriculture sustainable, but these are generally in shortsupply due to poverty. Thus poverty is not only a result of deserti-fication but a cause of it.
22.4.1.3 The Counter-paradigm
According to the counter-paradigm, the drivers, processes, andevents described in the desertification paradigm do exist, but thechain of events that leads to desertification and the chain-reactioncycle of reduced ecosystem productivity and poverty are far frominevitable. This section identifies the conceptual weaknesses ofthe desertification paradigm and presents the counter-paradigmapproach.
The ‘‘desertification narrative’’ dates back to the 1920s and1930s, when concerns about a presumed extension of the Saharabegan to be raised and when claims of harmful African farmingpractices coincided with reports about the American ‘‘DustBowl’’ experience (Anderson 1984; Swift 1996). So even beforethe term ‘‘desertification’’ was coined, the narrative or paradigmalready existed (Swift 1996). Although large-scale drought-relatedfamines in drylands are not a new phenomenon (Nicholson1979), however, there has always been a recovery after eachdrought rather than the irreversible collapse implied by the desert-ification paradigm. This suggests that the desertification paradigmdoes not fully describe what is happening on the ground. In par-ticular, as described in this section, there are problems with theknowledge and understanding of dryland systems that form thebasis for the theoretical foundation of the paradigm; the evidencefor degradation on which the paradigm builds; and its assumptionsabout human response to changes in the natural and socioeco-nomic environment.
22.4.1.3.1 Inherent instability of drylands
The desertification paradigm assumes that natural dryland ecosys-tems are in a stable state that can be disrupted by populationgrowth induced by overcultivation and overgrazing leading to adegraded condition of the service of primary production. Basedon this assumption, measured deviations from a theoretical naturalstable state are considered degradation, so human and livestockpopulations above calculated carrying capacities indicate degrada-tion (Leach et al. 1999).
The notion of this ‘‘balance of nature’’ has been increasinglychallenged by twentieth century ecologists, however, and an in-creasing number of studies in the last two decades have shownthat dryland systems exhibit large variability in space and timeand that many of them are far better described in terms of non-equilibrium systems (Ellis and Swift 1988; Behnke et al. 1993;Leach et al. 1999). A lot of this work has focused on Africansavanna systems, but the principles are likely to apply to otherdryland regions. The basic premise is that irregular droughts pre-vent the establishment of a stable equilibrium between plants andlivestock (Ellis and Swift 1988). Droughts, disease, and social up-heaval have had similar disruptive impacts on many dryland farm-ing systems, introducing elements of non-equilibrium systemsthere as well. Misinterpreting these systems as in equilibrium leads
PAGE 646
to an overestimation of land degradation because each (tempo-rary) shift in the balance of vegetation versus human and livestockpopulations is interpreted as a sign of degradation.
22.4.1.3.2 Problems defining and detecting degradation of an unstablesystemRecent remote sensing studies (see Box 22.4), using multiyearanalyses of rain-use efficiencies and vegetation indices, have re-vealed that the widely claimed land degradation in the Sahel mayhave been a temporary phenomenon caused by the droughts ofthe 1980s (Nicholson et al. 1998; Prince et al. 1998; Eklundh andOlsson 2003). In contrast, traditional desertification assessmentshave tended to be simple snapshots in time that have extrapolatedobservations and measured rates of change linearly into the future.To some extent that may be appropriate for equilibrium systemsundergoing a transition, but such linear extrapolations are not jus-tifiable for non-equilibrium systems that undergo continuouschange (Niemeijer 1996).
While the understanding of the basic principles of the individ-ual biophysical processes underlying the desertification paradigmis essentially correct, the methods of assessing and quantifying theprocesses have been problematic. Evidence for degradation hasbeen based on the assessment of vulnerabilities using national, re-gional, and continental soil surveys and models of carrying capac-ity, as well as experimental plot studies, expert opinion, andnutrient balance models. While each method is sound in its ownright, findings cannot simply be extrapolated in time and spaceto map out an essentially dynamic and spatially heterogeneousphenomenon such as desertification (Stocking 1987; Mazzucatoand Niemeijer 2000b; Scoones 2001). To take just one example,erosion, which is rightfully a major concern in the desertificationparadigm, is extremely difficult to measure accurately, let alone toextrapolate to large areas given the high spatial variability of rain-fall, geomorphology, and soils in most dryland environments. Dueto difficulties in measuring and extrapolating wind and water ero-sion accurately, landscape-level erosion figures based on plot mea-surements can lead to overestimation of the actual erosion by afactor of 10 to 100 times (Stocking 1987, 1996; Warren et al.2001).
22.4.1.3.3 Responses to keep ahead of degradationThe desertification paradigm is grounded in simplistic, mechanis-tic thinking about human responses to the dryland environmentand the processes of desertification. This section presents the cruxof the counter-paradigm. An understanding of the dynamism ofhuman responses helps explain why degradation estimates basedon carrying capacity concepts of the desertification paradigm canbe somewhat misleading.
It is important to note that the paradigm has its root in theenvironmental sciences (soil science, agronomy, and to a lesserdegree forestry) and is strongly influenced by Malthusian thinkingon the population-environment nexus. The sciences that dealwith human behavior have been largely ignored; as Swift (1999)noted: ‘‘Soil science has been brilliantly informed by reductionistphysics and chemistry, poorly informed by biology, ecology andgeography and largely uninformed by the social sciences.’’ Thepremise of the desertification paradigm is that land users, in re-sponse to their needs, increase pressure on the land in unsustaina-ble ways, leading to decreasing productivity and a downwardspiral of poverty and further degradation.
However, there is increasing evidence that these negativefeedback loops need not occur. Rather, dryland populations,building on long-term experience with their dynamic environ-ments as well as active innovation, can stay ahead of degradation
................. 11432$ CH22 10-11-05 15:06:00 PS
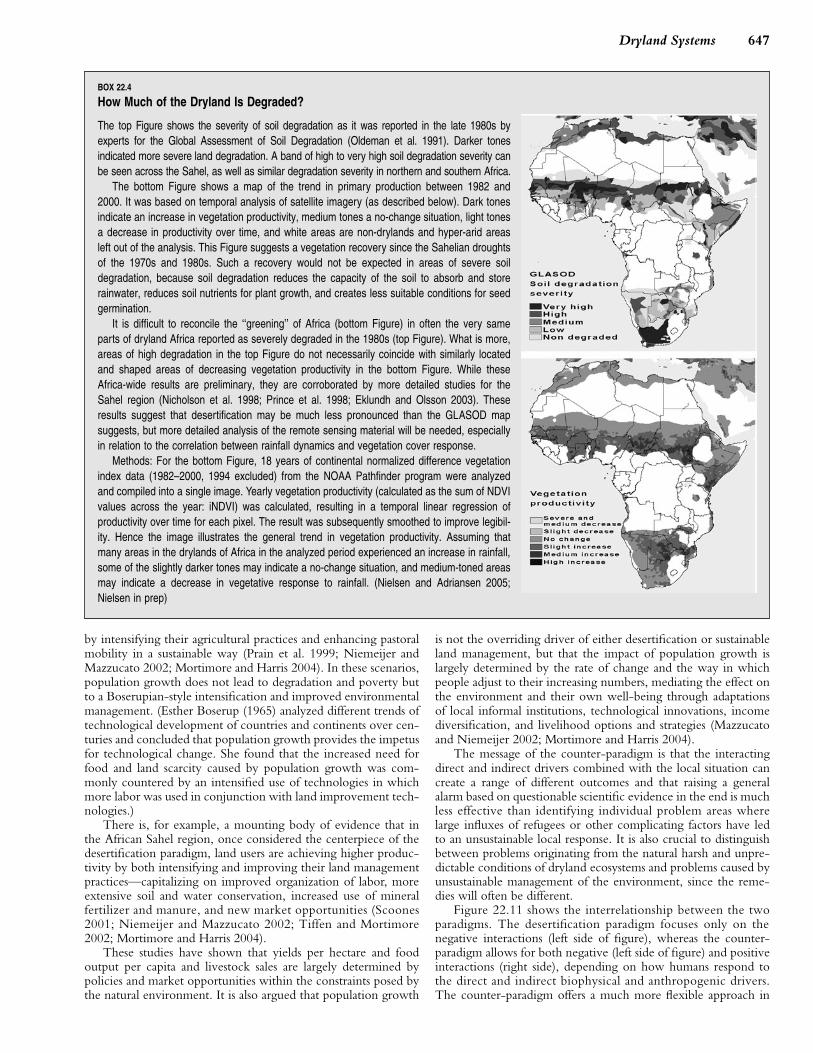
647Dryland Systems
BOX 22.4
How Much of the Dryland Is Degraded?
The top Figure shows the severity of soil degradation as it was reported in the late 1980s byexperts for the Global Assessment of Soil Degradation (Oldeman et al. 1991). Darker tonesindicated more severe land degradation. A band of high to very high soil degradation severity canbe seen across the Sahel, as well as similar degradation severity in northern and southern Africa.
The bottom Figure shows a map of the trend in primary production between 1982 and2000. It was based on temporal analysis of satellite imagery (as described below). Dark tonesindicate an increase in vegetation productivity, medium tones a no-change situation, light tonesa decrease in productivity over time, and white areas are non-drylands and hyper-arid areasleft out of the analysis. This Figure suggests a vegetation recovery since the Sahelian droughtsof the 1970s and 1980s. Such a recovery would not be expected in areas of severe soildegradation, because soil degradation reduces the capacity of the soil to absorb and storerainwater, reduces soil nutrients for plant growth, and creates less suitable conditions for seedgermination.
It is difficult to reconcile the ‘‘greening’’ of Africa (bottom Figure) in often the very sameparts of dryland Africa reported as severely degraded in the 1980s (top Figure). What is more,areas of high degradation in the top Figure do not necessarily coincide with similarly locatedand shaped areas of decreasing vegetation productivity in the bottom Figure. While theseAfrica-wide results are preliminary, they are corroborated by more detailed studies for theSahel region (Nicholson et al. 1998; Prince et al. 1998; Eklundh and Olsson 2003). Theseresults suggest that desertification may be much less pronounced than the GLASOD mapsuggests, but more detailed analysis of the remote sensing material will be needed, especiallyin relation to the correlation between rainfall dynamics and vegetation cover response.
Methods: For the bottom Figure, 18 years of continental normalized difference vegetationindex data (1982–2000, 1994 excluded) from the NOAA Pathfinder program were analyzedand compiled into a single image. Yearly vegetation productivity (calculated as the sum of NDVIvalues across the year: iNDVI) was calculated, resulting in a temporal linear regression ofproductivity over time for each pixel. The result was subsequently smoothed to improve legibil-ity. Hence the image illustrates the general trend in vegetation productivity. Assuming thatmany areas in the drylands of Africa in the analyzed period experienced an increase in rainfall,some of the slightly darker tones may indicate a no-change situation, and medium-toned areasmay indicate a decrease in vegetative response to rainfall. (Nielsen and Adriansen 2005;Nielsen in prep)
by intensifying their agricultural practices and enhancing pastoralmobility in a sustainable way (Prain et al. 1999; Niemeijer andMazzucato 2002; Mortimore and Harris 2004). In these scenarios,population growth does not lead to degradation and poverty butto a Boserupian-style intensification and improved environmentalmanagement. (Esther Boserup (1965) analyzed different trends oftechnological development of countries and continents over cen-turies and concluded that population growth provides the impetusfor technological change. She found that the increased need forfood and land scarcity caused by population growth was com-monly countered by an intensified use of technologies in whichmore labor was used in conjunction with land improvement tech-nologies.)
There is, for example, a mounting body of evidence that inthe African Sahel region, once considered the centerpiece of thedesertification paradigm, land users are achieving higher produc-tivity by both intensifying and improving their land managementpractices—capitalizing on improved organization of labor, moreextensive soil and water conservation, increased use of mineralfertilizer and manure, and new market opportunities (Scoones2001; Niemeijer and Mazzucato 2002; Tiffen and Mortimore2002; Mortimore and Harris 2004).
These studies have shown that yields per hectare and foodoutput per capita and livestock sales are largely determined bypolicies and market opportunities within the constraints posed bythe natural environment. It is also argued that population growth
PAGE 647
is not the overriding driver of either desertification or sustainableland management, but that the impact of population growth islargely determined by the rate of change and the way in whichpeople adjust to their increasing numbers, mediating the effect onthe environment and their own well-being through adaptationsof local informal institutions, technological innovations, incomediversification, and livelihood options and strategies (Mazzucatoand Niemeijer 2002; Mortimore and Harris 2004).
The message of the counter-paradigm is that the interactingdirect and indirect drivers combined with the local situation cancreate a range of different outcomes and that raising a generalalarm based on questionable scientific evidence in the end is muchless effective than identifying individual problem areas wherelarge influxes of refugees or other complicating factors have ledto an unsustainable local response. It is also crucial to distinguishbetween problems originating from the natural harsh and unpre-dictable conditions of dryland ecosystems and problems caused byunsustainable management of the environment, since the reme-dies will often be different.
Figure 22.11 shows the interrelationship between the twoparadigms. The desertification paradigm focuses only on thenegative interactions (left side of figure), whereas the counter-paradigm allows for both negative (left side of figure) and positiveinteractions (right side), depending on how humans respond tothe direct and indirect biophysical and anthropogenic drivers.The counter-paradigm offers a much more flexible approach in
................. 11432$ CH22 10-11-05 15:06:10 PS
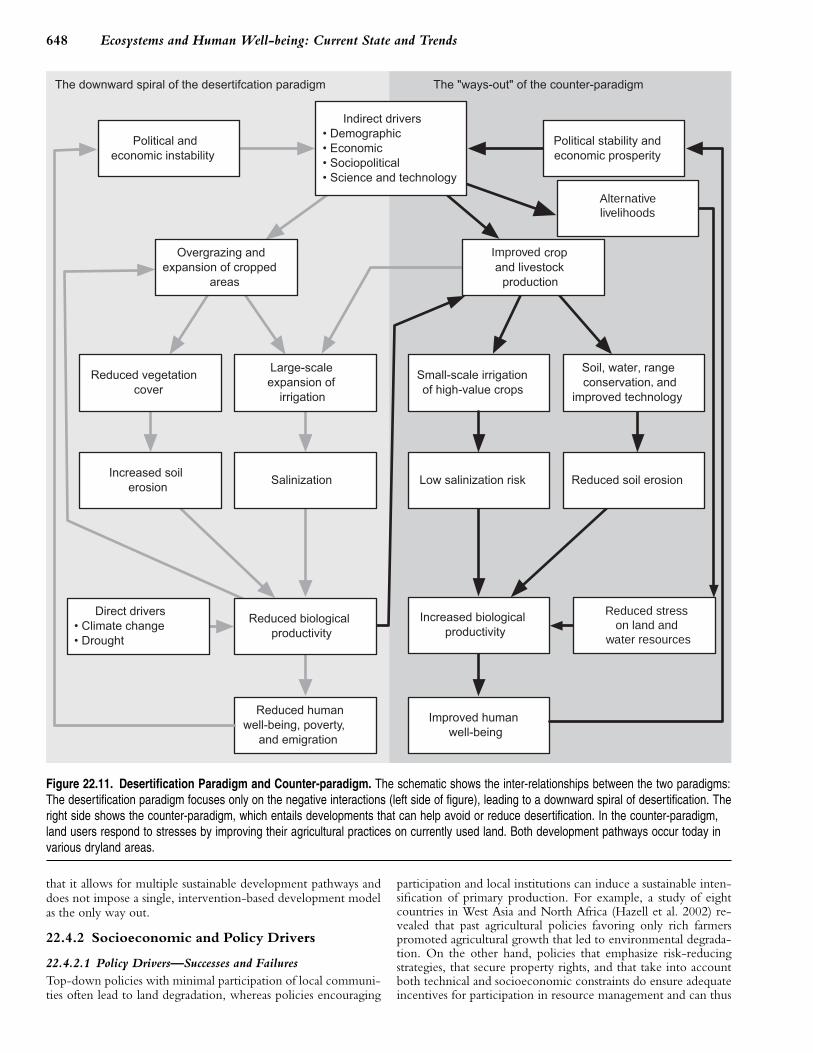
648 Ecosystems and Human Well-being: Current State and Trends
Improved
Alternativelivelihoods
Reduced stress on land and
water resources
Figure 22.11. Desertification Paradigm and Counter-paradigm. The schematic shows the inter-relationships between the two paradigms:The desertification paradigm focuses only on the negative interactions (left side of figure), leading to a downward spiral of desertification. Theright side shows the counter-paradigm, which entails developments that can help avoid or reduce desertification. In the counter-paradigm,land users respond to stresses by improving their agricultural practices on currently used land. Both development pathways occur today invarious dryland areas.
that it allows for multiple sustainable development pathways anddoes not impose a single, intervention-based development modelas the only way out.
22.4.2 Socioeconomic and Policy Drivers
22.4.2.1 Policy Drivers—Successes and FailuresTop-down policies with minimal participation of local communi-ties often lead to land degradation, whereas policies encouraging
PAGE 648
participation and local institutions can induce a sustainable inten-sification of primary production. For example, a study of eightcountries in West Asia and North Africa (Hazell et al. 2002) re-vealed that past agricultural policies favoring only rich farmerspromoted agricultural growth that led to environmental degrada-tion. On the other hand, policies that emphasize risk-reducingstrategies, that secure property rights, and that take into accountboth technical and socioeconomic constraints do ensure adequateincentives for participation in resource management and can thus
................. 11432$ CH22 10-11-05 15:06:13 PS
649Dryland Systems
avoid degradation (Sanders et al. 1996; Pender et al. 2001; Hazellet al. 2002). Community-based land use decision-making and so-cial networks also contribute to the success of non-degradingagriculture in drylands (Mazzucato et al. 2001).
There are also examples for the Boserupian ‘‘induced innova-tion’’ triggered by increasing needs and sustained by the commu-nity’s investments in agricultural infrastructure, markets, andconservation practices; in the Machakos (dry subhumid Kenya),demand from the nearby growing city of Nairobi since the 1930shas motivated farmers to restore degraded lands by terracing, pen-ning, and feeding livestock; manuring croplands; planting high-value trees; adopting labor-saving plows and new maize varieties;and creating small-scale water harvesting and irrigation structures.In Gombe (semiarid to dry subhumid north-central Nigeria),farmers repeatedly changed their livelihoods base from livestockto sorghum/groundnut, to cotton, and to maize as market accessand prices shifted and as fertilizer and new cultivation technolo-gies became available through government programs since the1940s (Tiffen and Mortimore 2002). In these two cases, marketdemand increased returns on agricultural production, which stim-ulated development toward a more labor-intensive system inwhich labor-intensive soil and water conservation practices paidoff through higher yields and better prices at the market.
However, there are other situations where induced innovationhas not occurred and higher population has increased pressure onthe land, which has not been compensated for by more invest-ment in soil and water conservation measures (Lopez 1998; Katesand Haarmann 1992). A comparison of these successes and failuressuggests that critical drivers for successful indigenous dryland re-habilitation include access to technologies that can increase laborand land productivity faster than population growth and access tomarkets (Pender and Kerr 1998; Pender et al. 2001).
Next to intensification, diversification away from a small listof regular crops or mono-cropping systems provides economicsustainability as well as maintenance of service provision. Treesinterspersed with crops provide year-round ground cover andlivestock feed, protecting soils from the degradation spiral. Agreater diversity of crops also provides a more consistent streamof employment and income to the farm year-round, reducing theincentive for out-migration and hedging against short-termdrought risk. Higher-value products provide farmers with the in-come needed to reinvest in soil nutrient replacement, in turnbuilding soil organic matter. In some areas, such practices havetraditionally been an integral part of the system; in other areas,they are currently being stimulated through development inter-ventions.
22.4.2.2 Demographic Drivers
Population is an important driver; however, population growthprojections for drylands can be confounded by the impact of so-cioeconomic and health problems, like HIV/AIDS. For example,in Botswana, which is mostly semiarid and where one in threeadults is reported to be HIV-positive, a 20% decline in populationis predicted between 2000 and 2050 (UNFPA 2003). This situa-tion could also apply to other dryland countries in Africa. Rapiddemographic changes—increases or decreases—make planningresource management more problematic.
Migrating populations can be a source of additional pressureon dryland environments and on resource management whenlivestock temporarily concentrate at key resources such as waterpoints. Under these circumstances, conflicts over water often arisebetween nomads and farmers (as in the dry subhumid part of Tan-zania) (Mbonile 2005). A transition between migration as a tem-
PAGE 649
porary livelihood strategy to permanent migration createsadditional pressure on drylands, as described later.
Nomadism can be described as a rangeland management prac-tice that over the centuries has proved to be sustainable andwithin the carrying capacity of drylands. Sedentarisation of no-mads and other policies and infrastructure that promote farmingin rangelands at the lower limit of cropping viability can act asdrivers of land degradation. The concentration of human andlivestock populations in particular areas can reduce the ability ofnomads to adjust their socioeconomic activities in the face ofstresses such as droughts, and a Convention on Nomadic Pastoral-ism to protect pastoralists’ rights and empower them economi-cally, socially, and politically has been suggested (CENESTA2002). Sedentarization under the Tribal Grazing Land Policy inBotswana has not yet caused large-scale environmental degrada-tion, but it has reduced the resource base and options for bothenvironmental and societal resilience to natural environmentalvariability (Thomas et al. 2000). Similarly, in Kenya’s semiaridLaikipia District, sedentarization of the previously nomadic popu-lation in a dryland wetland placed the people in an escalatinghuman-wildlife conflict (Thenya 2001).
22.4.2.3 Land Tenure Policies
Land tenure practices and policies in drylands can also act as indi-rect drivers of land degradation. When farmers and herders losecontrol or long-term security over the land they use, the incen-tives for maintaining environmentally sustainable practices arelost. Problems of water scarcity, groundwater depletion, sedimen-tation, and salinity can all be symptoms of deeper policy and insti-tutional failures, including a lack of well-defined, secure, tradableproperty rights (Ahmad 2000). According to this argument, it isessential that people perceive that they have secure ownershipover local natural resources for management to be effective.However, security of tenure need not imply systems of privateproperty rights. For instance, long-established collective andcommunity-based management of village tank systems has beenmore effective than the current proliferation of privately ownedboreholes (Gunnell and Krishnamurthy 2003).
22.4.2.4 Water Policies
Water policies are relevant to many provisioning and supportingservices in dryland areas. These policies include allocation sys-tems, pricing, government investments in water resource devel-opment, and priorities in conservation measures. Water allocationfor irrigation has caused degradation in some dryland areas whereflows in semiarid rivers used for irrigation, such as the River Ordin Western Australia, are highly variable and unpredictable.Therefore the proportionate water release strategies have beenfound to be unsuitable and to cause detrimental effects to theriverine ecosystem (Dupe and Pettit 2002). Irrigation policy deci-sions also depend on other factors, such as water availability andpricing and anticipated crop prices (Norwood and Dumler 2002).
Increasing water scarcity and degradation of quality are alsolinked to water sharing between upstream-downstream riparianusers (Lundqvist 1999). A frequent policy focus on the aggregateavailability of water—more specifically, the ratio between thenumber of people in a country or region and the amount of waterthat is naturally available—hides how much of that water can andis withdrawn and used by different people (Lundqvist 1999).Therefore, a shift from the mindset of resource development toone of resource management and conflict resolution is more use-ful (Shah et al. 2001).
................. 11432$ CH22 10-11-05 15:06:14 PS
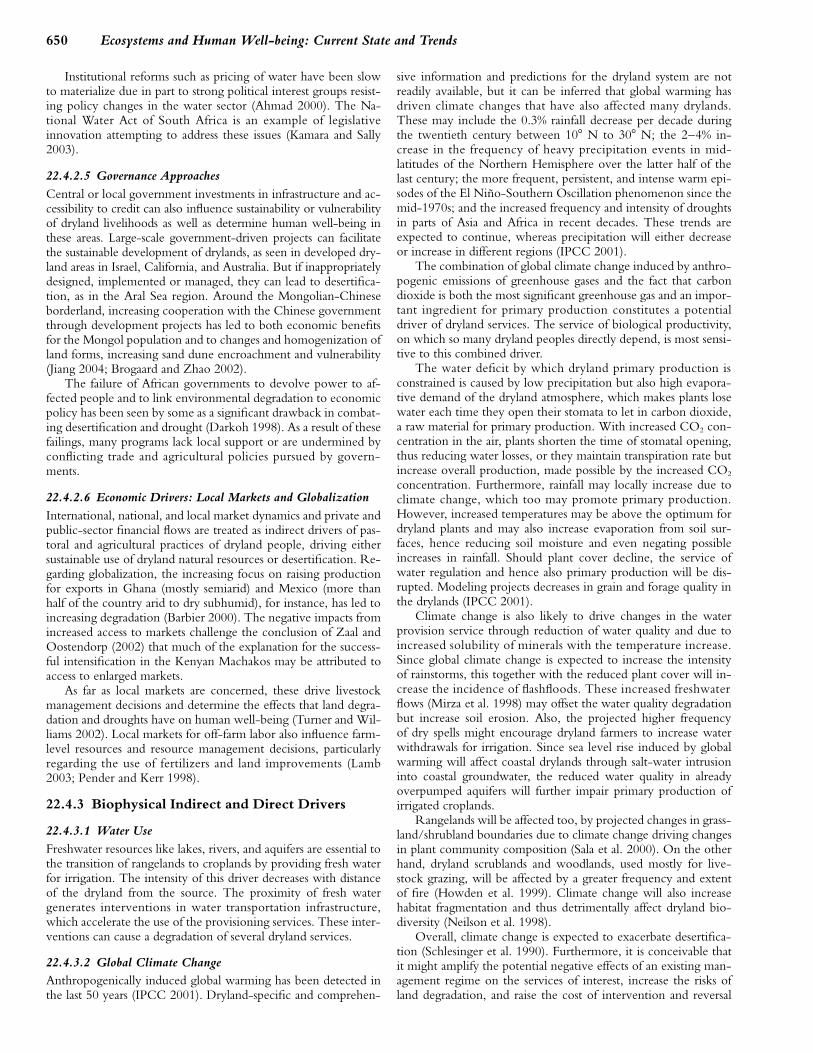
650 Ecosystems and Human Well-being: Current State and Trends
Institutional reforms such as pricing of water have been slowto materialize due in part to strong political interest groups resist-ing policy changes in the water sector (Ahmad 2000). The Na-tional Water Act of South Africa is an example of legislativeinnovation attempting to address these issues (Kamara and Sally2003).
22.4.2.5 Governance ApproachesCentral or local government investments in infrastructure and ac-cessibility to credit can also influence sustainability or vulnerabilityof dryland livelihoods as well as determine human well-being inthese areas. Large-scale government-driven projects can facilitatethe sustainable development of drylands, as seen in developed dry-land areas in Israel, California, and Australia. But if inappropriatelydesigned, implemented or managed, they can lead to desertifica-tion, as in the Aral Sea region. Around the Mongolian-Chineseborderland, increasing cooperation with the Chinese governmentthrough development projects has led to both economic benefitsfor the Mongol population and to changes and homogenization ofland forms, increasing sand dune encroachment and vulnerability(Jiang 2004; Brogaard and Zhao 2002).
The failure of African governments to devolve power to af-fected people and to link environmental degradation to economicpolicy has been seen by some as a significant drawback in combat-ing desertification and drought (Darkoh 1998). As a result of thesefailings, many programs lack local support or are undermined byconflicting trade and agricultural policies pursued by govern-ments.
22.4.2.6 Economic Drivers: Local Markets and GlobalizationInternational, national, and local market dynamics and private andpublic-sector financial flows are treated as indirect drivers of pas-toral and agricultural practices of dryland people, driving eithersustainable use of dryland natural resources or desertification. Re-garding globalization, the increasing focus on raising productionfor exports in Ghana (mostly semiarid) and Mexico (more thanhalf of the country arid to dry subhumid), for instance, has led toincreasing degradation (Barbier 2000). The negative impacts fromincreased access to markets challenge the conclusion of Zaal andOostendorp (2002) that much of the explanation for the success-ful intensification in the Kenyan Machakos may be attributed toaccess to enlarged markets.
As far as local markets are concerned, these drive livestockmanagement decisions and determine the effects that land degra-dation and droughts have on human well-being (Turner and Wil-liams 2002). Local markets for off-farm labor also influence farm-level resources and resource management decisions, particularlyregarding the use of fertilizers and land improvements (Lamb2003; Pender and Kerr 1998).
22.4.3 Biophysical Indirect and Direct Drivers
22.4.3.1 Water UseFreshwater resources like lakes, rivers, and aquifers are essential tothe transition of rangelands to croplands by providing fresh waterfor irrigation. The intensity of this driver decreases with distanceof the dryland from the source. The proximity of fresh watergenerates interventions in water transportation infrastructure,which accelerate the use of the provisioning services. These inter-ventions can cause a degradation of several dryland services.
22.4.3.2 Global Climate ChangeAnthropogenically induced global warming has been detected inthe last 50 years (IPCC 2001). Dryland-specific and comprehen-
PAGE 650
sive information and predictions for the dryland system are notreadily available, but it can be inferred that global warming hasdriven climate changes that have also affected many drylands.These may include the 0.3% rainfall decrease per decade duringthe twentieth century between 10� N to 30� N; the 2–4% in-crease in the frequency of heavy precipitation events in mid-latitudes of the Northern Hemisphere over the latter half of thelast century; the more frequent, persistent, and intense warm epi-sodes of the El Nino-Southern Oscillation phenomenon since themid-1970s; and the increased frequency and intensity of droughtsin parts of Asia and Africa in recent decades. These trends areexpected to continue, whereas precipitation will either decreaseor increase in different regions (IPCC 2001).
The combination of global climate change induced by anthro-pogenic emissions of greenhouse gases and the fact that carbondioxide is both the most significant greenhouse gas and an impor-tant ingredient for primary production constitutes a potentialdriver of dryland services. The service of biological productivity,on which so many dryland peoples directly depend, is most sensi-tive to this combined driver.
The water deficit by which dryland primary production isconstrained is caused by low precipitation but also high evapora-tive demand of the dryland atmosphere, which makes plants losewater each time they open their stomata to let in carbon dioxide,a raw material for primary production. With increased CO2 con-centration in the air, plants shorten the time of stomatal opening,thus reducing water losses, or they maintain transpiration rate butincrease overall production, made possible by the increased CO2
concentration. Furthermore, rainfall may locally increase due toclimate change, which too may promote primary production.However, increased temperatures may be above the optimum fordryland plants and may also increase evaporation from soil sur-faces, hence reducing soil moisture and even negating possibleincreases in rainfall. Should plant cover decline, the service ofwater regulation and hence also primary production will be dis-rupted. Modeling projects decreases in grain and forage quality inthe drylands (IPCC 2001).
Climate change is also likely to drive changes in the waterprovision service through reduction of water quality and due toincreased solubility of minerals with the temperature increase.Since global climate change is expected to increase the intensityof rainstorms, this together with the reduced plant cover will in-crease the incidence of flashfloods. These increased freshwaterflows (Mirza et al. 1998) may offset the water quality degradationbut increase soil erosion. Also, the projected higher frequencyof dry spells might encourage dryland farmers to increase waterwithdrawals for irrigation. Since sea level rise induced by globalwarming will affect coastal drylands through salt-water intrusioninto coastal groundwater, the reduced water quality in alreadyoverpumped aquifers will further impair primary production ofirrigated croplands.
Rangelands will be affected too, by projected changes in grass-land/shrubland boundaries due to climate change driving changesin plant community composition (Sala et al. 2000). On the otherhand, dryland scrublands and woodlands, used mostly for live-stock grazing, will be affected by a greater frequency and extentof fire (Howden et al. 1999). Climate change will also increasehabitat fragmentation and thus detrimentally affect dryland bio-diversity (Neilson et al. 1998).
Overall, climate change is expected to exacerbate desertifica-tion (Schlesinger et al. 1990). Furthermore, it is conceivable thatit might amplify the potential negative effects of an existing man-agement regime on the services of interest, increase the risks ofland degradation, and raise the cost of intervention and reversal
................. 11432$ CH22 10-11-05 15:06:15 PS

651Dryland Systems
(Fernandez et al. 2002). However, climate change is expected tohave different effects on the various dryland subtypes; Canziani etal. (1998) suggested that since plants and animals of fluctuatingenvironments are better adapted to environmental change, theadaptability of biodiversity to climate change will increase witharidity, since the drier dryland subtypes are also environmentallyless stable than the less dry subtypes.
22.4.3.3 Floods
Drylands are characterized by low, unpredictable, and erratic pre-cipitation. The expected annual rainfall typically occurs in a lim-ited number of intensive, highly erosive storms. This producesoverland flows that usually develop into violent floods. Thesefloods can be a major driver of soil erosion and soil loss, and thedry spells between storms increase the risk of crop failure. How-ever, these floodwaters can also replenish freshwater resources,deposit fertile minerals and organic debris, and recharge ground-water or the soil profile.
The prevalence of flash floods in drylands typically leads to anumber of responses from farmers directed at storage of runoffand flood water, mainly for increasing crops and forage. Theseinclude using catchments of up to several hectares (Pacey andCullis 1986) with or without mechanical or chemical treatmentto reduce infiltrability (UNEP 1983); creating micro-catchmentsof several square meters around a single bush or tree; cultivatingwadis that are naturally flooded following rainstorms; spreadingthe water over extensive tracts to reduce the kinetic energy andenhance infiltration; constructing diversion channels, stone orearth bunds, and even wood bunds to irrigate farmlands of hun-dreds or even a few thousands hectares; and combinations ofseveral of these techniques (Reij et al. 1988; van Dijk 1995; Nie-meijer 1999). Runoff farming is suitable in arid and semiarid areaswhere direct rainfall is too low for cropping, but in dry subhumidareas it would lead to extensive periods of waterlogging, causingyield reduction. In many of the drier areas floodwaters are alsoused to recharge wells and fill basins used for drinking water forlivestock and humans or for some dry season gardening.
22.4.3.4 Fires
Natural and induced fires are drivers of land cover, soil condition,and biodiversity, especially in the dry subhumid and semiarid dry-land subtype. With respect to soil condition, nitrogen and organiccarbon are largely lost to the atmosphere or converted to inertforms (charcoal) by fire, while soil erodibility increases for a pe-riod after the event. Thus highly recurrent fires can lead to soildegradation.
Historically, land use and management changes have modifiedthe temporal and spatial patterns of fire occurrence and intensity,with strong consequences on soil fertility and the composition ofthe vegetation it supports. In general, traditional land users main-tained a fine-grained spatial pattern of small fires with low on-siterecurrence, such as the aboriginal fire management in Australia(Griffin and Friedel, 1984a, 1984b, 1985), which could be extra-polated to other semiarid and dry subhumid dryland.
Dryland fires are often controlled by grazing and browsing ofeither wild herbivores or livestock. The twentieth-century com-mercial agricultural and stock breeding systems as well as wildlifemanagement regulations led to widespread fire prevention to-gether with overstocking of rangelands. The outcome has been anew pattern of larger patches of higher-intensity fires, which isclaimed to be one of the triggers for grass-shrub transition(Scholes and Hall 1996). World carbon emissions from savannaburning are estimated at 0.87 billion tons of carbon per year
PAGE 651
(Scholes and Hall 1996). In the northern Mediterranean basin, theburned area has been increasing at an annual rate of 4.7% since1960 due to vegetation regrowth after agricultural abandonment(Le Houerou 1992).
22.5 Trade-offs, Synergies, and InterventionsThis section compares and contrasts the major options availablefor drylands management. Each category of options is assessed interms of trade-offs, as far as gains and losses of services with regardto their impact on human well-being; synergies, where one typeof management option leads to multiple benefits; and vulnerabil-ity (losses greater than gains and no synergies) and sustainability(losses are equal to or smaller than gains).
22.5.1 Traditional Dryland Livelihoods
22.5.1.1 Woodland-Rangeland-Cropland Trade-offs andSynergies
Historically, dryland livelihoods have been based on a flexiblecombination of hunting, gathering, cropping, animal husbandry,and fishing. Archeological records and anthropological studieshave revealed shifts in livelihood strategies over time in the samelocation and often involving the same cultures. As a consequence,land use changes both in time and space as an adaptation to neweconomic possibilities, in response to environmental or climaticchanges, or as a result of war or drought-induced migration(Robbins 1984; Berry 1993; Niemeijer 1996). Land use changesare thus both responses to changes in the provision of ecosystemgoods and services and drivers of changes in this provision.
Population increase drives a growing tension between pastoralrangeland and cultivated land use. This can lead to interculturalconflicts and service degradation as herders and farmers claim ac-cess to and use of the same land (van Driel 2001). Depending onannual rainfall, supplemental or full irrigation may be introducedfor conversion to cultivated systems, often requiring capital in-vestment by governments or farmers. In the long run, trade-offsbetween the two land uses can also lead to a tighter cultural andeconomic integration, with herders cultivating more land, farmersholding more livestock, and an increased exchange of services(Breusers et al. 1998; Mazzucato and Niemeijer 2003).
Woodlands are a source of wild fruits, edible plants, and wild-life that can be important sources of food and off-farm income—vital during years of drought. Woodlands also often have culturaland religious significance for the local population, which protectsthem to some degree against overexploitation. When woodlandsare transformed to croplands, the tree volume decreases. In manytraditional systems, however, certain trees and shrubs are not re-moved because their fruits, leaves, or other products are used forconsumption or medication or are traded, as described earlier.The species composition changes and the soil cover decreases fol-lowing clearance, especially during the dry season, when no cropsare grown. The transformation negatively affects regulation andcultural services and reduces biodiversity, but at the same time itincreases food production and creates multiple livelihood oppor-tunities.
Woodlands that are increasingly used by livestock (and oftenmanaged with fire) may develop into rangelands with a reducedtree cover and increased grass or shrub cover. Over time, thespecies composition changes as a result of grazing, browsing, andfire (more fire-resistant species become dominant, for instance).For herders, economic productivity increases, but for hunters andgatherers the changes in species composition and the reduced
................. 11432$ CH22 10-11-05 15:06:15 PS
652 Ecosystems and Human Well-being: Current State and Trends
habitat for wildlife negatively affects their livelihood. On a largerscale, the disappearance or transformation of woodlands reducesthe service of supporting biodiversity by eliminating corridors formigration and refuge from predation and disturbances.
In semiarid and dry-subhumid areas, different land uses meetand there is the greatest potential for both trade-offs and synergies.Afforestation, silvipastoral, and agropastoral systems develop in re-sponse to population growth, environmental changes, and eco-nomic and political developments. Natural biodiversity is replacedby agrobiodiversity, where different species and landraces of live-stock and crops are introduced. Synergies are found in mixedfarming practices, where a single farm household combines live-stock rearing and cropping (Slingerland 2000).
Synergies are also found where different households or com-munities engage in either livestock herding or farming and tradefood and services. Such interactions can decrease livestock pres-sure on rangelands through fodder cultivation and provision ofstubble to supplement livestock feed during forage scarcity. At thesame time, cultivated systems benefit from manure provided bylivestock. Many West African farming systems are based on thiskind of integration of pastures and farmland (Prudencio 1993;Steenhuijsen 1995; Mazzucato and Niemeijer 2000a; van Driel2001). Growing crops in the most fertile areas and grazing live-stock on the less fertile land can optimally exploit spatial and tem-poral variability in service provision.
When used infrequently and controlled, fire plays an impor-tant role in the management of most pastoral and cropping sys-tems. Pastoralists use controlled fire to get fresh shoots that aremore digestible for their livestock. Farmers use fire to clear newland or old fallows for cultivation and in some cases also to re-move the remaining crop residue at the onset of the wet season.In both cases, the use of fire promotes nutrient cycling essentialfor maintaining the productivity of rangeland and cultivated land.Although fire provides a temporary boost to the provisioning ser-vices, carbon and nitrogen are lost to the atmosphere, and theexcessive and improper use of fire can also lead to land degrada-tion.
22.5.1.2 Use of Water Resource for Cultivated Drylands
The relative scarcity of dryland water dictates trade-offs in landuse and often creates competition and conflicts between differentriparian users, as well as upstream-downstream conflicts. For ex-ample, dryland-crossing rivers provide drinking water, irrigation,and navigational uses for multiple countries. Water abstracted forirrigation often conflicts with the downstream needs of wetlandareas of coastal or inland deltas. On a more local scale, farmersand pastoralists may compete for use of water between irrigationand livestock use. These competitive uses of water resources posepolitical, economic, and ecological conflicts and trade-offs thatsometimes go back to ancient time.
Effective water harvesting and water conservation practicesreduce runoff and erosion and increase crop performance, butthey also reduce downstream water supply. This reduction in run-off and erosion generally reduces flooding and siltation of fieldsand water ways. More significant trade-offs need to be consideredwhen runoff farming and water harvesting include intentionalclearing of the catchment areas, by removing vegetation andsometimes using artificial coatings to seal the soil. This helps in-crease the amount of runoff that can be harvested from the catch-ment, thereby increasing water availability in the run-on area forcrop production or livestock watering. However it leads to a lossof ecosystem services for the catchment area itself. Such catch-ment clearing is labor-intensive and not common in traditional
PAGE 652
runoff farming and soil and water conservation practices, exceptin the arid and hyper-arid regions (Pacey and Cullis 1986; Reij etal. 1996; Bruins et al. 1987).
22.5.2 Drylands and Other Systems
Six MA-defined systems overlap with the dryland system, someof which overlap with each other. Cultivated systems (44% ofdryland area), inland water systems (rivers and wetlands, 28%),coastal systems (9%), mountain systems (32%), forests (12%), andurban systems (2%) are all embedded in drylands. These systemsgenerate services for the drylands in which they are embedded,and often feedback loops and even synergies develop betweenthe drylands and the systems embedded in them. The trade-offsand synergies between cultivated systems in drylands and otherland uses are discussed in previous sections. The linkages of dry-land systems with coastal and mountain systems are important andare discussed in the related chapters. Inland waters and urban sys-tems are assessed in this section.
22.5.2.1 Inland Waters and WetlandsInland water systems—rivers, canals, lakes, and wetlands—are anintegral component of the dryland system and relate to provisionof many services, including freshwater provision and supportingbiodiversity. Rivers in drylands often feed dryland freshwater lakes(such as the Aral Sea and Lake Chad), landlocked salty lakes (theDead Sea and Salt Lake in Utah), or end up in dryland deltaic(such as the Mesopotamian marshlands) or landlocked marshes(the Okavango, for example). There is a major trade-off and po-tential for conflict here: increasing abstraction of water from riversis essential for agricultural production but it reduces the quantityand quality of water reaching lakes and marshes, leading to reduc-tion in surface area and increase in water salinity.
For example, the Aral Sea lost about 60% of its 68,000 squarekilometers between 1960 and 1998, a figure expected to rise toabout 70% by 2010, and its salinity increased from 10 to 45 gramsper liter (DFD 1996). This resulted in the total collapse of the44,000 annual tonnage of the lake-based fishing industry and inwind transport of the salt and pesticide-laden soil particles to otherparts of the Aral Sea basin, with severe health effects on the popu-lation (DFD 1996).
The large-scale abstraction of water for irrigation is directlyexpressed in shrinkage of wetlands; for example, the Mesopota-mian marshlands lost 89% of 20,000 square kilometers between1970 and 2000, which also affected fisheries of the Persian Gulf(UNEP 2001). Similarly, Lake Chad lost 95% of its 25,000-square-kilometer area from 1963 to 1997 due to irrigation appro-priation and climate (USAID/FEWS 1997; ITAP 2003). Suchchanges could have a significant impact on the 180 fish speciesin Lake Chad, which are the second most important source ofhousehold income in the Nigerian drylands (Sarch and Birkett2000).
Water abstraction also affects the provision of other services ofdryland wetlands, including nutrient cycling, primary production,soil formation away from wetlands, provision of food (both ani-mal and wild food plants) (Brouwer and Mullie 1994), provisionof fuelwood and biochemicals, climate regulation through evapo-rative cooling, and removal of several pollutants from water.Many dryland wetlands are critical for survival of cross-desert mi-gratory birds. Wetlands also provide cultural services (spiritual ser-vices and tourism, for instance, as described earlier).
22.5.2.2 Urban SystemsThe proportion of the global population living in urban areas isexpected to increase following a historical trend, with the urban
................. 11432$ CH22 10-11-05 15:06:16 PS
653Dryland Systems
fraction increasing to around 52% by 2010 (see Chapter 27) andto 60% by 2030 (UN 2002). This projection implies that nearlyall the population growth over the next three decades will occurin urban areas. Such growth has consequences for drylands, de-pending on whether it is undertaken with proper planning andprovision of services, infrastructure, and facilities. In hyper-ariddrylands, a much larger fraction of the population is urbanized.(See Figure 22.12.) This may be a result of concentration of liveli-hood opportunities and better living conditions in otherwiseharsh settings (CIESIN 2004). Overall urban population densityincreases with decreasing aridity, accompanied by a decreasing percapita income (expressed by GNP, calculated as dollars per capita).Such correlations with aridity can be linked to the reduction ofprovision of services with increasing aridity. On the other hand,the ‘‘ecological footprint’’ or impacts of dryland urban centers onadjoining rangelands and cultivated systems cannot yet be as-sessed.
22.5.2.3 Systems Away from Drylands—Dryland Dust
Drylands also affect non-dryland areas, indirectly at the sociopo-litical level (through environmental refugees, for example, or im-migration), and in various direct ways, such as the dust particlescarried by winds from the drylands. Dust from the Gobi desert iscarried to the Pacific coasts of America, and Saharan dust is carriedto the Caribbean islands (Prospero and Nees 1986) and the Ama-zon basin (Swap et al. 1992). Chemical contaminants and bacterialand fungal spores adhere to the surface of these dust particles,which can be hazardous to people and are suspected to have al-ready affected organisms of the Caribbean coral reefs (Smith et al.1996). It is hypothesized that this and other recently emergingcoral reef degradation episodes are coincidental with the deserti-fication-driven increased frequencies of Saharan dust storms(Shinn et al. 2000).
22.5.3 Climate Change and Carbon Sequestration
During the last century, global drylands have experienced anthro-pogenically induced climate changes that are predicted to con-tinue and even to accelerate during the present century, as notedearlier. Drylands ecosystems contribute carbon emissions to theatmosphere (0.23–0.29 billion tons of carbon a year) as a result ofdesertification and related vegetation destruction, through in-creased soil erosion and a reduced carbon sink (Lal 2001b). Thislatter effect is expected to intensify with climate change, but if
sq. km.
-
Figure 22.12. Impacts of Urbanization and Population Densityon Income Levels in Drylands (CIESIN 2004)
PAGE 653
they are properly managed, dryland systems have the potential tofunction as a carbon sink.
Lal (2001b) estimated the potential of dryland ecosystems tosequester up to 0.4–0.6 billion tons of carbon a year if eroded anddegraded dryland soils were restored and their further degradationwere arrested. Furthermore, Lal also pointed out that throughactive ecosystem management, such as reclamation of saline soilsand formation of secondary carbonates, carbon sequestration canbe further enhanced. This will add sequestration of 0.5–1.3 billiontons of carbon a year; similar magnitudes of potential carbon sinkcapacity of dryland ecosystems have been estimated by Squires etal. (1995) on a global scale. This restoration and enhancement ofdryland condition, if undertaken at a global scale, could have amajor impact on the global climate change patterns.
A significant change in the direction of national and local poli-cies would be needed to implement such restoration and en-hancement in the carbon sequestration service. Knowledge gapsalso need to be filled by collecting information on credible ratesof the extent and severity of soil degradation at different spatialscales; biotic and soil carbon pools and fluxes; the impact of landuse changes and desertification on the carbon sequestration dy-namics; and the cost-benefit ratio of soil improvement and carbonsequestration practices for small landholders and subsistence farm-ers in dryland ecosystems.
However, there are also numerous hidden costs of enhancedsoil carbon sequestration that must be considered (Schlesinger1999). Such enhancements require the addition of mineral or or-ganic fertilizer (especially nitrogen and phosphorus) and water,which would need significant capital investment. An incentive tofurther enhance the natural condition of the service even with thecosts involved and at the expense of other services is that drylandscan be instrumental in counter balancing the increased anthropo-genic emissions of carbon dioxide to the atmosphere. In the con-text of the Clean Development Mechanism proposed by theKyoto Protocol, developing countries can attract investmentsfrom industrial countries and multinational industries. Such proj-ects are expected to generate income through emerging interna-tional carbon trading (World Bank 2003a, 2003b), which mayoffset the expenses. The long-term impact of such projects in de-veloping countries depends on the future of the Kyoto Protocoland the Clean Development Mechanism.
22.6 Human Well-being in Dryland Systems
22.6.1 Indicators of Human Well-being in Drylands
In general, the human well-being of dryland peoples is lower thanthat of people in other MA systems (see Chapter 5). Dryland peo-ples have the highest infant mortality rates, and their economiccondition (as expressed by the GNP per capita) is the lowest. (SeeFigure 22.13.) Though the two factors may be linked, the ques-tion remains as to what drives the relative and absolute lowhuman well-being in drylands.
The MA defines human well-being as a composite of the basicmaterials for a good life, freedom and choice, health, good socialrelations, and security (MA 2003) and implies that these are di-rectly or indirectly linked to the availability of ecosystem services.One hypothesis is therefore that HWB in drylands is low becausethe natural rate of provision of ecosystem services is inherentlylow. Hence, the relatively low rate of water provision not onlyreduces biological productivity on which most dryland peoplesdepend, it also restricts people’s access to clean drinking water andadequate sanitation, thus worsening their health.
................. 11432$ CH22 10-11-05 15:06:19 PS

654 Ecosystems and Human Well-being: Current State and Trends
Figure 22.13. Comparison of Infant Mortality Rates and GNPper Capita across the MA Systems in Asia (CIESIN 2004)
Another hypothesis is that land degradation in drylands furtherreduces the natural rate of service provision, which either drivesor exacerbates HWB in the drylands. The degree to which thesedryland communities are reliant on dryland ecosystems to sustainthem (Webb and Harinarayan 1999; Nyariki et al. 2002) and theextent to which their relatively low HWB is linked to services’failure can be assessed by extending the analysis to subtypes ofdrylands, with the underlying assumption that the level of aridityis associated with the quality of ecosystem services as well as tothe level of stress or degradations observed in drylands. (See Fig-ure 22.14.)
This correlation manifests itself when observable well-beingindicators are measured. The hunger rate in children under theage of five and infant mortality rates in drylands demonstrate aclear linkage to the level of aridity. It can be argued that semiaridareas are worse off in terms of human well-being as a result of ahigh degree of sensitivity and high degree of pressure, which alsogenerate the highest degree of land degradation. The region-to-region variability is also significant, with drylands in sub-SaharanAfrica and Asia lagging well behind drylands in the rest of theworld, whereas the GNP per capita in OECD dryland countriesexceeds that of dryland countries in other regions almost by anorder of magnitude. This is not surprising, considering that eco-nomic performance relates to many other governance and macro-and microeconomic factors. Thus the economic status of drylandsocieties is not entirely linked to the low availability of basic eco-system services such as water and biological productivity. Thissection assesses the contribution of ecosystem services versus so-cioeconomic factor to components of HWB in the drylands.
- GN
P/c
api
ta (
US
$ th
ousa
nds)
Figure 22.14. Human Well-being Statistics by Dryland Subtypes(OECD countries excluded)
PAGE 654
22.6.2 Human Well-being Components in Drylands
The MA conceptual framework (MA 2003) broadly identifies fivekey components of human well-being.• Basic materials for a good life. The low biological production of
drylands, constrained by water, is the ecosystem condition thatlimits the provision of basic materials for a good standard ofliving. This also limits the livelihood opportunities in drylandsand often leads to practices, such as intensified cultivation, thatcannot be serviced due to low and further impaired nutrientcycling and water regulation and provision, requiring adjust-ments in management practices or the import of nutrients andwater provided by services of other ecosystems.
• Health. The two key factors contributing to poor health indrylands are malnutrition and limited access to clean drinkingwater, again reflecting their low biological production andwater provision. In Asia, for example, the fraction of childrenunder the age of five facing hunger is 36% in drylands com-pared with 15% in the forest and woodland system (averagedfor the different subtypes of each of these systems) (WHO2004). However, poor health is also exacerbated by poorhealth-related infrastructures.
• Good social relations. The quality of social relations can begauged in terms of social strife (wars and political upheavals)and refugees. Environmental refugees leave their homes dueto environmental degradation and lack of viable livelihoods.And the sale of stock, wage labor, borrowing of cash for food,and the sale of valuables all precede their migration (Black2001). Other categories include people displaced for politicalreasons that may affect the availability of services in drylandsto which they have been relocated. Thus demography andsociopolitical drivers, more than the direct condition of eco-system services, contribute to the quality of social relations.
• Security. Food security is an essential element of human well-being in drylands and is related to socioeconomic marginaliza-tion, lack of proper infrastructure and social amenities, andoften the lack of societal resilience. Climatic events like pro-longed droughts and excessive floods also drive insecurity indrylands. But sociopolitical drivers like land tenure practicesthat relate to sharing and conservation of natural resources orthat generate land cover change that may limit traditional pas-toral livelihood opportunities can greatly affect food security.Snel and Bot (2002) proposed a list of socioeconomic indica-tors of land degradation, including indicators to reflect insecu-rity caused by land degradation. Other security attributes,however, can be only indirectly related to the condition ofthe ecosystem.
• Freedom and choice. Dryland people are not affected just by theunique condition of the ecosystem but are also further re-stricted by local and global political and economic factors,which can exert major limitations on their freedom and lifechoices. With the exception of OECD countries, drylandpeoples are mostly politically marginalized; that is, their rolein political decision-making processes is perceived as beinginsignificant. Consequently, market factors that determinedryland farmers’ decision-making and the effects on theirwell-being are often critical (Turner and Williams 2002).This discussion demonstrates that provisioning of ecosystem
services is not the only driver of low HWB in drylands. The lackof a strong HWB-service correlation can be attributed to a num-ber of exogenous factors, including political marginality, slowgrowth of health and education infrastructure, facilities and ser-vices, and so on. What needs to be assessed, though, is whetheror not there are thresholds in the provision of services that either
................. 11432$ CH22 10-11-05 15:06:22 PS
655Dryland Systems
independently or together with the exogenous factors causehuman well-being to drop to a level that crosses the povertythreshold.
22.6.3 The Relative Dependence of Human Well-being on Ecosystems and Socioeconomic Drivers
Natural climatic fluctuations can move the level of service provi-sion to the point of crossing a threshold from a relatively high,stable rate of provision to a lower yet relatively stable state ofprovision. This can be a temporary transition, but a prolongeddrought or overexploitation can exert a persistent impact, result-ing in a permanently reduced rate of service provision that doesnot regain the previous level even when the impact is removed(e.g., Puigdefabregas 1998).
The grassland/scrubland transition is an example of a drylandecosystem that moves from one relatively stable state with a highprovision of forage to a different relatively stable state with alower provision of forage due to human impact. Even when theimpact is removed, the lower-service state persists, as describedearlier. Whether such a threshold is associated with a thresholdin socioeconomic and political drivers and a resulting significantchange in human well-being is not certain. The Sahel drought ofthe 1980s, for example, produced a devastating reduction inHWB, yet the region reverted to its former state once the pro-longed drought terminated. Thus it is likely that the issue of con-cern is not that of thresholds but of vulnerability to a persistentecosystem change, coupled with concomitant, resultant, or driv-ing socioeconomic and political changes.
The relative contribution of the condition of the dryland eco-system and of socioeconomic drivers to poverty attributes—suchas per capita rural cereal production, the time spent by householdmembers collecting water and fuelwood, the quantity of annualhousehold consumption that is derived from common lands, thepercent of children under five who are underweight, wasted, orstunted, and the percent of the rural population below the pov-erty line (Shyamsundar 2002)—has not yet been adequately as-sessed.
22.6.4 Responses to Improve Human Well-being inDrylands
The section explores the response interventions that can mitigateor reverse the effect of degraded ecosystem and service conditionon the well-being of dryland people. Experience has shown thatlocally appropriate interventions can introduce dynamics of sus-tainability and can improve human well-being by interrupting thevicious circle of poverty leading to overexploitation of servicesand to environmental degradation and desertification.
Traditionally, dryland societies have been able to cope withtheir harsh environment through livelihood adaptations over ex-tended periods. A number of commentators have explored the‘‘failure’’ of dryland farmers in sub-Saharan Africa and elsewhereto develop as quickly as farmers in non-dryland regions duringthe Green Revolution (Singh 2004). Analyses conducted at thesmallholder level have concluded that while overall progress hasbeen compromised by widespread insecurity, significant achieve-ments have been made by dryland farmers due to social resilience,the evolution of knowledge over time, and successful farmer ad-aptation (Bird and Shepherd 2003; Mortimore 2003). Theseachievements are contrasted with the failures of non-drylandfarmers at comparable poverty levels (Mehta and Shah 2003). Thissection assesses the relative role of traditional practices and mod-
PAGE 655
ern technologies in building capacities and public participation forimproving HWB in the drylands.
22.6.4.1 Traditional Knowledge
Traditional response options combine tested approaches for re-source management based on insights into the local natural andsocioeconomic environment with continuous experimentation todeal with changes in that environment (Prain et al. 1999). Suchapproaches have enabled communities to live in the harsh drylandenvironments for millennia. In oases, for example, traditionalmanagement approaches are based on the appropriate usage of thephysical and geomorphological factors. These include productionand distribution systems for water management, architectures thatregulate micro-climate, cultivation of salinity-tolerant fruit spe-cies such as the date palm, waste recycling systems, and sand dunestabilization techniques.
Traditional methods of water harvesting allow the replenish-ment of the resource and its long-term availability. They makeeffective use of local topographic and soil characteristics. In somecases, horizontal underground tunnels drain water from the sur-face of the groundwater table. Vertical ventilation shafts augmentsupplies by capturing night-time humidity. Locally adapted archi-tectural innovations are also used to facilitate water conservationby condensing atmospheric water, including stone heaps, drywalls, little cavities, and depressions in the soil, thus allowing theplants to overcome periods of high drought.
Contrary to the literal implication of the term, however, ‘‘tra-ditional’’ knowledge is not static but evolves over time, incorpo-rating elements of local experimentation and integrating newideas and technologies brought from outside or observed duringseasonal or temporary migrations (Mazzucato and Niemeijer2000b). Local knowledge can significantly contribute to humanwell-being because it has the benefit of integrating the multipleconstraints posed by the natural and social environment in waysthat are often lacking with introduced technologies. Where localapproaches are failing, it is important to distinguish cases wherethe technologies themselves are fine but need a more enablingpolitical or socioeconomic environment from those cases where atechnological solution is needed in the form of improved localtechnologies or the introduction of new technologies.
22.6.4.2 Adaptation of New Technologies
The gradual introduction, trial, and development of new technol-ogies have allowed considerable progress to be made in some dry-land farming communities (Chapman et al. 1996). The adaptationof new techniques is entirely dependent upon the skill and envi-ronmental awareness of dryland farmers (Twomlow et al. 1999).Integration of new technologies with tested management ap-proaches is a measure that can improve human well-being at vari-ous levels. Three such examples are:• Integrated water resource management approaches include
consideration of the full extent of water resources availablewithin a catchment. Even in hyper-arid areas, opportunitiescan often be identified to use additional water sources, such asrainwater, seasonal floodwaters, and wastewaters, to supple-ment over-reliance on groundwater or variable rainfalls. Cu-mulative uses of water in a catchment are also considered inorder to prevent overuse of water by multiple users over timeand the resulting depletion of aquifers.
• Integrated water and farming approaches highlight the impor-tance of considering water management in relation to otherfactors in the dryland production system. For example, thepotential to economically irrigate a crop of turnips to provide
................. 11432$ CH22 10-11-05 15:06:23 PS

656 Ecosystems and Human Well-being: Current State and Trends
an additional source of nutritional value for lactating dairycows is considerably affected by sowing dates, soil type, andinsect damage (Jacobs et al. 2004).
• Farming systems approaches (e.g., Singh 1998) look into thewhole production and farming system for synergies among itscomponents, such as arable cropping, livestock management,alternative land use systems, and management of village com-mons or degraded lands.
22.6.4.3 Capacity Building and Public Participation
Dynamically evolving local and ‘‘traditional’’ practices into whichadapted new technologies are integrated have the potential tobuild capacity for improving HWB in drylands. However, thispotential is not always realized. For example, the Indian NationalDemonstration Programme, which was coupled to training andvisiting system (beginning in the 1960s), was unsuccessful in thedrylands of India (Singh 1998). This was in contrast to the GreenRevolution that occurred elsewhere, with the instant adoption ofthe technology package over large areas in high-capacity irrigatedregions. Singh (1998) concludes that this was because the drylandfarmers were less willing to take risks and invest in the new tech-nologies since they were poorer to start with and suffered fromwater-related constraints and uncertainties in the productionprocess and because the demonstration approach could not con-vince them that the technologies were appropriate to their needs.Following such experiences, more-recent approaches to capacitydevelopment in drylands have adopted a more participatory ap-proach to capacity development, working with farmers as theydevelop their knowledge, according to their needs and percep-tions, rather than demonstrating to them what they could orshould do.
Similarly, participatory learning approaches have been used tofacilitate the transfer of technologies. In Australia, for example,increasing use is being made of on-farm experiments for capacitydevelopment (e.g., Foale et al. 2004; Lawrence et al. 2000). Pub-lic participation in resource-use decision-making in drylands isincreasingly seen as a key to demand-management for scarcewater resources (Kulkarni et al. 2004) and biodiversity conserva-tion (Solh et al. 2003). Participation in dryland decision-makingis generally structured according to the prevailing system of landand water rights. For instance, ‘‘community-based’’ projects inSudano-Sahelian West Africa have often attempted to improveresource management by spatially delimiting appropriate landuses, strengthening the community’s exclusionary powers, andclarifying specific claims to village resources. However, suchmoves can also increase social conflicts (Turner 1999). Thus, fur-ther experimentation and experience in merging ‘‘traditional’’with advanced knowledge as a tool for capacity building for in-creasing HWB in the drylands may still be required.
22.6.5 Services, Degradation, and Human Well-being
This chapter is an attempt to present ‘‘drylands’’ and ‘‘drylandpeoples’’ not as homogenous entities but as a continuum of eco-systems and their human inhabitants arranged along a global arid-ity gradient in which life and livelihoods are constrained by water.The magnitude of this constraint determines the makeup of thesuite of services provided by the ecosystems and, accordingly, theland uses by people and their respective livelihoods. The chapteralso examines the mutual interactions between ecosystems andpeople across this gradient and explores the degree to which theservices provided by the ecosystems are used sustainably or areoverexploited.
PAGE 656
The findings are that both sustainable use and overexploita-tion occur, but they depend more on socioeconomic drivers thanon the degree of water constraint and the resulting dimensionsand qualities of the provided ecosystem services. Thus the greatestpressure on ecosystem services takes place at intermediate aridityand not, as might be expected, in the least arid drylands wherepopulation density is highest, or in the most arid areas, wherepopulation is lowest. The high overexploitation of services is in-ferred by physical, biological, and social phenomena—soil erosionand salinization, reduced biodiversity and biological productivity,and reduced income expressed by reduced human well-being—and it is reflected by the highest rate of infant mortality and hun-ger among children. It can therefore be suggested that wherearidity is intermediate, on average, there is a mismatch betweenthe rate of service provision and the intensity of exploitation. Butthere are deviations from this average, expressed in sustainable useof the ecosystems.
Two interlinked drivers are involved in generating this sus-tainability. The first one is a selective use of services dependingon their divergent condition in different areas. For example, inareas where the quality and provision of cultural services are high,local people choose livelihoods served by cultural services (suchas ecotourism in the African savanna). And in areas where thequality of provisioning services is high, people choose livelihoodsserved by these services (such as food crops in natural or manageddesert oases). The second factor that promotes sustainability is theadaptation of sociocultural institutions and practices to the pre-vailing natural condition of the services and the implementationof policies that recognize the natural constraints and create eco-nomic instruments that provide for sustainability of the use ofservices, combined with the promotion of good human well-being.
This assessment also highlights the significance of dryland bio-diversity as a whole rather than just individual, selected species inthe provision of every single dryland service. It is therefore im-plied that livelihoods and human well-being depend on biodiver-sity just as they depend on services. Thus in addition to protectedareas, most dryland management, land uses, and livelihoods thatmaintain biodiversity in drylands will contribute significantly tothe well-being of dryland peoples. Also, the chapter suggests thatsome natural attributes of the drylands have the potential, alreadyrealized in some places, to provide dryland peoples with a com-petitive edge economically (through ‘‘alternative livelihoods,’’ forexample). Together with policies based on sociocultural and so-cioeconomic considerations, all dryland livelihoods—pastoral,farming, and ‘‘alternative’’—can contribute to alleviation of thecurrent high relative poverty and low human-well being of dry-land peoples.
ReferencesAbrahams, A., A. J. Parsons, and J. Wainwright, 1995: Effects of vegetation
change on inter-rill runoff and erosion, Walnut Gulch, southern Arizona.Geomorphology, 13, 37–48.
Ahmad, M., 2000: Water pricing and markets in the Near East: policy issuesand options. Water policy, 2, 229–242.
Aguiar, M. R. and O. E. Sala, 1999: Patch structure, dynamics and implicationsfor the functioning of arid ecosystems. Trends in Ecology and Systematics, 14(7),273–277.
Allen-Diaz, B., F. S. Chapin, S. Diaz, M. Howden, J. Puigdefabregas, andM. Stafford Smith, 1996: Rangelands in a changing climate: Impacts, adapta-tions and mitigation. In: Climate Change 1995—Impacts, Adaptation and Miti-gation, W. T. Watson, M. C. Zinyowera, R. H. Moss, and D. J. Dokken,(eds.), pp. 131–158.
Amous, S. 1997: The Role of Wood Energy in Africa. [online] Forestry Depart-ment, Food and Agriculture Organization of the United Nations, Rome,
................. 11432$ CH22 10-11-05 15:06:24 PS
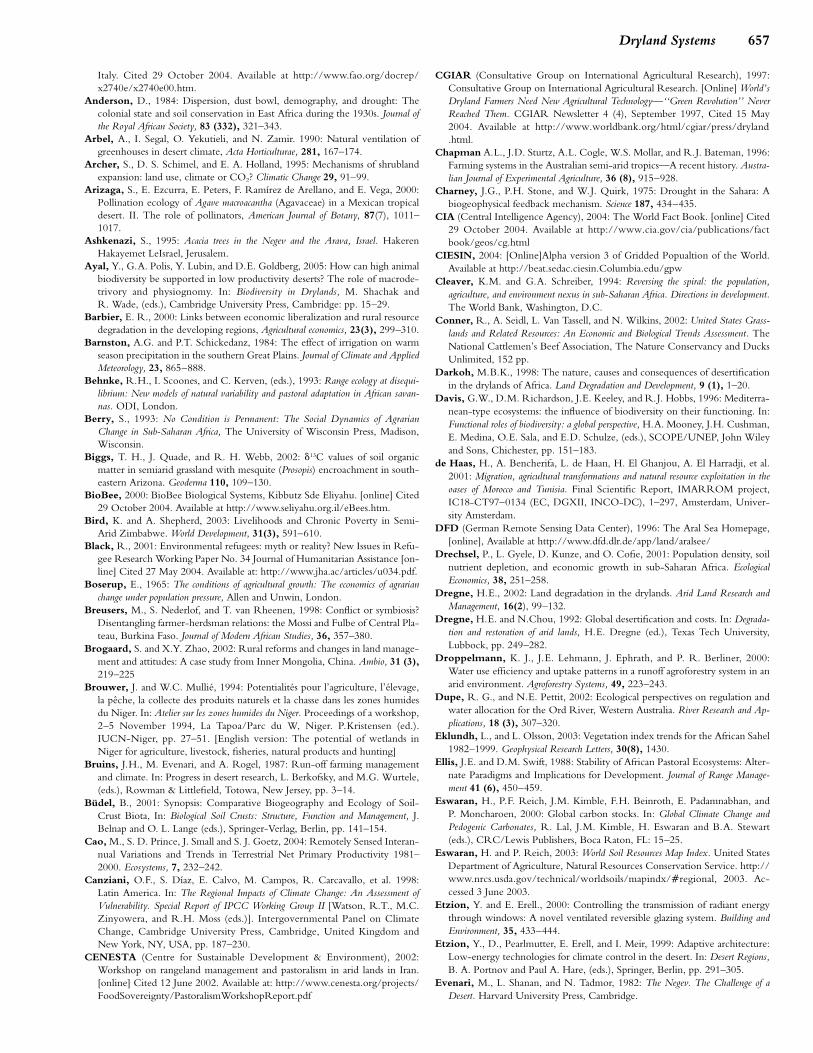
657Dryland Systems
Italy. Cited 29 October 2004. Available at http://www.fao.org/docrep/x2740e/x2740e00.htm.
Anderson, D., 1984: Dispersion, dust bowl, demography, and drought: Thecolonial state and soil conservation in East Africa during the 1930s. Journal ofthe Royal African Society, 83 (332), 321–343.
Arbel, A., I. Segal, O. Yekutieli, and N. Zamir. 1990: Natural ventilation ofgreenhouses in desert climate, Acta Horticulturae, 281, 167–174.
Archer, S., D. S. Schimel, and E. A. Holland, 1995: Mechanisms of shrublandexpansion: land use, climate or CO2? Climatic Change 29, 91–99.
Arizaga, S., E. Ezcurra, E. Peters, F. Ramırez de Arellano, and E. Vega, 2000:Pollination ecology of Agave macroacantha (Agavaceae) in a Mexican tropicaldesert. II. The role of pollinators, American Journal of Botany, 87(7), 1011–1017.
Ashkenazi, S., 1995: Acacia trees in the Negev and the Arava, Israel. HakerenHakayemet LeIsrael, Jerusalem.
Ayal, Y., G.A. Polis, Y. Lubin, and D.E. Goldberg, 2005: How can high animalbiodiversity be supported in low productivity deserts? The role of macrode-trivory and physiognomy. In: Biodiversity in Drylands, M. Shachak andR. Wade, (eds.), Cambridge University Press, Cambridge: pp. 15–29.
Barbier, E. R., 2000: Links between economic liberalization and rural resourcedegradation in the developing regions, Agricultural economics, 23(3), 299–310.
Barnston, A.G. and P.T. Schickedanz, 1984: The effect of irrigation on warmseason precipitation in the southern Great Plains. Journal of Climate and AppliedMeteorology, 23, 865–888.
Behnke, R.H., I. Scoones, and C. Kerven, (eds.), 1993: Range ecology at disequi-librium: New models of natural variability and pastoral adaptation in African savan-nas. ODI, London.
Berry, S., 1993: No Condition is Permanent: The Social Dynamics of AgrarianChange in Sub-Saharan Africa, The University of Wisconsin Press, Madison,Wisconsin.
Biggs, T. H., J. Quade, and R. H. Webb, 2002: �13C values of soil organicmatter in semiarid grassland with mesquite (Prosopis) encroachment in south-eastern Arizona. Geoderma 110, 109–130.
BioBee, 2000: BioBee Biological Systems, Kibbutz Sde Eliyahu. [online] Cited29 October 2004. Available at http://www.seliyahu.org.il/eBees.htm.
Bird, K. and A. Shepherd, 2003: Livelihoods and Chronic Poverty in Semi-Arid Zimbabwe. World Development, 31(3), 591–610.
Black, R., 2001: Environmental refugees: myth or reality? New Issues in Refu-gee Research Working Paper No. 34 Journal of Humanitarian Assistance [on-line] Cited 27 May 2004. Available at: http://www.jha.ac/articles/u034.pdf.
Boserup, E., 1965: The conditions of agricultural growth: The economics of agrarianchange under population pressure, Allen and Unwin, London.
Breusers, M., S. Nederlof, and T. van Rheenen, 1998: Conflict or symbiosis?Disentangling farmer-herdsman relations: the Mossi and Fulbe of Central Pla-teau, Burkina Faso. Journal of Modern African Studies, 36, 357–380.
Brogaard, S. and X.Y. Zhao, 2002: Rural reforms and changes in land manage-ment and attitudes: A case study from Inner Mongolia, China. Ambio, 31 (3),219–225
Brouwer, J. and W.C. Mullie, 1994: Potentialites pour l’agriculture, l’elevage,la peche, la collecte des produits naturels et la chasse dans les zones humidesdu Niger. In: Atelier sur les zones humides du Niger. Proceedings of a workshop,2–5 November 1994, La Tapoa/Parc du W, Niger. P.Kristensen (ed.).IUCN-Niger, pp. 27–51. [English version: The potential of wetlands inNiger for agriculture, livestock, fisheries, natural products and hunting]
Bruins, J.H., M. Evenari, and A. Rogel, 1987: Run-off farming managementand climate. In: Progress in desert research, L. Berkofsky, and M.G. Wurtele,(eds.), Rowman & Littlefield, Totowa, New Jersey, pp. 3–14.
Budel, B., 2001: Synopsis: Comparative Biogeography and Ecology of Soil-Crust Biota, In: Biological Soil Crusts: Structure, Function and Management, J.Belnap and O. L. Lange (eds.), Springer-Verlag, Berlin, pp. 141–154.
Cao, M., S. D. Prince, J. Small and S. J. Goetz, 2004: Remotely Sensed Interan-nual Variations and Trends in Terrestrial Net Primary Productivity 1981–2000. Ecosystems, 7, 232–242.
Canziani, O.F., S. Dıaz, E. Calvo, M. Campos, R. Carcavallo, et al. 1998:Latin America. In: The Regional Impacts of Climate Change: An Assessment ofVulnerability. Special Report of IPCC Working Group II [Watson, R.T., M.C.Zinyowera, and R.H. Moss (eds.)]. Intergovernmental Panel on ClimateChange, Cambridge University Press, Cambridge, United Kingdom andNew York, NY, USA, pp. 187–230.
CENESTA (Centre for Sustainable Development & Environment), 2002:Workshop on rangeland management and pastoralism in arid lands in Iran.[online] Cited 12 June 2002. Available at: http://www.cenesta.org/projects/FoodSovereignty/PastoralismWorkshopReport.pdf
PAGE 657
CGIAR (Consultative Group on International Agricultural Research), 1997:Consultative Group on International Agricultural Research. [Online] World’sDryland Farmers Need New Agricultural Technology—‘‘Green Revolution’’ NeverReached Them. CGIAR Newsletter 4 (4), September 1997, Cited 15 May2004. Available at http://www.worldbank.org/html/cgiar/press/dryland.html.
Chapman A.L., J.D. Sturtz, A.L. Cogle, W.S. Mollar, and R.J. Bateman, 1996:Farming systems in the Australian semi-arid tropics—A recent history. Austra-lian Journal of Experimental Agriculture, 36 (8), 915–928.
Charney, J.G., P.H. Stone, and W.J. Quirk, 1975: Drought in the Sahara: Abiogeophysical feedback mechanism. Science 187, 434–435.
CIA (Central Intelligence Agency), 2004: The World Fact Book. [online] Cited29 October 2004. Available at http://www.cia.gov/cia/publications/factbook/geos/cg.html
CIESIN, 2004: [Online]Alpha version 3 of Gridded Popualtion of the World.Available at http://beat.sedac.ciesin.Columbia.edu/gpw
Cleaver, K.M. and G.A. Schreiber, 1994: Reversing the spiral: the population,agriculture, and environment nexus in sub-Saharan Africa. Directions in development.The World Bank, Washington, D.C.
Conner, R., A. Seidl, L. Van Tassell, and N. Wilkins, 2002: United States Grass-lands and Related Resources: An Economic and Biological Trends Assessment. TheNational Cattlemen’s Beef Association, The Nature Conservancy and DucksUnlimited, 152 pp.
Darkoh, M.B.K., 1998: The nature, causes and consequences of desertificationin the drylands of Africa. Land Degradation and Development, 9 (1), 1–20.
Davis, G.W., D.M. Richardson, J.E. Keeley, and R.J. Hobbs, 1996: Mediterra-nean-type ecosystems: the influence of biodiversity on their functioning. In:Functional roles of biodiversity: a global perspective, H.A. Mooney, J.H. Cushman,E. Medina, O.E. Sala, and E.D. Schulze, (eds.), SCOPE/UNEP, John Wileyand Sons, Chichester, pp. 151–183.
de Haas, H., A. Bencherifa, L. de Haan, H. El Ghanjou, A. El Harradji, et al.2001: Migration, agricultural transformations and natural resource exploitation in theoases of Morocco and Tunisia. Final Scientific Report, IMARROM project,IC18-CT97–0134 (EC, DGXII, INCO-DC), 1–297, Amsterdam, Univer-sity Amsterdam.
DFD (German Remote Sensing Data Center), 1996: The Aral Sea Homepage,[online], Available at http://www.dfd.dlr.de/app/land/aralsee/
Drechsel, P., L. Gyele, D. Kunze, and O. Cofie, 2001: Population density, soilnutrient depletion, and economic growth in sub-Saharan Africa. EcologicalEconomics, 38, 251–258.
Dregne, H.E., 2002: Land degradation in the drylands. Arid Land Research andManagement, 16(2), 99–132.
Dregne, H.E. and N.Chou, 1992: Global desertification and costs. In: Degrada-tion and restoration of arid lands, H.E. Dregne (ed.), Texas Tech University,Lubbock, pp. 249–282.
Droppelmann, K. J., J.E. Lehmann, J. Ephrath, and P. R. Berliner, 2000:Water use efficiency and uptake patterns in a runoff agroforestry system in anarid environment. Agroforestry Systems, 49, 223–243.
Dupe, R. G., and N.E. Pettit, 2002: Ecological perspectives on regulation andwater allocation for the Ord River, Western Australia. River Research and Ap-plications, 18 (3), 307–320.
Eklundh, L., and L. Olsson, 2003: Vegetation index trends for the African Sahel1982–1999. Geophysical Research Letters, 30(8), 1430.
Ellis, J.E. and D.M. Swift, 1988: Stability of African Pastoral Ecosystems: Alter-nate Paradigms and Implications for Development. Journal of Range Manage-ment 41 (6), 450–459.
Eswaran, H., P.F. Reich, J.M. Kimble, F.H. Beinroth, E. Padamnabhan, andP. Moncharoen, 2000: Global carbon stocks. In: Global Climate Change andPedogenic Carbonates, R. Lal, J.M. Kimble, H. Eswaran and B.A. Stewart(eds.), CRC/Lewis Publishers, Boca Raton, FL: 15–25.
Eswaran, H. and P. Reich, 2003: World Soil Resources Map Index. United StatesDepartment of Agriculture, Natural Resources Conservation Service. http://www.nrcs.usda.gov/technical/worldsoils/mapindx/regional, 2003. Ac-cessed 3 June 2003.
Etzion, Y. and E. Erell., 2000: Controlling the transmission of radiant energythrough windows: A novel ventilated reversible glazing system. Building andEnvironment, 35, 433–444.
Etzion, Y., D., Pearlmutter, E. Erell, and I. Meir, 1999: Adaptive architecture:Low-energy technologies for climate control in the desert. In: Desert Regions,B. A. Portnov and Paul A. Hare, (eds.), Springer, Berlin, pp. 291–305.
Evenari, M., L. Shanan, and N. Tadmor, 1982: The Negev. The Challenge of aDesert. Harvard University Press, Cambridge.
................. 11432$ CH22 10-11-05 15:06:25 PS
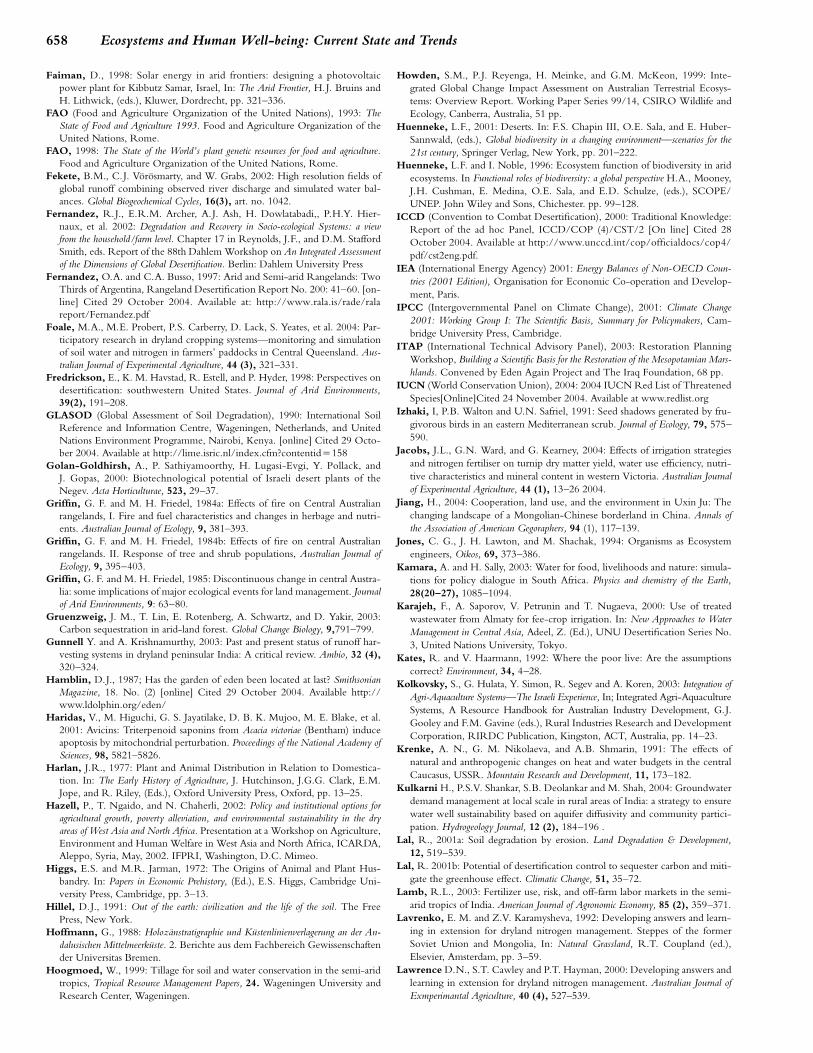
658 Ecosystems and Human Well-being: Current State and Trends
Faiman, D., 1998: Solar energy in arid frontiers: designing a photovoltaicpower plant for Kibbutz Samar, Israel, In: The Arid Frontier, H.J. Bruins andH. Lithwick, (eds.), Kluwer, Dordrecht, pp. 321–336.
FAO (Food and Agriculture Organization of the United Nations), 1993: TheState of Food and Agriculture 1993. Food and Agriculture Organization of theUnited Nations, Rome.
FAO, 1998: The State of the World’s plant genetic resources for food and agriculture.Food and Agriculture Organization of the United Nations, Rome.
Fekete, B.M., C.J. Vorosmarty, and W. Grabs, 2002: High resolution fields ofglobal runoff combining observed river discharge and simulated water bal-ances. Global Biogeochemical Cycles, 16(3), art. no. 1042.
Fernandez, R.J., E.R.M. Archer, A.J. Ash, H. Dowlatabadi,, P.H.Y. Hier-naux, et al. 2002: Degradation and Recovery in Socio-ecological Systems: a viewfrom the household/farm level. Chapter 17 in Reynolds, J.F., and D.M. StaffordSmith, eds. Report of the 88th Dahlem Workshop on An Integrated Assessmentof the Dimensions of Global Desertification. Berlin: Dahlem University Press
Fernandez, O.A. and C.A. Busso, 1997: Arid and Semi-arid Rangelands: TwoThirds of Argentina, Rangeland Desertification Report No. 200: 41–60. [on-line] Cited 29 October 2004. Available at: http://www.rala.is/rade/ralareport/Fernandez.pdf
Foale, M.A., M.E. Probert, P.S. Carberry, D. Lack, S. Yeates, et al. 2004: Par-ticipatory research in dryland cropping systems—monitoring and simulationof soil water and nitrogen in farmers’ paddocks in Central Queensland. Aus-tralian Journal of Experimental Agriculture, 44 (3), 321–331.
Fredrickson, E., K. M. Havstad, R. Estell, and P. Hyder, 1998: Perspectives ondesertification: southwestern United States. Journal of Arid Environments,39(2), 191–208.
GLASOD (Global Assessment of Soil Degradation), 1990: International SoilReference and Information Centre, Wageningen, Netherlands, and UnitedNations Environment Programme, Nairobi, Kenya. [online] Cited 29 Octo-ber 2004. Available at http://lime.isric.nl/index.cfm?contentid�158
Golan-Goldhirsh, A., P. Sathiyamoorthy, H. Lugasi-Evgi, Y. Pollack, andJ. Gopas, 2000: Biotechnological potential of Israeli desert plants of theNegev. Acta Horticulturae, 523, 29–37.
Griffin, G. F. and M. H. Friedel, 1984a: Effects of fire on Central Australianrangelands, I. Fire and fuel characteristics and changes in herbage and nutri-ents. Australian Journal of Ecology, 9, 381–393.
Griffin, G. F. and M. H. Friedel, 1984b: Effects of fire on central Australianrangelands. II. Response of tree and shrub populations, Australian Journal ofEcology, 9, 395–403.
Griffin, G. F. and M. H. Friedel, 1985: Discontinuous change in central Austra-lia: some implications of major ecological events for land management. Journalof Arid Environments, 9: 63–80.
Gruenzweig, J. M., T. Lin, E. Rotenberg, A. Schwartz, and D. Yakir, 2003:Carbon sequestration in arid-land forest. Global Change Biology, 9,791–799.
Gunnell Y. and A. Krishnamurthy, 2003: Past and present status of runoff har-vesting systems in dryland peninsular India: A critical review. Ambio, 32 (4),320–324.
Hamblin, D.J., 1987; Has the garden of eden been located at last? SmithsonianMagazine, 18. No. (2) [online] Cited 29 October 2004. Available http://www.ldolphin.org/eden/
Haridas, V., M. Higuchi, G. S. Jayatilake, D. B. K. Mujoo, M. E. Blake, et al.2001: Avicins: Triterpenoid saponins from Acacia victoriae (Bentham) induceapoptosis by mitochondrial perturbation. Proceedings of the National Academy ofSciences, 98, 5821–5826.
Harlan, J.R., 1977: Plant and Animal Distribution in Relation to Domestica-tion. In: The Early History of Agriculture, J. Hutchinson, J.G.G. Clark, E.M.Jope, and R. Riley, (Eds.), Oxford University Press, Oxford, pp. 13–25.
Hazell, P., T. Ngaido, and N. Chaherli, 2002: Policy and institutional options foragricultural growth, poverty alleviation, and environmental sustainability in the dryareas of West Asia and North Africa. Presentation at a Workshop on Agriculture,Environment and Human Welfare in West Asia and North Africa, ICARDA,Aleppo, Syria, May, 2002. IFPRI, Washington, D.C. Mimeo.
Higgs, E.S. and M.R. Jarman, 1972: The Origins of Animal and Plant Hus-bandry. In: Papers in Economic Prehistory, (Ed.), E.S. Higgs, Cambridge Uni-versity Press, Cambridge, pp. 3–13.
Hillel, D.J., 1991: Out of the earth: civilization and the life of the soil. The FreePress, New York.
Hoffmann, G., 1988: Holozanstratigraphie und Kustenlinienverlagerung an der An-dalusischen Mittelmeerkuste. 2. Berichte aus dem Fachbereich Gewissenschaftender Universitas Bremen.
Hoogmoed, W., 1999: Tillage for soil and water conservation in the semi-aridtropics, Tropical Resource Management Papers, 24. Wageningen University andResearch Center, Wageningen.
PAGE 658
Howden, S.M., P.J. Reyenga, H. Meinke, and G.M. McKeon, 1999: Inte-grated Global Change Impact Assessment on Australian Terrestrial Ecosys-tems: Overview Report. Working Paper Series 99/14, CSIRO Wildlife andEcology, Canberra, Australia, 51 pp.
Huenneke, L.F., 2001: Deserts. In: F.S. Chapin III, O.E. Sala, and E. Huber-Sannwald, (eds.), Global biodiversity in a changing environment—scenarios for the21st century, Springer Verlag, New York, pp. 201–222.
Huenneke, L.F. and I. Noble, 1996: Ecosystem function of biodiversity in aridecosystems. In Functional roles of biodiversity: a global perspective H.A., Mooney,J.H. Cushman, E. Medina, O.E. Sala, and E.D. Schulze, (eds.), SCOPE/UNEP. John Wiley and Sons, Chichester. pp. 99–128.
ICCD (Convention to Combat Desertification), 2000: Traditional Knowledge:Report of the ad hoc Panel, ICCD/COP (4)/CST/2 [On line] Cited 28October 2004. Available at http://www.unccd.int/cop/officialdocs/cop4/pdf/cst2eng.pdf.
IEA (International Energy Agency) 2001: Energy Balances of Non-OECD Coun-tries (2001 Edition), Organisation for Economic Co-operation and Develop-ment, Paris.
IPCC (Intergovernmental Panel on Climate Change), 2001: Climate Change2001: Working Group I: The Scientific Basis, Summary for Policymakers, Cam-bridge University Press, Cambridge.
ITAP (International Technical Advisory Panel), 2003: Restoration PlanningWorkshop, Building a Scientific Basis for the Restoration of the Mesopotamian Mars-hlands. Convened by Eden Again Project and The Iraq Foundation, 68 pp.
IUCN (World Conservation Union), 2004: 2004 IUCN Red List of ThreatenedSpecies[Online]Cited 24 November 2004. Available at www.redlist.org
Izhaki, I, P.B. Walton and U.N. Safriel, 1991: Seed shadows generated by fru-givorous birds in an eastern Mediterranean scrub. Journal of Ecology, 79, 575–590.
Jacobs, J.L., G.N. Ward, and G. Kearney, 2004: Effects of irrigation strategiesand nitrogen fertiliser on turnip dry matter yield, water use efficiency, nutri-tive characteristics and mineral content in western Victoria. Australian Journalof Experimental Agriculture, 44 (1), 13–26 2004.
Jiang, H., 2004: Cooperation, land use, and the environment in Uxin Ju: Thechanging landscape of a Mongolian-Chinese borderland in China. Annals ofthe Association of American Gegoraphers, 94 (1), 117–139.
Jones, C. G., J. H. Lawton, and M. Shachak, 1994: Organisms as Ecosystemengineers, Oikos, 69, 373–386.
Kamara, A. and H. Sally, 2003: Water for food, livelihoods and nature: simula-tions for policy dialogue in South Africa. Physics and chemistry of the Earth,28(20–27), 1085–1094.
Karajeh, F., A. Saporov, V. Petrunin and T. Nugaeva, 2000: Use of treatedwastewater from Almaty for fee-crop irrigation. In: New Approaches to WaterManagement in Central Asia, Adeel, Z. (Ed.), UNU Desertification Series No.3, United Nations University, Tokyo.
Kates, R. and V. Haarmann, 1992: Where the poor live: Are the assumptionscorrect? Environment, 34, 4–28.
Kolkovsky, S., G. Hulata, Y. Simon, R. Segev and A. Koren, 2003: Integration ofAgri-Aquaculture Systems—The Israeli Experience, In; Integrated Agri-AquacultureSystems, A Resource Handbook for Australian Industry Development, G.J.Gooley and F.M. Gavine (eds.), Rural Industries Research and DevelopmentCorporation, RIRDC Publication, Kingston, ACT, Australia, pp. 14–23.
Krenke, A. N., G. M. Nikolaeva, and A.B. Shmarin, 1991: The effects ofnatural and anthropogenic changes on heat and water budgets in the centralCaucasus, USSR. Mountain Research and Development, 11, 173–182.
Kulkarni H., P.S.V. Shankar, S.B. Deolankar and M. Shah, 2004: Groundwaterdemand management at local scale in rural areas of India: a strategy to ensurewater well sustainability based on aquifer diffusivity and community partici-pation. Hydrogeology Journal, 12 (2), 184–196 .
Lal, R., 2001a: Soil degradation by erosion. Land Degradation & Development,12, 519–539.
Lal, R. 2001b: Potential of desertification control to sequester carbon and miti-gate the greenhouse effect. Climatic Change, 51, 35–72.
Lamb, R.L., 2003: Fertilizer use, risk, and off-farm labor markets in the semi-arid tropics of India. American Journal of Agronomic Economy, 85 (2), 359–371.
Lavrenko, E. M. and Z.V. Karamysheva, 1992: Developing answers and learn-ing in extension for dryland nitrogen management. Steppes of the formerSoviet Union and Mongolia, In: Natural Grassland, R.T. Coupland (ed.),Elsevier, Amsterdam, pp. 3–59.
Lawrence D.N., S.T. Cawley and P.T. Hayman, 2000: Developing answers andlearning in extension for dryland nitrogen management. Australian Journal ofExmperimantal Agriculture, 40 (4), 527–539.
................. 11432$ CH22 10-11-05 15:06:25 PS
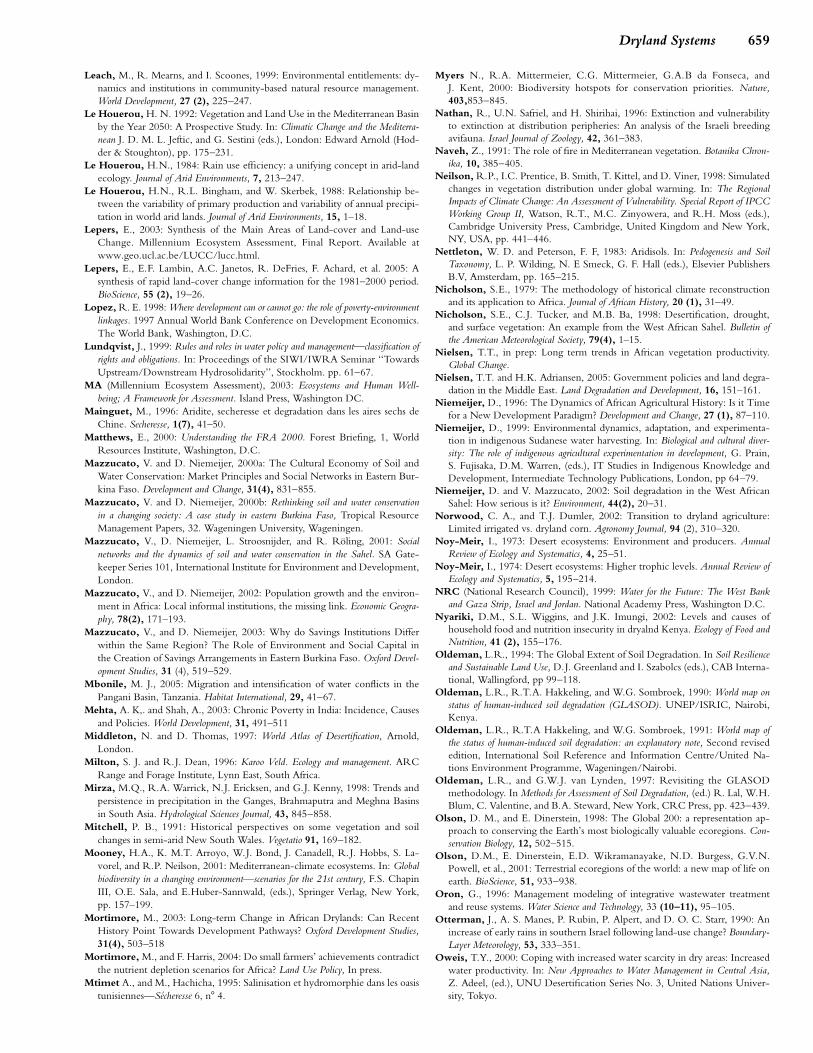
659Dryland Systems
Leach, M., R. Mearns, and I. Scoones, 1999: Environmental entitlements: dy-namics and institutions in community-based natural resource management.World Development, 27 (2), 225–247.
Le Houerou, H. N. 1992: Vegetation and Land Use in the Mediterranean Basinby the Year 2050: A Prospective Study. In: Climatic Change and the Mediterra-nean J. D. M. L. Jeftic, and G. Sestini (eds.), London: Edward Arnold (Hod-der & Stoughton), pp. 175–231.
Le Houerou, H.N., 1984: Rain use efficiency: a unifying concept in arid-landecology. Journal of Arid Environments, 7, 213–247.
Le Houerou, H.N., R.L. Bingham, and W. Skerbek, 1988: Relationship be-tween the variability of primary production and variability of annual precipi-tation in world arid lands. Journal of Arid Environments, 15, 1–18.
Lepers, E., 2003: Synthesis of the Main Areas of Land-cover and Land-useChange. Millennium Ecosystem Assessment, Final Report. Available atwww.geo.ucl.ac.be/LUCC/lucc.html.
Lepers, E., E.F. Lambin, A.C. Janetos, R. DeFries, F. Achard, et al. 2005: Asynthesis of rapid land-cover change information for the 1981–2000 period.BioScience, 55 (2), 19–26.
Lopez, R. E. 1998: Where development can or cannot go: the role of poverty-environmentlinkages. 1997 Annual World Bank Conference on Development Economics.The World Bank, Washington, D.C.
Lundqvist, J., 1999: Rules and roles in water policy and management—classification ofrights and obligations. In: Proceedings of the SIWI/IWRA Seminar ‘‘TowardsUpstream/Downstream Hydrosolidarity’’, Stockholm. pp. 61–67.
MA (Millennium Ecosystem Assessment), 2003: Ecosystems and Human Well-being; A Framework for Assessment. Island Press, Washington DC.
Mainguet, M., 1996: Aridite, secheresse et degradation dans les aires sechs deChine. Secheresse, 1(7), 41–50.
Matthews, E., 2000: Understanding the FRA 2000. Forest Briefing, 1, WorldResources Institute, Washington, D.C.
Mazzucato, V. and D. Niemeijer, 2000a: The Cultural Economy of Soil andWater Conservation: Market Principles and Social Networks in Eastern Bur-kina Faso. Development and Change, 31(4), 831–855.
Mazzucato, V. and D. Niemeijer, 2000b: Rethinking soil and water conservationin a changing society: A case study in eastern Burkina Faso, Tropical ResourceManagement Papers, 32. Wageningen University, Wageningen.
Mazzucato, V., D. Niemeijer, L. Stroosnijder, and R. Roling, 2001: Socialnetworks and the dynamics of soil and water conservation in the Sahel. SA Gate-keeper Series 101, International Institute for Environment and Development,London.
Mazzucato, V., and D. Niemeijer, 2002: Population growth and the environ-ment in Africa: Local informal institutions, the missing link. Economic Geogra-phy, 78(2), 171–193.
Mazzucato, V., and D. Niemeijer, 2003: Why do Savings Institutions Differwithin the Same Region? The Role of Environment and Social Capital inthe Creation of Savings Arrangements in Eastern Burkina Faso. Oxford Devel-opment Studies, 31 (4), 519–529.
Mbonile, M. J., 2005: Migration and intensification of water conflicts in thePangani Basin, Tanzania. Habitat International, 29, 41–67.
Mehta, A. K,. and Shah, A., 2003: Chronic Poverty in India: Incidence, Causesand Policies. World Development, 31, 491–511
Middleton, N. and D. Thomas, 1997: World Atlas of Desertification, Arnold,London.
Milton, S. J. and R.J. Dean, 1996: Karoo Veld. Ecology and management. ARCRange and Forage Institute, Lynn East, South Africa.
Mirza, M.Q., R.A. Warrick, N.J. Ericksen, and G.J. Kenny, 1998: Trends andpersistence in precipitation in the Ganges, Brahmaputra and Meghna Basinsin South Asia. Hydrological Sciences Journal, 43, 845–858.
Mitchell, P. B., 1991: Historical perspectives on some vegetation and soilchanges in semi-arid New South Wales. Vegetatio 91, 169–182.
Mooney, H.A., K. M.T. Arroyo, W.J. Bond, J. Canadell, R.J. Hobbs, S. La-vorel, and R.P. Neilson, 2001: Mediterranean-climate ecosystems. In: Globalbiodiversity in a changing environment—scenarios for the 21st century, F.S. ChapinIII, O.E. Sala, and E.Huber-Sannwald, (eds.), Springer Verlag, New York,pp. 157–199.
Mortimore, M., 2003: Long-term Change in African Drylands: Can RecentHistory Point Towards Development Pathways? Oxford Development Studies,31(4), 503–518
Mortimore, M., and F. Harris, 2004: Do small farmers’ achievements contradictthe nutrient depletion scenarios for Africa? Land Use Policy, In press.
Mtimet A., and M., Hachicha, 1995: Salinisation et hydromorphie dans les oasistunisiennes—Secheresse 6, n� 4.
PAGE 659
Myers N., R.A. Mittermeier, C.G. Mittermeier, G.A.B da Fonseca, andJ. Kent, 2000: Biodiversity hotspots for conservation priorities. Nature,403,853–845.
Nathan, R., U.N. Safriel, and H. Shirihai, 1996: Extinction and vulnerabilityto extinction at distribution peripheries: An analysis of the Israeli breedingavifauna. Israel Journal of Zoology, 42, 361–383.
Naveh, Z., 1991: The role of fire in Mediterranean vegetation. Botanika Chron-ika, 10, 385–405.
Neilson, R.P., I.C. Prentice, B. Smith, T. Kittel, and D. Viner, 1998: Simulatedchanges in vegetation distribution under global warming. In: The RegionalImpacts of Climate Change: An Assessment of Vulnerability. Special Report of IPCCWorking Group II, Watson, R.T., M.C. Zinyowera, and R.H. Moss (eds.),Cambridge University Press, Cambridge, United Kingdom and New York,NY, USA, pp. 441–446.
Nettleton, W. D. and Peterson, F. F, 1983: Aridisols. In: Pedogenesis and SoilTaxonomy, L. P. Wilding, N. E Smeck, G. F. Hall (eds.), Elsevier PublishersB.V, Amsterdam, pp. 165–215.
Nicholson, S.E., 1979: The methodology of historical climate reconstructionand its application to Africa. Journal of African History, 20 (1), 31–49.
Nicholson, S.E., C.J. Tucker, and M.B. Ba, 1998: Desertification, drought,and surface vegetation: An example from the West African Sahel. Bulletin ofthe American Meteorological Society, 79(4), 1–15.
Nielsen, T.T., in prep: Long term trends in African vegetation productivity.Global Change.
Nielsen, T.T. and H.K. Adriansen, 2005: Government policies and land degra-dation in the Middle East. Land Degradation and Development, 16, 151–161.
Niemeijer, D., 1996: The Dynamics of African Agricultural History: Is it Timefor a New Development Paradigm? Development and Change, 27 (1), 87–110.
Niemeijer, D., 1999: Environmental dynamics, adaptation, and experimenta-tion in indigenous Sudanese water harvesting. In: Biological and cultural diver-sity: The role of indigenous agricultural experimentation in development, G. Prain,S. Fujisaka, D.M. Warren, (eds.), IT Studies in Indigenous Knowledge andDevelopment, Intermediate Technology Publications, London, pp 64–79.
Niemeijer, D. and V. Mazzucato, 2002: Soil degradation in the West AfricanSahel: How serious is it? Environment, 44(2), 20–31.
Norwood, C. A., and T.J. Dumler, 2002: Transition to dryland agriculture:Limited irrigated vs. dryland corn. Agronomy Journal, 94 (2), 310–320.
Noy-Meir, I., 1973: Desert ecosystems: Environment and producers. AnnualReview of Ecology and Systematics, 4, 25–51.
Noy-Meir, I., 1974: Desert ecosystems: Higher trophic levels. Annual Review ofEcology and Systematics, 5, 195–214.
NRC (National Research Council), 1999: Water for the Future: The West Bankand Gaza Strip, Israel and Jordan. National Academy Press, Washington D.C.
Nyariki, D.M., S.L. Wiggins, and J.K. Imungi, 2002: Levels and causes ofhousehold food and nutrition insecurity in dryalnd Kenya. Ecology of Food andNutrition, 41 (2), 155–176.
Oldeman, L.R., 1994: The Global Extent of Soil Degradation. In Soil Resilienceand Sustainable Land Use, D.J. Greenland and I. Szabolcs (eds.), CAB Interna-tional, Wallingford, pp 99–118.
Oldeman, L.R., R.T.A. Hakkeling, and W.G. Sombroek, 1990: World map onstatus of human-induced soil degradation (GLASOD). UNEP/ISRIC, Nairobi,Kenya.
Oldeman, L.R., R.T.A Hakkeling, and W.G. Sombroek, 1991: World map ofthe status of human-induced soil degradation: an explanatory note, Second revisededition, International Soil Reference and Information Centre/United Na-tions Environment Programme, Wageningen/Nairobi.
Oldeman, L.R., and G.W.J. van Lynden, 1997: Revisiting the GLASODmethodology. In Methods for Assessment of Soil Degradation, (ed.) R. Lal, W.H.Blum, C. Valentine, and B.A. Steward, New York, CRC Press, pp. 423–439.
Olson, D. M., and E. Dinerstein, 1998: The Global 200: a representation ap-proach to conserving the Earth’s most biologically valuable ecoregions. Con-servation Biology, 12, 502–515.
Olson, D.M., E. Dinerstein, E.D. Wikramanayake, N.D. Burgess, G.V.N.Powell, et al., 2001: Terrestrial ecoregions of the world: a new map of life onearth. BioScience, 51, 933–938.
Oron, G., 1996: Management modeling of integrative wastewater treatmentand reuse systems. Water Science and Technology, 33 (10–11), 95–105.
Otterman, J., A. S. Manes, P. Rubin, P. Alpert, and D. O. C. Starr, 1990: Anincrease of early rains in southern Israel following land-use change? Boundary-Layer Meteorology, 53, 333–351.
Oweis, T.Y., 2000: Coping with increased water scarcity in dry areas: Increasedwater productivity. In: New Approaches to Water Management in Central Asia,Z. Adeel, (ed.), UNU Desertification Series No. 3, United Nations Univer-sity, Tokyo.
................. 11432$ CH22 10-11-05 15:06:26 PS

660 Ecosystems and Human Well-being: Current State and Trends
Pacey, A., and A. Cullis, 1986: Rainwater harvesting. The collection of rainfall andrunoff in rural areas. Intermediate Technology Publications, London.
Paine, R.T., 1966: Food web complexity and species diversity, American Natu-ralist, 100, 65–75.
Pearlmutter, D. and P. Berliner, 1999: Urban microclimate in the desert: plan-ning for outdoor comfort under arid conditions, In: Desert Regions, B.A.Portnov and A. Paul Hare, (eds.), Springer, Berlin, pp. 279–290.
Pender J.L. and J.M. Kerr, 1998: Determinants of farmers’ indigenous soil andwater conservation investments in semi-arid India. Agricultural Economy, 19(1–2), 113–125.
Pender, J., S. J. Scherr, and G. Duron, 2001: Pathways of development inthe hillsides of Honduras: causes and implications for agricultural production,poverty, and sustainable resource use. In: Tradeoffs or Synergies? AgriculturalIntensification, Economic Development and the Environment, D.R., Lee, and C. BBarrett, (eds.), Wallingford, UK: CAB International.
Pickup, G., 1996: Estimating the effects of land degradation and rainfall varia-tion on productivity in rangelands: an approach using remote sensing andmodels of grazing and herbage dynamics. Journal of Applied Ecology, 33, 819–832.
Poesen, J., J. Nachtergaele, G. Verstraeten, and C.Valentin, 2003: Gully erosionand environmental change: importance and research needs. Catena 50(2),91–133.
Pohoryles, S., 2000: Program for efficient water use in Middle East agriculture,In: Water for Peace in the Middle East and Southern Africa, Green Cross Interna-tional, The Hague, pp. 18–38.
Portnov, B.A. and U.N. Safriel, 2004: Combating desertification in the Negev:dryland agriculture vs. dryland urbanization. Journal of Arid Environment, 56,659–680.
Prain, G., S. Fujisaka, and M.D. Warren, (eds.), 1999: Biological and agriculutraldiversity: The role of indigneous agricultural experimentation in development. Inter-mediate Technology Publications, London, 218 pp.
Prince, S.D., 1991: A model of regional primary production for use withcoarse-resolution satellite data. International Journal of Remote Sensing, 12,1313–1330.
Prince, S.D., 1999: What practical information about land-surface function canbe determined by remote sensing? Where do we stand? In: Integrating hydrol-ogy, ecosystem dynamics, and biogeochemistry in complex landscapes, J. D. Tenhu-nen and P. Kabat (eds), Dahlem Workshop Reports, John Wiley & Sons Ltd.,Chichester, pp 39–60.
Prince, S.D., 2002: Spatial and temporal scales of measurement of desertifica-tion. In: Global desertification: do humans create deserts? M. Stafford-Smith andJ. F. Reynolds (eds.), Dahlem University Press, Berlin, pp. 23–40.
Prince, S.D., 2004: Mapping desertification in Southern Africa In: Land ChangeScience: Observing, Monitoring, and Understanding Trajectories of Change on theEarth’s Surface. G. Gutman, A. Janetos, C. O. Justice, et al., (eds.), Kluwer,Dordrecht, pp. 163–184.
Prince, S.D., E. Brown de Colstoun, and L.L. Kravitz, 1998: Evidence fromrain-use efficiencies does not indicate extensive Sahelian desertification.Global Change Biology, 4(4), 359–374.
Prospero, J.M. and R.T. Nees, 1986: Impact of the North African droughtand El Nino on mineral dust in the Barabados Trade Winds. Nature, 320,735–738.
Prudencio, C.Y., 1993: Ring Management of Soils and Crops in the WestAfrican Semi-Arid Tropics: The Case of the Mossi Farming System in Bur-kina Faso, Agriculture, Ecosystems and Environment, 47 (3), 237–264.
Puigdefabregas, J., 1998: Ecological impacts of global change on drylands andtheir implications for desertification. Land Degradation & Development, 9, 393–406.
Puigdefabregas, J., A., Sole, L. Gutierrez, G. del Barrio and M. Boer, 1999:Scales and processes of water redistribution in drylands: results from the Ram-bla Honda field site in southeast Spain. Earth Science Reviews, 48, 39–70.
Puigdefabregas, J. and T. Mendizabal, 1998: Perspectives on desertification:western Mediterranean. Journal of Arid Environments, 39, 209–224.
Ramankutty, N. and J.A. Foley, 1999: Estimating historical changes in globalland cover: Croplands from 1700 to 1992. Global Biogechemical Cycles, 13[4],997–1027.
Reich, P., H. Eswaran, S. Kapur, S. and E. Akca, 2000: Land Degradationand Desertification in Desert Margins, [online] International Symposium OnDesertification/2000-Konya, Cited 29 October 2004. Available at http://www.toprak.org.tr/isd/isd
Reid, R.S., P.K. Thornton, G.J. McCRabb, R.L. Kruska, F. Atieno, and P.G.Jones, 2004: Is it possible to mitigate greenhouse gas emissions in pastoralecosystems of the tropics? Development and Sustainability, 6, 91–109.
PAGE 660
Reij, C., P. Mulder, and L. Begemann, 1988: Water harvesting for Plant Production.World Bank Technical Paper, 91, World Bank, Washington, D.C.
Reij, C., I., Scoones, and C. Toulmin, 1996: Sustaining the Soil: Indigenous Soiland Water Conservation in Africa. Earthscan, London.
Richmond, A., 1986: Halotolerant microalage: A future crop for arid lands. in:Progress in Desert Research, L. Berkofsky and M.G. Wurtele (eds.), Rowman &Littlefield, Totowa, New Jersey, pp. 67–86.
Robbins, L.H., 1984: Late Prehistoric Aquatic and Pastoral Adaptations Westof Lake Turkana, Kenya. In: From Hunters to Farmers: The Causes and Conse-quences of Food Production in Africa,. J.D. Clark, and S.A. Brandt, (eds.), Uni-versity of California Press, Berkeley, London, pp. 206–211.
Roquero, C., 1990: Mediterranean soils behavior in relation to soil erosion. In:Strategies to combat desertification in Mediterranean Europe, J.L.Rubio and R.J.Rickson (eds.), Commission of the European Communities, Luxembourg,pp. 40–76.
Rosenzweig, M. L., 1995: Species Diversity in Space and Time. CambridgeUniversity Press, Cambridge.
Rosenzweig, M.L. and Z.Abramsky, 1993: How are diversity and productivityrelated? In: Species diversity in ecological communities: historical and geographicalperspectives, R.E. Ricklefs and D. Schluter, (eds), University of Chicago Press,Chicago, pp 52–65.
Ruf, T, 1995: Histoire hydraulique et agricole et lutte contre la salinisation dansle delta du Nil. Secheresse, 4(6), 307–318.
Rust, R. H., 1983: Alfisols, In: Pedogenesis and Soil Taxonomy, L. P. Wilding,N. E. Smeck, and G. F. Hall, (eds.), Elsevier Publishers D.V., Amsterdam,pp. 253–281.
Safriel, U.N, 1992: The regional and global significance of environmental pro-tection, nature conservation and ecological research in Israel. In Judaism andEcology: Aubrey Rose (ed.) Cassell, London, .pp. 91–99.
Safriel, U.N., 1999: The concept of sustainability in dryland ecosystems. in:T. W. Hoekstra and M. Shachak (eds.), Arid Lands Management—Toward Eco-logical Sustainability, Urbana: University of Illinois Press, pp. 117–140.
Sala, O.E., W.K. Laurenroth, S.J. McNaughton, G. Rusch, and X. Zang, 1996:Biodiversity and ecosystem function in grasslands. In: Functional roles of biodiv-ersity: a global perspective, H.A. Mooney, J.H. Cushman, E. Medina, O.E. Salaand E.D. Schulze (eds.), SCOPE/UNEP, John Wiley and Sons, Chichester,pp. 129–149.
Sala, O.E., F.S. Chapin III, J.J. Armesto, E. Berlow, J. Bloomfield, et al. 2000:Global Biodiversity Scenarios for the Year 2100, Science, 287, 1770–1774.
Sanders, J. H., B. I. Shapiro and S. Ramaswamy, 1996: The Economics of Agricul-tural Technology Development in Sub-Saharan Africa. John Hopkins UniversityPress, USA.
Sauerhaft, B., P.R. Berliner, and T.L. Thurow, 1998: The fuelwood crisis inarid zones: runoff agriculture for renewable energy production. In: The AridFrontier, H.J. Bruins, and H. Lithwick, (eds.), Kluwer, Dordrecht, pp. 351–364.
Sarch, M-T, and C. Birkett, 2000: Fishing and Farming at Lake Chad: Re-sponses to Lake-level Fluctuations. Geographical Journal, 166, 156–172.
Schlesinger, W.H., 1999: Carbon sequestration in soils. Science, 284: 2095.Schlesinger, W.H., J.F. Reynolds, G.L. Cunningham, L.F. Huenneke, W.M.
Jarrell, R.A. Virginia, and W.G. Whitford, 1990: Biological feedbacks inGlobal Desertification. Science, 247, 1043–1048.
Schmidt-Nielsen, K., 1980: Desert Animals: Physiological Problems of Heat andWater. Dover Publications, New York.
Scholes, R. J. and D. O. Hall, 1996: The carbon budget of tropical savannas,woodlands and grasslands. In: Global Change: Effects on Coniferous Forests andGrasslands, A. I. Breymeyer, D. O. Hall, J. M. Melillo, and G. I. Agren,(Eds.), John Wiley & Sons Ltd., pp. 71–100.
Scoones, I. (ed.), 2001: Dynamics and diversity: Soil fertility and farming livelihoodsin Africa. Earthscan, London, 244 pp.
Scoones, I. and C. Toulmin, 1998: Soil nutrient budgets and balances: what usefor policy? Agriculture, Ecosystems & Environment, 71, 255–267.
Shachak, M., and G.M. Lovett, 1998: Atmospheric deposition to a desert eco-system and its implication for management. Ecological Applications, 8, 455–463.
Shachak, M. and S.T.A. Picket, 1997: Linking ecological understanding andapplication: patchiness in a dryland system. In: The Ecological Basis of Conserva-tion, S.T.A. Pickett, R.S. Ostfeld, M. Shachak and G.E. Likens (eds.), Chap-man & Hall, New York, pp. 108–119.
Shah, T., A. D. Roy, A. S. Qureshi, and J. X. Wang, 2001: Sustaining Asia’sgroundwater boom: An overview of issues and evidence. [Online] Cited 29October 2004. Available at: http://www.water-2001.de/supporting/Asia_Groundwater_Boom.pdf.
................. 11432$ CH22 10-11-05 15:06:27 PS
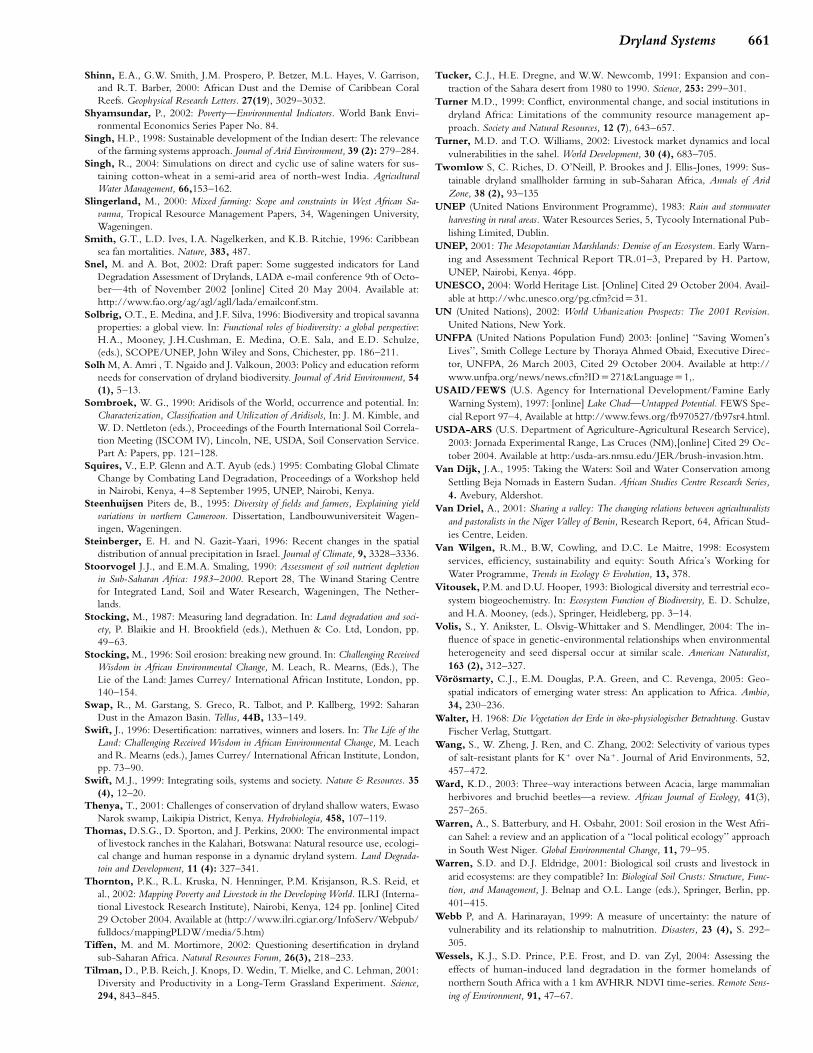
661Dryland Systems
Shinn, E.A., G.W. Smith, J.M. Prospero, P. Betzer, M.L. Hayes, V. Garrison,and R.T. Barber, 2000: African Dust and the Demise of Caribbean CoralReefs. Geophysical Research Letters. 27(19), 3029–3032.
Shyamsundar, P., 2002: Poverty—Environmental Indicators. World Bank Envi-ronmental Economics Series Paper No. 84.
Singh, H.P., 1998: Sustainable development of the Indian desert: The relevanceof the farming systems approach. Journal of Arid Environment, 39 (2): 279–284.
Singh, R., 2004: Simulations on direct and cyclic use of saline waters for sus-taining cotton-wheat in a semi-arid area of north-west India. AgriculturalWater Management, 66,153–162.
Slingerland, M., 2000: Mixed farming: Scope and constraints in West African Sa-vanna, Tropical Resource Management Papers, 34, Wageningen University,Wageningen.
Smith, G.T., L.D. Ives, I.A. Nagelkerken, and K.B. Ritchie, 1996: Caribbeansea fan mortalities. Nature, 383, 487.
Snel, M. and A. Bot, 2002: Draft paper: Some suggested indicators for LandDegradation Assessment of Drylands, LADA e-mail conference 9th of Octo-ber—4th of November 2002 [online] Cited 20 May 2004. Available at:http://www.fao.org/ag/agl/agll/lada/emailconf.stm.
Solbrig, O.T., E. Medina, and J.F. Silva, 1996: Biodiversity and tropical savannaproperties: a global view. In: Functional roles of biodiversity: a global perspective:H.A., Mooney, J.H.Cushman, E. Medina, O.E. Sala, and E.D. Schulze,(eds.), SCOPE/UNEP, John Wiley and Sons, Chichester, pp. 186–211.
Solh M, A. Amri , T. Ngaido and J. Valkoun, 2003: Policy and education reformneeds for conservation of dryland biodiversity. Journal of Arid Environment, 54(1), 5–13.
Sombroek, W. G., 1990: Aridisols of the World, occurrence and potential. In:Characterization, Classification and Utilization of Aridisols, In: J. M. Kimble, andW. D. Nettleton (eds.), Proceedings of the Fourth International Soil Correla-tion Meeting (ISCOM IV), Lincoln, NE, USDA, Soil Conservation Service.Part A: Papers, pp. 121–128.
Squires, V., E.P. Glenn and A.T. Ayub (eds.) 1995: Combating Global ClimateChange by Combating Land Degradation, Proceedings of a Workshop heldin Nairobi, Kenya, 4–8 September 1995, UNEP, Nairobi, Kenya.
Steenhuijsen Piters de, B., 1995: Diversity of fields and farmers, Explaining yieldvariations in northern Cameroon. Dissertation, Landbouwuniversiteit Wagen-ingen, Wageningen.
Steinberger, E. H. and N. Gazit-Yaari, 1996: Recent changes in the spatialdistribution of annual precipitation in Israel. Journal of Climate, 9, 3328–3336.
Stoorvogel J.J., and E.M.A. Smaling, 1990: Assessment of soil nutrient depletionin Sub-Saharan Africa: 1983–2000. Report 28, The Winand Staring Centrefor Integrated Land, Soil and Water Research, Wageningen, The Nether-lands.
Stocking, M., 1987: Measuring land degradation. In: Land degradation and soci-ety, P. Blaikie and H. Brookfield (eds.), Methuen & Co. Ltd, London, pp.49–63.
Stocking, M., 1996: Soil erosion: breaking new ground. In: Challenging ReceivedWisdom in African Environmental Change, M. Leach, R. Mearns, (Eds.), TheLie of the Land: James Currey/ International African Institute, London, pp.140–154.
Swap, R., M. Garstang, S. Greco, R. Talbot, and P. Kallberg, 1992: SaharanDust in the Amazon Basin. Tellus, 44B, 133–149.
Swift, J., 1996: Desertification: narratives, winners and losers. In: The Life of theLand: Challenging Received Wisdom in African Environmental Change, M. Leachand R. Mearns (eds.), James Currey/ International African Institute, London,pp. 73–90.
Swift, M.J., 1999: Integrating soils, systems and society. Nature & Resources. 35(4), 12–20.
Thenya, T., 2001: Challenges of conservation of dryland shallow waters, EwasoNarok swamp, Laikipia District, Kenya. Hydrobiologia, 458, 107–119.
Thomas, D.S.G., D. Sporton, and J. Perkins, 2000: The environmental impactof livestock ranches in the Kalahari, Botswana: Natural resource use, ecologi-cal change and human response in a dynamic dryland system. Land Degrada-toin and Development, 11 (4): 327–341.
Thornton, P.K., R.L. Kruska, N. Henninger, P.M. Krisjanson, R.S. Reid, etal., 2002: Mapping Poverty and Livestock in the Developing World. ILRI (Interna-tional Livestock Research Institute), Nairobi, Kenya, 124 pp. [online] Cited29 October 2004. Available at (http://www.ilri.cgiar.org/InfoServ/Webpub/fulldocs/mappingPLDW/media/5.htm)
Tiffen, M. and M. Mortimore, 2002: Questioning desertification in drylandsub-Saharan Africa. Natural Resources Forum, 26(3), 218–233.
Tilman, D., P.B. Reich, J. Knops, D. Wedin, T. Mielke, and C. Lehman, 2001:Diversity and Productivity in a Long-Term Grassland Experiment. Science,294, 843–845.
PAGE 661
Tucker, C.J., H.E. Dregne, and W.W. Newcomb, 1991: Expansion and con-traction of the Sahara desert from 1980 to 1990. Science, 253: 299–301.
Turner M.D., 1999: Conflict, environmental change, and social institutions indryland Africa: Limitations of the community resource management ap-proach. Society and Natural Resources, 12 (7), 643–657.
Turner, M.D. and T.O. Williams, 2002: Livestock market dynamics and localvulnerabilities in the sahel. World Development, 30 (4), 683–705.
Twomlow S, C. Riches, D. O’Neill, P. Brookes and J. Ellis-Jones, 1999: Sus-tainable dryland smallholder farming in sub-Saharan Africa, Annals of AridZone, 38 (2), 93–135
UNEP (United Nations Environment Programme), 1983: Rain and stormwaterharvesting in rural areas. Water Resources Series, 5, Tycooly International Pub-lishing Limited, Dublin.
UNEP, 2001: The Mesopotamian Marshlands: Demise of an Ecosystem. Early Warn-ing and Assessment Technical Report TR.01–3, Prepared by H. Partow,UNEP, Nairobi, Kenya. 46pp.
UNESCO, 2004: World Heritage List. [Online] Cited 29 October 2004. Avail-able at http://whc.unesco.org/pg.cfm?cid�31.
UN (United Nations), 2002: World Urbanization Prospects: The 2001 Revision.United Nations, New York.
UNFPA (United Nations Population Fund) 2003: [online] ‘‘Saving Women’sLives’’, Smith College Lecture by Thoraya Ahmed Obaid, Executive Direc-tor, UNFPA, 26 March 2003, Cited 29 October 2004. Available at http://www.unfpa.org/news/news.cfm?ID�271&Language�1,.
USAID/FEWS (U.S. Agency for International Development/Famine EarlyWarning System), 1997: [online] Lake Chad—Untapped Potential. FEWS Spe-cial Report 97–4, Available at http://www.fews.org/fb970527/fb97sr4.html.
USDA-ARS (U.S. Department of Agriculture-Agricultural Research Service),2003: Jornada Experimental Range, Las Cruces (NM),[online] Cited 29 Oc-tober 2004. Available at http:/usda-ars.nmsu.edu/JER/brush-invasion.htm.
Van Dijk, J.A., 1995: Taking the Waters: Soil and Water Conservation amongSettling Beja Nomads in Eastern Sudan. African Studies Centre Research Series,4. Avebury, Aldershot.
Van Driel, A., 2001: Sharing a valley: The changing relations between agriculturalistsand pastoralists in the Niger Valley of Benin, Research Report, 64, African Stud-ies Centre, Leiden.
Van Wilgen, R.M., B.W, Cowling, and D.C. Le Maitre, 1998: Ecosystemservices, efficiency, sustainability and equity: South Africa’s Working forWater Programme, Trends in Ecology & Evolution, 13, 378.
Vitousek, P.M. and D.U. Hooper, 1993: Biological diversity and terrestrial eco-system biogeochemistry. In: Ecosystem Function of Biodiversity, E. D. Schulze,and H.A. Mooney, (eds.), Springer, Heidleberg, pp. 3–14.
Volis, S., Y. Anikster, L. Olsvig-Whittaker and S. Mendlinger, 2004: The in-fluence of space in genetic-environmental relationships when environmentalheterogeneity and seed dispersal occur at similar scale. American Naturalist,163 (2), 312–327.
Vorosmarty, C.J., E.M. Douglas, P.A. Green, and C. Revenga, 2005: Geo-spatial indicators of emerging water stress: An application to Africa. Ambio,34, 230–236.
Walter, H. 1968: Die Vegetation der Erde in oko-physiologischer Betrachtung. GustavFischer Verlag, Stuttgart.
Wang, S., W. Zheng, J. Ren, and C. Zhang, 2002: Selectivity of various typesof salt-resistant plants for K� over Na�. Journal of Arid Environments, 52,457–472.
Ward, K.D., 2003: Three–way interactions between Acacia, large mammalianherbivores and bruchid beetles—a review. African Journal of Ecology, 41(3),257–265.
Warren, A., S. Batterbury, and H. Osbahr, 2001: Soil erosion in the West Afri-can Sahel: a review and an application of a ‘‘local political ecology’’ approachin South West Niger. Global Environmental Change, 11, 79–95.
Warren, S.D. and D.J. Eldridge, 2001: Biological soil crusts and livestock inarid ecosystems: are they compatible? In: Biological Soil Crusts: Structure, Func-tion, and Management, J. Belnap and O.L. Lange (eds.), Springer, Berlin, pp.401–415.
Webb P, and A. Harinarayan, 1999: A measure of uncertainty: the nature ofvulnerability and its relationship to malnutrition. Disasters, 23 (4), S. 292–305.
Wessels, K.J., S.D. Prince, P.E. Frost, and D. van Zyl, 2004: Assessing theeffects of human-induced land degradation in the former homelands ofnorthern South Africa with a 1 km AVHRR NDVI time-series. Remote Sens-ing of Environment, 91, 47–67.
................. 11432$ CH22 10-11-05 15:06:28 PS
662 Ecosystems and Human Well-being: Current State and Trends
White, R.P, S. Murray, and M. Rohweder, 2000: Pilot Analysis of Global Ecosys-tems (PAGE): Grassland Ecosystems. World Resources Institute, Washington,DC, 69 pp.
Whitford, W.G. and L.W. Parker, 1989: Contributions of soil fauna to decom-position and mineralization processes in semiarid and arid ecosystems. AridSoil Research and Rehabilitation, 3, 199–215.
WHO (World Health Organization), 2004: Global Database on Child Growthand Malnutrition. [Online] Cited 22 July 2004. Available at: http://www.who.int/nutgrowthdb/
Williams, M.A.J. and R.J. Balling, 1995: Interactions of Desertification and Cli-mate. Edward Arnold Press, London.
Williams, J.R. and P.I. Diebel, 1996: The economic value of the prairie. In:Prairie Conservation: Preserving North America’s Most Endangered Ecosystem, F.B.Samson and F.I. Knopf, (ed.), Island Press, Washington, DC, pp 19–35.
World Bank, 2003a: BioCarbon Funds, World Bank, Washington, DC.World Bank, 2003b: ProtoType Carbon Funds, World Bank, Washington, DC.WRI (World Resources Institute), 2004: EarthTrends, the Environmental Infor-
mation Portal [Online], Drylands, People, and Ecosystem Goods and Ser-
PAGE 662
vices: A Web-based Geospatial Analysis (pdf version), by R.P. White andJ. Nackoney. Cited 29 October.
WWF/IUCN (World Wide Fund for Nature/World Conservation Union),1994: Centres of Plant Diversity: a guide and strategy for their conservation. IUCNPublications Unit, 3 volumes, Cambridge, UK.
Xue, Y. and P.A. Dirmeyer, 2004: The Sahelian climate. In: Vegetation, Water,Humans, and the Climate: A New Perspective on an Interactive System, P. Kabat,M. Claussen, P.A. Dirmeyer, J.H.C. Gash, L. Bravo de Guenni, et al. (eds.),Springer, New York, pp. 59–78.
Zaal, F., and R.H. Oostendorp, 2002: Explaining a miracle: Intensification andthe transition towards sustainable small-scale agriculture in dryland Machakosand Kitui Districts, Kenya World Development, 30 (7), 1271–1287.
Zeidler, J., S. Hanrahan, and M. Scholes, 2002: Landuse intensity affects rangecondition in arid to semi-arid Namibia. Journal of Arid Environments, 52 (3),389–403.
Zohary, M., 1973: Geobotanical Foundations of the Middle East. Gustav FischerVerlag, Sttutgart.
................. 11432$ CH22 10-11-05 15:06:28 PS