2019 LOCAL CAPACITY TECHNICAL ANALYSIS FINAL REPORT …€¦ · LOCAL CAPACITY TECHNICAL ANALYSIS...
98
2019 LOCAL CAPACITY TECHNICAL ANALYSIS FINAL REPORT AND STUDY RESULTS April 30, 2014 California Independent System Operator
Transcript of 2019 LOCAL CAPACITY TECHNICAL ANALYSIS FINAL REPORT …€¦ · LOCAL CAPACITY TECHNICAL ANALYSIS...

2019 LOCAL CAPACITY TECHNICAL
ANALYSIS
FINAL REPORT AND STUDY RESULTS
April 30, 2014
California Independent
System Operator
1
Local Capacity Technical Analysis Overview and Study Results
I. Executive Summary
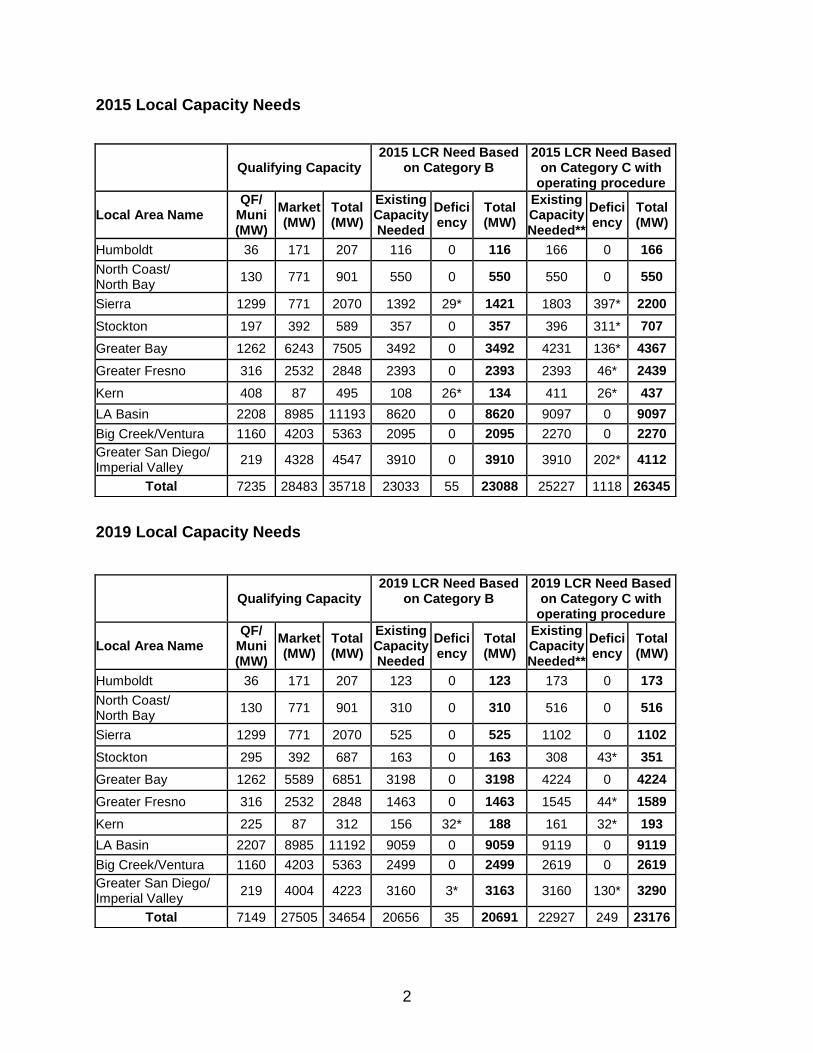
This Report documents the results and recommendations of the 2019 Long-Term
Local Capacity Technical (LCT) Study. The LCT Study objectives, inputs,
methodologies and assumptions are the same as those discussed in the 2015 LCT
Study to be adopted by the CAISO and CPUC in their 2015 Local Resource Adequacy
needs.
Overall, the LCR trend compared with 2018, is downward by about 3200 MW
mainly due to lower load forecast and new transmission projects. It is worth mentioning
the following areas: (1) Humboldt, North Coast/North Bay, Sierra, Stockton, Bay Area,
Big Creek/Ventura and San Diego, LCR has decreased mostly due to load forecast; (2)
Fresno and LA Basin, where the LCR has significantly decreased mostly due to new
transmission projects; (3) Kern where LCR has significantly decreased due to new
transmission projects and resulting area redefinition.
This Valley Electric Association (VEA) area is eliminated due to new transmission
projects, the incorporation of the VEA UVLS model into the contingency analysis as well
as the availability of ISO operating procedure 7910 that addresses some category C
issues.
The load forecast used in this study is based on the final adopted California
Energy Demand 2014 - 2024 Final Forecast developed by the CEC; namely the mid-
demand baseline with low-mid additional achievable energy efficiency (AAEE), posted
at: http://www.energy.ca.gov/2013_energypolicy/documents/.
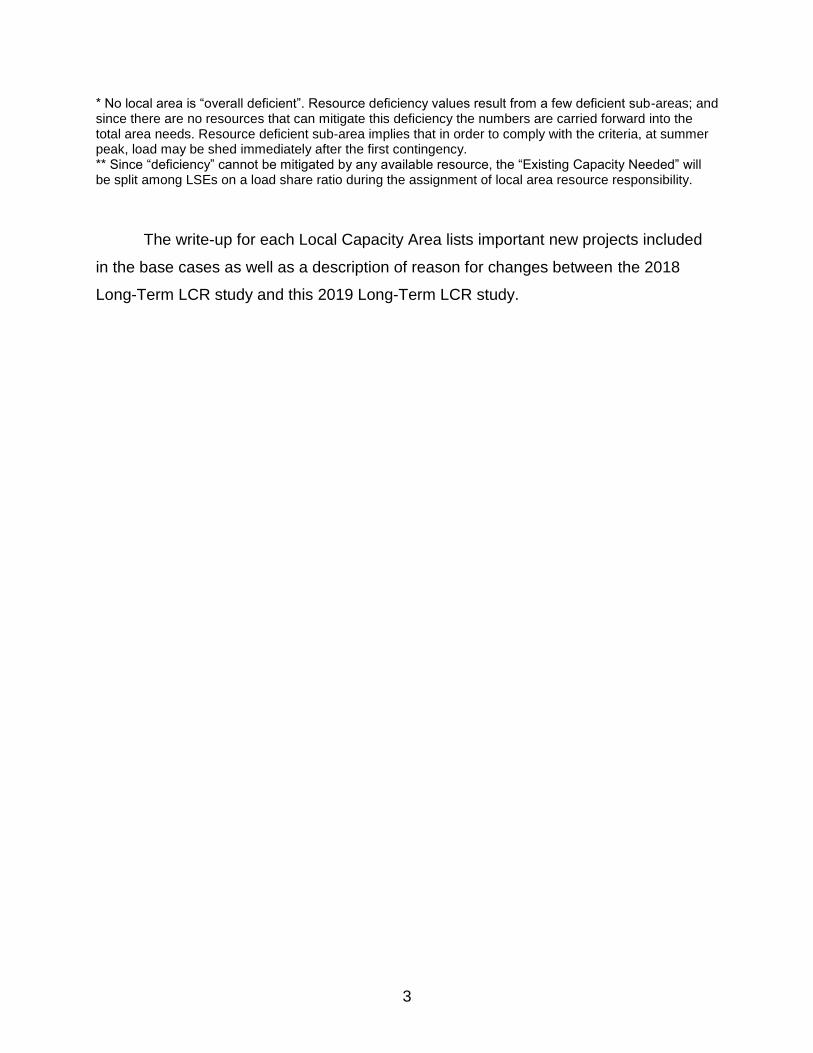
For comparison below you will find the 2015 and 2019 total LCR needs.
2
2015 Local Capacity Needs
2019 Local Capacity Needs
Qualifying Capacity 2019 LCR Need Based
on Category B
2019 LCR Need Based on Category C with
operating procedure
Local Area Name QF/
Muni (MW)
Market (MW)
Total (MW)
Existing Capacity Needed
Deficiency
Total (MW)
Existing Capacity Needed**
Deficiency
Total (MW)
Humboldt 36 171 207 123 0 123 173 0 173
North Coast/ North Bay
130 771 901 310 0 310 516 0 516
Sierra 1299 771 2070 525 0 525 1102 0 1102
Stockton 295 392 687 163 0 163 308 43* 351
Greater Bay 1262 5589 6851 3198 0 3198 4224 0 4224
Greater Fresno 316 2532 2848 1463 0 1463 1545 44* 1589
Kern 225 87 312 156 32* 188 161 32* 193
LA Basin 2207 8985 11192 9059 0 9059 9119 0 9119
Big Creek/Ventura 1160 4203 5363 2499 0 2499 2619 0 2619
Greater San Diego/ Imperial Valley
219 4004 4223 3160 3* 3163 3160 130* 3290
Total 7149 27505 34654 20656 35 20691 22927 249 23176
Qualifying Capacity 2015 LCR Need Based
on Category B
2015 LCR Need Based on Category C with
operating procedure
Local Area Name QF/
Muni (MW)
Market (MW)
Total (MW)
Existing Capacity Needed
Deficiency
Total (MW)
Existing Capacity Needed**
Deficiency
Total (MW)
Humboldt 36 171 207 116 0 116 166 0 166
North Coast/ North Bay
130 771 901 550 0 550 550 0 550
Sierra 1299 771 2070 1392 29* 1421 1803 397* 2200
Stockton 197 392 589 357 0 357 396 311* 707
Greater Bay 1262 6243 7505 3492 0 3492 4231 136* 4367
Greater Fresno 316 2532 2848 2393 0 2393 2393 46* 2439
Kern 408 87 495 108 26* 134 411 26* 437
LA Basin 2208 8985 11193 8620 0 8620 9097 0 9097
Big Creek/Ventura 1160 4203 5363 2095 0 2095 2270 0 2270
Greater San Diego/ Imperial Valley
219 4328 4547 3910 0 3910 3910 202* 4112
Total 7235 28483 35718 23033 55 23088 25227 1118 26345
3
* No local area is “overall deficient”. Resource deficiency values result from a few deficient sub-areas; and since there are no resources that can mitigate this deficiency the numbers are carried forward into the total area needs. Resource deficient sub-area implies that in order to comply with the criteria, at summer peak, load may be shed immediately after the first contingency. ** Since “deficiency” cannot be mitigated by any available resource, the “Existing Capacity Needed” will be split among LSEs on a load share ratio during the assignment of local area resource responsibility.
The write-up for each Local Capacity Area lists important new projects included
in the base cases as well as a description of reason for changes between the 2018
Long-Term LCR study and this 2019 Long-Term LCR study.
4
Table of Contents
I. Executive Summary .............................................................................................................. 1
II. Overview of the Study: Inputs, Outputs and Options ....................................................... 5
A. Objectives ............................................................................................................................ 5
B. Key Study Assumptions ....................................................................................................... 5 Inputs and Methodology ......................................................................................................... 5
C. Grid Reliability ................................................................................................................... 7
D. Application of N-1, N-1-1, and N-2 Criteria....................................................................... 8
E. Performance Criteria .......................................................................................................... 8
F. The Two Options Presented In This LCT Report .............................................................. 14
1. Option 1- Meet Performance Criteria Category B ........................................................ 15 2. Option 2- Meet Performance Criteria Category C and Incorporate Suitable Operational
Solutions ............................................................................................................................... 15
III. Assumption Details: How the Study was Conducted .................................................. 15
A. System Planning Criteria .................................................................................................. 15
1. Power Flow Assessment: .............................................................................................. 17 2. Post Transient Load Flow Assessment: ........................................................................ 18
3. Stability Assessment: .................................................................................................... 18
B. Load Forecast ............................................................................................................... 18
1. System Forecast ............................................................................................................ 18 2. Base Case Load Development Method ......................................................................... 19
C. Power Flow Program Used in the LCR analysis .......................................................... 20
IV. Locational Capacity Requirement Study Results ........................................................ 21
A. Summary of Study Results ................................................................................................. 21
B. Summary of Results by Local Area ................................................................................... 23 1. Humboldt Area.............................................................................................................. 23 2. North Coast / North Bay Area ...................................................................................... 26
3. Sierra Area .................................................................................................................... 33 4. Stockton Area................................................................................................................ 42
5. Greater Bay Area .......................................................................................................... 47 6. Greater Fresno Area ...................................................................................................... 56
7. Kern Area ...................................................................................................................... 62 8. LA Basin Area .............................................................................................................. 64 9. Big Creek/Ventura Area ............................................................................................... 79 10. Greater San Diego-Imperial Valley Area ................................................................. 89 11. Valley Electric Area .................................................................................................. 96
5
II. Overview of the Study: Inputs, Outputs and Options
A. Objectives
As was the objective of all previous LCT Studies, the intent of the 2019 Long-
Term LCT Study is to identify specific areas within the CAISO Balancing Authority Area
that have limited import capability and determine the minimum generation capacity
(MW) necessary to mitigate the local reliability problems in those areas.
B. Key Study Assumptions
Inputs and Methodology
The CAISO used the same Inputs and Methodology as does agreed upon by
interested parties previously incorporated into the 2015 LCR Study. The following table
sets forth a summary of the approved inputs and methodology that have been used in
the previous 2015 LCR Study as well as this 2019 LCR Study:

6
Summary Table of Inputs and Methodology Used in this LCR Study:
Issue: HOW INCORPORATED INTO THIS LCR
STUDY:
Input Assumptions:
Transmission System
Configuration
The existing transmission system has been modeled, including
all projects operational on or before June 1, of the study year
and all other feasible operational solutions brought forth by the
PTOs and as agreed to by the CAISO.
Generation Modeled The existing generation resources has been modeled and also
includes all projects that will be on-line and commercial on or
before June 1, of the study year
Load Forecast Uses a 1-in-10 year summer peak load forecast
Methodology:
Maximize Import Capability Import capability into the load pocket has been maximized, thus
minimizing the generation required in the load pocket to meet
applicable reliability requirements.
QF/Nuclear/State/Federal Units
Regulatory Must-take and similarly situated units like
QF/Nuclear/State/Federal resources have been modeled on-line
at qualifying capacity output values for purposes of this LCR
Study.
Maintaining Path Flows Path flows have been maintained below all established path
ratings into the load pockets, including the 500 kV. For
clarification, given the existing transmission system
configuration, the only 500 kV path that flows directly into a
load pocket and will, therefore, be considered in this LCR Study
is the South of Lugo transfer path flowing into the LA Basin.
Performance Criteria:
Performance Level B & C, including incorporation of PTO operational solutions
This LCR Study is being published based on Performance Level
B and Performance Level C criterion, yielding the low and high
range LCR scenarios. In addition, the CAISO will incorporate
all new projects and other feasible and CAISO-approved
operational solutions brought forth by the PTOs that can be
operational on or before June 1, of the study year. Any such
solutions that can reduce the need for procurement to meet the
Performance Level C criteria will be incorporated into the LCR
Study.
Load Pocket:
Fixed Boundary, including limited reference to published effectiveness factors
This LCR Study has been produced based on load pockets
defined by a fixed boundary. The CAISO only publishes
effectiveness factors where they are useful in facilitating
procurement where excess capacity exists within a load pocket.

7
Further details regarding the 2015 as well as 2019 LCR Study methodology and
assumptions are provided in Section III, below.
C. Grid Reliability
Service reliability builds from grid reliability because grid reliability is reflected in
the planning standards of the Western Electricity Coordinating Council (“WECC”) that
incorporate standards set by the North American Electric Reliability Council (“NERC”)
(collectively “NERC Planning Standards”). The NERC Planning Standards apply to the
interconnected electric system in the United States and are intended to address the
reality that within an integrated network, whatever one Balancing Authority Area does
can affect the reliability of other Balancing Authority Areas. Consistent with the
mandatory nature of the NERC Planning Standards, the CAISO is under a statutory
obligation to ensure efficient use and reliable operation of the transmission grid
consistent with achievement of the NERC Planning Standards.1 The CAISO is further
under an obligation, pursuant to its FERC-approved Transmission Control Agreement,
to secure compliance with all “Applicable Reliability Criteria.” Applicable Reliability
Criteria consists of the NERC Planning Standards as well as reliability criteria adopted
by the CAISO, in consultation with the CAISO’s Participating Transmission Owners
(“PTOs”), which affect a PTO’s individual system.
The NERC Planning Standards define reliability on interconnected electric
systems using the terms “adequacy” and “security.” “Adequacy” is the ability of the
electric systems to supply the aggregate electrical demand and energy requirements of
their customers at all times, taking into account physical characteristics of the
transmission system such as transmission ratings and scheduled and reasonably
expected unscheduled outages of system elements. “Security” is the ability of the
electric systems to withstand sudden disturbances such as electric short circuits or
unanticipated loss of system elements. The NERC Planning Standards are organized
by Performance Categories. Certain categories require that the grid operator not only
ensure that grid integrity is maintained under certain adverse system conditions (e.g.,
1 Pub. Utilities Code § 345
8
security), but also that all customers continue to receive electric supply to meet demand
(e.g., adequacy). In that case, grid reliability and service reliability would overlap. But
there are other levels of performance where security can be maintained without
ensuring adequacy.
D. Application of N-1, N-1-1, and N-2 Criteria
The CAISO will maintain the system in a safe operating mode at all times. This
obligation translates into respecting the Reliability Criteria at all times, for example
during normal operating conditions (N-0) the CAISO must protect for all single
contingencies (N-1) and common mode (N-2) double line outages. Also, after a single
contingency, the CAISO must re-adjust the system to support the loss of the next most
stringent contingency. This is referred to as the N-1-1 condition.
The N-1-1 vs N-2 terminology was introduced only as a mere temporal
differentiation between two existing NERC Category C events. N-1-1 represents NERC
Category C3 (“category B contingency, manual system adjustment, followed by another
category B contingency”). The N-2 represents NERC Category C5 (“any two circuits of a
multiple circuit tower line”) as well as WECC-S2 (for 500 kV only) (“any two circuits in
the same right-of-way”) with no manual system adjustment between the two
contingencies.
E. Performance Criteria
As set forth on the Summary Table of Inputs and Methodology, this LCR Report
is based on NERC Performance Level B and Performance Level C criterion. The NERC
Standards refer mainly to thermal overloads. However, the CAISO also tests the
electric system in regards to the dynamic and reactive margin compliance with the
existing WECC standards for the same NERC performance levels. These Performance
Levels can be described as follows:

9
a. Performance Criteria- Category B
Category B describes the system performance that is expected immediately
following the loss of a single transmission element, such as a transmission circuit, a
generator, or a transformer.
Category B system performance requires that all thermal and voltage limits must
be within their “Applicable Rating,” which, in this case, are the emergency ratings as
generally determined by the PTO or facility owner. Applicable Rating includes a
temporal element such that emergency ratings can only be maintained for certain
duration. Under this category, load cannot be shed in order to assure the Applicable
Ratings are met however there is no guarantee that facilities are returned to within
normal ratings or to a state where it is safe to continue to operate the system in a
reliable manner such that the next element out will not cause a violation of the
Applicable Ratings.
b. Performance Criteria- Category C
The NERC Planning Standards require system operators to “look forward” to
make sure they safely prepare for the “next” N-1 following the loss of the “first” N-1 (stay
within Applicable Ratings after the “next” N-1). This is commonly referred to as N-1-1.
Because it is assumed that some time exists between the “first” and “next” element
losses, operating personnel may make any reasonable and feasible adjustments to the
system to prepare for the loss of the second element, including, operating procedures,
dispatching generation, moving load from one substation to another to reduce
equipment loading, dispatching operating personnel to specific station locations to
manually adjust load from the substation site, or installing a “Special Protection
Scheme” that would remove pre-identified load from service upon the loss of the “next “

10
element.2 All Category C requirements in this report refer to situations when in real time
(N-0) or after the first contingency (N-1) the system requires additional readjustment in
order to prepare for the next worst contingency. In this time frame, load drop is not
allowed per existing planning criteria.
Generally, Category C describes system performance that is expected following
the loss of two or more system elements. This loss of two elements is generally
expected to happen simultaneously, referred to as N-2. It should be noted that once the
“next” element is lost after the first contingency, as discussed above under the
Performance Criteria B, N-1-1 scenario, the event is effectively a Category C. As noted
above, depending on system design and expected system impacts, the planned and
controlled interruption of supply to customers (load shedding), the removal from
service of certain generators and curtailment of exports may be utilized to maintain grid
“security.”
c. CAISO Statutory Obligation Regarding Safe Operation
The CAISO will maintain the system in a safe operating mode at all times. This
obligation translates into respecting the Reliability Criteria at all times, for example
during normal operating conditions A (N-0) the CAISO must protect for all single
contingencies B (N-1) and common mode C5 (N-2) double line outages. As a further
example, after a single contingency the CAISO must readjust the system in order to be
able to support the loss of the next most stringent contingency C3 (N-1-1).
2 A Special Protection Scheme is typically proposed as an operational solution that does not require
additional generation and permits operators to effectively prepare for the next event as well as ensure security should the next event occur. However, these systems have their own risks, which limit the extent to which they could be deployed as a solution for grid reliability augmentation. While they provide the value of protecting against the next event without the need for pre-contingency load shedding, they add points of potential failure to the transmission network. This increases the potential for load interruptions because sometimes these systems will operate when not required and other times they will not operate when needed.
11
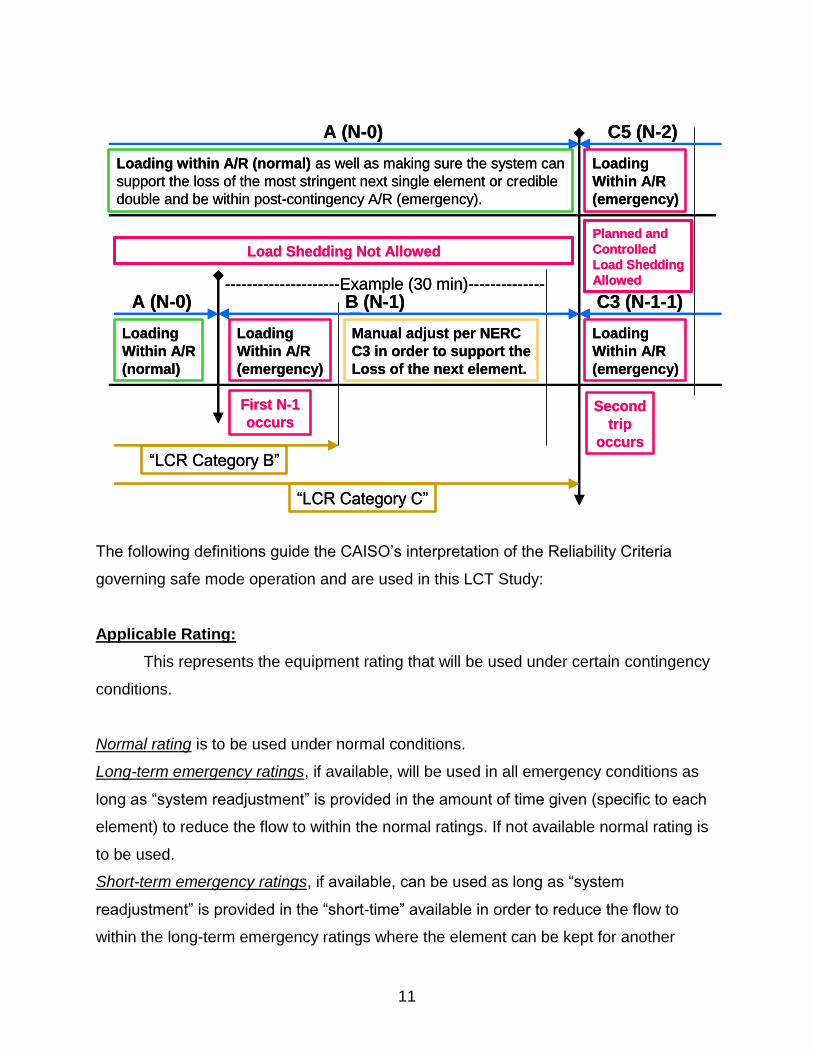
The following definitions guide the CAISO’s interpretation of the Reliability Criteria
governing safe mode operation and are used in this LCT Study:
Applicable Rating:
This represents the equipment rating that will be used under certain contingency
conditions.
Normal rating is to be used under normal conditions.
Long-term emergency ratings, if available, will be used in all emergency conditions as
long as “system readjustment” is provided in the amount of time given (specific to each
element) to reduce the flow to within the normal ratings. If not available normal rating is
to be used.
Short-term emergency ratings, if available, can be used as long as “system
readjustment” is provided in the “short-time” available in order to reduce the flow to
within the long-term emergency ratings where the element can be kept for another
First N-1
occurs
Loading
Within A/R
(normal)
Loading
Within A/R
(emergency)
---------------------Example (30 min)--------------
Manual adjust per NERC
C3 in order to support the
Loss of the next element.
“LCR Category B”
Second
trip
occurs
A (N-0) C3 (N-1-1)B (N-1)
Planned and
Controlled
Load Shedding
Allowed
Loading
Within A/R
(emergency)
“LCR Category C”
Load Shedding Not Allowed
C5 (N-2)A (N-0)
Loading
Within A/R
(emergency)
Loading within A/R (normal) as well as making sure the system can
support the loss of the most stringent next single element or credible
double and be within post-contingency A/R (emergency).
12
length of time (specific to each element) before the flow needs to be reduced the below
the normal ratings. If not available long-term emergency rating should be used.
Temperature-adjusted ratings shall not be used because this is a year-ahead study not
a real-time tool, as such the worst-case scenario must be covered. In case temperature-
adjusted ratings are the only ratings available then the minimum rating (highest
temperature) given the study conditions shall be used.
CAISO Transmission Register is the only official keeper of all existing ratings mentioned
above.
Ratings for future projects provided by PTO and agree upon by the CAISO shall be
used.
Other short-term ratings not included in the CAISO Transmission Register may be used
as long as they are engineered, studied and enforced through clear operating
procedures that can be followed by real-time operators.
Path Ratings need to be maintained in order for these studies to comply with the
Minimum Operating Reliability Criteria and assure that proper capacity is available in
order to operate the system in real-time.
Controlled load drop:
This is achieved with the use of a Special Protection Scheme.
Planned load drop:
This is achieved when the most limiting equipment has short-term emergency
ratings AND the operators have an operating procedure that clearly describes the
actions that need to be taken in order to shed load.
Special Protection Scheme:
All known SPS shall be assumed. New SPS must be verified and approved by
the CAISO and must comply with the new SPS guideline described in the CAISO
Planning Standards.
System Readjustment:
13
This represents the actions taken by operators in order to bring the system within
a safe operating zone after any given contingency in the system.
Actions that can be taken as system readjustment after a single contingency (Category
B):
1. System configuration change – based on validated and approved operating
procedures
2. Generation re-dispatch
a. Decrease generation (up to 1150 MW) – limit given by single contingency
SPS as part of the CAISO Grid Planning standards (ISO G4)
b. Increase generation – this generation will become part of the LCR need
Actions, which shall not be taken as system readjustment after a single contingency
(Category B):
1. Load drop – based on the intent of the CAISO/WECC and NERC criteria for
category B contingencies.
This is one of the most controversial aspects of the interpretation of the existing
NERC criteria because the NERC Planning Standards footnote mentions that load
shedding can be done after a category B event in certain local areas in order to
maintain compliance with performance criteria. However, the main body of the criteria
spells out that no dropping of load should be done following a single contingency. All
stakeholders and the CAISO agree that no involuntary interruption of load should be
done immediately after a single contingency. Further, the CAISO and stakeholders now
agree on the viability of dropping load as part of the system readjustment period – in
order to protect for the next most limiting contingency. After a single contingency, it is
understood that the system is in a Category B condition and the system should be
planned based on the body of the criteria with no shedding of load regardless of
whether it is done immediately or in 15-30 minute after the original contingency.
Category C conditions only arrive after the second contingency has happened; at that
point in time, shedding load is allowed in a planned and controlled manner.
14
A robust California transmission system should be, and under the LCT Study is being,
planned based on the main body of the criteria, not the footnote regarding Category B
contingencies. Therefore, if there are available resources in the area, they are looked to
meet reliability needs (and included in the LCR requirement) before resorting to
involuntary load curtailment. The footnote may be applied for criteria compliance issues
only where there are no resources available in the area.
Time allowed for manual readjustment:
This is the amount of time required for the operator to take all actions necessary
to prepare the system for the next contingency. This time should be less than 30
minutes, based on existing CAISO Planning Standards.
This is a somewhat controversial aspect of the interpretation of existing criteria.
This item is very specific in the CAISO Planning Standards. However, some will argue
that 30 minutes only allows generation re-dispatch and automated switching where
remote control is possible. If remote capability does not exist, a person must be
dispatched in the field to do switching and 30 minutes may not allow sufficient time. If
approved, an exemption from the existing time requirements may be given for small
local areas with very limited exposure and impact, clearly described in operating
procedures, and only until remote controlled switching equipment can be installed.
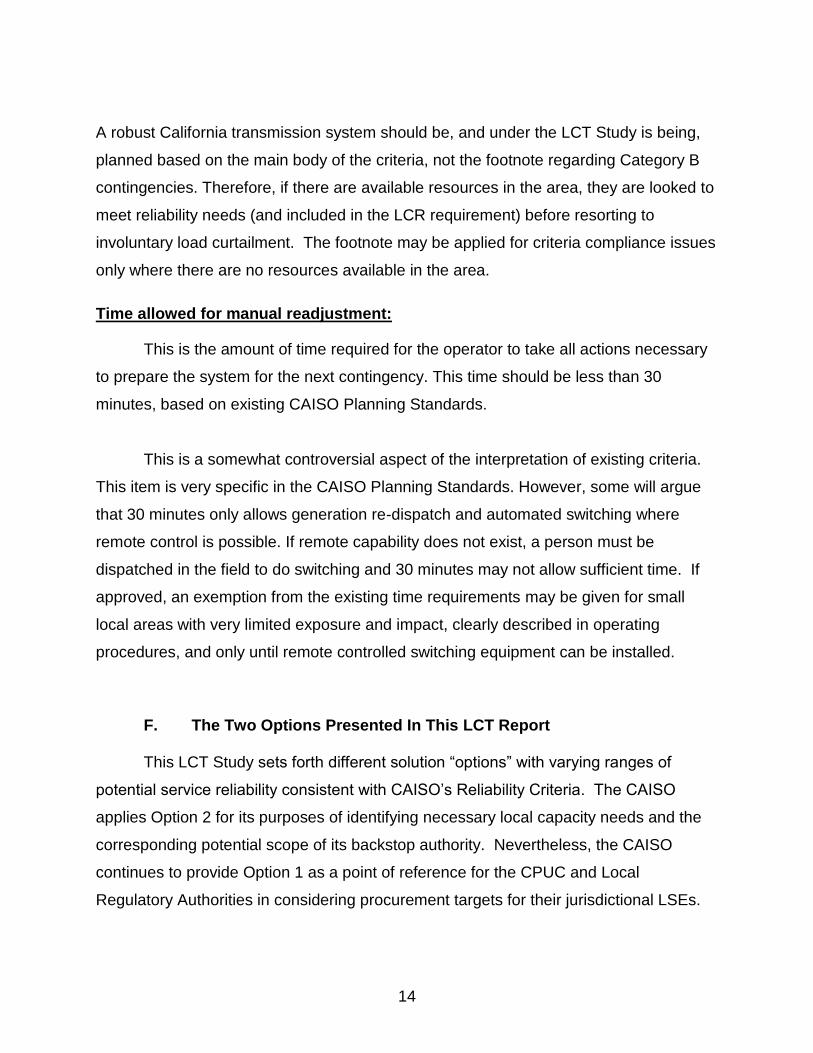
F. The Two Options Presented In This LCT Report
This LCT Study sets forth different solution “options” with varying ranges of
potential service reliability consistent with CAISO’s Reliability Criteria. The CAISO
applies Option 2 for its purposes of identifying necessary local capacity needs and the
corresponding potential scope of its backstop authority. Nevertheless, the CAISO
continues to provide Option 1 as a point of reference for the CPUC and Local
Regulatory Authorities in considering procurement targets for their jurisdictional LSEs.

15
1. Option 1- Meet Performance Criteria Category B
Option 1 is a service reliability level that reflects generation capacity that must be
available to comply with reliability standards immediately after a NERC Category B
given that load cannot be removed to meet this performance standard under Reliability
Criteria. However, this capacity amount implicitly relies on load interruption as the only
means of meeting any Reliability Criteria that is beyond the loss of a single
transmission element (N-1). These situations will likely require substantial load
interruptions in order to maintain system continuity and alleviate equipment overloads
prior to the actual occurrence of the second contingency.3
2. Option 2- Meet Performance Criteria Category C and Incorporate Suitable Operational Solutions
Option 2 is a service reliability level that reflects generation capacity that is
needed to readjust the system to prepare for the loss of a second transmission element
(N-1-1) using generation capacity after considering all reasonable and feasible
operating solutions (including those involving customer load interruption) developed and
approved by the CAISO, in consultation with the PTOs. Under this option, there is no
expected load interruption to end-use customers under normal or single contingency
conditions as the CAISO operators prepare for the second contingency. However, the
customer load may be interrupted in the event the second contingency occurs.
As noted, Option 2 is the local capacity level that the CAISO requires to reliably
operate the grid per NERC, WECC and CAISO standards. As such, the CAISO
recommends adoption of this Option to guide resource adequacy procurement.
III. Assumption Details: How the Study was Conducted
A. System Planning Criteria
3 This potential for pre-contingency load shedding also occurs because real time operators must prepare for the loss of a common mode N-2 at all times.
16
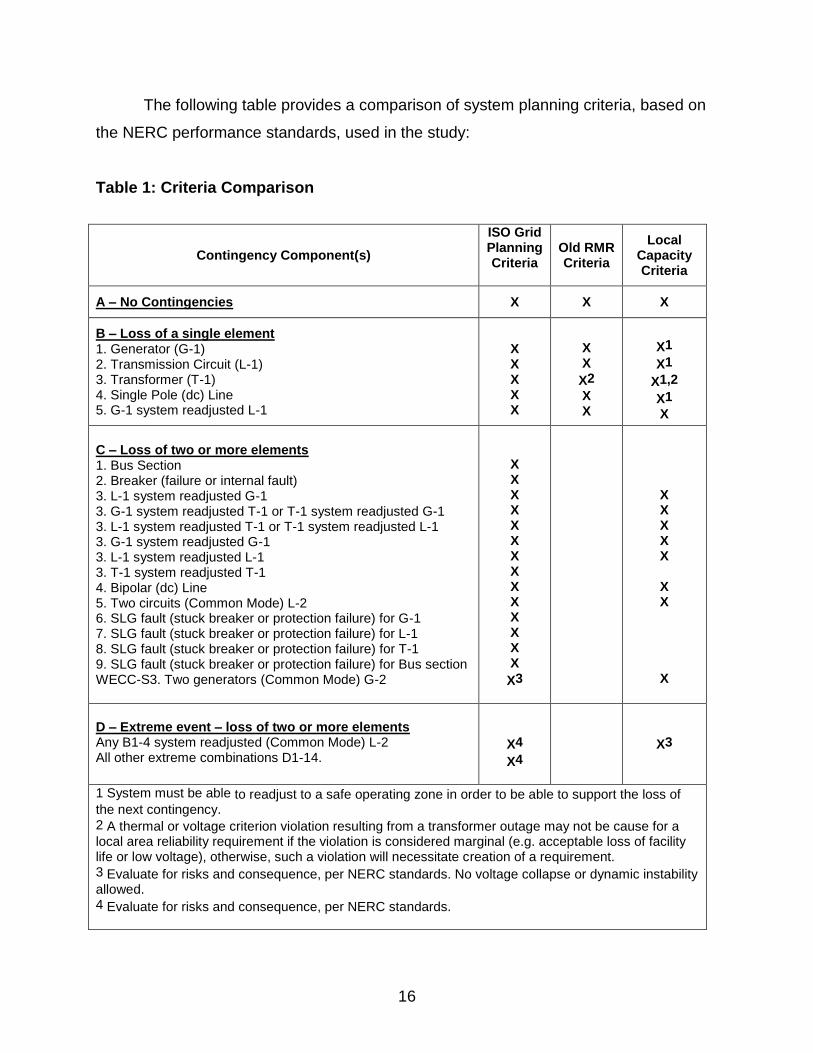
The following table provides a comparison of system planning criteria, based on
the NERC performance standards, used in the study:
Table 1: Criteria Comparison
Contingency Component(s)
ISO Grid Planning Criteria
Old RMR Criteria
Local Capacity Criteria
A – No Contingencies X X X
B – Loss of a single element 1. Generator (G-1) 2. Transmission Circuit (L-1) 3. Transformer (T-1) 4. Single Pole (dc) Line 5. G-1 system readjusted L-1
X X X X X
X X
X2
X X
X1
X1
X1,2
X1
X
C – Loss of two or more elements 1. Bus Section 2. Breaker (failure or internal fault) 3. L-1 system readjusted G-1 3. G-1 system readjusted T-1 or T-1 system readjusted G-1 3. L-1 system readjusted T-1 or T-1 system readjusted L-1 3. G-1 system readjusted G-1 3. L-1 system readjusted L-1 3. T-1 system readjusted T-1 4. Bipolar (dc) Line 5. Two circuits (Common Mode) L-2 6. SLG fault (stuck breaker or protection failure) for G-1 7. SLG fault (stuck breaker or protection failure) for L-1 8. SLG fault (stuck breaker or protection failure) for T-1 9. SLG fault (stuck breaker or protection failure) for Bus section WECC-S3. Two generators (Common Mode) G-2
X X X X X X X X X X X X X X
X3
X X X X X
X X
X
D – Extreme event – loss of two or more elements Any B1-4 system readjusted (Common Mode) L-2 All other extreme combinations D1-14.
X4
X4
X3
1 System must be able to readjust to a safe operating zone in order to be able to support the loss of the next contingency. 2 A thermal or voltage criterion violation resulting from a transformer outage may not be cause for a local area reliability requirement if the violation is considered marginal (e.g. acceptable loss of facility life or low voltage), otherwise, such a violation will necessitate creation of a requirement. 3 Evaluate for risks and consequence, per NERC standards. No voltage collapse or dynamic instability allowed. 4 Evaluate for risks and consequence, per NERC standards.

17
A significant number of simulations were run to determine the most critical
contingencies within each Local Capacity Area. Using power flow, post-transient load
flow, and stability assessment tools, the system performance results of all the
contingencies that were studied were measured against the system performance
requirements defined by the criteria shown in Table 4. Where the specific system
performance requirements were not met, generation was adjusted such that the
minimum amount of generation required to meet the criteria was determined in the
Local Capacity Area. The following describes how the criteria were tested for the
specific type of analysis performed.
1. Power Flow Assessment: Contingencies Thermal Criteria3 Voltage Criteria4 Generating unit 1, 6 Applicable Rating Applicable Rating Transmission line 1, 6 Applicable Rating Applicable Rating Transformer 1, 6 Applicable Rating5 Applicable Rating5 (G-1)(L-1) 2, 6 Applicable Rating Applicable Rating Overlapping 6, 7 Applicable Rating Applicable Rating
1 All single contingency outages (i.e. generating unit, transmission line or transformer) will be simulated on Participating Transmission Owners’ local area systems.
2 Key generating unit out, system readjusted, followed by a line outage. This over-lapping outage is considered a single contingency within the ISO Grid Planning Criteria. Therefore, load dropping for an overlapping G-1, L-1 scenario is not permitted.
3 Applicable Rating – Based on CAISO Transmission Register or facility upgrade plans including established Path ratings.
4 Applicable Rating – CAISO Grid Planning Criteria or facility owner criteria as appropriate including established Path ratings.
5 A thermal or voltage criterion violation resulting from a transformer outage may not be cause for a local area reliability requirement if the violation is considered marginal (e.g. acceptable loss of facility life or low voltage), otherwise, such a violation will necessitate creation of a requirement.
6 Following the first contingency (N-1), the generation must be sufficient to allow the operators to bring the system back to within acceptable (normal) operating range (voltage and loading) and/or appropriate OTC following the studied outage conditions.
7 During normal operation or following the first contingency (N-1), the generation must be sufficient to allow the operators to prepare for the next worst N-1 or common mode N-2 without pre-contingency interruptible or firm load shedding.
18
SPS/RAS/Safety Nets may be utilized to satisfy the criteria after the second N-1 or common mode N-2 except if the problem is of a thermal nature such that short-term ratings could be utilized to provide the operators time to shed either interruptible or firm load. T-2s (two transformer bank outages) would be excluded from the criteria.
2. Post Transient Load Flow Assessment:
Contingencies Reactive Margin Criteria 2 Selected 1 Applicable Rating
1 If power flow results indicate significant low voltages for a given power flow contingency, simulate that outage using the post transient load flow program. The post-transient assessment will develop appropriate Q/V and/or P/V curves.
2 Applicable Rating – positive margin based on the higher of imports or load increase by 5% for N-1 contingencies, and 2.5% for N-2 contingencies.
3. Stability Assessment:
Contingencies Stability Criteria 2 Selected 1 Applicable Rating
1 Base on historical information, engineering judgment and/or if power flow or post transient study results indicate significant low voltages or marginal reactive margin for a given contingency.
2 Applicable Rating – CAISO Grid Planning Criteria or facility owner criteria as appropriate.
B. Load Forecast
1. System Forecast
The California Energy Commission (CEC) derives the load forecast at the system
and Participating Transmission Owner (PTO) levels. This relevant CEC forecast is then
distributed across the entire system, down to the local area, division and substation
level. The PTOs use an econometric equation to forecast the system load. The
predominant parameters affecting the system load are (1) number of households, (2)
economic activity (gross metropolitan products, GMP), (3) temperature and (4)
increased energy efficiency and distributed generation programs.
19
2. Base Case Load Development Method
The method used to develop the load in the base case is a melding process that
extracts, adjusts and modifies the information from the system, distribution and
municipal utility forecasts. The melding process consists of two parts: Part 1 deals with
the PTO load and Part 2 deals with the municipal utility load. There may be small
differences between the methodologies used by each PTO to disaggregate the CEC
load forecast to their level of local area as well as bar-bus model.
a. PTO Loads in Base Case
The methods used to determine the PTO loads are, for the most part, similar.
One part of the method deals with the determination of the division4 loads that would
meet the requirements of 1-in-5 or 1-in-10 system or area base cases and the other part
deals with the allocation of the division load to the transmission buses.
i. Determination of division loads
The annual division load is determined by summing the previous year division
load and the current division load growth. Thus, the key steps are the determination of
the initial year division load and the annual load growth. The initial year for the base
case development method is based heavily on recorded data. The division load growth
in the system base case is determined in two steps. First, the total PTO load growth for
the year is determined, as the product of the PTO load and the load growth rate from
the system load forecast. Then this total PTO load growth is allocated to the division,
based on the relative magnitude of the load growth projected for the divisions by the
distribution planners. For example, for the 1-in-10 area base case, the division load
growth determined for the system base case is adjusted to the 1-in-10 temperature
using the load temperature relation determined from the latest peak load and
temperature data of the division.
4 Each PTO divides its territory in a number of smaller area named divisions. These are usually smaller
and compact areas that have the same temperature profile.

20
ii. Allocation of division load to transmission bus level
Since the loads in the base case are modeled at the various transmission buses,
the division loads developed must be allocated to those buses. The allocation process
is different depending on the load types. For the most part, each PTO classifies its loads
into four types: conforming, non-conforming, self-generation and generation-plant loads.
Since the non-conforming and self-generation loads are assumed to not vary with
temperature, their magnitude would be the same in the system or area base cases of
the same year. The remaining load (the total division load developed above, less the
quantity of non-conforming and self-generation load) is the conforming load. The
remaining load is allocated to the transmission buses based on the relative magnitude
of the distribution forecast. The summation of all base case loads is generally higher
than the load forecast because some load, i.e., self-generation and generation-plant,
are behind the meter and must be modeled in the base cases. However, for the most
part, metered or aggregated data with telemetry is used to come up with the load
forecast.
b. Municipal Loads in Base Case
The municipal utility forecasts that have been provided to the CEC and PTOs for the
purposes of their base cases were also used for this study.
C. Power Flow Program Used in the LCR analysis
The technical studies were conducted using General Electric’s Power System
Load Flow (GE PSLF) program version 18.1. This GE PSLF program is available
directly from GE or through the Western System Electricity Council (WECC) to any
member.
To evaluate Local Capacity Areas, the starting base case was adjusted to reflect
the latest generation and transmission projects as well as the one-in-ten-year peak load
forecast for each Local Capacity Area as provided to the CAISO by the PTOs.
Electronic contingency files provided by the PTOs were utilized to perform the
numerous contingencies required to identify the LCR. These contingency files include
remedial action and special protection schemes that are expected to be in operation
21
during the year of study. An CAISO created EPCL (a GE programming language
contained within the GE PSLF package) routine was used to run the combination of
contingencies; however, other routines are available from WECC with the GE PSFL
package or can be developed by third parties to identify the most limiting combination of
contingencies requiring the highest amount of generation within the local area to
maintain power flows within applicable ratings.
IV. Locational Capacity Requirement Study Results
A. Summary of Study Results
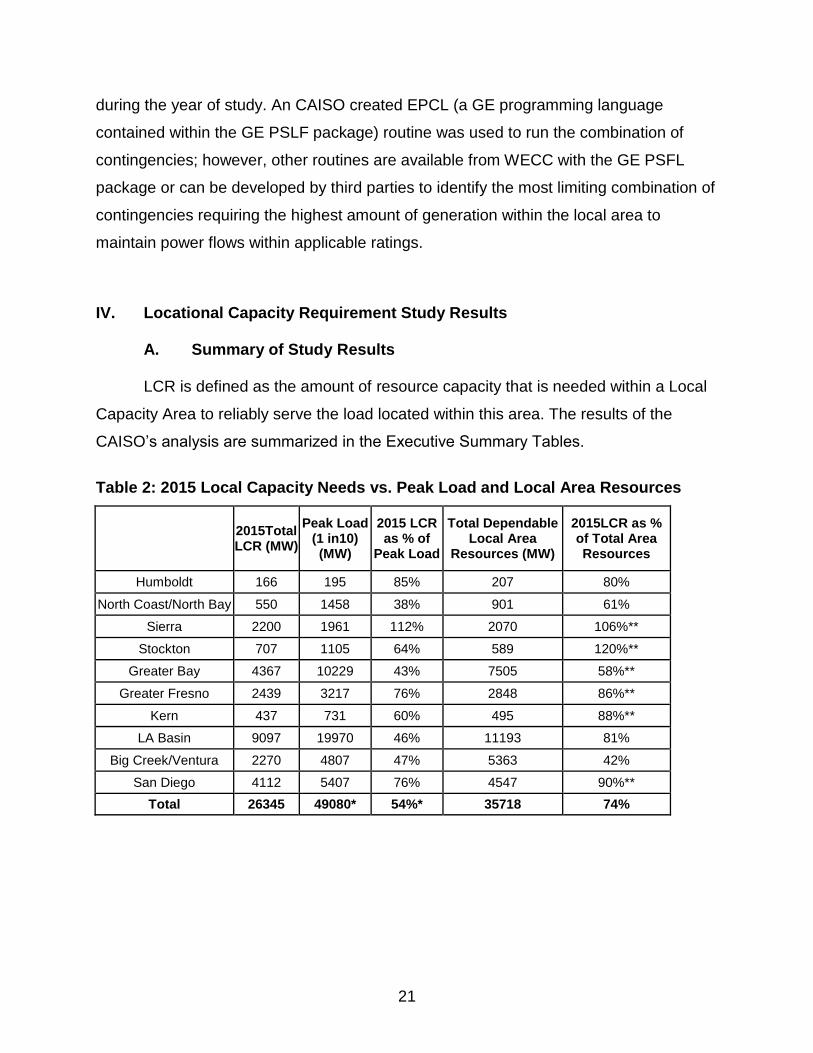
LCR is defined as the amount of resource capacity that is needed within a Local
Capacity Area to reliably serve the load located within this area. The results of the
CAISO’s analysis are summarized in the Executive Summary Tables.
Table 2: 2015 Local Capacity Needs vs. Peak Load and Local Area Resources
iii. e 2015Total LCR (MW)
Peak Load (1 in10) (MW)
2015 LCR as % of
Peak Load
Total Dependable Local Area
Resources (MW)
2015LCR as % of Total Area Resources
Humboldt 166 195 85% 207 80%
North Coast/North Bay 550 1458 38% 901 61%
Sierra 2200 1961 112% 2070 106%**
Stockton 707 1105 64% 589 120%**
Greater Bay 4367 10229 43% 7505 58%**
Greater Fresno 2439 3217 76% 2848 86%**
Kern 437 731 60% 495 88%**
LA Basin 9097 19970 46% 11193 81%
Big Creek/Ventura 2270 4807 47% 5363 42%
San Diego 4112 5407 76% 4547 90%**
Total 26345 49080* 54%* 35718 74%
22
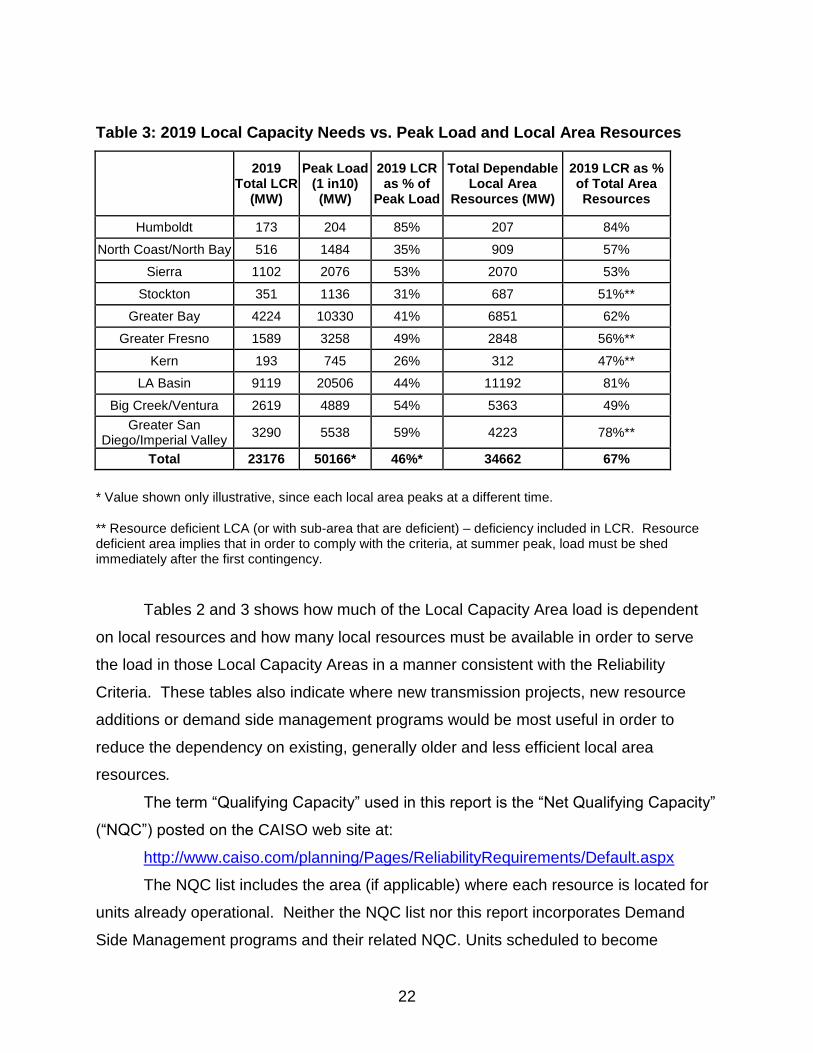
Table 3: 2019 Local Capacity Needs vs. Peak Load and Local Area Resources
iv. e 2019
Total LCR (MW)
Peak Load (1 in10) (MW)
2019 LCR as % of
Peak Load
Total Dependable Local Area
Resources (MW)
2019 LCR as % of Total Area Resources
Humboldt 173 204 85% 207 84%
North Coast/North Bay 516 1484 35% 909 57%
Sierra 1102 2076 53% 2070 53%
Stockton 351 1136 31% 687 51%**
Greater Bay 4224 10330 41% 6851 62%
Greater Fresno 1589 3258 49% 2848 56%**
Kern 193 745 26% 312 47%**
LA Basin 9119 20506 44% 11192 81%
Big Creek/Ventura 2619 4889 54% 5363 49%
Greater San Diego/Imperial Valley
3290 5538 59% 4223 78%**
Total 23176 50166* 46%* 34662 67%
* Value shown only illustrative, since each local area peaks at a different time.
** Resource deficient LCA (or with sub-area that are deficient) – deficiency included in LCR. Resource deficient area implies that in order to comply with the criteria, at summer peak, load must be shed immediately after the first contingency.
Tables 2 and 3 shows how much of the Local Capacity Area load is dependent
on local resources and how many local resources must be available in order to serve
the load in those Local Capacity Areas in a manner consistent with the Reliability
Criteria. These tables also indicate where new transmission projects, new resource
additions or demand side management programs would be most useful in order to
reduce the dependency on existing, generally older and less efficient local area
resources.
The term “Qualifying Capacity” used in this report is the “Net Qualifying Capacity”
(“NQC”) posted on the CAISO web site at:
http://www.caiso.com/planning/Pages/ReliabilityRequirements/Default.aspx
The NQC list includes the area (if applicable) where each resource is located for
units already operational. Neither the NQC list nor this report incorporates Demand
Side Management programs and their related NQC. Units scheduled to become
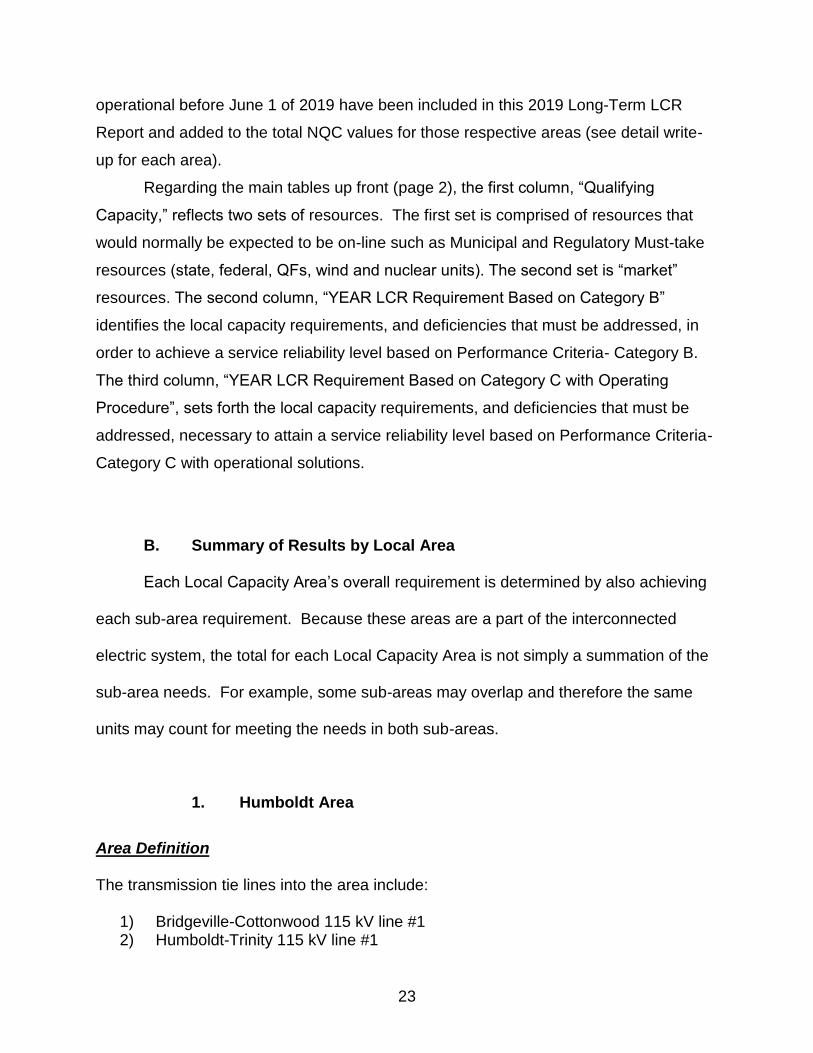
23
operational before June 1 of 2019 have been included in this 2019 Long-Term LCR
Report and added to the total NQC values for those respective areas (see detail write-
up for each area).
Regarding the main tables up front (page 2), the first column, “Qualifying
Capacity,” reflects two sets of resources. The first set is comprised of resources that
would normally be expected to be on-line such as Municipal and Regulatory Must-take
resources (state, federal, QFs, wind and nuclear units). The second set is “market”
resources. The second column, “YEAR LCR Requirement Based on Category B”
identifies the local capacity requirements, and deficiencies that must be addressed, in
order to achieve a service reliability level based on Performance Criteria- Category B.
The third column, “YEAR LCR Requirement Based on Category C with Operating
Procedure”, sets forth the local capacity requirements, and deficiencies that must be
addressed, necessary to attain a service reliability level based on Performance Criteria-
Category C with operational solutions.
B. Summary of Results by Local Area
Each Local Capacity Area’s overall requirement is determined by also achieving
each sub-area requirement. Because these areas are a part of the interconnected
electric system, the total for each Local Capacity Area is not simply a summation of the
sub-area needs. For example, some sub-areas may overlap and therefore the same
units may count for meeting the needs in both sub-areas.
1. Humboldt Area
Area Definition The transmission tie lines into the area include:
1) Bridgeville-Cottonwood 115 kV line #1 2) Humboldt-Trinity 115 kV line #1

24
3) Willits-Garberville 60 kV line #1 4) Trinity-Maple Creek 60 kV line #1
The substations that delineate the Humboldt Area are:
1) Bridgeville and Low Gap are in, Cottonwood is out 2) Humboldt is in Trinity is out 3) Willits is out, Kekawaka and Garberville are in 4) Trinity is out, Ridge Cabin and Maple Creek are in
Total 2019 busload within the defined area: 194 MW with 10 MW of losses resulting in
total load + losses of 204 MW.
Total units and qualifying capacity available in this area:
MKT/SCHED RESOURCE ID
BUS # BUS NAME kV NQC UNIT
ID LCR SUB-AREA NAME
NQC Comments CAISO Tag
BLULKE_6_BLUELK 31156 BLUELKPP 12.5 8.49 1 None Market
BRDGVL_7_BAKER 0.00 None Not modeled Aug NQC QF/Selfgen
FAIRHV_6_UNIT 31150 FAIRHAVN 13.8 16.05 1 None Aug NQC QF/Selfgen
FTSWRD_6_TRFORK 0.00 None Energy Only Market
FTSWRD_7_QFUNTS 0.50 None Not modeled Aug NQC QF/Selfgen
GRSCRK_6_BGCKWW 0.00 None Energy Only QF/Selfgen
HUMBPP_1_UNITS3 31180 HUMB_G1 13.8 16.27 1 None Market
HUMBPP_1_UNITS3 31180 HUMB_G1 13.8 16.27 2 None Market
HUMBPP_1_UNITS3 31180 HUMB_G1 13.8 16.27 3 None Market
HUMBPP_1_UNITS3 31180 HUMB_G1 13.8 16.27 4 None Market
HUMBPP_6_UNITS1 31181 HUMB_G2 13.8 16.27 5 None Market
HUMBPP_6_UNITS1 31181 HUMB_G2 13.8 16.27 6 None Market
HUMBPP_6_UNITS1 31181 HUMB_G2 13.8 16.27 7 None Market
HUMBPP_6_UNITS2 31182 HUMB_G2 13.8 16.27 8 None Market
HUMBPP_6_UNITS2 31182 HUMB_G2 13.8 16.27 9 None Market
HUMBPP_6_UNITS2 31182 HUMB_G2 13.8 16.27 10 None Market
HUMBSB_1_QF 0.00 None Not modeled Aug NQC QF/Selfgen
KEKAWK_6_UNIT 31166 KEKAWAK 9.1 0.00 1 None Aug NQC QF/Selfgen
PACLUM_6_UNIT 31152 PAC.LUMB 13.8 7.60 1 None Aug NQC QF/Selfgen
PACLUM_6_UNIT 31152 PAC.LUMB 13.8 7.60 2 None Aug NQC QF/Selfgen
PACLUM_6_UNIT 31153 PAC.LUMB 2.4 4.58 3 None Aug NQC QF/Selfgen
WLLWCR_6_CEDRFL 0.02 None Not modeled Aug NQC QF/Selfgen
LAPAC_6_UNIT 31158 LP SAMOA 12.5 0.00 1 None QF/Selfgen
Major new projects modeled:
1. Humboldt 115/60 kV #1 and #2 transformers replacement
2. Maple Creek Reactive Support
3. Garberville Reactive Support
4. Bridgeville 115/60 kV #1 transformer replacement
25
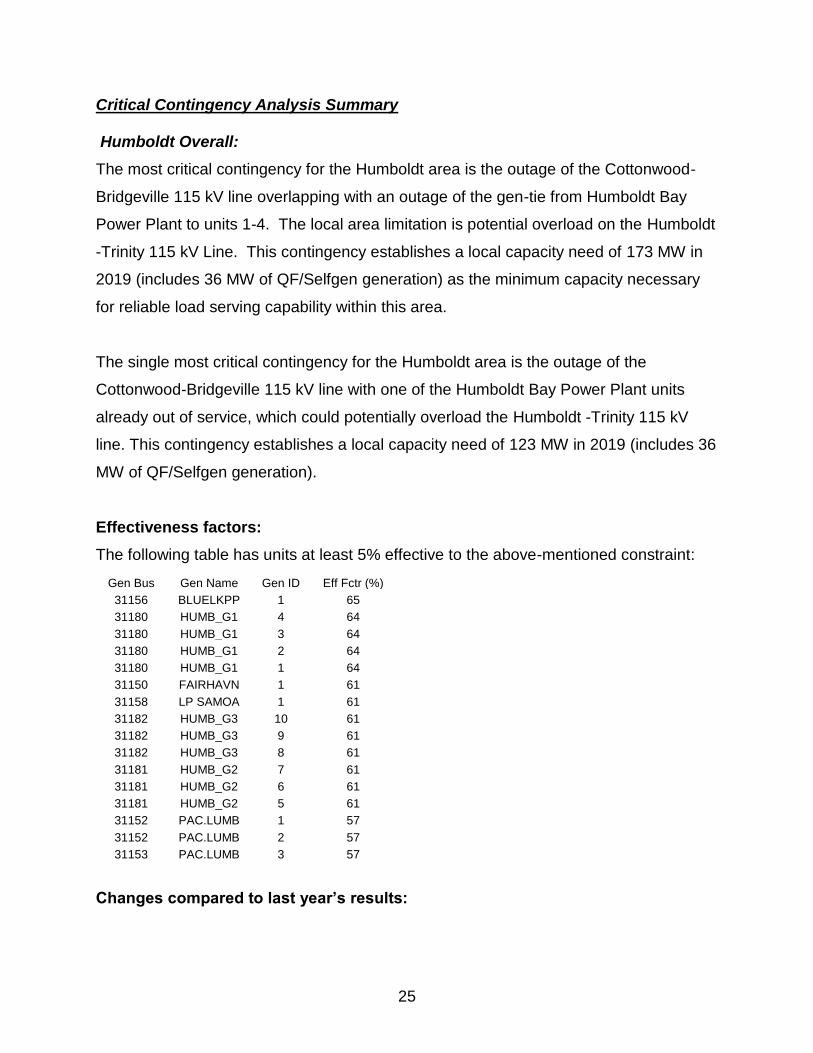
Critical Contingency Analysis Summary Humboldt Overall:
The most critical contingency for the Humboldt area is the outage of the Cottonwood-
Bridgeville 115 kV line overlapping with an outage of the gen-tie from Humboldt Bay
Power Plant to units 1-4. The local area limitation is potential overload on the Humboldt
-Trinity 115 kV Line. This contingency establishes a local capacity need of 173 MW in
2019 (includes 36 MW of QF/Selfgen generation) as the minimum capacity necessary
for reliable load serving capability within this area.
The single most critical contingency for the Humboldt area is the outage of the
Cottonwood-Bridgeville 115 kV line with one of the Humboldt Bay Power Plant units
already out of service, which could potentially overload the Humboldt -Trinity 115 kV
line. This contingency establishes a local capacity need of 123 MW in 2019 (includes 36
MW of QF/Selfgen generation).
Effectiveness factors:
The following table has units at least 5% effective to the above-mentioned constraint:
Gen Bus Gen Name Gen ID Eff Fctr (%)
31156 BLUELKPP 1 65
31180 HUMB_G1 4 64
31180 HUMB_G1 3 64
31180 HUMB_G1 2 64
31180 HUMB_G1 1 64
31150 FAIRHAVN 1 61
31158 LP SAMOA 1 61
31182 HUMB_G3 10 61
31182 HUMB_G3 9 61
31182 HUMB_G3 8 61
31181 HUMB_G2 7 61
31181 HUMB_G2 6 61
31181 HUMB_G2 5 61
31152 PAC.LUMB 1 57
31152 PAC.LUMB 2 57
31153 PAC.LUMB 3 57
Changes compared to last year’s results:

26
The load and losses have decreased by 4 MW from 2018 to 2019 and the total LCR has
reduced by 24 MW.
Humboldt Overall Requirements:
QF/Selfgen (MW)
Market (MW)
Max. Qualifying Capacity (MW)
Available generation 36 171 207
2018 Existing Generation
Capacity Needed (MW) Deficiency
(MW) Total MW
Requirement
Category B (Single)5 123 0 123
Category C (Multiple)6 173 0 173
2. North Coast / North Bay Area
Area Definition The transmission tie facilities coming into the North Coast/North Bay area are:
1) Cortina-Mendocino 115 kV Line 2) Cortina-Eagle Rock 115 kV Line 3) Willits-Garberville 60 kV line #1 4) Vaca Dixon-Lakeville 230 kV line #1 5) Tulucay-Vaca Dixon 230 kV line #1 6) Lakeville-Sobrante 230 kV line #1 7) Ignacio-Sobrante 230 kV line #1
The substations that delineate the North Coast/North Bay area are:
1) Cortina is out, Mendocino and Indian Valley are in 2) Cortina is out, Eagle Rock, Highlands and Homestake are in 3) Willits and Lytonville are in, Kekawaka and Garberville are out 4) Vaca Dixon is out, Lakeville is in 5) Tulucay is in, Vaca Dixon is out 6) Lakeville is in, Sobrante is out
5 A single contingency means that the system will be able the survive the loss of a single element,
however the operators will not have any means (other than load drop) in order to bring the system within
a safe operating zone and get prepared for the next contingency as required by MORC. 6 Multiple contingencies means that the system will be able the survive the loss of a single element, and
the operators will have enough generation (other operating procedures) in order to bring the system
within a safe operating zone and get prepared for the next contingency as required by MORC.

27
7) Ignacio is in, Sobrante and Crocket are out Total 2019 busload within the defined area: 1447 MW with 37 MW of losses resulting in
total load + losses of 1484 MW.
Total units and qualifying capacity available in this area:
MKT/SCHED RESOURCE ID
BUS # BUS NAME kV NQC UNIT
ID LCR SUB-AREA NAME
NQC Comments
CAISO Tag
ADLIN_1_UNITS 31435 GEO.ENGY 9.1 8.00 1 Eagle Rock, Fulton,
Lakeville Market
ADLIN_1_UNITS 31435 GEO.ENGY 9.1 8.00 2 Eagle Rock, Fulton,
Lakeville Market
BEARCN_2_UNITS 31402 BEAR CAN 13.8 6.50 1 Fulton, Lakeville Market
BEARCN_2_UNITS 31402 BEAR CAN 13.8 6.50 2 Fulton, Lakeville Market
FULTON_1_QF 0.08 Fulton, Lakeville Not modeled
Aug NQC QF/Selfgen
GEYS11_7_UNIT11 31412 GEYSER11 13.8 65.00 1 Eagle Rock, Fulton,
Lakeville Market
GEYS12_7_UNIT12 31414 GEYSER12 13.8 50.00 1 Fulton, Lakeville Market
GEYS13_7_UNIT13 31416 GEYSER13 13.8 56.00 1 Lakeville Market
GEYS14_7_UNIT14 31418 GEYSER14 13.8 50.00 1 Fulton, Lakeville Market
GEYS16_7_UNIT16 31420 GEYSER16 13.8 49.00 1 Fulton, Lakeville Market
GEYS17_2_BOTRCK 31421 BOTTLERK 13.8 14.70 1 Fulton, Lakeville Market
GEYS17_7_UNIT17 31422 GEYSER17 13.8 53.00 1 Fulton, Lakeville Market
GEYS18_7_UNIT18 31424 GEYSER18 13.8 45.00 1 Lakeville Market
GEYS20_7_UNIT20 31426 GEYSER20 13.8 40.00 1 Lakeville Market
GYS5X6_7_UNITS 31406 GEYSR5-6 13.8 40.00 1 Eagle Rock, Fulton,
Lakeville Market
GYS5X6_7_UNITS 31406 GEYSR5-6 13.8 40.00 2 Eagle Rock, Fulton,
Lakeville Market
GYS7X8_7_UNITS 31408 GEYSER78 13.8 38.00 1 Eagle Rock, Fulton,
Lakeville Market
GYS7X8_7_UNITS 31408 GEYSER78 13.8 38.00 2 Eagle Rock, Fulton,
Lakeville Market
GYSRVL_7_WSPRNG 1.68 Fulton, Lakeville Not modeled
Aug NQC QF/Selfgen
HILAND_7_YOLOWD 0.00 Eagle Rock, Fulton,
Lakeville Energy Only Market
HIWAY_7_ACANYN 0.59 Lakeville Not modeled
Aug NQC QF/Selfgen
IGNACO_1_QF 0.00 Lakeville Not modeled
Aug NQC QF/Selfgen
INDVLY_1_UNITS 31436 INDIAN V 9.1 1.28 1 Eagle Rock, Fulton,
Lakeville Aug NQC QF/Selfgen
MONTPH_7_UNITS 32700 MONTICLO 9.1 3.96 1 Fulton, Lakeville Aug NQC QF/Selfgen
MONTPH_7_UNITS 32700 MONTICLO 9.1 3.95 2 Fulton, Lakeville Aug NQC QF/Selfgen
MONTPH_7_UNITS 32700 MONTICLO 9.1 0.94 3 Fulton, Lakeville Aug NQC QF/Selfgen
NCPA_7_GP1UN1 38106 NCPA1GY1 13.8 31.00 1 Lakeville Aug NQC MUNI
NCPA_7_GP1UN2 38108 NCPA1GY2 13.8 28.00 1 Lakeville Aug NQC MUNI
NCPA_7_GP2UN3 38110 NCPA2GY1 13.8 0.00 1 Fulton, Lakeville Aug NQC MUNI
NCPA_7_GP2UN4 38112 NCPA2GY2 13.8 52.73 1 Fulton, Lakeville Aug NQC MUNI
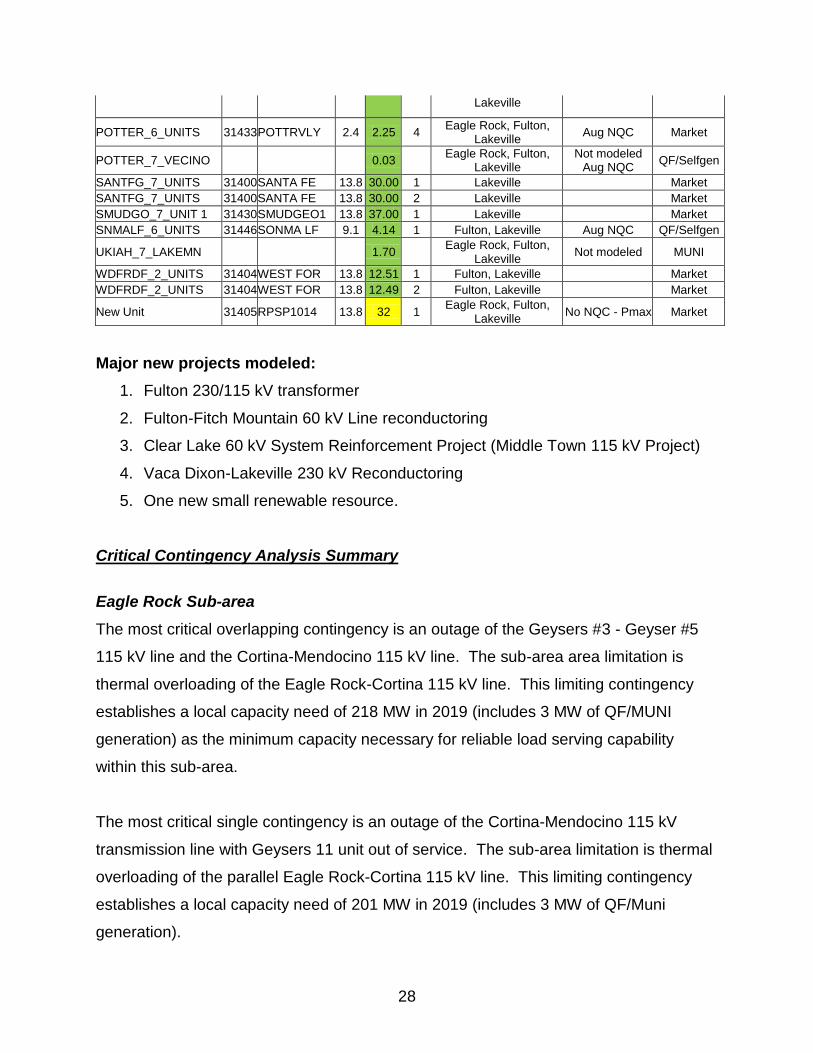
POTTER_6_UNITS 31433 POTTRVLY 2.4 4.70 1 Eagle Rock, Fulton,
Lakeville Aug NQC Market
POTTER_6_UNITS 31433 POTTRVLY 2.4 2.25 3 Eagle Rock, Fulton, Aug NQC Market
28
Lakeville
POTTER_6_UNITS 31433 POTTRVLY 2.4 2.25 4 Eagle Rock, Fulton,
Lakeville Aug NQC Market
POTTER_7_VECINO 0.03 Eagle Rock, Fulton,
Lakeville Not modeled
Aug NQC QF/Selfgen
SANTFG_7_UNITS 31400 SANTA FE 13.8 30.00 1 Lakeville Market
SANTFG_7_UNITS 31400 SANTA FE 13.8 30.00 2 Lakeville Market
SMUDGO_7_UNIT 1 31430 SMUDGEO1 13.8 37.00 1 Lakeville Market
SNMALF_6_UNITS 31446 SONMA LF 9.1 4.14 1 Fulton, Lakeville Aug NQC QF/Selfgen
UKIAH_7_LAKEMN 1.70 Eagle Rock, Fulton,
Lakeville Not modeled MUNI
WDFRDF_2_UNITS 31404 WEST FOR 13.8 12.51 1 Fulton, Lakeville Market
WDFRDF_2_UNITS 31404 WEST FOR 13.8 12.49 2 Fulton, Lakeville Market
New Unit 31405 RPSP1014 13.8 32 1 Eagle Rock, Fulton,
Lakeville No NQC - Pmax Market
Major new projects modeled:
1. Fulton 230/115 kV transformer
2. Fulton-Fitch Mountain 60 kV Line reconductoring
3. Clear Lake 60 kV System Reinforcement Project (Middle Town 115 kV Project)
4. Vaca Dixon-Lakeville 230 kV Reconductoring
5. One new small renewable resource.
Critical Contingency Analysis Summary
Eagle Rock Sub-area
The most critical overlapping contingency is an outage of the Geysers #3 - Geyser #5
115 kV line and the Cortina-Mendocino 115 kV line. The sub-area area limitation is
thermal overloading of the Eagle Rock-Cortina 115 kV line. This limiting contingency
establishes a local capacity need of 218 MW in 2019 (includes 3 MW of QF/MUNI
generation) as the minimum capacity necessary for reliable load serving capability
within this sub-area.
The most critical single contingency is an outage of the Cortina-Mendocino 115 kV
transmission line with Geysers 11 unit out of service. The sub-area limitation is thermal
overloading of the parallel Eagle Rock-Cortina 115 kV line. This limiting contingency
establishes a local capacity need of 201 MW in 2019 (includes 3 MW of QF/Muni
generation).
29
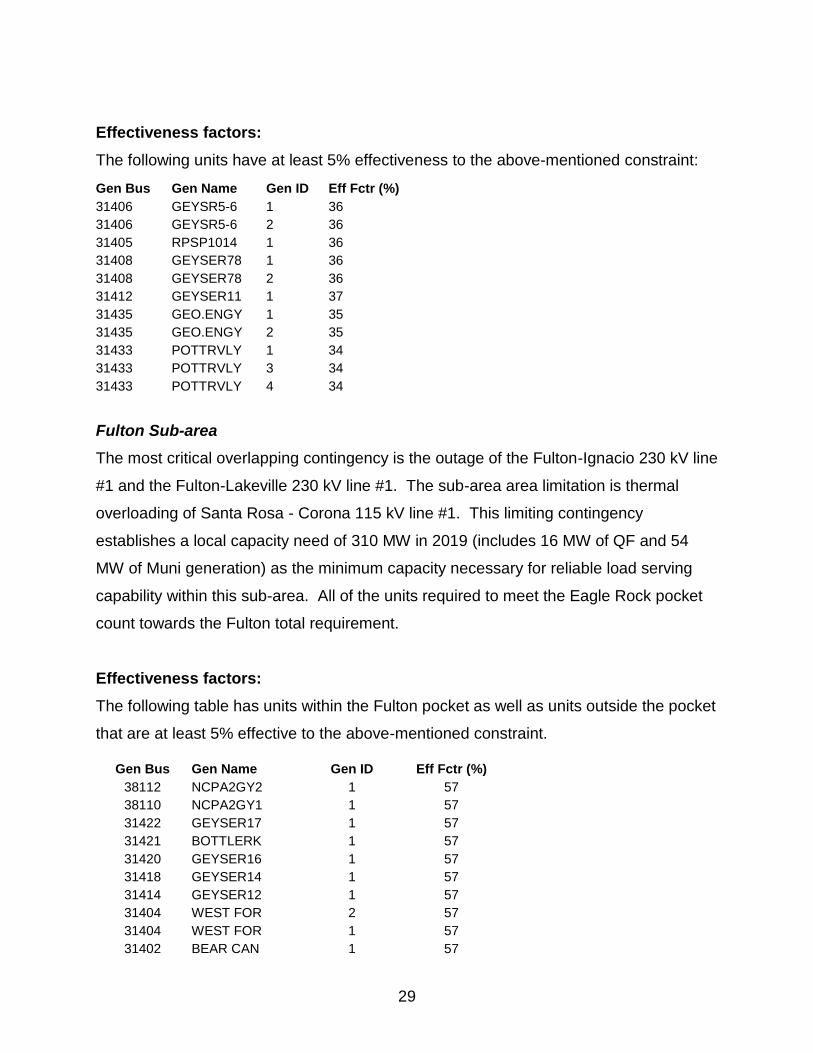
Effectiveness factors:
The following units have at least 5% effectiveness to the above-mentioned constraint:
Gen Bus Gen Name Gen ID Eff Fctr (%)
31406 GEYSR5-6 1 36
31406 GEYSR5-6 2 36
31405 RPSP1014 1 36
31408 GEYSER78 1 36
31408 GEYSER78 2 36
31412 GEYSER11 1 37
31435 GEO.ENGY 1 35
31435 GEO.ENGY 2 35
31433 POTTRVLY 1 34
31433 POTTRVLY 3 34
31433 POTTRVLY 4 34
Fulton Sub-area
The most critical overlapping contingency is the outage of the Fulton-Ignacio 230 kV line
#1 and the Fulton-Lakeville 230 kV line #1. The sub-area area limitation is thermal
overloading of Santa Rosa - Corona 115 kV line #1. This limiting contingency
establishes a local capacity need of 310 MW in 2019 (includes 16 MW of QF and 54
MW of Muni generation) as the minimum capacity necessary for reliable load serving
capability within this sub-area. All of the units required to meet the Eagle Rock pocket
count towards the Fulton total requirement.
Effectiveness factors:
The following table has units within the Fulton pocket as well as units outside the pocket
that are at least 5% effective to the above-mentioned constraint.
Gen Bus Gen Name Gen ID Eff Fctr (%)
38112 NCPA2GY2 1 57
38110 NCPA2GY1 1 57
31422 GEYSER17 1 57
31421 BOTTLERK 1 57
31420 GEYSER16 1 57
31418 GEYSER14 1 57
31414 GEYSER12 1 57
31404 WEST FOR 2 57
31404 WEST FOR 1 57
31402 BEAR CAN 1 57

30
31402 BEAR CAN 2 57
31406 GEYSR5-6 1 31
31406 GEYSR5-6 2 31
31405 RPSP1014 1 31
31408 GEYSER78 1 31
31408 GEYSER78 2 31
31412 GEYSER11 1 31
31435 GEO.ENGY 1 31
31435 GEO.ENGY 2 31
31433 POTTRVLY 1 29
31433 POTTRVLY 3 29
31433 POTTRVLY 4 29
Lakeville Sub-area (North Coast/North Bay Overall)
The most limiting contingency for the North Coast/North Bay Area is a common mode
outage of the Vaca Dixon-Lakeville and Vaca Dixon-Tulucay 230 kV lines. The area
limitation is thermal overloading of the Eagle Rock-Cortina and Eagle Rock-Fulton 115
kV lines. This limiting contingency establishes a local capacity need of 516 MW in 2019
(includes 17 MW of QF and 113 MW of Muni generation) as the minimum capacity
necessary for reliable load serving capability within this area.
Effectiveness factors:
The following units have at least 5% effectiveness to the Eagle Rock-Cortina constraint:
Gen Bus Gen Name Gen ID Eff Fctr (%)
31406 GEYSR5-6 1 33
31406 GEYSR5-6 2 33
31405 RPSP1014 1 34
31408 GEYSER78 1 34
31408 GEYSER78 2 34
31412 GEYSER11 1 34
31435 GEO.ENGY 1 33
31435 GEO.ENGY 2 33
31433 POTTRVLY 1 23
31433 POTTRVLY 3 23
31433 POTTRVLY 4 23
31400 SANTA FE 2 8
31400 SANTA FE 1 8
31430 SMUDGEO1 1 8
31402 BEAR CAN 1 10
31402 BEAR CAN 1 10
31404 WEST FOR 1 10
31
31404 WEST FOR 2 10
31414 GEYSER12 1 10
31416 GEYSER13 1 8
31418 GEYSER14 1 10
31421 BOTTLERK 1 10
31420 GEYSER16 1 10
31422 GEYSER17 1 10
31424 GEYSER18 1 8
31426 GEYSER20 1 8
31446 SONMA LF 1 11
32700 MONTICLO 1 15
32700 MONTICLO 2 15
32700 MONTICLO 3 15
38106 NCPA1GY1 1 8
38108 NCPA1GY2 1 8
38110 NCPA2GY1 1 10
38112 NCPA2GY2 1 10
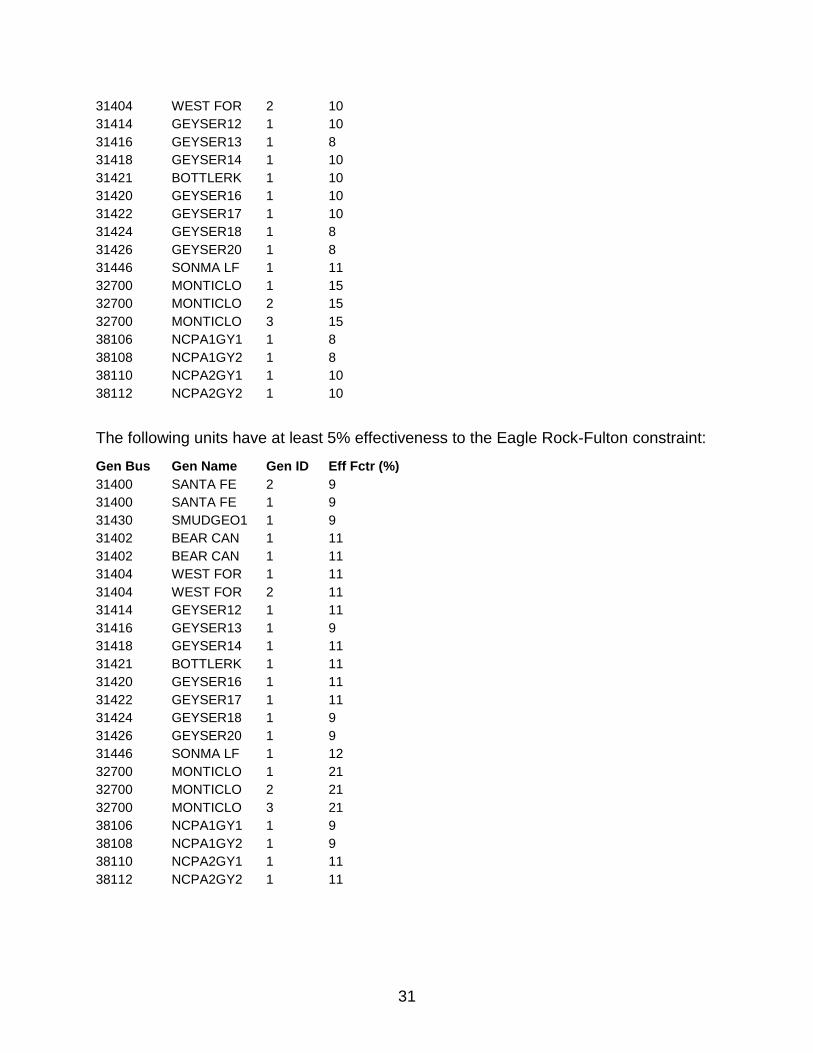
The following units have at least 5% effectiveness to the Eagle Rock-Fulton constraint:
Gen Bus Gen Name Gen ID Eff Fctr (%)
31400 SANTA FE 2 9
31400 SANTA FE 1 9
31430 SMUDGEO1 1 9
31402 BEAR CAN 1 11
31402 BEAR CAN 1 11
31404 WEST FOR 1 11
31404 WEST FOR 2 11
31414 GEYSER12 1 11
31416 GEYSER13 1 9
31418 GEYSER14 1 11
31421 BOTTLERK 1 11
31420 GEYSER16 1 11
31422 GEYSER17 1 11
31424 GEYSER18 1 9
31426 GEYSER20 1 9
31446 SONMA LF 1 12
32700 MONTICLO 1 21
32700 MONTICLO 2 21
32700 MONTICLO 3 21
38106 NCPA1GY1 1 9
38108 NCPA1GY2 1 9
38110 NCPA2GY1 1 11
38112 NCPA2GY2 1 11
32
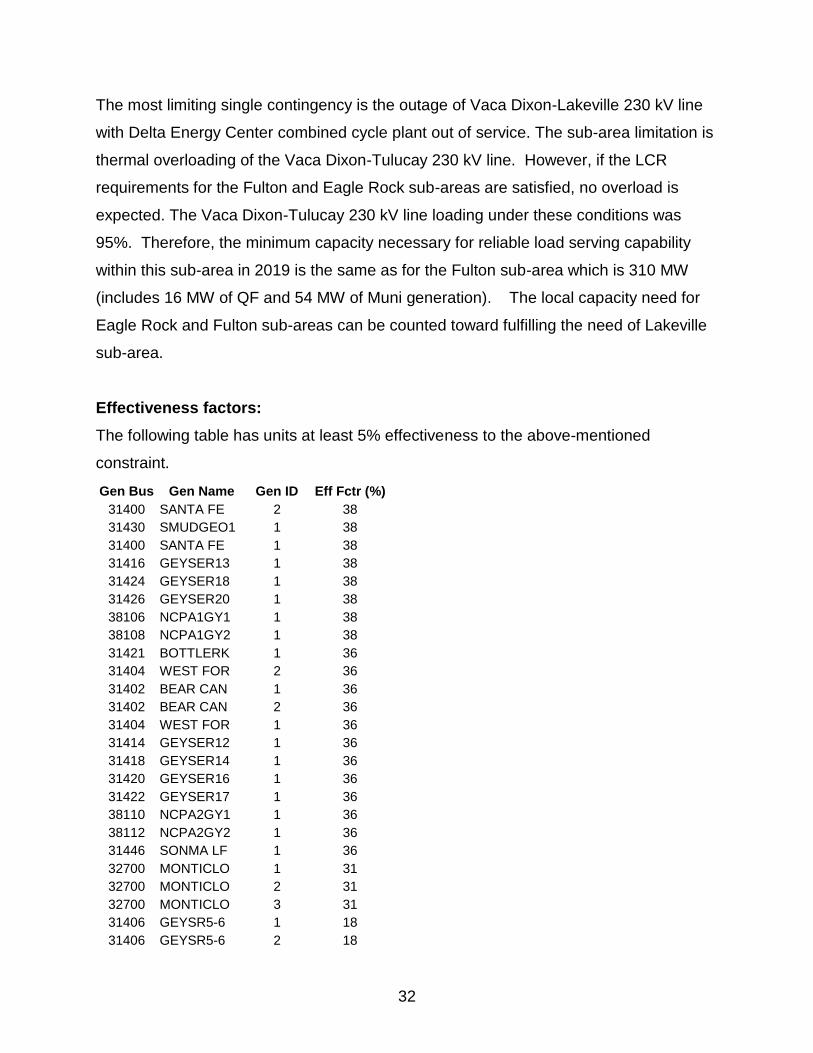
The most limiting single contingency is the outage of Vaca Dixon-Lakeville 230 kV line
with Delta Energy Center combined cycle plant out of service. The sub-area limitation is
thermal overloading of the Vaca Dixon-Tulucay 230 kV line. However, if the LCR
requirements for the Fulton and Eagle Rock sub-areas are satisfied, no overload is
expected. The Vaca Dixon-Tulucay 230 kV line loading under these conditions was
95%. Therefore, the minimum capacity necessary for reliable load serving capability
within this sub-area in 2019 is the same as for the Fulton sub-area which is 310 MW
(includes 16 MW of QF and 54 MW of Muni generation). The local capacity need for
Eagle Rock and Fulton sub-areas can be counted toward fulfilling the need of Lakeville
sub-area.
Effectiveness factors:
The following table has units at least 5% effectiveness to the above-mentioned
constraint.
Gen Bus Gen Name Gen ID Eff Fctr (%)
31400 SANTA FE 2 38
31430 SMUDGEO1 1 38
31400 SANTA FE 1 38
31416 GEYSER13 1 38
31424 GEYSER18 1 38
31426 GEYSER20 1 38
38106 NCPA1GY1 1 38
38108 NCPA1GY2 1 38
31421 BOTTLERK 1 36
31404 WEST FOR 2 36
31402 BEAR CAN 1 36
31402 BEAR CAN 2 36
31404 WEST FOR 1 36
31414 GEYSER12 1 36
31418 GEYSER14 1 36
31420 GEYSER16 1 36
31422 GEYSER17 1 36
38110 NCPA2GY1 1 36
38112 NCPA2GY2 1 36
31446 SONMA LF 1 36
32700 MONTICLO 1 31
32700 MONTICLO 2 31
32700 MONTICLO 3 31
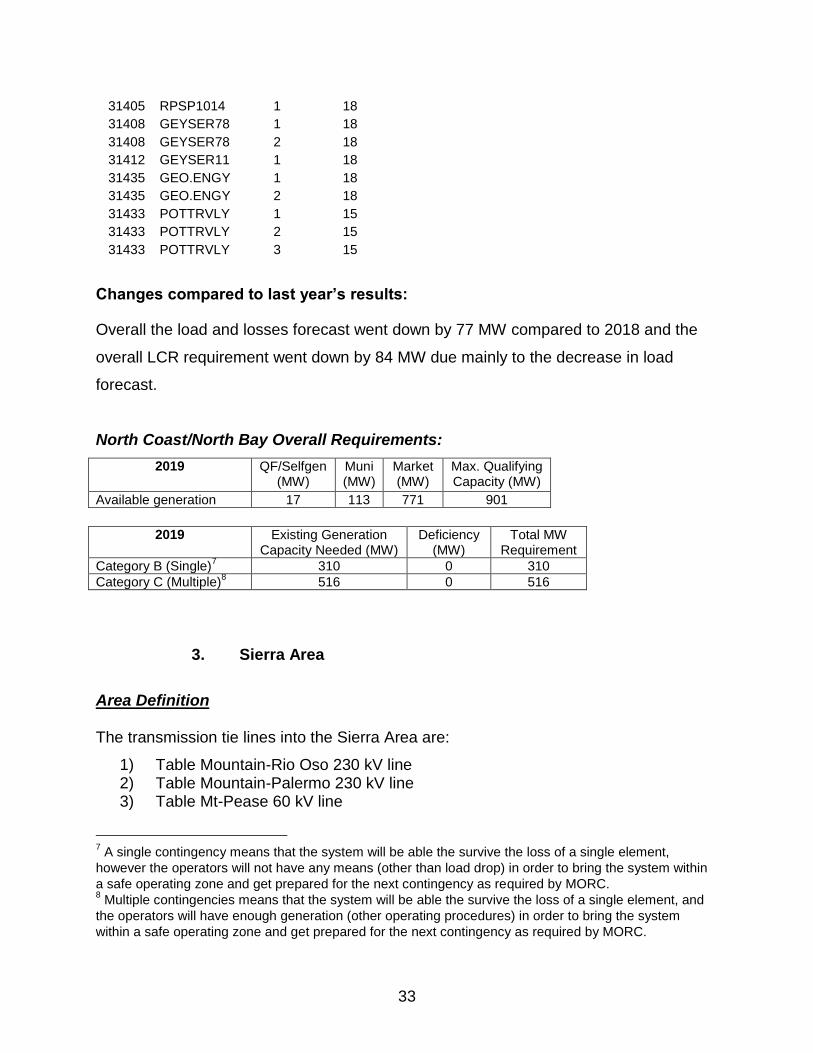
31406 GEYSR5-6 1 18
31406 GEYSR5-6 2 18
33
31405 RPSP1014 1 18
31408 GEYSER78 1 18
31408 GEYSER78 2 18
31412 GEYSER11 1 18
31435 GEO.ENGY 1 18
31435 GEO.ENGY 2 18
31433 POTTRVLY 1 15
31433 POTTRVLY 2 15
31433 POTTRVLY 3 15
Changes compared to last year’s results:
Overall the load and losses forecast went down by 77 MW compared to 2018 and the
overall LCR requirement went down by 84 MW due mainly to the decrease in load
forecast.
North Coast/North Bay Overall Requirements:
2019 QF/Selfgen (MW)
Muni (MW)
Market (MW)
Max. Qualifying Capacity (MW)
Available generation 17 113 771 901
2019 Existing Generation
Capacity Needed (MW) Deficiency
(MW) Total MW
Requirement
Category B (Single)7 310 0 310
Category C (Multiple)8 516 0 516
3. Sierra Area
Area Definition The transmission tie lines into the Sierra Area are:
1) Table Mountain-Rio Oso 230 kV line 2) Table Mountain-Palermo 230 kV line 3) Table Mt-Pease 60 kV line
7 A single contingency means that the system will be able the survive the loss of a single element,
however the operators will not have any means (other than load drop) in order to bring the system within
a safe operating zone and get prepared for the next contingency as required by MORC. 8 Multiple contingencies means that the system will be able the survive the loss of a single element, and
the operators will have enough generation (other operating procedures) in order to bring the system
within a safe operating zone and get prepared for the next contingency as required by MORC.

34
4) Caribou-Palermo 115 kV line 5) Drum-Summit 115 kV line #1 6) Drum-Summit 115 kV line #2 7) Spaulding-Summit 60 kV line 8) Brighton-Bellota 230 kV line 9) Rio Oso-Lockeford 230 kV line 10) Gold Hill-Eight Mile Road 230 kV line 11) Lodi-Eight Mile Road 230 kV line 12) Gold Hill-Lake 230 kV line 13) Vaca Dixon–Davis #1 115kV line 14) Vaca Dixon–Davis #2 115kV line
The substations that delineate the Sierra Area are:
1) Table Mountain is out Rio Oso is in 2) Table Mountain is out Palermo is in 3) Table Mt is out Pease is in 4) Caribou is out Palermo is in 5) Drum is in Summit is out 6) Drum is in Summit is out 7) Spaulding is in Summit is out 8) Brighton is in Bellota is out 9) Rio Oso is in Lockeford is out 10) Gold Hill is in Eight Mile is out 11) Lodi is in Eight Mile is out 12) Gold Hill is in Lake is out 13) Vaca Dixon is out Vaca Dixon Junction 1 is in 14) Vaca Dixon is out Vaca Dixon Junction 2 is in
Total 2019 busload within the defined area: 1976 MW with 100 MW of losses resulting
in total load + losses of 2076 MW.
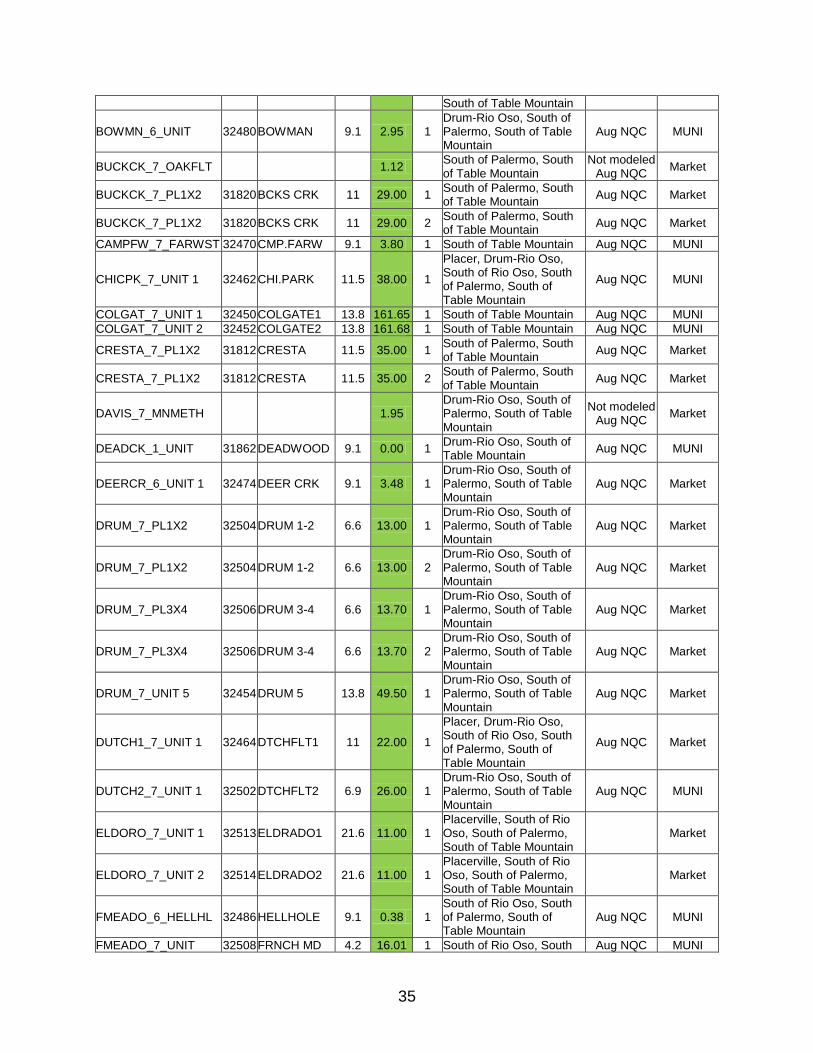
Total units and qualifying capacity available in this area:
MKT/SCHED RESOURCE ID
BUS #
BUS NAME kV NQC UNIT
ID LCR SUB-AREA NAME
NQC Comments
CAISO Tag
APLHIL_1_SLABCK 0.00 1 Placerville, South of Rio Oso, South of Palermo, South of Table Mountain
Not modeled Energy Only
Market
BANGOR_6_HYDRO 0.00 South of Table Mountain Energy Only Market
BELDEN_7_UNIT 1 31784 BELDEN 13.8 115.00 1 South of Palermo, South of Table Mountain
Aug NQC Market
BIOMAS_1_UNIT 1 32156 WOODLAND 9.1 24.70 1 Drum-Rio Oso, South of Palermo, South of Table Mountain
Aug NQC QF/Selfgen
BNNIEN_7_ALTAPH 32376 BONNIE N 60 0.46
Weimer, Placer, Drum-Rio Oso, South of Rio Oso, South of Palermo, South of Table Mountain
Not modeled Aug NQC
Market
BOGUE_1_UNITA1 32451 FREC 13.8 45.00 1 Bogue, Drum-Rio Oso, Aug NQC Market
35
South of Table Mountain
BOWMN_6_UNIT 32480 BOWMAN 9.1 2.95 1 Drum-Rio Oso, South of Palermo, South of Table Mountain
Aug NQC MUNI
BUCKCK_7_OAKFLT 1.12 South of Palermo, South of Table Mountain
Not modeled Aug NQC
Market
BUCKCK_7_PL1X2 31820 BCKS CRK 11 29.00 1 South of Palermo, South of Table Mountain
Aug NQC Market
BUCKCK_7_PL1X2 31820 BCKS CRK 11 29.00 2 South of Palermo, South of Table Mountain
Aug NQC Market
CAMPFW_7_FARWST 32470 CMP.FARW 9.1 3.80 1 South of Table Mountain Aug NQC MUNI
CHICPK_7_UNIT 1 32462 CHI.PARK 11.5 38.00 1
Placer, Drum-Rio Oso, South of Rio Oso, South of Palermo, South of Table Mountain
Aug NQC MUNI
COLGAT_7_UNIT 1 32450 COLGATE1 13.8 161.65 1 South of Table Mountain Aug NQC MUNI
COLGAT_7_UNIT 2 32452 COLGATE2 13.8 161.68 1 South of Table Mountain Aug NQC MUNI
CRESTA_7_PL1X2 31812 CRESTA 11.5 35.00 1 South of Palermo, South of Table Mountain
Aug NQC Market
CRESTA_7_PL1X2 31812 CRESTA 11.5 35.00 2 South of Palermo, South of Table Mountain
Aug NQC Market
DAVIS_7_MNMETH 1.95 Drum-Rio Oso, South of Palermo, South of Table Mountain
Not modeled Aug NQC
Market
DEADCK_1_UNIT 31862 DEADWOOD 9.1 0.00 1 Drum-Rio Oso, South of Table Mountain
Aug NQC MUNI
DEERCR_6_UNIT 1 32474 DEER CRK 9.1 3.48 1 Drum-Rio Oso, South of Palermo, South of Table Mountain
Aug NQC Market
DRUM_7_PL1X2 32504 DRUM 1-2 6.6 13.00 1 Drum-Rio Oso, South of Palermo, South of Table Mountain
Aug NQC Market
DRUM_7_PL1X2 32504 DRUM 1-2 6.6 13.00 2 Drum-Rio Oso, South of Palermo, South of Table Mountain
Aug NQC Market
DRUM_7_PL3X4 32506 DRUM 3-4 6.6 13.70 1 Drum-Rio Oso, South of Palermo, South of Table Mountain
Aug NQC Market
DRUM_7_PL3X4 32506 DRUM 3-4 6.6 13.70 2 Drum-Rio Oso, South of Palermo, South of Table Mountain
Aug NQC Market
DRUM_7_UNIT 5 32454 DRUM 5 13.8 49.50 1 Drum-Rio Oso, South of Palermo, South of Table Mountain
Aug NQC Market
DUTCH1_7_UNIT 1 32464 DTCHFLT1 11 22.00 1
Placer, Drum-Rio Oso, South of Rio Oso, South of Palermo, South of Table Mountain
Aug NQC Market
DUTCH2_7_UNIT 1 32502 DTCHFLT2 6.9 26.00 1 Drum-Rio Oso, South of Palermo, South of Table Mountain
Aug NQC MUNI
ELDORO_7_UNIT 1 32513 ELDRADO1 21.6 11.00 1 Placerville, South of Rio Oso, South of Palermo, South of Table Mountain
Market
ELDORO_7_UNIT 2 32514 ELDRADO2 21.6 11.00 1 Placerville, South of Rio Oso, South of Palermo, South of Table Mountain
Market
FMEADO_6_HELLHL 32486 HELLHOLE 9.1 0.38 1 South of Rio Oso, South of Palermo, South of Table Mountain
Aug NQC MUNI
FMEADO_7_UNIT 32508 FRNCH MD 4.2 16.01 1 South of Rio Oso, South Aug NQC MUNI
36
of Palermo, South of Table Mountain
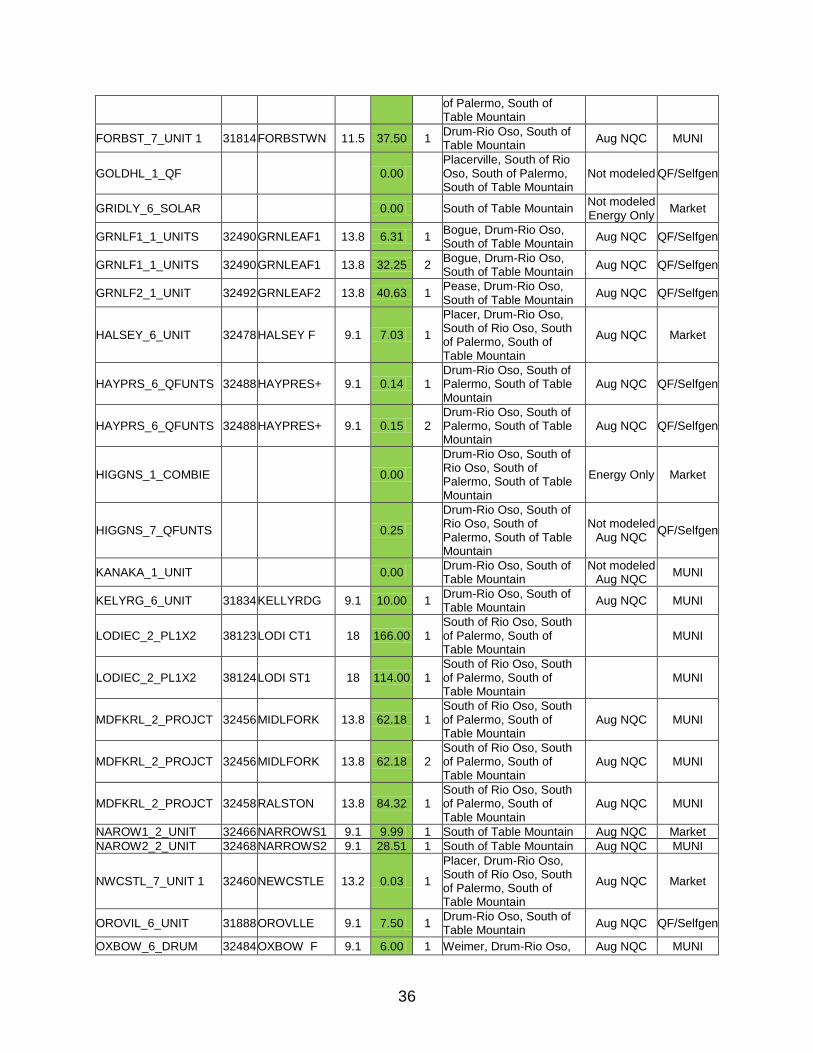
FORBST_7_UNIT 1 31814 FORBSTWN 11.5 37.50 1 Drum-Rio Oso, South of Table Mountain
Aug NQC MUNI
GOLDHL_1_QF 0.00 Placerville, South of Rio Oso, South of Palermo, South of Table Mountain
Not modeled QF/Selfgen
GRIDLY_6_SOLAR 0.00 South of Table Mountain Not modeled Energy Only
Market
GRNLF1_1_UNITS 32490 GRNLEAF1 13.8 6.31 1 Bogue, Drum-Rio Oso, South of Table Mountain
Aug NQC QF/Selfgen
GRNLF1_1_UNITS 32490 GRNLEAF1 13.8 32.25 2 Bogue, Drum-Rio Oso, South of Table Mountain
Aug NQC QF/Selfgen
GRNLF2_1_UNIT 32492 GRNLEAF2 13.8 40.63 1 Pease, Drum-Rio Oso, South of Table Mountain
Aug NQC QF/Selfgen
HALSEY_6_UNIT 32478 HALSEY F 9.1 7.03 1
Placer, Drum-Rio Oso, South of Rio Oso, South of Palermo, South of Table Mountain
Aug NQC Market
HAYPRS_6_QFUNTS 32488 HAYPRES+ 9.1 0.14 1 Drum-Rio Oso, South of Palermo, South of Table Mountain
Aug NQC QF/Selfgen
HAYPRS_6_QFUNTS 32488 HAYPRES+ 9.1 0.15 2 Drum-Rio Oso, South of Palermo, South of Table Mountain
Aug NQC QF/Selfgen
HIGGNS_1_COMBIE 0.00
Drum-Rio Oso, South of Rio Oso, South of Palermo, South of Table Mountain
Energy Only Market
HIGGNS_7_QFUNTS 0.25
Drum-Rio Oso, South of Rio Oso, South of Palermo, South of Table Mountain
Not modeled Aug NQC
QF/Selfgen
KANAKA_1_UNIT 0.00 Drum-Rio Oso, South of Table Mountain
Not modeled Aug NQC
MUNI
KELYRG_6_UNIT 31834 KELLYRDG 9.1 10.00 1 Drum-Rio Oso, South of Table Mountain
Aug NQC MUNI
LODIEC_2_PL1X2 38123 LODI CT1 18 166.00 1 South of Rio Oso, South of Palermo, South of Table Mountain
MUNI
LODIEC_2_PL1X2 38124 LODI ST1 18 114.00 1 South of Rio Oso, South of Palermo, South of Table Mountain
MUNI
MDFKRL_2_PROJCT 32456 MIDLFORK 13.8 62.18 1 South of Rio Oso, South of Palermo, South of Table Mountain
Aug NQC MUNI
MDFKRL_2_PROJCT 32456 MIDLFORK 13.8 62.18 2 South of Rio Oso, South of Palermo, South of Table Mountain
Aug NQC MUNI
MDFKRL_2_PROJCT 32458 RALSTON 13.8 84.32 1 South of Rio Oso, South of Palermo, South of Table Mountain
Aug NQC MUNI
NAROW1_2_UNIT 32466 NARROWS1 9.1 9.99 1 South of Table Mountain Aug NQC Market
NAROW2_2_UNIT 32468 NARROWS2 9.1 28.51 1 South of Table Mountain Aug NQC MUNI
NWCSTL_7_UNIT 1 32460 NEWCSTLE 13.2 0.03 1
Placer, Drum-Rio Oso, South of Rio Oso, South of Palermo, South of Table Mountain
Aug NQC Market
OROVIL_6_UNIT 31888 OROVLLE 9.1 7.50 1 Drum-Rio Oso, South of Table Mountain
Aug NQC QF/Selfgen
OXBOW_6_DRUM 32484 OXBOW F 9.1 6.00 1 Weimer, Drum-Rio Oso, Aug NQC MUNI
37
South of Palermo, South of Table Mountain
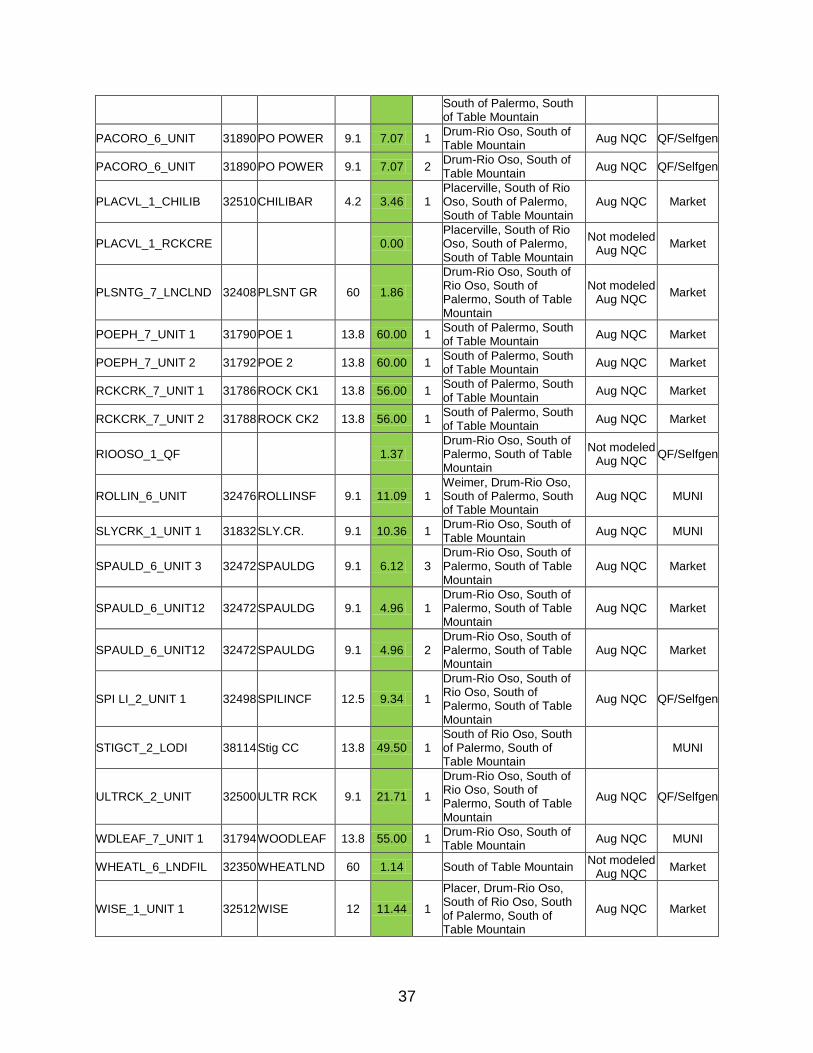
PACORO_6_UNIT 31890 PO POWER 9.1 7.07 1 Drum-Rio Oso, South of Table Mountain
Aug NQC QF/Selfgen
PACORO_6_UNIT 31890 PO POWER 9.1 7.07 2 Drum-Rio Oso, South of Table Mountain
Aug NQC QF/Selfgen
PLACVL_1_CHILIB 32510 CHILIBAR 4.2 3.46 1 Placerville, South of Rio Oso, South of Palermo, South of Table Mountain
Aug NQC Market
PLACVL_1_RCKCRE 0.00 Placerville, South of Rio Oso, South of Palermo, South of Table Mountain
Not modeled Aug NQC
Market
PLSNTG_7_LNCLND 32408 PLSNT GR 60 1.86
Drum-Rio Oso, South of Rio Oso, South of Palermo, South of Table Mountain
Not modeled Aug NQC
Market
POEPH_7_UNIT 1 31790 POE 1 13.8 60.00 1 South of Palermo, South of Table Mountain
Aug NQC Market
POEPH_7_UNIT 2 31792 POE 2 13.8 60.00 1 South of Palermo, South of Table Mountain
Aug NQC Market
RCKCRK_7_UNIT 1 31786 ROCK CK1 13.8 56.00 1 South of Palermo, South of Table Mountain
Aug NQC Market
RCKCRK_7_UNIT 2 31788 ROCK CK2 13.8 56.00 1 South of Palermo, South of Table Mountain
Aug NQC Market
RIOOSO_1_QF 1.37 Drum-Rio Oso, South of Palermo, South of Table Mountain
Not modeled Aug NQC
QF/Selfgen
ROLLIN_6_UNIT 32476 ROLLINSF 9.1 11.09 1 Weimer, Drum-Rio Oso, South of Palermo, South of Table Mountain
Aug NQC MUNI
SLYCRK_1_UNIT 1 31832 SLY.CR. 9.1 10.36 1 Drum-Rio Oso, South of Table Mountain
Aug NQC MUNI
SPAULD_6_UNIT 3 32472 SPAULDG 9.1 6.12 3 Drum-Rio Oso, South of Palermo, South of Table Mountain
Aug NQC Market
SPAULD_6_UNIT12 32472 SPAULDG 9.1 4.96 1 Drum-Rio Oso, South of Palermo, South of Table Mountain
Aug NQC Market
SPAULD_6_UNIT12 32472 SPAULDG 9.1 4.96 2 Drum-Rio Oso, South of Palermo, South of Table Mountain
Aug NQC Market
SPI LI_2_UNIT 1 32498 SPILINCF 12.5 9.34 1
Drum-Rio Oso, South of Rio Oso, South of Palermo, South of Table Mountain
Aug NQC QF/Selfgen
STIGCT_2_LODI 38114 Stig CC 13.8 49.50 1 South of Rio Oso, South of Palermo, South of Table Mountain
MUNI
ULTRCK_2_UNIT 32500 ULTR RCK 9.1 21.71 1
Drum-Rio Oso, South of Rio Oso, South of Palermo, South of Table Mountain
Aug NQC QF/Selfgen
WDLEAF_7_UNIT 1 31794 WOODLEAF 13.8 55.00 1 Drum-Rio Oso, South of Table Mountain
Aug NQC MUNI
WHEATL_6_LNDFIL 32350 WHEATLND 60 1.14 South of Table Mountain Not modeled
Aug NQC Market
WISE_1_UNIT 1 32512 WISE 12 11.44 1
Placer, Drum-Rio Oso, South of Rio Oso, South of Palermo, South of Table Mountain
Aug NQC Market

38
WISE_1_UNIT 2 32512 WISE 12 0.11 1
Placer, Drum-Rio Oso, South of Rio Oso, South of Palermo, South of Table Mountain
Aug NQC Market
YUBACT_1_SUNSWT 32494 YUBA CTY 9.1 29.78 1 Pease, Drum-Rio Oso, South of Table Mountain
Aug NQC QF/Selfgen
YUBACT_6_UNITA1 32496 YCEC 13.8 46.00 1 Pease, Drum-Rio Oso, South of Table Mountain
Market
NA 32162 RIV.DLTA 9.11 0.00 1 Drum-Rio Oso, South of Palermo, South of Table Mountain
No NQC - hist. data
QF/Selfgen
UCDAVS_1_UNIT 32166 UC DAVIS 9.1 3.50 1 Drum-Rio Oso, South of Palermo, South of Table Mountain
No NQC - hist. data
QF/Selfgen
Major new projects modeled:
1. Palermo-Rio Oso 115 kV Reconductoring
2. Gold Hill-Missouri Flat #1 and #2 115 kV line Reconductoring
3. Rio Oso #1 and #2 230/115 kV Transformer Replacement
4. Vaca Dixon-Davis Voltage Conversion
5. New Rio Oso-Atlantic 230 kV line
6. South of Palermo 115 kV Reinforcement
7. New Atlantic-Placer 115 kV Line
8. Pease 115/60 kV Transformer Addition
Critical Contingency Analysis Summary Placerville Sub-area
No requirements due to the Missouri Flat-Gold Hill 115 kV lines reconductoring project.
Placer Sub-area
The most critical contingency is the loss of the New Atlantic-Placer 115 kV line with
Chicago Park unit out of service. The area limitation is thermal overloading of the
Drum-Higgins 115 kV line. This limiting contingency establishes a local capacity need
of 60 MW (includes 38 MW of QF and MUNI generation) in 2019 as the minimum
capacity necessary for reliable load serving capability within this sub-area.
Effectiveness factors:

39
The following table has effectiveness factor to the most critical contingency.
Pease Sub-area
The most critical contingency is the loss of the Palermo-Pease 115 kV line followed by
Pease-Rio Oso 115 kV line. The area limitation is thermal overloading of the Table
Mountain-Pease 60 kV line. This limiting contingency establishes a LCR of 93 MW
(includes 70 MW of QF generation) in 2019 as the minimum capacity necessary for
reliable load serving capability within this sub-area.
The most critical single contingency is the loss of the Palermo-Pease 115 kV line with
YCEC unit out of service. The area limitation is thermal overloading of the Table
Mountain-Pease 60 kV line. This limiting contingency establishes a local capacity need
of 51 MW (includes 70 MW of QF generation) in 2019.
Effectiveness factors:
All units within this sub-area have the same effectiveness factor.
Bogue Sub-area
No requirements due to the Palermo-Rio Oso 115 kV reconductoring project.
Drum-Rio Oso Sub-area
No requirements due to the Rio Oso 230/115 kV transformers replacement project.
South of Rio Oso Sub-area
No requirements due to the addition of the new Rio Oso-Atlantic 230 kV line.
South of Palermo Sub-area
No requirements due to the South of Palermo reinforcement project.
South of Table Mountain Sub-area

40
The most critical contingency is the loss of the Table Mountain-Rio Oso and Table
Mountain-Palermo 230 kV double circuit tower line outage. The area limitation is
thermal overloading of the Caribou-Palermo 115 kV line. This limitation establishes a
local capacity need of 1102 MW in 2019 (includes 192 MW of QF and 1107 MW of
MUNI generation) as the minimum capacity necessary for reliable load serving
capability within this area.
The most critical single contingency is the loss of the Table Mountain-Rio Oso line with
Belden unit out of service. The area limitation is thermal overloading of the Table
Mountain-Palermo 230 kV line. This limiting contingency establishes a local capacity
need of 525 MW (includes 192 MW of QF and 1107 MW of MUNI generation) in 2019.
Effectiveness factors:
The following table has effectiveness factor to the most critical contingency.
Gen Bus # Gen Name Gen ID Eff Fctr (%)
31814 FORBSTWN 1 7
31794 WOODLEAF 1 7
31832 SLY.CR. 1 7
31862 DEADWOOD 1 7
31890 PO POWER 1 6
31890 PO POWER 2 6
31888 OROVLLE 1 6
31834 KELLYRDG 1 6
32450 COLGATE1 1 4
32466 NARROWS1 1 4
32468 NARROWS2 1 4
32452 COLGATE2 1 4
32470 CMP.FARW 1 4
32451 FREC 1 4
32490 GRNLEAF1 1 4
32490 GRNLEAF1 2 4
32496 YCEC 1 4
32494 YUBA CTY 1 4
32492 GRNLEAF2 1 4
32498 SPILINCF 1 2
31788 ROCK CK2 1 2
31812 CRESTA 1 2

41
31812 CRESTA 2 2
31820 BCKS CRK 1 2
31820 BCKS CRK 2 2
31786 ROCK CK1 1 2
31790 POE 1 1 2
31792 POE 2 1 2
31784 BELDEN 1 2
32500 ULTR RCK 1 2
32156 WOODLAND 1 2
32510 CHILIBAR 1 2
32513 ELDRADO1 1 2
32514 ELDRADO2 1 2
32478 HALSEY F 1 2
32460 NEWCSTLE 1 1
32458 RALSTON 1 1
32512 WISE 1 1
32456 MIDLFORK 1 1
32456 MIDLFORK 2 1
32486 HELLHOLE 1 1
32508 FRNCH MD 1 1
32162 RIV.DLTA 1 1
32502 DTCHFLT2 1 1
32462 CHI.PARK 1 1
32464 DTCHFLT1 1 1
32454 DRUM 5 1 1
32476 ROLLINSF 1 1
32484 OXBOW F 1 1
32474 DEER CRK 1 1
32504 DRUM 1-2 1 1
32504 DRUM 1-2 2 1
32506 DRUM 3-4 1 1
32506 DRUM 3-4 2 1
32166 UC DAVIS 1 1
32472 SPAULDG 1 1
32472 SPAULDG 2 1
32472 SPAULDG 3 1
32480 BOWMAN 1 1
32488 HAYPRES+ 1 1
32488 HAYPRES+ 2 1
38124 LODI ST1 1 1
38123 LODI CT1 1 1
38114 STIG CC 1 1

42
Changes compared to last year’s results:
The load forecast went down by 100 MW as compared to 2018. Overall the total LCR
for 2019 for the Sierra area has decreased by 51 MW.
Sierra Overall Requirements:
2019 QF (MW)
Muni (MW)
Market (MW)
Max. Qualifying Capacity (MW)
Available generation 192 1107 771 2070
2019 Existing Generation
Capacity Needed (MW) Deficiency
(MW) Total MW
Requirement
Category B (Single)9 525 0 525
Category C (Multiple)10
1102 0 1102
4. Stockton Area
Area Definition
The transmission facilities that establish the boundary of the Tesla-Bellota sub-area are:
1) Bellota 230/115 kV Transformer #1 2) Bellota 230/115 kV Transformer #2 3) Tesla-Tracy 115 kV Line 4) Tesla-Salado 115 kV Line 5) Tesla-Salado-Manteca 115 kV line 6) Tesla-Schulte #1 115 kV Line 7) Tesla-Schulte #2 115kV line 8) Tesla-Vierra 115 kV Line
The substations that delineate the Tesla-Bellota Sub-area are:
1) Bellota 230 kV is out Bellota 115 kV is in 2) Bellota 230 kV is out Bellota 115 kV is in 3) Tesla is out Tracy is in 4) Tesla is out Salado is in 5) Tesla is out Salado and Manteca are in
9 A single contingency means that the system will be able the survive the loss of a single element,
however the operators will not have any means (other than load drop) in order to bring the system within
a safe operating zone and get prepared for the next contingency as required by MORC. 10
Multiple contingencies means that the system will be able the survive the loss of a single element, and
the operators will have enough generation (other operating procedures) in order to bring the system
within a safe operating zone and get prepared for the next contingency as required by MORC.

43
6) Tesla is out Schulte is in 7) Tesla is out Schulte is in 8) Tesla is out Thermal Energy is in
The transmission facilities that establish the boundary of the Lockeford sub-area are:
1) Lockeford-Industrial 60 kV line 2) Lockeford-Lodi #1 60 kV line 3) Lockeford-Lodi #2 60 kV line 4) Lockeford-Lodi #3 60 kV line
The substations that delineate the Lockeford Sub-area are:
1) Lockeford is out Industrial is in 2) Lockeford is out Lodi is in 3) Lockeford is out Lodi is in 4) Lockeford is out Lodi is in
The transmission facilities that establish the boundary of the Weber Sub-area are:
1) Weber 230/60 kV Transformer #1 2) Weber 230/60 kV Transformer #2
The substations that delineate the Weber Sub-area are:
1) Weber 230 kV is out Weber 60 kV is in 2) Weber 230 kV is out Weber 60 kV is in
Total 2019 busload within the defined area: 1118 MW with 18 MW of losses resulting in
total load + losses of 1136 MW.
Total units and qualifying capacity available in this area:
MKT/SCHED RESOURCE ID
BUS # BUS NAME kV NQC UNIT
ID LCR SUB-AREA NAME
NQC Comments CAISO Tag
BEARDS_7_UNIT 1 34074 BEARDSLY 6.9 8.36 1 Tesla-Bellota, Stanislaus
Aug NQC MUNI
CAMCHE_1_PL1X3 33850 CAMANCHE 4.2 1.44 1 Tesla-Bellota Aug NQC MUNI
CAMCHE_1_PL1X3 33850 CAMANCHE 4.2 1.44 2 Tesla-Bellota Aug NQC MUNI
CAMCHE_1_PL1X3 33850 CAMANCHE 4.2 1.45 3 Tesla-Bellota Aug NQC MUNI
COGNAT_1_UNIT 33818 COG.NTNL 12 25.46 1 Weber Aug NQC QF/Selfgen
CURIS_1_QF 0.94 Tesla-Bellota Not modeled Aug NQC QF/Selfgen
DONNLS_7_UNIT 34058 DONNELLS 13.8 72.00 1 Tesla-Bellota, Stanislaus
Aug NQC MUNI
FROGTN_7_UTICA 0.00 Tesla-Bellota, Stanislaus
Energy Only Market
LODI25_2_UNIT 1 38120 LODI25CT 9.11 22.70 1 Lockeford MUNI
PHOENX_1_UNIT 1.33 Tesla-Bellota, Stanislaus
Not modeled Aug NQC Market
SCHLTE_1_PL1X3 33805 GWFTRCY1 13.8 83.56 1 Tesla-Bellota Market
SCHLTE_1_PL1X3 33807 GWFTRCY2 13.8 82.88 1 Tesla-Bellota Market
SCHLTE_1_PL1X3 33811 GWFTRCY3 13.8 132.96 1 Tesla-Bellota Market
SNDBAR_7_UNIT 1 34060 SANDBAR 13.8 13.11 1 Tesla-Bellota, Stanislaus
Aug NQC MUNI
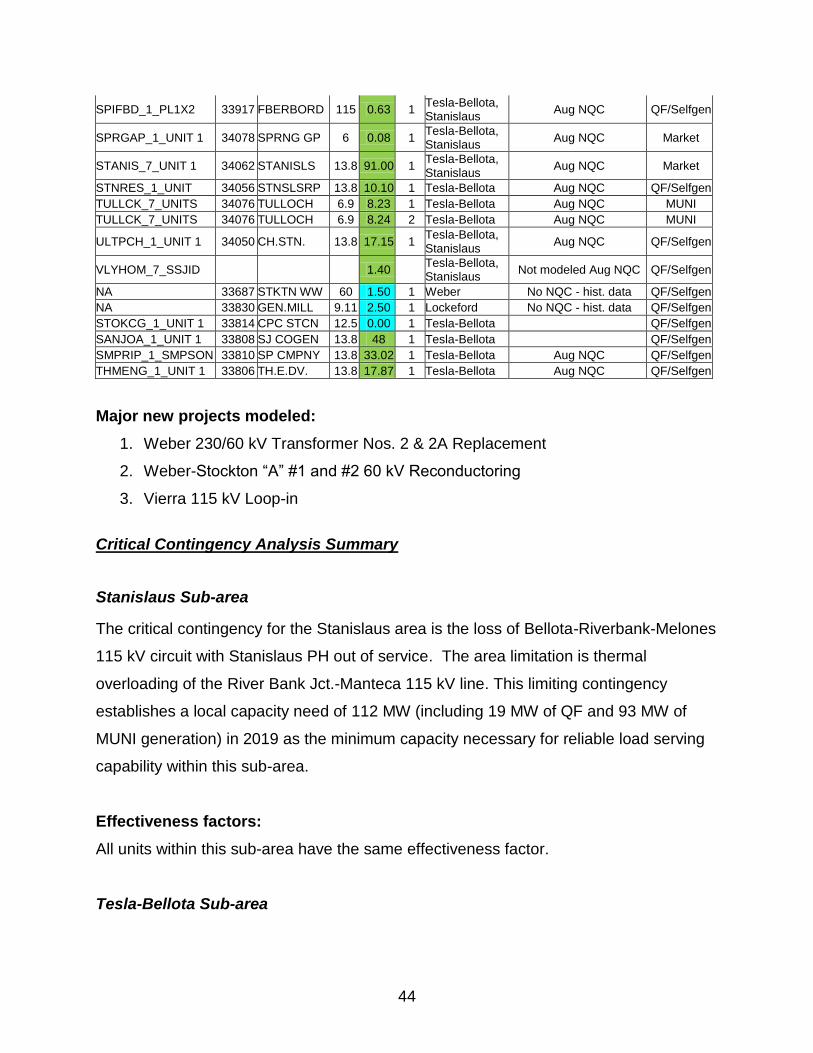
44
SPIFBD_1_PL1X2 33917 FBERBORD 115 0.63 1 Tesla-Bellota, Stanislaus
Aug NQC QF/Selfgen
SPRGAP_1_UNIT 1 34078 SPRNG GP 6 0.08 1 Tesla-Bellota, Stanislaus
Aug NQC Market
STANIS_7_UNIT 1 34062 STANISLS 13.8 91.00 1 Tesla-Bellota, Stanislaus
Aug NQC Market
STNRES_1_UNIT 34056 STNSLSRP 13.8 10.10 1 Tesla-Bellota Aug NQC QF/Selfgen
TULLCK_7_UNITS 34076 TULLOCH 6.9 8.23 1 Tesla-Bellota Aug NQC MUNI
TULLCK_7_UNITS 34076 TULLOCH 6.9 8.24 2 Tesla-Bellota Aug NQC MUNI
ULTPCH_1_UNIT 1 34050 CH.STN. 13.8 17.15 1 Tesla-Bellota, Stanislaus
Aug NQC QF/Selfgen
VLYHOM_7_SSJID 1.40 Tesla-Bellota, Stanislaus
Not modeled Aug NQC QF/Selfgen
NA 33687 STKTN WW 60 1.50 1 Weber No NQC - hist. data QF/Selfgen
NA 33830 GEN.MILL 9.11 2.50 1 Lockeford No NQC - hist. data QF/Selfgen
STOKCG_1_UNIT 1 33814 CPC STCN 12.5 0.00 1 Tesla-Bellota QF/Selfgen
SANJOA_1_UNIT 1 33808 SJ COGEN 13.8 48 1 Tesla-Bellota QF/Selfgen
SMPRIP_1_SMPSON 33810 SP CMPNY 13.8 33.02 1 Tesla-Bellota Aug NQC QF/Selfgen
THMENG_1_UNIT 1 33806 TH.E.DV. 13.8 17.87 1 Tesla-Bellota Aug NQC QF/Selfgen
Major new projects modeled:
1. Weber 230/60 kV Transformer Nos. 2 & 2A Replacement
2. Weber-Stockton “A” #1 and #2 60 kV Reconductoring
3. Vierra 115 kV Loop-in
Critical Contingency Analysis Summary
Stanislaus Sub-area
The critical contingency for the Stanislaus area is the loss of Bellota-Riverbank-Melones
115 kV circuit with Stanislaus PH out of service. The area limitation is thermal
overloading of the River Bank Jct.-Manteca 115 kV line. This limiting contingency
establishes a local capacity need of 112 MW (including 19 MW of QF and 93 MW of
MUNI generation) in 2019 as the minimum capacity necessary for reliable load serving
capability within this sub-area.
Effectiveness factors:
All units within this sub-area have the same effectiveness factor.
Tesla-Bellota Sub-area
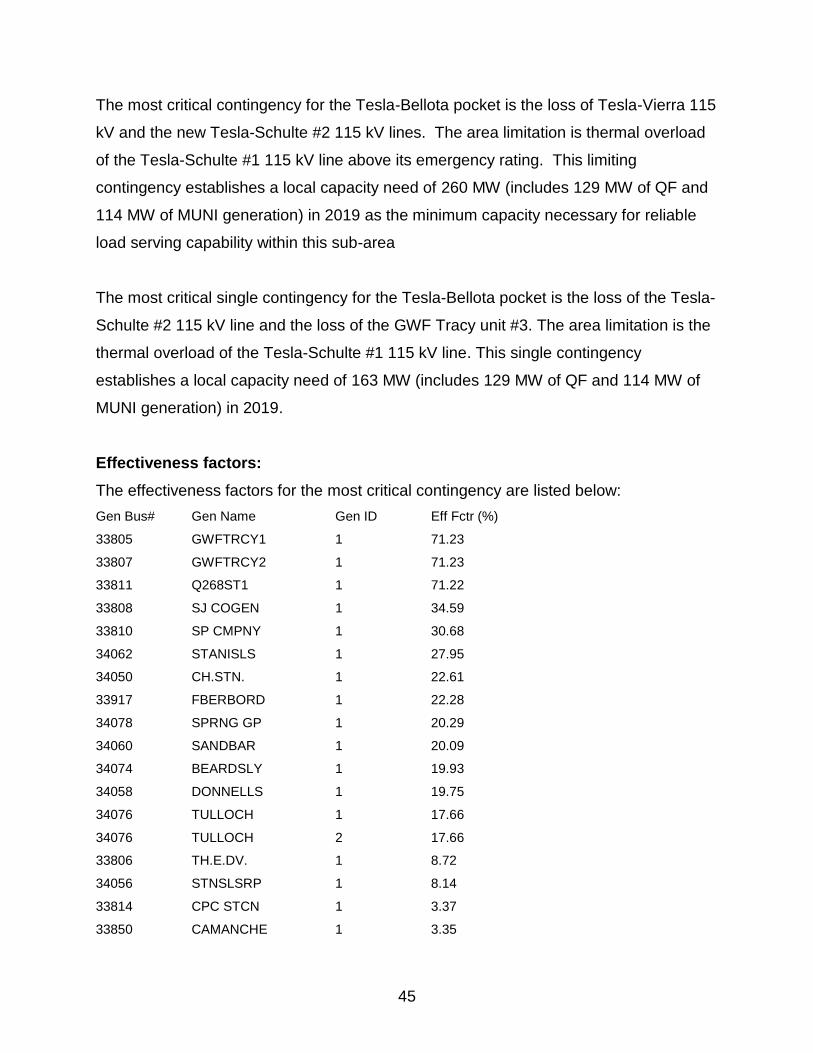
45
The most critical contingency for the Tesla-Bellota pocket is the loss of Tesla-Vierra 115
kV and the new Tesla-Schulte #2 115 kV lines. The area limitation is thermal overload
of the Tesla-Schulte #1 115 kV line above its emergency rating. This limiting
contingency establishes a local capacity need of 260 MW (includes 129 MW of QF and
114 MW of MUNI generation) in 2019 as the minimum capacity necessary for reliable
load serving capability within this sub-area
The most critical single contingency for the Tesla-Bellota pocket is the loss of the Tesla-
Schulte #2 115 kV line and the loss of the GWF Tracy unit #3. The area limitation is the
thermal overload of the Tesla-Schulte #1 115 kV line. This single contingency
establishes a local capacity need of 163 MW (includes 129 MW of QF and 114 MW of
MUNI generation) in 2019.
Effectiveness factors:
The effectiveness factors for the most critical contingency are listed below:
Gen Bus# Gen Name Gen ID Eff Fctr (%)
33805 GWFTRCY1 1 71.23
33807 GWFTRCY2 1 71.23
33811 Q268ST1 1 71.22
33808 SJ COGEN 1 34.59
33810 SP CMPNY 1 30.68
34062 STANISLS 1 27.95
34050 CH.STN. 1 22.61
33917 FBERBORD 1 22.28
34078 SPRNG GP 1 20.29
34060 SANDBAR 1 20.09
34074 BEARDSLY 1 19.93
34058 DONNELLS 1 19.75
34076 TULLOCH 1 17.66
34076 TULLOCH 2 17.66
33806 TH.E.DV. 1 8.72
34056 STNSLSRP 1 8.14
33814 CPC STCN 1 3.37
33850 CAMANCHE 1 3.35
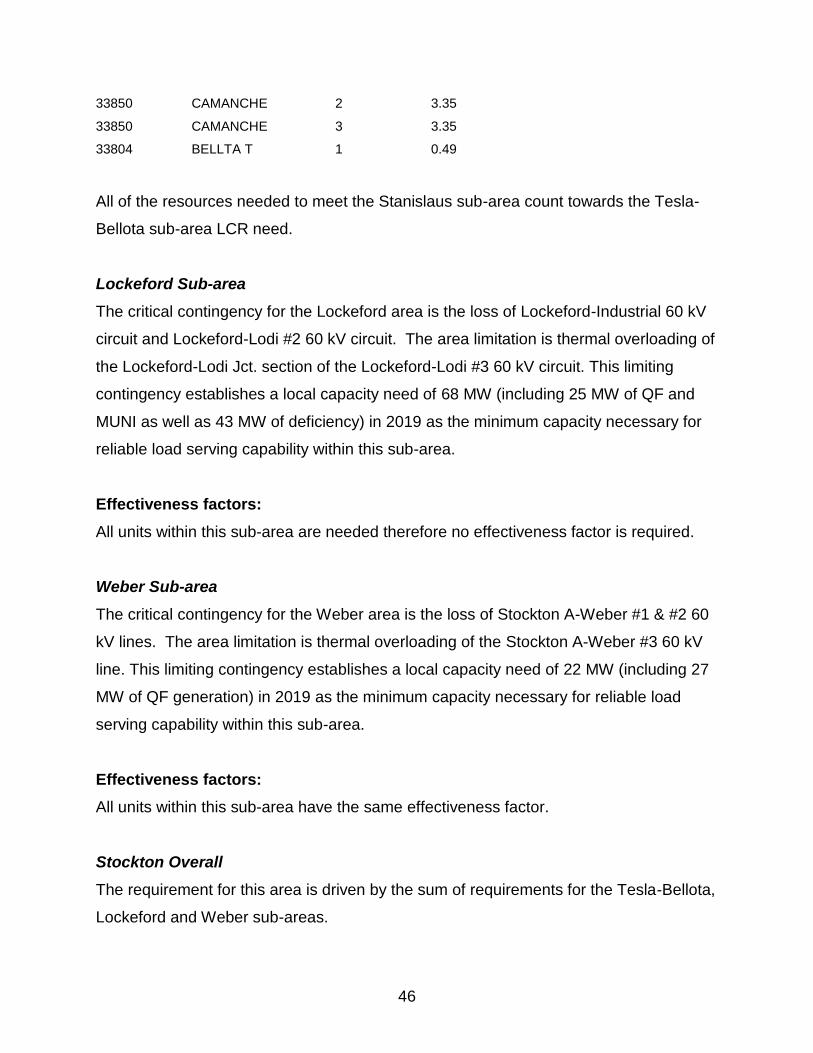
46
33850 CAMANCHE 2 3.35
33850 CAMANCHE 3 3.35
33804 BELLTA T 1 0.49
All of the resources needed to meet the Stanislaus sub-area count towards the Tesla-
Bellota sub-area LCR need.
Lockeford Sub-area
The critical contingency for the Lockeford area is the loss of Lockeford-Industrial 60 kV
circuit and Lockeford-Lodi #2 60 kV circuit. The area limitation is thermal overloading of
the Lockeford-Lodi Jct. section of the Lockeford-Lodi #3 60 kV circuit. This limiting
contingency establishes a local capacity need of 68 MW (including 25 MW of QF and
MUNI as well as 43 MW of deficiency) in 2019 as the minimum capacity necessary for
reliable load serving capability within this sub-area.
Effectiveness factors:
All units within this sub-area are needed therefore no effectiveness factor is required.
Weber Sub-area
The critical contingency for the Weber area is the loss of Stockton A-Weber #1 & #2 60
kV lines. The area limitation is thermal overloading of the Stockton A-Weber #3 60 kV
line. This limiting contingency establishes a local capacity need of 22 MW (including 27
MW of QF generation) in 2019 as the minimum capacity necessary for reliable load
serving capability within this sub-area.
Effectiveness factors:
All units within this sub-area have the same effectiveness factor.
Stockton Overall
The requirement for this area is driven by the sum of requirements for the Tesla-Bellota,
Lockeford and Weber sub-areas.

47
Changes compared to last year’s results:
The 2019 load forecast went down by 88 MW and the overall LCR has decreased by 66
MW as compared to the 2018.
Stockton Overall Requirements:
2019 QF (MW)
Muni (MW)
Market (MW)
Max. Qualifying Capacity (MW)
Available generation 158 137 392 687
2019 Existing Generation
Capacity Needed (MW) Deficiency
(MW) Total MW
Requirement
Category B (Single)11
163 0 163
Category C (Multiple)12
308 43 351
5. Greater Bay Area
Area Definition The transmission tie lines into the Greater Bay Area are:
1) Lakeville-Sobrante 230 kV 2) Ignacio-Sobrante 230 kV 3) Parkway-Moraga 230 kV 4) Bahia-Moraga 230 kV 5) Lambie SW Sta-Vaca Dixon 230 kV 6) Peabody-Contra Costa P.P. 230 kV 7) Tesla-Kelso 230 kV 8) Tesla-Delta Switching Yard 230 kV 9) Tesla-Pittsburg #1 230 kV 10) Tesla-Pittsburg #2 230 kV 11) Tesla-Newark #1 230 kV 12) Tesla-Newark #2 230 kV 13) Tesla-Ravenswood 230 kV 14) Tesla-Metcalf 500 kV 15) Moss Landing-Metcalf 500 kV 16) Moss Landing-Metcalf #1 230 kV
11
A single contingency means that the system will be able the survive the loss of a single element,
however the operators will not have any means (other than load drop) in order to bring the system within
a safe operating zone and get prepared for the next contingency as required by MORC. 12
Multiple contingencies means that the system will be able the survive the loss of a single element, and
the operators will have enough generation (other operating procedures) in order to bring the system
within a safe operating zone and get prepared for the next contingency as required by MORC.
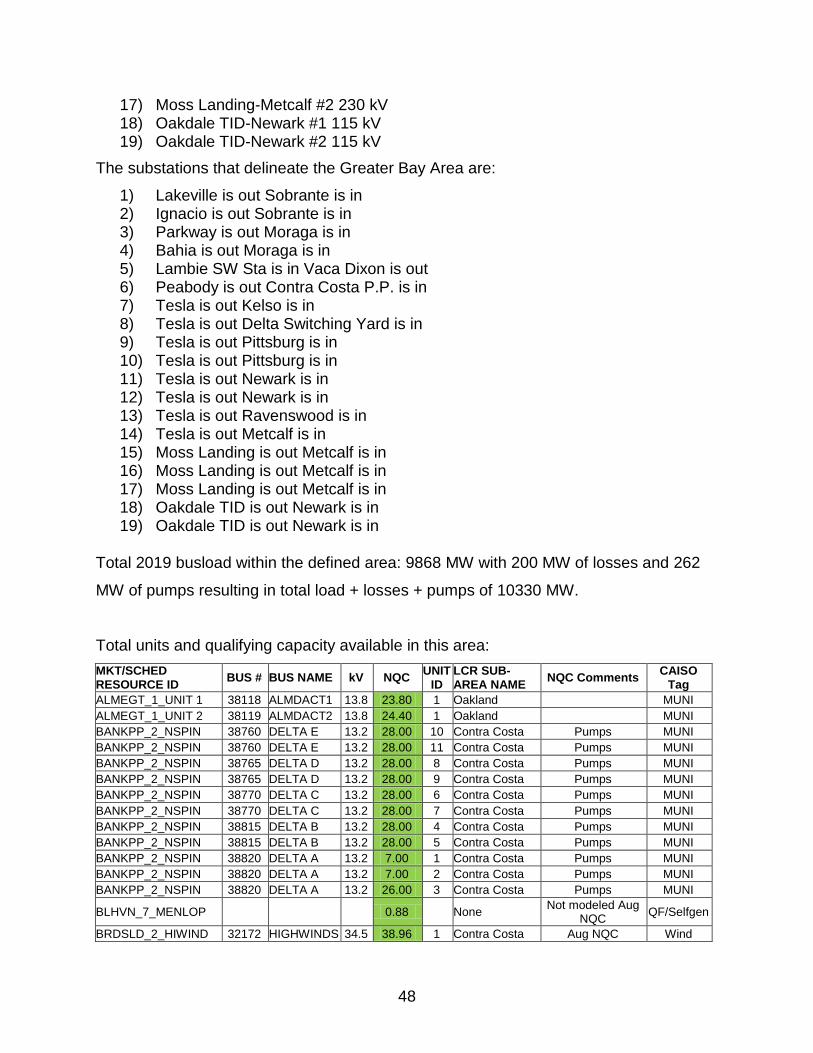
48
17) Moss Landing-Metcalf #2 230 kV 18) Oakdale TID-Newark #1 115 kV 19) Oakdale TID-Newark #2 115 kV
The substations that delineate the Greater Bay Area are:
1) Lakeville is out Sobrante is in 2) Ignacio is out Sobrante is in 3) Parkway is out Moraga is in 4) Bahia is out Moraga is in 5) Lambie SW Sta is in Vaca Dixon is out 6) Peabody is out Contra Costa P.P. is in 7) Tesla is out Kelso is in 8) Tesla is out Delta Switching Yard is in 9) Tesla is out Pittsburg is in 10) Tesla is out Pittsburg is in 11) Tesla is out Newark is in 12) Tesla is out Newark is in 13) Tesla is out Ravenswood is in 14) Tesla is out Metcalf is in 15) Moss Landing is out Metcalf is in 16) Moss Landing is out Metcalf is in 17) Moss Landing is out Metcalf is in 18) Oakdale TID is out Newark is in 19) Oakdale TID is out Newark is in
Total 2019 busload within the defined area: 9868 MW with 200 MW of losses and 262
MW of pumps resulting in total load + losses + pumps of 10330 MW.
Total units and qualifying capacity available in this area:
MKT/SCHED RESOURCE ID
BUS # BUS NAME kV NQC UNIT
ID LCR SUB-AREA NAME
NQC Comments CAISO
Tag
ALMEGT_1_UNIT 1 38118 ALMDACT1 13.8 23.80 1 Oakland MUNI
ALMEGT_1_UNIT 2 38119 ALMDACT2 13.8 24.40 1 Oakland MUNI
BANKPP_2_NSPIN 38760 DELTA E 13.2 28.00 10 Contra Costa Pumps MUNI
BANKPP_2_NSPIN 38760 DELTA E 13.2 28.00 11 Contra Costa Pumps MUNI
BANKPP_2_NSPIN 38765 DELTA D 13.2 28.00 8 Contra Costa Pumps MUNI
BANKPP_2_NSPIN 38765 DELTA D 13.2 28.00 9 Contra Costa Pumps MUNI
BANKPP_2_NSPIN 38770 DELTA C 13.2 28.00 6 Contra Costa Pumps MUNI
BANKPP_2_NSPIN 38770 DELTA C 13.2 28.00 7 Contra Costa Pumps MUNI
BANKPP_2_NSPIN 38815 DELTA B 13.2 28.00 4 Contra Costa Pumps MUNI
BANKPP_2_NSPIN 38815 DELTA B 13.2 28.00 5 Contra Costa Pumps MUNI
BANKPP_2_NSPIN 38820 DELTA A 13.2 7.00 1 Contra Costa Pumps MUNI
BANKPP_2_NSPIN 38820 DELTA A 13.2 7.00 2 Contra Costa Pumps MUNI
BANKPP_2_NSPIN 38820 DELTA A 13.2 26.00 3 Contra Costa Pumps MUNI
BLHVN_7_MENLOP 0.88 None Not modeled Aug
NQC QF/Selfgen
BRDSLD_2_HIWIND 32172 HIGHWINDS 34.5 38.96 1 Contra Costa Aug NQC Wind

49
BRDSLD_2_MTZUM2 32179 MNTZUMA2 0.69 13.02 1 Contra Costa Aug NQC Wind
BRDSLD_2_MTZUMA 32171 HIGHWND3 34.5 7.12 1 Contra Costa Aug NQC Wind
BRDSLD_2_SHILO1 32176 SHILOH 34.5 35.34 1 Contra Costa Aug NQC Wind
BRDSLD_2_SHILO2 32177 SHILOH 2 34.5 36.13 1 Contra Costa Aug NQC Wind
BRDSLD_2_SHLO3A 32191 SHLH3AC2 0.58 17.45 1 Contra Costa Aug NQC Wind
BRDSLD_2_SHLO3B 32194 SHLH3BC2 0.58 17.45 1 Contra Costa Aug NQC Wind
CALPIN_1_AGNEW 35860 OLS-AGNE 9.11 28.00 1 San Jose Aug NQC QF/Selfgen
CARDCG_1_UNITS 33463 CARDINAL 12.5 10.49 1 None Aug NQC QF/Selfgen
CARDCG_1_UNITS 33463 CARDINAL 12.5 10.49 2 None Aug NQC QF/Selfgen
CLRMTK_1_QF 0.00 Oakland Not modeled QF/Selfgen
COCOPP_2_CTG1 33188 MARSHBS1 16.4 191.35 1 Contra Costa Aug NQC Market
COCOPP_2_CTG2 33188 MARSHBS1 16.4 189.30 2 Contra Costa Aug NQC Market
COCOPP_2_CTG3 33189 MARSHBS2 16.4 191.45 3 Contra Costa Aug NQC Market
COCOPP_2_CTG4 33189 MARSHBS2 16.4 191.44 4 Contra Costa Aug NQC Market
CONTAN_1_UNIT 36856 CCA100 13.8 27.70 1 San Jose Aug NQC QF/Selfgen
CROKET_7_UNIT 32900 CRCKTCOG 18 225.24 1 Pittsburg Aug NQC QF/Selfgen
CSCCOG_1_UNIT 1 36854 Cogen 12 3.00 1 San Jose MUNI
CSCCOG_1_UNIT 1 36854 Cogen 12 3.00 2 San Jose MUNI
CSCGNR_1_UNIT 1 36858 Gia100 13.8 24.00 1 San Jose MUNI
CSCGNR_1_UNIT 2 36895 Gia200 13.8 24.00 2 San Jose MUNI
DELTA_2_PL1X4 33107 DEC STG1 24 269.61 1 Pittsburg Aug NQC Market
DELTA_2_PL1X4 33108 DEC CTG1 18 181.13 1 Pittsburg Aug NQC Market
DELTA_2_PL1X4 33109 DEC CTG2 18 181.13 1 Pittsburg Aug NQC Market
DELTA_2_PL1X4 33110 DEC CTG3 18 181.13 1 Pittsburg Aug NQC Market
DUANE_1_PL1X3 36863 DVRaGT1 13.8 49.27 1 San Jose MUNI
DUANE_1_PL1X3 36864 DVRbGT2 13.8 49.27 1 San Jose MUNI
DUANE_1_PL1X3 36865 DVRaST3 13.8 49.26 1 San Jose MUNI
FLOWD1_6_ALTPP1 35318 FLOWDPTR 9.11 0.00 1 Contra Costa Aug NQC Wind
GATWAY_2_PL1X3 33118 GATEWAY1 18 189.27 1 Contra Costa Aug NQC Market
GATWAY_2_PL1X3 33119 GATEWAY2 18 185.36 1 Contra Costa Aug NQC Market
GATWAY_2_PL1X3 33120 GATEWAY3 18 185.36 1 Contra Costa Aug NQC Market
GILROY_1_UNIT 35850 GLRY COG 13.8 69.30 1 Llagas Aug NQC Market
GILROY_1_UNIT 35850 GLRY COG 13.8 35.70 2 Llagas Aug NQC Market
GILRPP_1_PL1X2 35851 GROYPKR1 13.8 45.50 1 Llagas Aug NQC Market
GILRPP_1_PL1X2 35852 GROYPKR2 13.8 45.50 1 Llagas Aug NQC Market
GILRPP_1_PL3X4 35853 GROYPKR3 13.8 46.00 1 Llagas Aug NQC Market
GRZZLY_1_BERKLY 32740 HILLSIDE 115 24.92 1 None Aug NQC QF/Selfgen
HICKS_7_GUADLP 1.74 None Not modeled Aug
NQC QF/Selfgen
KELSO_2_UNITS 33813 MARIPCT1 13.8 45.95 1 Contra Costa Aug NQC Market
KELSO_2_UNITS 33815 MARIPCT2 13.8 45.95 2 Contra Costa Aug NQC Market
KELSO_2_UNITS 33817 MARIPCT3 13.8 45.95 3 Contra Costa Aug NQC Market
KELSO_2_UNITS 33819 MARIPCT4 13.8 45.96 4 Contra Costa Aug NQC Market
KIRKER_7_KELCYN 3.21 Pittsburg Not modeled Market
LAWRNC_7_SUNYVL 0.11 None Not modeled Aug
NQC Market
LECEF_1_UNITS 35854 LECEFGT1 13.8 46.50 1 San Jose Aug NQC Market
LECEF_1_UNITS 35855 LECEFGT2 13.8 46.50 1 San Jose Aug NQC Market
LECEF_1_UNITS 35856 LECEFGT3 13.8 46.50 1 San Jose Aug NQC Market
LECEF_1_UNITS 35857 LECEFGT4 13.8 46.50 1 San Jose Aug NQC Market
LECEF_1_UNITS 35858 LECEFST1 13.8 107.88 1 San Jose Market
LFC 51_2_UNIT 1 35310 LFC FIN+ 9.11 2.03 1 None Aug NQC Wind
LMBEPK_2_UNITA1 32173 LAMBGT1 13.8 47.00 1 Contra Costa Aug NQC Market
LMBEPK_2_UNITA2 32174 GOOSEHGT 13.8 46.00 2 Contra Costa Aug NQC Market
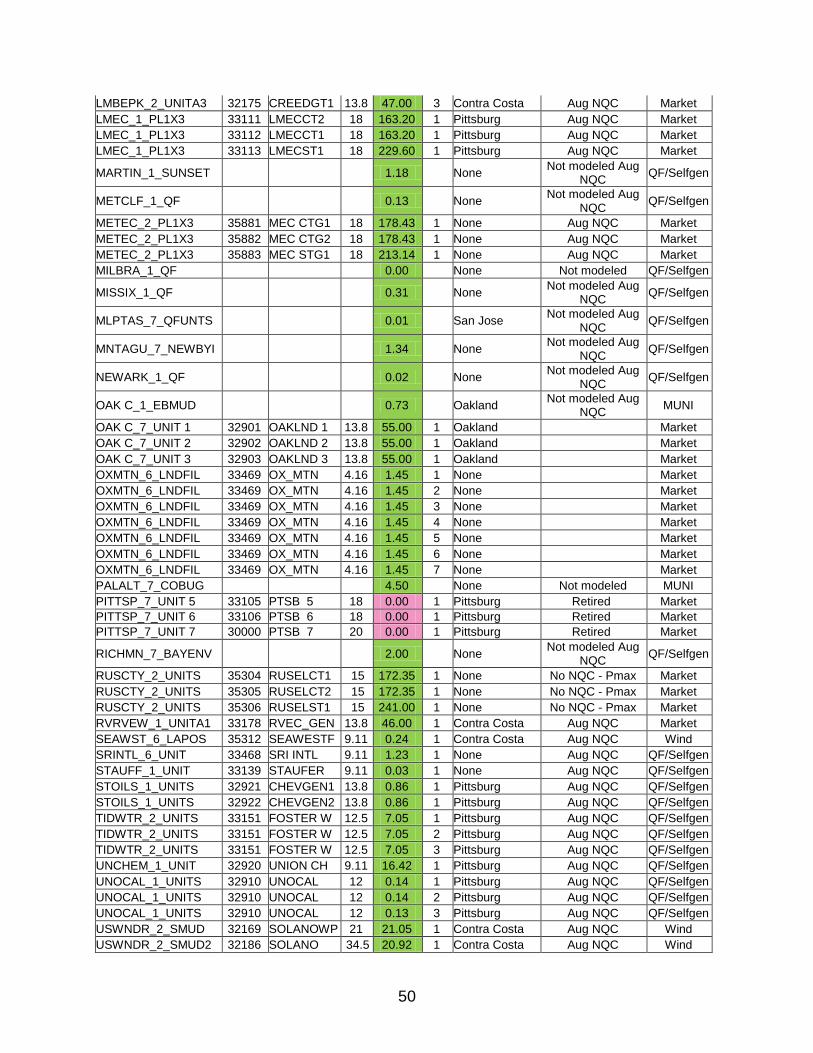
50
LMBEPK_2_UNITA3 32175 CREEDGT1 13.8 47.00 3 Contra Costa Aug NQC Market
LMEC_1_PL1X3 33111 LMECCT2 18 163.20 1 Pittsburg Aug NQC Market
LMEC_1_PL1X3 33112 LMECCT1 18 163.20 1 Pittsburg Aug NQC Market
LMEC_1_PL1X3 33113 LMECST1 18 229.60 1 Pittsburg Aug NQC Market
MARTIN_1_SUNSET 1.18 None Not modeled Aug
NQC QF/Selfgen
METCLF_1_QF 0.13 None Not modeled Aug
NQC QF/Selfgen
METEC_2_PL1X3 35881 MEC CTG1 18 178.43 1 None Aug NQC Market
METEC_2_PL1X3 35882 MEC CTG2 18 178.43 1 None Aug NQC Market
METEC_2_PL1X3 35883 MEC STG1 18 213.14 1 None Aug NQC Market
MILBRA_1_QF 0.00 None Not modeled QF/Selfgen
MISSIX_1_QF 0.31 None Not modeled Aug
NQC QF/Selfgen
MLPTAS_7_QFUNTS 0.01 San Jose Not modeled Aug
NQC QF/Selfgen
MNTAGU_7_NEWBYI 1.34 None Not modeled Aug
NQC QF/Selfgen
NEWARK_1_QF 0.02 None Not modeled Aug
NQC QF/Selfgen
OAK C_1_EBMUD 0.73 Oakland Not modeled Aug
NQC MUNI
OAK C_7_UNIT 1 32901 OAKLND 1 13.8 55.00 1 Oakland Market
OAK C_7_UNIT 2 32902 OAKLND 2 13.8 55.00 1 Oakland Market
OAK C_7_UNIT 3 32903 OAKLND 3 13.8 55.00 1 Oakland Market
OXMTN_6_LNDFIL 33469 OX_MTN 4.16 1.45 1 None Market
OXMTN_6_LNDFIL 33469 OX_MTN 4.16 1.45 2 None Market
OXMTN_6_LNDFIL 33469 OX_MTN 4.16 1.45 3 None Market
OXMTN_6_LNDFIL 33469 OX_MTN 4.16 1.45 4 None Market
OXMTN_6_LNDFIL 33469 OX_MTN 4.16 1.45 5 None Market
OXMTN_6_LNDFIL 33469 OX_MTN 4.16 1.45 6 None Market
OXMTN_6_LNDFIL 33469 OX_MTN 4.16 1.45 7 None Market
PALALT_7_COBUG 4.50 None Not modeled MUNI
PITTSP_7_UNIT 5 33105 PTSB 5 18 0.00 1 Pittsburg Retired Market
PITTSP_7_UNIT 6 33106 PTSB 6 18 0.00 1 Pittsburg Retired Market
PITTSP_7_UNIT 7 30000 PTSB 7 20 0.00 1 Pittsburg Retired Market
RICHMN_7_BAYENV 2.00 None Not modeled Aug
NQC QF/Selfgen
RUSCTY_2_UNITS 35304 RUSELCT1 15 172.35 1 None No NQC - Pmax Market
RUSCTY_2_UNITS 35305 RUSELCT2 15 172.35 1 None No NQC - Pmax Market
RUSCTY_2_UNITS 35306 RUSELST1 15 241.00 1 None No NQC - Pmax Market
RVRVEW_1_UNITA1 33178 RVEC_GEN 13.8 46.00 1 Contra Costa Aug NQC Market
SEAWST_6_LAPOS 35312 SEAWESTF 9.11 0.24 1 Contra Costa Aug NQC Wind
SRINTL_6_UNIT 33468 SRI INTL 9.11 1.23 1 None Aug NQC QF/Selfgen
STAUFF_1_UNIT 33139 STAUFER 9.11 0.03 1 None Aug NQC QF/Selfgen
STOILS_1_UNITS 32921 CHEVGEN1 13.8 0.86 1 Pittsburg Aug NQC QF/Selfgen
STOILS_1_UNITS 32922 CHEVGEN2 13.8 0.86 1 Pittsburg Aug NQC QF/Selfgen
TIDWTR_2_UNITS 33151 FOSTER W 12.5 7.05 1 Pittsburg Aug NQC QF/Selfgen
TIDWTR_2_UNITS 33151 FOSTER W 12.5 7.05 2 Pittsburg Aug NQC QF/Selfgen
TIDWTR_2_UNITS 33151 FOSTER W 12.5 7.05 3 Pittsburg Aug NQC QF/Selfgen
UNCHEM_1_UNIT 32920 UNION CH 9.11 16.42 1 Pittsburg Aug NQC QF/Selfgen
UNOCAL_1_UNITS 32910 UNOCAL 12 0.14 1 Pittsburg Aug NQC QF/Selfgen
UNOCAL_1_UNITS 32910 UNOCAL 12 0.14 2 Pittsburg Aug NQC QF/Selfgen
UNOCAL_1_UNITS 32910 UNOCAL 12 0.13 3 Pittsburg Aug NQC QF/Selfgen
USWNDR_2_SMUD 32169 SOLANOWP 21 21.05 1 Contra Costa Aug NQC Wind
USWNDR_2_SMUD2 32186 SOLANO 34.5 20.92 1 Contra Costa Aug NQC Wind
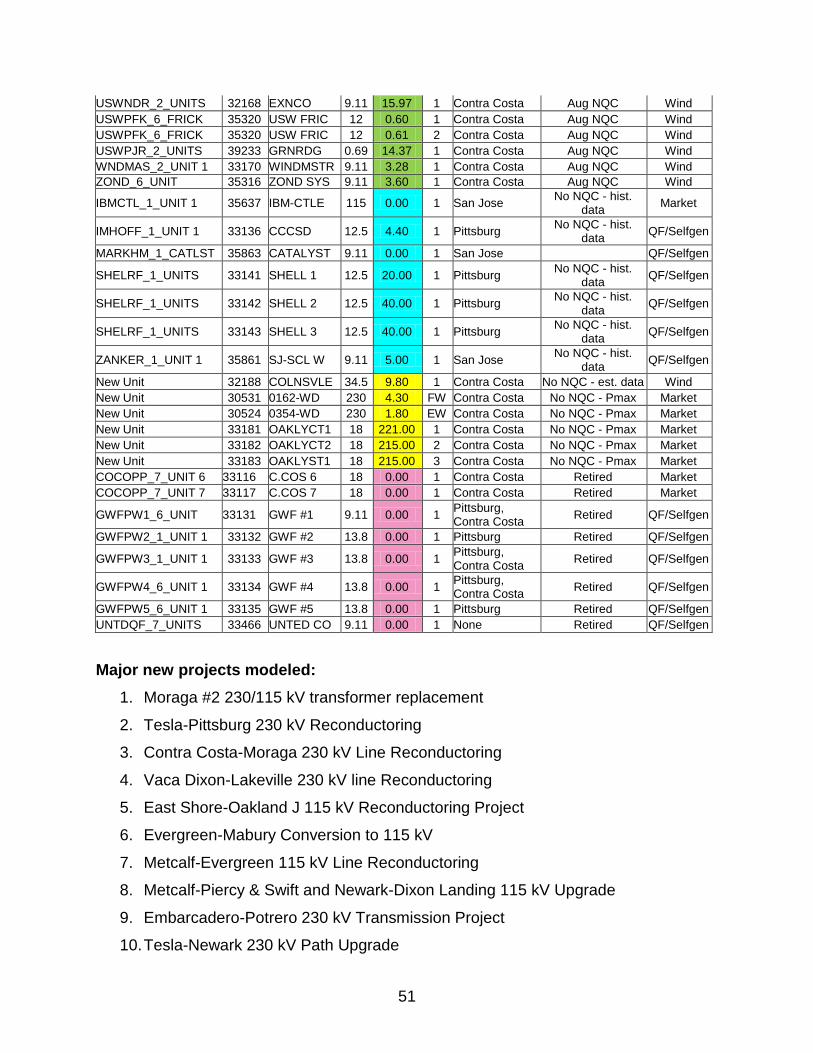
51
USWNDR_2_UNITS 32168 EXNCO 9.11 15.97 1 Contra Costa Aug NQC Wind
USWPFK_6_FRICK 35320 USW FRIC 12 0.60 1 Contra Costa Aug NQC Wind
USWPFK_6_FRICK 35320 USW FRIC 12 0.61 2 Contra Costa Aug NQC Wind
USWPJR_2_UNITS 39233 GRNRDG 0.69 14.37 1 Contra Costa Aug NQC Wind
WNDMAS_2_UNIT 1 33170 WINDMSTR 9.11 3.28 1 Contra Costa Aug NQC Wind
ZOND_6_UNIT 35316 ZOND SYS 9.11 3.60 1 Contra Costa Aug NQC Wind
IBMCTL_1_UNIT 1 35637 IBM-CTLE 115 0.00 1 San Jose No NQC - hist.
data Market
IMHOFF_1_UNIT 1 33136 CCCSD 12.5 4.40 1 Pittsburg No NQC - hist.
data QF/Selfgen
MARKHM_1_CATLST 35863 CATALYST 9.11 0.00 1 San Jose QF/Selfgen
SHELRF_1_UNITS 33141 SHELL 1 12.5 20.00 1 Pittsburg No NQC - hist.
data QF/Selfgen
SHELRF_1_UNITS 33142 SHELL 2 12.5 40.00 1 Pittsburg No NQC - hist.
data QF/Selfgen
SHELRF_1_UNITS 33143 SHELL 3 12.5 40.00 1 Pittsburg No NQC - hist.
data QF/Selfgen
ZANKER_1_UNIT 1 35861 SJ-SCL W 9.11 5.00 1 San Jose No NQC - hist.
data QF/Selfgen
New Unit 32188 COLNSVLE 34.5 9.80 1 Contra Costa No NQC - est. data Wind
New Unit 30531 0162-WD 230 4.30 FW Contra Costa No NQC - Pmax Market
New Unit 30524 0354-WD 230 1.80 EW Contra Costa No NQC - Pmax Market
New Unit 33181 OAKLYCT1 18 221.00 1 Contra Costa No NQC - Pmax Market
New Unit 33182 OAKLYCT2 18 215.00 2 Contra Costa No NQC - Pmax Market
New Unit 33183 OAKLYST1 18 215.00 3 Contra Costa No NQC - Pmax Market
COCOPP_7_UNIT 6 33116 C.COS 6 18 0.00 1 Contra Costa Retired Market
COCOPP_7_UNIT 7 33117 C.COS 7 18 0.00 1 Contra Costa Retired Market
GWFPW1_6_UNIT 33131 GWF #1 9.11 0.00 1 Pittsburg, Contra Costa
Retired QF/Selfgen
GWFPW2_1_UNIT 1 33132 GWF #2 13.8 0.00 1 Pittsburg Retired QF/Selfgen
GWFPW3_1_UNIT 1 33133 GWF #3 13.8 0.00 1 Pittsburg, Contra Costa
Retired QF/Selfgen
GWFPW4_6_UNIT 1 33134 GWF #4 13.8 0.00 1 Pittsburg, Contra Costa
Retired QF/Selfgen
GWFPW5_6_UNIT 1 33135 GWF #5 13.8 0.00 1 Pittsburg Retired QF/Selfgen
UNTDQF_7_UNITS 33466 UNTED CO 9.11 0.00 1 None Retired QF/Selfgen
Major new projects modeled:
1. Moraga #2 230/115 kV transformer replacement
2. Tesla-Pittsburg 230 kV Reconductoring
3. Contra Costa-Moraga 230 kV Line Reconductoring
4. Vaca Dixon-Lakeville 230 kV line Reconductoring
5. East Shore-Oakland J 115 kV Reconductoring Project
6. Evergreen-Mabury Conversion to 115 kV
7. Metcalf-Evergreen 115 kV Line Reconductoring
8. Metcalf-Piercy & Swift and Newark-Dixon Landing 115 kV Upgrade
9. Embarcadero-Potrero 230 kV Transmission Project
10. Tesla-Newark 230 kV Path Upgrade

52
11. Oakley Generating Station
Critical Contingency Analysis Summary Oakland Sub-area
The critical contingency for the Oakland pocket is the loss of either Moraga-Claremont
#1 or #2 115 kV line with one of the Oakland CTs out of service. The area limitation is
thermal overloading of the remaining Moraga-Claremont 115 kV lines above their
emergency rating. This limiting contingency establishes a local capacity need of 141
MW in 2019 (includes 49 MW of MUNI generation) as minimum capacity necessary for
reliable load serving capability within this sub-area.
Effectiveness factors:
All units within this sub-area have the same effectiveness factor. Units outside of this
sub-area are not effective.
Llagas Sub-area
The most critical contingency is an outage of Metcalf D-Morgan Hill 115 kV line with one
of the Gilroy Peaker off-line. The area limitation is thermal overload on the Morgan Hill-
Llagas 115 kV Line as well as 5% voltage drop at the Morgan Hill substation. This
limiting contingency establishes a local capacity need of 158 MW in 2019 (includes 0
MW of QF and MUNI generation) as the minimum capacity necessary for reliable load
serving capability within this sub-area.
Effectiveness factors:
All units within this sub-area have the same effectiveness factor. Units outside of this
sub-area are not effective.
San Jose Sub-area
The most critical contingency in the San Jose area is the Metcalf El Patio #1 or #2
overlapped with the outage of Metcalf-Evergreen #2 115 kV lines. The limiting element
is the Metcalf - Piercy 115 kV line and establishes a local capacity 385 MW in 2019
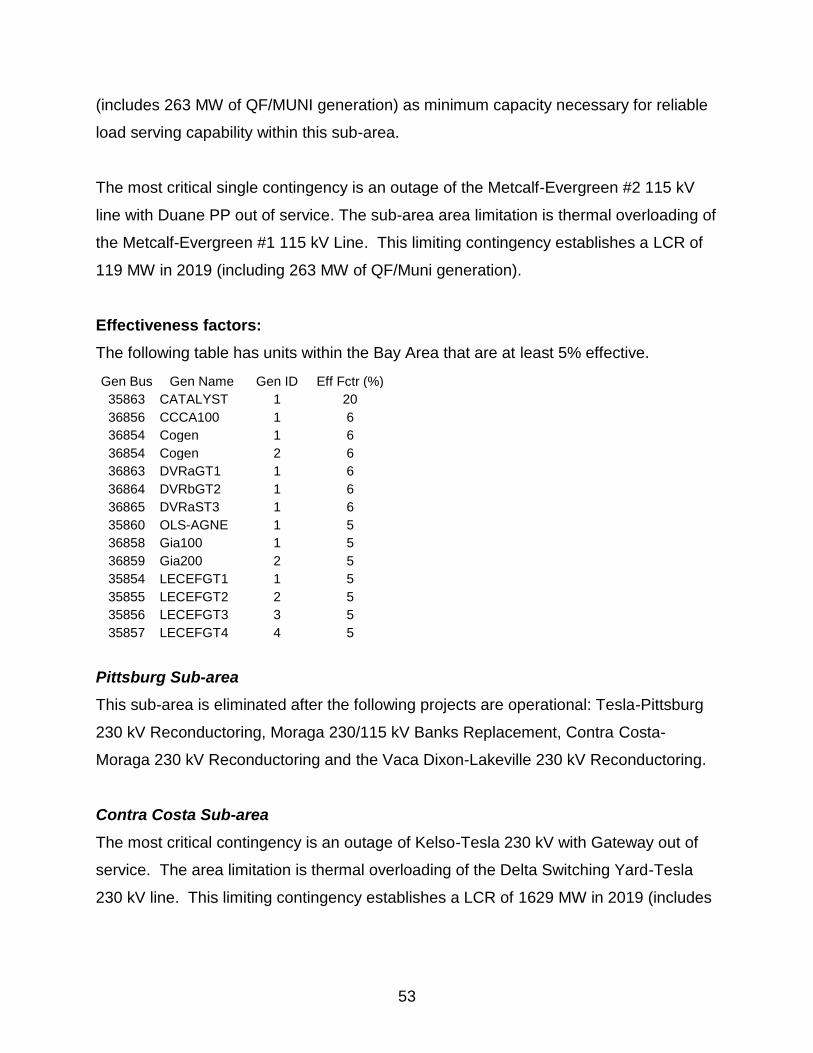
53
(includes 263 MW of QF/MUNI generation) as minimum capacity necessary for reliable
load serving capability within this sub-area.
The most critical single contingency is an outage of the Metcalf-Evergreen #2 115 kV
line with Duane PP out of service. The sub-area area limitation is thermal overloading of
the Metcalf-Evergreen #1 115 kV Line. This limiting contingency establishes a LCR of
119 MW in 2019 (including 263 MW of QF/Muni generation).
Effectiveness factors:
The following table has units within the Bay Area that are at least 5% effective.
Gen Bus Gen Name Gen ID Eff Fctr (%)
35863 CATALYST 1 20
36856 CCCA100 1 6
36854 Cogen 1 6
36854 Cogen 2 6
36863 DVRaGT1 1 6
36864 DVRbGT2 1 6
36865 DVRaST3 1 6
35860 OLS-AGNE 1 5
36858 Gia100 1 5
36859 Gia200 2 5
35854 LECEFGT1 1 5
35855 LECEFGT2 2 5
35856 LECEFGT3 3 5
35857 LECEFGT4 4 5
Pittsburg Sub-area
This sub-area is eliminated after the following projects are operational: Tesla-Pittsburg
230 kV Reconductoring, Moraga 230/115 kV Banks Replacement, Contra Costa-
Moraga 230 kV Reconductoring and the Vaca Dixon-Lakeville 230 kV Reconductoring.
Contra Costa Sub-area
The most critical contingency is an outage of Kelso-Tesla 230 kV with Gateway out of
service. The area limitation is thermal overloading of the Delta Switching Yard-Tesla
230 kV line. This limiting contingency establishes a LCR of 1629 MW in 2019 (includes
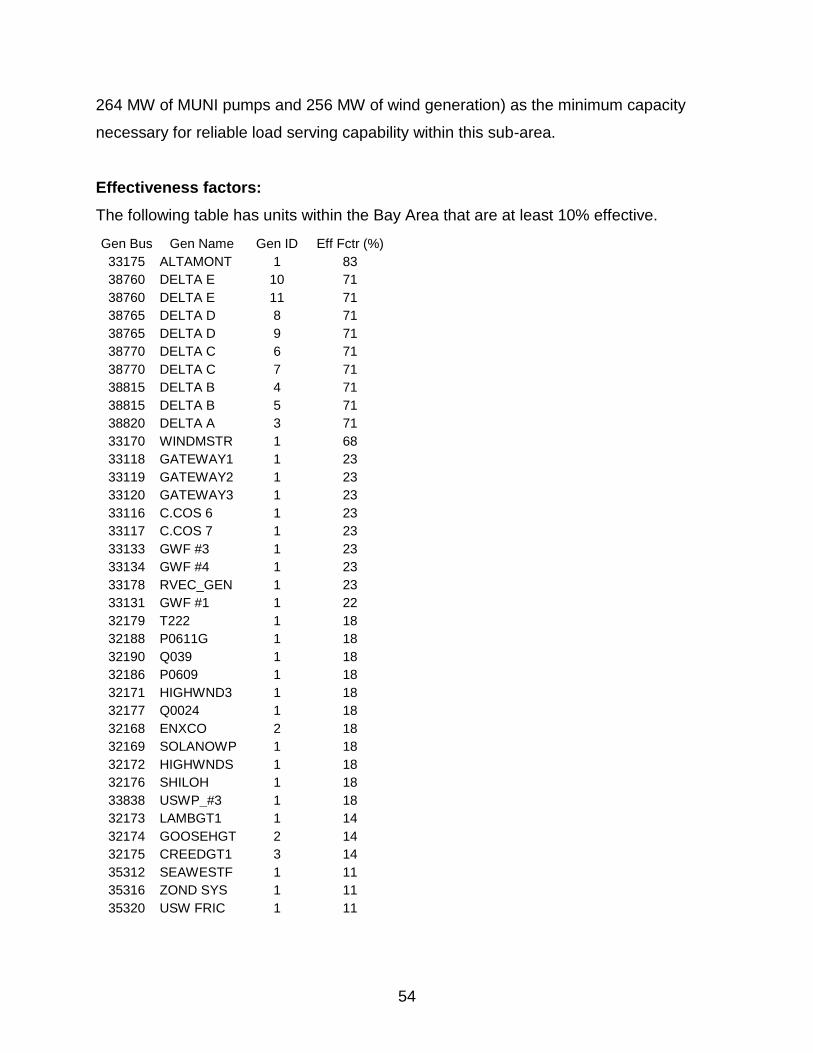
54
264 MW of MUNI pumps and 256 MW of wind generation) as the minimum capacity
necessary for reliable load serving capability within this sub-area.
Effectiveness factors:
The following table has units within the Bay Area that are at least 10% effective.
Gen Bus Gen Name Gen ID Eff Fctr (%)
33175 ALTAMONT 1 83
38760 DELTA E 10 71
38760 DELTA E 11 71
38765 DELTA D 8 71
38765 DELTA D 9 71
38770 DELTA C 6 71
38770 DELTA C 7 71
38815 DELTA B 4 71
38815 DELTA B 5 71
38820 DELTA A 3 71
33170 WINDMSTR 1 68
33118 GATEWAY1 1 23
33119 GATEWAY2 1 23
33120 GATEWAY3 1 23
33116 C.COS 6 1 23
33117 C.COS 7 1 23
33133 GWF #3 1 23
33134 GWF #4 1 23
33178 RVEC_GEN 1 23
33131 GWF #1 1 22
32179 T222 1 18
32188 P0611G 1 18
32190 Q039 1 18
32186 P0609 1 18
32171 HIGHWND3 1 18
32177 Q0024 1 18
32168 ENXCO 2 18
32169 SOLANOWP 1 18
32172 HIGHWNDS 1 18
32176 SHILOH 1 18
33838 USWP_#3 1 18
32173 LAMBGT1 1 14
32174 GOOSEHGT 2 14
32175 CREEDGT1 3 14
35312 SEAWESTF 1 11
35316 ZOND SYS 1 11
35320 USW FRIC 1 11
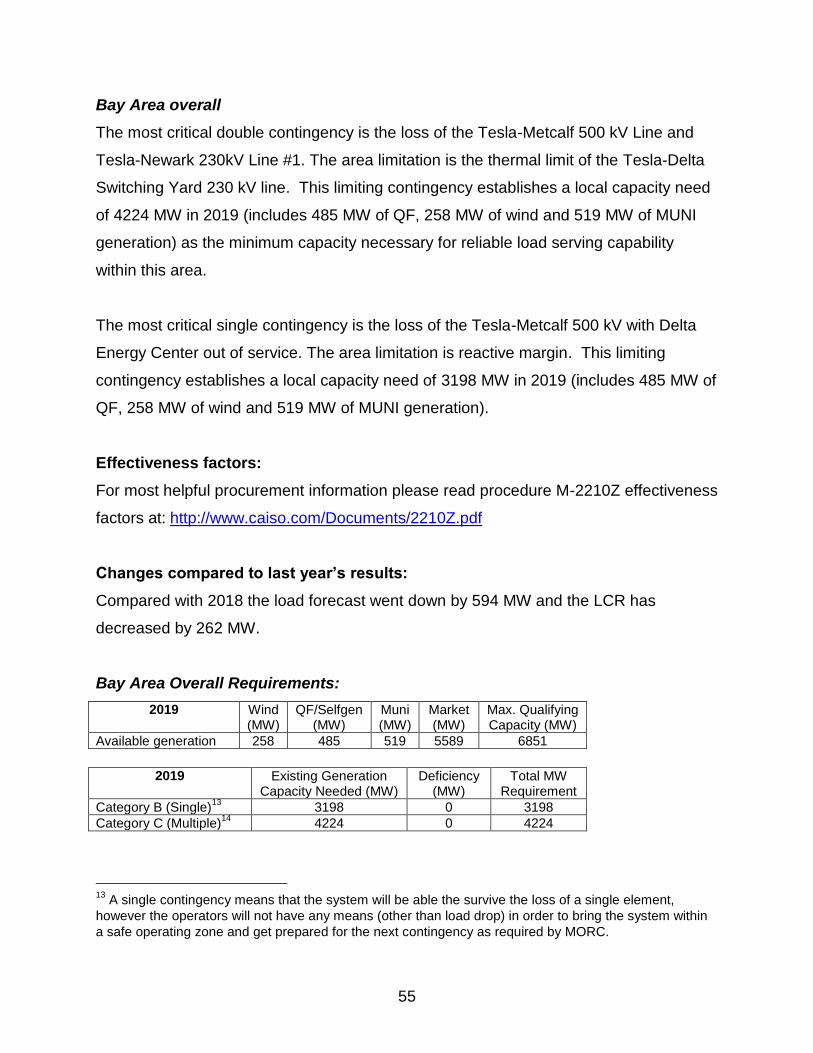
55
Bay Area overall
The most critical double contingency is the loss of the Tesla-Metcalf 500 kV Line and
Tesla-Newark 230kV Line #1. The area limitation is the thermal limit of the Tesla-Delta
Switching Yard 230 kV line. This limiting contingency establishes a local capacity need
of 4224 MW in 2019 (includes 485 MW of QF, 258 MW of wind and 519 MW of MUNI
generation) as the minimum capacity necessary for reliable load serving capability
within this area.
The most critical single contingency is the loss of the Tesla-Metcalf 500 kV with Delta
Energy Center out of service. The area limitation is reactive margin. This limiting
contingency establishes a local capacity need of 3198 MW in 2019 (includes 485 MW of
QF, 258 MW of wind and 519 MW of MUNI generation).
Effectiveness factors:
For most helpful procurement information please read procedure M-2210Z effectiveness
factors at: http://www.caiso.com/Documents/2210Z.pdf
Changes compared to last year’s results:
Compared with 2018 the load forecast went down by 594 MW and the LCR has
decreased by 262 MW.
Bay Area Overall Requirements:
2019 Wind (MW)
QF/Selfgen (MW)
Muni (MW)
Market (MW)
Max. Qualifying Capacity (MW)
Available generation 258 485 519 5589 6851
2019 Existing Generation
Capacity Needed (MW) Deficiency
(MW) Total MW
Requirement
Category B (Single)13
3198 0 3198
Category C (Multiple)14
4224 0 4224
13
A single contingency means that the system will be able the survive the loss of a single element,
however the operators will not have any means (other than load drop) in order to bring the system within
a safe operating zone and get prepared for the next contingency as required by MORC.
56
6. Greater Fresno Area
Area Definition
The transmission facilities coming into the Greater Fresno area are:
1) Gates-McCall 230 kV 2) Gates-Gregg 230 kV 3) Gates #5 230/70 kV Transformer Bank 4) Mercy Spring 230 /70 Bank # 1 5) Los Banos #3 230/70 Transformer Bank 6) Los Banos #4 230/70 Transformer Bank 7) Warnerville-Wilson 230kV 8) Melones-North Merced 230 kV line 9) Panoche-Kearney 230 kV 10) Panoche-Helm 230 kV 11) Panoche #1 230/115 kV Transformer Bank 12) Panoche #2 230/115 kV Transformer Bank 13) Corcoran-Smyrna 115kV 14) Coalinga #1-San Miguel 70 kV
The substations that delineate the Greater Fresno area are:
1) Gates is out Henrietta is in 2) Gates is out Henrietta is in 3) Gates 230 is out Gates 70 is in 4) Mercy Spring 230 is out Mercy Spring 70 is in 5) Los Banos 230 is out Los Banos 70 is in 6) Los Banos 230 is out Los Banos 70 is in 7) Warnerville is out Wilson is in 8) Melones is out North Merced is in 9) Panoche is out Kearney is in 10) Panoche is out Helm is in 11) Panoche 230 is out Panoche 115 is in 12) Panoche 230 is out Panoche 115 is in 13) Corcoran is in Smyrna is out 14) Coalinga is in San Miguel is out
Total 2019 busload within the defined area: 3170 MW with 88 MW of losses resulting in
total load + losses of 3258 MW.
14
Multiple contingencies means that the system will be able the survive the loss of a single element, and
the operators will have enough generation (other operating procedures) in order to bring the system
within a safe operating zone and get prepared for the next contingency as required by MORC.
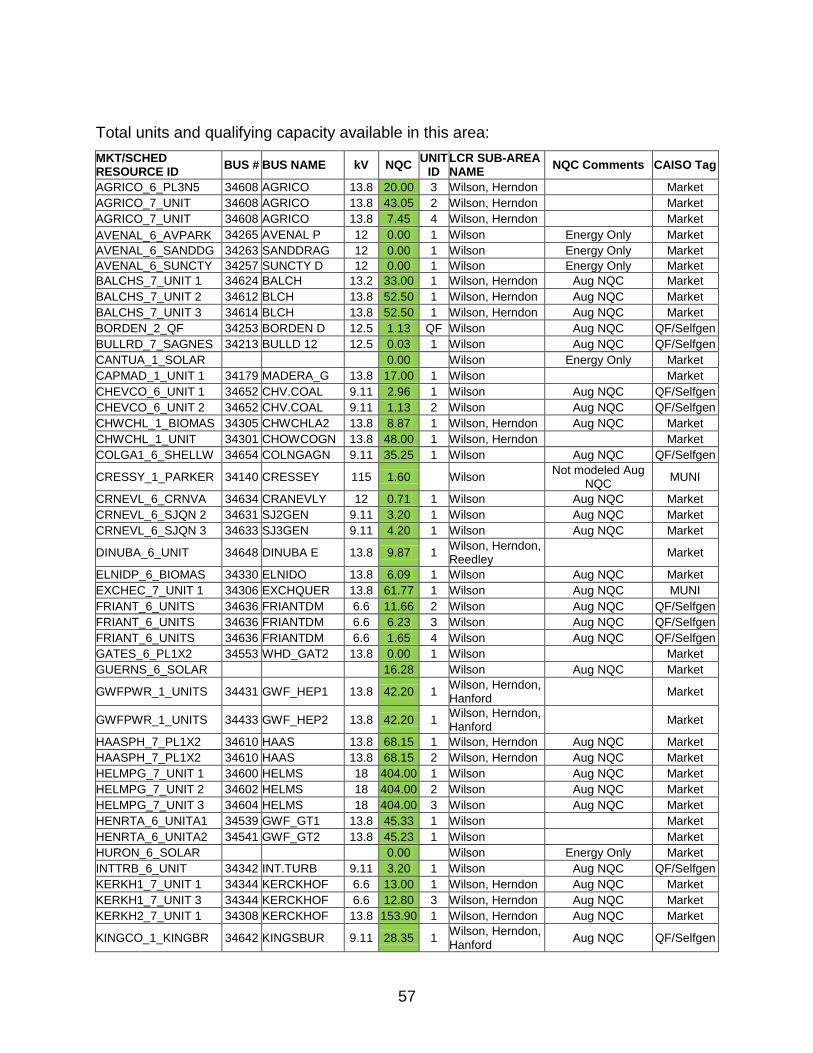
57
Total units and qualifying capacity available in this area:
MKT/SCHED RESOURCE ID
BUS # BUS NAME kV NQC UNIT
ID LCR SUB-AREA NAME
NQC Comments CAISO Tag
AGRICO_6_PL3N5 34608 AGRICO 13.8 20.00 3 Wilson, Herndon Market
AGRICO_7_UNIT 34608 AGRICO 13.8 43.05 2 Wilson, Herndon Market
AGRICO_7_UNIT 34608 AGRICO 13.8 7.45 4 Wilson, Herndon Market
AVENAL_6_AVPARK 34265 AVENAL P 12 0.00 1 Wilson Energy Only Market
AVENAL_6_SANDDG 34263 SANDDRAG 12 0.00 1 Wilson Energy Only Market
AVENAL_6_SUNCTY 34257 SUNCTY D 12 0.00 1 Wilson Energy Only Market
BALCHS_7_UNIT 1 34624 BALCH 13.2 33.00 1 Wilson, Herndon Aug NQC Market
BALCHS_7_UNIT 2 34612 BLCH 13.8 52.50 1 Wilson, Herndon Aug NQC Market
BALCHS_7_UNIT 3 34614 BLCH 13.8 52.50 1 Wilson, Herndon Aug NQC Market
BORDEN_2_QF 34253 BORDEN D 12.5 1.13 QF Wilson Aug NQC QF/Selfgen
BULLRD_7_SAGNES 34213 BULLD 12 12.5 0.03 1 Wilson Aug NQC QF/Selfgen
CANTUA_1_SOLAR 0.00 Wilson Energy Only Market
CAPMAD_1_UNIT 1 34179 MADERA_G 13.8 17.00 1 Wilson Market
CHEVCO_6_UNIT 1 34652 CHV.COAL 9.11 2.96 1 Wilson Aug NQC QF/Selfgen
CHEVCO_6_UNIT 2 34652 CHV.COAL 9.11 1.13 2 Wilson Aug NQC QF/Selfgen
CHWCHL_1_BIOMAS 34305 CHWCHLA2 13.8 8.87 1 Wilson, Herndon Aug NQC Market
CHWCHL_1_UNIT 34301 CHOWCOGN 13.8 48.00 1 Wilson, Herndon Market
COLGA1_6_SHELLW 34654 COLNGAGN 9.11 35.25 1 Wilson Aug NQC QF/Selfgen
CRESSY_1_PARKER 34140 CRESSEY 115 1.60 Wilson Not modeled Aug
NQC MUNI
CRNEVL_6_CRNVA 34634 CRANEVLY 12 0.71 1 Wilson Aug NQC Market
CRNEVL_6_SJQN 2 34631 SJ2GEN 9.11 3.20 1 Wilson Aug NQC Market
CRNEVL_6_SJQN 3 34633 SJ3GEN 9.11 4.20 1 Wilson Aug NQC Market
DINUBA_6_UNIT 34648 DINUBA E 13.8 9.87 1 Wilson, Herndon, Reedley
Market
ELNIDP_6_BIOMAS 34330 ELNIDO 13.8 6.09 1 Wilson Aug NQC Market
EXCHEC_7_UNIT 1 34306 EXCHQUER 13.8 61.77 1 Wilson Aug NQC MUNI
FRIANT_6_UNITS 34636 FRIANTDM 6.6 11.66 2 Wilson Aug NQC QF/Selfgen
FRIANT_6_UNITS 34636 FRIANTDM 6.6 6.23 3 Wilson Aug NQC QF/Selfgen
FRIANT_6_UNITS 34636 FRIANTDM 6.6 1.65 4 Wilson Aug NQC QF/Selfgen
GATES_6_PL1X2 34553 WHD_GAT2 13.8 0.00 1 Wilson Market
GUERNS_6_SOLAR 16.28 Wilson Aug NQC Market
GWFPWR_1_UNITS 34431 GWF_HEP1 13.8 42.20 1 Wilson, Herndon, Hanford
Market
GWFPWR_1_UNITS 34433 GWF_HEP2 13.8 42.20 1 Wilson, Herndon, Hanford
Market
HAASPH_7_PL1X2 34610 HAAS 13.8 68.15 1 Wilson, Herndon Aug NQC Market
HAASPH_7_PL1X2 34610 HAAS 13.8 68.15 2 Wilson, Herndon Aug NQC Market
HELMPG_7_UNIT 1 34600 HELMS 18 404.00 1 Wilson Aug NQC Market
HELMPG_7_UNIT 2 34602 HELMS 18 404.00 2 Wilson Aug NQC Market
HELMPG_7_UNIT 3 34604 HELMS 18 404.00 3 Wilson Aug NQC Market
HENRTA_6_UNITA1 34539 GWF_GT1 13.8 45.33 1 Wilson Market
HENRTA_6_UNITA2 34541 GWF_GT2 13.8 45.23 1 Wilson Market
HURON_6_SOLAR 0.00 Wilson Energy Only Market
INTTRB_6_UNIT 34342 INT.TURB 9.11 3.20 1 Wilson Aug NQC QF/Selfgen
KERKH1_7_UNIT 1 34344 KERCKHOF 6.6 13.00 1 Wilson, Herndon Aug NQC Market
KERKH1_7_UNIT 3 34344 KERCKHOF 6.6 12.80 3 Wilson, Herndon Aug NQC Market
KERKH2_7_UNIT 1 34308 KERCKHOF 13.8 153.90 1 Wilson, Herndon Aug NQC Market
KINGCO_1_KINGBR 34642 KINGSBUR 9.11 28.35 1 Wilson, Herndon, Hanford
Aug NQC QF/Selfgen

58
KINGRV_7_UNIT 1 34616 KINGSRIV 13.8 51.20 1 Wilson, Herndon Aug NQC Market
MALAGA_1_PL1X2 34671 KRCDPCT1 13.8 48.00 1 Wilson, Herndon Market
MALAGA_1_PL1X2 34672 KRCDPCT2 13.8 48.00 1 Wilson, Herndon Market
MCCALL_1_QF 34219 MCCALL 4 12.5 0.52 QF Wilson, Herndon Aug NQC QF/Selfgen
MCSWAN_6_UNITS 34320 MCSWAIN 9.11 6.72 1 Wilson Aug NQC MUNI
MENBIO_6_RENEW1 34339 CALRENEW 12.5 0.00 1 Wilson Energy Only Market
MENBIO_6_UNIT 34334 BIO PWR 9.11 20.24 1 Wilson Aug NQC QF/Selfgen
MERCFL_6_UNIT 34322 MERCEDFL 9.11 2.82 1 Wilson Aug NQC Market
PINFLT_7_UNITS 38720 PINEFLAT 13.8 21.75 1 Wilson, Herndon Aug NQC MUNI
PINFLT_7_UNITS 38720 PINEFLAT 13.8 21.75 2 Wilson, Herndon Aug NQC MUNI
PINFLT_7_UNITS 38720 PINEFLAT 13.8 21.75 3 Wilson, Herndon Aug NQC MUNI
PNCHPP_1_PL1X2 34328 STARGT1 13.8 55.58 1 Wilson Market
PNCHPP_1_PL1X2 34329 STARGT2 13.8 55.58 1 Wilson Market
PNOCHE_1_PL1X2 34142 WHD_PAN2 13.8 49.97 1 Wilson, Herndon Market
PNOCHE_1_UNITA1 34186 DG_PAN1 13.8 48.00 1 Wilson Market
SCHNDR_1_FIVPTS 34354 SCHINDLR 115 0.00 Wilson Energy Only Market
SCHNDR_1_WSTSDE 34354 SCHINDLR 115 0.00 Wilson Energy Only Market
SGREGY_6_SANGER 34646 SANGERCO 9.11 28.13 1 Wilson Aug NQC QF/Selfgen
STOREY_7_MDRCHW 34209 STOREY D 12.5 0.91 1 Wilson Aug NQC QF/Selfgen
STROUD_6_SOLAR 34564 STROUD 70 0.00 Wilson Energy Only Market
ULTPFR_1_UNIT 1 34640 ULTR.PWR 9.11 21.79 1 Wilson, Herndon Aug NQC QF/Selfgen
WAUKNA_1_SOLAR 0.00 Wilson, Herndon, Hanford
Energy Only Market
WFRESN_1_SOLAR 0.00 Wilson Energy Only Market
WISHON_6_UNITS 34658 WISHON 2.3 4.51 1 Wilson Aug NQC Market
WISHON_6_UNITS 34658 WISHON 2.3 4.51 2 Wilson Aug NQC Market
WISHON_6_UNITS 34658 WISHON 2.3 4.51 3 Wilson Aug NQC Market
WISHON_6_UNITS 34658 WISHON 2.3 4.51 4 Wilson Aug NQC Market
WISHON_6_UNITS 34658 WISHON 2.3 0.36 5 Wilson Aug NQC Market
WRGHTP_7_AMENGY 24207 WRIGHT D 12.5 0.46 QF Wilson Aug NQC QF/Selfgen
JRWOOD_1_UNIT 1 34332 JRWCOGEN 9.11 7.80 1 Wilson QF/Selfgen
KERKH1_7_UNIT 2 34344 KERCKHOF 6.6 8.50 2 Wilson, Herndon Aug NQC Market
NA 34485 FRESNOWW 12.5 4.00 1 Wilson No NQC - hist. data QF/Selfgen
NA 34485 FRESNOWW 12.5 4.00 2 Wilson No NQC - hist. data QF/Selfgen
NA 34485 FRESNOWW 12.5 1.00 3 Wilson No NQC - hist. data QF/Selfgen
ONLLPP_6_UNIT 1 34316 ONEILPMP 9.11 0.50 1 Wilson No NQC - hist. data MUNI
New Unit 34603 JGBSWLT 12.5 0.00 ST Wilson Energy Only Market
New Unit 34673 RPSP1005 0.48 20.00 1 Wilson No NQC - Pmax Market
New Unit 34674 RPSP1006 0.48 20.00 1 Wilson No NQC - Pmax Market
New Unit 34675 RPSP1007 0.48 20.00 1 Wilson No NQC - Pmax Market
New Unit 34677 2C558 20 19.75 F Wilson, Herndon, Hanford
No NQC - Pmax Market
New Unit 34696 RPSP1004 21 20.00 1 Wilson, Herndon No NQC - Pmax Market
New Unit 39171 S653E 0.48 20.00 FT Wilson, Herndon, Hanford
No NQC - Pmax Market
Major new projects modeled:
1. Warnerville-Wilson 230 kV reactor
2. New E2 substation
3. New North Merced 230/115 kV substation
4. New Mercy Spring 230/70 kV substation
59
5. Le Grand-Chowchilla 115 kV reconductoring
Critical Contingency Analysis Summary
Hanford Sub-area
The most critical contingency for the Hanford sub-area is the common mode loss of the
McCall-Kingsburg #1 & #2 115 kV lines, which would thermally overload the Henrietta-
GWF 115 kV line. This limiting contingency establishes a local capacity need of 124
MW (including 28 MW of QF generation) in 2019 as the minimum generation capacity
necessary for reliable load serving capability within this sub-area.
The single worst contingency is the loss of the McCall-Kingsburg #2 115 kV line with
GWF Hanford #1 out of service. This contingency establishes a local capacity need of
51 MW (including 28 MW of QF generation) in 2019.
Effectiveness factors:
All units within this sub-area are needed therefore no effectiveness factor is required.
Reedley Sub-area
The most critical contingency for the Reedley sub-area is the loss of the McCall-
Reedley (McCall-Wahtoke) 115 kV line followed by the loss of Sanger-Reedley 115 kV
line, which would thermally overload the Kings River-Sanger-Reedley 115 kV line. This
limiting contingency establishes a local capacity need of 54 MW (including 44 MW of
deficiency) in 2019 as the minimum generation capacity necessary for reliable load
serving capability within this sub-area.
There is no single critical contingency in this sub-area.
Effectiveness factors:
All units within this sub-area are needed therefore no effectiveness factor is required.
Herndon Sub-area

60
This sub-area has been eliminated due to the new E2 substation that loops the Helms-
Gregg #1 & #2 230kV lines and now injects Helms generation into Sanger, eliminating
the need for this sub-area.
Wilson Sub-area
The most critical contingency for the Wilson sub-area is the common mode loss of the
Panoche-Kearney 230kV line and the Gates-Gregg 230kV line, which would thermally
overload the Oro Loma-El Nido section of the Wilson-Oro Loma 115 kV line. This
limiting contingency establishes a local capacity need of 1545 MW in 2019 (includes
180 MW of QF and 136 MW of Muni generation) as the generation capacity necessary
for reliable load serving capability within this sub-area.
The single most critical contingency is the loss of Gates-Gregg 230 kV line with one
Helms unit out of service. This limiting contingency establishes a local capacity need of
1463 MW in 2019 (includes 180 MW of QF and 136 MW of Muni generation).
Effectiveness factors:
The following table has units within Fresno that are at least 5% effective.
Gen No Gen Name ID DFAX
34330 ELNIDO 1 15%
34322 MERCEDFL 1 13%
34301 CHOWCOGN 1 11%
34305 CHWCHLA2 1 11%
34602 HELMS 2 1 11%
34604 HELMS 3 1 11%
34658 WISHON 1 11%
34658 WISHON 2 11%
34658 WISHON 3 11%
34658 WISHON 4 11%
34658 WISHON SJ 11%
34600 HELMS 1 1 11%
34631 SJ2GEN 1 11%
34308 KERCKHOF 1 11%
34344 KERCKHOF 1 11%
34344 KERCKHOF 2 11%
34344 KERCKHOF 3 11%
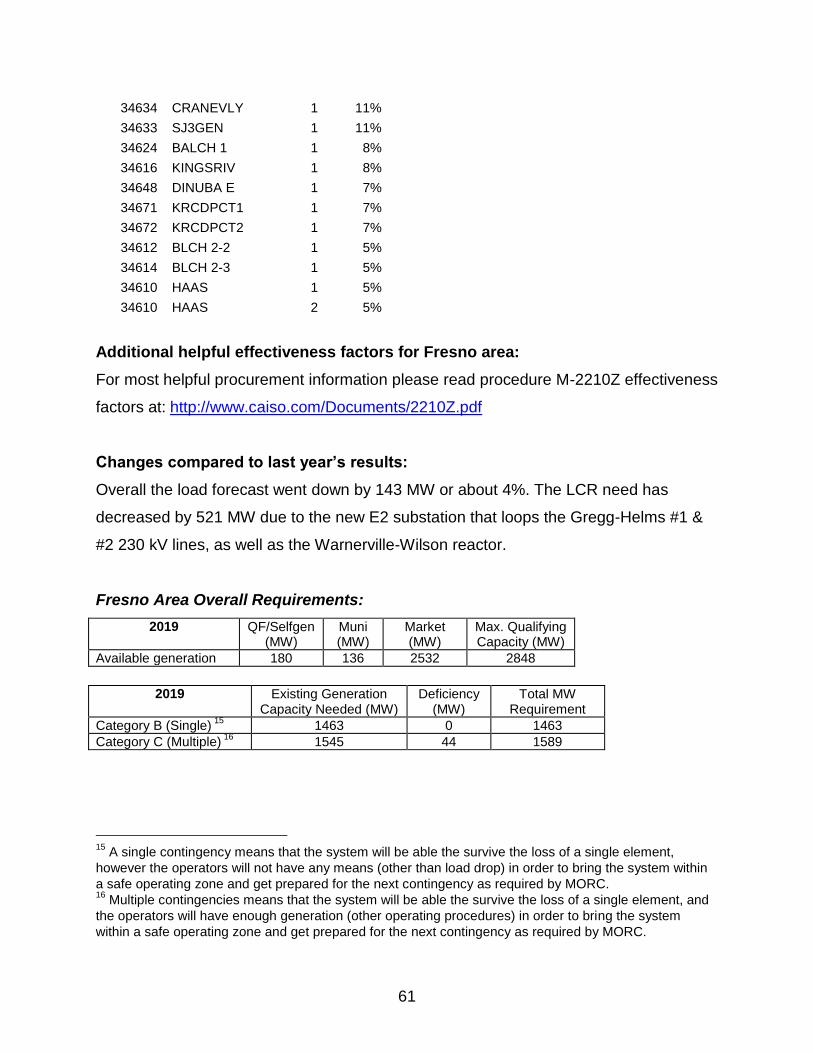
61
34634 CRANEVLY 1 11%
34633 SJ3GEN 1 11%
34624 BALCH 1 1 8%
34616 KINGSRIV 1 8%
34648 DINUBA E 1 7%
34671 KRCDPCT1 1 7%
34672 KRCDPCT2 1 7%
34612 BLCH 2-2 1 5%
34614 BLCH 2-3 1 5%
34610 HAAS 1 5%
34610 HAAS 2 5%
Additional helpful effectiveness factors for Fresno area:
For most helpful procurement information please read procedure M-2210Z effectiveness
factors at: http://www.caiso.com/Documents/2210Z.pdf
Changes compared to last year’s results:
Overall the load forecast went down by 143 MW or about 4%. The LCR need has
decreased by 521 MW due to the new E2 substation that loops the Gregg-Helms #1 &
#2 230 kV lines, as well as the Warnerville-Wilson reactor.
Fresno Area Overall Requirements:
2019 QF/Selfgen (MW)
Muni (MW)
Market (MW)
Max. Qualifying Capacity (MW)
Available generation 180 136 2532 2848
2019 Existing Generation
Capacity Needed (MW) Deficiency
(MW) Total MW
Requirement
Category B (Single) 15
1463 0 1463
Category C (Multiple) 16
1545 44 1589
15
A single contingency means that the system will be able the survive the loss of a single element,
however the operators will not have any means (other than load drop) in order to bring the system within
a safe operating zone and get prepared for the next contingency as required by MORC. 16
Multiple contingencies means that the system will be able the survive the loss of a single element, and
the operators will have enough generation (other operating procedures) in order to bring the system
within a safe operating zone and get prepared for the next contingency as required by MORC.
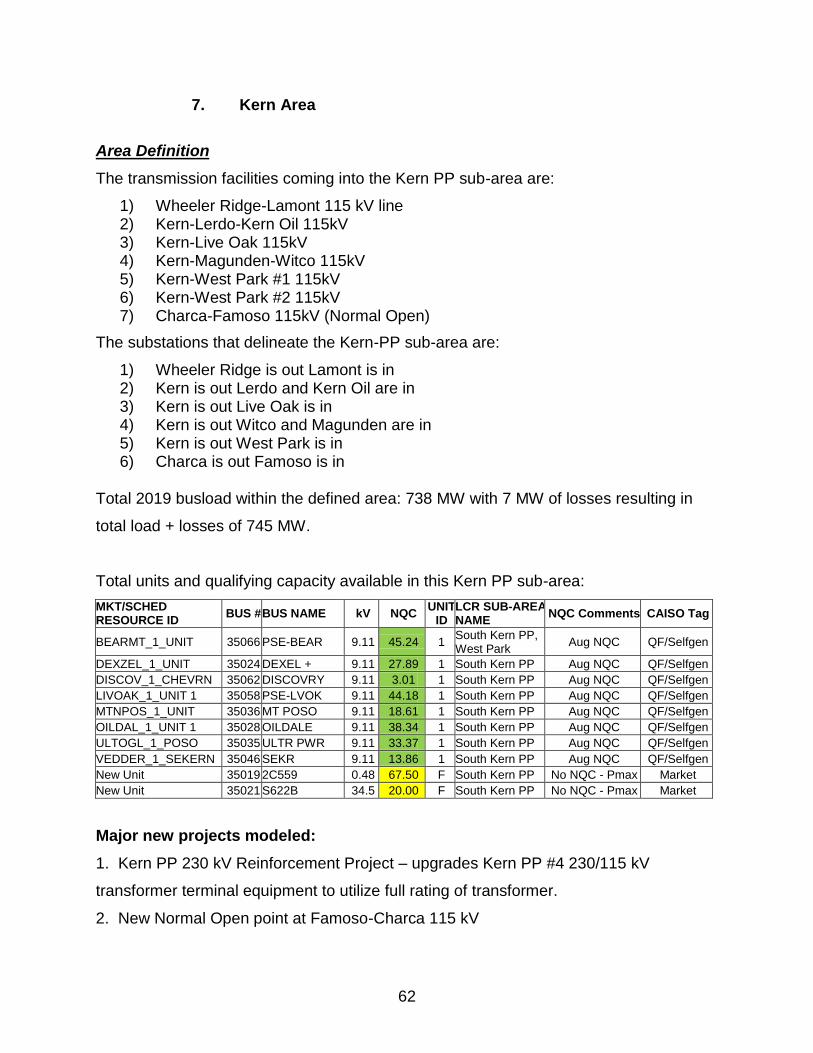
62
7. Kern Area
Area Definition
The transmission facilities coming into the Kern PP sub-area are:
1) Wheeler Ridge-Lamont 115 kV line 2) Kern-Lerdo-Kern Oil 115kV 3) Kern-Live Oak 115kV 4) Kern-Magunden-Witco 115kV 5) Kern-West Park #1 115kV 6) Kern-West Park #2 115kV 7) Charca-Famoso 115kV (Normal Open)
The substations that delineate the Kern-PP sub-area are:
1) Wheeler Ridge is out Lamont is in 2) Kern is out Lerdo and Kern Oil are in 3) Kern is out Live Oak is in 4) Kern is out Witco and Magunden are in 5) Kern is out West Park is in 6) Charca is out Famoso is in
Total 2019 busload within the defined area: 738 MW with 7 MW of losses resulting in
total load + losses of 745 MW.
Total units and qualifying capacity available in this Kern PP sub-area:
MKT/SCHED RESOURCE ID
BUS # BUS NAME kV NQC UNIT
ID LCR SUB-AREA NAME
NQC Comments CAISO Tag
BEARMT_1_UNIT 35066 PSE-BEAR 9.11 45.24 1 South Kern PP, West Park
Aug NQC QF/Selfgen
DEXZEL_1_UNIT 35024 DEXEL + 9.11 27.89 1 South Kern PP Aug NQC QF/Selfgen
DISCOV_1_CHEVRN 35062 DISCOVRY 9.11 3.01 1 South Kern PP Aug NQC QF/Selfgen
LIVOAK_1_UNIT 1 35058 PSE-LVOK 9.11 44.18 1 South Kern PP Aug NQC QF/Selfgen
MTNPOS_1_UNIT 35036 MT POSO 9.11 18.61 1 South Kern PP Aug NQC QF/Selfgen
OILDAL_1_UNIT 1 35028 OILDALE 9.11 38.34 1 South Kern PP Aug NQC QF/Selfgen
ULTOGL_1_POSO 35035 ULTR PWR 9.11 33.37 1 South Kern PP Aug NQC QF/Selfgen
VEDDER_1_SEKERN 35046 SEKR 9.11 13.86 1 South Kern PP Aug NQC QF/Selfgen
New Unit 35019 2C559 0.48 67.50 F South Kern PP No NQC - Pmax Market
New Unit 35021 S622B 34.5 20.00 F South Kern PP No NQC - Pmax Market
Major new projects modeled:
1. Kern PP 230 kV Reinforcement Project – upgrades Kern PP #4 230/115 kV
transformer terminal equipment to utilize full rating of transformer.
2. New Normal Open point at Famoso-Charca 115 kV

63
Critical Contingency Analysis Summary West Park Sub-area
The most critical contingency is the loss of Kern - West Park # 1 or #2 115 kV lines with
PSE-Bear generation out of service, resulting in the overload of the remaining Kern –
West Park 115 kV line. This limitation establishes a LCR of 77 MW (includes 45 MW of
QF generation and 32 MW of deficiency) in 2019 as the minimum generation capacity
necessary for reliable load serving capability within this sub-area.
Effectiveness factors:
All units within this sub-area are needed therefore no effectiveness factor is required.
South Kern PP Sub-area
The most critical contingency is the outage of Kern-Magunden-Witco 115 kV line
overlapping with Kern-7th Standard 115 kV line, which could thermally overload the
Kern-Live Oak 115 kV line. This limiting contingency establishes a LCR of 116 MW in
2019 (includes 225 MW of QF generation) as the minimum generation capacity
necessary for reliable load serving capability within this sub-area.
The single most critical contingency is the loss of Kern-Magunden-Witco 115 kV line
with Mt Poso generation out of service. This limiting contingency establishes a local
capacity requirement of 111 MW in 2019 (includes 225 MW of QF generation).
Effectiveness factors:
All units within this sub-area are needed therefore no effectiveness factor is required.
Changes compared to last year’s results:
Overall the load went down by 579 MW, the maximum qualifying capacity went down by
365 MW and the LCR requirement have gone down by 281 MW mostly due to area
redefinition caused by a new normal open at Famoso-Charca 115 kV and the upgrades
to the Kern PP #4 230/115 kV transformer.
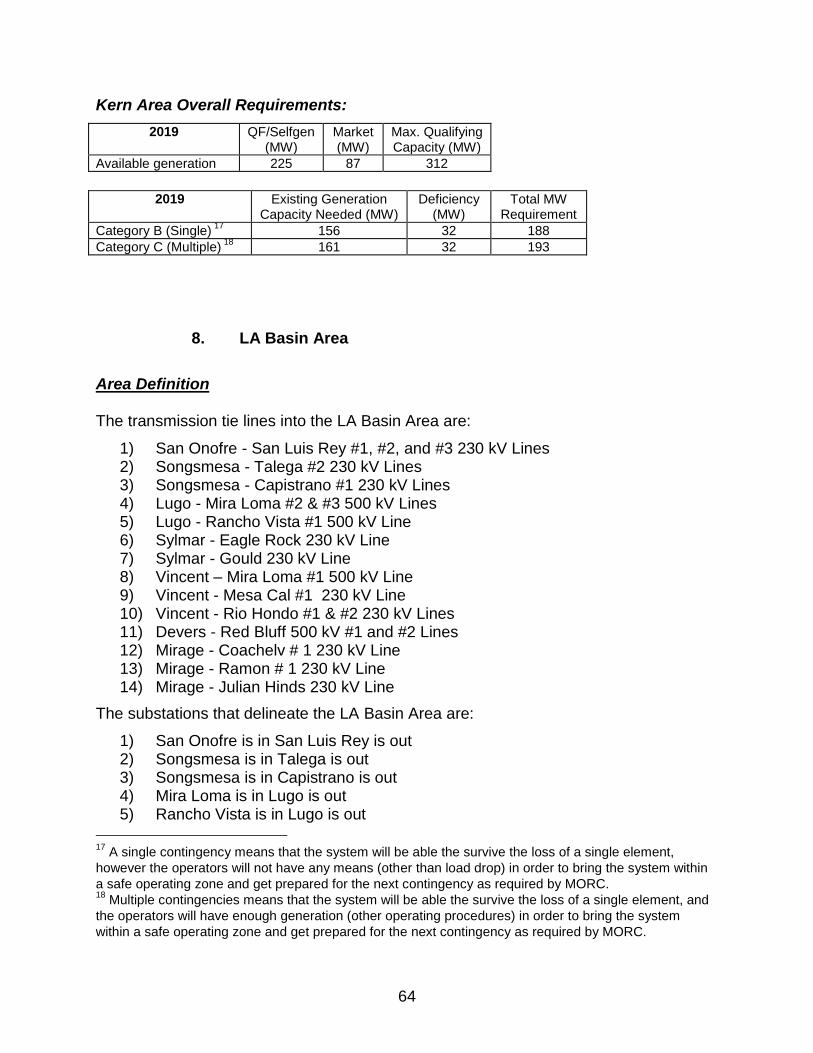
64
Kern Area Overall Requirements:
2019 QF/Selfgen (MW)
Market (MW)
Max. Qualifying Capacity (MW)
Available generation 225 87 312
2019 Existing Generation
Capacity Needed (MW) Deficiency
(MW) Total MW
Requirement
Category B (Single) 17
156 32 188
Category C (Multiple) 18
161 32 193
8. LA Basin Area
Area Definition The transmission tie lines into the LA Basin Area are:
1) San Onofre - San Luis Rey #1, #2, and #3 230 kV Lines 2) Songsmesa - Talega #2 230 kV Lines 3) Songsmesa - Capistrano #1 230 kV Lines 4) Lugo - Mira Loma #2 & #3 500 kV Lines 5) Lugo - Rancho Vista #1 500 kV Line 6) Sylmar - Eagle Rock 230 kV Line 7) Sylmar - Gould 230 kV Line 8) Vincent – Mira Loma #1 500 kV Line 9) Vincent - Mesa Cal #1 230 kV Line 10) Vincent - Rio Hondo #1 & #2 230 kV Lines 11) Devers - Red Bluff 500 kV #1 and #2 Lines 12) Mirage - Coachelv # 1 230 kV Line 13) Mirage - Ramon # 1 230 kV Line 14) Mirage - Julian Hinds 230 kV Line
The substations that delineate the LA Basin Area are:
1) San Onofre is in San Luis Rey is out 2) Songsmesa is in Talega is out 3) Songsmesa is in Capistrano is out 4) Mira Loma is in Lugo is out 5) Rancho Vista is in Lugo is out
17
A single contingency means that the system will be able the survive the loss of a single element,
however the operators will not have any means (other than load drop) in order to bring the system within
a safe operating zone and get prepared for the next contingency as required by MORC. 18
Multiple contingencies means that the system will be able the survive the loss of a single element, and
the operators will have enough generation (other operating procedures) in order to bring the system
within a safe operating zone and get prepared for the next contingency as required by MORC.

65
6) Eagle Rock is in Sylmar is out 7) Gould is in Sylmar is out 8) Mira Loma is in Vincent is out 9) Mesa Cal is in Vincent is out 10) Rio Hondo is in Vincent is out 11) Devers is in Red Bluff is out 12) Mirage is in Coachelv is out 13) Mirage is in Ramon is out 14) Mirage is in Julian Hinds is out
Total 2019 busload within the defined area is 20,344 MW, with 132 MW of losses and
30 MW pumps resulting in total load + losses + pumps of 20,506 MW.
Total units and qualifying capacity available in the LA Basin area:
MKT/SCHED RESOURCE ID
BUS # BUS NAME kV NQC UNIT
ID LCR SUB-AREA NAME
NQC Comments CAISO Tag
ALAMIT_7_UNIT 1 24001 ALAMT1 G 18 174.56 1 Western Market
ALAMIT_7_UNIT 2 24002 ALAMT2 G 18 175.00 2 Western Market
ALAMIT_7_UNIT 3 24003 ALAMT3 G 18 332.18 3 Western Market
ALAMIT_7_UNIT 4 24004 ALAMT4 G 18 335.67 4 Western Market
ALAMIT_7_UNIT 5 24005 ALAMT5 G 20 497.97 5 Western Market
ALAMIT_7_UNIT 6 24161 ALAMT6 G 20 495.00 6 Western Market
ANAHM_2_CANYN1 25211 CanyonGT 1 13.8 49.40 1 Western MUNI
ANAHM_2_CANYN2 25212 CanyonGT 2 13.8 48.00 2 Western MUNI
ANAHM_2_CANYN3 25213 CanyonGT 3 13.8 48.00 3 Western MUNI
ANAHM_2_CANYN4 25214 CanyonGT 4 13.8 49.40 4 Western MUNI
ANAHM_7_CT 25208 DowlingCTG 13.8 40.64 1 Western Aug NQC MUNI
ARCOGN_2_UNITS 24011 ARCO 1G 13.8 54.98 1 Western Aug NQC QF/Selfgen
ARCOGN_2_UNITS 24012 ARCO 2G 13.8 54.98 2 Western Aug NQC QF/Selfgen
ARCOGN_2_UNITS 24013 ARCO 3G 13.8 54.98 3 Western Aug NQC QF/Selfgen
ARCOGN_2_UNITS 24014 ARCO 4G 13.8 54.98 4 Western Aug NQC QF/Selfgen
ARCOGN_2_UNITS 24163 ARCO 5G 13.8 27.49 5 Western Aug NQC QF/Selfgen
ARCOGN_2_UNITS 24164 ARCO 6G 13.8 27.50 6 Western Aug NQC QF/Selfgen
BARRE_2_QF 24016 BARRE 230 0.00 Western Not modeled QF/Selfgen
BARRE_6_PEAKER 29309 BARPKGEN 13.8 47.00 1 Western Market
BLAST_1_WIND 24839 BLAST 115 8.55 1 Eastern Aug NQC Wind
BRDWAY_7_UNIT 3 29007 BRODWYSC 13.8 65.00 1 Western MUNI
BUCKWD_1_NPALM1 25634 BUCKWIND 115 1.95 Eastern, Valley-Devers
Not modeled Aug NQC
Wind
BUCKWD_1_QF 25634 BUCKWIND 115 2.53 QF Eastern, Valley-Devers
Aug NQC QF/Selfgen
BUCKWD_7_WINTCV 25634 BUCKWIND 115 0.15 W5 Eastern, Valley-Devers
Aug NQC Wind
CABZON_1_WINDA1 29290 CABAZON 33 11.34 1 Eastern, Valley-Devers
Aug NQC Wind
CENTER_2_QF 24203 CENTER S 66 18.97 Western Not modeled Aug
NQC QF/Selfgen
CENTER_2_RHONDO 24203 CENTER S 66 1.91 Western Not modeled QF/Selfgen
CENTER_6_PEAKER 29308 CTRPKGEN 13.8 47.00 1 Western Market
CENTRY_6_PL1X4 25302 CLTNCTRY 13.8 36.00 1 Eastern Aug NQC MUNI
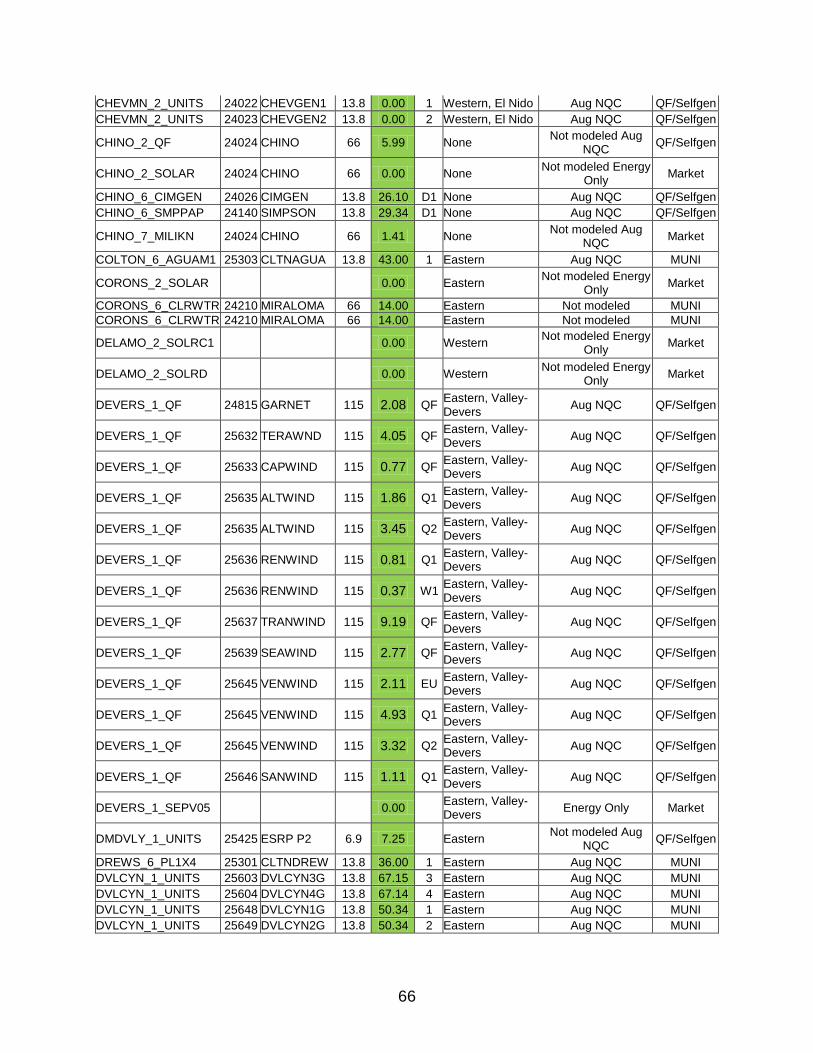
66
CHEVMN_2_UNITS 24022 CHEVGEN1 13.8 0.00 1 Western, El Nido Aug NQC QF/Selfgen
CHEVMN_2_UNITS 24023 CHEVGEN2 13.8 0.00 2 Western, El Nido Aug NQC QF/Selfgen
CHINO_2_QF 24024 CHINO 66 5.99 None Not modeled Aug
NQC QF/Selfgen
CHINO_2_SOLAR 24024 CHINO 66 0.00 None Not modeled Energy
Only Market
CHINO_6_CIMGEN 24026 CIMGEN 13.8 26.10 D1 None Aug NQC QF/Selfgen
CHINO_6_SMPPAP 24140 SIMPSON 13.8 29.34 D1 None Aug NQC QF/Selfgen
CHINO_7_MILIKN 24024 CHINO 66 1.41 None Not modeled Aug
NQC Market
COLTON_6_AGUAM1 25303 CLTNAGUA 13.8 43.00 1 Eastern Aug NQC MUNI
CORONS_2_SOLAR 0.00 Eastern Not modeled Energy
Only Market
CORONS_6_CLRWTR 24210 MIRALOMA 66 14.00 Eastern Not modeled MUNI
CORONS_6_CLRWTR 24210 MIRALOMA 66 14.00 Eastern Not modeled MUNI
DELAMO_2_SOLRC1 0.00 Western Not modeled Energy
Only Market
DELAMO_2_SOLRD 0.00 Western Not modeled Energy
Only Market
DEVERS_1_QF 24815 GARNET 115 2.08 QF Eastern, Valley-Devers
Aug NQC QF/Selfgen
DEVERS_1_QF 25632 TERAWND 115 4.05 QF Eastern, Valley-Devers
Aug NQC QF/Selfgen
DEVERS_1_QF 25633 CAPWIND 115 0.77 QF Eastern, Valley-Devers
Aug NQC QF/Selfgen
DEVERS_1_QF 25635 ALTWIND 115 1.86 Q1 Eastern, Valley-Devers
Aug NQC QF/Selfgen
DEVERS_1_QF 25635 ALTWIND 115 3.45 Q2 Eastern, Valley-Devers
Aug NQC QF/Selfgen
DEVERS_1_QF 25636 RENWIND 115 0.81 Q1 Eastern, Valley-Devers
Aug NQC QF/Selfgen
DEVERS_1_QF 25636 RENWIND 115 0.37 W1 Eastern, Valley-Devers
Aug NQC QF/Selfgen
DEVERS_1_QF 25637 TRANWIND 115 9.19 QF Eastern, Valley-Devers
Aug NQC QF/Selfgen
DEVERS_1_QF 25639 SEAWIND 115 2.77 QF Eastern, Valley-Devers
Aug NQC QF/Selfgen
DEVERS_1_QF 25645 VENWIND 115 2.11 EU Eastern, Valley-Devers
Aug NQC QF/Selfgen
DEVERS_1_QF 25645 VENWIND 115 4.93 Q1 Eastern, Valley-Devers
Aug NQC QF/Selfgen
DEVERS_1_QF 25645 VENWIND 115 3.32 Q2 Eastern, Valley-Devers
Aug NQC QF/Selfgen
DEVERS_1_QF 25646 SANWIND 115 1.11 Q1 Eastern, Valley-Devers
Aug NQC QF/Selfgen
DEVERS_1_SEPV05 0.00 Eastern, Valley-Devers
Energy Only Market
DMDVLY_1_UNITS 25425 ESRP P2 6.9 7.25 Eastern Not modeled Aug
NQC QF/Selfgen
DREWS_6_PL1X4 25301 CLTNDREW 13.8 36.00 1 Eastern Aug NQC MUNI
DVLCYN_1_UNITS 25603 DVLCYN3G 13.8 67.15 3 Eastern Aug NQC MUNI
DVLCYN_1_UNITS 25604 DVLCYN4G 13.8 67.14 4 Eastern Aug NQC MUNI
DVLCYN_1_UNITS 25648 DVLCYN1G 13.8 50.34 1 Eastern Aug NQC MUNI
DVLCYN_1_UNITS 25649 DVLCYN2G 13.8 50.34 2 Eastern Aug NQC MUNI
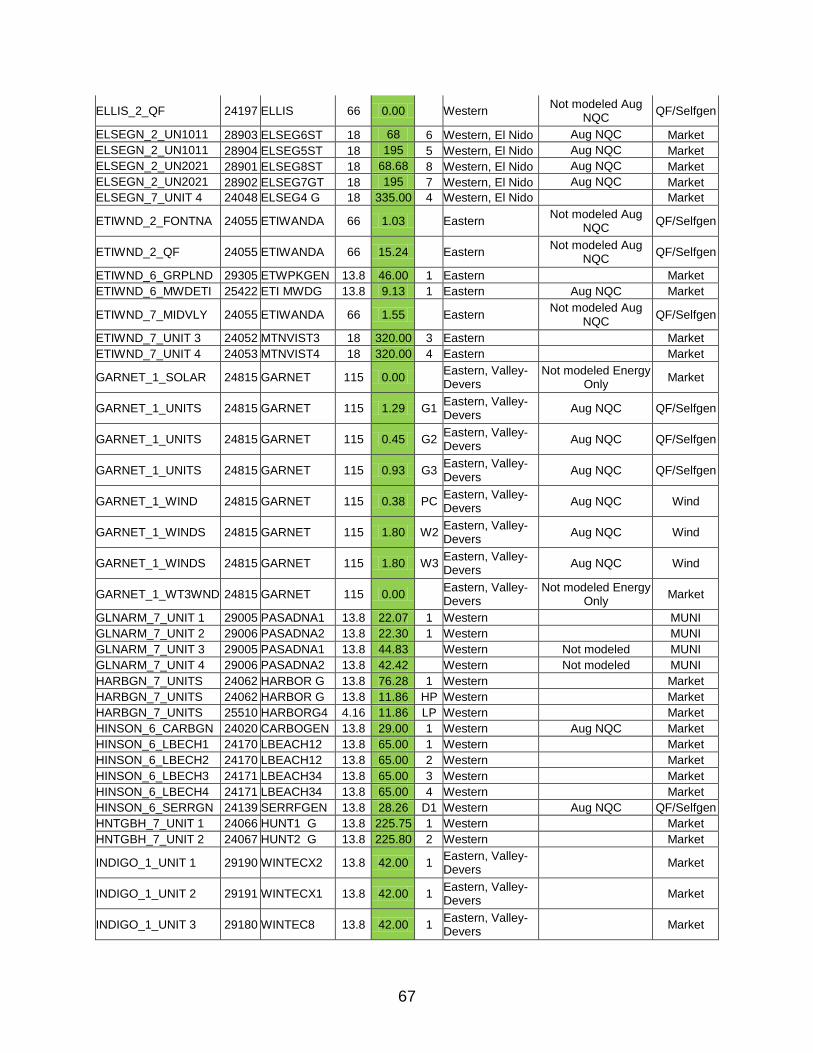
67
ELLIS_2_QF 24197 ELLIS 66 0.00 Western Not modeled Aug
NQC QF/Selfgen
ELSEGN_2_UN1011 28903 ELSEG6ST 18 68 6 Western, El Nido Aug NQC Market
ELSEGN_2_UN1011 28904 ELSEG5ST 18 195 5 Western, El Nido Aug NQC Market
ELSEGN_2_UN2021 28901 ELSEG8ST 18 68.68 8 Western, El Nido Aug NQC Market
ELSEGN_2_UN2021 28902 ELSEG7GT 18 195 7 Western, El Nido Aug NQC Market
ELSEGN_7_UNIT 4 24048 ELSEG4 G 18 335.00 4 Western, El Nido Market
ETIWND_2_FONTNA 24055 ETIWANDA 66 1.03 Eastern Not modeled Aug
NQC QF/Selfgen
ETIWND_2_QF 24055 ETIWANDA 66 15.24 Eastern Not modeled Aug
NQC QF/Selfgen
ETIWND_6_GRPLND 29305 ETWPKGEN 13.8 46.00 1 Eastern Market
ETIWND_6_MWDETI 25422 ETI MWDG 13.8 9.13 1 Eastern Aug NQC Market
ETIWND_7_MIDVLY 24055 ETIWANDA 66 1.55 Eastern Not modeled Aug
NQC QF/Selfgen
ETIWND_7_UNIT 3 24052 MTNVIST3 18 320.00 3 Eastern Market
ETIWND_7_UNIT 4 24053 MTNVIST4 18 320.00 4 Eastern Market
GARNET_1_SOLAR 24815 GARNET 115 0.00 Eastern, Valley-Devers
Not modeled Energy Only
Market
GARNET_1_UNITS 24815 GARNET 115 1.29 G1 Eastern, Valley-Devers
Aug NQC QF/Selfgen
GARNET_1_UNITS 24815 GARNET 115 0.45 G2 Eastern, Valley-Devers
Aug NQC QF/Selfgen
GARNET_1_UNITS 24815 GARNET 115 0.93 G3 Eastern, Valley-Devers
Aug NQC QF/Selfgen
GARNET_1_WIND 24815 GARNET 115 0.38 PC Eastern, Valley-Devers
Aug NQC Wind
GARNET_1_WINDS 24815 GARNET 115 1.80 W2 Eastern, Valley-Devers
Aug NQC Wind
GARNET_1_WINDS 24815 GARNET 115 1.80 W3 Eastern, Valley-Devers
Aug NQC Wind
GARNET_1_WT3WND 24815 GARNET 115 0.00 Eastern, Valley-Devers
Not modeled Energy Only
Market
GLNARM_7_UNIT 1 29005 PASADNA1 13.8 22.07 1 Western MUNI
GLNARM_7_UNIT 2 29006 PASADNA2 13.8 22.30 1 Western MUNI
GLNARM_7_UNIT 3 29005 PASADNA1 13.8 44.83 Western Not modeled MUNI
GLNARM_7_UNIT 4 29006 PASADNA2 13.8 42.42 Western Not modeled MUNI
HARBGN_7_UNITS 24062 HARBOR G 13.8 76.28 1 Western Market
HARBGN_7_UNITS 24062 HARBOR G 13.8 11.86 HP Western Market
HARBGN_7_UNITS 25510 HARBORG4 4.16 11.86 LP Western Market
HINSON_6_CARBGN 24020 CARBOGEN 13.8 29.00 1 Western Aug NQC Market
HINSON_6_LBECH1 24170 LBEACH12 13.8 65.00 1 Western Market
HINSON_6_LBECH2 24170 LBEACH12 13.8 65.00 2 Western Market
HINSON_6_LBECH3 24171 LBEACH34 13.8 65.00 3 Western Market
HINSON_6_LBECH4 24171 LBEACH34 13.8 65.00 4 Western Market
HINSON_6_SERRGN 24139 SERRFGEN 13.8 28.26 D1 Western Aug NQC QF/Selfgen
HNTGBH_7_UNIT 1 24066 HUNT1 G 13.8 225.75 1 Western Market
HNTGBH_7_UNIT 2 24067 HUNT2 G 13.8 225.80 2 Western Market
INDIGO_1_UNIT 1 29190 WINTECX2 13.8 42.00 1 Eastern, Valley-Devers
Market
INDIGO_1_UNIT 2 29191 WINTECX1 13.8 42.00 1 Eastern, Valley-Devers
Market
INDIGO_1_UNIT 3 29180 WINTEC8 13.8 42.00 1 Eastern, Valley-Devers
Market
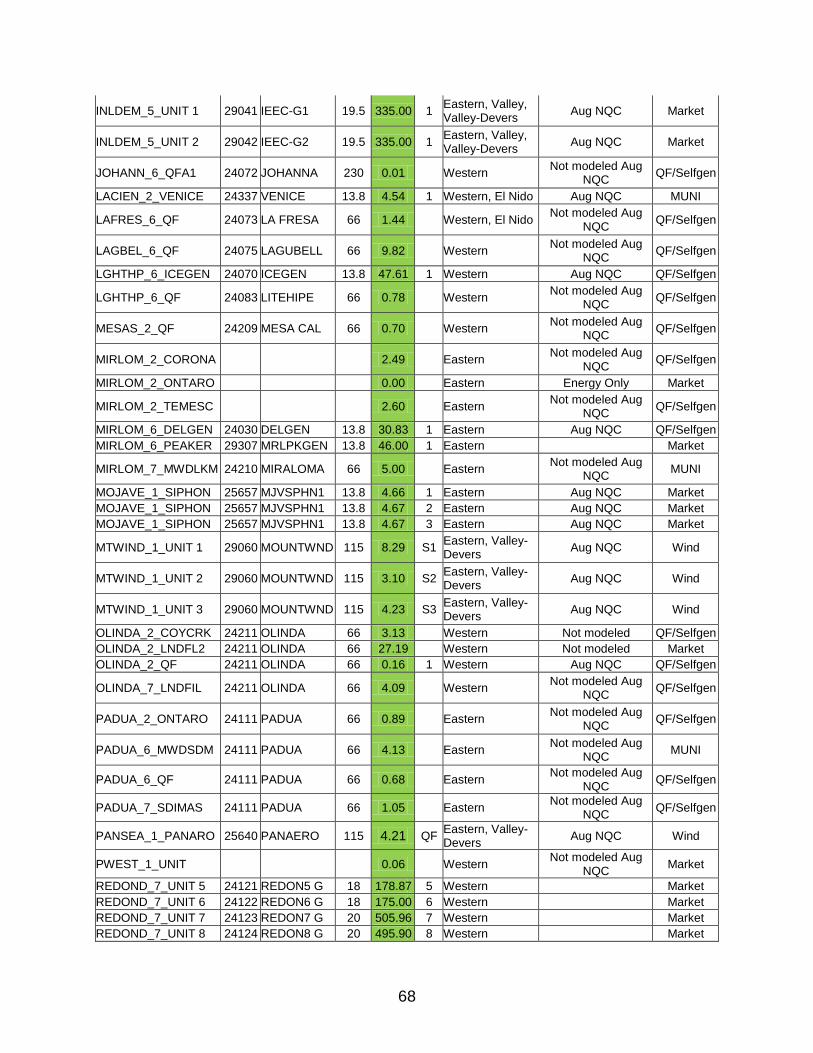
68
INLDEM_5_UNIT 1 29041 IEEC-G1 19.5 335.00 1 Eastern, Valley, Valley-Devers
Aug NQC Market
INLDEM_5_UNIT 2 29042 IEEC-G2 19.5 335.00 1 Eastern, Valley, Valley-Devers
Aug NQC Market
JOHANN_6_QFA1 24072 JOHANNA 230 0.01 Western Not modeled Aug
NQC QF/Selfgen
LACIEN_2_VENICE 24337 VENICE 13.8 4.54 1 Western, El Nido Aug NQC MUNI
LAFRES_6_QF 24073 LA FRESA 66 1.44 Western, El Nido Not modeled Aug
NQC QF/Selfgen
LAGBEL_6_QF 24075 LAGUBELL 66 9.82 Western Not modeled Aug
NQC QF/Selfgen
LGHTHP_6_ICEGEN 24070 ICEGEN 13.8 47.61 1 Western Aug NQC QF/Selfgen
LGHTHP_6_QF 24083 LITEHIPE 66 0.78 Western Not modeled Aug
NQC QF/Selfgen
MESAS_2_QF 24209 MESA CAL 66 0.70 Western Not modeled Aug
NQC QF/Selfgen
MIRLOM_2_CORONA 2.49 Eastern Not modeled Aug
NQC QF/Selfgen
MIRLOM_2_ONTARO 0.00 Eastern Energy Only Market
MIRLOM_2_TEMESC 2.60 Eastern Not modeled Aug
NQC QF/Selfgen
MIRLOM_6_DELGEN 24030 DELGEN 13.8 30.83 1 Eastern Aug NQC QF/Selfgen
MIRLOM_6_PEAKER 29307 MRLPKGEN 13.8 46.00 1 Eastern Market
MIRLOM_7_MWDLKM 24210 MIRALOMA 66 5.00 Eastern Not modeled Aug
NQC MUNI
MOJAVE_1_SIPHON 25657 MJVSPHN1 13.8 4.66 1 Eastern Aug NQC Market
MOJAVE_1_SIPHON 25657 MJVSPHN1 13.8 4.67 2 Eastern Aug NQC Market
MOJAVE_1_SIPHON 25657 MJVSPHN1 13.8 4.67 3 Eastern Aug NQC Market
MTWIND_1_UNIT 1 29060 MOUNTWND 115 8.29 S1 Eastern, Valley-Devers
Aug NQC Wind
MTWIND_1_UNIT 2 29060 MOUNTWND 115 3.10 S2 Eastern, Valley-Devers
Aug NQC Wind
MTWIND_1_UNIT 3 29060 MOUNTWND 115 4.23 S3 Eastern, Valley-Devers
Aug NQC Wind
OLINDA_2_COYCRK 24211 OLINDA 66 3.13 Western Not modeled QF/Selfgen
OLINDA_2_LNDFL2 24211 OLINDA 66 27.19 Western Not modeled Market
OLINDA_2_QF 24211 OLINDA 66 0.16 1 Western Aug NQC QF/Selfgen
OLINDA_7_LNDFIL 24211 OLINDA 66 4.09 Western Not modeled Aug
NQC QF/Selfgen
PADUA_2_ONTARO 24111 PADUA 66 0.89 Eastern Not modeled Aug
NQC QF/Selfgen
PADUA_6_MWDSDM 24111 PADUA 66 4.13 Eastern Not modeled Aug
NQC MUNI
PADUA_6_QF 24111 PADUA 66 0.68 Eastern Not modeled Aug
NQC QF/Selfgen
PADUA_7_SDIMAS 24111 PADUA 66 1.05 Eastern Not modeled Aug
NQC QF/Selfgen
PANSEA_1_PANARO 25640 PANAERO 115 4.21 QF Eastern, Valley-Devers
Aug NQC Wind
PWEST_1_UNIT 0.06 Western Not modeled Aug
NQC Market
REDOND_7_UNIT 5 24121 REDON5 G 18 178.87 5 Western Market
REDOND_7_UNIT 6 24122 REDON6 G 18 175.00 6 Western Market
REDOND_7_UNIT 7 24123 REDON7 G 20 505.96 7 Western Market
REDOND_7_UNIT 8 24124 REDON8 G 20 495.90 8 Western Market
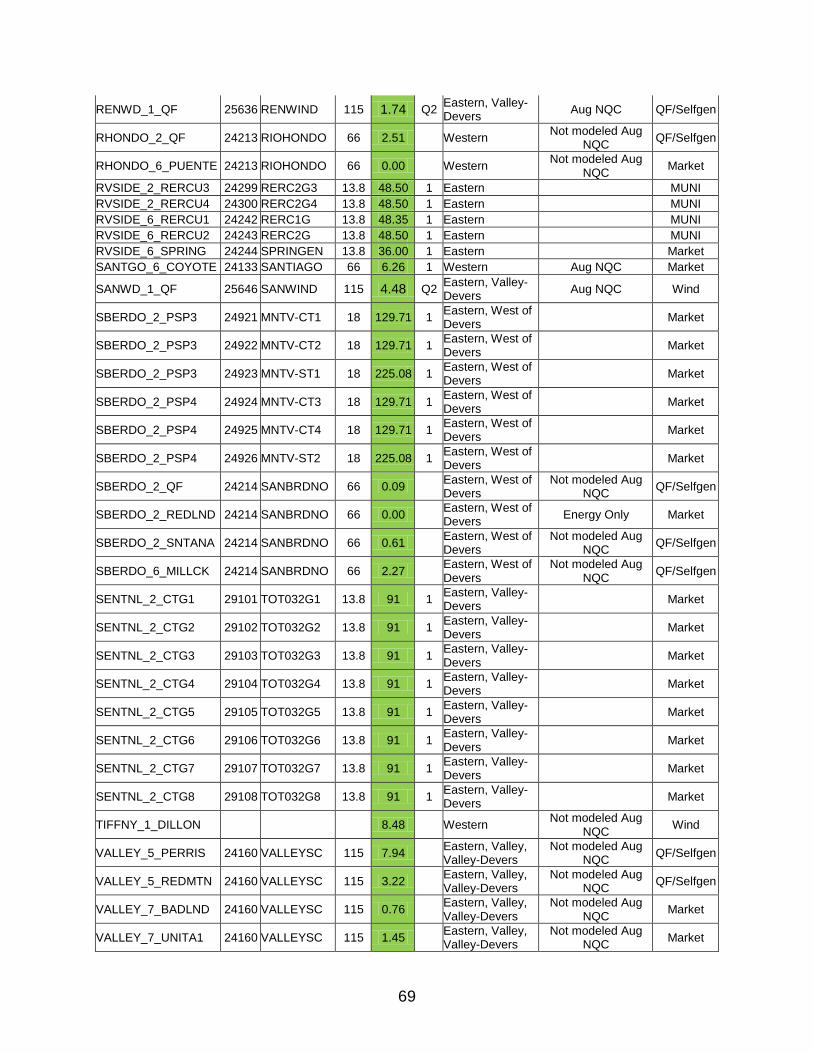
69
RENWD_1_QF 25636 RENWIND 115 1.74 Q2 Eastern, Valley-Devers
Aug NQC QF/Selfgen
RHONDO_2_QF 24213 RIOHONDO 66 2.51 Western Not modeled Aug
NQC QF/Selfgen
RHONDO_6_PUENTE 24213 RIOHONDO 66 0.00 Western Not modeled Aug
NQC Market
RVSIDE_2_RERCU3 24299 RERC2G3 13.8 48.50 1 Eastern MUNI
RVSIDE_2_RERCU4 24300 RERC2G4 13.8 48.50 1 Eastern MUNI
RVSIDE_6_RERCU1 24242 RERC1G 13.8 48.35 1 Eastern MUNI
RVSIDE_6_RERCU2 24243 RERC2G 13.8 48.50 1 Eastern MUNI
RVSIDE_6_SPRING 24244 SPRINGEN 13.8 36.00 1 Eastern Market
SANTGO_6_COYOTE 24133 SANTIAGO 66 6.26 1 Western Aug NQC Market
SANWD_1_QF 25646 SANWIND 115 4.48 Q2 Eastern, Valley-Devers
Aug NQC Wind
SBERDO_2_PSP3 24921 MNTV-CT1 18 129.71 1 Eastern, West of Devers
Market
SBERDO_2_PSP3 24922 MNTV-CT2 18 129.71 1 Eastern, West of Devers
Market
SBERDO_2_PSP3 24923 MNTV-ST1 18 225.08 1 Eastern, West of Devers
Market
SBERDO_2_PSP4 24924 MNTV-CT3 18 129.71 1 Eastern, West of Devers
Market
SBERDO_2_PSP4 24925 MNTV-CT4 18 129.71 1 Eastern, West of Devers
Market
SBERDO_2_PSP4 24926 MNTV-ST2 18 225.08 1 Eastern, West of Devers
Market
SBERDO_2_QF 24214 SANBRDNO 66 0.09 Eastern, West of Devers
Not modeled Aug NQC
QF/Selfgen
SBERDO_2_REDLND 24214 SANBRDNO 66 0.00 Eastern, West of Devers
Energy Only Market
SBERDO_2_SNTANA 24214 SANBRDNO 66 0.61 Eastern, West of Devers
Not modeled Aug NQC
QF/Selfgen
SBERDO_6_MILLCK 24214 SANBRDNO 66 2.27 Eastern, West of Devers
Not modeled Aug NQC
QF/Selfgen
SENTNL_2_CTG1 29101 TOT032G1 13.8 91 1 Eastern, Valley-Devers
Market
SENTNL_2_CTG2 29102 TOT032G2 13.8 91 1 Eastern, Valley-Devers
Market
SENTNL_2_CTG3 29103 TOT032G3 13.8 91 1 Eastern, Valley-Devers
Market
SENTNL_2_CTG4 29104 TOT032G4 13.8 91 1 Eastern, Valley-Devers
Market
SENTNL_2_CTG5 29105 TOT032G5 13.8 91 1 Eastern, Valley-Devers
Market
SENTNL_2_CTG6 29106 TOT032G6 13.8 91 1 Eastern, Valley-Devers
Market
SENTNL_2_CTG7 29107 TOT032G7 13.8 91 1 Eastern, Valley-Devers
Market
SENTNL_2_CTG8 29108 TOT032G8 13.8 91 1 Eastern, Valley-Devers
Market
TIFFNY_1_DILLON 8.48 Western Not modeled Aug
NQC Wind
VALLEY_5_PERRIS 24160 VALLEYSC 115 7.94 Eastern, Valley, Valley-Devers
Not modeled Aug NQC
QF/Selfgen
VALLEY_5_REDMTN 24160 VALLEYSC 115 3.22 Eastern, Valley, Valley-Devers
Not modeled Aug NQC
QF/Selfgen
VALLEY_7_BADLND 24160 VALLEYSC 115 0.76 Eastern, Valley, Valley-Devers
Not modeled Aug NQC
Market
VALLEY_7_UNITA1 24160 VALLEYSC 115 1.45 Eastern, Valley, Valley-Devers
Not modeled Aug NQC
Market
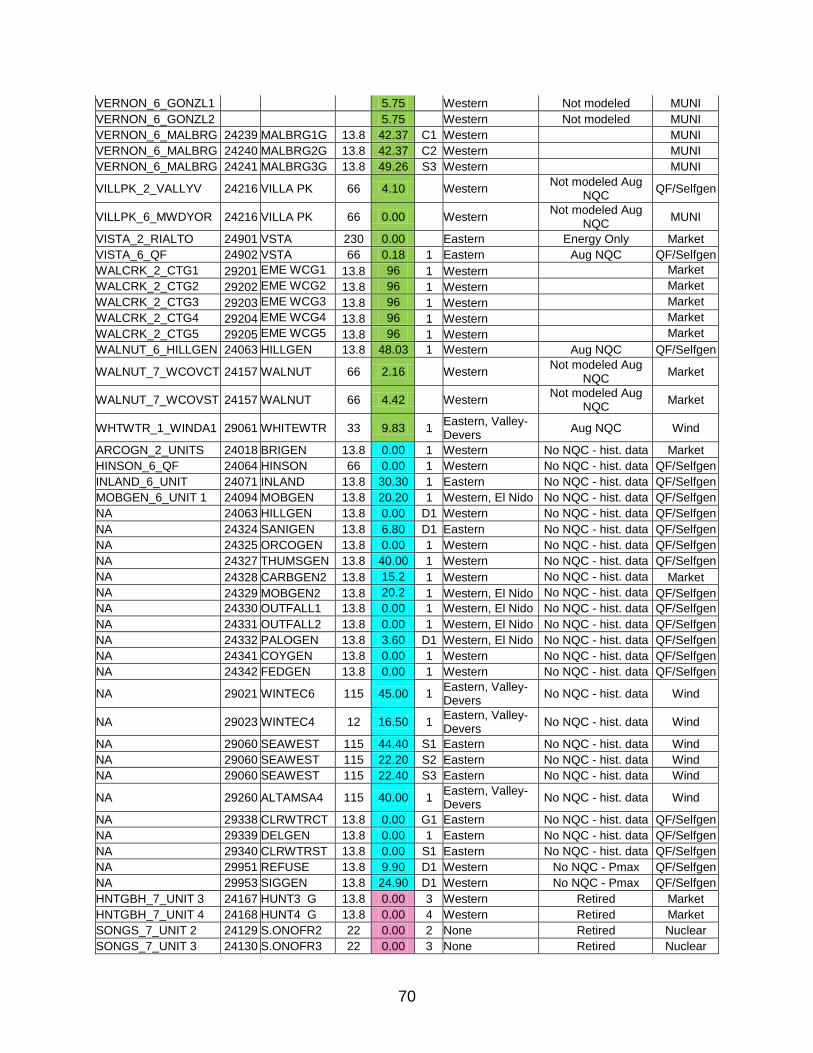
70
VERNON_6_GONZL1 5.75 Western Not modeled MUNI
VERNON_6_GONZL2 5.75 Western Not modeled MUNI
VERNON_6_MALBRG 24239 MALBRG1G 13.8 42.37 C1 Western MUNI
VERNON_6_MALBRG 24240 MALBRG2G 13.8 42.37 C2 Western MUNI
VERNON_6_MALBRG 24241 MALBRG3G 13.8 49.26 S3 Western MUNI
VILLPK_2_VALLYV 24216 VILLA PK 66 4.10 Western Not modeled Aug
NQC QF/Selfgen
VILLPK_6_MWDYOR 24216 VILLA PK 66 0.00 Western Not modeled Aug
NQC MUNI
VISTA_2_RIALTO 24901 VSTA 230 0.00 Eastern Energy Only Market
VISTA_6_QF 24902 VSTA 66 0.18 1 Eastern Aug NQC QF/Selfgen
WALCRK_2_CTG1 29201 EME WCG1 13.8 96 1 Western Market
WALCRK_2_CTG2 29202 EME WCG2 13.8 96 1 Western Market
WALCRK_2_CTG3 29203 EME WCG3 13.8 96 1 Western Market
WALCRK_2_CTG4 29204 EME WCG4 13.8 96 1 Western Market
WALCRK_2_CTG5 29205 EME WCG5 13.8 96 1 Western Market
WALNUT_6_HILLGEN 24063 HILLGEN 13.8 48.03 1 Western Aug NQC QF/Selfgen
WALNUT_7_WCOVCT 24157 WALNUT 66 2.16 Western Not modeled Aug
NQC Market
WALNUT_7_WCOVST 24157 WALNUT 66 4.42 Western Not modeled Aug
NQC Market
WHTWTR_1_WINDA1 29061 WHITEWTR 33 9.83 1 Eastern, Valley-Devers
Aug NQC Wind
ARCOGN_2_UNITS 24018 BRIGEN 13.8 0.00 1 Western No NQC - hist. data Market
HINSON_6_QF 24064 HINSON 66 0.00 1 Western No NQC - hist. data QF/Selfgen
INLAND_6_UNIT 24071 INLAND 13.8 30.30 1 Eastern No NQC - hist. data QF/Selfgen
MOBGEN_6_UNIT 1 24094 MOBGEN 13.8 20.20 1 Western, El Nido No NQC - hist. data QF/Selfgen
NA 24063 HILLGEN 13.8 0.00 D1 Western No NQC - hist. data QF/Selfgen
NA 24324 SANIGEN 13.8 6.80 D1 Eastern No NQC - hist. data QF/Selfgen
NA 24325 ORCOGEN 13.8 0.00 1 Western No NQC - hist. data QF/Selfgen
NA 24327 THUMSGEN 13.8 40.00 1 Western No NQC - hist. data QF/Selfgen
NA 24328 CARBGEN2 13.8 15.2 1 Western No NQC - hist. data Market
NA 24329 MOBGEN2 13.8 20.2 1 Western, El Nido No NQC - hist. data QF/Selfgen
NA 24330 OUTFALL1 13.8 0.00 1 Western, El Nido No NQC - hist. data QF/Selfgen
NA 24331 OUTFALL2 13.8 0.00 1 Western, El Nido No NQC - hist. data QF/Selfgen
NA 24332 PALOGEN 13.8 3.60 D1 Western, El Nido No NQC - hist. data QF/Selfgen
NA 24341 COYGEN 13.8 0.00 1 Western No NQC - hist. data QF/Selfgen
NA 24342 FEDGEN 13.8 0.00 1 Western No NQC - hist. data QF/Selfgen
NA 29021 WINTEC6 115 45.00 1 Eastern, Valley-Devers
No NQC - hist. data Wind
NA 29023 WINTEC4 12 16.50 1 Eastern, Valley-Devers
No NQC - hist. data Wind
NA 29060 SEAWEST 115 44.40 S1 Eastern No NQC - hist. data Wind
NA 29060 SEAWEST 115 22.20 S2 Eastern No NQC - hist. data Wind
NA 29060 SEAWEST 115 22.40 S3 Eastern No NQC - hist. data Wind
NA 29260 ALTAMSA4 115 40.00 1 Eastern, Valley-Devers
No NQC - hist. data Wind
NA 29338 CLRWTRCT 13.8 0.00 G1 Eastern No NQC - hist. data QF/Selfgen
NA 29339 DELGEN 13.8 0.00 1 Eastern No NQC - hist. data QF/Selfgen
NA 29340 CLRWTRST 13.8 0.00 S1 Eastern No NQC - hist. data QF/Selfgen
NA 29951 REFUSE 13.8 9.90 D1 Western No NQC - Pmax QF/Selfgen
NA 29953 SIGGEN 13.8 24.90 D1 Western No NQC - Pmax QF/Selfgen
HNTGBH_7_UNIT 3 24167 HUNT3 G 13.8 0.00 3 Western Retired Market
HNTGBH_7_UNIT 4 24168 HUNT4 G 13.8 0.00 4 Western Retired Market
SONGS_7_UNIT 2 24129 S.ONOFR2 22 0.00 2 None Retired Nuclear
SONGS_7_UNIT 3 24130 S.ONOFR3 22 0.00 3 None Retired Nuclear
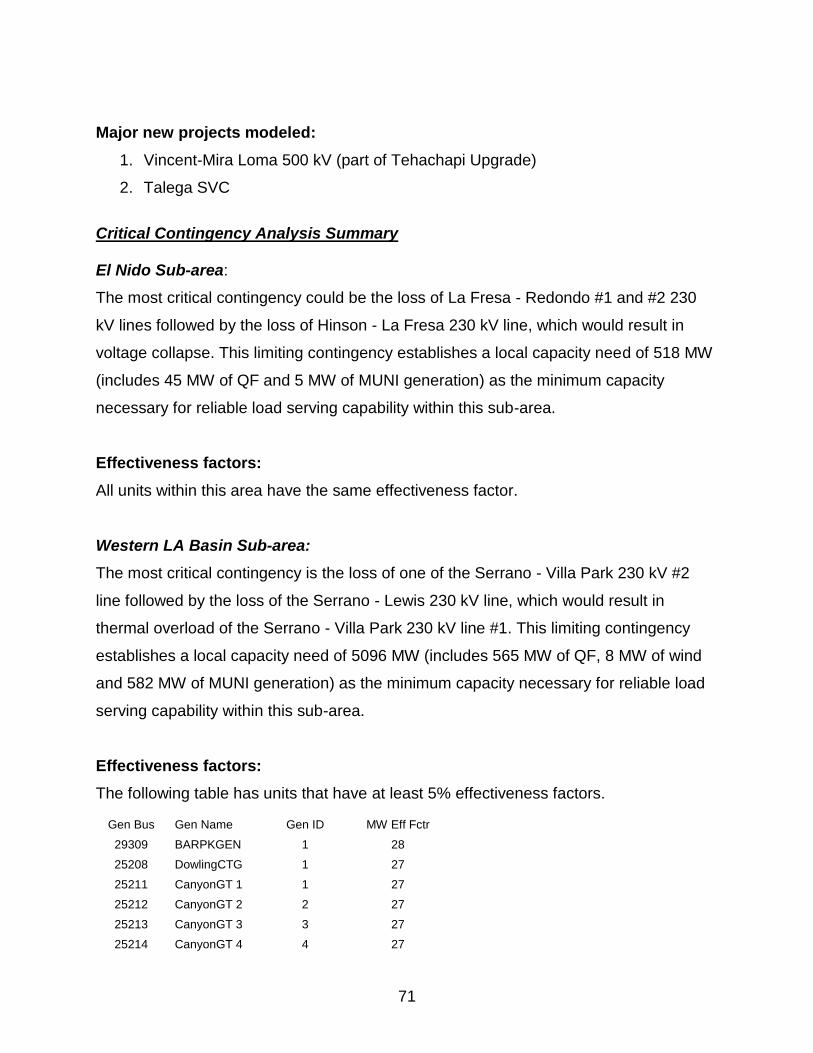
71
Major new projects modeled:
1. Vincent-Mira Loma 500 kV (part of Tehachapi Upgrade)
2. Talega SVC
Critical Contingency Analysis Summary
El Nido Sub-area:
The most critical contingency could be the loss of La Fresa - Redondo #1 and #2 230
kV lines followed by the loss of Hinson - La Fresa 230 kV line, which would result in
voltage collapse. This limiting contingency establishes a local capacity need of 518 MW
(includes 45 MW of QF and 5 MW of MUNI generation) as the minimum capacity
necessary for reliable load serving capability within this sub-area.
Effectiveness factors:
All units within this area have the same effectiveness factor.
Western LA Basin Sub-area:
The most critical contingency is the loss of one of the Serrano - Villa Park 230 kV #2
line followed by the loss of the Serrano - Lewis 230 kV line, which would result in
thermal overload of the Serrano - Villa Park 230 kV line #1. This limiting contingency
establishes a local capacity need of 5096 MW (includes 565 MW of QF, 8 MW of wind
and 582 MW of MUNI generation) as the minimum capacity necessary for reliable load
serving capability within this sub-area.
Effectiveness factors:
The following table has units that have at least 5% effectiveness factors.
Gen Bus Gen Name Gen ID MW Eff Fctr
29309 BARPKGEN 1 28
25208 DowlingCTG 1 27
25211 CanyonGT 1 1 27
25212 CanyonGT 2 2 27
25213 CanyonGT 3 3 27
25214 CanyonGT 4 4 27

72
24066 HUNT1 G 1 24
24067 HUNT2 G 2 24
24325 ORCOGEN 1 24
24001 ALAMT1 G 1 21
24002 ALAMT2 G 2 21
24003 ALAMT3 G 3 21
24004 ALAMT4 G 4 21
24005 ALAMT5 G 5 21
24161 ALAMT6 G 6 21
24133 SANTIAGO 1 18
24341 COYGEN 1 18
24018 BRIGEN 1 17
24011 ARCO 1G 1 15
24012 ARCO 2G 2 15
24013 ARCO 3G 3 15
24014 ARCO 4G 4 15
24163 ARCO 5G 5 15
24164 ARCO 6G 6 15
24020 CARBGEN1 1 15
24064 HINSON 1 15
24070 ICEGEN D1 15
24170 LBEACH12 2 15
24171 LBEACH34 3 15
24062 HARBOR G 1 15
25510 HARBORG4 LP 15
24062 HARBOR G HP 15
29308 CTRPKGEN 1 15
24139 SERRFGEN D1 15
24170 LBEACH12 1 15
24171 LBEACH34 4 15
24327 THUMSGEN 1 15
24328 CARBGEN2 1 15
29953 SIGGEN D1 15
24022 CHEVGEN1 1 14
24023 CHEVGEN2 2 14
24047 ELSEG3 G 3 14
24048 ELSEG4 G 4 14
24094 MOBGEN1 1 14
24121 REDON5 G 5 14
24122 REDON6 G 6 14
24123 REDON7 G 7 14
24124 REDON8 G 8 14
24329 MOBGEN2 1 14
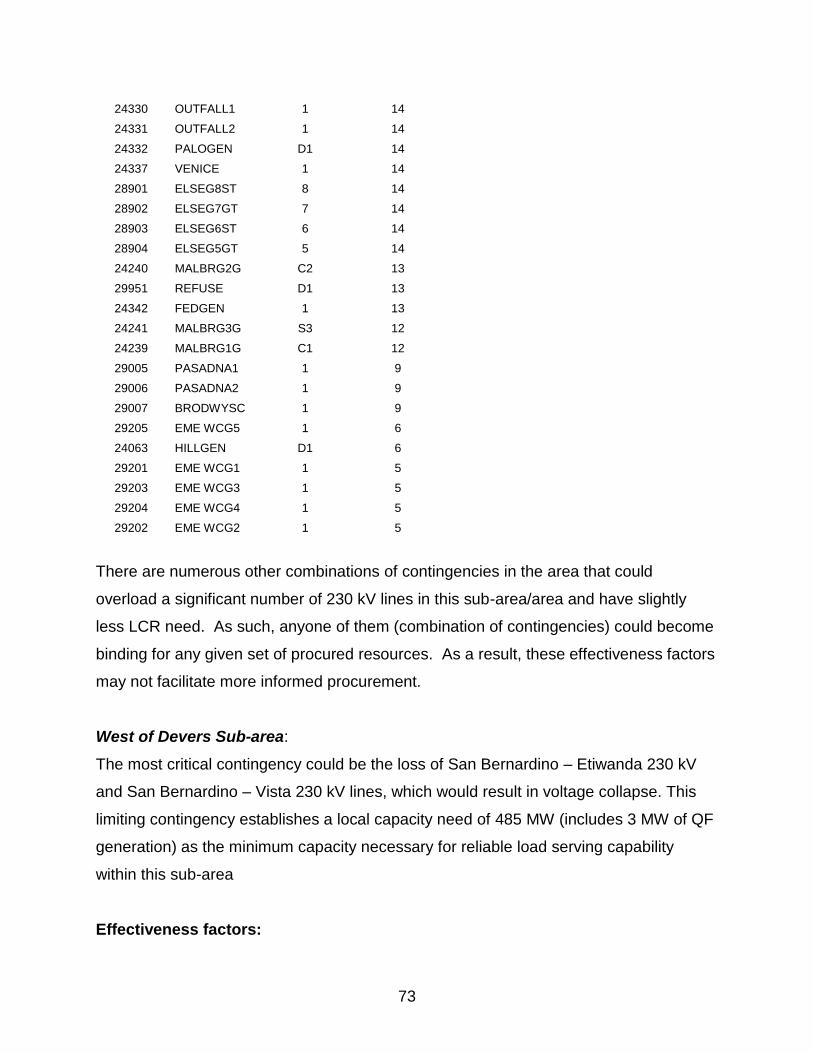
73
24330 OUTFALL1 1 14
24331 OUTFALL2 1 14
24332 PALOGEN D1 14
24337 VENICE 1 14
28901 ELSEG8ST 8 14
28902 ELSEG7GT 7 14
28903 ELSEG6ST 6 14
28904 ELSEG5GT 5 14
24240 MALBRG2G C2 13
29951 REFUSE D1 13
24342 FEDGEN 1 13
24241 MALBRG3G S3 12
24239 MALBRG1G C1 12
29005 PASADNA1 1 9
29006 PASADNA2 1 9
29007 BRODWYSC 1 9
29205 EME WCG5 1 6
24063 HILLGEN D1 6
29201 EME WCG1 1 5
29203 EME WCG3 1 5
29204 EME WCG4 1 5
29202 EME WCG2 1 5
There are numerous other combinations of contingencies in the area that could
overload a significant number of 230 kV lines in this sub-area/area and have slightly
less LCR need. As such, anyone of them (combination of contingencies) could become
binding for any given set of procured resources. As a result, these effectiveness factors
may not facilitate more informed procurement.
West of Devers Sub-area:
The most critical contingency could be the loss of San Bernardino – Etiwanda 230 kV
and San Bernardino – Vista 230 kV lines, which would result in voltage collapse. This
limiting contingency establishes a local capacity need of 485 MW (includes 3 MW of QF
generation) as the minimum capacity necessary for reliable load serving capability
within this sub-area
Effectiveness factors:

74
All units within this area have the same effectiveness factor.
Valley-Devers Sub-area:
The most critical contingency is the loss of one of the Palo Verde - Colorado River 500
kV line followed by the loss of Alberthill - Serrano 500 kV, which would result in thermal
overload of Camino – Iron Mountain 230 kV line. This limiting contingency establishes a
local capacity need of 1,180 MW (includes 55 MW of QF and 153 MW of wind
generation) as the minimum capacity necessary for reliable load serving capability
within this sub-area.
Effectiveness factors:
All units within this area have the same effectiveness factor.
Valley Sub-area:
Resources needed to meet the Valley-Devers sub-area are enough to meet this sub-
area requirement as well.
Eastern LA Basin Sub-area:
Resources needed to meet the West of Devers and Valley-Devers sub-areas are
enough to meet this sub-area requirement as well.
LA Basin Overall:
Assuming the flow control device on Imperial Valley – ROA 230 kV line is in service,
and assuming there would be 520 MW additional capacity in San Diego, the most
critical contingency is the loss of the Lugo - Victorville 500 kV Line followed by the loss
of Sylmar - Gould 230.0 kV or vice versa, which would result in thermal overload on the
Sylmar - Eagle Rock 230 kV. This limiting contingency establishes a local capacity need
of about 9,119 MW (includes 785 MW of QF, 259 MW of wind and 1,163 MW of MUNI
generation) as the minimum capacity necessary for reliable load serving capability
within this area.

75
Assuming the flow control device on Imperial Valley – ROA 230 kV line is not in service,
and assuming there would be 520 MW additional capacity in San Diego, the most
critical contingency is the loss of Miguel – ECO 500 kV line followed by Ocotillo –
Suncrest 500 kV line, which would result in voltage collapse. This limiting contingency
establishes a local capacity need of about 10,095 MW (includes 785 MW of QF, 259
MW of wind and 1,163 MW of MUNI generation) as the minimum capacity necessary for
reliable load serving capability within this area.
The most critical single contingency is the loss of the Sylmar S - Gould 230 kV line with
SONGS #3 unit out of service, which would result in thermal overload of the Sylmar S -
Eagle Rock 230 kV line. This limiting contingency establishes a local capacity need of
about 9,059 MW (includes 785 MW of QF, 259 MW of wind and 1,163 MW of MUNI
generation).
Effectiveness factors:
The following table has units that have at least 5% effectiveness.
Gen Bus Gen Name Gen ID MW Eff Fctr
29005 PASADNA1 1 28
29006 PASADNA2 1 28
29007 BRODWYSC 1 27
24241 MALBRG3G S3 18
24240 MALBRG2G C2 18
24239 MALBRG1G C1 18
29951 REFUSE D1 18
24342 FEDGEN 1 17
24022 CHEVGEN1 1 15
24023 CHEVGEN2 2 15
24047 ELSEG3 G 3 15
24048 ELSEG4 G 4 15
24094 MOBGEN1 1 15
24121 REDON5 G 5 15
24122 REDON6 G 6 15
24123 REDON7 G 7 15
24124 REDON8 G 8 15
24329 MOBGEN2 1 15
24330 OUTFALL1 1 15
24331 OUTFALL2 1 15

76
24332 PALOGEN D1 15
24337 VENICE 1 15
28901 ELSEG8ST 8 15
28902 ELSEG7GT 7 15
28903 ELSEG6ST 6 15
28904 ELSEG5GT 5 15
24011 ARCO 1G 1 14
24012 ARCO 2G 2 14
24013 ARCO 3G 3 14
24014 ARCO 4G 4 14
24163 ARCO 5G 5 14
24164 ARCO 6G 6 14
24018 BRIGEN 1 14
24020 CARBGEN1 1 14
24064 HINSON 1 14
24070 ICEGEN D1 14
24170 LBEACH12 2 14
24171 LBEACH34 3 14
24062 HARBOR G 1 14
25510 HARBORG4 LP 14
24062 HARBOR G HP 14
24139 SERRFGEN D1 14
24170 LBEACH12 1 14
24171 LBEACH34 4 14
24327 THUMSGEN 1 14
24328 CARBGEN2 1 14
29308 CTRPKGEN 1 13
29953 SIGGEN D1 13
24001 ALAMT1 G 1 12
24002 ALAMT2 G 2 12
24003 ALAMT3 G 3 12
24004 ALAMT4 G 4 12
24005 ALAMT5 G 5 11
24161 ALAMT6 G 6 11
29201 EME WCG1 1 11
29203 EME WCG3 1 11
29204 EME WCG4 1 11
29205 EME WCG5 1 11
29202 EME WCG2 1 11
24063 HILLGEN D1 11
24066 HUNT1 G 1 10
24067 HUNT2 G 2 10
29309 BARPKGEN 1 10
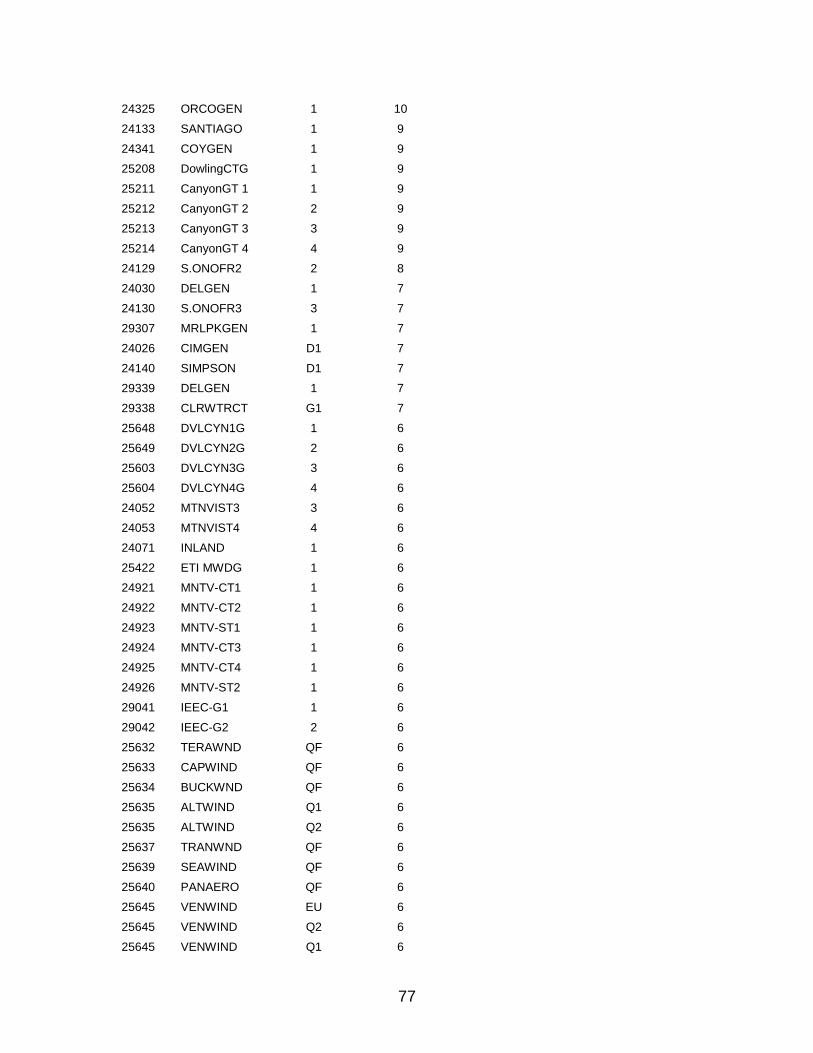
77
24325 ORCOGEN 1 10
24133 SANTIAGO 1 9
24341 COYGEN 1 9
25208 DowlingCTG 1 9
25211 CanyonGT 1 1 9
25212 CanyonGT 2 2 9
25213 CanyonGT 3 3 9
25214 CanyonGT 4 4 9
24129 S.ONOFR2 2 8
24030 DELGEN 1 7
24130 S.ONOFR3 3 7
29307 MRLPKGEN 1 7
24026 CIMGEN D1 7
24140 SIMPSON D1 7
29339 DELGEN 1 7
29338 CLRWTRCT G1 7
25648 DVLCYN1G 1 6
25649 DVLCYN2G 2 6
25603 DVLCYN3G 3 6
25604 DVLCYN4G 4 6
24052 MTNVIST3 3 6
24053 MTNVIST4 4 6
24071 INLAND 1 6
25422 ETI MWDG 1 6
24921 MNTV-CT1 1 6
24922 MNTV-CT2 1 6
24923 MNTV-ST1 1 6
24924 MNTV-CT3 1 6
24925 MNTV-CT4 1 6
24926 MNTV-ST2 1 6
29041 IEEC-G1 1 6
29042 IEEC-G2 2 6
25632 TERAWND QF 6
25633 CAPWIND QF 6
25634 BUCKWND QF 6
25635 ALTWIND Q1 6
25635 ALTWIND Q2 6
25637 TRANWND QF 6
25639 SEAWIND QF 6
25640 PANAERO QF 6
25645 VENWIND EU 6
25645 VENWIND Q2 6
25645 VENWIND Q1 6

78
25646 SANWIND Q2 6
24815 GARNET QF 6
24815 GARNET W3 6
29023 WINTEC4 1 6
29060 MOUNTWND S1 6
29060 MOUNTWND S3 6
29060 MOUNTWND S2 6
29061 WHITEWTR 1 6
29260 ALTAMSA4 1 6
29290 CABAZON 1 6
29021 WINTEC6 1 6
24242 RERC1G 1 6
24243 RERC2G 1 6
24244 SPRINGEN 1 6
29305 ETWPKGEN 1 6
25301 CLTNDREW 1 6
25302 CLTNCTRY 1 6
25303 CLTNAGUA 1 6
24299 RERC2G3 1 6
24300 RERC2G4 1 6
24839 BLAST 1 5
29106 RPS10496 1 5
29107 RPS10495 1 5
29108 RPS10494 1 5
28174 RPS11031 EQ 5
29190 WINTECX2 1 5
29191 WINTECX1 1 5
29180 WINTEC8 1 5
25657 MJVSPHN1 1 5
25658 MJVSPHN2 2 5
25659 MJVSPHN3 3 5
29101 RPS10501 1 5
29102 RPS10500 1 5
29103 RPS10499 1 5
29104 RPS10498 1 5
29105 RPS10497 1 5
Changes compared to last year’s results:
Compared with 2018 the load forecast went down by 201 MW. The LA Basin LCR need
has decreased by 1,952 MW mainly due to transmission projects after resource
retirements in the area.
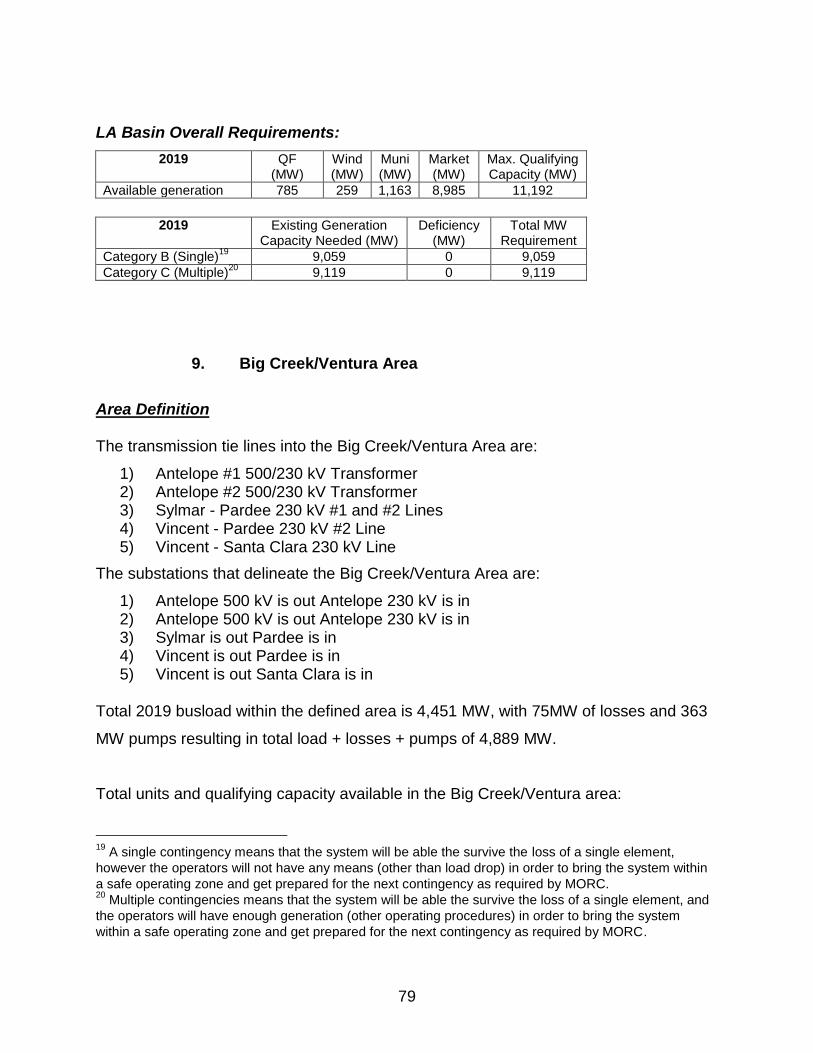
79
LA Basin Overall Requirements:
2019 QF (MW)
Wind (MW)
Muni (MW)
Market (MW)
Max. Qualifying Capacity (MW)
Available generation 785 259 1,163 8,985 11,192
2019 Existing Generation
Capacity Needed (MW) Deficiency
(MW) Total MW
Requirement
Category B (Single)19
9,059 0 9,059
Category C (Multiple)20
9,119 0 9,119
9. Big Creek/Ventura Area
Area Definition The transmission tie lines into the Big Creek/Ventura Area are:
1) Antelope #1 500/230 kV Transformer 2) Antelope #2 500/230 kV Transformer 3) Sylmar - Pardee 230 kV #1 and #2 Lines 4) Vincent - Pardee 230 kV #2 Line 5) Vincent - Santa Clara 230 kV Line
The substations that delineate the Big Creek/Ventura Area are:
1) Antelope 500 kV is out Antelope 230 kV is in 2) Antelope 500 kV is out Antelope 230 kV is in 3) Sylmar is out Pardee is in 4) Vincent is out Pardee is in 5) Vincent is out Santa Clara is in
Total 2019 busload within the defined area is 4,451 MW, with 75MW of losses and 363
MW pumps resulting in total load + losses + pumps of 4,889 MW.
Total units and qualifying capacity available in the Big Creek/Ventura area:
19
A single contingency means that the system will be able the survive the loss of a single element,
however the operators will not have any means (other than load drop) in order to bring the system within
a safe operating zone and get prepared for the next contingency as required by MORC. 20
Multiple contingencies means that the system will be able the survive the loss of a single element, and
the operators will have enough generation (other operating procedures) in order to bring the system
within a safe operating zone and get prepared for the next contingency as required by MORC.

80
MKT/SCHED RESOURCE ID
BUS # BUS NAME kV NQC UNIT
ID LCR SUB-AREA NAME
NQC Comments CAISO Tag
ALAMO_6_UNIT 25653 ALAMO SC 13.8 14.58 1 Big Creek Aug NQC Market
BIGCRK_2_EXESWD 24306 B CRK1-1 7.2 19.38 1 Big Creek, Rector, Vestal
Aug NQC Market
BIGCRK_2_EXESWD 24306 B CRK1-1 7.2 21.03 2 Big Creek, Rector, Vestal
Aug NQC Market
BIGCRK_2_EXESWD 24307 B CRK1-2 13.8 21.03 3 Big Creek, Rector, Vestal
Aug NQC Market
BIGCRK_2_EXESWD 24307 B CRK1-2 13.8 30.39 4 Big Creek, Rector, Vestal
Aug NQC Market
BIGCRK_2_EXESWD 24308 B CRK2-1 13.8 49.48 1 Big Creek, Rector, Vestal
Aug NQC Market
BIGCRK_2_EXESWD 24308 B CRK2-1 13.8 50.64 2 Big Creek, Rector, Vestal
Aug NQC Market
BIGCRK_2_EXESWD 24309 B CRK2-2 7.2 18.22 3 Big Creek, Rector, Vestal
Aug NQC Market
BIGCRK_2_EXESWD 24309 B CRK2-2 7.2 19.19 4 Big Creek, Rector, Vestal
Aug NQC Market
BIGCRK_2_EXESWD 24310 B CRK2-3 7.2 16.55 5 Big Creek, Rector, Vestal
Aug NQC Market
BIGCRK_2_EXESWD 24310 B CRK2-3 7.2 18.02 6 Big Creek, Rector, Vestal
Aug NQC Market
BIGCRK_2_EXESWD 24311 B CRK3-1 13.8 34.09 1 Big Creek, Rector, Vestal
Aug NQC Market
BIGCRK_2_EXESWD 24311 B CRK3-1 13.8 34.09 2 Big Creek, Rector, Vestal
Aug NQC Market
BIGCRK_2_EXESWD 24312 B CRK3-2 13.8 34.09 3 Big Creek, Rector, Vestal
Aug NQC Market
BIGCRK_2_EXESWD 24312 B CRK3-2 13.8 39.93 4 Big Creek, Rector, Vestal
Aug NQC Market
BIGCRK_2_EXESWD 24313 B CRK3-3 13.8 37.99 5 Big Creek, Rector, Vestal
Aug NQC Market
BIGCRK_2_EXESWD 24314 B CRK 4 11.5 49.09 41 Big Creek, Rector, Vestal
Aug NQC Market
BIGCRK_2_EXESWD 24314 B CRK 4 11.5 49.28 42 Big Creek, Rector, Vestal
Aug NQC Market
BIGCRK_2_EXESWD 24315 B CRK 8 13.8 23.76 81 Big Creek, Rector, Vestal
Aug NQC Market
BIGCRK_2_EXESWD 24315 B CRK 8 13.8 42.85 82 Big Creek, Rector, Vestal
Aug NQC Market
BIGCRK_2_EXESWD 24317 MAMOTH1G 13.8 91.07 1 Big Creek, Rector, Vestal
Aug NQC Market
BIGCRK_2_EXESWD 24318 MAMOTH2G 13.8 91.07 2 Big Creek, Rector, Vestal
Aug NQC Market
BIGCRK_2_EXESWD 24323 PORTAL 4.8 9.35 1 Big Creek, Rector, Vestal
Aug NQC Market
EASTWD_7_UNIT 24319 EASTWOOD 13.8 199.00 1 Big Creek, Rector, Vestal
Market
EDMONS_2_NSPIN 25605 EDMON1AP 14.4 25.00 1 Big Creek Pumps MUNI
EDMONS_2_NSPIN 25606 EDMON2AP 14.4 25.00 2 Big Creek Pumps MUNI
EDMONS_2_NSPIN 25607 EDMON3AP 14.4 25.00 3 Big Creek Pumps MUNI
EDMONS_2_NSPIN 25607 EDMON3AP 14.4 25.00 4 Big Creek Pumps MUNI
EDMONS_2_NSPIN 25608 EDMON4AP 14.4 25.00 5 Big Creek Pumps MUNI
EDMONS_2_NSPIN 25608 EDMON4AP 14.4 25.00 6 Big Creek Pumps MUNI
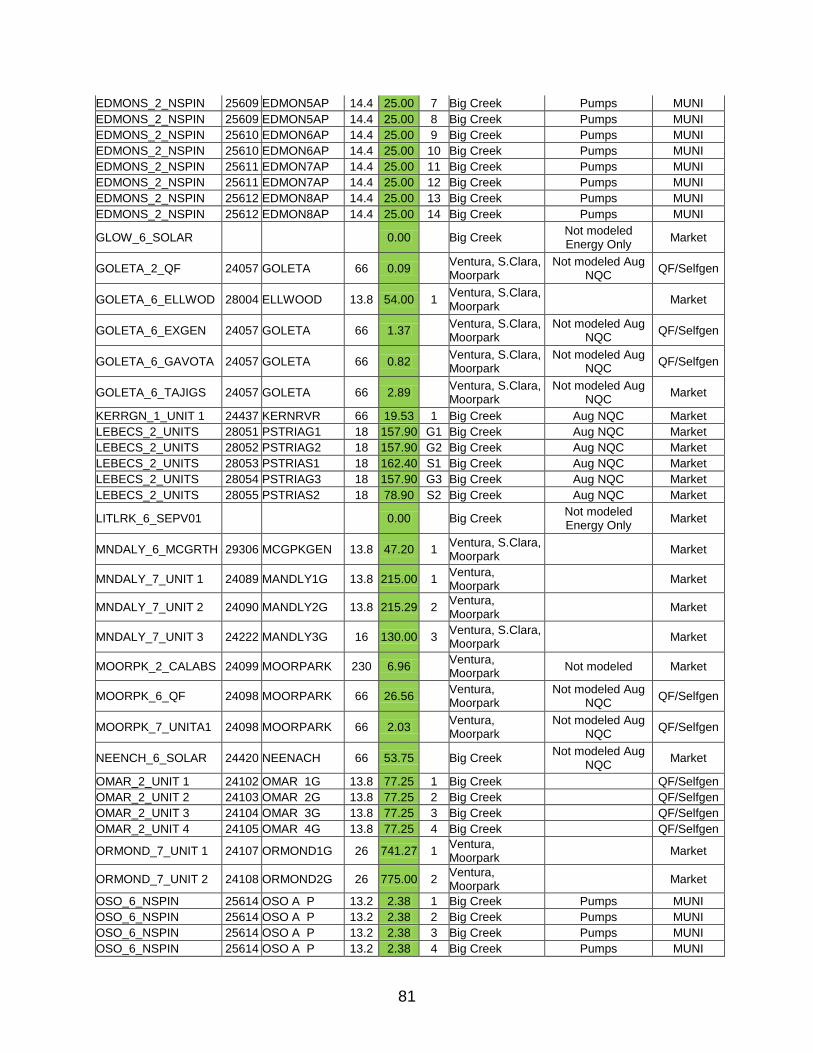
81
EDMONS_2_NSPIN 25609 EDMON5AP 14.4 25.00 7 Big Creek Pumps MUNI
EDMONS_2_NSPIN 25609 EDMON5AP 14.4 25.00 8 Big Creek Pumps MUNI
EDMONS_2_NSPIN 25610 EDMON6AP 14.4 25.00 9 Big Creek Pumps MUNI
EDMONS_2_NSPIN 25610 EDMON6AP 14.4 25.00 10 Big Creek Pumps MUNI
EDMONS_2_NSPIN 25611 EDMON7AP 14.4 25.00 11 Big Creek Pumps MUNI
EDMONS_2_NSPIN 25611 EDMON7AP 14.4 25.00 12 Big Creek Pumps MUNI
EDMONS_2_NSPIN 25612 EDMON8AP 14.4 25.00 13 Big Creek Pumps MUNI
EDMONS_2_NSPIN 25612 EDMON8AP 14.4 25.00 14 Big Creek Pumps MUNI
GLOW_6_SOLAR 0.00 Big Creek Not modeled Energy Only
Market
GOLETA_2_QF 24057 GOLETA 66 0.09 Ventura, S.Clara, Moorpark
Not modeled Aug NQC
QF/Selfgen
GOLETA_6_ELLWOD 28004 ELLWOOD 13.8 54.00 1 Ventura, S.Clara, Moorpark
Market
GOLETA_6_EXGEN 24057 GOLETA 66 1.37 Ventura, S.Clara, Moorpark
Not modeled Aug NQC
QF/Selfgen
GOLETA_6_GAVOTA 24057 GOLETA 66 0.82 Ventura, S.Clara, Moorpark
Not modeled Aug NQC
QF/Selfgen
GOLETA_6_TAJIGS 24057 GOLETA 66 2.89 Ventura, S.Clara, Moorpark
Not modeled Aug NQC
Market
KERRGN_1_UNIT 1 24437 KERNRVR 66 19.53 1 Big Creek Aug NQC Market
LEBECS_2_UNITS 28051 PSTRIAG1 18 157.90 G1 Big Creek Aug NQC Market
LEBECS_2_UNITS 28052 PSTRIAG2 18 157.90 G2 Big Creek Aug NQC Market
LEBECS_2_UNITS 28053 PSTRIAS1 18 162.40 S1 Big Creek Aug NQC Market
LEBECS_2_UNITS 28054 PSTRIAG3 18 157.90 G3 Big Creek Aug NQC Market
LEBECS_2_UNITS 28055 PSTRIAS2 18 78.90 S2 Big Creek Aug NQC Market
LITLRK_6_SEPV01 0.00 Big Creek Not modeled Energy Only
Market
MNDALY_6_MCGRTH 29306 MCGPKGEN 13.8 47.20 1 Ventura, S.Clara, Moorpark
Market
MNDALY_7_UNIT 1 24089 MANDLY1G 13.8 215.00 1 Ventura, Moorpark
Market
MNDALY_7_UNIT 2 24090 MANDLY2G 13.8 215.29 2 Ventura, Moorpark
Market
MNDALY_7_UNIT 3 24222 MANDLY3G 16 130.00 3 Ventura, S.Clara, Moorpark
Market
MOORPK_2_CALABS 24099 MOORPARK 230 6.96 Ventura, Moorpark
Not modeled Market
MOORPK_6_QF 24098 MOORPARK 66 26.56 Ventura, Moorpark
Not modeled Aug NQC
QF/Selfgen
MOORPK_7_UNITA1 24098 MOORPARK 66 2.03 Ventura, Moorpark
Not modeled Aug NQC
QF/Selfgen
NEENCH_6_SOLAR 24420 NEENACH 66 53.75 Big Creek Not modeled Aug
NQC Market
OMAR_2_UNIT 1 24102 OMAR 1G 13.8 77.25 1 Big Creek QF/Selfgen
OMAR_2_UNIT 2 24103 OMAR 2G 13.8 77.25 2 Big Creek QF/Selfgen
OMAR_2_UNIT 3 24104 OMAR 3G 13.8 77.25 3 Big Creek QF/Selfgen
OMAR_2_UNIT 4 24105 OMAR 4G 13.8 77.25 4 Big Creek QF/Selfgen
ORMOND_7_UNIT 1 24107 ORMOND1G 26 741.27 1 Ventura, Moorpark
Market
ORMOND_7_UNIT 2 24108 ORMOND2G 26 775.00 2 Ventura, Moorpark
Market
OSO_6_NSPIN 25614 OSO A P 13.2 2.38 1 Big Creek Pumps MUNI
OSO_6_NSPIN 25614 OSO A P 13.2 2.38 2 Big Creek Pumps MUNI
OSO_6_NSPIN 25614 OSO A P 13.2 2.38 3 Big Creek Pumps MUNI
OSO_6_NSPIN 25614 OSO A P 13.2 2.38 4 Big Creek Pumps MUNI

82
OSO_6_NSPIN 25615 OSO B P 13.2 2.38 5 Big Creek Pumps MUNI
OSO_6_NSPIN 25615 OSO B P 13.2 2.38 6 Big Creek Pumps MUNI
OSO_6_NSPIN 25615 OSO B P 13.2 2.38 7 Big Creek Pumps MUNI
OSO_6_NSPIN 25615 OSO B P 13.2 2.38 8 Big Creek Pumps MUNI
PANDOL_6_UNIT 24113 PANDOL 13.8 25.70 1 Big Creek, Vestal Aug NQC QF/Selfgen
PANDOL_6_UNIT 24113 PANDOL 13.8 20.94 2 Big Creek, Vestal Aug NQC QF/Selfgen
RECTOR_2_KAWEAH 24212 RECTOR 66 2.76 Big Creek, Rector, Vestal
Not modeled Aug NQC
Market
RECTOR_2_KAWH 1 24212 RECTOR 66 1.29 Big Creek, Rector, Vestal
Not modeled Aug NQC
Market
RECTOR_2_QF 24212 RECTOR 66 9.48 Big Creek, Rector, Vestal
Not modeled Aug NQC
QF/Selfgen
RECTOR_7_TULARE 24212 RECTOR 66 0.17 Big Creek, Rector, Vestal
Not modeled QF/Selfgen
SAUGUS_2_TOLAND 24135 SAUGUS 66 0.00 Big Creek Not modeled Energy Only
Market
SAUGUS_6_MWDFTH 24135 SAUGUS 66 4.08 Big Creek Not modeled Aug
NQC MUNI
SAUGUS_6_PTCHGN 24118 PITCHGEN 13.8 18.95 1 Big Creek Aug NQC MUNI
SAUGUS_6_QF 24135 SAUGUS 66 0.92 Big Creek Not modeled Aug
NQC QF/Selfgen
SAUGUS_7_CHIQCN 24135 SAUGUS 66 2.02 Big Creek Not modeled Aug
NQC Market
SAUGUS_7_LOPEZ 24135 SAUGUS 66 5.42 Big Creek Not modeled Aug
NQC QF/Selfgen
SNCLRA_6_OXGEN 24110 OXGEN 13.8 35.70 1 Ventura, S.Clara, Moorpark
Aug NQC QF/Selfgen
SNCLRA_6_PROCGN 24119 PROCGEN 13.8 46.26 1 Ventura, S.Clara, Moorpark
Aug NQC Market
SNCLRA_6_QF 24127 S.CLARA 66 0.00 1 Ventura, S.Clara, Moorpark
Aug NQC QF/Selfgen
SNCLRA_6_WILLMT 24159 WILLAMET 13.8 13.94 1 Ventura, S.Clara, Moorpark
Aug NQC QF/Selfgen
SPRGVL_2_QF 24215 SPRINGVL 66 0.23 Big Creek, Rector, Vestal
Not modeled Aug NQC
QF/Selfgen
SPRGVL_2_TULE 24215 SPRINGVL 66 0.59 Big Creek, Rector, Vestal
Not modeled Aug NQC
Market
SPRGVL_2_TULESC 24215 SPRINGVL 66 0.41 Big Creek, Rector, Vestal
Not modeled Aug NQC
Market
SYCAMR_2_UNITS 24143 SYCCYN1G 13.8 56.53 1 Big Creek Aug NQC QF/Selfgen
SYCAMR_2_UNITS 24144 SYCCYN2G 13.8 56.54 2 Big Creek Aug NQC QF/Selfgen
SYCAMR_2_UNITS 24145 SYCCYN3G 13.8 56.53 3 Big Creek Aug NQC QF/Selfgen
SYCAMR_2_UNITS 24146 SYCCYN4G 13.8 56.53 4 Big Creek Aug NQC QF/Selfgen
TENGEN_2_PL1X2 24148 TENNGEN1 13.8 17.49 1 Big Creek Aug NQC Market
TENGEN_2_PL1X2 24149 TENNGEN2 13.8 17.50 2 Big Creek Aug NQC Market
VESTAL_2_KERN 24152 VESTAL 66 26.68 1 Big Creek, Vestal Aug NQC QF/Selfgen
VESTAL_2_WELLHD 24152 VESTAL 66 49.00 Big Creek, Vestal Not modeled Market
VESTAL_6_QF 24152 VESTAL 66 6.91 Big Creek, Vestal Not modeled Aug
NQC QF/Selfgen
VESTAL_6_ULTRGN 24150 ULTRAGEN 13.8 34.13 1 Big Creek, Vestal Aug NQC QF/Selfgen
VESTAL_6_WDFIRE 28008 LAKEGEN 13.8 6.60 1 Big Creek, Vestal Aug NQC QF/Selfgen
WARNE_2_UNIT 25651 WARNE1 13.8 38.00 1 Big Creek Aug NQC Market
WARNE_2_UNIT 25652 WARNE2 13.8 38.00 1 Big Creek Aug NQC Market
APPGEN_6_UNIT 1 24009 APPGEN1G 13.8 0.00 1 Big Creek No NQC - hist. data Market
APPGEN_6_UNIT 1 24010 APPGEN2G 13.8 0.00 2 Big Creek No NQC - hist. data Market
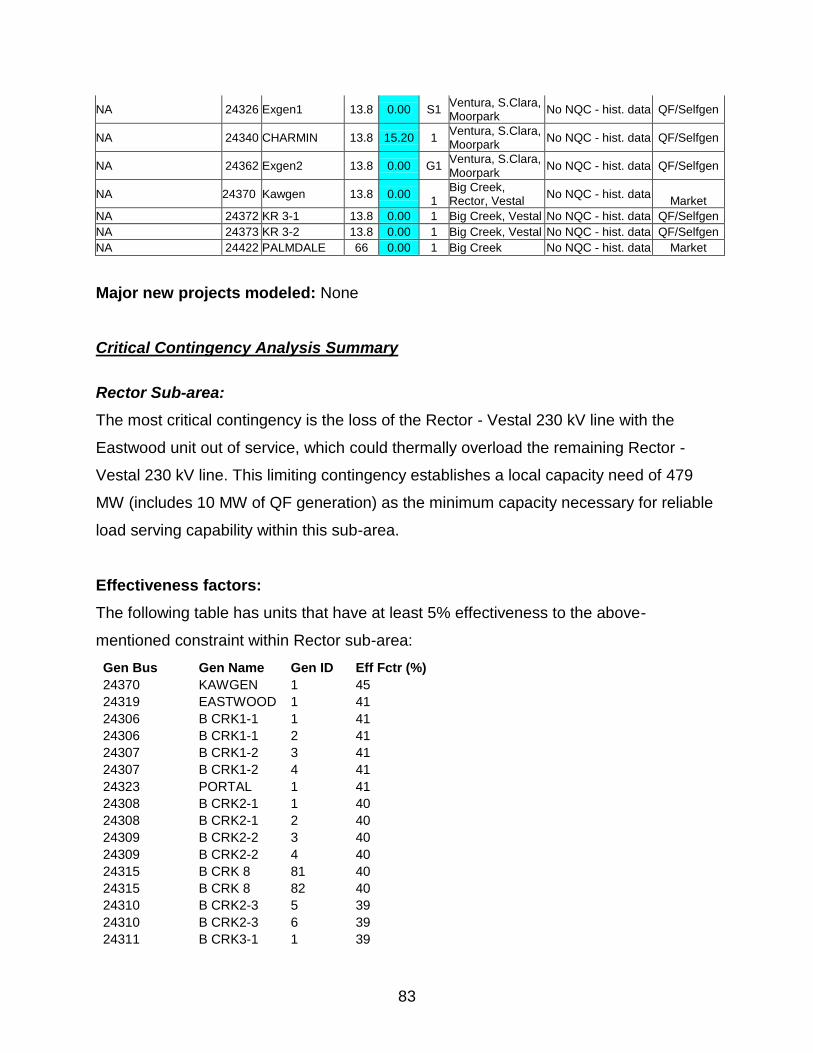
83
NA 24326 Exgen1 13.8 0.00 S1 Ventura, S.Clara, Moorpark
No NQC - hist. data QF/Selfgen
NA 24340 CHARMIN 13.8 15.20 1 Ventura, S.Clara, Moorpark
No NQC - hist. data QF/Selfgen
NA 24362 Exgen2 13.8 0.00 G1 Ventura, S.Clara, Moorpark
No NQC - hist. data QF/Selfgen
NA 24370 Kawgen 13.8 0.00 1
Big Creek, Rector, Vestal
No NQC - hist. data Market
NA 24372 KR 3-1 13.8 0.00 1 Big Creek, Vestal No NQC - hist. data QF/Selfgen
NA 24373 KR 3-2 13.8 0.00 1 Big Creek, Vestal No NQC - hist. data QF/Selfgen
NA 24422 PALMDALE 66 0.00 1 Big Creek No NQC - hist. data Market
Major new projects modeled: None
Critical Contingency Analysis Summary
Rector Sub-area:
The most critical contingency is the loss of the Rector - Vestal 230 kV line with the
Eastwood unit out of service, which could thermally overload the remaining Rector -
Vestal 230 kV line. This limiting contingency establishes a local capacity need of 479
MW (includes 10 MW of QF generation) as the minimum capacity necessary for reliable
load serving capability within this sub-area.
Effectiveness factors:
The following table has units that have at least 5% effectiveness to the above-
mentioned constraint within Rector sub-area:
Gen Bus Gen Name Gen ID Eff Fctr (%)
24370 KAWGEN 1 45
24319 EASTWOOD 1 41
24306 B CRK1-1 1 41
24306 B CRK1-1 2 41
24307 B CRK1-2 3 41
24307 B CRK1-2 4 41
24323 PORTAL 1 41
24308 B CRK2-1 1 40
24308 B CRK2-1 2 40
24309 B CRK2-2 3 40
24309 B CRK2-2 4 40
24315 B CRK 8 81 40
24315 B CRK 8 82 40
24310 B CRK2-3 5 39
24310 B CRK2-3 6 39
24311 B CRK3-1 1 39
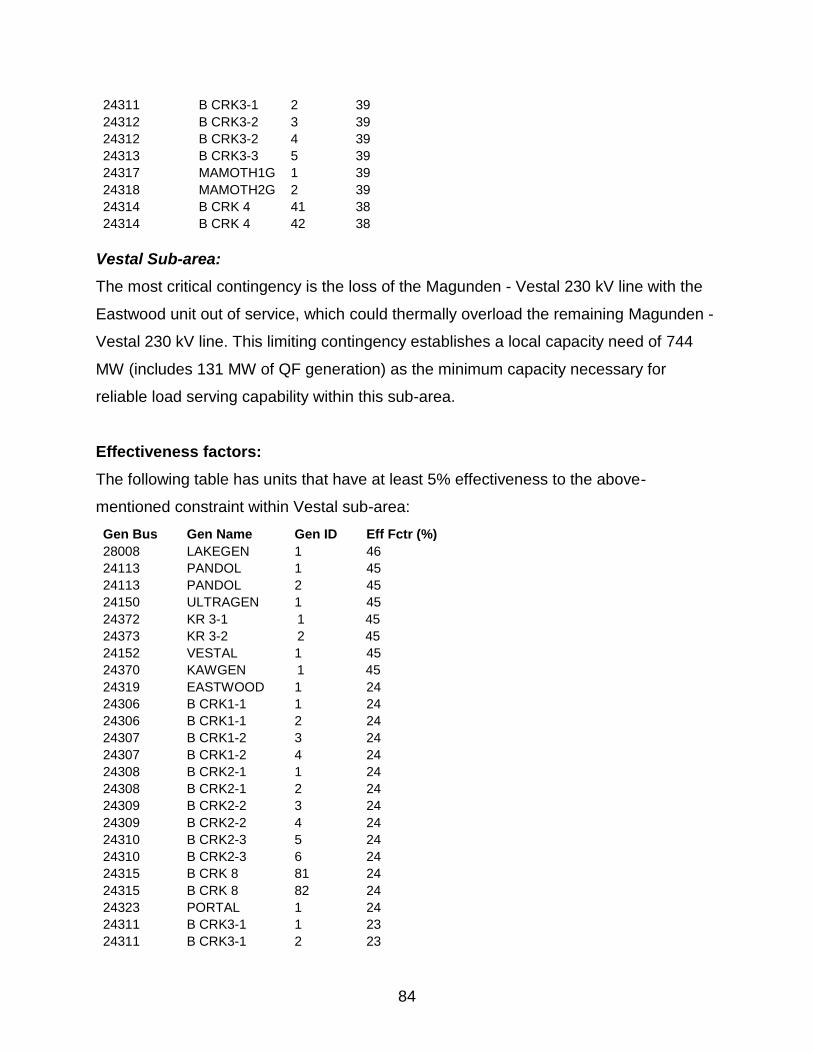
84
24311 B CRK3-1 2 39
24312 B CRK3-2 3 39
24312 B CRK3-2 4 39
24313 B CRK3-3 5 39
24317 MAMOTH1G 1 39
24318 MAMOTH2G 2 39
24314 B CRK 4 41 38
24314 B CRK 4 42 38
Vestal Sub-area:
The most critical contingency is the loss of the Magunden - Vestal 230 kV line with the
Eastwood unit out of service, which could thermally overload the remaining Magunden -
Vestal 230 kV line. This limiting contingency establishes a local capacity need of 744
MW (includes 131 MW of QF generation) as the minimum capacity necessary for
reliable load serving capability within this sub-area.
Effectiveness factors:
The following table has units that have at least 5% effectiveness to the above-
mentioned constraint within Vestal sub-area:
Gen Bus Gen Name Gen ID Eff Fctr (%)
28008 LAKEGEN 1 46
24113 PANDOL 1 45
24113 PANDOL 2 45
24150 ULTRAGEN 1 45
24372 KR 3-1 1 45
24373 KR 3-2 2 45
24152 VESTAL 1 45
24370 KAWGEN 1 45
24319 EASTWOOD 1 24
24306 B CRK1-1 1 24
24306 B CRK1-1 2 24
24307 B CRK1-2 3 24
24307 B CRK1-2 4 24
24308 B CRK2-1 1 24
24308 B CRK2-1 2 24
24309 B CRK2-2 3 24
24309 B CRK2-2 4 24
24310 B CRK2-3 5 24
24310 B CRK2-3 6 24
24315 B CRK 8 81 24
24315 B CRK 8 82 24
24323 PORTAL 1 24
24311 B CRK3-1 1 23
24311 B CRK3-1 2 23
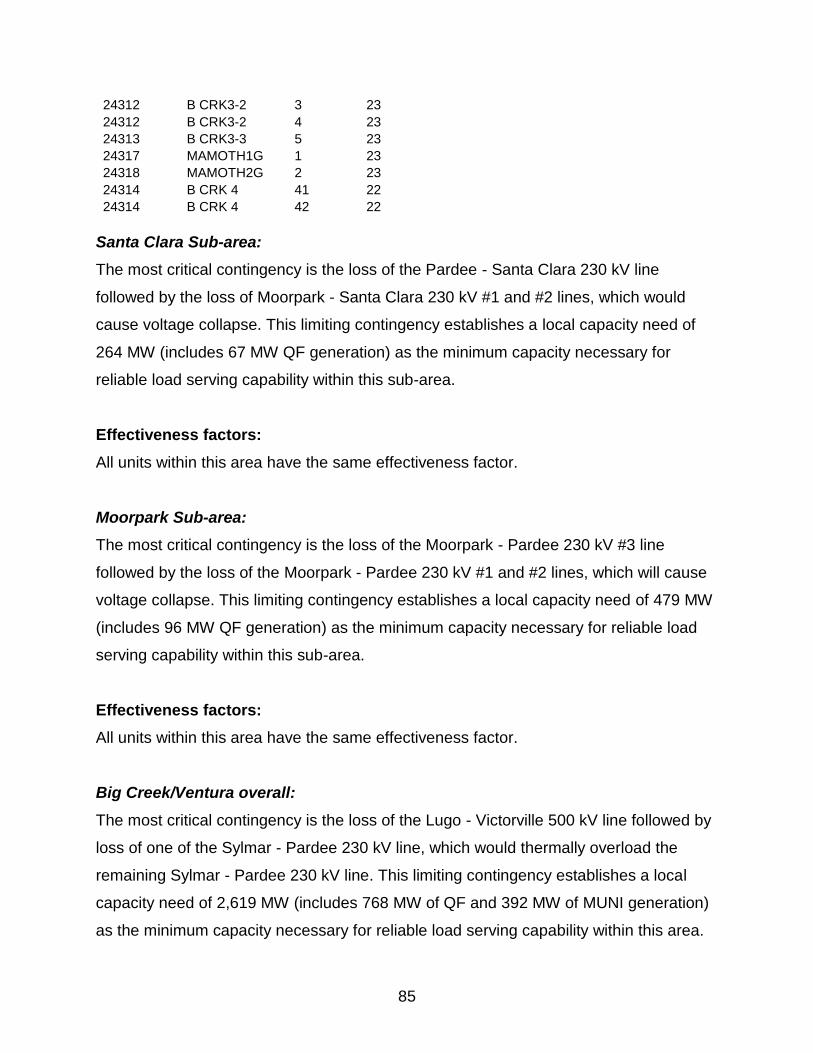
85
24312 B CRK3-2 3 23
24312 B CRK3-2 4 23
24313 B CRK3-3 5 23
24317 MAMOTH1G 1 23
24318 MAMOTH2G 2 23
24314 B CRK 4 41 22
24314 B CRK 4 42 22
Santa Clara Sub-area:
The most critical contingency is the loss of the Pardee - Santa Clara 230 kV line
followed by the loss of Moorpark - Santa Clara 230 kV #1 and #2 lines, which would
cause voltage collapse. This limiting contingency establishes a local capacity need of
264 MW (includes 67 MW QF generation) as the minimum capacity necessary for
reliable load serving capability within this sub-area.
Effectiveness factors:
All units within this area have the same effectiveness factor.
Moorpark Sub-area:
The most critical contingency is the loss of the Moorpark - Pardee 230 kV #3 line
followed by the loss of the Moorpark - Pardee 230 kV #1 and #2 lines, which will cause
voltage collapse. This limiting contingency establishes a local capacity need of 479 MW
(includes 96 MW QF generation) as the minimum capacity necessary for reliable load
serving capability within this sub-area.
Effectiveness factors:
All units within this area have the same effectiveness factor.
Big Creek/Ventura overall:
The most critical contingency is the loss of the Lugo - Victorville 500 kV line followed by
loss of one of the Sylmar - Pardee 230 kV line, which would thermally overload the
remaining Sylmar - Pardee 230 kV line. This limiting contingency establishes a local
capacity need of 2,619 MW (includes 768 MW of QF and 392 MW of MUNI generation)
as the minimum capacity necessary for reliable load serving capability within this area.
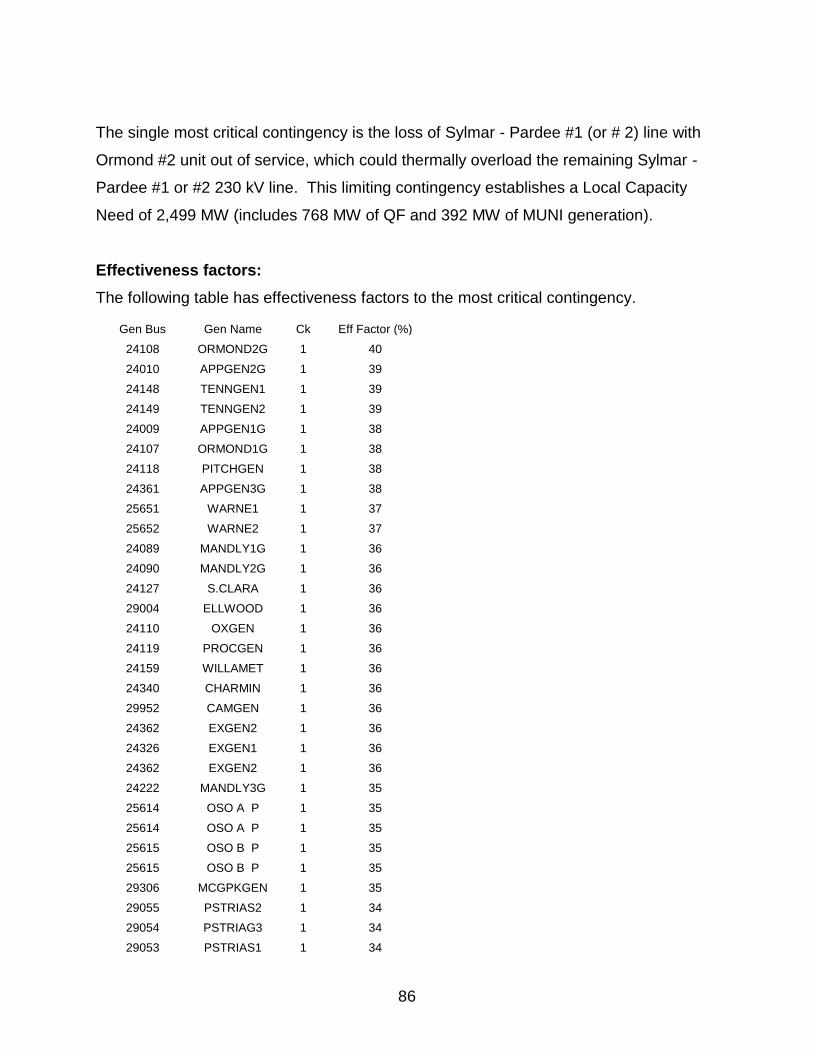
86
The single most critical contingency is the loss of Sylmar - Pardee #1 (or # 2) line with
Ormond #2 unit out of service, which could thermally overload the remaining Sylmar -
Pardee #1 or #2 230 kV line. This limiting contingency establishes a Local Capacity
Need of 2,499 MW (includes 768 MW of QF and 392 MW of MUNI generation).
Effectiveness factors:
The following table has effectiveness factors to the most critical contingency.
Gen Bus Gen Name Ck Eff Factor (%)
24108 ORMOND2G 1 40
24010 APPGEN2G 1 39
24148 TENNGEN1 1 39
24149 TENNGEN2 1 39
24009 APPGEN1G 1 38
24107 ORMOND1G 1 38
24118 PITCHGEN 1 38
24361 APPGEN3G 1 38
25651 WARNE1 1 37
25652 WARNE2 1 37
24089 MANDLY1G 1 36
24090 MANDLY2G 1 36
24127 S.CLARA 1 36
29004 ELLWOOD 1 36
24110 OXGEN 1 36
24119 PROCGEN 1 36
24159 WILLAMET 1 36
24340 CHARMIN 1 36
29952 CAMGEN 1 36
24362 EXGEN2 1 36
24326 EXGEN1 1 36
24362 EXGEN2 1 36
24222 MANDLY3G 1 35
25614 OSO A P 1 35
25614 OSO A P 1 35
25615 OSO B P 1 35
25615 OSO B P 1 35
29306 MCGPKGEN 1 35
29055 PSTRIAS2 1 34
29054 PSTRIAG3 1 34
29053 PSTRIAS1 1 34
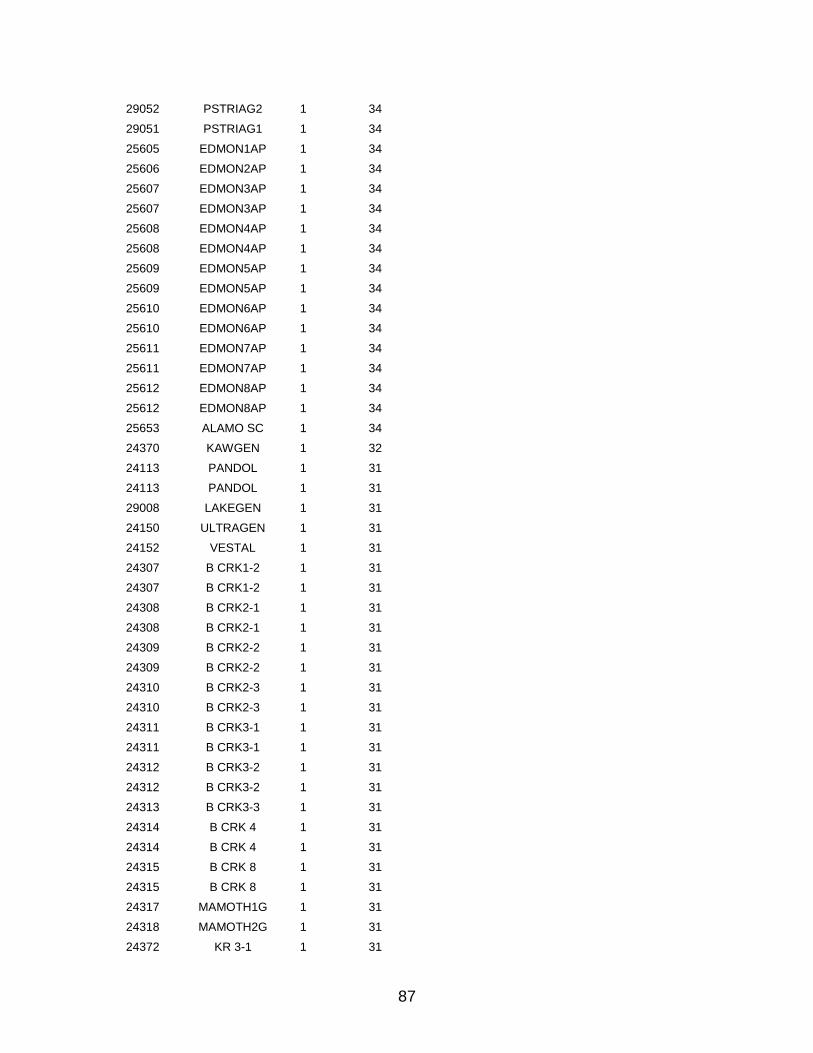
87
29052 PSTRIAG2 1 34
29051 PSTRIAG1 1 34
25605 EDMON1AP 1 34
25606 EDMON2AP 1 34
25607 EDMON3AP 1 34
25607 EDMON3AP 1 34
25608 EDMON4AP 1 34
25608 EDMON4AP 1 34
25609 EDMON5AP 1 34
25609 EDMON5AP 1 34
25610 EDMON6AP 1 34
25610 EDMON6AP 1 34
25611 EDMON7AP 1 34
25611 EDMON7AP 1 34
25612 EDMON8AP 1 34
25612 EDMON8AP 1 34
25653 ALAMO SC 1 34
24370 KAWGEN 1 32
24113 PANDOL 1 31
24113 PANDOL 1 31
29008 LAKEGEN 1 31
24150 ULTRAGEN 1 31
24152 VESTAL 1 31
24307 B CRK1-2 1 31
24307 B CRK1-2 1 31
24308 B CRK2-1 1 31
24308 B CRK2-1 1 31
24309 B CRK2-2 1 31
24309 B CRK2-2 1 31
24310 B CRK2-3 1 31
24310 B CRK2-3 1 31
24311 B CRK3-1 1 31
24311 B CRK3-1 1 31
24312 B CRK3-2 1 31
24312 B CRK3-2 1 31
24313 B CRK3-3 1 31
24314 B CRK 4 1 31
24314 B CRK 4 1 31
24315 B CRK 8 1 31
24315 B CRK 8 1 31
24317 MAMOTH1G 1 31
24318 MAMOTH2G 1 31
24372 KR 3-1 1 31
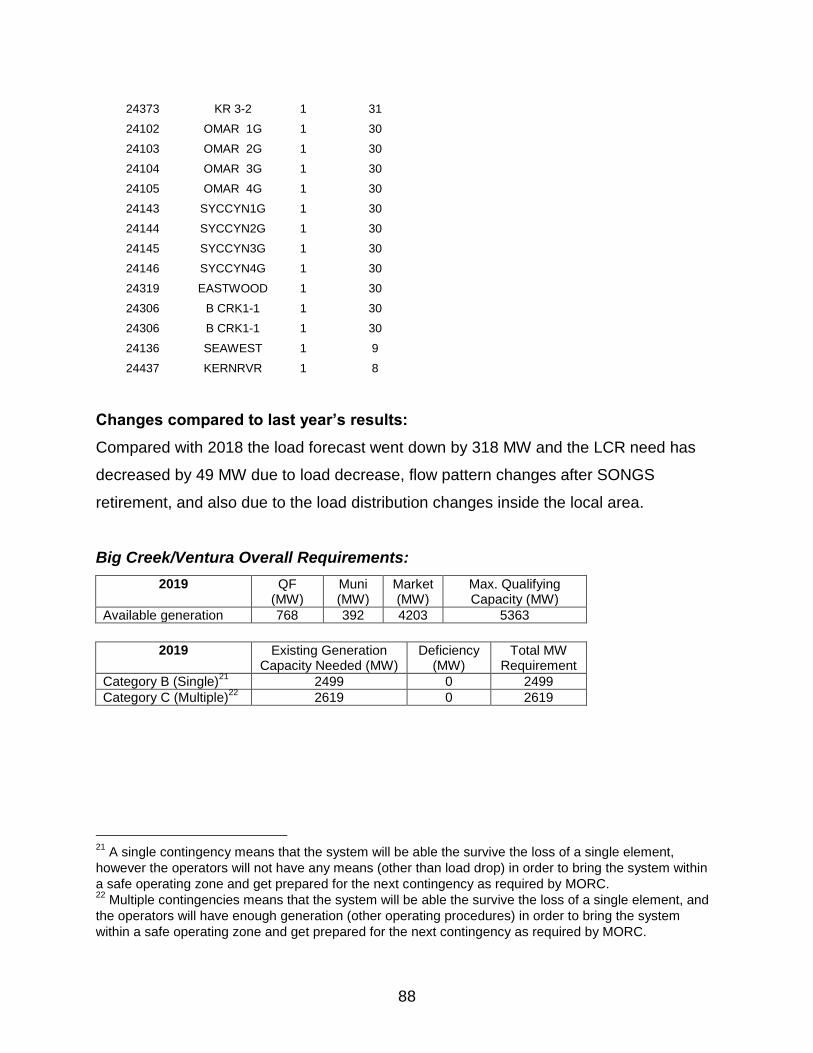
88
24373 KR 3-2 1 31
24102 OMAR 1G 1 30
24103 OMAR 2G 1 30
24104 OMAR 3G 1 30
24105 OMAR 4G 1 30
24143 SYCCYN1G 1 30
24144 SYCCYN2G 1 30
24145 SYCCYN3G 1 30
24146 SYCCYN4G 1 30
24319 EASTWOOD 1 30
24306 B CRK1-1 1 30
24306 B CRK1-1 1 30
24136 SEAWEST 1 9
24437 KERNRVR 1 8
Changes compared to last year’s results:
Compared with 2018 the load forecast went down by 318 MW and the LCR need has
decreased by 49 MW due to load decrease, flow pattern changes after SONGS
retirement, and also due to the load distribution changes inside the local area.
Big Creek/Ventura Overall Requirements:
2019 QF (MW)
Muni (MW)
Market (MW)
Max. Qualifying Capacity (MW)
Available generation 768 392 4203 5363
2019 Existing Generation
Capacity Needed (MW) Deficiency
(MW) Total MW
Requirement
Category B (Single)21
2499 0 2499
Category C (Multiple)22
2619 0 2619
21
A single contingency means that the system will be able the survive the loss of a single element,
however the operators will not have any means (other than load drop) in order to bring the system within
a safe operating zone and get prepared for the next contingency as required by MORC. 22
Multiple contingencies means that the system will be able the survive the loss of a single element, and
the operators will have enough generation (other operating procedures) in order to bring the system
within a safe operating zone and get prepared for the next contingency as required by MORC.
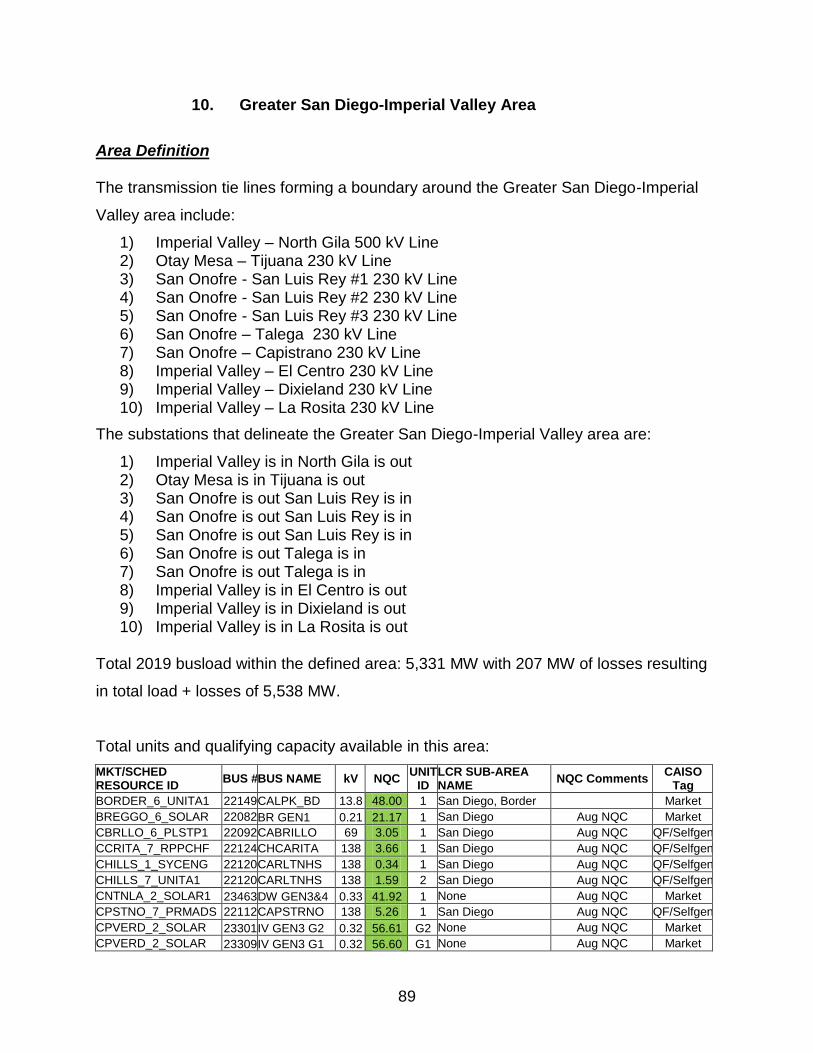
89
10. Greater San Diego-Imperial Valley Area
Area Definition
The transmission tie lines forming a boundary around the Greater San Diego-Imperial
Valley area include:
1) Imperial Valley – North Gila 500 kV Line 2) Otay Mesa – Tijuana 230 kV Line 3) San Onofre - San Luis Rey #1 230 kV Line 4) San Onofre - San Luis Rey #2 230 kV Line 5) San Onofre - San Luis Rey #3 230 kV Line 6) San Onofre – Talega 230 kV Line 7) San Onofre – Capistrano 230 kV Line 8) Imperial Valley – El Centro 230 kV Line 9) Imperial Valley – Dixieland 230 kV Line 10) Imperial Valley – La Rosita 230 kV Line
The substations that delineate the Greater San Diego-Imperial Valley area are:
1) Imperial Valley is in North Gila is out 2) Otay Mesa is in Tijuana is out 3) San Onofre is out San Luis Rey is in 4) San Onofre is out San Luis Rey is in 5) San Onofre is out San Luis Rey is in 6) San Onofre is out Talega is in 7) San Onofre is out Talega is in 8) Imperial Valley is in El Centro is out 9) Imperial Valley is in Dixieland is out 10) Imperial Valley is in La Rosita is out
Total 2019 busload within the defined area: 5,331 MW with 207 MW of losses resulting
in total load + losses of 5,538 MW.
Total units and qualifying capacity available in this area:
MKT/SCHED RESOURCE ID
BUS # BUS NAME kV NQC UNIT
ID LCR SUB-AREA NAME
NQC Comments CAISO
Tag
BORDER_6_UNITA1 22149 CALPK_BD 13.8 48.00 1 San Diego, Border Market
BREGGO_6_SOLAR 22082 BR GEN1 0.21 21.17 1 San Diego Aug NQC Market
CBRLLO_6_PLSTP1 22092 CABRILLO 69 3.05 1 San Diego Aug NQC QF/Selfgen
CCRITA_7_RPPCHF 22124 CHCARITA 138 3.66 1 San Diego Aug NQC QF/Selfgen
CHILLS_1_SYCENG 22120 CARLTNHS 138 0.34 1 San Diego Aug NQC QF/Selfgen
CHILLS_7_UNITA1 22120 CARLTNHS 138 1.59 2 San Diego Aug NQC QF/Selfgen
CNTNLA_2_SOLAR1 23463 DW GEN3&4 0.33 41.92 1 None Aug NQC Market
CPSTNO_7_PRMADS 22112 CAPSTRNO 138 5.26 1 San Diego Aug NQC QF/Selfgen
CPVERD_2_SOLAR 23301 IV GEN3 G2 0.32 56.61 G2 None Aug NQC Market
CPVERD_2_SOLAR 23309 IV GEN3 G1 0.32 56.60 G1 None Aug NQC Market

90
CRSTWD_6_KUMYAY 22915 KUMEYAAY 34.5 8.72 1 San Diego Aug NQC Wind
CSLR4S_2_SOLAR 23298 DW GEN1 G1 0.32 52.94 G1 None Aug NQC Market
CSLR4S_2_SOLAR 23299 DW GEN1 G2 0.32 52.94 G2 None Aug NQC Market
DIVSON_6_NSQF 22172 DIVISION 69 41.73 1 San Diego Aug NQC QF/Selfgen
EGATE_7_NOCITY 22204 EASTGATE 69 0.26 1 San Diego Aug NQC QF/Selfgen
ELCAJN_6_LM6K 23320 EC GEN2 13.8 48.10 1 San Diego, El Cajon Market
ELCAJN_6_UNITA1 22150 EC GEN1 13.8 45.42 1 San Diego, El Cajon Market
ESCNDO_6_PL1X2 22257 ESGEN 13.8 35.50 1 San Diego, Escondido
Market
ESCNDO_6_UNITB1 22153 CALPK_ES 13.8 48.00 1 San Diego, Escondido
Market
ESCO_6_GLMQF 22332 GOALLINE 69 38.37 1 San Diego, Esco, Escondido
Aug NQC QF/Selfgen
IVSLRP_2_SOLAR1 23440 DW GEN2 G1 0.36 18.77 1 None Aug NQC Market
IVSLRP_2_SOLAR1 23441 DW GEN2 G2 0.36 18.78 1 None Aug NQC Market
IVSLRP_2_SOLAR1 23442 DW GEN2 G3 0.36 18.78 1 None Aug NQC Market
LAKHDG_6_UNIT 1 22625 LKHODG1 13.8 20.00 1 San Diego, Bernardo, Encinitas
Market
LAKHDG_6_UNIT 2 22626 LKHODG2 13.8 20.00 2 San Diego, Bernardo, Encinitas
Market
LARKSP_6_UNIT 1 22074 LRKSPBD1 13.8 46.00 1 San Diego, Border Market
LARKSP_6_UNIT 2 22075 LRKSPBD2 13.8 46.00 1 San Diego, Border Market
LAROA1_2_UNITA1 20187 LRP-U1 16 165 1 None Market
LAROA2_2_UNITA1 22996 INTBST 18 157 1 None Market
LAROA2_2_UNITA1 22997 INTBCT 16 165 1 None Market
MRGT_6_MEF2 22487 MEF_MR2 13.8 47.90 1 San Diego, Mission, Miramar
Market
MRGT_6_MMAREF 22486 MEF_MR1 13.8 48.00 1 San Diego, Mission, Miramar
Market
MSHGTS_6_MMARLF 22448 MESAHGTS 69 3.64 1 San Diego, Mission Aug NQC QF/Selfgen
MSSION_2_QF 22496 MISSION 69 0.70 1 San Diego Aug NQC QF/Selfgen
NIMTG_6_NIQF 22576 NOISLMTR 69 36.43 1 San Diego Aug NQC QF/Selfgen
OCTILO_5_WIND 23314 OCO GEN G1 0.69 23.13 G1 None Aug NQC Wind
OCTILO_5_WIND 23318 OCO GEN G2 0.69 23.13 G2 None Aug NQC Wind
OGROVE_6_PL1X2 22628 PA99MWQ1 13.8 49.95 1 San Diego, Pala Market
OGROVE_6_PL1X2 22629 PA99MWQ2 13.8 49.95 2 San Diego, Pala Market
OTAY_6_PL1X2 22617 OYGEN 13.8 35.50 1 San Diego, Border Market
OTAY_6_UNITB1 22604 OTAY 69 2.83 1 San Diego, Border Aug NQC QF/Selfgen
OTAY_7_UNITC1 22604 OTAY 69 2.57 3 San Diego, Border Aug NQC QF/Selfgen
OTMESA_2_PL1X3 22605 OTAYMGT1 18 185.06 1 San Diego Market
OTMESA_2_PL1X3 22606 OTAYMGT2 18 185.06 1 San Diego Market
OTMESA_2_PL1X3 22607 OTAYMST1 16 233.48 1 San Diego Market
PALOMR_2_PL1X3 22262 PEN_CT1 18 162.39 1 San Diego Market
PALOMR_2_PL1X3 22263 PEN_CT2 18 162.39 1 San Diego Market
PALOMR_2_PL1X3 22265 PEN_ST 18 240.83 1 San Diego Market
PTLOMA_6_NTCCGN 22660 POINTLMA 69 1.98 2 San Diego Aug NQC QF/Selfgen
PTLOMA_6_NTCQF 22660 POINTLMA 69 19.44 1 San Diego Aug NQC QF/Selfgen
SAMPSN_6_KELCO1 22704 SAMPSON 12.5 1.00 1 San Diego Aug NQC QF/Selfgen
SMRCOS_6_UNIT 1 22724 SANMRCOS 69 0.65 1 San Diego Aug NQC QF/Selfgen
TERMEX_2_PL1X3 22981 TDM STG 18 281 1 None Market
TERMEX_2_PL1X3 22982 TDM CTG2 18 156 1 None Market
TERMEX_2_PL1X3 22983 TDM CTG3 18 156 1 None Market
NA 22916 PFC-AVC 0.6 0.00 1 San Diego No NQC - hist.
data QF/Selfgen
New unit 22245 COSTAL 2 13.8 70.00 1 San Diego No NQC - Pmax Market
New unit 22246 COSTAL 2 16.5 190.00 0 San Diego No NQC - Pmax Market
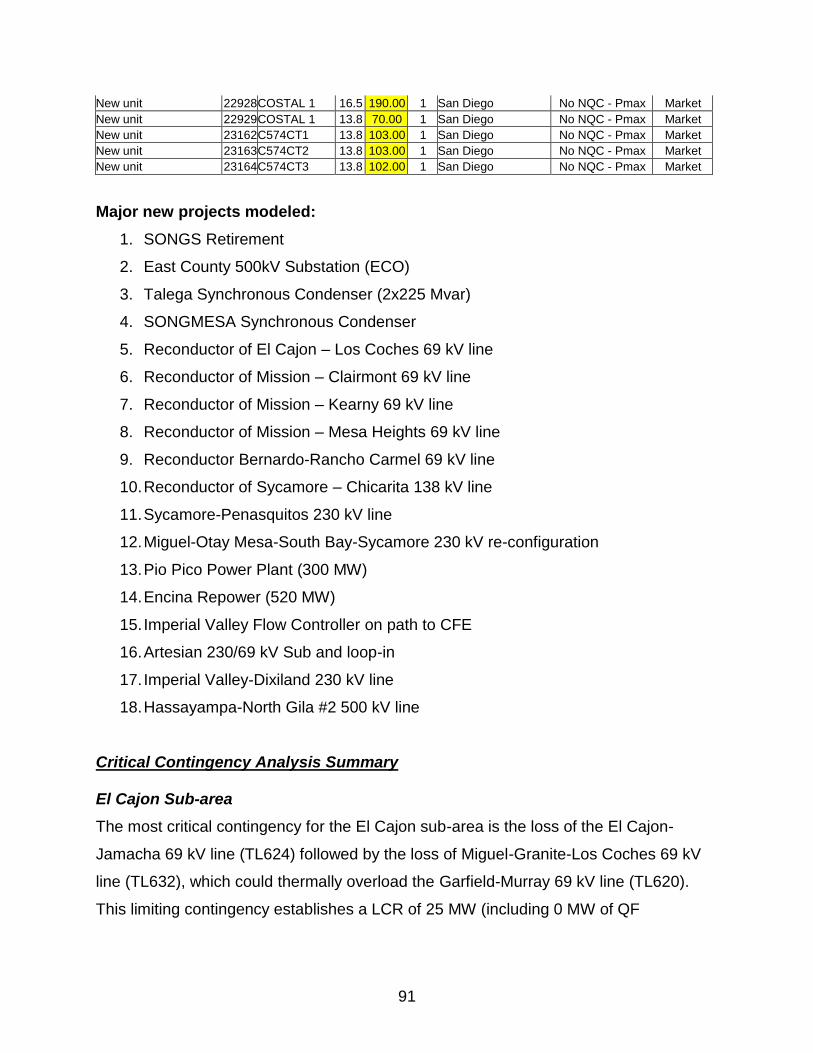
91
New unit 22928 COSTAL 1 16.5 190.00 1 San Diego No NQC - Pmax Market
New unit 22929 COSTAL 1 13.8 70.00 1 San Diego No NQC - Pmax Market
New unit 23162 C574CT1 13.8 103.00 1 San Diego No NQC - Pmax Market
New unit 23163 C574CT2 13.8 103.00 1 San Diego No NQC - Pmax Market
New unit 23164 C574CT3 13.8 102.00 1 San Diego No NQC - Pmax Market
Major new projects modeled:
1. SONGS Retirement
2. East County 500kV Substation (ECO)
3. Talega Synchronous Condenser (2x225 Mvar)
4. SONGMESA Synchronous Condenser
5. Reconductor of El Cajon – Los Coches 69 kV line
6. Reconductor of Mission – Clairmont 69 kV line
7. Reconductor of Mission – Kearny 69 kV line
8. Reconductor of Mission – Mesa Heights 69 kV line
9. Reconductor Bernardo-Rancho Carmel 69 kV line
10. Reconductor of Sycamore – Chicarita 138 kV line
11. Sycamore-Penasquitos 230 kV line
12. Miguel-Otay Mesa-South Bay-Sycamore 230 kV re-configuration
13. Pio Pico Power Plant (300 MW)
14. Encina Repower (520 MW)
15. Imperial Valley Flow Controller on path to CFE
16. Artesian 230/69 kV Sub and loop-in
17. Imperial Valley-Dixiland 230 kV line
18. Hassayampa-North Gila #2 500 kV line
Critical Contingency Analysis Summary
El Cajon Sub-area
The most critical contingency for the El Cajon sub-area is the loss of the El Cajon-
Jamacha 69 kV line (TL624) followed by the loss of Miguel-Granite-Los Coches 69 kV
line (TL632), which could thermally overload the Garfield-Murray 69 kV line (TL620).
This limiting contingency establishes a LCR of 25 MW (including 0 MW of QF

92
generation) in 2019 as the minimum generation capacity necessary for reliable load
serving capability within this sub-area.
Effectiveness factors:
All units within this sub-area (El Cajon CalPeak, El Cajon GT and El Cajon Energy
Center) have the same effectiveness factor.
Mission Sub-area
The most critical contingency for the Mission sub-area is the loss of Mission - Kearny 69
kV line (TL663) followed by the loss of Mission – Mesa Heights 69kV line (TL676),
which could thermally overload the Clairmont-Clairmont Tap 69kV line (TL600). This
limiting contingency establishes a local capacity need of 43 MW (including 4 MW of QF
generation and 39 MW of deficiency) in 2019 as the minimum generation capacity
necessary for reliable load serving capability within this sub-area.
It is recommended to retain the Kearny peakers, generating facilities until the limiting
component is eliminated.
Effectiveness factors:
All Kearny Peakers have the same effectiveness factor.
Bernardo Sub-area
A newly approved Artesian 230 kV substation project (expected to be in-service in
2016) will eliminate the local capacity need in this sub-area.
Esco Sub-area
The most critical contingency for the Esco sub-area is the loss of Poway-Pomerado 69
kV line (TL6913) followed by the loss of Bernardo – Rancho Carmel 69 kV line, which
could thermally overload the Esco-Escondido 69kV line (TL6908). This limiting
contingency establishes a local capacity need of 85 MW in 2018 (includes 38 MW of QF
93
generation and 47 MW deficiency) as the minimum capacity necessary for reliable load
serving capability within this sub-area.
Effectiveness factors:
The only unit within this area (Goal line) is needed therefore no effectiveness factor is
required.
Escondido Sub-area
Reconductor project for the Bernardo – Rancho Carmel 69 kV line was approved in
2011-2012 planning cycle (expected in-service date – 2015). This transmission project
will eliminate the local capacity need in this sub-area.
Pala Sub-area
The most critical contingency for the Pala sub-area is the loss of Pendleton – San Luis
Rey 69kV line (TL6912) followed by the loss of Lilac - Pala 69kV line (TL6932), which
could thermally overload the Monserate – Morro Hill Tap 69 kV line (TL694). This
limiting contingency establishes a local capacity need of 45 MW in 2019 (includes 0 MW
of QF generation) as the minimum capacity necessary for reliable load serving
capability within this sub-area.
Effectiveness factors:
All units within this area (Pala) have the same effectiveness factor.
Border Sub-area
The most critical contingency for the Border sub-area is the loss of Bay Boulevard –
Otay 69kV line #1 (TL645) followed by Bay Boulevard Otay – 69kV line #2 (TL646),
which could thermally overload the Imperial Beach – Bay Boulevard 69 kV line (TL647).
This limiting contingency establishes a local capacity need of 60 MW in 2019 (includes
5 MW of QF generation) as the minimum capacity necessary for reliable load serving
capability within this sub-area.

94
Effectiveness factors:
All units within this area have the same effectiveness factor.
Miramar Sub-area
The most critical contingency for the Miramar sub-area is the loss of Otay Mesa –
Miguel Tap – Silvergate 230kV line (TL23042) followed by the loss of Sycamore
230/138 kV Bank #60, which could thermally overload the Sycamore - Scripps 69 kV
line (TL6916). This limiting contingency establishes a LCR of 140 MW (including 0 MW
of QF generation as well as 44 MW of deficiency) in 2014 as the minimum generation
capacity necessary for reliable load serving capability within this sub-area.
The most critical single contingency for the Miramar Sub-area is the loss of Otay Mesa-
Miguel Tap-South Bay 230 kV line with Miramar Energy Facility #1 or #2 out of service,
which could thermally overload the Sycamore-Scripps 69 kV line (TL6916). This limiting
contingency establishes a local capacity need of 99 MW (including 0 MW of QF
generation and 3 MW deficiency) in 2018 as the minimum capacity necessary for
reliable load serving capability within this sub-area.
The deficiency arises due to assumed retirement of 2 existing Miramar GT’s. It is
recommended to retain the Miramar GTs (Cabrillo Power II) until the most limiting
contingency is mitigated.
Effectiveness factors:
All units within this area (Miramar Energy Facility #1 and #2) have the same
effectiveness factor.
San Diego Sub-area:
The most limiting contingency in the San Diego sub-area is the N-1-1 contingency of
Ocotillo – Suncrest 500 kV line followed by the contingency of Miguel – ECO 500 kV
line or vice versa, which could potentially lead to post-transient voltage instability
concern in the San Diego sub-area and LA Basin area. This contingency establishes a
95
LCR of 2508 MW in 2019 (includes 164 MW of QF and 9 MW of wind generation) as the
minimum generation capacity necessary for reliable load serving capability within this
sub-area. The Imperial power flow controller project on path to CFE was approved in
the 2013~2014 Transmission Planning cycle and was used to control the loop flow
through CFE system, avoid the SPS cross tripping TL23040 or TL23050 tie with CFE,
and consequently reduce the LCR need in the sub-area for the N-1-1 contingency.
Effectiveness factors:
All units within this sub-area have the same effectiveness factor.
Greater San Diego-Imperial Valley overall:
The most limiting contingency in the Greater Imperial Valley-San Diego area is the loss
of 500 kV Southwest Power Link (SWPL) between Imperial Valley and N. Gila
Substations with Otay Mesa Combined-Cycle Power plant (603 MW) out of service,
which could potentially lead to post-transient voltage instability concern in the San
Diego-Imperial Valley and LA Basin areas. This limiting contingency establishes a local
capacity need of 3,160 MW in 2019 (includes 164 MW of QF and 55 MW of wind
generation) as the minimum capacity necessary for reliable load serving capability
within this area.
As mentioned in the study assumptions, IID’s new Dixieland 230 kV substation and the
new Imperial Valley-Dixieland 230 kV line were modeled in the 2019 base case, and
consequently reduced the LCR need in the area for this contingency.
Effectiveness factors:
All units within this area have the same effectiveness factor.
Changes compared to last year’s results:
Compared with 2017 the load forecast decreased by 125 MW and the LCR need
reduced by about 73 MW.

96
Greater San Diego-Imperial Valley Overall Requirements:
2019 QF (MW)
Wind (MW)
Market (MW)
Max. Qualifying Capacity (MW)
Available generation 164 55 4004 4223
2019 Existing Generation Capacity Needed (MW)
Deficiency (MW)
Total MW Requirement
Category B (Single)23
3160 3 3163
Category C (Multiple) 24
3160 130 3290
11. Valley Electric Area
Area Definition The transmission tie lines into the area include:
1) Amargosa-Sandy 138 kV line 2) Jackass Flats-Mercury Switch 138 kV line 3) Mercury Switch – Mercury 138kV line 4) Mead-Bob Switchyard 230 kV line 5) Northwest-Desert View 230 kV line 6) Innovation-Mercury 138 kV line 7) Bob Switchyard-SCE Eldorado 230 kV line
The substations that delineate the area are:
1) Amargosa is out Sandy is in 2) Jackass Flats is a shared bus between CAISO and NVE 3) Mercury Switch is a shared bus between CAISO and NVE 4) Mead is out Bob Switchyard is in 5) Northwest is out Desert View is in 6) Mercury is out Innovation is in 7) SCE Eldorado is out Bob Switchyard is in
23
A single contingency means that the system will be able the survive the loss of a single element,
however the operators will not have any means (other than load drop) in order to bring the system within
a safe operating zone and get prepared for the next contingency as required by MORC. 24
Multiple contingencies means that the system will be able the survive the loss of a single element, and
the operators will have enough generation (other operating procedures) in order to bring the system
within a safe operating zone and get prepared for the next contingency as required by MORC.
97
Total 2019 busload within the defined area was: 152 MW along with 3 MW of
transmission losses resulting in total load + losses of 155 MW.
There is no generation and qualifying capacity available in this area.
Major new transmission projects modeled:
1. SCE Eldorado-Bob Switchyard 230 kV Line #1
2. Bob Tap 230 kV Switchyard
3. Innovation-Mercury 138 kV line
4. Innovation 230 kV Switchyard
5. Charleston-Vista 138 kV line
Critical Contingency Analysis Summary Valley Electric Association LCR area has been eliminated on the basis of the following
results:
No generation exists in this area
No category B issues were observed in this area
Category C and beyond –
o No common-mode N-2 issues were observed
o No issues were observed for category B outage followed by a common-
mode N-2 outage
o All the N-1-1 issues that were observed can either be mitigated by the
existing UVLS or by an operating procedure
Changes compared to last year’s results:
This area is eliminated due to the reasons cited above. DOE load at Jackass Flat is now
reflected at part of total VEA load. VEA UVLS model was incorporated in the
contingency analysis. CAISO operating procedure 7910 is now in effect and addresses
some category C issues.