2016 Annual Results Presentation - Tourism Holdings … · Unforgettable experiences. Sustaining...
48
Unforgettable experiences. Sustaining success. FY16: Full Year Results Presentation and Shareholder Review 23 August 2016
Transcript of 2016 Annual Results Presentation - Tourism Holdings … · Unforgettable experiences. Sustaining...
Unforgettable experiences. Sustaining success.
FY16: Full Year Results Presentationand Shareholder Review23 August 2016
DISCLAIMER
2
The information in this presentation dated 23 August 2016 may contain forward-looking statements and projections. These reflect thl’s current expectations, based on what it thinks are reasonable assumptions. However, for any number of reasons the future could be different and the assumptions on which the forward-looking statements and projections are based could be wrong. thl gives no warranty or representation as to its future financial performance or any future matter. Except as required by law or NZX listing rules, thl is not obliged to update this presentation after its release, even if things change materially.
This presentation may contain a number of non-GAAP financial measures. Because they are not defined by GAAP or IFRS, thl’s calculation of these measures may differ from similarly titled measures presented by other companies and they should not be considered in isolation from, or construed as an alternative to, other financial measures determined in accordance with GAAP.
This presentation does not take into account any specific investors objectives, and does not constitute financial or investment advice. Investors are encouraged to make an independent assessment of thl.
The information contained in this presentation should be read in conjunction with thl’s latest financial statements, which are available at: www.thlonline.com
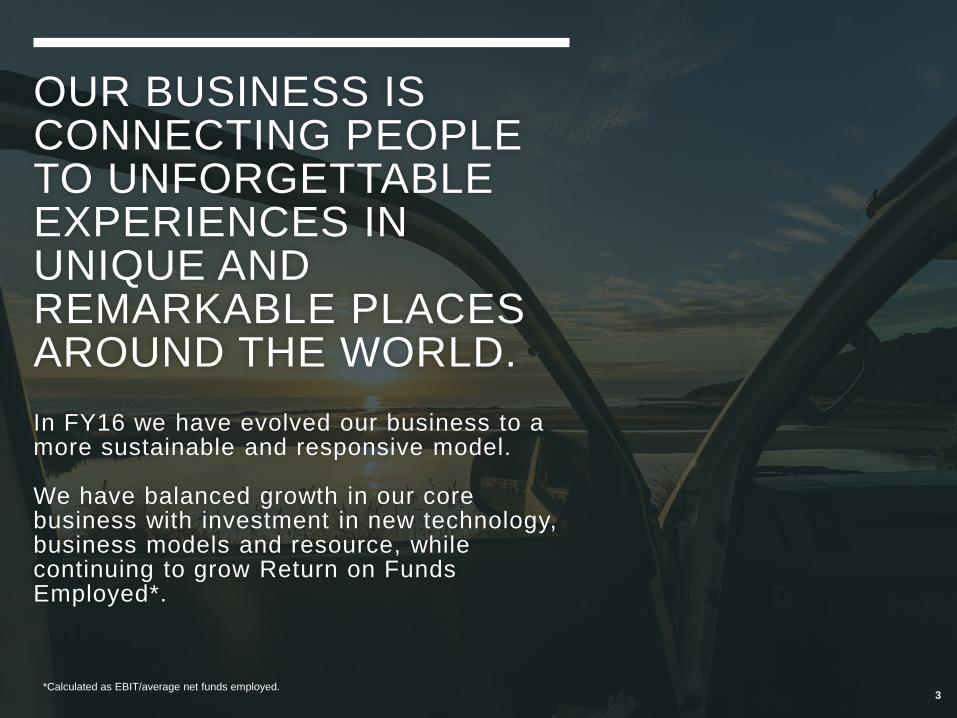
OUR BUSINESS IS CONNECTING PEOPLE TO UNFORGETTABLE EXPERIENCES IN UNIQUE AND REMARKABLE PLACES AROUND THE WORLD.
In FY16 we have evolved our business to a more sustainable and responsive model.
We have balanced growth in our core business with investment in new technology, business models and resource, while continuing to grow Return on Funds Employed*.
3*Calculated as EBIT/average net funds employed.

4
Overall the result for the year should be seen as positive progress for the company.
The performance of the business continues to be enhanced across all activities and markets. This is an ongoing process of improvement in the experiences we provide and the profitability and sustainability of the business.
Shareholders can expect continued growth in value and returns from this process.
I look forward to engaging with shareholders at the Annual Meeting in October.
RegardsRob Campbell
CHAIRMAN’S INTRODUCTION

5
The thl business has changed dramatically over the past few years (it needed to) and yet we still have significant potential and are only starting to unlock the opportunities.
The following are some key points of note regarding the last financial year from my perspective:
• We have delivered improved EBIT margins (pre group support costs) .
• The improvement in ROFE is positive and should continue to grow, albeit likely at the expense of EBIT margin in some parts of the business.
• Sustaining dividends at current or higher levels is a key focus for the company.
• The balance sheet position is positive given the increase in “flex fleet” in Australia and NZ which should be viewed from an investment perspective as “stock” or working capital. Net Debt at $79M is, in our view, very acceptable.
• Sustainability is a word being used more in the business and the context for thl needs to include a focus on improving the customer proposition, tourism and shareholder community. We are doing good work on issues such as freedom camping, tourist driver behaviour and health and safety and we need to ensure we remain proactive in such matters.
• There are some gains in the result from exchange rate movements in the translation of earnings, in particular the USA result. These have been detailed in this review.
• The increase in group support costs reflects the new initiatives such as Mighway and the increase in senior leadership headcount and capability.
CEO’S INTRODUCTION

6
Taking a broader industry and global view, we can see where our competencies can be leveraged for growth, but in a smarter manner than the past. Within this presentation we detail the business model today and how we are adapting for improved future results.
We have several key internal themes for the year all starting with the word DELIVER. We know what needs to be achieved and are well on the way.
We have improved our accountability focus as an organisation. We continue to improve our resilience, which will deliver a better outcome for all our stakeholders.
The presentation that follows is designed to provide the requisite balance of review of the past year, with a higher level overview of where we are going and our operating focus and direction for the coming 12 months.
Regards Grant Webster
CEO’S INTRODUCTION (CONT.)

FINANCIAL HIGHLIGHTS
7
REVENUE
$279MUP
18%
ROFE (AVERAGE FUNDS)*
15.1%UP FROM
12.9%
EARNINGS BEFOREINTEREST AND TAX
$38.7MUP
20%
AVERAGE NET FUNDS EMPLOYED
$256MUP
$8M
FULL YEAR DIVIDEND
19cps (50% imputed)
UP FROM
15cps (50% imputed)
All financials in NZ Dollars unless stated otherwise (throughout presentation)
All comparisons are against prior corresponding period
* ROFE = Return On Funds Employed. Measured as EBIT/average net funds employed.
NET PROFIT AFTER TAX
$24.4MUP
21%
Dividend split was 9cps in April 2016 and
10cps to be paid in October 2016.

TRENDS
8
15
23
32
39
FY13 FY14 FY15 FY16
EBIT
6.5%
10.1%
13.7%13.9%
FY13 FY14 FY15 FY16
EBIT Margin
58.9 60.365.5
73.6
FY13 FY14 FY15 FY16
EBITDA
3.8
11.1
20.1
24.4
FY13 FY14 FY15 FY16
NPAT
5.2%
8.6%
12.9%15.1%
FY13 FY14 FY15 FY16
Group ROFE(average funds)
225 226 237
279
FY13 FY14 FY15 FY16
Revenue
FINANCIAL HIGHLIGHTS
9
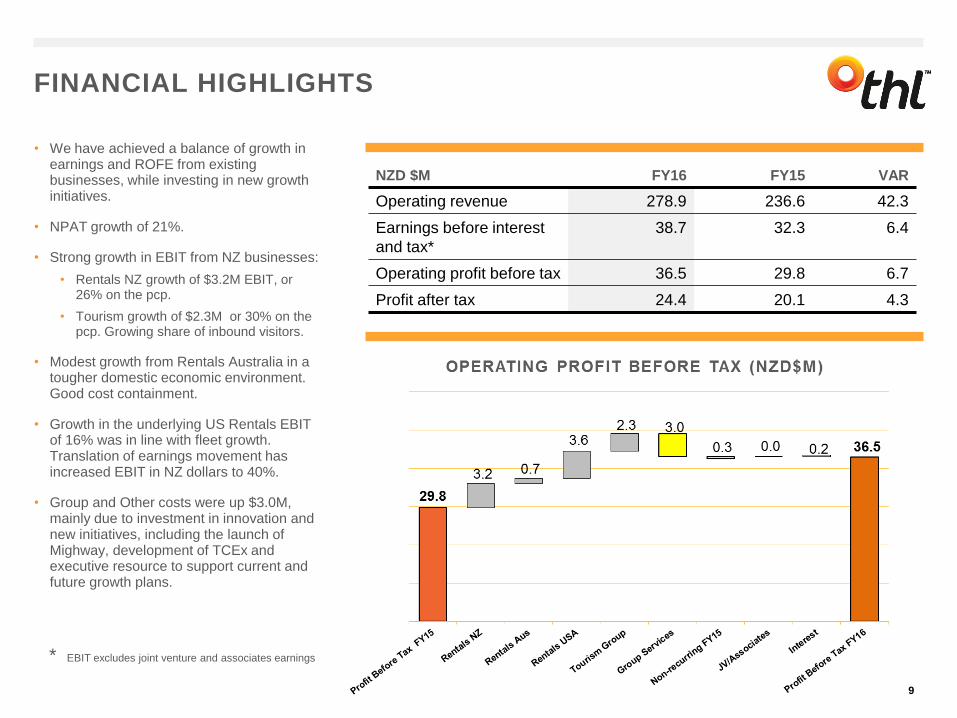
• We have achieved a balance of growth in earnings and ROFE from existing businesses, while investing in new growth initiatives.
• NPAT growth of 21%.
• Strong growth in EBIT from NZ businesses:
• Rentals NZ growth of $3.2M EBIT, or 26% on the pcp.
• Tourism growth of $2.3M or 30% on the pcp. Growing share of inbound visitors.
• Modest growth from Rentals Australia in a tougher domestic economic environment. Good cost containment.
• Growth in the underlying US Rentals EBIT of 16% was in line with fleet growth. Translation of earnings movement has increased EBIT in NZ dollars to 40%.
• Group and Other costs were up $3.0M, mainly due to investment in innovation and new initiatives, including the launch of Mighway, development of TCEx and executive resource to support current and future growth plans.
NZD $M FY16 FY15 VAR
Operating revenue 278.9 236.6 42.3
Earnings before interest
and tax*
38.7 32.3 6.4
Operating profit before tax 36.5 29.8 6.7
Profit after tax 24.4 20.1 4.3
* EBIT excludes joint venture and associates earnings
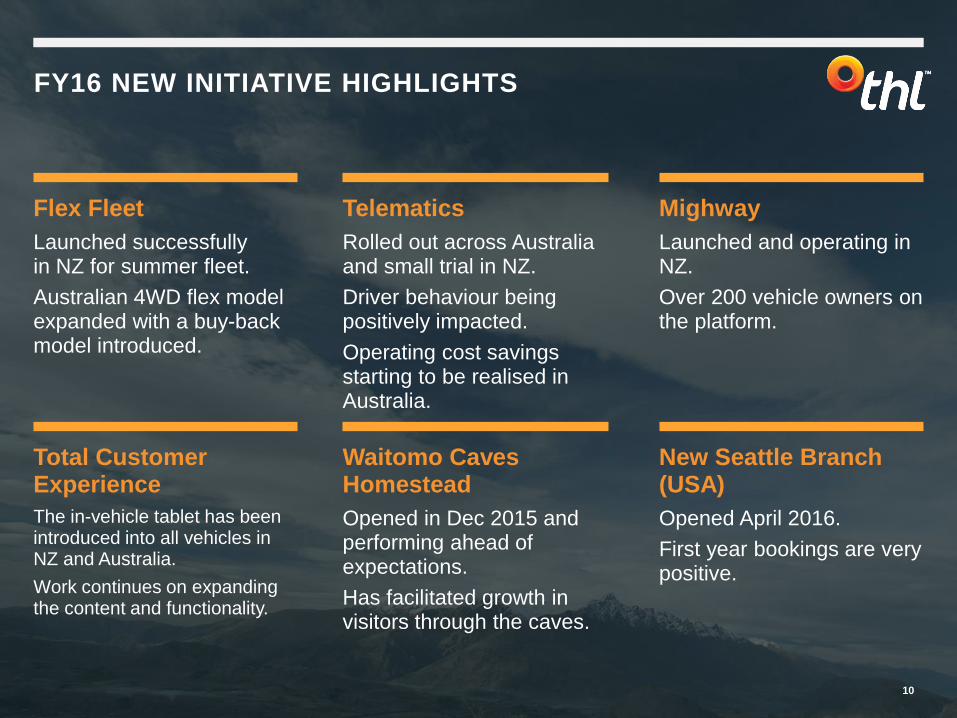
FY16 NEW INITIATIVE HIGHLIGHTS
10
Flex Fleet
Launched successfully in NZ for summer fleet.
Australian 4WD flex model expanded with a buy-back model introduced.
Telematics
Rolled out across Australia and small trial in NZ.
Driver behaviour being positively impacted.
Operating cost savings starting to be realised in Australia.
Mighway
Launched and operating in NZ.
Over 200 vehicle owners on the platform.
Total Customer Experience
The in-vehicle tablet has been introduced into all vehicles in NZ and Australia.
Work continues on expanding the content and functionality.
Waitomo Caves Homestead
Opened in Dec 2015 and performing ahead of expectations.
Has facilitated growth in visitors through the caves.
New Seattle Branch (USA)
Opened April 2016.
First year bookings are very positive.
RETURN ON AVERAGE FUNDS EMPLOYED*
11
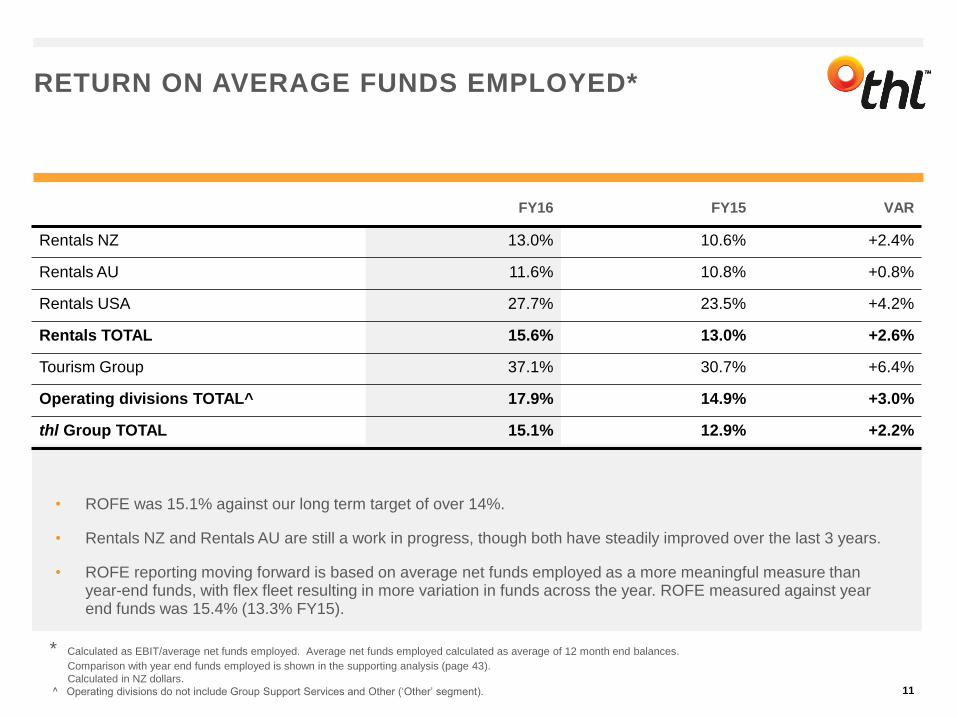
• ROFE was 15.1% against our long term target of over 14%.
• Rentals NZ and Rentals AU are still a work in progress, though both have steadily improved over the last 3 years.
• ROFE reporting moving forward is based on average net funds employed as a more meaningful measure than year-end funds, with flex fleet resulting in more variation in funds across the year. ROFE measured against year end funds was 15.4% (13.3% FY15).
FY16 FY15 VAR
Rentals NZ 13.0% 10.6% +2.4%
Rentals AU 11.6% 10.8% +0.8%
Rentals USA 27.7% 23.5% +4.2%
Rentals TOTAL 15.6% 13.0% +2.6%
Tourism Group 37.1% 30.7% +6.4%
Operating divisions TOTAL^ 17.9% 14.9% +3.0%
thl Group TOTAL 15.1% 12.9% +2.2%
* Calculated as EBIT/average net funds employed. Average net funds employed calculated as average of 12 month end balances.
Comparison with year end funds employed is shown in the supporting analysis (page 43).
Calculated in NZ dollars.
^ Operating divisions do not include Group Support Services and Other (‘Other’ segment).
DIVIDEND
12
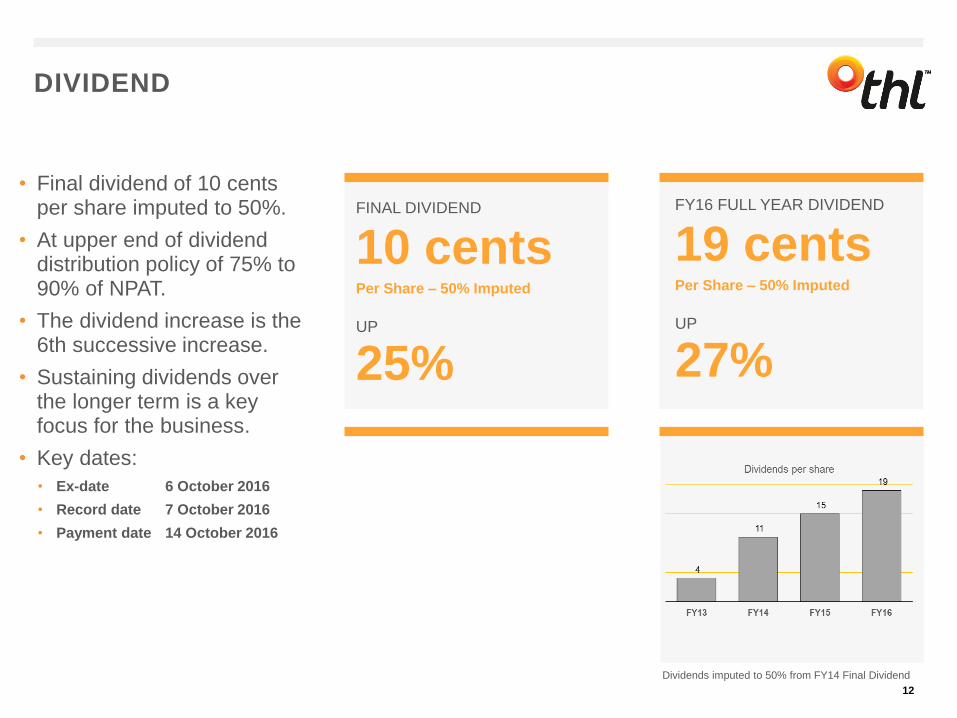
FINAL DIVIDEND
10 cents Per Share – 50% Imputed
UP
25%
FY16 FULL YEAR DIVIDEND
19 cents Per Share – 50% Imputed
UP
27%
• Final dividend of 10 cents per share imputed to 50%.
• At upper end of dividend distribution policy of 75% to 90% of NPAT.
• The dividend increase is the 6th successive increase.
• Sustaining dividends over the longer term is a key focus for the business.
• Key dates:
• Ex-date 6 October 2016
• Record date 7 October 2016
• Payment date 14 October 2016
Dividends imputed to 50% from FY14 Final Dividend
13
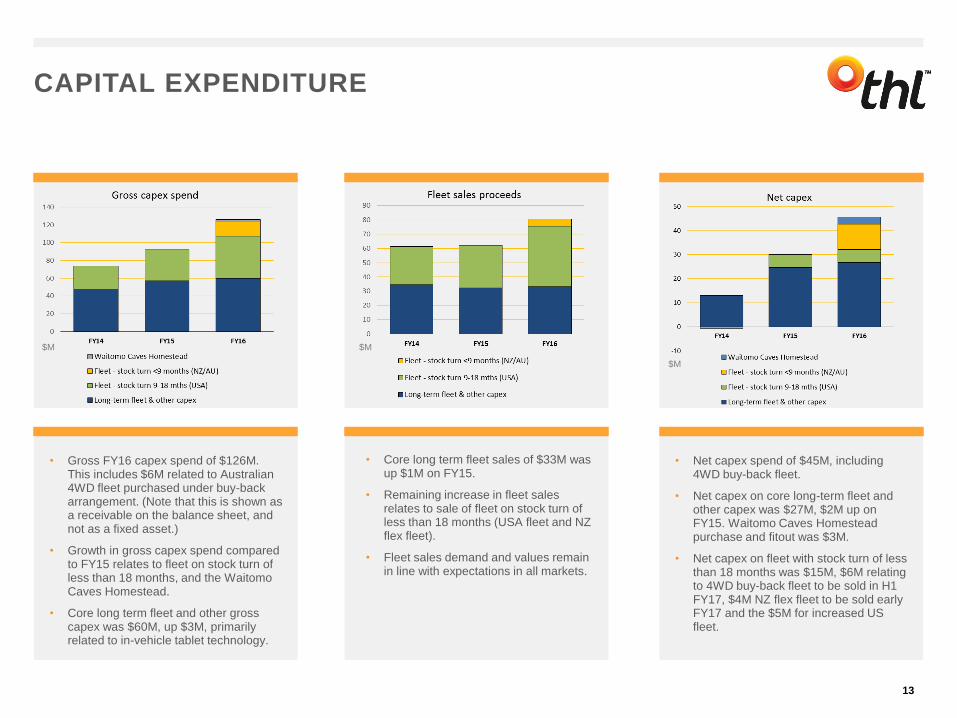
• Gross FY16 capex spend of $126M. This includes $6M related to Australian 4WD fleet purchased under buy-back arrangement. (Note that this is shown as a receivable on the balance sheet, and not as a fixed asset.)
• Growth in gross capex spend compared to FY15 relates to fleet on stock turn of less than 18 months, and the Waitomo Caves Homestead.
• Core long term fleet and other gross capex was $60M, up $3M, primarily related to in-vehicle tablet technology.
• Core long term fleet sales of $33M was up $1M on FY15.
• Remaining increase in fleet sales relates to sale of fleet on stock turn of less than 18 months (USA fleet and NZ flex fleet).
• Fleet sales demand and values remain in line with expectations in all markets.
• Net capex spend of $45M, including 4WD buy-back fleet.
• Net capex on core long-term fleet and other capex was $27M, $2M up on FY15. Waitomo Caves Homestead purchase and fitout was $3M.
• Net capex on fleet with stock turn of less than 18 months was $15M, $6M relating to 4WD buy-back fleet to be sold in H1 FY17, $4M NZ flex fleet to be sold early FY17 and the $5M for increased US fleet.
CAPITAL EXPENDITURE
$M $M
$M
BALANCE SHEET
14
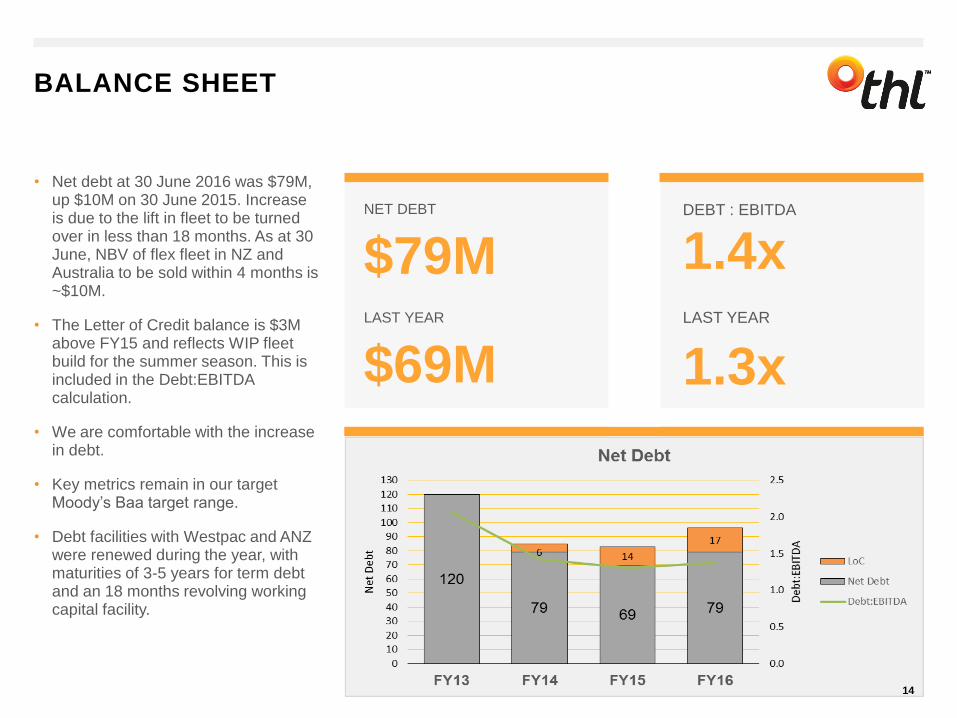
NET DEBT
$79MLAST YEAR
$69M
DEBT : EBITDA
1.4xLAST YEAR
1.3x
• Net debt at 30 June 2016 was $79M, up $10M on 30 June 2015. Increase is due to the lift in fleet to be turned over in less than 18 months. As at 30 June, NBV of flex fleet in NZ and Australia to be sold within 4 months is ~$10M.
• The Letter of Credit balance is $3M above FY15 and reflects WIP fleet build for the summer season. This is included in the Debt:EBITDAcalculation.
• We are comfortable with the increase in debt.
• Key metrics remain in our target Moody’s Baa target range.
• Debt facilities with Westpac and ANZ were renewed during the year, with maturities of 3-5 years for term debt and an 18 months revolving working capital facility.

DIVISIONAL REVIEW
15
DIVISIONAL EBIT
16
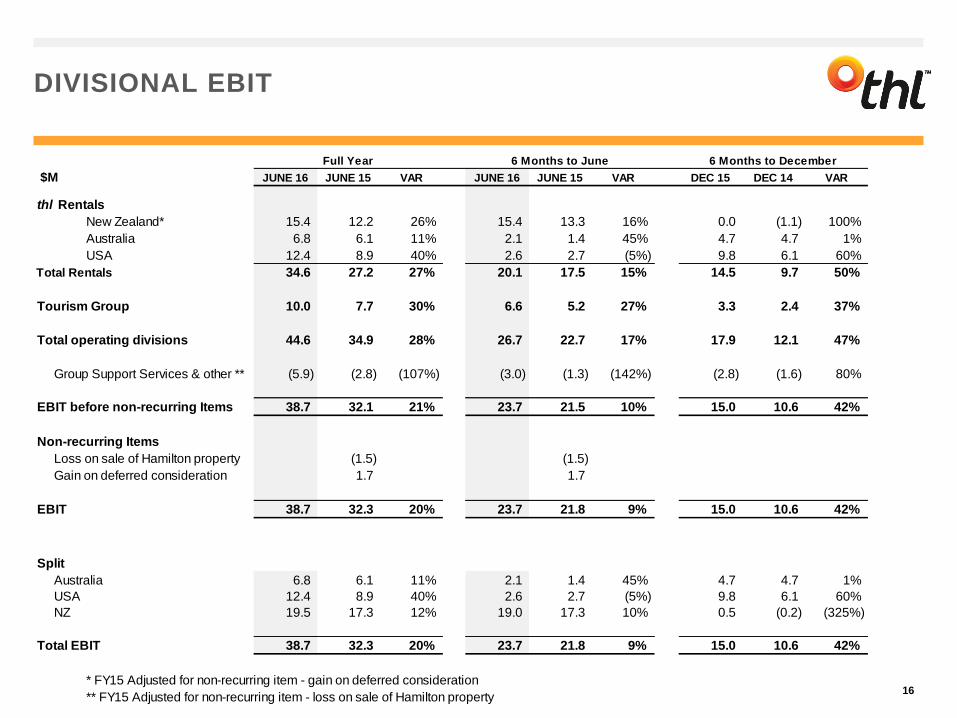
; $M JUNE 16 JUNE 15 VAR JUNE 16 JUNE 15 VAR DEC 15 DEC 14 VAR
thl Rentals
New Zealand* 15.4 12.2 26% 15.4 13.3 16% 0.0 (1.1) 100%
Australia 6.8 6.1 11% 2.1 1.4 45% 4.7 4.7 1%
USA 12.4 8.9 40% 2.6 2.7 (5%) 9.8 6.1 60%
Total Rentals 34.6 27.2 27% 20.1 17.5 15% 14.5 9.7 50%
Tourism Group 10.0 7.7 30% 6.6 5.2 27% 3.3 2.4 37%
Total operating divisions 44.6 34.9 28% 26.7 22.7 17% 17.9 12.1 47%
Group Support Services & other ** (5.9) (2.8) (107%) (3.0) (1.3) (142%) (2.8) (1.6) 80%
EBIT before non-recurring Items 38.7 32.1 21% 23.7 21.5 10% 15.0 10.6 42%
Non-recurring Items
Loss on sale of Hamilton property (1.5) (1.5)
Gain on deferred consideration 1.7 1.7
EBIT 38.7 32.3 20% 23.7 21.8 9% 15.0 10.6 42%
Split
Australia 6.8 6.1 11% 2.1 1.4 45% 4.7 4.7 1%
USA 12.4 8.9 40% 2.6 2.7 (5%) 9.8 6.1 60%
NZ 19.5 17.3 12% 19.0 17.3 10% 0.5 (0.2) (325%)
Total EBIT 38.7 32.3 20% 23.7 21.8 9% 15.0 10.6 42%
* FY15 Adjusted for non-recurring item - gain on deferred consideration
** FY15 Adjusted for non-recurring item - loss on sale of Hamilton property
6 Months to DecemberFull Year 6 Months to June

RENTALS NZ
17
Moving Ahead
• A successful first season of flex fleet and positive tourism dynamics have resulted in good EBIT growth and improvement in margin and ROFE.
• Our RV Supercentres (retail and service) in Auckland and Christchurch have increased the contribution from non-fleet sales and service by 72%. We see strong growth prospects for this part of the business.
• Online RV accessory store launched and demand is growing.
• Demand for motorhome sales has been strong. Vehicle sales volumes in total were up 24% (including flex fleet buy-backs).
• Flex fleet lifted peak fleet by approximately 8% and enabled year end fleet to be down 3% on pcp.
• Both the rental and sales market outlooks remain positive. The end of FY17 will see the start of the Lions Tour which is expected to provide strong FY18 H1 growth.
Full Year
NZD $M FY16 FY15* VAR %
Rental income 68.4 60.8 7.6 13%
Sale of goods 35.5 29.2 6.3 22%
Costs 88.5 77.8 (10.7) (14%)
EBIT 15.4 12.2 3.2 26%
Vehicle Fleet
UNITS: FY16 FY15 VAR %
Fleet Sales 517 416 101 24%
Fleet Purchases 470 300 170 57%
Closing Fleet 1,740 1,787 (47) (3%)
WIP Fleet 158 156
* FY15 adjusted for non-recurring item – gain on deferred consideration $1.7M
RENTALS AU
18
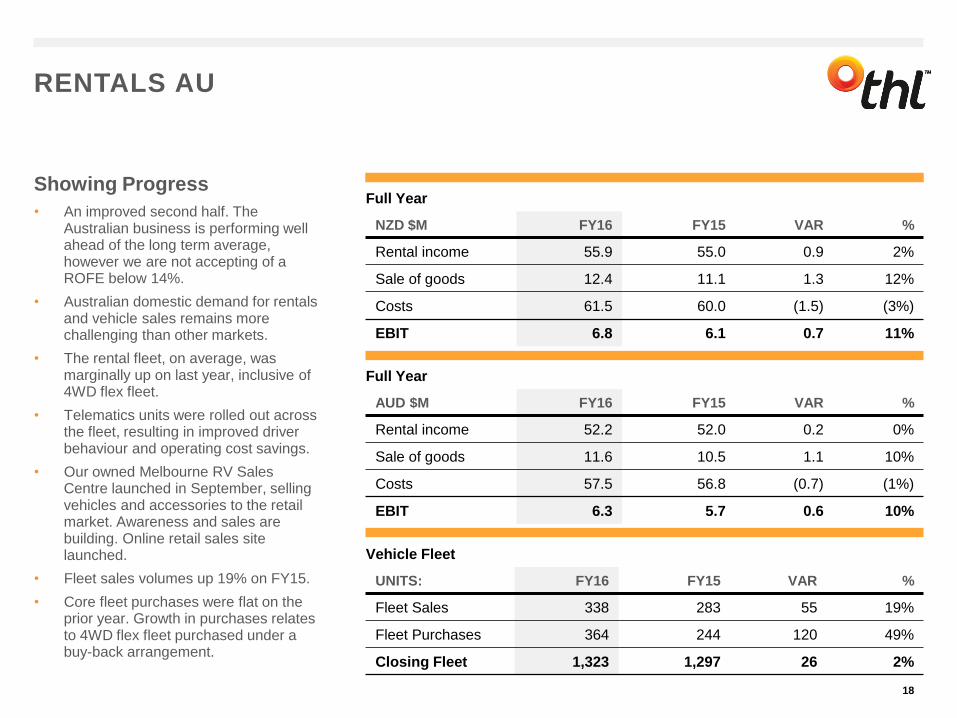
Showing Progress
• An improved second half. The Australian business is performing well ahead of the long term average, however we are not accepting of a ROFE below 14%.
• Australian domestic demand for rentals and vehicle sales remains more challenging than other markets.
• The rental fleet, on average, was marginally up on last year, inclusive of 4WD flex fleet.
• Telematics units were rolled out across the fleet, resulting in improved driver behaviour and operating cost savings.
• Our owned Melbourne RV Sales Centre launched in September, selling vehicles and accessories to the retail market. Awareness and sales are building. Online retail sales site launched.
• Fleet sales volumes up 19% on FY15.
• Core fleet purchases were flat on the prior year. Growth in purchases relates to 4WD flex fleet purchased under a buy-back arrangement.
Full Year
NZD $M FY16 FY15 VAR %
Rental income 55.9 55.0 0.9 2%
Sale of goods 12.4 11.1 1.3 12%
Costs 61.5 60.0 (1.5) (3%)
EBIT 6.8 6.1 0.7 11%
Vehicle Fleet
UNITS: FY16 FY15 VAR %
Fleet Sales 338 283 55 19%
Fleet Purchases 364 244 120 49%
Closing Fleet 1,323 1,297 26 2%
Full Year
AUD $M FY16 FY15 VAR %
Rental income 52.2 52.0 0.2 0%
Sale of goods 11.6 10.5 1.1 10%
Costs 57.5 56.8 (0.7) (1%)
EBIT 6.3 5.7 0.6 10%
Full Year
USD $M FY16 FY15 VAR %
Rental income 19.1 17.0 2.1 12%
Sale of goods 28.8 23.3 5.5 24%
Costs 39.4 33.0 (6.4) (19%)
EBIT 8.5 7.3 1.2 16%
RENTALS USA
19
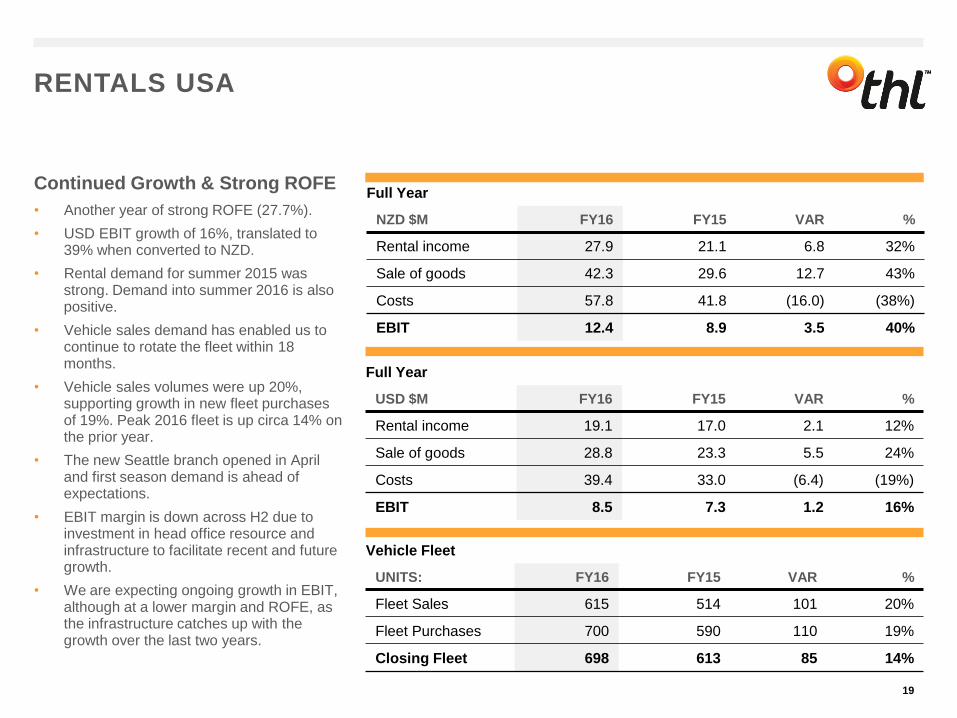
Continued Growth & Strong ROFE
• Another year of strong ROFE (27.7%).
• USD EBIT growth of 16%, translated to 39% when converted to NZD.
• Rental demand for summer 2015 was strong. Demand into summer 2016 is also positive.
• Vehicle sales demand has enabled us to continue to rotate the fleet within 18 months.
• Vehicle sales volumes were up 20%, supporting growth in new fleet purchases of 19%. Peak 2016 fleet is up circa 14% on the prior year.
• The new Seattle branch opened in April and first season demand is ahead of expectations.
• EBIT margin is down across H2 due to investment in head office resource and infrastructure to facilitate recent and future growth.
• We are expecting ongoing growth in EBIT, although at a lower margin and ROFE, as the infrastructure catches up with the growth over the last two years.
Vehicle Fleet
UNITS: FY16 FY15 VAR %
Fleet Sales 615 514 101 20%
Fleet Purchases 700 590 110 19%
Closing Fleet 698 613 85 14%
Full Year
NZD $M FY16 FY15 VAR %
Rental income 27.9 21.1 6.8 32%
Sale of goods 42.3 29.6 12.7 43%
Costs 57.8 41.8 (16.0) (38%)
EBIT 12.4 8.9 3.5 40%
TOURISM GROUP
20
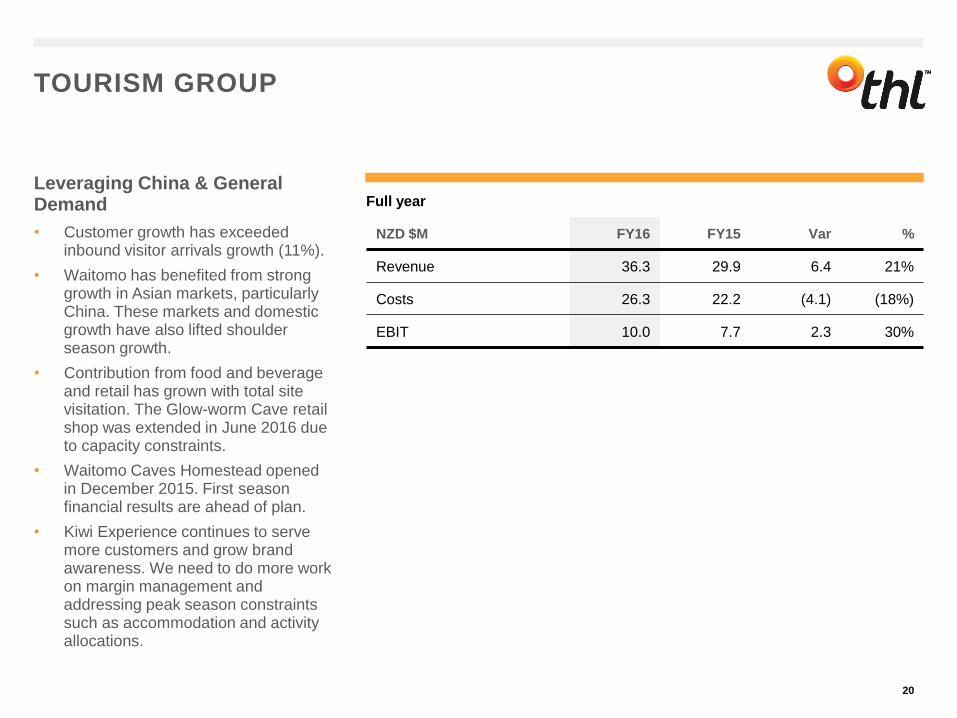
Leveraging China & General Demand
• Customer growth has exceeded inbound visitor arrivals growth (11%).
• Waitomo has benefited from strong growth in Asian markets, particularly China. These markets and domestic growth have also lifted shoulder season growth.
• Contribution from food and beverage and retail has grown with total site visitation. The Glow-worm Cave retail shop was extended in June 2016 due to capacity constraints.
• Waitomo Caves Homestead opened in December 2015. First season financial results are ahead of plan.
• Kiwi Experience continues to serve more customers and grow brand awareness. We need to do more work on margin management and addressing peak season constraints such as accommodation and activity allocations.
Full year
NZD $M FY16 FY15 Var %
Revenue 36.3 29.9 6.4 21%
Costs 26.3 22.2 (4.1) (18%)
EBIT 10.0 7.7 2.3 30%
GROUP SUPPORT SERVICES AND OTHER
21
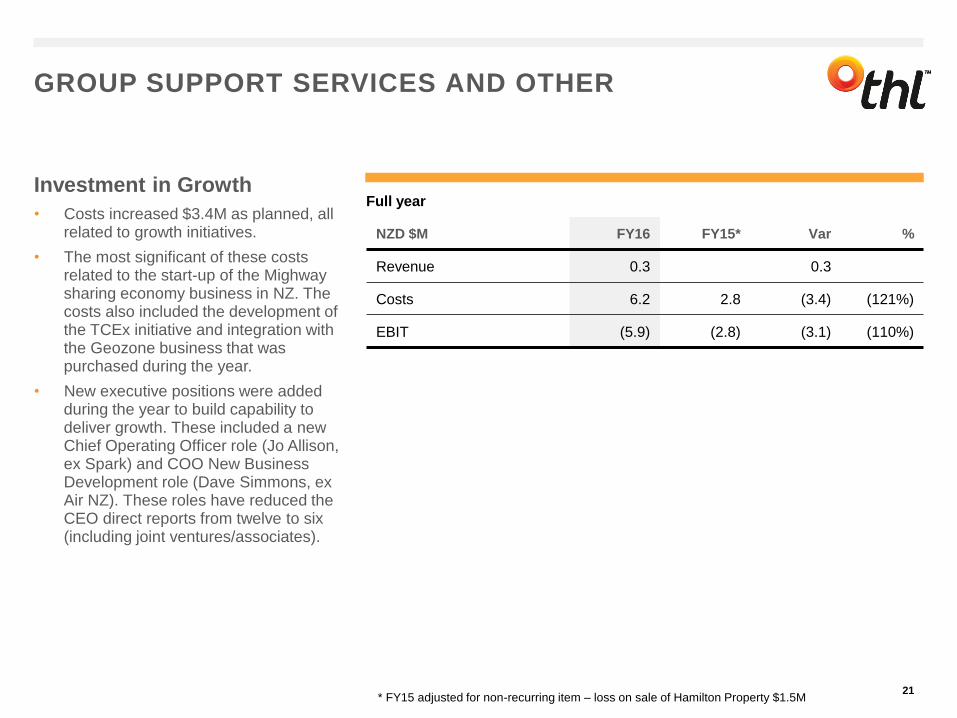
Investment in Growth
• Costs increased $3.4M as planned, all related to growth initiatives.
• The most significant of these costs related to the start-up of the Mighwaysharing economy business in NZ. The costs also included the development of the TCEx initiative and integration with the Geozone business that was purchased during the year.
• New executive positions were added during the year to build capability to deliver growth. These included a new Chief Operating Officer role (Jo Allison, ex Spark) and COO New Business Development role (Dave Simmons, ex Air NZ). These roles have reduced the CEO direct reports from twelve to six (including joint ventures/associates).
Full year
NZD $M FY16 FY15* Var %
Revenue 0.3 0.3
Costs 6.2 2.8 (3.4) (121%)
EBIT (5.9) (2.8) (3.1) (110%)
* FY15 adjusted for non-recurring item – loss on sale of Hamilton Property $1.5M
EQUITY INVESTMENTS
22
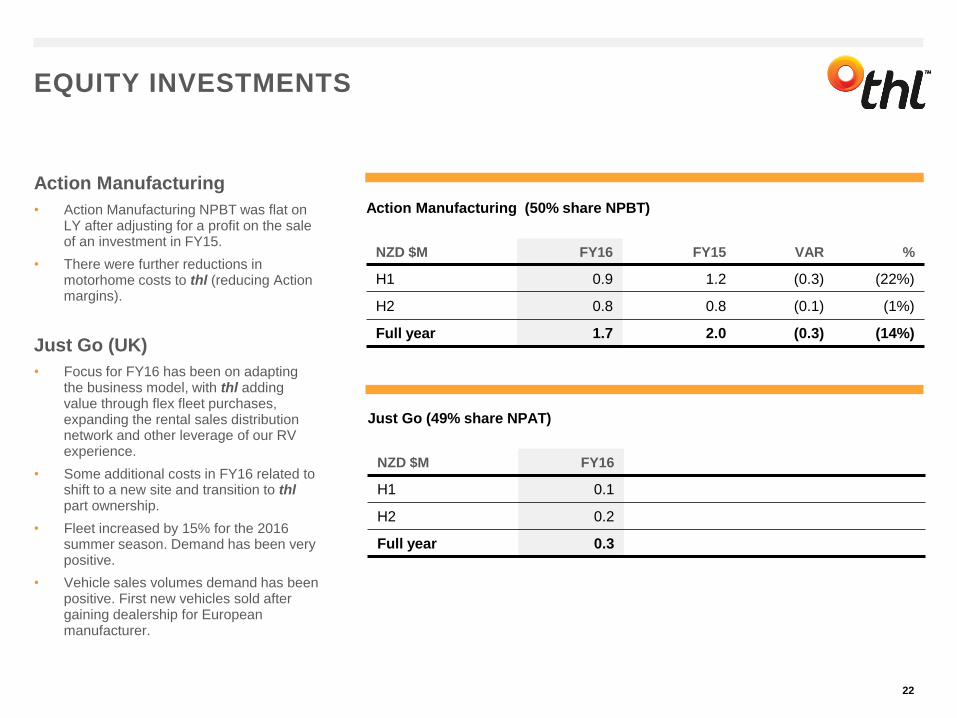
Action Manufacturing
• Action Manufacturing NPBT was flat on LY after adjusting for a profit on the sale of an investment in FY15.
• There were further reductions in motorhome costs to thl (reducing Action margins).
Just Go (UK)
• Focus for FY16 has been on adapting the business model, with thl adding value through flex fleet purchases, expanding the rental sales distribution network and other leverage of our RV experience.
• Some additional costs in FY16 related to shift to a new site and transition to thlpart ownership.
• Fleet increased by 15% for the 2016 summer season. Demand has been very positive.
• Vehicle sales volumes demand has been positive. First new vehicles sold after gaining dealership for European manufacturer.
Action Manufacturing (50% share NPBT)
NZD $M FY16 FY15 VAR %
H1 0.9 1.2 (0.3) (22%)
H2 0.8 0.8 (0.1) (1%)
Full year 1.7 2.0 (0.3) (14%)
Just Go (49% share NPAT)
NZD $M FY16
H1 0.1
H2 0.2
Full year 0.3
STRATEGY UPDATE
23
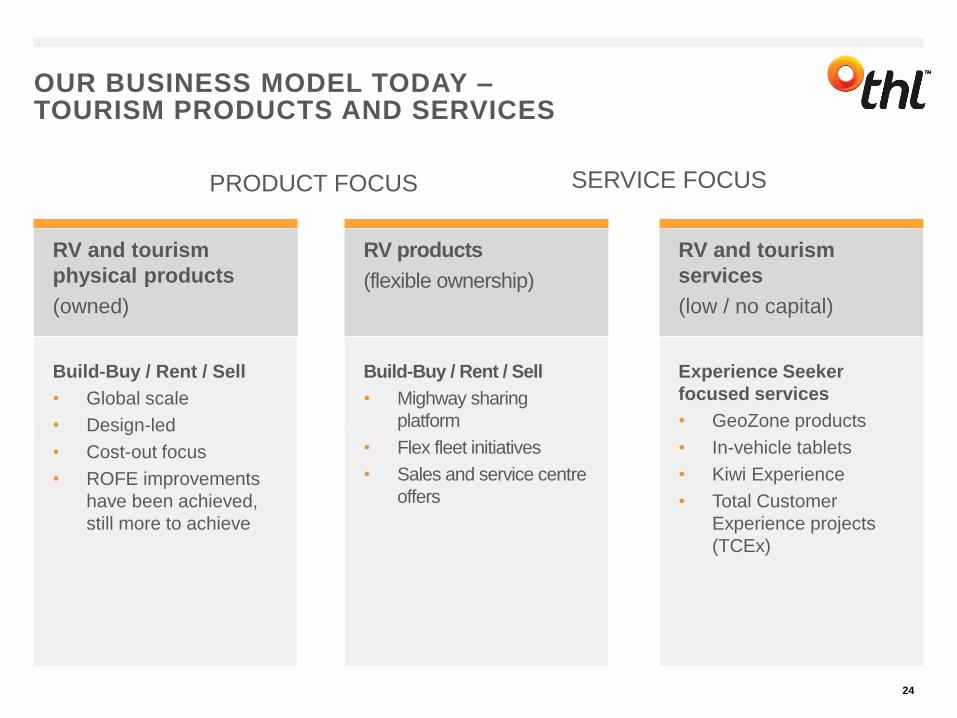
OUR BUSINESS MODEL TODAY –TOURISM PRODUCTS AND SERVICES
RV and tourism
physical products
(owned)
RV products
(flexible ownership)
RV and tourism
services
(low / no capital)
6
PRODUCT FOCUS SERVICE FOCUS
Build-Buy / Rent / Sell
• Global scale
• Design-led
• Cost-out focus
• ROFE improvements
have been achieved,
still more to achieve
Build-Buy / Rent / Sell
• Mighway sharing
platform
• Flex fleet initiatives
• Sales and service centre
offers
Experience Seeker
focused services
• GeoZone products
• In-vehicle tablets
• Kiwi Experience
• Total Customer
Experience projects
(TCEx)
24

DEEPER CUSTOMER ENGAGEMENT
25
Our new initiatives are increasing opportunities for customer engagement throughout the journey
Traditional customer interaction
New customer interaction

A MORE FLEXIBLE FLEET MODEL
• In FY17 we will build on the success of the more flexible fleet capital deployment model that was trialled in NZ in FY16.
• NZ flex fleet will be increased for the peak summer period, including an increase in ex-Just Go vehicles.
• Australia will add flex fleet across the summer peak, and lift 4WD flex fleet for winter 2017.
• Mighway will continue to grow, enabling thl to meet greater peak season demand in New Zealand.
• US fleet for FY17 will be at the same level, or up to 10% higher, depending on forward demand over the coming months.
• Just Go fleet for summer 2017 will be increased.
We will grow capacity through flex fleet, while maintaining core fleet
26
Build/buy Rent Sell
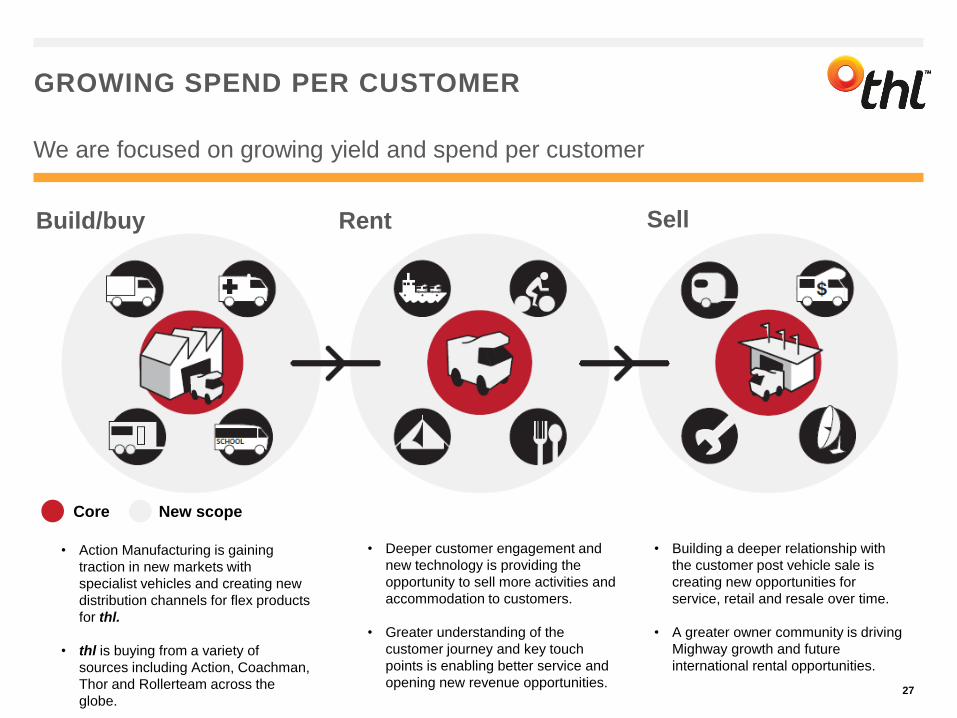
GROWING SPEND PER CUSTOMER
We are focused on growing yield and spend per customer
• Action Manufacturing is gaining
traction in new markets with
specialist vehicles and creating new
distribution channels for flex products
for thl.
• thl is buying from a variety of
sources including Action, Coachman,
Thor and Rollerteam across the
globe.
• Deeper customer engagement and
new technology is providing the
opportunity to sell more activities and
accommodation to customers.
• Greater understanding of the
customer journey and key touch
points is enabling better service and
opening new revenue opportunities.
• Building a deeper relationship with
the customer post vehicle sale is
creating new opportunities for
service, retail and resale over time.
• A greater owner community is driving
Mighway growth and future
international rental opportunities.
Core New scope
27
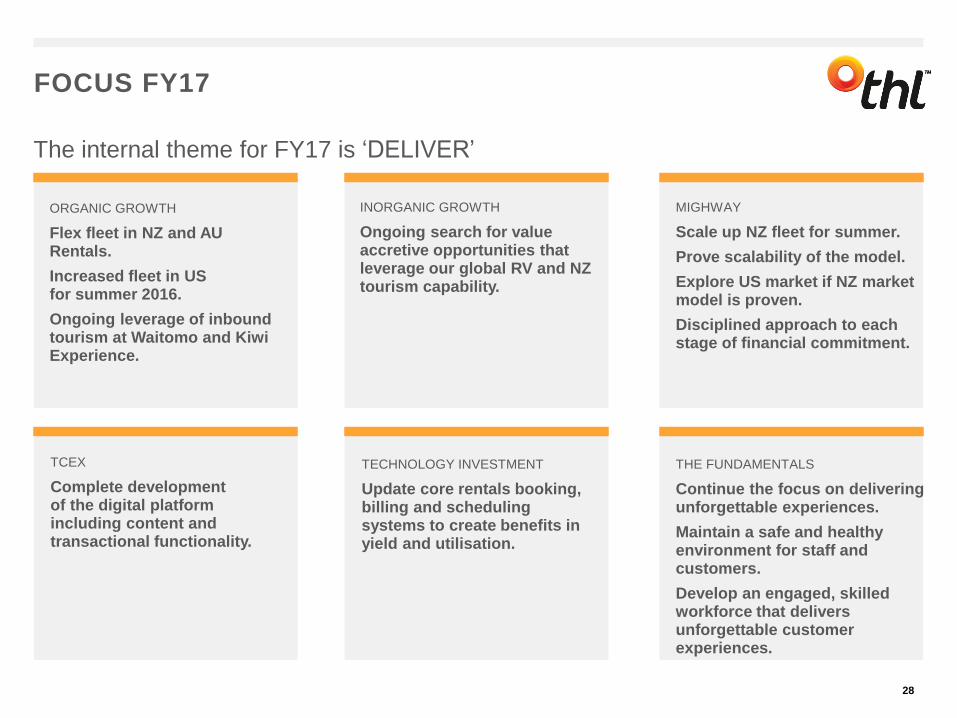
FOCUS FY17
28
ORGANIC GROWTH
Flex fleet in NZ and AU Rentals.
Increased fleet in US for summer 2016.
Ongoing leverage of inbound tourism at Waitomo and Kiwi Experience.
INORGANIC GROWTH
Ongoing search for value accretive opportunities that leverage our global RV and NZ tourism capability.
MIGHWAY
Scale up NZ fleet for summer.
Prove scalability of the model.
Explore US market if NZ market model is proven.
Disciplined approach to each stage of financial commitment.
TCEX
Complete development of the digital platform including content and transactional functionality.
THE FUNDAMENTALS
Continue the focus on delivering unforgettable experiences.
Maintain a safe and healthy environment for staff and customers.
Develop an engaged, skilled workforce that delivers unforgettable customer experiences.
TECHNOLOGY INVESTMENT
Update core rentals booking, billing and scheduling systems to create benefits in yield and utilisation.
The internal theme for FY17 is ‘DELIVER’

SUSTAINABILITY MATTERS
29
Community
• At thl we take our role as a leader in the tourism industry seriously and actively work to ensure that the impacts of tourism on the wider community are positive.
• Our CEO Grant Webster is a Board member of the Tourism Industry Aotearoa.
• We have been proactive in taking steps to ensure both domestic and overseas drivers are safe on our roads. This includes both leadership within the industry as well as our own internal measures. These measures cover the customer journey and include pre-pickup education, in-vehicle signage, safety messaging delivered via in-vehicle tablets and (in Australia) telematic system warnings around speeding and driver behaviour.
• thl is closely involved with the Visitor Driver Safety project in New Zealand.
• We have taken a lead role in addressing concerns around freedom camping, and are inaugural members of the Responsible Camping Forum, a body focused on educating tourists on respecting the environment and regional bylaws. Equally, in Australia, we are a member of, and promote, Leave No Trace Australia, an organisation that promotes responsible outdoor travel and recreation.
• In buying the Geozone business, we acquired the ability to inform users of the Campermate app (over 20,000/day in peak season) where they can legally camp.
• thl is currently the only operator working with local councils (TCDC and QLDC) in New Zealand trialling the collection of responsible camping infringement fines.
SUSTAINABILITY MATTERS
30
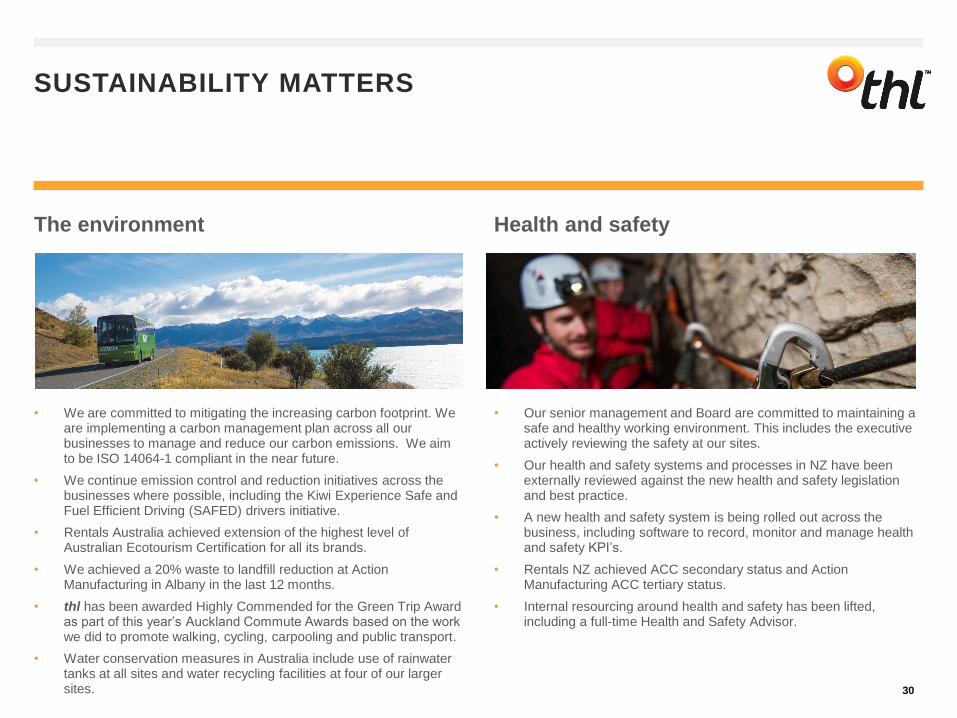
The environment
• We are committed to mitigating the increasing carbon footprint. We are implementing a carbon management plan across all our businesses to manage and reduce our carbon emissions. We aim to be ISO 14064-1 compliant in the near future.
• We continue emission control and reduction initiatives across the businesses where possible, including the Kiwi Experience Safe and Fuel Efficient Driving (SAFED) drivers initiative.
• Rentals Australia achieved extension of the highest level of Australian Ecotourism Certification for all its brands.
• We achieved a 20% waste to landfill reduction at Action Manufacturing in Albany in the last 12 months.
• thl has been awarded Highly Commended for the Green Trip Award as part of this year’s Auckland Commute Awards based on the work we did to promote walking, cycling, carpooling and public transport.
• Water conservation measures in Australia include use of rainwater tanks at all sites and water recycling facilities at four of our larger sites.
Health and safety
• Our senior management and Board are committed to maintaining a safe and healthy working environment. This includes the executive actively reviewing the safety at our sites.
• Our health and safety systems and processes in NZ have been externally reviewed against the new health and safety legislation and best practice.
• A new health and safety system is being rolled out across the business, including software to record, monitor and manage health and safety KPI’s.
• Rentals NZ achieved ACC secondary status and Action Manufacturing ACC tertiary status.
• Internal resourcing around health and safety has been lifted, including a full-time Health and Safety Advisor.

OUTLOOK
31

Data sources:
Market size – based on tourism direct contribution to GDP 2015 per World Travel and Tourism Council (WTTC) published March 2016.
Travel & Tourism Spend growth – NZ based on Ministry of Business, Innovation and Employment forecast to 2022, published May 2016. Australia based on
Tourism Research Australia 2016 Tourism Forecasts, USA &UK - WTTC forecast growth in direct contribution to GDP to 2026, published March 2016.
Visitor arrivals growth forecast – MBIE forecast to 2022, Tourism Research Australia forecast to 2022, US Department of Commerce (Oct 2015) forecast to
2020, VisitBritain forecast to 2020.
Last 12 months actual visitor arrivals – NZ Department of Statistics (to June 2016), Australian Bureau of Statistics (to June 2016), USA (to Dec 2015),
VisitBritain (to May 2016)
COUNTRYESTIMATED
MARKET SIZE
TRAVEL &
TOURISM SPEND
GROWTH
FORECAST
ANNUAL
VISITOR
ARRIVALS
FORECAST
LAST 12
MONTHS
VISITOR
ARRIVALS
GROWTH
New Zealand NZD $13B 7.5% CAGR 5.4% CAGR +11%
Australia AUD $46B 7.7% CAGR 5.9% CAGR +10%
USA USD $488B 3.7% CAGR 3.1% CAGR +3%
UK GBP £69B 3.1% CAGR 3.5% CAGR +4%
THE MACRO ENVIRONMENT
The long term macro environment remains positive
32
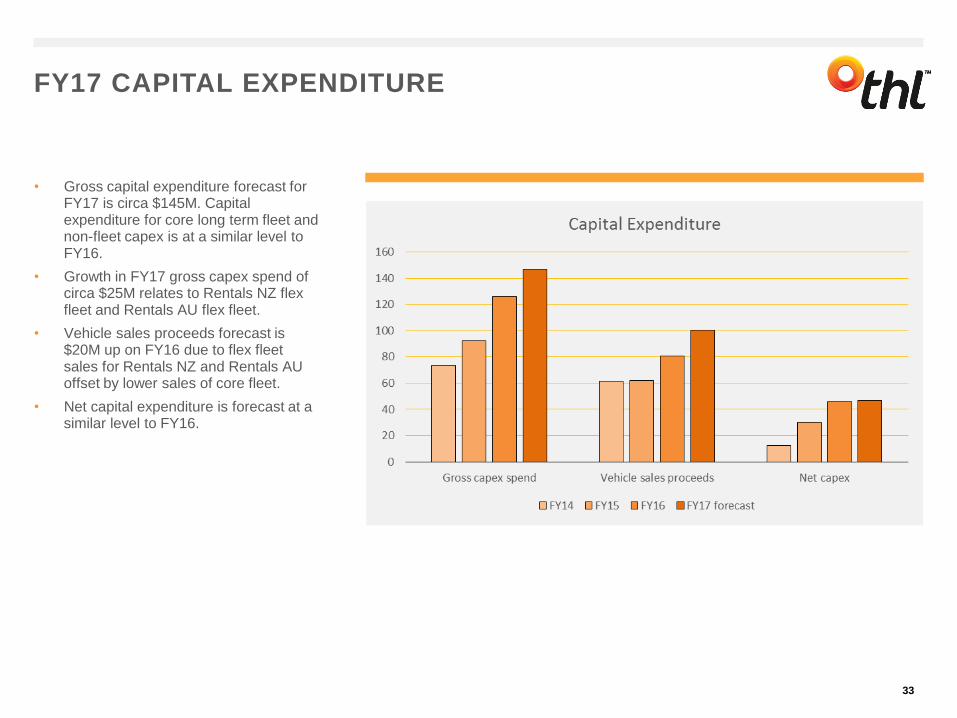
FY17 CAPITAL EXPENDITURE
33
• Gross capital expenditure forecast for FY17 is circa $145M. Capital expenditure for core long term fleet and non-fleet capex is at a similar level to FY16.
• Growth in FY17 gross capex spend of circa $25M relates to Rentals NZ flex fleet and Rentals AU flex fleet.
• Vehicle sales proceeds forecast is $20M up on FY16 due to flex fleet sales for Rentals NZ and Rentals AU offset by lower sales of core fleet.
• Net capital expenditure is forecast at a similar level to FY16.
OUTLOOK AND GUIDANCE
34
Tourism Environment
• The outlook for the tourism industry remains positive, particularly for New Zealand. FY17 trading results for July were positive and forward bookings for summer are encouraging.
Brexit
• The UK market is an important market for thl and we are actively monitoring booking activity for any impact of Brexit.
• We are now moving into the peak booking period for UK bookings.
Lions Tour
• The Lions tour of New Zealand commences in June 2017 and continues into July 2017. As this occurs in the off-season, we expect a benefit in FY17 and FY18.
FY17 Guidance
• We expect to continue to grow NPAT toward our FY18 goal of $30M.
• Further guidance will be provided at the Annual Meeting on 18 October, when bookings for the southern hemisphere summer season will be clearer.
CORPORATE GOVERNANCE
35
• During the last quarter of the year David Neidhart resigned as a Director of the company following the sale of the Sterling Grace shareholding. The Board would like to thank David for his contribution and the owners of Sterling Grace for their long standing shareholder support for the business.
• The company is in the process of recruiting a new Director to take the Board back to six members.
SUPPORTING ANALYSIS
36

INCOME STATEMENT SUMMARY
37
$M FY16 FY15 Var Var % FY16 FY15 Var Var % FY16 FY15 Var Var %
Revenue from trading 188.7 166.8 21.9 13% 99.9 88.9 11.0 12% 88.8 77.9 10.9 14%
Revenue from sale of fleet 90.2 69.8 20.4 29% 45.3 36.3 9.0 25% 44.9 33.5 11.4 34%
Total revenue 278.9 236.6 42.3 18% 145.2 125.2 20.0 16% 133.7 111.4 22.3 20%
Costs 205.3 171.1 (34.2) (20%) 103.5 86.4 (17.1) (20%) 101.8 84.6 (17.1) (20%)
EBITDA 73.6 65.5 8.1 12% 41.7 38.8 2.9 8% 31.9 26.8 5.2 19%
Depreciation & Amortisation 34.9 33.2 (1.7) (5%) 18.0 17.0 (1.0) (6%) 16.9 16.2 (0.7) (4%)
EBIT 38.7 32.3 6.4 20% 23.7 21.8 1.9 9% 15.0 10.6 4.5 42%
Interest (4.2) (4.4) 0.2 5% (1.9) (2.3) 0.3 15% (2.3) (2.2) (0.1) (5%)
Share of JV Profit (loss) 1.7 2.0 (0.3) (14%) 0.8 0.8 (0.0) (1%) 0.9 1.1 (0.3) (22%)
Share of Associates 0.3 (0.0) 0.3 3222% 0.2 0.0 0.2 2214% 0.1 (0.0) 0.1 844%
Profit before taxation 36.5 29.8 6.7 22% 22.7 20.3 2.4 12% 13.7 9.5 4.2 44%
Taxation (12.1) (9.8) (2.3) (24%) (6.6) (5.9) (0.7) (12%) (5.5) (3.9) (1.6) (42%)
Profit attributable to thl shareholders 24.4 20.1 4.3 21% 16.1 14.4 1.7 12% 8.2 5.6 2.6 46%
Basic EPS 21.4 17.9 3.5 20%
Full Year 6 Months to June 6 Months to December

REVENUE
38
$M JUNE 16 JUNE 15 VAR JUNE 16 JUNE 15 VAR DEC 15 DEC 14 VAR
thl Rentals - Rental Revenue
New Zealand 68.4 60.8 12% 41.9 36.9 13% 26.5 23.9 11%
Australia 55.9 55.0 2% 25.7 25.1 2% 30.3 29.9 1%
USA 27.9 21.1 32% 11.0 9.6 14% 16.9 11.5 47%
152.2 136.9 11% 78.5 71.6 10% 73.7 65.3 13%
thl Rentals - Sale of Goods
New Zealand 35.5 29.2 22% 19.2 15.6 24% 16.3 13.6 20%
Australia 12.4 11.1 12% 6.5 6.1 7% 5.9 5.0 19%
USA 42.3 29.6 43% 19.6 14.6 34% 22.7 14.9 52%
90.2 69.8 29% 45.3 36.3 25% 44.9 33.5 34%
Tourism Group 36.3 29.9 21% 21.2 17.3 23% 15.1 12.7 19%
Other 0.3 0.2 0.0 0.1
Total Revenue 278.9 236.6 18% 145.2 125.2 16% 133.7 111.4 20%
Split
Australia 68.4 66.1 3% 32.1 31.2 3% 36.2 34.9 4%
USA 70.2 50.6 39% 30.6 24.3 26% 39.6 26.4 50%
NZ and other 140.4 119.9 17% 82.5 69.7 18% 57.9 50.2 15%
278.9 236.6 18% 145.2 125.2 16% 133.7 111.4 20%
Revenue Split
Sale of Services 188.7 166.8 13% 99.9 88.9 12% 88.8 77.9 14%
Sale of Goods 90.2 69.8 29% 45.3 36.3 25% 44.9 33.5 34%
278.9 236.6 18% 145.2 125.2 16% 133.7 111.4 20%
6 Months to DecemberFull Year 6 Months to June
DIVISIONAL REVIEW
39
DIVISIONAL AVE FUNDS OPERATING DIVISIONAL AVE FUNDS OPERATING
$M REVENUE EBIT EMPLOYED CASHFLOW* REVENUE EBIT EMPLOYED CASHFLOW*
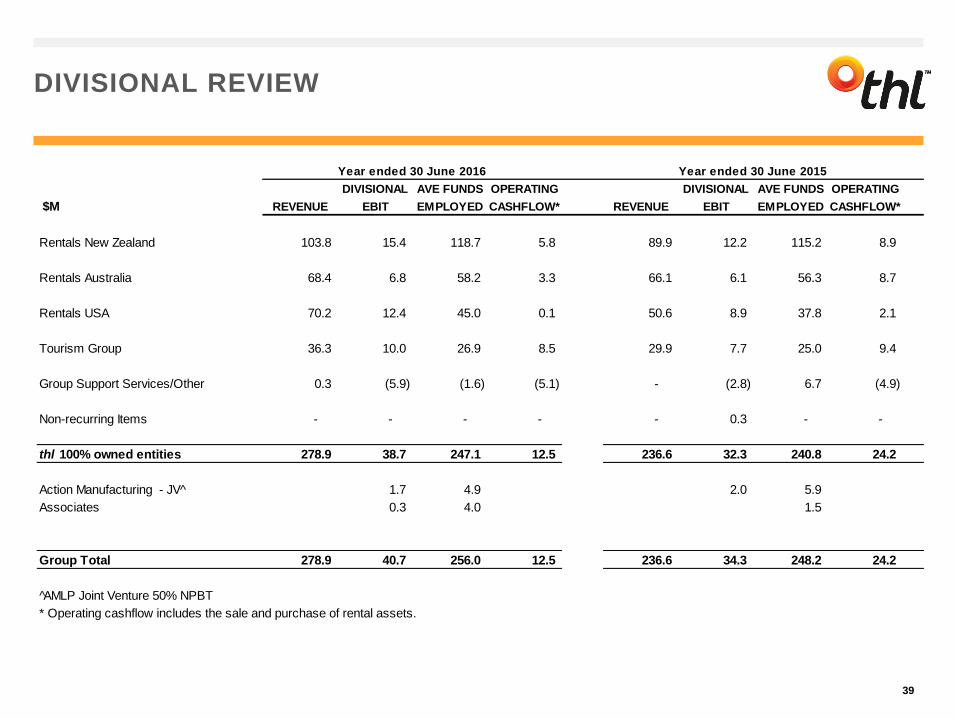
Rentals New Zealand 103.8 15.4 118.7 5.8 89.9 12.2 115.2 8.9
Rentals Australia 68.4 6.8 58.2 3.3 66.1 6.1 56.3 8.7
Rentals USA 70.2 12.4 45.0 0.1 50.6 8.9 37.8 2.1
Tourism Group 36.3 10.0 26.9 8.5 29.9 7.7 25.0 9.4
Group Support Services/Other 0.3 (5.9) (1.6) (5.1) - (2.8) 6.7 (4.9)
Non-recurring Items - - - - - 0.3 - -
thl 100% owned entities 278.9 38.7 247.1 12.5 236.6 32.3 240.8 24.2
Action Manufacturing - JV^ 1.7 4.9 2.0 5.9
Associates 0.3 4.0 1.5
Group Total 278.9 40.7 256.0 12.5 236.6 34.3 248.2 24.2
AMLP Joint Venture 50% NPBT
* Operating cashflow includes the sale and purchase of rental assets.
Year ended 30 June 2016 Year ended 30 June 2015
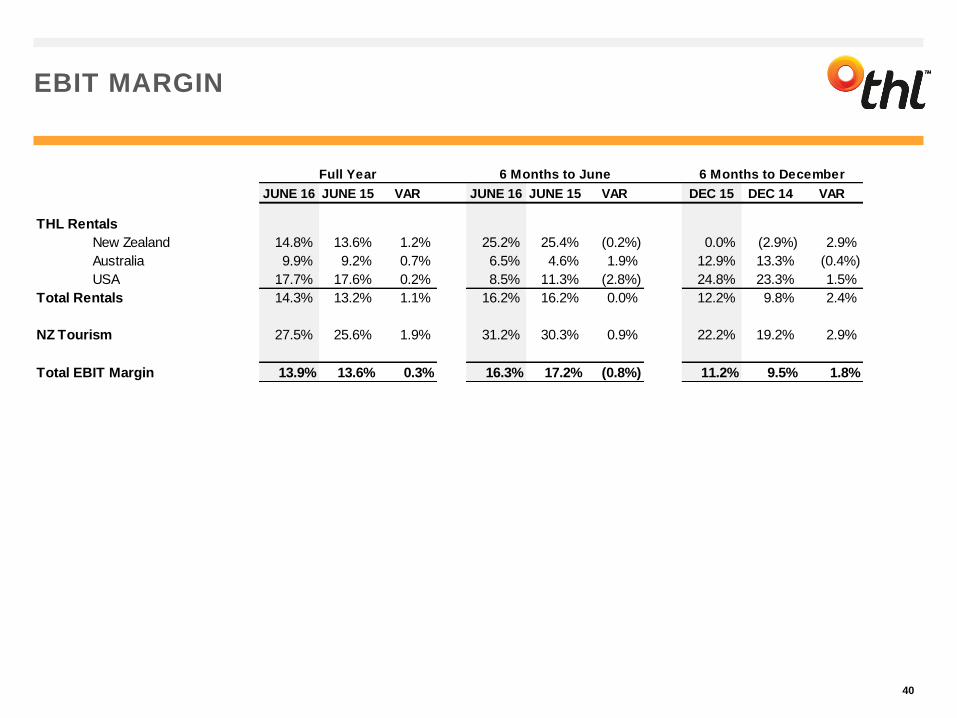
EBIT MARGIN
40
JUNE 16 JUNE 15 VAR JUNE 16 JUNE 15 VAR DEC 15 DEC 14 VAR
THL Rentals
New Zealand 14.8% 13.6% 1.2% 25.2% 25.4% (0.2%) 0.0% (2.9%) 2.9%
Australia 9.9% 9.2% 0.7% 6.5% 4.6% 1.9% 12.9% 13.3% (0.4%)
USA 17.7% 17.6% 0.2% 8.5% 11.3% (2.8%) 24.8% 23.3% 1.5%
Total Rentals 14.3% 13.2% 1.1% 16.2% 16.2% 0.0% 12.2% 9.8% 2.4%
NZ Tourism 27.5% 25.6% 1.9% 31.2% 30.3% 0.9% 22.2% 19.2% 2.9%
Total EBIT Margin 13.9% 13.6% 0.3% 16.3% 17.2% (0.8%) 11.2% 9.5% 1.8%
Full Year 6 Months to December6 Months to June

EBITDA
41
$M FY16 FY15 Var Var % FY16 FY15 Var Var % FY16 FY15 Var Var %
EBIT 38.7 32.3 6.4 20% 23.7 21.8 1.9 9% 15.0 10.6 4.5 42%
Add back non-cash items:
Amortisation 1.6 1.6 0.0 0.8 0.8 0.0 0.8 0.8 0.0
Depreciation 33.3 31.6 1.7 17.2 16.2 1.0 16.1 15.4 0.7
EBITDA 73.6 65.5 8.1 12% 41.7 38.8 2.9 7% 31.9 26.8 5.2 19%
Full Year 6 Months to June 6 Months to December
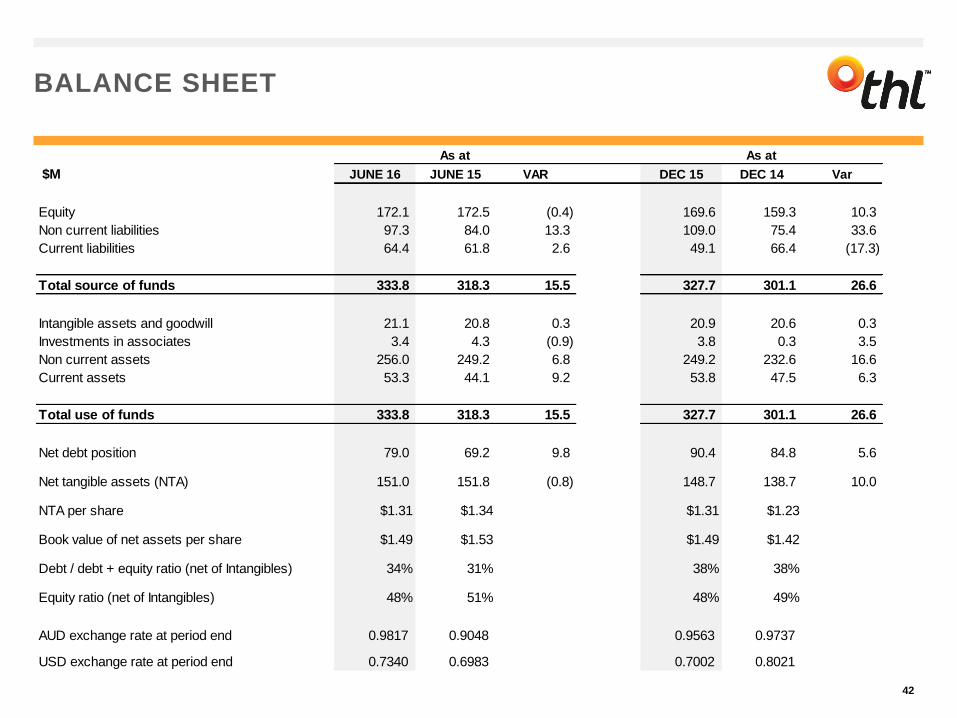
BALANCE SHEET
42
$M JUNE 16 JUNE 15 VAR DEC 15 DEC 14 Var
Equity 172.1 172.5 (0.4) 169.6 159.3 10.3
Non current liabilities 97.3 84.0 13.3 109.0 75.4 33.6
Current liabilities 64.4 61.8 2.6 49.1 66.4 (17.3)
Total source of funds 333.8 318.3 15.5 327.7 301.1 26.6
Intangible assets and goodwill 21.1 20.8 0.3 20.9 20.6 0.3
Investments in associates 3.4 4.3 (0.9) 3.8 0.3 3.5
Non current assets 256.0 249.2 6.8 249.2 232.6 16.6
Current assets 53.3 44.1 9.2 53.8 47.5 6.3
Total use of funds 333.8 318.3 15.5 327.7 301.1 26.6
Net debt position 79.0 69.2 9.8 90.4 84.8 5.6
Net tangible assets (NTA) 151.0 151.8 (0.8) 148.7 138.7 10.0
NTA per share $1.31 $1.34 $1.31 $1.23
Book value of net assets per share $1.49 $1.53 $1.49 $1.42
Debt / debt + equity ratio (net of Intangibles) 34% 31% 38% 38%
Equity ratio (net of Intangibles) 48% 51% 48% 49%
AUD exchange rate at period end 0.9817 0.9048 0.9563 0.9737
USD exchange rate at period end 0.7340 0.6983 0.7002 0.8021
As at As at
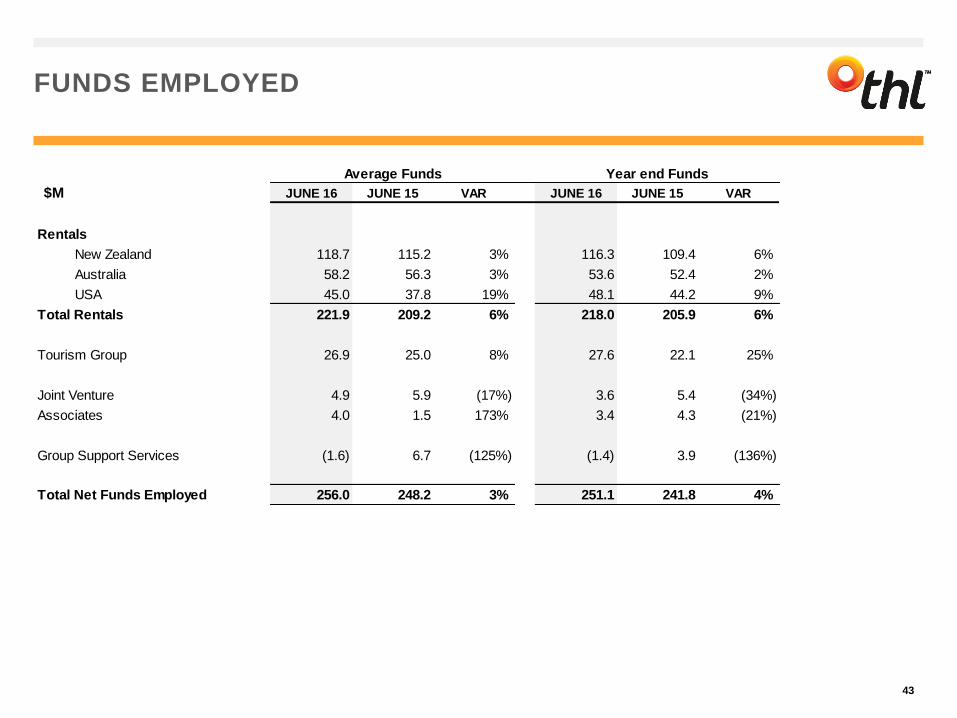
FUNDS EMPLOYED
43
$M JUNE 16 JUNE 15 VAR JUNE 16 JUNE 15 VAR
Rentals
New Zealand 118.7 115.2 3% 116.3 109.4 6%
Australia 58.2 56.3 3% 53.6 52.4 2%
USA 45.0 37.8 19% 48.1 44.2 9%
Total Rentals 221.9 209.2 6% 218.0 205.9 6%
Tourism Group 26.9 25.0 8% 27.6 22.1 25%
Joint Venture 4.9 5.9 (17%) 3.6 5.4 (34%)
Associates 4.0 1.5 173% 3.4 4.3 (21%)
Group Support Services (1.6) 6.7 (125%) (1.4) 3.9 (136%)
Total Net Funds Employed 256.0 248.2 3% 251.1 241.8 4%
Average Funds Year end Funds
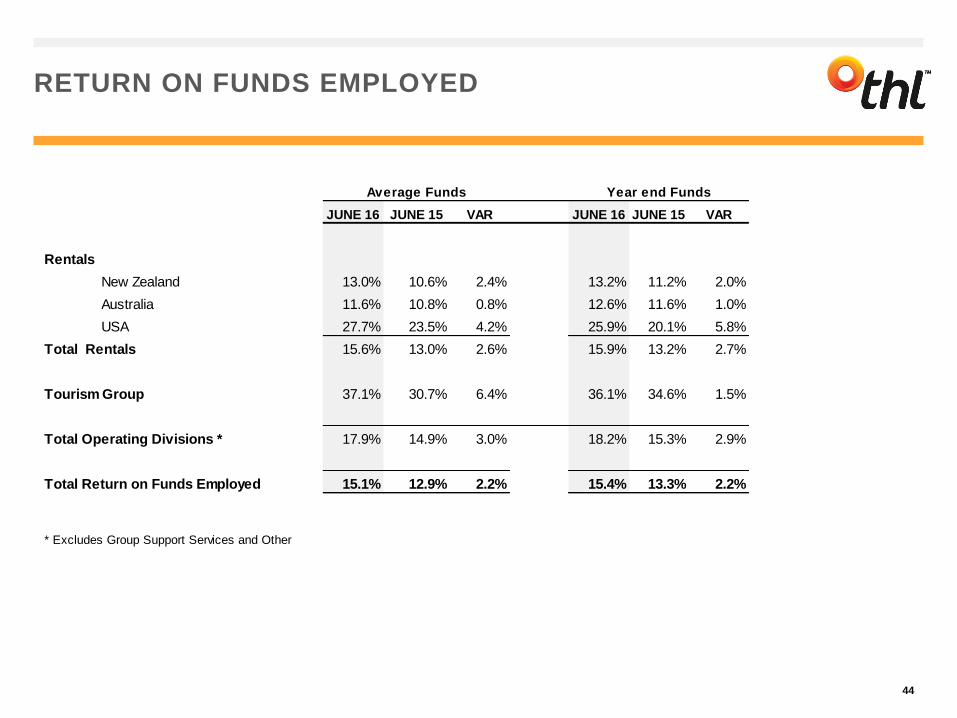
RETURN ON FUNDS EMPLOYED
44
JUNE 16 JUNE 15 VAR JUNE 16 JUNE 15 VAR
Rentals
New Zealand 13.0% 10.6% 2.4% 13.2% 11.2% 2.0%
Australia 11.6% 10.8% 0.8% 12.6% 11.6% 1.0%
USA 27.7% 23.5% 4.2% 25.9% 20.1% 5.8%
Total Rentals 15.6% 13.0% 2.6% 15.9% 13.2% 2.7%
Tourism Group 37.1% 30.7% 6.4% 36.1% 34.6% 1.5%
Total Operating Divisions * 17.9% 14.9% 3.0% 18.2% 15.3% 2.9%
Total Return on Funds Employed 15.1% 12.9% 2.2% 15.4% 13.3% 2.2%
* Excludes Group Support Services and Other
Average Funds Year end Funds
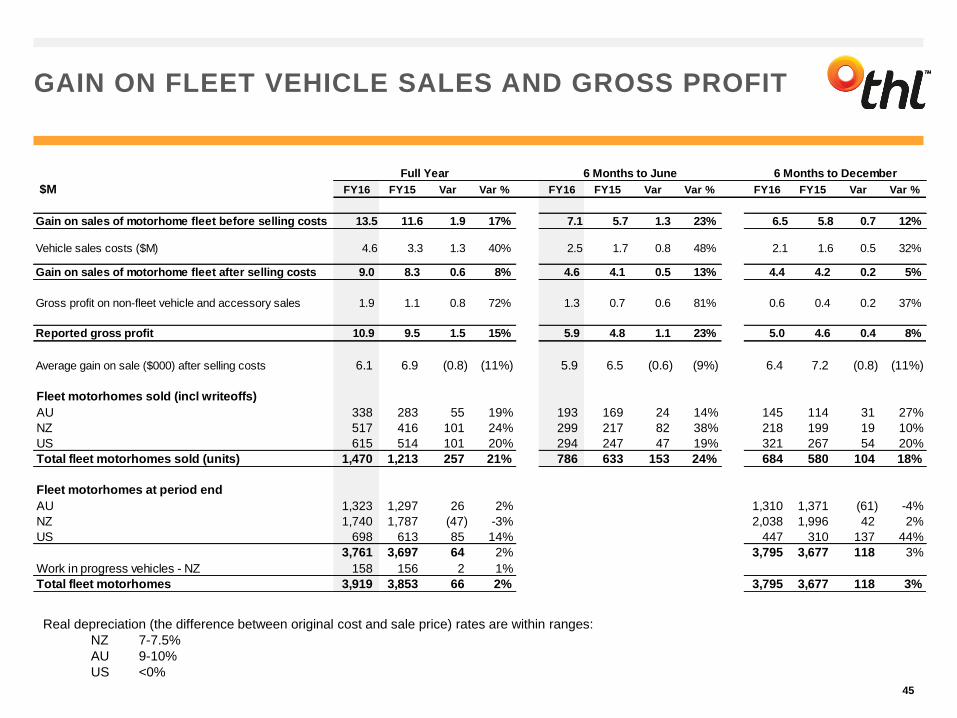
GAIN ON FLEET VEHICLE SALES AND GROSS PROFIT
45
Real depreciation (the difference between original cost and sale price) rates are within ranges:
NZ 7-7.5%
AU 9-10%
US <0%
$M FY16 FY15 Var Var % FY16 FY15 Var Var % FY16 FY15 Var Var %
Gain on sales of motorhome fleet before selling costs 13.5 11.6 1.9 17% 7.1 5.7 1.3 23% 6.5 5.8 0.7 12%
Vehicle sales costs ($M) 4.6 3.3 1.3 40% 2.5 1.7 0.8 48% 2.1 1.6 0.5 32%
Gain on sales of motorhome fleet after selling costs 9.0 8.3 0.6 8% 4.6 4.1 0.5 13% 4.4 4.2 0.2 5%
Gross profit on non-fleet vehicle and accessory sales 1.9 1.1 0.8 72% 1.3 0.7 0.6 81% 0.6 0.4 0.2 37%
Reported gross profit 10.9 9.5 1.5 15% 5.9 4.8 1.1 23% 5.0 4.6 0.4 8%
Average gain on sale ($000) after selling costs 6.1 6.9 (0.8) (11%) 5.9 6.5 (0.6) (9%) 6.4 7.2 (0.8) (11%)
Fleet motorhomes sold (incl writeoffs)
AU 338 283 55 19% 193 169 24 14% 145 114 31 27%
NZ 517 416 101 24% 299 217 82 38% 218 199 19 10%
US 615 514 101 20% 294 247 47 19% 321 267 54 20%
Total fleet motorhomes sold (units) 1,470 1,213 257 21% 786 633 153 24% 684 580 104 18%
Fleet motorhomes at period end
AU 1,323 1,297 26 2% 1,310 1,371 (61) -4%
NZ 1,740 1,787 (47) -3% 2,038 1,996 42 2%
US 698 613 85 14% 447 310 137 44%
3,761 3,697 64 2% 3,795 3,677 118 3%
Work in progress vehicles - NZ 158 156 2 1%
Total fleet motorhomes 3,919 3,853 66 2% 3,795 3,677 118 3%
Full Year 6 Months to June 6 Months to December
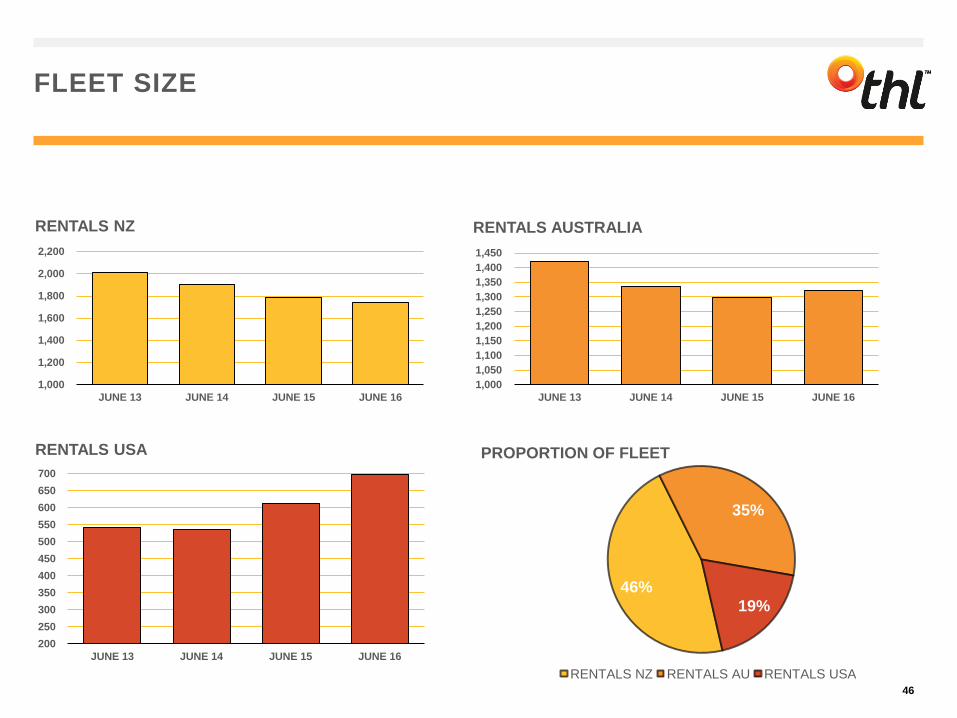
FLEET SIZE
46
1,000
1,200
1,400
1,600
1,800
2,000
2,200
JUNE 13 JUNE 14 JUNE 15 JUNE 16
RENTALS NZ
1,000
1,050
1,100
1,150
1,200
1,250
1,300
1,350
1,400
1,450
JUNE 13 JUNE 14 JUNE 15 JUNE 16
RENTALS AUSTRALIA
200
250
300
350
400
450
500
550
600
650
700
JUNE 13 JUNE 14 JUNE 15 JUNE 16
RENTALS USA
46%
35%
19%
PROPORTION OF FLEET
RENTALS NZ RENTALS AU RENTALS USA

FOREIGN CURRENCY MOVEMENT
47
• The movement in the New Zealand dollar (NZD) had some impact in the translation of earnings and debt. All overseas businesses have associated debt in the local currency, which partially hedges the currency movement impact on net assets.
• The year-end exchange rate movement resulted in a year-on-year reduction in net assets as reflected in movement in the Foreign Currency Translation Reserve, which moved by $5.4M during the year.
• The impact of the movement in exchange rates used for the translation of earnings was to increase NPAT by approximately $1.3M from the result that would have been reported, had exchange rates remained at FY15 levels.
YEAR END FX RATE FY16 FY15
NZD : AUD 0.9817 0.9048
NZD :USD 0.7340 0.6983

END
48