2014 EU-wide ST-Aggregate Results
51
RESULTS OF 2014 EU‐WIDE STRESS TEST 1 26 October 2014 Report Results of 2014 EU‐wide stress test Aggregate results
-
Upload
paradosiakos -
Category
Documents
-
view
216 -
download
0
Transcript of 2014 EU-wide ST-Aggregate Results
8/10/2019 2014 EU-wide ST-Aggregate Results
http://slidepdf.com/reader/full/2014-eu-wide-st-aggregate-results 1/51
RESULTS OF 2014 EU‐WIDE STRESS TEST
1
26 October 2014
Report
Results of 2014 EU‐wide stress test
Aggregate results
8/10/2019 2014 EU-wide ST-Aggregate Results
http://slidepdf.com/reader/full/2014-eu-wide-st-aggregate-results 2/51
RESULTS OF 2014 EU‐WIDE STRESS TEST
2
Contents
List of figures 3
List of boxes 5
List of tables 5
Executive Summary 7
1. Objectives of this document 9
2. Rationale, purpose and governance of the EU‐wide stress test 10
2.1
Purpose of
the
exercise
10
2.2 Summary of the main methodological aspects 11
2.2.1 Sample of banks 11
2.2.2 The static balance sheet assumption 12
2.2.3 Definition of capital 13
2.2.4 Risk coverage 15
2.3 Governance 16
3. Aggregate outcomes of the exercise 18
3.1 Summary 18
3.2
Banks’ capital
position
ahead
of
the
stress
test
18
3.3 Impact of the stress test on capital ratios 19
3.3.1 Impact on Common Equity Tier 1 ratios 19
3.3.2 Shortfall 21
3.3.3 Impact on fully loaded CRR/CRD IV Common Equity Tier 1 Capital ratios 23
3.3.4 Main drivers of the impact 24
3.3.5 Impact on capital 25
3.3.6 Impact on risk exposure amount 26
3.4 Impact by risk type 27
3.4.1 Credit risk 27
3.4.2
Cost of
funding
and
Net
Interest
Income
33
3.4.3 Market risk 33
3.4.4 Sovereign risk 34
3.5 Supervisory reaction function 36
3.5.1 Process and communication 36
3.5.2 Capital actions 36
3.5.1 Impact of restructuring plans approved after December 2013 38
Annex 1: EU‐wide stress test sample of banks and bank‐level results 40
Annex 2: Basic methodological background for reading the report 46
Annex 3:
Scenario
overview
47
Annex 4: Monitoring of EBA capital preservation recommendation 48

8/10/2019 2014 EU-wide ST-Aggregate Results
http://slidepdf.com/reader/full/2014-eu-wide-st-aggregate-results 3/51
RESULTS OF 2014 EU‐WIDE STRESS TEST
3
Annex 5: Banks covered in the capital preservation recommendation 50
List of figures
Figure 1: Stylised categorisation of stress tests by type, aim and use ............................................. 11
Figure 2: Evolution of Core Tier 1 Capital ratios from 2011 stress test to December 2013 for major EU banks ........................................................................................................................................... 18
Figure 3: Impact of asset quality reviews on weighted average Common Equity Tier 1 Capital ratio
for the
starting
point
2013
...............................................................................................................
19
Figure 4: Evolution of aggregate Common Equity Tier 1 ratio and delta to starting point 2013 ..... 19
Figure 5: Impact on Common Equity Tier 1 ratio from 2013 to 2016 in the adverse scenario by
country and for individual banks sorted by size of the impact ........................................................ 20
Figure 6: Number of banks by ranges of Common Equity Tier 1 Capital ratios 2013 and 2016 in the
adverse scenario .............................................................................................................................. 21
Figure 7: Median and interquartile range for Common Equity Tier 1 Capital ratio and change from
2013 to 2016 in the adverse scenario .............................................................................................. 21
Figure 8:
Evolution
of
number
of
banks
failing
the
stress
test
capital
shortfall21
............................
22
Figure 9: Number of banks failing the stress test and shortfall in the adverse scenario in 2016 by
country ............................................................................................................................................. 22
Figure 10: Evolution of aggregate fully loaded Common Equity Tier 1 ratio and delta to starting
point 2013 ........................................................................................................................................ 23
Figure 11: 2016 Common Equity Tier 1 ratios by country in the adverse scenario ‐ transitional, fully
loaded CRR/CRD IV and impact from 2013 to 2016 of transitional arrangements ......................... 24
Figure 12: Contribution of different drivers to the change in Common Equity Tier 1 Capital ratio
from 2013 to 2016 in the adverse scenario ..................................................................................... 25
Figure 13: Evolution of aggregate Common Equity Tier 1 Capital (EUR BN) and evolution relative to
starting point (2013 = 100) ............................................................................................................... 25
Figure 14: Evolution of aggregate total risk exposure amount (EUR BN) and evolution relative to
starting point (2013 = 100) ............................................................................................................... 27
Figure 15: Evolution of risk exposure amount by risk type under the adverse scenario (2013=100)
.......................................................................................................................................................... 27
Figure 16: Evolution of absolute credit losses (impairment of financial assets other than
instruments designated at fair value through P&L, EUR BN) and evolution relative to starting point
(2013 = 100)
.....................................................................................................................................
28
8/10/2019 2014 EU-wide ST-Aggregate Results
http://slidepdf.com/reader/full/2014-eu-wide-st-aggregate-results 4/51
RESULTS OF 2014 EU‐WIDE STRESS TEST
4
Figure 17: Contribution to cumulative credit losses (impairments of financial assets other than
instruments designated at fair value through P&L) in the adverse scenario – by regulatory
exposure class
and
for
selected
countries
of
the
counterparty.......................................................
29
Figure 18: Evolution of credit exposure by exposure class (2011=100) .......................................... 29
Figure 19: Evolution of credit exposure by country of the counterparty (2012=100) ..................... 30
Figure 20: Cumulative credit losses (impairments of financial assets other than instruments
designated at fair value through P&L) relative to December 2013 exposure and coverage of defaulted exposures with provisions 2016 in the adverse scenario – by regulatory exposure class
and for selected countries of the counterparty ............................................................................... 31
Figure 21: Distribution of default rates and loss rates in the adverse scenario across banks –
interquartile range and median for both historical and stress test data ......................................... 32
Figure 22: Evolution of absolute net interest income (EUR BN) and evolution relative to starting
point (2013 = 100) ............................................................................................................................ 33
Figure 23: Evolution of aggregate net trading income (EUR BN) and evolution relative to starting
point (2013 = 100) ............................................................................................................................ 34
Figure 24: Direct net sovereign exposure by accounting book December 2013 (%) and capital impact of AfS exposure in the adverse scenario (EUR BN) .............................................................. 35
Figure 25: Direct net sovereign exposure (EUR BN) held by domestic bank and held by non‐
domestic banks December 2013 in the sample of the EU‐wide stress test ..................................... 35
Figure 26:
Major
capital
measures
impacting
Common
Equity
Tier
1 eligible
capital
from
1 January
2014 to 30 September 2014 and net CET1 Capital raised and converted by country (EUR BN) ..... 37
Figure 27: Impact of net capital raised and converted on capital shortfall 2016 under the adverse
scenario ............................................................................................................................................ 37
Figure 28: Impact on CET1 ratio of restructuring plans on those banks with a plan approved before
December 2013 under the adverse scenario from 2013 to 2016 .................................................... 39

8/10/2019 2014 EU-wide ST-Aggregate Results
http://slidepdf.com/reader/full/2014-eu-wide-st-aggregate-results 5/51
RESULTS OF 2014 EU‐WIDE STRESS TEST
5
List of boxes
Box 1: The suite of stress tests ......................................................................................................... 10
Box 2: Integration of asset quality reviews and the stress test ....................................................... 17
Box 3: Evolution of credit risk exposure ........................................................................................... 29
Box 4: Evolution of risk parameters ................................................................................................. 32
Box 5: Distribution and evolution of sovereign exposure ................................................................ 35
Box 6: Impact of the dynamic balance sheet approach for banks with restructuring plans approved
before December
2013
....................................................................................................................
39
List of tables
Table 1: Overview on key figures for the 2014 EU‐wide stress test .................................................. 8
Table 2: Stylised EU aggregate profit and loss account ‐ Cumulative profit and loss from 2014 to
2016 in the adverse scenario and accumulated capital impact of sovereign exposure held as
Available
for
Sale
..............................................................................................................................
26
Table 3: Shortfall for individual banks 2016 under the adverse scenario, capital raised or converted in 2014 and net shortfall (EUR BN) ................................................................................. 38
Table 4: Shortfall for banks with restructuring plans approved after 31/12/2013 (EUR BN) .......... 39
Table 5: Application of restructuring plans and selected results for individual banks .................... 41
Table 6: Banks’ compliance with capital preservation recommendation ........................................ 50
8/10/2019 2014 EU-wide ST-Aggregate Results
http://slidepdf.com/reader/full/2014-eu-wide-st-aggregate-results 6/51
RESULTS OF 2014 EU‐WIDE STRESS TEST
6
Abbreviations
AfS Available for Sale (accounting portfolio)
AQR Asset quality review
bps Basis points
CA Competent authority
CEE Central and Eastern Europe
CET1 Common Equity Tier 1
CRR/CRD
IV
Regulation (EU)
No
575/2013
and
Directive
2013/36/EU
CT1 Core Tier 1
EBA European Banking Authority
ECB European Central Bank
EEA European Economic Area
ESRB European Systemic Risk Board
EU European Union
HfT Held for Trading (accounting portfolio)
HtM Held till Maturity (accounting portfolio)
IRB Internal Ratings Based
NII Net interest income
NTI Net trading income
P&L Profit and loss
pp Percentage points
RE
Real estate
SL Specialised lending
SME Small and medium enterprises
8/10/2019 2014 EU-wide ST-Aggregate Results
http://slidepdf.com/reader/full/2014-eu-wide-st-aggregate-results 7/51
RESULTS OF 2014 EU‐WIDE STRESS TEST
7
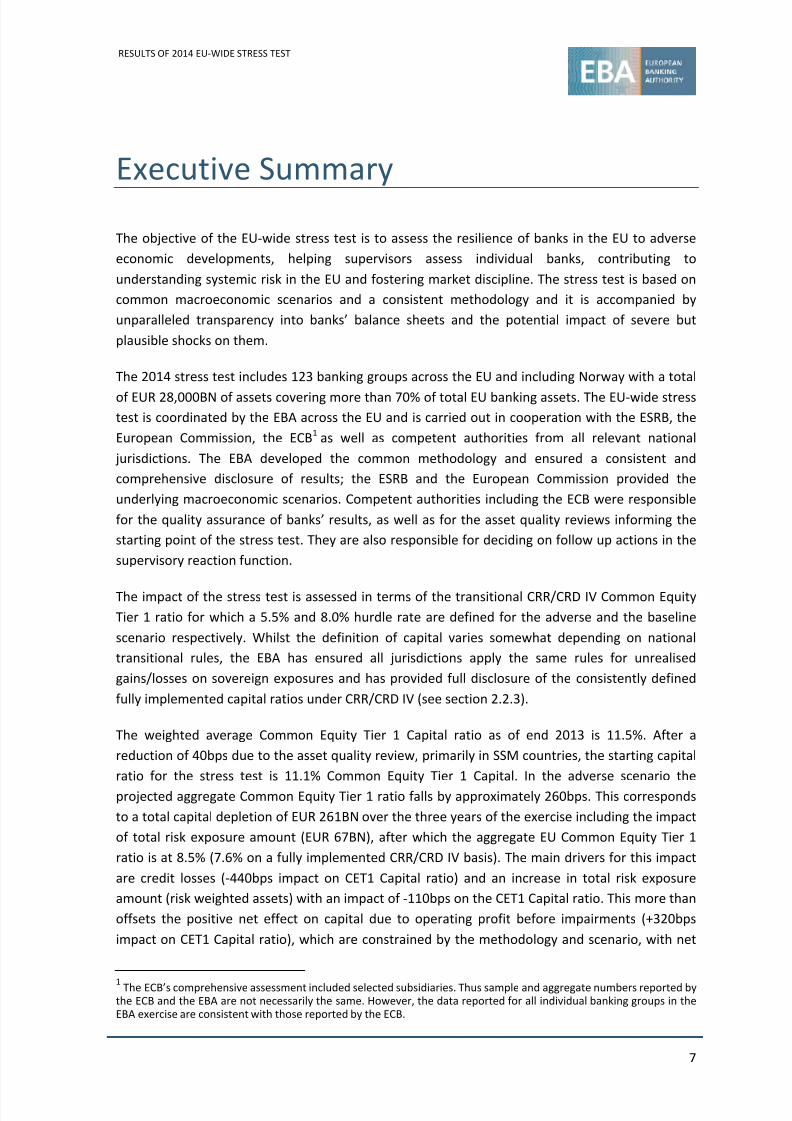
Executive Summary
The objective of the EU‐wide stress test is to assess the resilience of banks in the EU to adverse
economic developments, helping supervisors assess individual banks, contributing to
understanding systemic risk in the EU and fostering market discipline. The stress test is based on
common macroeconomic scenarios and a consistent methodology and it is accompanied by
unparalleled transparency into banks’ balance sheets and the potential impact of severe but
plausible shocks on them.
The 2014 stress test includes 123 banking groups across the EU and including Norway with a total
of EUR
28,000BN
of
assets
covering
more
than
70%
of
total
EU
banking
assets.
The
EU
‐wide
stress
test is coordinated by the EBA across the EU and is carried out in cooperation with the ESRB, the
European Commission, the ECB1 as well as competent authorities from all relevant national
jurisdictions. The EBA developed the common methodology and ensured a consistent and
comprehensive disclosure of results; the ESRB and the European Commission provided the
underlying macroeconomic scenarios. Competent authorities including the ECB were responsible
for the quality assurance of banks’ results, as well as for the asset quality reviews informing the
starting point of the stress test. They are also responsible for deciding on follow up actions in the
supervisory reaction function.
The impact
of
the
stress
test
is
assessed
in
terms
of
the
transitional
CRR/CRD
IV
Common
Equity
Tier 1 ratio for which a 5.5% and 8.0% hurdle rate are defined for the adverse and the baseline
scenario respectively. Whilst the definition of capital varies somewhat depending on national
transitional rules, the EBA has ensured all jurisdictions apply the same rules for unrealised
gains/losses on sovereign exposures and has provided full disclosure of the consistently defined
fully implemented capital ratios under CRR/CRD IV (see section 2.2.3).
The weighted average Common Equity Tier 1 Capital ratio as of end 2013 is 11.5%. After a
reduction of 40bps due to the asset quality review, primarily in SSM countries, the starting capital
ratio for the stress test is 11.1% Common Equity Tier 1 Capital. In the adverse scenario the
projected aggregate Common Equity Tier 1 ratio falls by approximately 260bps. This corresponds
to a total capital depletion of EUR 261BN over the three years of the exercise including the impact
of total risk exposure amount (EUR 67BN), after which the aggregate EU Common Equity Tier 1
ratio is at 8.5% (7.6% on a fully implemented CRR/CRD IV basis). The main drivers for this impact
are credit losses (‐440bps impact on CET1 Capital ratio) and an increase in total risk exposure
amount (risk weighted assets) with an impact of ‐110bps on the CET1 Capital ratio. This more than
offsets the positive net effect on capital due to operating profit before impairments (+320bps
impact on CET1 Capital ratio), which are constrained by the methodology and scenario, with net
1 The
ECB’s
comprehensive
assessment
included
selected
subsidiaries.
Thus
sample
and
aggregate
numbers
reported
by
the ECB and the EBA are not necessarily the same. However, the data reported for all individual banking groups in the
EBA exercise are consistent with those reported by the ECB.
8/10/2019 2014 EU-wide ST-Aggregate Results
http://slidepdf.com/reader/full/2014-eu-wide-st-aggregate-results 8/51
RESULTS OF 2014 EU‐WIDE STRESS TEST
8
interest income falling 16%. 24 participating banks fall below the defined thresholds leading to an
aggregate maximum capital shortfall of EUR 24.6BN. The additional capital raised in 2014 by
banks with
a shortfall
reduces
the
capital
needs
for
those
banks
to
EUR
9.5BN
and
the
number
of
banks with a shortfall to 14.
This report summarises aggregate results of the exercise. The annex also contains the resulting
capital ratios on a bank‐by‐bank basis. In addition to this report, the EBA published granular data
for each bank including detailed information on the starting point at the end of December 2013 as
well as the impact on P&L and balance sheet on its website. More detailed information is also
available in form of interactive tools on the EBA website.2
The supervisory reaction for individual banks based on these results is the responsibility of
competent authorities.
Supervisory
actions
will
be
communicated
by
each
competent
authority
shortly after the publication of the stress test results.
Table 1: Overview on key figures for the 2014 EU‐wide stress test
Sample
123 banks
EUR 28,000BN of assets
Approximately 70% of the EU banking sector
Starting point
Capital
strengthening
of
9.2%
to
11.6%
CT1
from
2011
to
2013
for
the
major
EU
banks
Starting CET1 Capital ratio: 11.5%
AQR adjusted CET1 starting point: 11.1%
Impact
Combined impact of stress test and AQR: 300bps
Impact of stress test: 260bps
Main driver of the impact: ‐440bps for credit losses
Shortfall
Threshold of 5.5% CET1 in the adverse and 8.0% in the baseline scenario
Banks failing the stress test: 24
Maximum shortfall: EUR 24.6BN
Shortfall under the adverse 2016: EUR 24.2BN
Shortfall after capital raising: EUR 9.5BN
Transparency
Up to 12,000 data points per bank
Capital composition and fully loaded ratio
Detailed exposure data
2 http://www.eba.europa.eu/risk‐analysis‐and‐data/eu‐wide‐stress‐testing/2014
8/10/2019 2014 EU-wide ST-Aggregate Results
http://slidepdf.com/reader/full/2014-eu-wide-st-aggregate-results 9/51
RESULTS OF 2014 EU‐WIDE STRESS TEST
9
1. Objectives of this document
The objective of this document is to summarise the main results of the 2014 EU‐wide stress test.
It describes the main methodological aspects as well as the governance of the stress test. The
main results on an EU‐level, and in some cases on a country level, are then described based on
the stress test results submitted by banks. Details on methodology, templates and scenarios for
the EU‐wide stress test can be found in documents published on the EBA website. 3 Main results
and starting point data of the stress test are published on a bank‐by‐bank level, in the form of an
interactive tool and as a database on the EBA website. This document does not capture any
information regarding the supervisory actions to be taken by competent authorities based on the
outcome of the stress test for individual banks.
This report is provided for analytical and transparency purposes only and does not substitute the
original PDF files published by the EBA which have been submitted and confirmed by the
competent authorities. Cut‐off date for the data: 25 October 2014 – 15:00 CET.
3 http://www.eba.europa.eu/risk‐analysis‐and‐data/eu‐wide‐stress‐testing/2014
8/10/2019 2014 EU-wide ST-Aggregate Results
http://slidepdf.com/reader/full/2014-eu-wide-st-aggregate-results 10/51
RESULTS OF 2014 EU‐WIDE STRESS TEST
10
2. Rationale, purpose and governance
of the
EU
‐wide
stress
test
2.1
Purpose of the exercise
The EU‐wide stress test is designed to provide supervisors, banks and other market participants
with a common analytical framework to consistently compare and contrast the resilience of EU‐
banks under adverse market conditions across a sample of 123 banking groups from 22 countries.
The
EBA
provided
competent
authorities
with
a
common
set
of
tools,
including
a
common
methodology, an internally consistent but relevant scenario, and a set of templates to capture
starting point data and stress test results to allow a rigorous assessment of banks’ resilience
under stress. The common methodology defines how banks should calculate the stress impact of
the common scenario bottom‐up and at the same time sets constraints for their calculation. Along
with the templates, it also ensures that the stress test results can be effectively disseminated in a
transparent and comparable fashion at an EU‐level. The disclosure of granular data on a bank‐by‐
bank level is meant to facilitate market discipline and also serves as a common ground on which
competent authorities base their supervisory assessments of banks’ resilience to relevant shocks,
in order to identify appropriate mitigating actions.
The EU‐wide stress test is focused on providing consistent transparency as a complement, not as
a substitute, to the supervisory review and evaluation process4 and other supervisory stress tests.
Also, although significant work was carried out in the context of the stress test to challenge banks’
results and ensure comparability across banks and countries, the stress test does not replace the
supervisory review of banks’ internal models for the calculation of capital requirements and
complements the EBA supervisory benchmarking exercise for assessing possible discrepancies in
the outcomes of banks’ internal models.
Box 1: The suite of stress tests
There is a wide range of stress tests that are applicable in banking, which can be categorised into those
carried out by firms, by supervisors and by macro‐prudential authorities, since these differ by aim and
usage of results. Region and sector‐wide micro‐prudential stress tests like the EU‐wide stress test 2014 are
not designed to replace other stress tests. Instead they are a complement which provides key information
on a consistent basis across the single market and provide additional information as input and challenge to
other stress tests. It should also be noted that the EU‐wide stress test combines micro‐prudential and
macro‐prudential aspects.
4 http://www.eba.europa.eu/documents/10180/748829/EBA‐CP‐2014‐14+%28CP+on+draft+SREP+Guidelines%29.pdf

8/10/2019 2014 EU-wide ST-Aggregate Results
http://slidepdf.com/reader/full/2014-eu-wide-st-aggregate-results 11/51
RESULTS OF 2014 EU‐WIDE STRESS TEST
11
Figure 1: Stylised categorisation of stress tests by type, aim and use
Type Aim Use
Firms
Firms own stress
testing { risk,
portfolio or
institution}
Risk management
Banks’ risk
management and
planning
Region‐wide
micro‐ prudential
stress tests
Hybrid in
methods and
aims; multiple
use
Either bottom
up or top down
Focus on
comparability
Supervisors
Micro‐ prudential
stress tests { risk,
portfolio or
institution}
Bank‐by‐bank
information on
risks and
vulnerabilities
Supervisory risk
analysis and
action, early
warning tools
Macro‐prudential
authorities
System‐wide
macro‐prudential
stress tests
{institution}
Aggregated
information on
systemic risks
Systemic stability,
economic policy
implications
With respect to the 2011 EU‐wide stress test, and cognisant of the significant capital
strengthening carried out by EU banks the 2014 exercise was improved in a number of ways:
A complete review and overhaul of the methodology was carried out. The review led, among
other changes, to the definition of tighter constraints for banks’ calculations in particular in
form of defined caps and floors and prescribed fixed stress impacts for various risk types;
The exercise was for the first time linked to an asset quality review in all EU‐countries to
ensure the validity and enhanced comparability of the starting point of the stress test;
Competent authorities, including the ECB, have taken full responsibility for the quality
assurance process including ensuring the validity of input data as well as checking the
credibility of
outcomes;
The time horizon of the stress test was increased from two to three years;
The hurdle rate was raised to 5.5% Common Equity Tier 1 ratio based on the CRR/CRD IV
implementation (as against 5% Core Tier 1 ratio in 2011).
2.2
Summary of the main methodological aspects
2.2.1 Sample of banks
The EU‐wide stress test exercise was carried out on a sample of 123 banking groups from 22
countries with a total of approximately EUR 28,000BN of assets as of end 2013, i.e. covering more
8/10/2019 2014 EU-wide ST-Aggregate Results
http://slidepdf.com/reader/full/2014-eu-wide-st-aggregate-results 12/51
RESULTS OF 2014 EU‐WIDE STRESS TEST
12
than 70% of total banking assets in the EU. The exercise was run at the highest level of
consolidation where the scope of consolidation was the perimeter of the banking group as
defined by
the
CRR/CRD
IV.
The
full
list
of
banks
for
the
EU
‐wide
stress
test
is
reported
in
the
Annex.5
The sample was selected to cover at least 50% of the national banking sector, directly or via
subsidiaries of parent companies included in the sample, in each EU Member State and Norway,
as expressed in terms of total consolidated assets as of end of 2013. Competent authorities
including the ECB could expand the sample if they deemed this necessary.
The resulting sample constitutes a significant increase compared to the 2011 stress test exercise
that was carried out on a sample of 91 banks. It should be noted that the sample for the EU‐wide
stress test
exercise
differs
from
the
sample
of
the
Comprehensive
Assessment
carried
out
by
the
ECB for two reasons:
The EU‐wide stress test was run for all EU‐countries and not limited to the euro‐zone.
The EU‐wide stress test was carried out for banks on the highest level of consolidation in the
EU, so that subsidiaries of banks from other EU or non‐EU countries and other entities were
excluded from the sample.
For the same reasons or because of the inclusions of smaller banks, samples of national variants
complementing the
EU
‐wide
stress
test
and
published
at
a later
stage
may
differ
from
the
sample
of the EU‐wide exercise.
2.2.2 The static balance sheet assumption
The EU‐wide stress test was conducted based on the assumption of a static balance sheet. A zero
growth assumption was applied for both the baseline as well as the adverse scenario. Assets and
liabilities that mature within the time horizon of the exercise were assumed to be replaced with
similar financial instruments in terms of type, credit quality and maturity as at the start of the
exercise. No workout or replacement of defaulted assets was allowed in the exercise. In
particular,
no
capital
measures
taken
after
the
reference
date
31/12/13
were
to
be
considered.
Furthermore, it was assumed in the exercise that banks would maintain the same business mix
and model (geographical, product strategies and operations) throughout the time horizon. With
respect to the P&L, revenue and cost, assumptions made by banks were to be made in line with
the constraints of zero growth and a stable business mix.
Exemptions from the static balance sheet assumption were solely granted due the directions in
mandatory restructuring plans that had been publicly announced before 31/12/2013. These
restructuring plans needed to be formally agreed with the European Commission. 26 banks were
exempted from the static balance sheet assumptions because of restructuring plans approved by
the
European
Commission
before
this
reference
date.
An
additional
6
banks
from
Germany,
5 Source for aggregate sector data: ECB aggregate consolidated data of EU banks
8/10/2019 2014 EU-wide ST-Aggregate Results
http://slidepdf.com/reader/full/2014-eu-wide-st-aggregate-results 13/51
RESULTS OF 2014 EU‐WIDE STRESS TEST
13
Slovenia and Portugal abstained from applying for the exemption in spite of an approved
restructuring plan.6
Banks that are subject to a restructuring plan were requested to align their projections under the
baseline scenario with those foreseen in their plans. Under the adverse scenario, banks were
expected to use more conservative projections in line with the adverse stress test scenario.
For a further group of 6 banks in the sample from Cyprus, Ireland and Greece restructuring plans
were approved by the European commission after the end 2013 reference date.7 To ensure a
consistent application of the common methodology, but also to give competent authorities and
market participants the full information to assess the results, these banks were allowed to submit
stress test results based on the static as well as a dynamic balance sheet assumption. All
information published
for
these
banks
is
based
on
the
static
balance
sheet
assumption
with
the
exception of one template8 that discloses resulting capital ratios based on the dynamic balance
sheet assumption. The Cypriot bank did not submit these additional results based on the dynamic
balance sheet assumption.
Capital actions taken after the reference date as well as any losses realized in 2014 do not affect
the stress test results. Major capital measures and losses between January and September 2014
are therefore disclosed on a separate template. 9
2.2.3 Definition of capital
a. Transitional arrangements
The impact of the EU‐wide stress test was assessed in terms of Common Equity Tier 1 Capital
ratios. The definition of Common Equity Tier 1 that would legally apply at each point during the
time‐horizon of the stress test was used (i.e. CRR/CRD IV definition of capital with national
transitional arrangements as per December 2013, December 2014, December 2015 and
December 2016). The regulatory framework regarding capital requirements and risk exposure
amount is similarly applied as of these dates. In particular, data provided as starting point
31/12/2013 was computed according to CRR/CRD IV requirements as of the first day of
application of
the
new
regulation,
i.e.
01/01/2014.
Transitional arrangements were reported in line with the implemented national transition
schedule to accurately reflect the legal position of every bank in each member state and to form a
basis for supervisory action. So for example, the percentage of goodwill, holdings of financial
institutions, defined pension fund assets, IRB shortfall, minority interests and deferred tax assets
that are deducted from capital for the calculation of Common Equity Tier 1 Capital increases over
6 Bayerische Landesbank, HSH Nordbank AG, IKB Deutsche Industriebank AG, Nova Kreditna Banka Maribor d.d., Nova
Ljubljanska banka d. d., Banco BPI 7 Co‐operative Central Bank Ltd, Alpha Bank, S.A., Eurobank Ergasias, S.A., National Bank of Greece, S.A., Piraeus Bank,
S.A.,
Allied
Irish
Banks
plc
8 36.TR_Outcome Dynamic_2 Calc
9 37.TR_Capital Measures_3Q2014
8/10/2019 2014 EU-wide ST-Aggregate Results
http://slidepdf.com/reader/full/2014-eu-wide-st-aggregate-results 14/51
RESULTS OF 2014 EU‐WIDE STRESS TEST
14
the years up to the full deduction prescribed in the CRR/CRD IV. However, the schedule for these
increased deductions is based on the national transition schedule. The only exception from this
rule concerns
sovereign
exposures
held
as
Available
for
Sale.
The
CRR/CRD
IV
allows
a discretion10
on this aspect so that unrealised gains/losses on sovereign bonds in this category could be subject
to a prudential filter which would avoid any impact on the banks capital position. For the purpose
of the 2014 EU‐wide stress test unrealised losses were deducted from capital in all banks based
on a common set of transitional arrangements as set out in Part Ten, Title I of the CRR for
unrealised losses, i.e. including 20% of unrealised losses in 2014, 40% in 2015 and 60% in 2016.
This treatment applied not only to additional unrealized losses during the stress projection period
but to total accumulated unrealized gains/losses, i.e. including those present at the starting point.
This treatment was applied to sovereign exposures only, but not to other exposures in the
Available‐for‐Sale portfolio. Across the EU around half of all sovereign bonds are held as Available
for Sale. This exemption was applied given the importance of sovereign exposure and because the
widening of credit spreads and a lack of confidence in public finances was identified as a core risk
underlying the ESRB macroeconomic scenario.
b. Hurdle rates
For the purpose of the EU‐wide stress test the following hurdle rates were applied as a minimum
across all participating banks based on transitional Common Equity Tier 1 capital:
The capital hurdle rate was set at 8.0% Common Equity Tier 1 ratio for the baseline scenario.
The capital hurdle rate was set at 5.5% Common Equity Tier 1 ratio for the adverse scenario.
c. Transparency on the components of capital
It should be noted that the transition schedule for CRR/CRD IV requirements as described above
differs among countries in the EU, some countries having opted for an early adoption of the fully
loaded requirements. While the results of the stress test are assessed in terms of the national
transitional Common Equity Tier 1 Capital ratio, information on relevant transitional adjustments
are published on a bank‐by‐bank level to give full transparency.
Additional Tier 1 and Tier 2 instruments eligible as regulatory capital under the CRR provisions
that convert into Common Equity Tier 1 or are written down upon a trigger event were reported
as a separate item if the conversion trigger was above the bank’s Common Equity Tier 1 ratio in
the adverse scenario. However any potential conversion or write down is not included in the
Common Equity Tier 1 ratios shown.
d. Disclosure of fully loaded CRR/CRD IV capital ratios
In addition, to further enhance comparability across countries, in particular in light of the differing
transitional arrangements described above, a fully loaded Common Equity Tier 1 Capital ratio is
10 Regulation (EU) No 575/2013, Article 467.2 subparagraph 2 and 3 of CRR.

8/10/2019 2014 EU-wide ST-Aggregate Results
http://slidepdf.com/reader/full/2014-eu-wide-st-aggregate-results 15/51
RESULTS OF 2014 EU‐WIDE STRESS TEST
15
reported for 2016 under the baseline and the adverse scenario as a memo item and is published
alongside the transitional capital ratios in the annex to this report. This ratio assumes a full
implementation
of
CRR/CRD
IV
rules,
i.e.
without
any
transitional
adjustments.
In
the
case
of
sovereign exposure held as Available for Sale, and due to the aforementioned discretion allowed
in Article 467.2 of the CRR, no common full implementation was feasible for the computation of
the fully loaded Common Equity Tier 1 ratio. In order to achieve a consistent and common
definition, the fully loaded Common Equity Tier 1 ratio reported in the context of the EU‐wide
stress test is based on the same phase‐in schedule for sovereign gains/losses from the Available‐
for‐Sale portfolio as described above, i.e. including 20% of unrealised gains/losses in 2014, 40% in
2015 and 60% in 2016.11
2.2.4 Risk coverage
The EU‐wide stress test was primarily focused on the assessment of the impact of risk drivers on
the solvency of banks. Banks were required to stress test the following common set of risks:
Credit risk;
Market risk;
Sovereign risk;
Securitisation risk;
Cost of funding and interest income.
Although the focus of the exercise remained on credit and market risk, banks were also requested
to assess the impact on interest income, including the increase in the cost of funding, over the
stress‐test time horizon. Capital requirements for operational risk were also taken into account
with operational risk costs to be included in P&L items, e.g. administrative and other operating
expenses, other income and expenses, impairments, or as additional reserves. Realised conduct
and litigation losses in 2014 were included in a bank‐level disclosure template.12 CAs assessed
whether the projection of litigation and conduct cost was relevant for the stress test results of the
corresponding banks also compared to existing provisions. In some cases this led to significant
additional losses taken into account in the stress test. Given the solvency focus and the long‐term
horizon of the exercise, a liquidity stress was not included.
As part of the stress test exercise, banks had to assess the impact of the macroeconomic scenario
(see annex) on these risk types. For example, the adverse scenario assumes a cumulative
deviation of EU GDP from its baseline level by ‐7.0% in 2016 and an increase of EU unemployment
relative to the baseline level by 2.9 percentage points in 2016, both of which together with
11
There
may
be
other
options
within
the
CRR/CRD
IV
than
the
sovereign
discretion
noted,
where
countries
take
different approaches, such as significant investment deductions 12
37.TR_Capital Measures_3Q2014
8/10/2019 2014 EU-wide ST-Aggregate Results
http://slidepdf.com/reader/full/2014-eu-wide-st-aggregate-results 16/51
RESULTS OF 2014 EU‐WIDE STRESS TEST
16
decreasing real estate values lead to higher credit losses. At the same time higher interest rates
and widening spreads have a market risk effect on bond holdings and lead to increasing funding
costs which
are
only
partly
allowed
to
be
passed
through
to
new
lending.
In
particular
the
latter
constraint for the projection of cost of funding and net interest income was defined to avoid
unduly favourable outcomes for banks. Based on the static balance sheet assumption heightened
credit and market risk could not be mitigated by hypothetical management actions or portfolio
assumptions like hedging, portfolio rebalancing or curing of defaulted loans.
2.3
Governance
The process for running the common EU‐wide stress test involved close cooperation between the
EBA, competent authorities from all relevant jurisdictions, the ECB the ESRB as well as the
European Commission:
The EBA was mainly responsible for the development of a common methodology and
templates and hosted a central question and answer process, answering over 1000 questions,
to facilitate the calculation of stress results by banks. The quality assurance process was the
responsibility of competent authorities but the EBA assisted by providing sets of statistical
benchmarks to all competent authorities as a tool to assess the banks’ results. The EBA also
acted as a data hub for the dissemination of results of the common exercise.
Competent authorities, including the ECB, were responsible for conveying instructions on
completing
the
exercise
to
banks
and
for
receiving
information
directly
from
banks.
Competent authorities were also responsible for the quality assurance process, i.e. for the
assessment of banks’ assumptions, data, estimates and results as well as the definition of
additional data and qualitative information to be provided by banks as basis for the
assessment. In addition, competent authorities were responsible for carrying out asset quality
reviews ahead of the stress test and for joining‐up the results of assets quality reviews with
stress test results – changing if required the banks’ starting position as well as the projection
over the full time horizon of the stress test. Competent authorities are responsible for
defining and the communication of all follow up actions that will form the supervisory
reaction
function.
The underlying adverse and baseline scenarios of the EU‐wide stress test were provided by
the ESRB and the European Commission respectively.
8/10/2019 2014 EU-wide ST-Aggregate Results
http://slidepdf.com/reader/full/2014-eu-wide-st-aggregate-results 17/51
RESULTS OF 2014 EU‐WIDE STRESS TEST
17
Box 2: Integration of asset quality reviews and the stress test
As part
of
a continued
effort
to
restore
confidence
in
the
EU
banking
sector,
the
EBA
issued
in
October
2013
recommendations addressed to competent authorities requiring them to undertake asset quality reviews
(AQRs) of asset classes considered to be high risk. The objective of the recommendations was to contribute
to a more uniform approach in competent authorities’ evaluations of banks’ credit portfolios, including risk
classification and provisioning, in order to support sufficiently prudent capital levels and provisions to cover
the risks associated with these exposures.13
Asset quality reviews can have two effects on the stress test data. First, changes in assets classification and
valuation can have an impact on the starting values of data used for the stress test e.g. changes in loan
classification and provisioning can affect the starting capital ratio. Second, stress projection data can be
affected. For example if the asset quality review leads to changes in the risk assessment or the share of
defaulted exposure
for
a portfolio,
projected
credit
risk
losses
for
this
portfolio
may
be
affected,
too.
Stress
test data published by the EBA and used in this report already includes both adjustments as carried out by
competent authorities.14
Details regarding the details of the impact of asset quality reviews and their and their impact will be
released by competent authorities as appropriate.15
13 EBA Recommendation on asset quality reviews EBA/REC/2013/04
14 The results of the Polish banks in the EU‐wide stress test exercise do not include AQR adjustments, due to late
submission by the Polish Authorities who will provide further details at the Polish Financial Supervision Authority
website. 15
For details on the methodology applied by the ECB see e.g. https://www.ecb.europa.eu/ssm/assessment/html/index.en.html
8/10/2019 2014 EU-wide ST-Aggregate Results
http://slidepdf.com/reader/full/2014-eu-wide-st-aggregate-results 18/51
RESULTS OF 2014 EU‐WIDE STRESS TEST
18
3. Aggregate outcomes of the exercise
3.1
Summary
Overall the scenario tested under the 2014 EU‐wide stress test saw EU banks experience EUR
261BN of capital depletion mostly caused by EUR 492BN of credit losses (‐440bps impact on CET1
Capital ratio), which is only marginally offset by continued but diminished earnings. In the adverse
scenario, the weighted average Common Equity Tier 1 ratio falls by 260 bps from 11.1% – post
AQR – at the end of 2013 to 8.5% at the end of 2016. 24 participating banks fall below the capital
threshold in the adverse scenario, leading to a maximum capital shortfall of EUR 24.6BN and a
shortfall of EUR 24.2BN in the adverse scenario. The following will focus on the latter.
3.2
Banks’ capital position ahead of the stress test
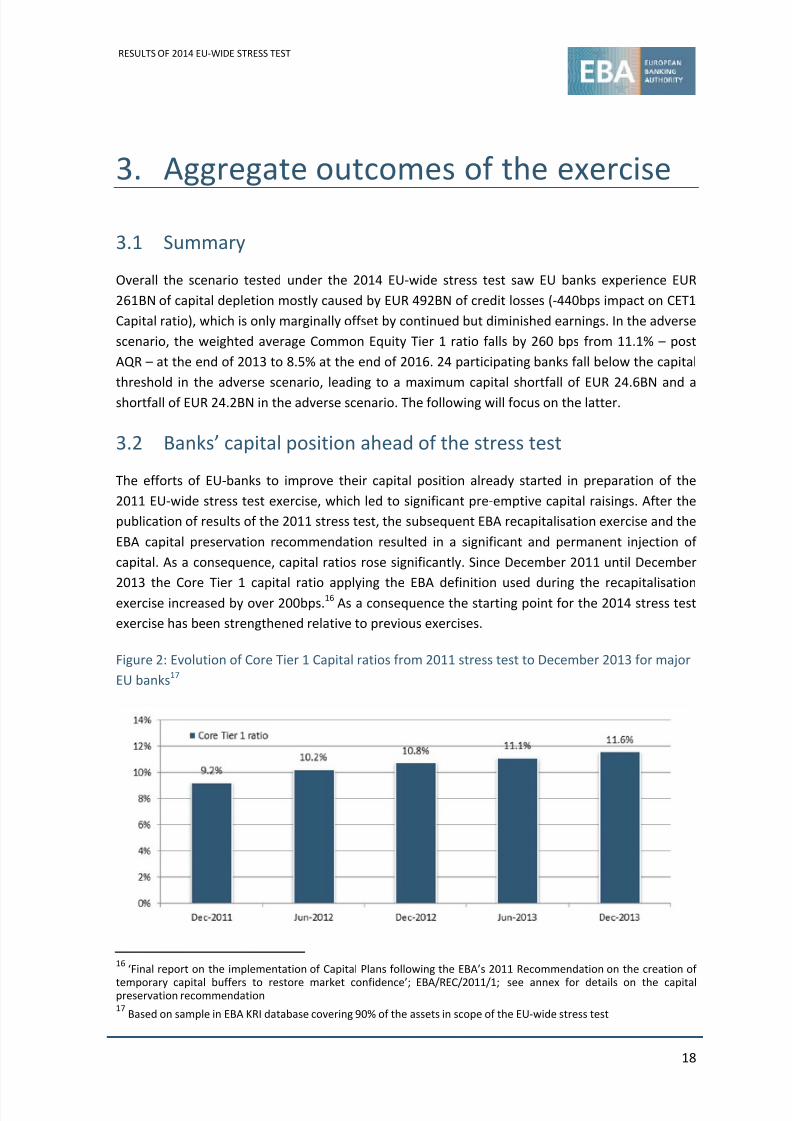
The efforts of EU‐banks to improve their capital position already started in preparation of the
2011 EU‐wide stress test exercise, which led to significant pre‐emptive capital raisings. After the
publication of results of the 2011 stress test, the subsequent EBA recapitalisation exercise and the
EBA capital preservation recommendation resulted in a significant and permanent injection of
capital. As a consequence, capital ratios rose significantly. Since December 2011 until December
2013
the
Core
Tier
1
capital
ratio
applying
the
EBA
definition
used
during
the
recapitalisation
exercise increased by over 200bps.16
As a consequence the starting point for the 2014 stress test
exercise has been strengthened relative to previous exercises.
Figure 2: Evolution of Core Tier 1 Capital ratios from 2011 stress test to December 2013 for major
EU banks17
16 ‘Final report on the implementation of Capital Plans following the EBA’s 2011 Recommendation on the creation of
temporary capital
buffers
to
restore
market
confidence’;
EBA/REC/2011/1;
see
annex
for
details
on
the
capital
preservation recommendation
17 Based on sample in EBA KRI database covering 90% of the assets in scope of the EU‐wide stress test
8/10/2019 2014 EU-wide ST-Aggregate Results
http://slidepdf.com/reader/full/2014-eu-wide-st-aggregate-results 19/51
RESULTS OF 2014 EU‐WIDE STRESS TEST
19
3.3 Impact of the stress test on capital ratios
3.3.1
Impact on
Common
Equity
Tier
1 ratios
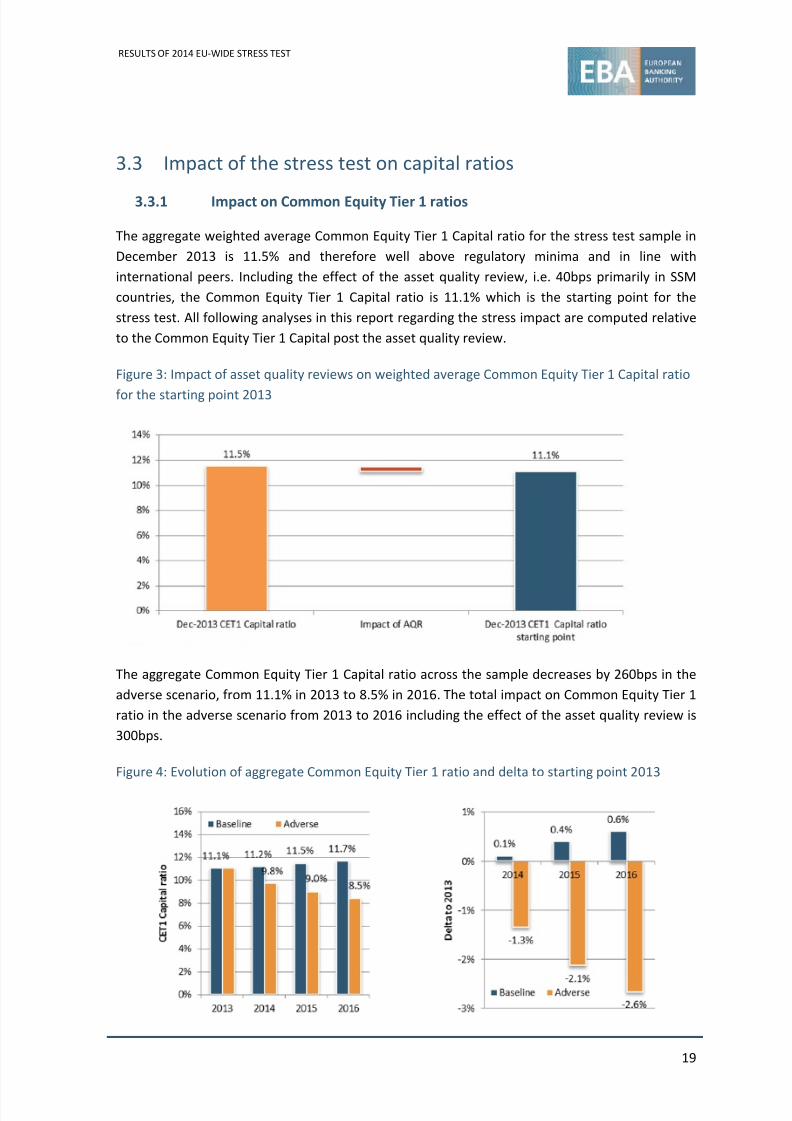
The aggregate weighted average Common Equity Tier 1 Capital ratio for the stress test sample in
December 2013 is 11.5% and therefore well above regulatory minima and in line with
international peers. Including the effect of the asset quality review, i.e. 40bps primarily in SSM
countries, the Common Equity Tier 1 Capital ratio is 11.1% which is the starting point for the
stress test. All following analyses in this report regarding the stress impact are computed relative
to the Common Equity Tier 1 Capital post the asset quality review.
Figure 3: Impact of asset quality reviews on weighted average Common Equity Tier 1 Capital ratio
for the
starting
point
2013
The aggregate Common Equity Tier 1 Capital ratio across the sample decreases by 260bps in the
adverse scenario, from 11.1% in 2013 to 8.5% in 2016. The total impact on Common Equity Tier 1
ratio in the adverse scenario from 2013 to 2016 including the effect of the asset quality review is
300bps.
Figure 4: Evolution of aggregate Common Equity Tier 1 ratio and delta to starting point 2013
8/10/2019 2014 EU-wide ST-Aggregate Results
http://slidepdf.com/reader/full/2014-eu-wide-st-aggregate-results 20/51
RESULTS OF 2014 EU‐WIDE STRESS TEST
20
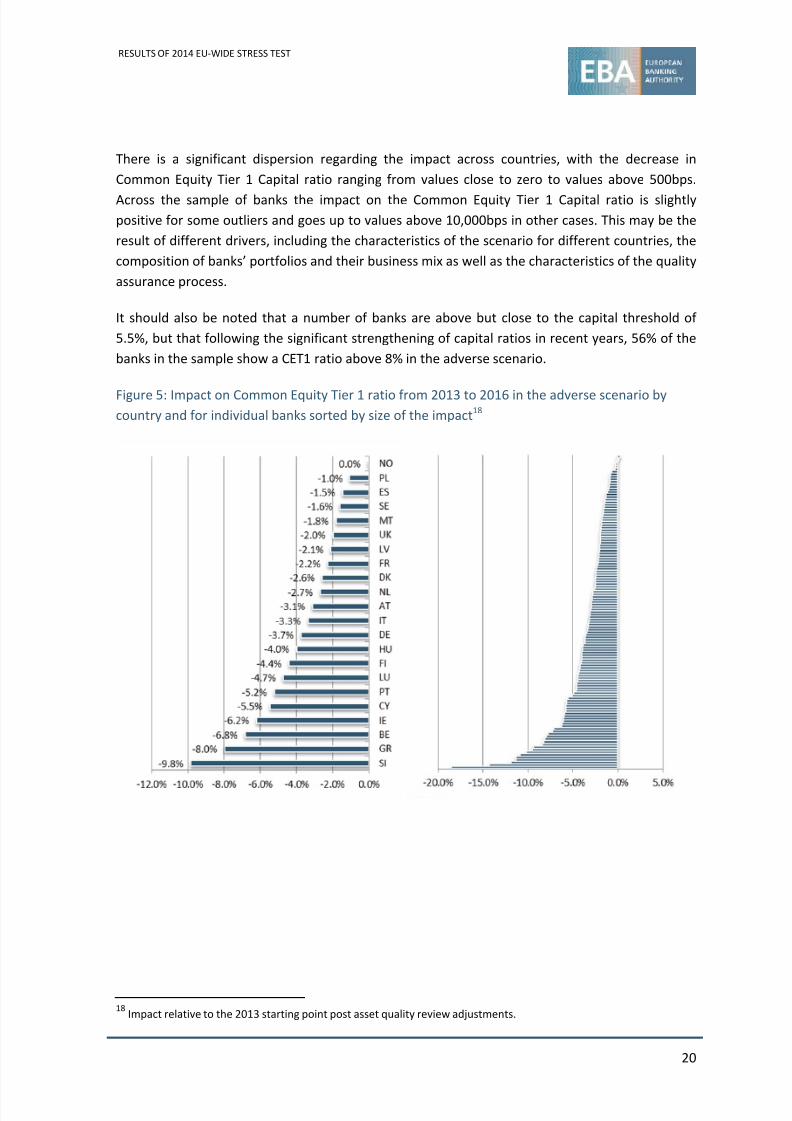
There is a significant dispersion regarding the impact across countries, with the decrease in
Common Equity Tier 1 Capital ratio ranging from values close to zero to values above 500bps.
Across the
sample
of
banks
the
impact
on
the
Common
Equity
Tier
1 Capital
ratio
is
slightly
positive for some outliers and goes up to values above 10,000bps in other cases. This may be the
result of different drivers, including the characteristics of the scenario for different countries, the
composition of banks’ portfolios and their business mix as well as the characteristics of the quality
assurance process.
It should also be noted that a number of banks are above but close to the capital threshold of
5.5%, but that following the significant strengthening of capital ratios in recent years, 56% of the
banks in the sample show a CET1 ratio above 8% in the adverse scenario.
Figure 5:
Impact
on
Common
Equity
Tier
1 ratio
from
2013
to
2016
in
the
adverse
scenario
by
country and for individual banks sorted by size of the impact18
18 Impact relative to the 2013 starting point post asset quality review adjustments.

8/10/2019 2014 EU-wide ST-Aggregate Results
http://slidepdf.com/reader/full/2014-eu-wide-st-aggregate-results 21/51
RESULTS OF 2014 EU‐WIDE STRESS TEST
21
Figure 6: Number of banks by ranges of Common Equity Tier 1 Capital ratios 2013 and 2016 in the
adverse scenario
Figure 7: Median and interquartile range for Common Equity Tier 1 Capital ratio and change from
2013 to 2016 in the adverse scenario
3.3.2 Shortfall
For the 2014 EU‐wide stress a 5.5% and 8.0% hurdle rate are defined for the adverse and the
baseline scenario respectively. In all, post the asset quality review, 16 banks experienced a
shortfall in the baseline scenario against the 8% threshold, all but one of which reported a
Common Equity Tier 1 Capital below the threshold in 2013. And in total, 24 banks experienced a
shortfall in the adverse scenario, including the 16 with a shortfall in the baseline scenario.
All banks report the maximum shortfall in the 2016 leading to an aggregate shortfall of EUR
24.2BN in the adverse scenario and EUR 9.4BN in the baseline scenario. 19
Two banks report a
19 Please refer to section 3.5.2 for information on the capital actions taken by these banks in 2014 reducing their
shortfall.
8/10/2019 2014 EU-wide ST-Aggregate Results
http://slidepdf.com/reader/full/2014-eu-wide-st-aggregate-results 22/51
RESULTS OF 2014 EU‐WIDE STRESS TEST
22
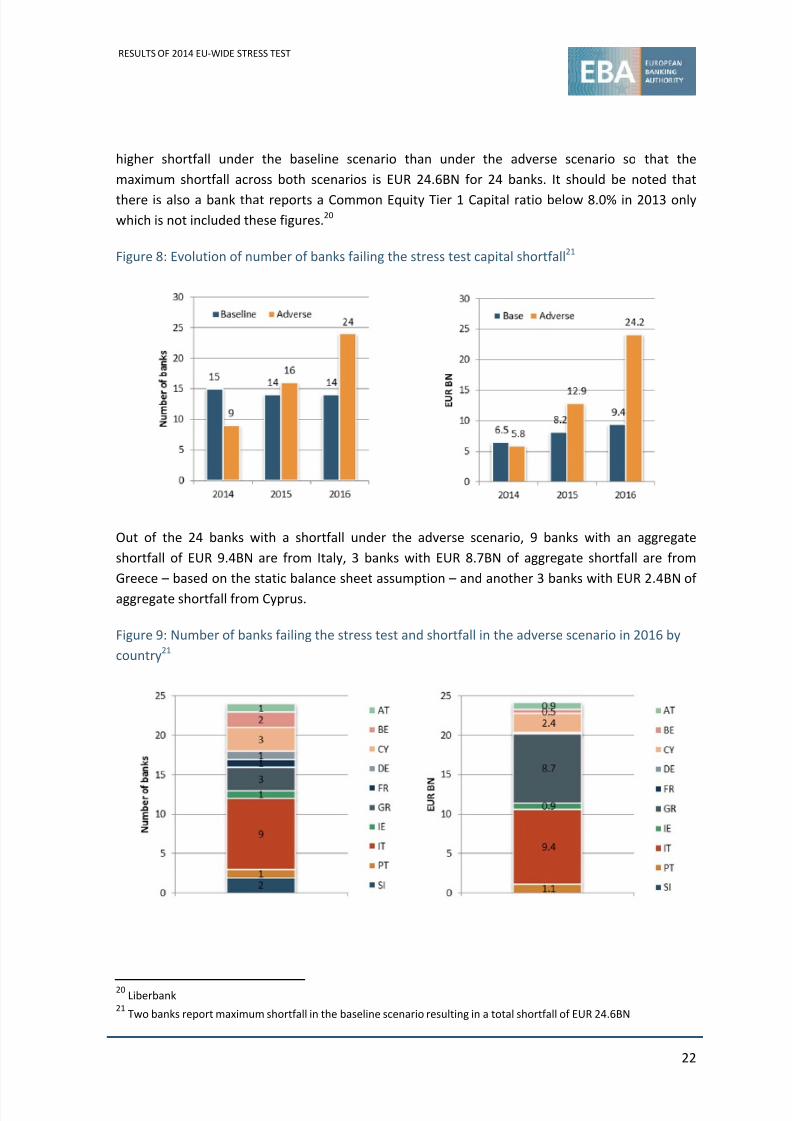
higher shortfall under the baseline scenario than under the adverse scenario so that the
maximum shortfall across both scenarios is EUR 24.6BN for 24 banks. It should be noted that
there is
also
a bank
that
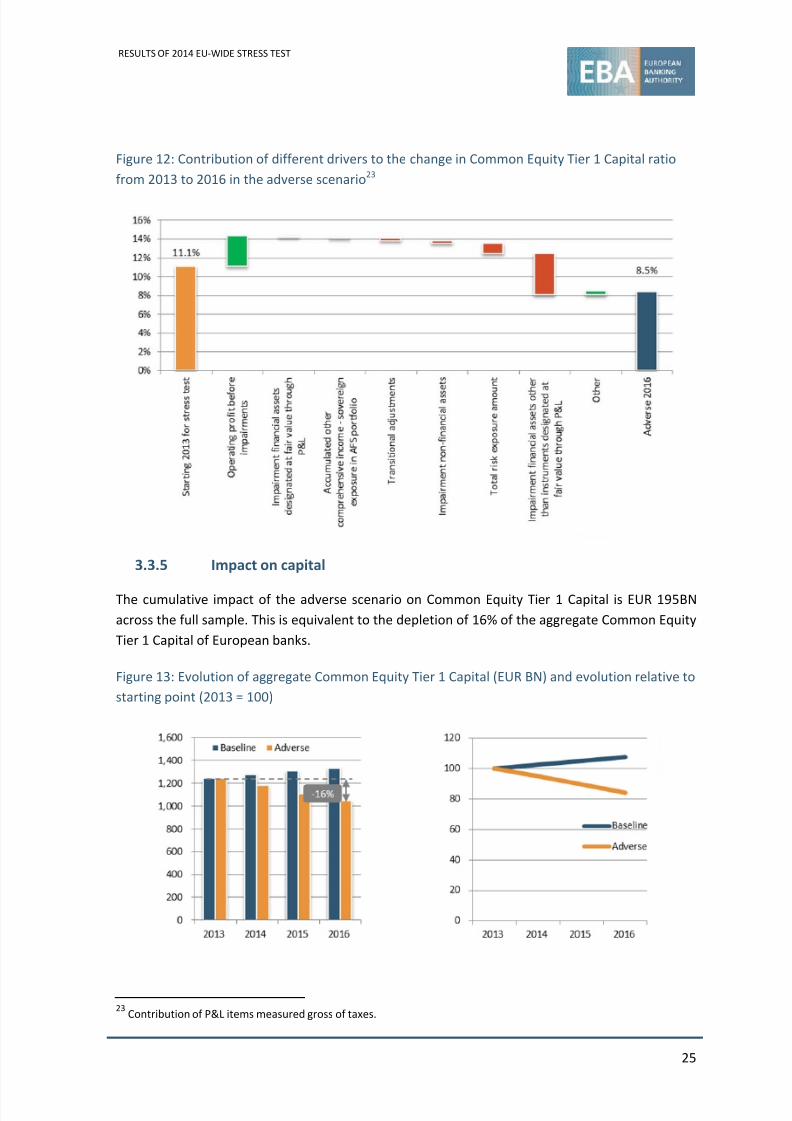
reports
a Common
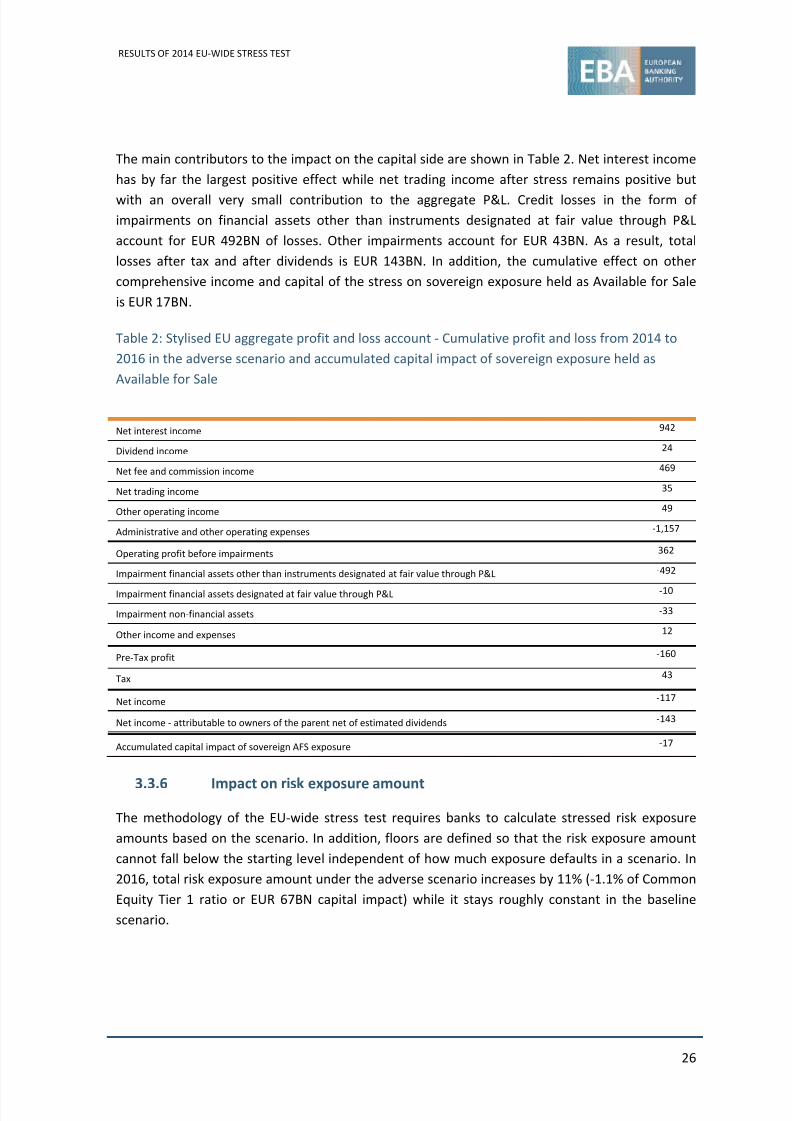
Equity
Tier
1 Capital
ratio
below
8.0%
in
2013
only
which is not included these figures.20
Figure 8: Evolution of number of banks failing the stress test capital shortfall21
Out of the 24 banks with a shortfall under the adverse scenario, 9 banks with an aggregate
shortfall of EUR 9.4BN are from Italy, 3 banks with EUR 8.7BN of aggregate shortfall are from
Greece – based on the static balance sheet assumption – and another 3 banks with EUR 2.4BN of
aggregate shortfall from Cyprus.
Figure 9: Number of banks failing the stress test and shortfall in the adverse scenario in 2016 by
country21
20 Liberbank
21 Two banks report maximum shortfall in the baseline scenario resulting in a total shortfall of EUR 24.6BN
8/10/2019 2014 EU-wide ST-Aggregate Results
http://slidepdf.com/reader/full/2014-eu-wide-st-aggregate-results 23/51
RESULTS OF 2014 EU‐WIDE STRESS TEST
23
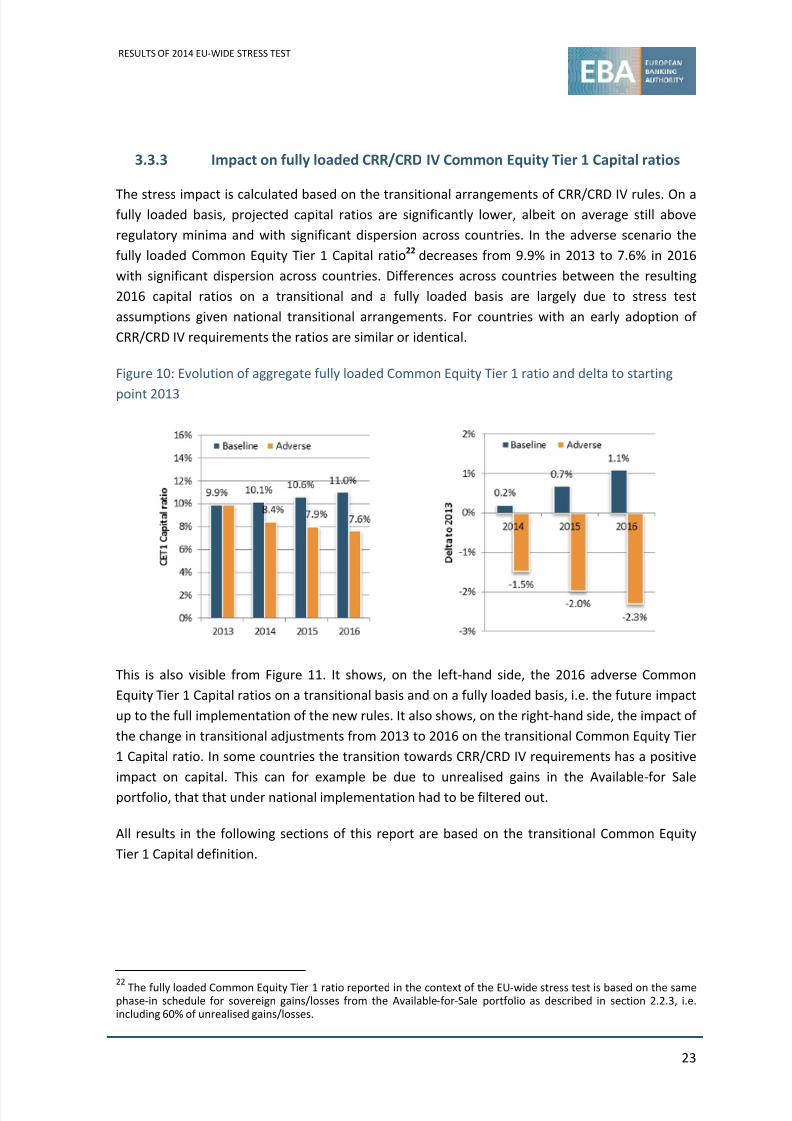
3.3.3 Impact on fully loaded CRR/CRD IV Common Equity Tier 1 Capital ratios
The stress
impact
is
calculated
based
on
the
transitional
arrangements
of
CRR/CRD
IV
rules.
On
a
fully loaded basis, projected capital ratios are significantly lower, albeit on average still above
regulatory minima and with significant dispersion across countries. In the adverse scenario the
fully loaded Common Equity Tier 1 Capital ratio22
decreases from 9.9% in 2013 to 7.6% in 2016
with significant dispersion across countries. Differences across countries between the resulting
2016 capital ratios on a transitional and a fully loaded basis are largely due to stress test
assumptions given national transitional arrangements. For countries with an early adoption of
CRR/CRD IV requirements the ratios are similar or identical.
Figure 10: Evolution of aggregate fully loaded Common Equity Tier 1 ratio and delta to starting
point 2013
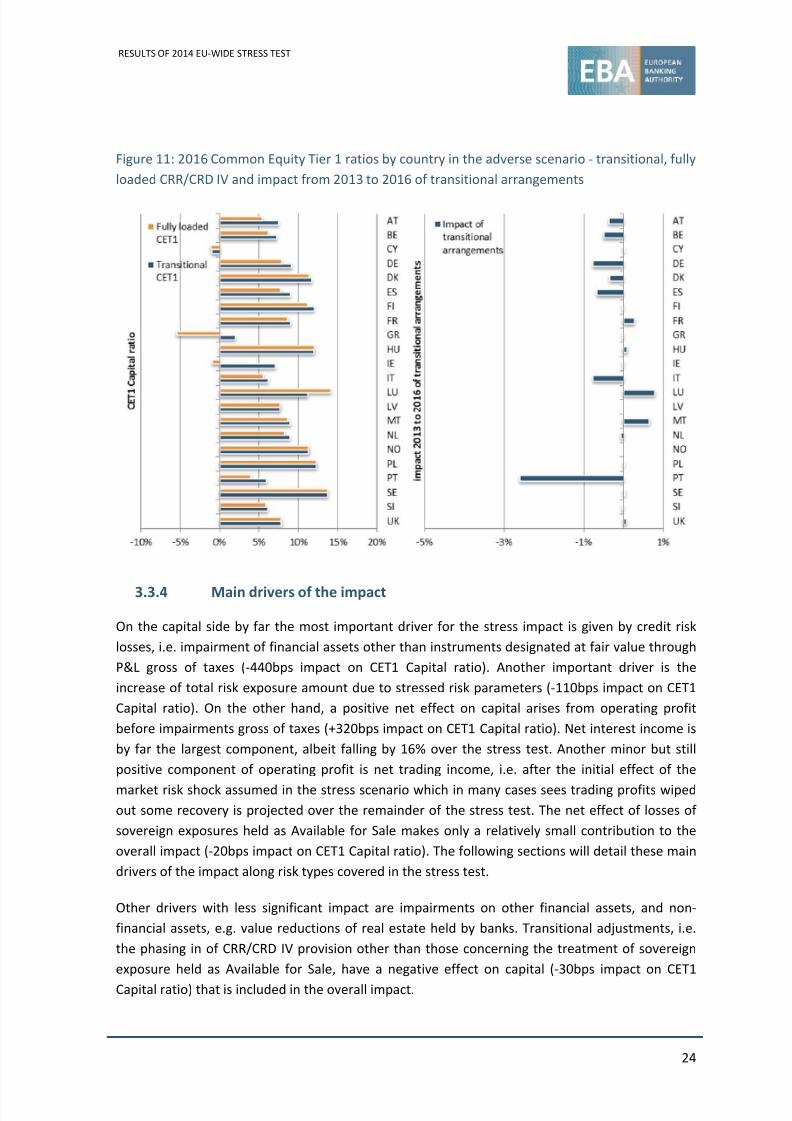
This is also visible from Figure 11. It shows, on the left‐hand side, the 2016 adverse Common
Equity Tier 1 Capital ratios on a transitional basis and on a fully loaded basis, i.e. the future impact
up to the full implementation of the new rules. It also shows, on the right‐hand side, the impact of
the change in transitional adjustments from 2013 to 2016 on the transitional Common Equity Tier
1 Capital ratio. In some countries the transition towards CRR/CRD IV requirements has a positive
impact on capital. This can for example be due to unrealised gains in the Available‐for Sale
portfolio, that that under national implementation had to be filtered out.
All results in the following sections of this report are based on the transitional Common Equity
Tier 1 Capital definition.
22 The
fully
loaded
Common
Equity
Tier
1 ratio
reported
in
the
context
of
the
EU
‐wide
stress
test
is
based
on
the
same
phase‐in schedule for sovereign gains/losses from the Available‐for‐Sale portfolio as described in section 2.2.3, i.e. including 60% of unrealised gains/losses.
8/10/2019 2014 EU-wide ST-Aggregate Results
http://slidepdf.com/reader/full/2014-eu-wide-st-aggregate-results 24/51
RESULTS OF 2014 EU‐WIDE STRESS TEST
24
Figure 11: 2016 Common Equity Tier 1 ratios by country in the adverse scenario ‐ transitional, fully
loaded CRR/CRD IV and impact from 2013 to 2016 of transitional arrangements
3.3.4
Main drivers
of
the
impact
On the capital side by far the most important driver for the stress impact is given by credit risk
losses, i.e. impairment of financial assets other than instruments designated at fair value through
P&L gross of taxes (‐440bps impact on CET1 Capital ratio). Another important driver is the
increase of total risk exposure amount due to stressed risk parameters (‐110bps impact on CET1
Capital ratio). On the other hand, a positive net effect on capital arises from operating profit
before impairments gross of taxes (+320bps impact on CET1 Capital ratio). Net interest income is
by far the largest component, albeit falling by 16% over the stress test. Another minor but still
positive component of operating profit is net trading income, i.e. after the initial effect of the
market risk
shock
assumed
in
the
stress
scenario
which
in
many
cases
sees
trading
profits
wiped
out some recovery is projected over the remainder of the stress test. The net effect of losses of
sovereign exposures held as Available for Sale makes only a relatively small contribution to the
overall impact (‐20bps impact on CET1 Capital ratio). The following sections will detail these main
drivers of the impact along risk types covered in the stress test.
Other drivers with less significant impact are impairments on other financial assets, and non‐
financial assets, e.g. value reductions of real estate held by banks. Transitional adjustments, i.e.
the phasing in of CRR/CRD IV provision other than those concerning the treatment of sovereign
exposure held as Available for Sale, have a negative effect on capital (‐30bps impact on CET1
Capital ratio)
that
is
included
in
the
overall
impact.
8/10/2019 2014 EU-wide ST-Aggregate Results
http://slidepdf.com/reader/full/2014-eu-wide-st-aggregate-results 25/51
8/10/2019 2014 EU-wide ST-Aggregate Results
http://slidepdf.com/reader/full/2014-eu-wide-st-aggregate-results 26/51

8/10/2019 2014 EU-wide ST-Aggregate Results
http://slidepdf.com/reader/full/2014-eu-wide-st-aggregate-results 27/51
RESULTS OF 2014 EU‐WIDE STRESS TEST
27
Figure 14: Evolution of aggregate total risk exposure amount (EUR BN) and evolution relative to
starting point (2013 = 100)
In particular, the methodology specifies that risk exposure amount for credit risk under the IRB
approach – accounting for 41% of total risk exposure amount – should be calculated based on
stress risk parameters, i.e. stressed PD and LGD values (see Box 1). Also, a fixed stress on risk
exposure amount for securitisations depending on the risk profile of positions is defined. For
market risk an increase for risk exposure amount for VaR, SVaR and CRM capital charges due to
predefined assumptions is assumed, while risk exposure amount stays constant for banks not
using
internal
models.
Figure 15: Evolution of risk exposure amount by risk type under the adverse scenario (2013=100)
3.4
Impact by risk type
3.4.1 Credit risk
Credit
risk
losses
in
the
form
of
“impairments
on
financial
assets
other
than
instruments
designated at fair value account” form the majority of the stress impact on capital. The
methodology requires banks to use internal models to project these losses but sets strict caps and

8/10/2019 2014 EU-wide ST-Aggregate Results
http://slidepdf.com/reader/full/2014-eu-wide-st-aggregate-results 28/51
RESULTS OF 2014 EU‐WIDE STRESS TEST
28
floors, e.g. for coverage ratios and defaulted exposure. In addition, benchmark parameters
developed by the ECB/ESRB were provided for banks which have no internal models available as
well as
for
sovereign
exposures.
It
should
also
be
noted
that
the
methodology
requires
banks
not
only to project additional defaults and corresponding credit losses, i.e. impairments, but also to
stress the provisions for exposures already defaulted at reference date December 2013.
The credit risk stress covers more than EUR 20,000BN of exposure. The stress impact leads to a
significant increase in defaults, with the share of defaulted exposures increasing from
approximately 6% to 10% in 2016 under the adverse scenario.
Due to one‐off effects in 2013 and the adjustment of impairments as result of the asset quality
reviews credit losses, i.e. impairments, on these defaulted exposures stay roughly constant from
2013 to
2014
while
the
baseline
shows
a significant
reduction.
In
total,
EUR
492BN
of
additional
credit losses including securitisations are reported under the adverse scenario, almost double the
amount projected in the baseline scenario (‐440bps impact on CET1 Capital ratio). The impact
shows a broad dispersion across countries ranging from approximately ‐130bps to more than
‐1,400bps.
Figure 16: Evolution of absolute credit losses (impairment of financial assets other than
instruments designated at fair value through P&L, EUR BN) and evolution relative to starting point
(2013 = 100)
Credit losses are fairly evenly split between Corporate and Retail exposure classes. It is worth
noting that Central Banks and Central Governments account for EUR 19BN of additional losses
(‐20bps impact on CET1 Capital ratio). With respect to the country of the counterparty, Italy
accounts for the highest share of credit losses. Counterparties in Italy, the United Kingdom, Spain,
France and Germany combined contribute more than half of credit losses while the next largest
losses are reported for the Netherlands, Brazil, the United States and Greece.
8/10/2019 2014 EU-wide ST-Aggregate Results
http://slidepdf.com/reader/full/2014-eu-wide-st-aggregate-results 29/51
RESULTS OF 2014 EU‐WIDE STRESS TEST
29
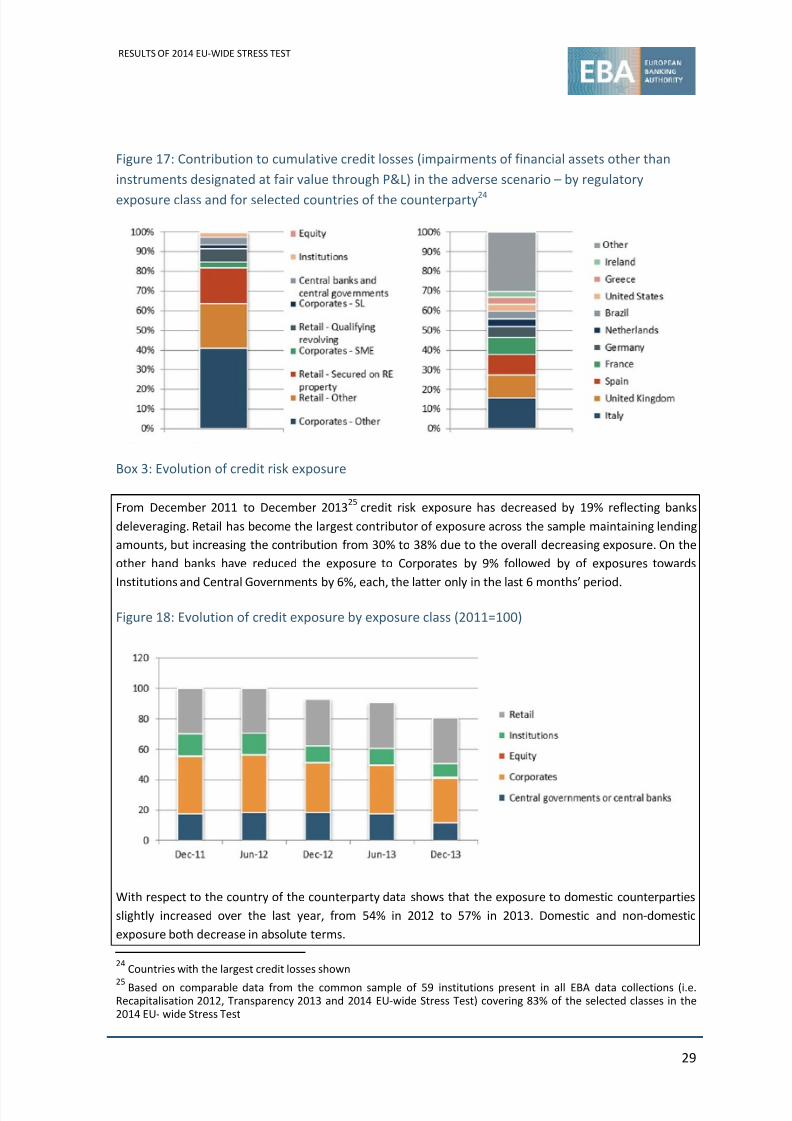
Figure 17: Contribution to cumulative credit losses (impairments of financial assets other than
instruments designated at fair value through P&L) in the adverse scenario – by regulatory
exposure class
and
for
selected
countries
of
the
counterparty24
Box 3: Evolution of credit risk exposure
From December 2011 to December 201325
credit risk exposure has decreased by 19% reflecting banks
deleveraging. Retail has become the largest contributor of exposure across the sample maintaining lending
amounts, but increasing the contribution from 30% to 38% due to the overall decreasing exposure. On the
other hand banks have reduced the exposure to Corporates by 9% followed by of exposures towards
Institutions and Central Governments by 6%, each, the latter only in the last 6 months’ period.
Figure 18: Evolution of credit exposure by exposure class (2011=100)
With respect to the country of the counterparty data shows that the exposure to domestic counterparties
slightly increased over the last year, from 54% in 2012 to 57% in 2013. Domestic and non‐domestic
exposure both decrease in absolute terms.
24 Countries with the largest credit losses shown
25 Based
on
comparable
data
from
the
common
sample
of
59
institutions
present
in
all
EBA
data
collections
(i.e.
Recapitalisation 2012, Transparency 2013 and 2014 EU‐wide Stress Test) covering 83% of the selected classes in the
2014 EU‐ wide Stress Test
8/10/2019 2014 EU-wide ST-Aggregate Results
http://slidepdf.com/reader/full/2014-eu-wide-st-aggregate-results 30/51
RESULTS OF 2014 EU‐WIDE STRESS TEST
30
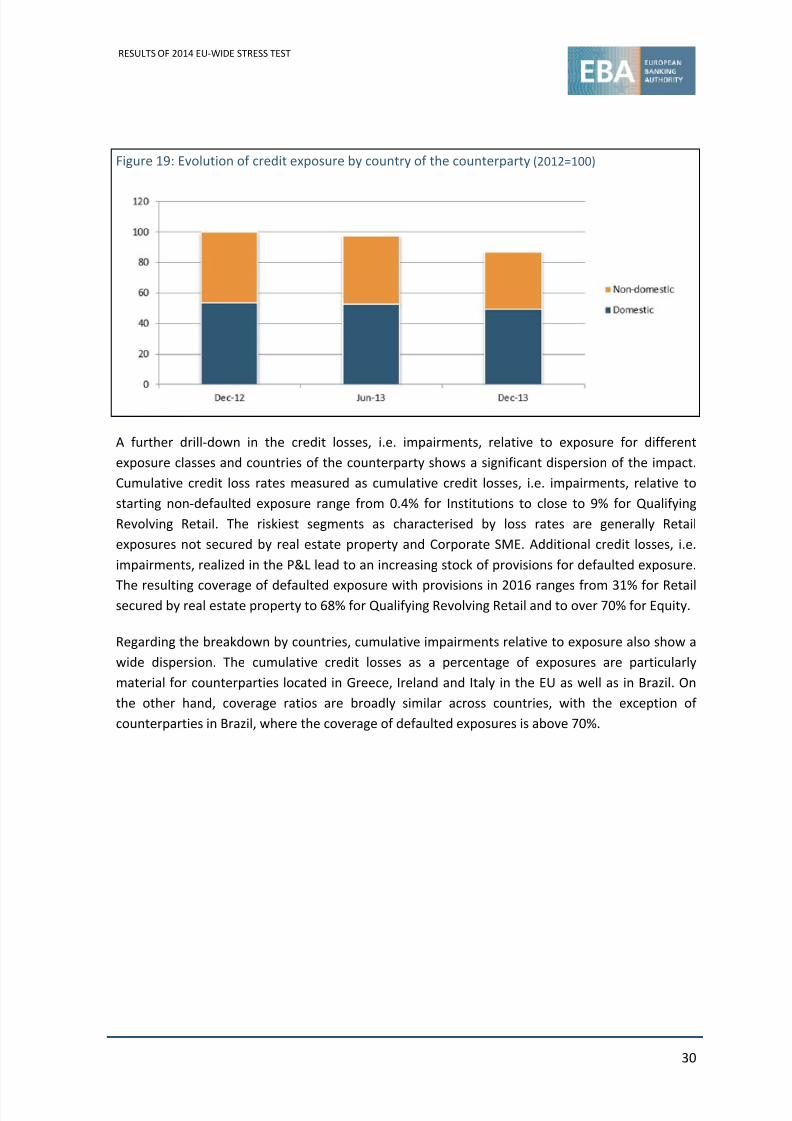
Figure 19: Evolution of credit exposure by country of the counterparty (2012=100)
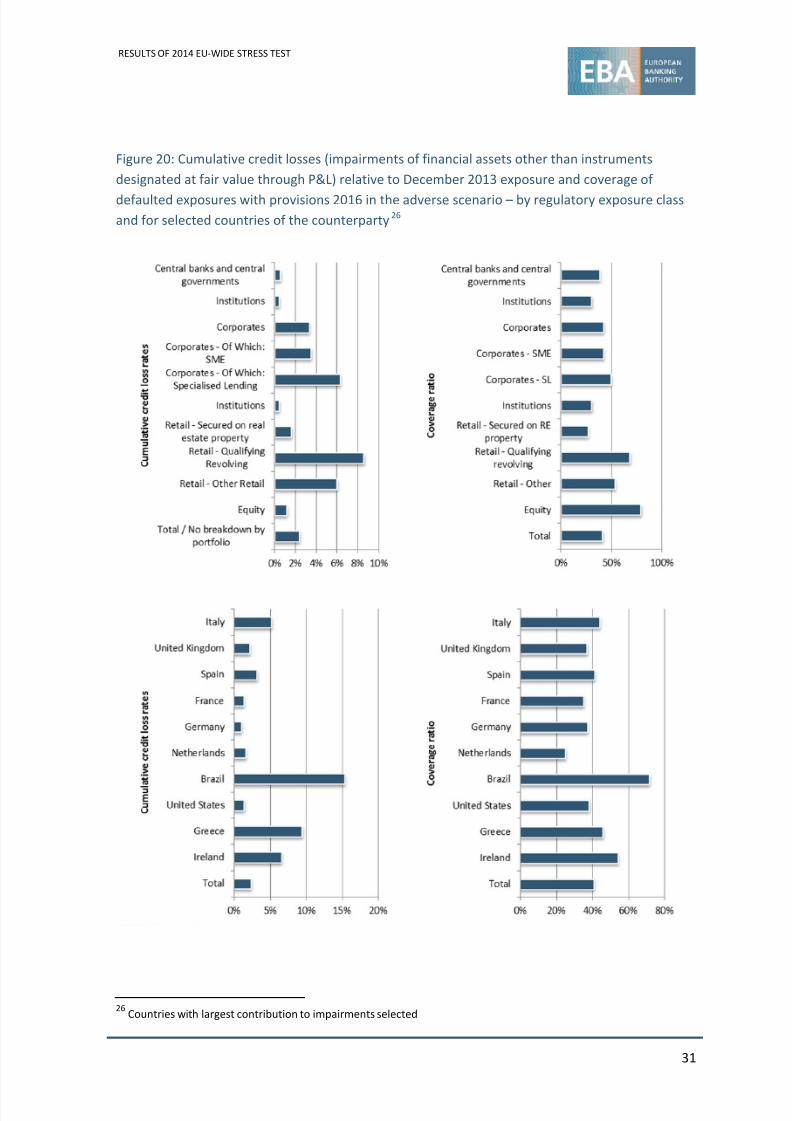
A further drill‐down in the credit losses, i.e. impairments, relative to exposure for different
exposure classes and countries of the counterparty shows a significant dispersion of the impact.
Cumulative credit loss rates measured as cumulative credit losses, i.e. impairments, relative to
starting non‐defaulted exposure range from 0.4% for Institutions to close to 9% for Qualifying
Revolving Retail. The riskiest segments as characterised by loss rates are generally Retail
exposures not secured by real estate property and Corporate SME. Additional credit losses, i.e.
impairments, realized in the P&L lead to an increasing stock of provisions for defaulted exposure.
The resulting
coverage
of
defaulted
exposure
with
provisions
in
2016
ranges
from
31%
for
Retail
secured by real estate property to 68% for Qualifying Revolving Retail and to over 70% for Equity.
Regarding the breakdown by countries, cumulative impairments relative to exposure also show a
wide dispersion. The cumulative credit losses as a percentage of exposures are particularly
material for counterparties located in Greece, Ireland and Italy in the EU as well as in Brazil. On
the other hand, coverage ratios are broadly similar across countries, with the exception of
counterparties in Brazil, where the coverage of defaulted exposures is above 70%.
8/10/2019 2014 EU-wide ST-Aggregate Results
http://slidepdf.com/reader/full/2014-eu-wide-st-aggregate-results 31/51
8/10/2019 2014 EU-wide ST-Aggregate Results
http://slidepdf.com/reader/full/2014-eu-wide-st-aggregate-results 32/51
RESULTS OF 2014 EU‐WIDE STRESS TEST
32
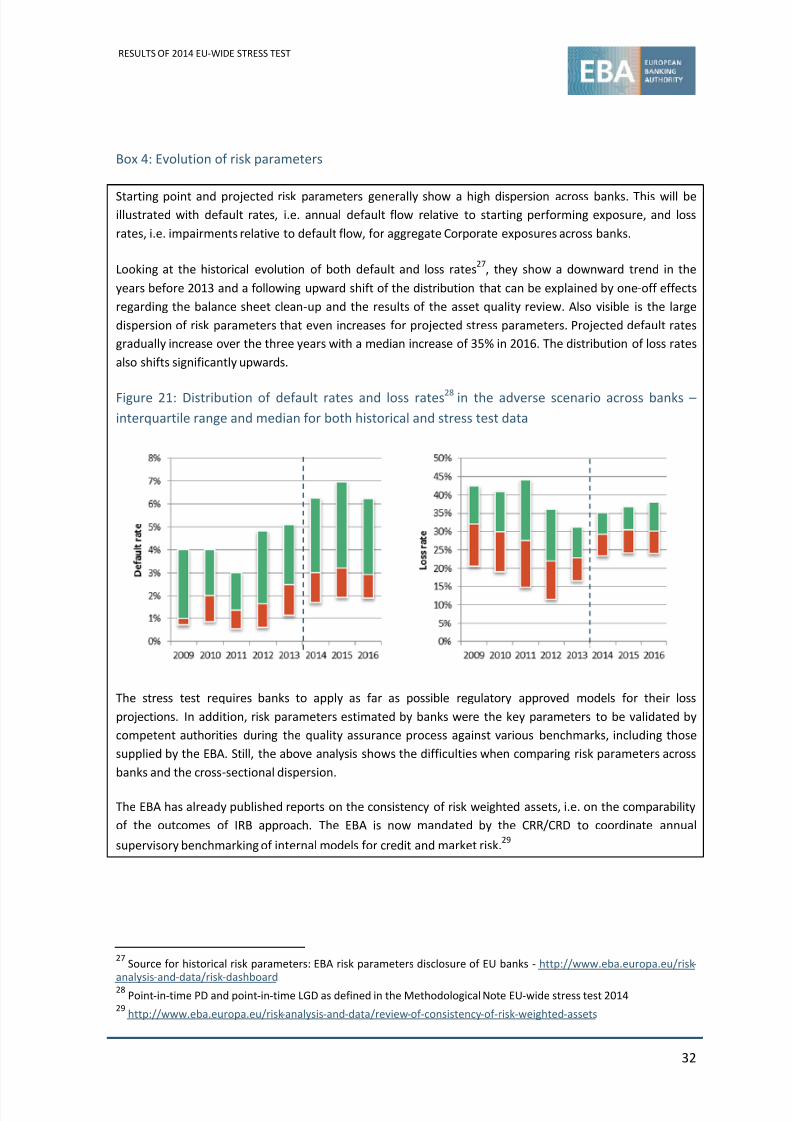
Box 4: Evolution of risk parameters
Starting point
and
projected
risk
parameters
generally
show
a high
dispersion
across
banks.
This
will
be
illustrated with default rates, i.e. annual default flow relative to starting performing exposure, and loss
rates, i.e. impairments relative to default flow, for aggregate Corporate exposures across banks.
Looking at the historical evolution of both default and loss rates27, they show a downward trend in the
years before 2013 and a following upward shift of the distribution that can be explained by one‐off effects
regarding the balance sheet clean‐up and the results of the asset quality review. Also visible is the large
dispersion of risk parameters that even increases for projected stress parameters. Projected default rates
gradually increase over the three years with a median increase of 35% in 2016. The distribution of loss rates
also shifts significantly upwards.
Figure 21:
Distribution
of
default
rates
and
loss
rates28
in
the
adverse
scenario
across
banks
–
interquartile range and median for both historical and stress test data
The stress test requires banks to apply as far as possible regulatory approved models for their loss
projections. In addition, risk parameters estimated by banks were the key parameters to be validated by
competent authorities during the quality assurance process against various benchmarks, including those
supplied by the EBA. Still, the above analysis shows the difficulties when comparing risk parameters across
banks and the cross‐sectional dispersion.
The EBA has already published reports on the consistency of risk weighted assets, i.e. on the comparability
of the outcomes of IRB approach. The EBA is now mandated by the CRR/CRD to coordinate annual
supervisory benchmarking of internal models for credit and market risk.29
27 Source for historical risk parameters: EBA risk parameters disclosure of EU banks ‐ http://www.eba.europa.eu/risk‐
analysis‐
and‐
data/risk‐
dashboard
28 Point‐in‐time PD and point‐in‐time LGD as defined in the Methodological Note EU‐wide stress test 2014
29 http://www.eba.europa.eu/risk‐analysis‐and‐data/review‐of ‐consistency‐of ‐risk‐weighted‐assets

8/10/2019 2014 EU-wide ST-Aggregate Results
http://slidepdf.com/reader/full/2014-eu-wide-st-aggregate-results 33/51
RESULTS OF 2014 EU‐WIDE STRESS TEST
33
3.4.2 Cost of funding and Net Interest Income
The adverse
scenario
of
the
EU
‐wide
stress
test
includes
an
upwards
shift
in
short
‐term
and
long
‐
term interest rates and government bond spreads. The methodology specifies how banks should
project an increase in funding costs based on this scenario while also limiting the possibility to
pass through increasing funding costs to lending. Net interest income across the sample
decreases compared to the 2013 level not just in the adverse but also in the baseline scenario.
Over the three years of the stress test time horizon, more assets and liabilities are assumed to be
replaced depending on their maturities therefore leading to a more severe effect. By 2016 net
interest income in the adverse scenario falls by EUR 56BN, i.e. by 16%, from 2013 which
corresponds to a cumulative decrease of EUR 86BN of profits compared to the baseline scenario.
Figure 22:
Evolution
of
absolute
net
interest
income
(EUR
BN)
and
evolution
relative
to
starting
point (2013 = 100)
3.4.3 Market risk
The market risk methodology prescribes how banks should translate given market risk scenarios
into P&L and capital impacts. The core element of this is the impact on net trading income,
although the methodology covers all positions. Banks were either subject to a simplified
approach, based
on
historical
losses,
or
had
to
carry
out
a full
revaluation
of
their
portfolios
for
various market risk scenarios including historical shocks. Due to this approach the baseline
scenario already assumes a reduction in net trading income. Another core element of the
methodology is the realisation of the market shocks over the three years of the stress test. An
average starting value for net trading income is reduced by 50% for 2014, 30% for 2015 and 20%
for 2016. Consequently the largest impact is in 2014 where the full net trading income in the
sample is wiped out. In the following two years net trading income recovers in line with the
prescribed methodology and as evidenced by the small net positive contribution made by trading
income to the outcome, although this is 19% or EUR 26BN lower than the baseline.

8/10/2019 2014 EU-wide ST-Aggregate Results
http://slidepdf.com/reader/full/2014-eu-wide-st-aggregate-results 34/51
RESULTS OF 2014 EU‐WIDE STRESS TEST
34
Figure 23: Evolution of aggregate net trading income (EUR BN) and evolution relative to starting
point (2013 = 100)
3.4.4 Sovereign risk
The stress test required a specific treatment of sovereign exposures. In particular, fixed valuation
haircuts were prescribed for all EU countries in the adverse scenario to take into account the
credit and interest rate risk of direct sovereign exposures. Other sovereign exposures, i.e.
exposure to other countries and all derivative positions, were to be stressed consistently based on
the market risk scenario. In total, more than EUR 2,700BN of direct sovereign exposure were in
scope of
the
stress
test.
48%
of
direct
exposures
are
held
as
Available
for
Sale
for
which
haircuts
had to be applied to project the impact on capital via other comprehensive income. The second
biggest accounting category with 35% – Loans and Receivables and Held to Maturity was subject
to the credit risk methodology. Other categories for which the same treatment as for Available for
Sale applied are less significant, i.e. 14% Held for Trading and 3% designated at fair value through
profit and loss. The total impact on capital is driven first by the valuation haircuts which have the
highest effect in 2014 and second by the common phase out of prudential filters which led to an
increasing realisation of losses in capital until 2016. The net effect on capital in the adverse
scenario is a reduction by EUR 17BN (‐20bps impact on CET1 Capital ratio) in 2016. It should be
noted
that
the
stress
impact
was
not
limited
to
losses
due
to
valuation
effect.
As
described
in
section 3.4.1, cumulative effects due to the prescribed credit risk stress for sovereign exposure
account for another EUR 19BN of impairments (‐20bps impact on CET1 Capital ratio).

8/10/2019 2014 EU-wide ST-Aggregate Results
http://slidepdf.com/reader/full/2014-eu-wide-st-aggregate-results 35/51
RESULTS OF 2014 EU‐WIDE STRESS TEST
35
Figure 24: Direct net sovereign exposure by accounting book December 2013 (%) and capital
impact of AfS exposure in the adverse scenario (EUR BN)
Box 5: Distribution and evolution of sovereign exposure
The bulk of direct sovereign exposure is concentrated towards Germany and Italy which account for more
than 30% of exposure. More than half of direct sovereign exposure is held by domestic banks, which
gradually but consistently increased their share since December 2010 by close to 10%. Also the share of
exposure booked as Available for Sale has increased by approximately 10% since December 2010.30
Figure 25:
Direct
net
sovereign
exposure
(EUR
BN)
held
by
domestic
bank
and
held
by
non
‐
domestic banks December 2013 in the sample of the EU‐wide stress test
30 Historical
evolution
based
on
comparable
data
from
the
common
sample
of
58
institutions
present
in
EBA
data
collections (i.e. Recapitalisation 2011, Recapitalisation 2012, Transparency 2013 and 2014 EU‐wide Stress Test) covering 78% of the exposure of the 2014 EU‐ wide Stress Test.

8/10/2019 2014 EU-wide ST-Aggregate Results
http://slidepdf.com/reader/full/2014-eu-wide-st-aggregate-results 36/51
RESULTS OF 2014 EU‐WIDE STRESS TEST
36
3.5
Supervisory reaction function
3.5.1
Process and
communication
Supervisory actions to be taken are the responsibility of the competent authorities and not
covered in this report. Supervisory actions will be communicated by each competent authority
shortly after the publication of the stress test results. Some common building blocks were agreed
across participating countries:
The stress test will inform supervisory actions on a range of banks and not just those who
“fail” the stress test as measures by defined capital thresholds.
The
stress
test
can
be
used
to
understand
a
range
of
potential
weaknesses
in
banks
and
therefore can inform a range of supervisory actions. In some cases these may be capital
related. Some capital actions could be raising capital in the short term to cover shortfalls but
in other cases weaknesses in capital plans may lead to other types of capital strengthening
including restrictions on dividends. However, there is a broad range of other actions that
might be considered including changes to banks’ strategies, reducing concentrations, cost
reduction and continued cleaning or reduction of balance sheets by disposing of non‐
performing and other assets.
The ECB already announced that all banks that face a capital shortfall on the basis of the results of
the comprehensive
assessment
will
be
requested
to
submit
capital
plans
within
two
weeks
after
the disclosure of the results, detailing how the shortfalls will be covered within the foreseen time
frame. Banks will be expected to cover shortfalls arising from the AQR, or the baseline scenario of
the stress test, within six months, and shortfalls arising from the adverse scenario of the stress
test within nine months. The overall amount of capital to be raised by a bank will be the
maximum of the shortfall under the AQR, the baseline scenario and the adverse scenario of the
stress test, whenever it appears over the three‐year horizon. For other countries the
communication of supervisory reaction functions differs. No bank from non‐SSM countries
reported a shortfall based on the stress test. Additional actions might still form part e.g. of the
usual SREP process for a bank. It should also be noted that the supervisory reaction function for
UK banks will draw on both the EU‐wide and UK variant stress tests, and will be communicated as
part of the publication of the UK stress test variant in December. In particular, any supervisory
reactions will not only take into account the stress test result given as Common Equity Tier 1
Capital ratios but also any mitigation actions already taken by the banks as well as other context
to the bank’s situation, e.g. losses already realised in 2014, existing restructuring plans and the
assessment of forward‐looking capital plans to meet future capital targets like fully phased‐in
CRR/CRD IV requirements.
3.5.2 Capital actions
Banks already
took
actions
that
mitigate
the
stress
test
capital
impact
and
shortfall
across
the
sample. Overall EUR 53.6BN of Common Equity Tier 1 Capital was raised or resulted from the
conversion of hybrid instruments by banks in the sample between January and September 2014
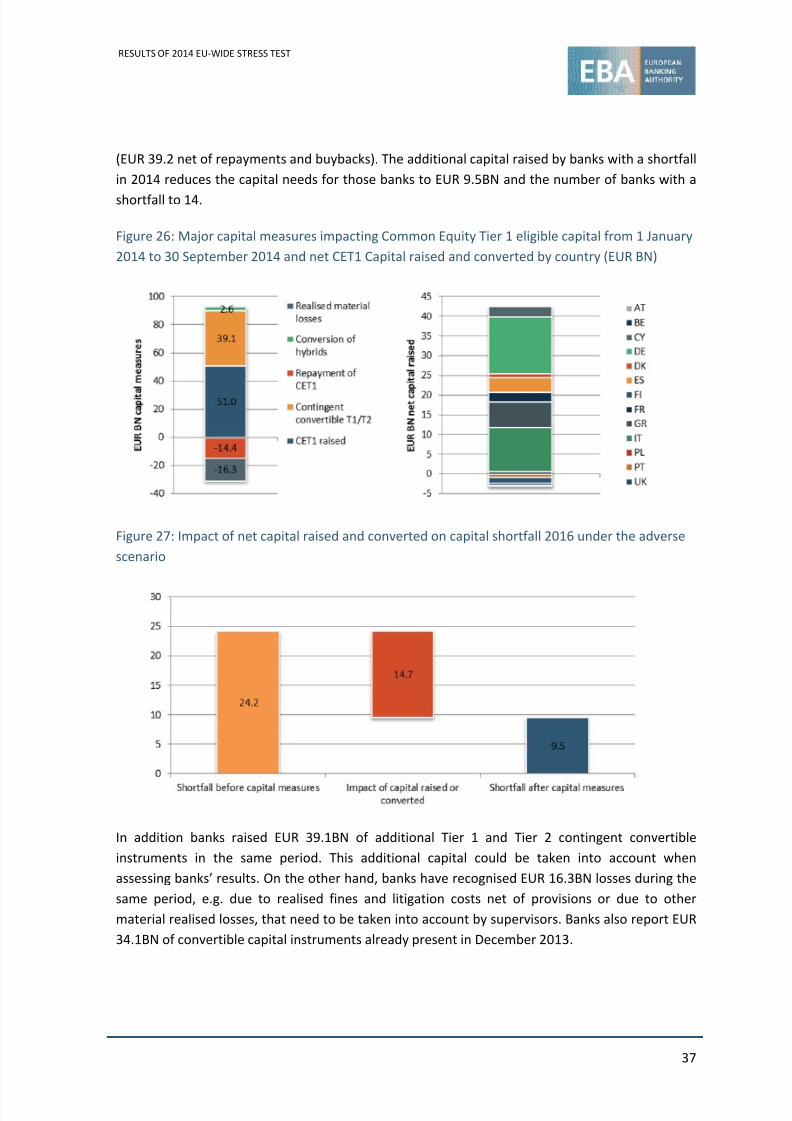
8/10/2019 2014 EU-wide ST-Aggregate Results
http://slidepdf.com/reader/full/2014-eu-wide-st-aggregate-results 37/51
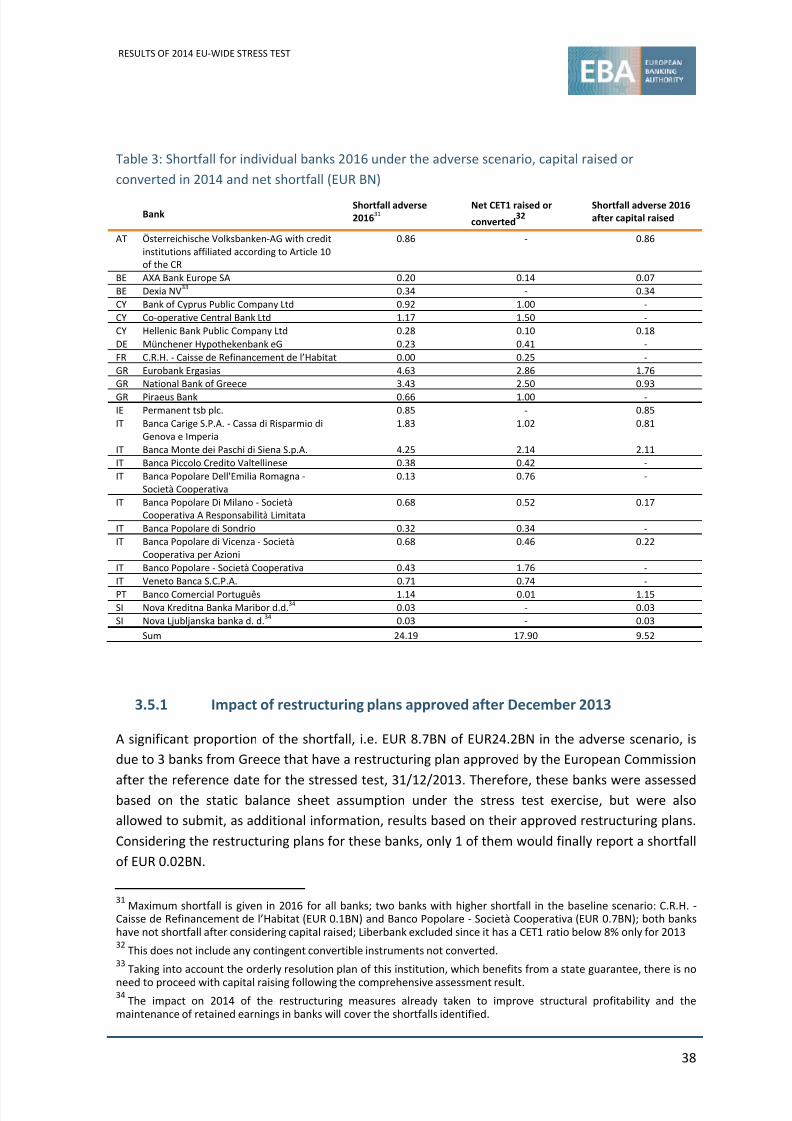
8/10/2019 2014 EU-wide ST-Aggregate Results
http://slidepdf.com/reader/full/2014-eu-wide-st-aggregate-results 38/51
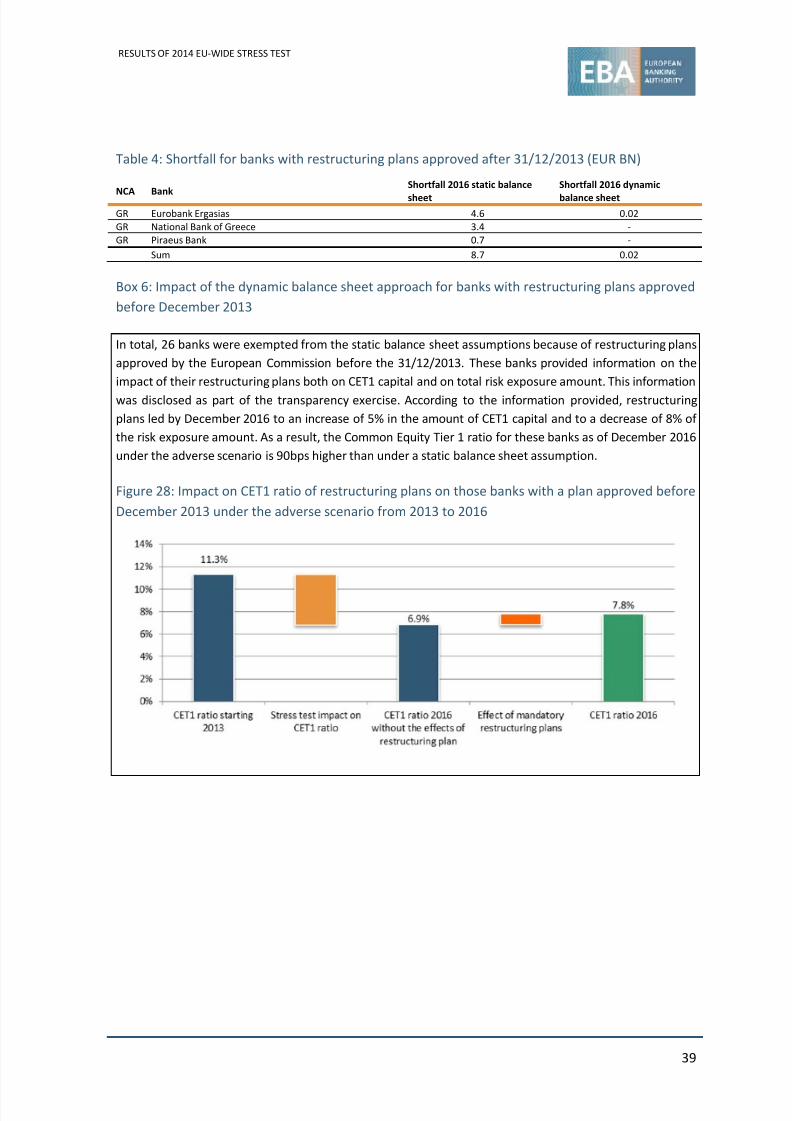
8/10/2019 2014 EU-wide ST-Aggregate Results
http://slidepdf.com/reader/full/2014-eu-wide-st-aggregate-results 39/51
RESULTS OF 2014 EU‐WIDE STRESS TEST
39
Table 4: Shortfall for banks with restructuring plans approved after 31/12/2013 (EUR BN)
NCA
Bank
Shortfall 2016 static balance
sheet
Shortfall 2016 dynamic
balance sheet
GR Eurobank Ergasias 4.6 0.02
GR National Bank of Greece 3.4 ‐
GR Piraeus Bank 0.7 ‐
Sum 8.7 0.02
Box 6: Impact of the dynamic balance sheet approach for banks with restructuring plans approved
before December 2013
In total, 26 banks were exempted from the static balance sheet assumptions because of restructuring plans
approved by the European Commission before the 31/12/2013. These banks provided information on the
impact of their restructuring plans both on CET1 capital and on total risk exposure amount. This information
was disclosed as part of the transparency exercise. According to the information provided, restructuring
plans led by December 2016 to an increase of 5% in the amount of CET1 capital and to a decrease of 8% of
the risk exposure amount. As a result, the Common Equity Tier 1 ratio for these banks as of December 2016
under the adverse scenario is 90bps higher than under a static balance sheet assumption.
Figure 28: Impact on CET1 ratio of restructuring plans on those banks with a plan approved before
December 2013 under the adverse scenario from 2013 to 2016
8/10/2019 2014 EU-wide ST-Aggregate Results
http://slidepdf.com/reader/full/2014-eu-wide-st-aggregate-results 40/51
RESULTS OF 2014 EU‐WIDE STRESS TEST
40
Annex 1: EU‐wide stress test sample of
banks and
bank
‐level
results
The following table lists key stress test result for all 123 individual banks. 35 For each bank it is
indicated if the bank has a restructuring plan approved before the reference date of 31/12/2013
and if it was granted an exemption from the static balance sheet assumption.36 It is also shown if
the bank has a restructuring plan that was approved after the reference date so that for these
banks results are shown based on the static balance sheet assumption, i.e. the restructuring plan
is not taken into account but the banks could provide additional results based on the dynamic
balance sheet
assumption. 37
For
each
bank
the
transitional
Common
Equity
Tier
1 ratio
is
shown
for the starting point and the value for 2016 under the baseline and the adverse scenario. It
should be noted that hurdle rates are defined for this transitional Common Equity Tier 1 ratio so
that only this metrics applied for assessing the need for supervisory actions. In addition and to
enhance comparability the fully loaded CRR/CRD IV ratio for 2016 is also included as a memo item
only.38
35 The list of banks taking part in the 2014 EU‐wide stress test was updated to accommodate the following changes
since April 2014: Banco Ceiss and Unicaja (MPCA Ronda, Cádiz, Almería, Málaga, Antequera y Jaén): Following the
acquisition of
Banco
Ceiss
by
Unicaja,
the
stress
test
is
being
performed
at
the
level
of
the
merged
entity
(Unicaja).
Banco Espirito Santo: Following the recent resolution decision applied to Banco Espírito Santo that led to the creation of Novo Banco, the stress test exercise for Novo Banco has been postponed. Wüstenrot & Württembergische AG: This bank will be treated at a sub‐consolidated level, which means that the stress test and the publication of results will be
conducted separately for the two bank entities of the group, Wüstenrot Bank AG Pfandbriefbank and Wüstenrot Bausparkasse AG. 36
Banks with an approved restructuring plan that did not apply for an exemption: Bayerische Landesbank, HSH
Nordbank AG, IKB Deutsche Industriebank AG, Nova Ljubljanska banka d. d., Nova Kreditna Banka Maribor d.d., Banco
BPI 37
Banks with restructuring plan after 31/12/2013: Co‐operative Central Bank Ltd, Alpha Bank, S.A., Eurobank Ergasias, S.A., National Bank of Greece, S.A., Piraeus Bank, S.A., Allied Irish Banks plc – no submission of second dynamic
calculation by Cooperative Central Bank LtD
38 The results of the Polish banks in the EU‐wide stress test exercise do not include AQR adjustments, due to late
submission by the Polish Authorities who will provide further details at the Polish Financial Supervision Authority
website. Including
the
AQR
would
have
the
following
effect
on
banks’
CET1
ratios:
ALIOR
BANK
SA
(‐1.3pp),
BANK
BPH
SA (‐0.1pp), BANK HANDLOWY W WARSZAWIE SA (‐0.5pp), BANK OCHRONY SRODOWISKA SA (‐2.2pp), GETIN NOBLE
BANK SA (‐1.1pp), POWSZECHNA KASA OSZCZEDNOSCI BANK POLSKI S.A. (PKO BANK POLSKI) (‐0.9pp).
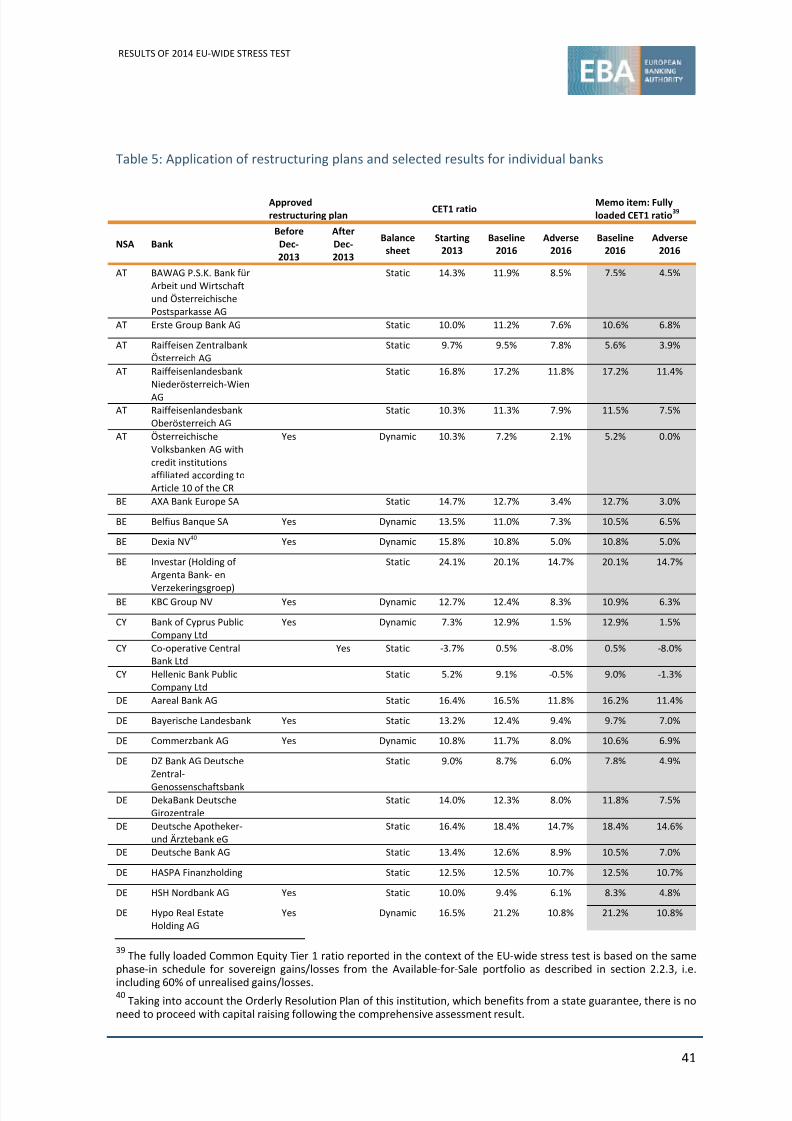
8/10/2019 2014 EU-wide ST-Aggregate Results
http://slidepdf.com/reader/full/2014-eu-wide-st-aggregate-results 41/51
RESULTS OF 2014 EU‐WIDE STRESS TEST
41
Table 5: Application of restructuring plans and selected results for individual banks
Approved
restructuring plan
CET1 ratio
Memo item: Fully
loaded CET1 ratio39
NSA Bank
Before
Dec‐
2013
After
Dec‐
2013
Balance
sheet
Starting
2013
Baseline
2016
Adverse
2016
Baseline
2016
Adverse
2016
AT BAWAG P.S.K. Bank für Arbeit und Wirtschaft und Österreichische
Postsparkasse AG
Static 14.3% 11.9% 8.5% 7.5% 4.5%
AT Erste Group Bank AG Static 10.0% 11.2% 7.6% 10.6% 6.8%
AT Raiffeisen Zentralbank
Österreich AG
Static 9.7% 9.5% 7.8% 5.6% 3.9%
AT Raiffeisenlandesbank
Niederösterreich‐Wien
AG
Static 16.8% 17.2% 11.8% 17.2% 11.4%
AT Raiffeisenlandesbank
Oberösterreich AG
Static 10.3% 11.3% 7.9% 11.5% 7.5%
AT Österreichische
Volksbanken‐AG with
credit institutions
affiliated according to
Article 10 of the CR
Yes Dynamic 10.3% 7.2% 2.1% 5.2% 0.0%
BE AXA Bank Europe SA Static 14.7% 12.7% 3.4% 12.7% 3.0%
BE Belfius Banque SA Yes Dynamic 13.5% 11.0% 7.3% 10.5% 6.5%
BE Dexia NV40
Yes Dynamic 15.8% 10.8% 5.0% 10.8% 5.0%
BE Investar (Holding of Argenta Bank‐ en
Verzekeringsgroep)
Static 24.1% 20.1% 14.7% 20.1% 14.7%
BE KBC Group NV Yes Dynamic 12.7% 12.4% 8.3% 10.9% 6.3%
CY Bank of Cyprus Public
Company Ltd
Yes Dynamic 7.3% 12.9% 1.5% 12.9% 1.5%
CY Co‐operative Central Bank Ltd
Yes Static ‐3.7% 0.5% ‐8.0% 0.5% ‐8.0%
CY Hellenic Bank Public
Company Ltd
Static 5.2% 9.1% ‐0.5% 9.0% ‐1.3%
DE Aareal Bank AG Static 16.4% 16.5% 11.8% 16.2% 11.4%
DE Bayerische Landesbank Yes Static 13.2% 12.4% 9.4% 9.7% 7.0%
DE Commerzbank AG Yes Dynamic 10.8% 11.7% 8.0% 10.6% 6.9%
DE DZ Bank AG Deutsche
Zentral‐
Genossenschaftsbank
Static 9.0% 8.7% 6.0% 7.8% 4.9%
DE DekaBank Deutsche
Girozentrale
Static 14.0% 12.3% 8.0% 11.8% 7.5%
DE Deutsche Apotheker‐
und Ärztebank eG
Static 16.4% 18.4% 14.7% 18.4% 14.6%
DE Deutsche Bank AG Static 13.4% 12.6% 8.9% 10.5% 7.0%
DE HASPA Finanzholding Static 12.5% 12.5% 10.7% 12.5% 10.7%
DE HSH Nordbank AG Yes Static 10.0% 9.4% 6.1% 8.3% 4.8%
DE Hypo Real Estate
Holding AG
Yes Dynamic 16.5% 21.2% 10.8% 21.2% 10.8%
39 The fully loaded Common Equity Tier 1 ratio reported in the context of the EU‐wide stress test is based on the same
phase‐in schedule for sovereign gains/losses from the Available‐for‐Sale portfolio as described in section 2.2.3, i.e.
including 60%
of
unrealised
gains/losses.
40 Taking into account the Orderly Resolution Plan of this institution, which benefits from a state guarantee, there is no
need to proceed with capital raising following the comprehensive assessment result.

8/10/2019 2014 EU-wide ST-Aggregate Results
http://slidepdf.com/reader/full/2014-eu-wide-st-aggregate-results 42/51
RESULTS OF 2014 EU‐WIDE STRESS TEST
42
Approved
restructuring plan
CET1 ratio
Memo item: Fully
loaded CET1 ratio39
NSA
Bank
Before
Dec‐
2013
After
Dec‐
2013
Balance
sheet Starting
2013
Baseline
2016
Adverse
2016
Baseline
2016
Adverse
2016
DE IKB Deutsche
Industriebank AG
Yes Static 9.0% 8.8% 6.5% 8.1% 6.1%
DE KfW IPEX‐Bank GmbH Static 12.8% 12.3% 9.4% 11.9% 9.0%
DE Landesbank Baden‐
Württemberg
Yes Dynamic 13.5% 12.3% 7.4% 11.1% 5.5%
DE Landesbank Berlin
Holding AG
Static 9.9% 10.5% 6.8% 10.1% 6.5%
DE Landesbank Hessen‐
Thüringen Girozentrale
Static 12.2% 11.6% 8.2% 10.9% 7.7%
DE Landeskreditbank
Baden‐Württemberg‐
Förderbank
Static 13.5% 14.5% 11.2% 14.5% 11.2%
DE
Landwirtschaftliche Rentenbank
Static 16.9% 17.7% 12.9%
17.7%
12.9%
DE Münchener Hypothekenbank eG
Static 6.9% 5.8% 2.9% 5.7% 2.9%
DE NRW.Bank Static 37.4% 33.8% 31.5% 33.4% 31.1%
DE Norddeutsche
Landesbank‐
Girozentrale
Yes Dynamic 10.1% 12.9% 9.2% 12.3% 8.5%
DE Volkswagen Financial Services AG
Static 9.4% 10.4% 7.0% 10.3% 6.5%
DE WGZ Bank AG
Westdeutsche
Genossenschafts‐
Zentralbank
Static 10.0% 9.7% 7.3% 6.9% 4.6%
DE Wüstenrot Bank AG
Pfandbriefbank
Static 8.6% 8.0% 6.5% 8.0% 6.5%
DE Wüstenrot Bausparkasse AG
Static 10.6% 9.7% 6.9% 9.7% 6.9%
DK Danske Bank Static 13.7% 14.5% 11.7% 14.0% 11.1%
DK Jyske Bank Static 14.9% 18.6% 13.6% 18.4% 13.3%
DK Nykredit Static 15.5% 16.6% 10.9% 16.6% 10.9%
DK Sydbank Static 13.7% 15.5% 12.9% 15.5% 12.9%
ES Banco Bilbao Vizcaya
Argentaria
Static 10.5% 10.6% 9.0% 10.0% 8.2%
ES Banco Financiero y de
Ahorros
Yes Dynamic 10.6% 14.3% 10.3% 12.0% 8.6%
ES Banco Mare Nostrum Yes Dynamic 9.0% 11.5% 8.1% 11.1% 7.6%
ES
Banco Popular
Español
Static 10.1% 10.9% 7.6%
9.8%
6.4%
ES Banco Santander Static 10.4% 12.0% 8.9% 10.6% 7.3%
ES Banco de Sabadell Yes Dynamic 10.3% 10.2% 8.3% 9.8% 7.8%
ES Bankinter Static 11.7% 12.9% 11.0% 12.4% 10.5%
ES Caja de Ahorros y M.P. de Zaragoza
Yes Dynamic 10.0% 10.6% 7.9% 9.6% 6.7%
ES Caja de Ahorros y
Pensiones de Barcelona
Yes Dynamic 10.3% 11.6% 9.3% 9.6% 7.5%
ES Cajas Rurales Unidas Static 9.9% 10.2% 8.0% 10.1% 7.6%
ES Catalunya Banc Yes Dynamic 12.2% 12.5% 8.0% 12.5% 8.0%
ES Kutxabank Static 12.1% 13.1% 11.9% 12.1% 10.7%
ES
Liberbank
Yes
Dynamic 7.8% 9.4% 5.6%
7.0%
2.9%ES MPCA Ronda Yes Dynamic 10.9% 11.9% 8.9% 10.8% 7.3%
ES NCG Banco Yes Dynamic 10.2% 13.9% 9.1% 14.0% 9.0%
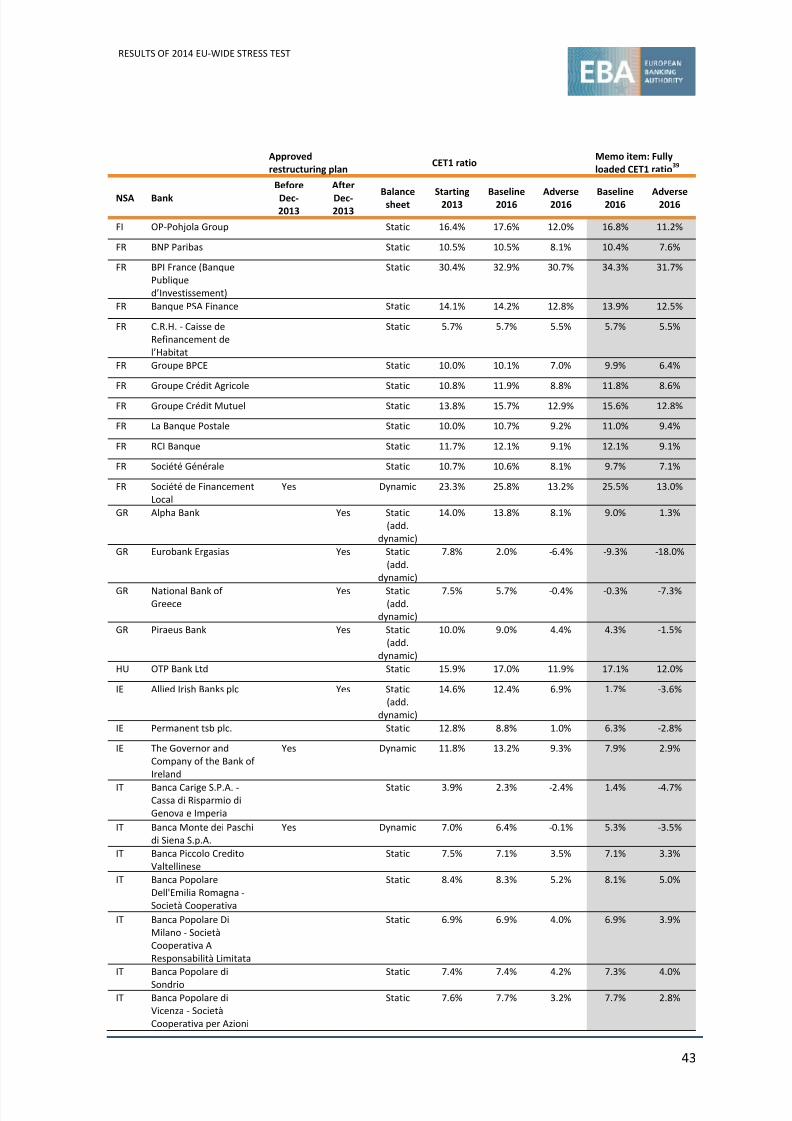
8/10/2019 2014 EU-wide ST-Aggregate Results
http://slidepdf.com/reader/full/2014-eu-wide-st-aggregate-results 43/51
RESULTS OF 2014 EU‐WIDE STRESS TEST
43
Approved
restructuring plan
CET1 ratio
Memo item: Fully
loaded CET1 ratio39
NSA
Bank
Before
Dec‐
2013
After
Dec‐
2013
Balance
sheet Starting
2013
Baseline
2016
Adverse
2016
Baseline
2016
Adverse
2016
FI OP‐Pohjola Group Static 16.4% 17.6% 12.0% 16.8% 11.2%
FR BNP Paribas Static 10.5% 10.5% 8.1% 10.4% 7.6%
FR BPI France (Banque
Publique
d’Investissement)
Static 30.4% 32.9% 30.7% 34.3% 31.7%
FR Banque PSA Finance Static 14.1% 14.2% 12.8% 13.9% 12.5%
FR C.R.H. ‐ Caisse de
Refinancement de
l’Habitat
Static 5.7% 5.7% 5.5% 5.7% 5.5%
FR Groupe BPCE Static 10.0% 10.1% 7.0% 9.9% 6.4%
FR Groupe Crédit Agricole Static 10.8% 11.9% 8.8% 11.8% 8.6%
FR Groupe Crédit Mutuel Static 13.8% 15.7% 12.9% 15.6% 12.8%
FR La Banque Postale Static 10.0% 10.7% 9.2% 11.0% 9.4%
FR RCI Banque Static 11.7% 12.1% 9.1% 12.1% 9.1%
FR Société Générale Static 10.7% 10.6% 8.1% 9.7% 7.1%
FR Société de Financement
Local
Yes Dynamic 23.3% 25.8% 13.2% 25.5% 13.0%
GR Alpha Bank Yes Static
(add.
dynamic)
14.0% 13.8% 8.1% 9.0% 1.3%
GR Eurobank Ergasias Yes Static
(add.
dynamic)
7.8% 2.0% ‐6.4% ‐9.3% ‐18.0%
GR
National Bank
of
Greece
Yes Static
(add. dynamic)
7.5% 5.7% ‐
0.4% ‐
0.3% ‐
7.3%
GR Piraeus Bank Yes Static
(add. dynamic)
10.0% 9.0% 4.4% 4.3% ‐1.5%
HU OTP Bank Ltd Static 15.9% 17.0% 11.9% 17.1% 12.0%
IE Allied Irish Banks plc Yes Static
(add.
dynamic)
14.6% 12.4% 6.9% 1.7% ‐3.6%
IE Permanent tsb plc. Static 12.8% 8.8% 1.0% 6.3% ‐2.8%
IE The Governor and
Company of the Bank of Ireland
Yes Dynamic 11.8% 13.2% 9.3% 7.9% 2.9%
IT
Banca Carige
S.P.A.
‐
Cassa di Risparmio di Genova e Imperia
Static 3.9% 2.3% ‐
2.4%
1.4% ‐
4.7%
IT Banca Monte dei Paschi di Siena S.p.A.
Yes Dynamic 7.0% 6.4% ‐0.1% 5.3% ‐3.5%
IT Banca Piccolo Credito
Valtellinese
Static 7.5% 7.1% 3.5% 7.1% 3.3%
IT Banca Popolare
Dell'Emilia Romagna ‐
Società Cooperativa
Static 8.4% 8.3% 5.2% 8.1% 5.0%
IT Banca Popolare Di Milano ‐ Società
Cooperativa A
Responsabilità Limitata
Static 6.9% 6.9% 4.0% 6.9% 3.9%
IT Banca Popolare di
Sondrio
Static 7.4% 7.4% 4.2% 7.3% 4.0%
IT Banca Popolare di Vicenza ‐ Società
Cooperativa per Azioni
Static 7.6% 7.7% 3.2% 7.7% 2.8%
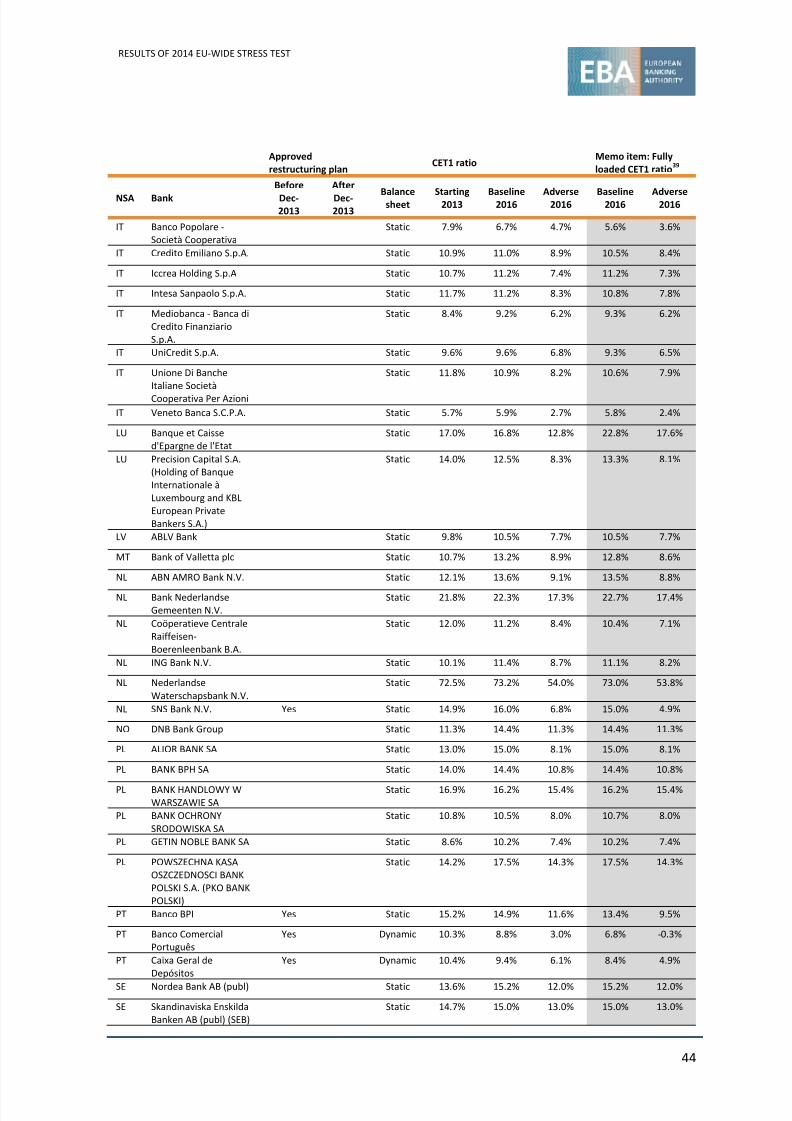
8/10/2019 2014 EU-wide ST-Aggregate Results
http://slidepdf.com/reader/full/2014-eu-wide-st-aggregate-results 44/51
RESULTS OF 2014 EU‐WIDE STRESS TEST
44
Approved
restructuring plan
CET1 ratio
Memo item: Fully
loaded CET1 ratio39
NSA
Bank
Before
Dec‐
2013
After
Dec‐
2013
Balance
sheet Starting
2013
Baseline
2016
Adverse
2016
Baseline
2016
Adverse
2016
IT Banco Popolare ‐
Società Cooperativa
Static 7.9% 6.7% 4.7% 5.6% 3.6%
IT Credito Emiliano S.p.A. Static 10.9% 11.0% 8.9% 10.5% 8.4%
IT Iccrea Holding S.p.A Static 10.7% 11.2% 7.4% 11.2% 7.3%
IT Intesa Sanpaolo S.p.A. Static 11.7% 11.2% 8.3% 10.8% 7.8%
IT Mediobanca ‐ Banca di
Credito Finanziario
S.p.A.
Static 8.4% 9.2% 6.2% 9.3% 6.2%
IT UniCredit S.p.A. Static 9.6% 9.6% 6.8% 9.3% 6.5%
IT Unione Di Banche
Italiane Società
Cooperativa Per
Azioni
Static 11.8% 10.9% 8.2% 10.6% 7.9%
IT Veneto Banca S.C.P.A. Static 5.7% 5.9% 2.7% 5.8% 2.4%
LU Banque et Caisse
d'Epargne de l'Etat
Static 17.0% 16.8% 12.8% 22.8% 17.6%
LU Precision Capital S.A.
(Holding of Banque
Internationale à
Luxembourg and KBL
European Private
Bankers S.A.)
Static 14.0% 12.5% 8.3% 13.3% 8.1%
LV ABLV Bank Static 9.8% 10.5% 7.7% 10.5% 7.7%
MT Bank of Valletta plc Static 10.7% 13.2% 8.9% 12.8% 8.6%
NL ABN AMRO Bank N.V. Static 12.1% 13.6% 9.1% 13.5% 8.8%
NL Bank Nederlandse
Gemeenten N.V.
Static 21.8% 22.3% 17.3% 22.7% 17.4%
NL Coöperatieve Centrale
Raiffeisen‐
Boerenleenbank B.A.
Static 12.0% 11.2% 8.4% 10.4% 7.1%
NL ING Bank N.V. Static 10.1% 11.4% 8.7% 11.1% 8.2%
NL Nederlandse
Waterschapsbank N.V.
Static 72.5% 73.2% 54.0% 73.0% 53.8%
NL SNS Bank N.V. Yes Static 14.9% 16.0% 6.8% 15.0% 4.9%
NO DNB Bank Group Static 11.3% 14.4% 11.3% 14.4% 11.3%
PL ALIOR BANK SA Static 13.0% 15.0% 8.1% 15.0% 8.1%
PL BANK BPH SA Static 14.0% 14.4% 10.8% 14.4% 10.8%
PL
BANK HANDLOWY
W
WARSZAWIE SA
Static 16.9% 16.2% 15.4%
16.2%
15.4%
PL BANK OCHRONY
SRODOWISKA SA
Static 10.8% 10.5% 8.0% 10.7% 8.0%
PL GETIN NOBLE BANK SA Static 8.6% 10.2% 7.4% 10.2% 7.4%
PL POWSZECHNA KASA
OSZCZEDNOSCI BANK
POLSKI S.A. (PKO BANK
POLSKI)
Static 14.2% 17.5% 14.3% 17.5% 14.3%
PT Banco BPI Yes Static 15.2% 14.9% 11.6% 13.4% 9.5%
PT Banco Comercial Português
Yes Dynamic 10.3% 8.8% 3.0% 6.8% ‐0.3%
PT Caixa Geral de
Depósitos
Yes Dynamic 10.4% 9.4% 6.1% 8.4% 4.9%
SE
Nordea Bank
AB
(publ)
Static 13.6% 15.2% 12.0%
15.2%
12.0%
SE Skandinaviska Enskilda
Banken AB (publ) (SEB)
Static 14.7% 15.0% 13.0% 15.0% 13.0%
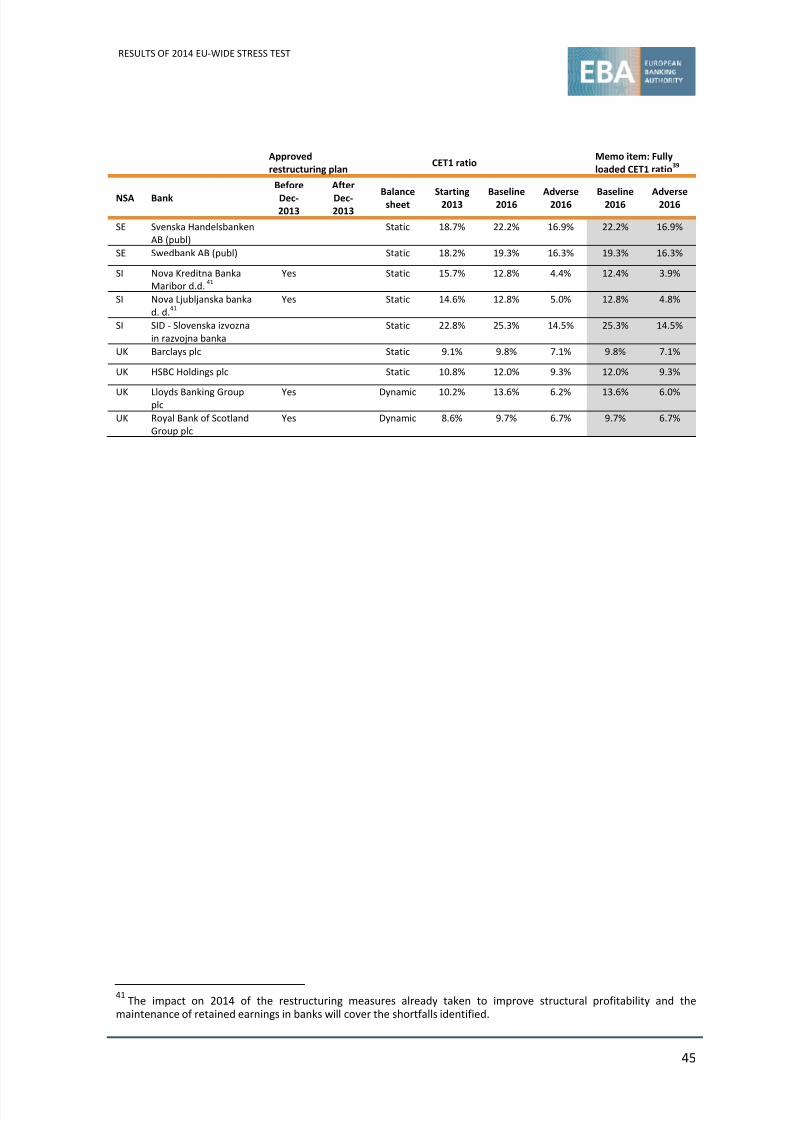
8/10/2019 2014 EU-wide ST-Aggregate Results
http://slidepdf.com/reader/full/2014-eu-wide-st-aggregate-results 45/51
RESULTS OF 2014 EU‐WIDE STRESS TEST
45
Approved
restructuring plan
CET1 ratio
Memo item: Fully
loaded CET1 ratio39
NSA
Bank
Before
Dec‐
2013
After
Dec‐
2013
Balance
sheet Starting
2013
Baseline
2016
Adverse
2016
Baseline
2016
Adverse
2016
SE Svenska Handelsbanken
AB (publ)
Static 18.7% 22.2% 16.9% 22.2% 16.9%
SE Swedbank AB (publ) Static 18.2% 19.3% 16.3% 19.3% 16.3%
SI Nova Kreditna Banka
Maribor d.d. 41
Yes Static 15.7% 12.8% 4.4% 12.4% 3.9%
SI Nova Ljubljanska banka
d. d.41
Yes Static 14.6% 12.8% 5.0% 12.8% 4.8%
SI SID ‐ Slovenska izvozna
in razvojna banka
Static 22.8% 25.3% 14.5% 25.3% 14.5%
UK Barclays plc Static 9.1% 9.8% 7.1% 9.8% 7.1%
UK HSBC Holdings plc Static 10.8% 12.0% 9.3% 12.0% 9.3%
UK
Lloyds Banking
Group
plc
Yes
Dynamic 10.2% 13.6% 6.2%
13.6%
6.0%
UK Royal Bank of Scotland
Group plc
Yes Dynamic 8.6% 9.7% 6.7% 9.7% 6.7%
41 The impact on 2014 of the restructuring measures already taken to improve structural profitability and the
maintenance of retained earnings in banks will cover the shortfalls identified.

8/10/2019 2014 EU-wide ST-Aggregate Results
http://slidepdf.com/reader/full/2014-eu-wide-st-aggregate-results 46/51
RESULTS OF 2014 EU‐WIDE STRESS TEST
46
Annex 2: Basic methodological
background for
reading
the
report
This report focusses on aggregate EU‐wide or country level information. Aggregate metrics are
generally computed as weighted averages so that aggregate metrics are identical with the
corresponding metrics on the combined balance sheet of the sample. For example the weighted
average CET1 Capital ratio is calculated as the sum of CET1 Capital over the sample relative to the
sum of total risk exposure amount over the sample. All metrics are generally reported for the full
sample unless otherwise specified for specific analyses for restructuring bank that are exempted
from the
static
balance
sheet
assumption.
Key
analyses
are
shown
for
all
years
of
the
exercise
and
for the baseline as well as the adverse scenario. More detailed analyses are shown for the adverse
scenario and for the last year of the exercise only.
It should be noted that all results reported in this document are based on the combined effect of
stress test and assets quality reviews. Consequently, data shown for the starting point 2013 may
already have been adjusted based on results of the asset quality review and may therefore be
different from data externally reported by banks.
This report is based on the full data set submitted from banks to the EBA in the EU‐wide stress
test template
and
is
not
limited
to
information
disclosed
by
the
EBA
on
a bank
‐by
‐bank
basis.
Details on the methodology applied and the definition of stress test metrics, e.g. exposure and
exposure classes, can be found in the Methodological Note EU‐wide Stress Test 2014.42
42 https://www.eba.europa.eu/documents/10180/669262/Methodological+Note.pdf
8/10/2019 2014 EU-wide ST-Aggregate Results
http://slidepdf.com/reader/full/2014-eu-wide-st-aggregate-results 47/51
RESULTS OF 2014 EU‐WIDE STRESS TEST
47
Annex 3: Scenario overview
The EU‐wide stress test is based on an adverse macroeconomic scenario provided by the
ECB/ESRB in close collaboration with NCAs, the ECB and the EBA covering the years from 2014 to
2016. The baseline scenario was provided by the European Commission based on the winter
forecast by extended by one year. The adverse scenario provides forward‐looking paths for key
macroeconomic and financial variables for all EU countries and a large number of non‐EU
countries.43
It reflects the systemic risks that were assessed as representing the most pertinent threats to the
stability of
the
EU
banking
sector:
an increase in global bond yields amplified by an abrupt reversal in risk assessment, especially
towards emerging market economies;
a further deterioration of credit quality in countries with feeble demand;
stalling policy reforms jeopardising confidence in the sustainability of public finances; and
an increase in banks’ funding costs and the lack of necessary bank balance sheet repair to
maintain
affordable
market
funding.
The negative impact of the shocks, which include also a stress in the real estate sector, as well as
a foreign exchange shock in Central and Eastern Europe, is substantially global. In the EU, the
scenario leads overall to a cumulative deviation of EU GDP from its baseline level by ‐2.2% in
2014, by ‐5.6% in 2015, and ‐7.0% in 2016. The EU unemployment is higher than its baseline level,
by 0.6pp in 2014, by 1.9pp in 2015 and by 2.9pp in 2016.
For most advanced economies, including Japan and the United States, the scenario results in a
negative response of GDP ranging between 5‐6% in cumulative terms compared to the baseline.
43 https://www.eba.europa.eu/‐/eba‐publishes‐common‐methodology‐and‐scenario‐for‐2014‐eu‐banks‐stress‐test
8/10/2019 2014 EU-wide ST-Aggregate Results
http://slidepdf.com/reader/full/2014-eu-wide-st-aggregate-results 48/51
RESULTS OF 2014 EU‐WIDE STRESS TEST
48
Annex 4: Monitoring of EBA capital
preservation recommendation
On the 22nd of July 2013 the EBA published a Recommendation on the preservation of Core Tier 1
capital. The recommendation, addressed to competent authorities in all EEA member states, was
issued with the aim to preserve the enhanced capital base and capital buffers that credit
institutions built by 30 June 2012 in response to the EBA's recapitalisation exercise and the EBA
December 2011 Recommendation on the creation and supervisory oversight of temporary capital
buffers to restore market confidence.44
Competent authorities were recommended to ensure that a credit institutions maintain the
nominal level of Core Tier 1 capital45 (nominal floor) corresponding to the amount of capital
needed as at 30 June 2012 to meet the requirements set out in the EBA December 2011
Recommendation.46
The sample of institutions under the scope of the capital preservation recommendation initially
included the 61 banks that were finally assessed in October 2012, based on June 2012 data, in the
framework of the EBA December 2011 recommendation. Nevertheless, 2 authorities, Bank of
Slovenia and Central Bank of Cyprus, notified to the EBA their intention not to comply47 with the
capital
preservation
recommendation.
Furthermore,
regarding
Banco
Espirito
Santo,
and
following the recent split‐up of the bank into two separate entities, Novo Banco and an entity
envisaged to wind down troubled assets, data is not currently available. Therefore, the list of
institutions that are actually being assessed under this report includes 56 banks listed in a
separate Annex.
In those cases where an institution’s CT1 capital falls below the nominal floor level, banks were
expected to produce credible plans for its restoration. Only limited waivers may be granted on a
case by case basis, after in depth discussion within colleges of supervisors, when it is envisaged
that the bank is or will be unable in the near future to keep the minimum level of CT1 capital, and
will not
be
able
to
restore
this
floor.
Under
these
circumstances,
waivers
may
be
granted
either
to
accommodate restructuring plans; or where there is capital in excess to meet on a continuous
44 EBA/REC/2011/1
45 CT1 defined to include the following deductions without transitional period: Goodwill: 100% deducted; IRB shortfall:
50% deducted from CT1 and 50% from Tier 2; holdings of financial sector entities: 50% deducted from CT1 and 50%
from Tier 2; Deferred tax assets that rely on future profitability: no deduction; defined benefit pension fund assets: no
deduction
46 9% Core Tier 1 capital of the June 2012 RWAs plus the sovereign capital buffer, EBA definition of Core Tier 1 capital as
per envisaged in the December 2011 recommendation
47 Both
national
competent
authorities
explained
their
decision
based
on
the
deep
restructuring
process
that
their
banks are undergoing triggered during the implementation of the EBA December 2011 recommendation due to the
fact, among others, that their banks were unable to comply with that recommendation.
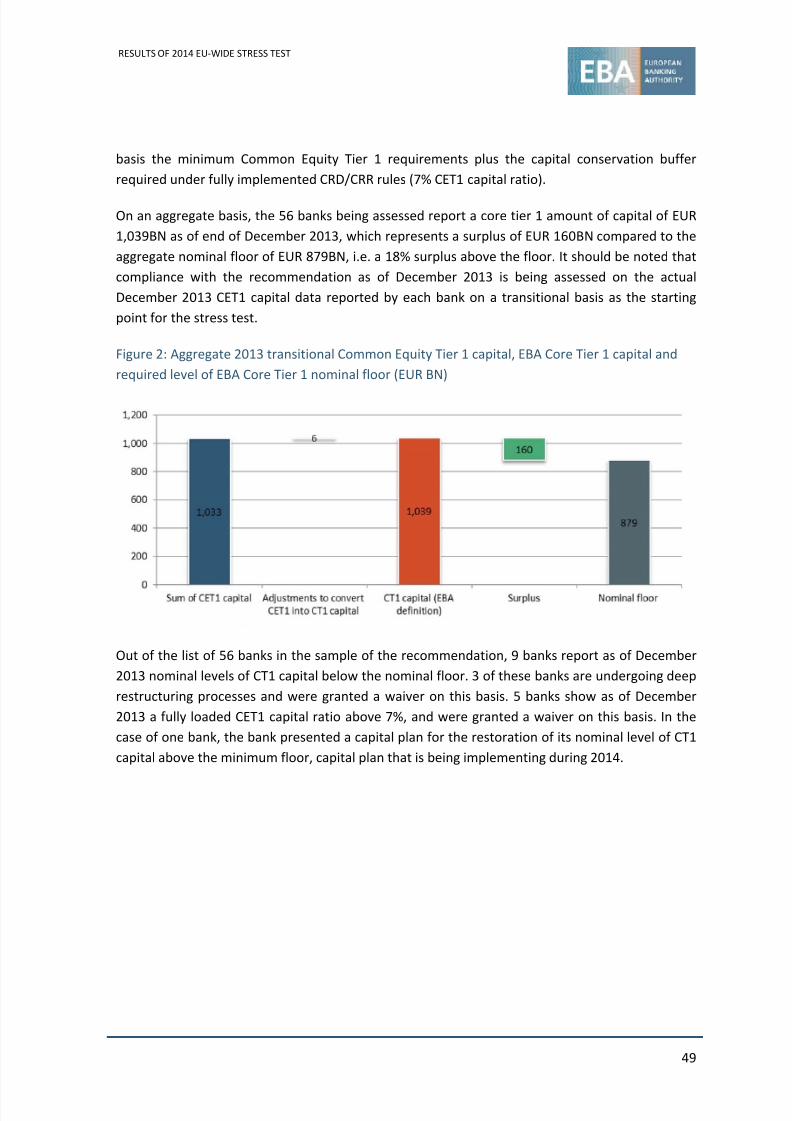
8/10/2019 2014 EU-wide ST-Aggregate Results
http://slidepdf.com/reader/full/2014-eu-wide-st-aggregate-results 49/51
RESULTS OF 2014 EU‐WIDE STRESS TEST
49
basis the minimum Common Equity Tier 1 requirements plus the capital conservation buffer
required under fully implemented CRD/CRR rules (7% CET1 capital ratio).
On an aggregate basis, the 56 banks being assessed report a core tier 1 amount of capital of EUR
1,039BN as of end of December 2013, which represents a surplus of EUR 160BN compared to the
aggregate nominal floor of EUR 879BN, i.e. a 18% surplus above the floor. It should be noted that
compliance with the recommendation as of December 2013 is being assessed on the actual
December 2013 CET1 capital data reported by each bank on a transitional basis as the starting
point for the stress test.
Figure 2: Aggregate 2013 transitional Common Equity Tier 1 capital, EBA Core Tier 1 capital and
required level of EBA Core Tier 1 nominal floor (EUR BN)
Out of the list of 56 banks in the sample of the recommendation, 9 banks report as of December
2013 nominal levels of CT1 capital below the nominal floor. 3 of these banks are undergoing deep
restructuring processes and were granted a waiver on this basis. 5 banks show as of December
2013 a fully loaded CET1 capital ratio above 7%, and were granted a waiver on this basis. In the
case of one bank, the bank presented a capital plan for the restoration of its nominal level of CT1
capital above the minimum floor, capital plan that is being implementing during 2014.
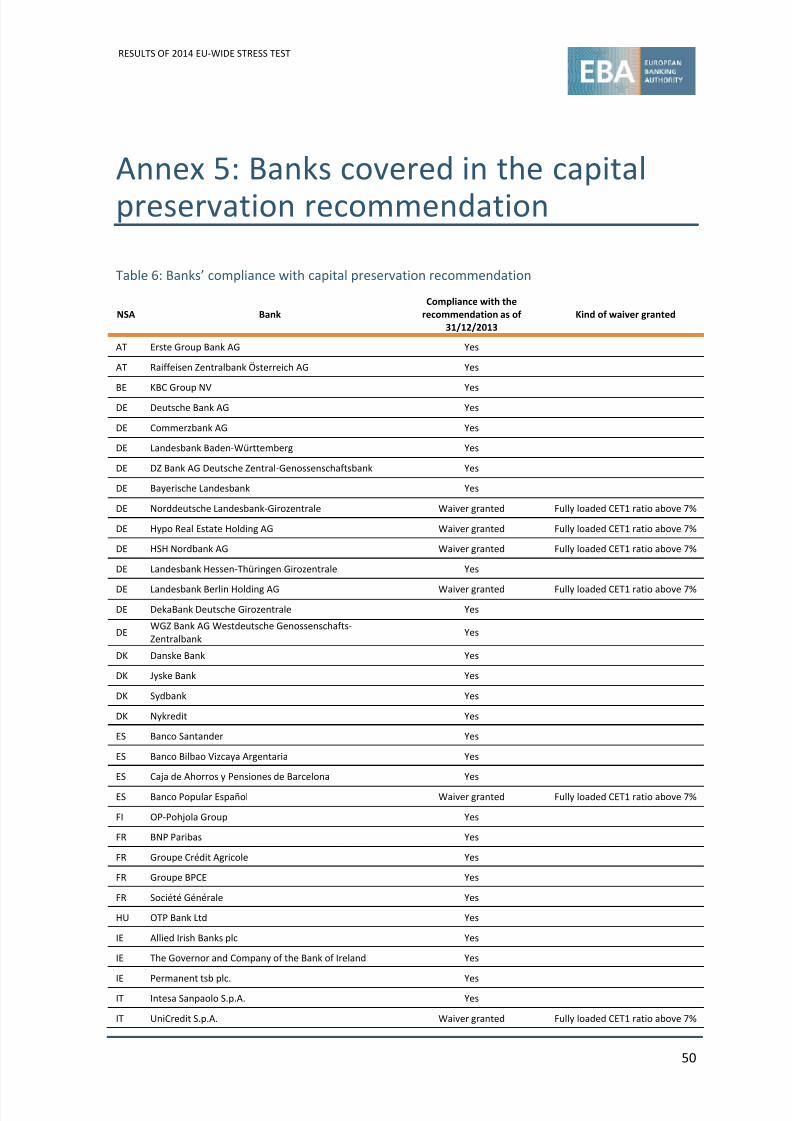
8/10/2019 2014 EU-wide ST-Aggregate Results
http://slidepdf.com/reader/full/2014-eu-wide-st-aggregate-results 50/51
RESULTS OF 2014 EU‐WIDE STRESS TEST
50
Annex 5: Banks covered in the capital
preservation recommendation
Table 6: Banks’ compliance with capital preservation recommendation
NSA Bank
Compliance with the
recommendation as of
31/12/2013
Kind of waiver granted
AT Erste Group Bank AG Yes
AT Raiffeisen Zentralbank Österreich AG Yes
BE KBC Group NV Yes
DE Deutsche Bank AG Yes
DE Commerzbank AG Yes
DE Landesbank Baden‐Württemberg Yes
DE DZ Bank AG Deutsche Zentral‐Genossenschaftsbank Yes
DE Bayerische Landesbank Yes
DE Norddeutsche Landesbank‐Girozentrale Waiver granted Fully loaded CET1 ratio above 7%
DE Hypo Real Estate Holding AG Waiver granted Fully loaded CET1 ratio above 7%
DE HSH Nordbank AG Waiver granted Fully loaded CET1 ratio above 7%
DE Landesbank Hessen‐Thüringen Girozentrale Yes
DE
Landesbank Berlin
Holding
AG
Waiver
granted
Fully
loaded
CET1
ratio
above
7%
DE DekaBank Deutsche Girozentrale Yes
DE
WGZ Bank AG Westdeutsche Genossenschafts‐
Zentralbank
Yes
DK Danske Bank Yes
DK Jyske Bank Yes
DK Sydbank Yes
DK Nykredit Yes
ES Banco Santander Yes
ES Banco Bilbao Vizcaya Argentaria Yes
ES Caja de Ahorros y Pensiones de Barcelona Yes
ES Banco Popular Español Waiver granted Fully loaded CET1 ratio above 7%
FI OP‐Pohjola Group Yes
FR BNP Paribas Yes
FR Groupe Crédit Agricole Yes
FR Groupe BPCE Yes
FR Société Générale Yes
HU OTP Bank Ltd Yes
IE Allied Irish Banks plc Yes
IE The Governor and Company of the Bank of Ireland Yes
IE
Permanent
tsb
plc.
Yes
IT Intesa Sanpaolo S.p.A. Yes
IT UniCredit S.p.A. Waiver granted Fully loaded CET1 ratio above 7%
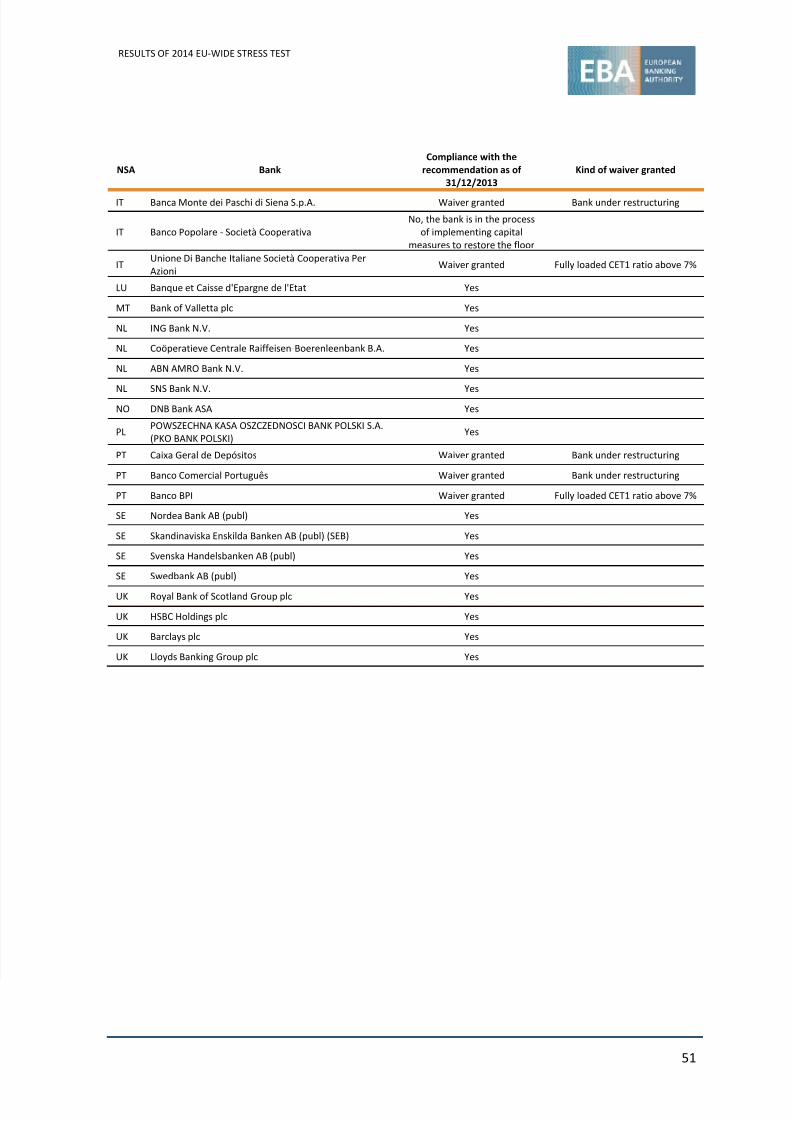
8/10/2019 2014 EU-wide ST-Aggregate Results
http://slidepdf.com/reader/full/2014-eu-wide-st-aggregate-results 51/51
RESULTS OF 2014 EU‐WIDE STRESS TEST
NSA Bank
Compliance with the
recommendation as of
31/12/2013
Kind of waiver granted
IT Banca Monte dei Paschi di Siena S.p.A. Waiver granted Bank under restructuring
IT Banco Popolare ‐ Società Cooperativa
No, the bank is in the process of implementing capital
measures to restore the floor
IT
Unione Di Banche Italiane Società Cooperativa Per
Azioni Waiver granted Fully loaded CET1 ratio above 7%
LU Banque et Caisse d'Epargne de l'Etat Yes
MT Bank of Valletta plc Yes
NL ING Bank N.V. Yes
NL Coöperatieve Centrale Raiffeisen‐Boerenleenbank B.A. Yes
NL ABN AMRO Bank N.V. Yes
NL
SNS
Bank
N.V.
Yes
NO DNB Bank ASA Yes
PL
POWSZECHNA KASA OSZCZEDNOSCI BANK POLSKI S.A.
(PKO BANK POLSKI) Yes
PT Caixa Geral de Depósitos Waiver granted Bank under restructuring
PT Banco Comercial Português Waiver granted Bank under restructuring
PT Banco BPI Waiver granted Fully loaded CET1 ratio above 7%
SE Nordea Bank AB (publ) Yes
SE Skandinaviska Enskilda Banken AB (publ) (SEB) Yes
SE Svenska Handelsbanken AB (publ) Yes
SE Swedbank AB (publ) Yes
UK Royal Bank of Scotland Group plc Yes
UK HSBC Holdings plc Yes
UK Barclays plc Yes
UK Lloyds Banking Group plc Yes