2012 Maritime Salary Review
16
Maritime Salary Review July 2012
-
Upload
eugene-nutovych -
Category
Documents
-
view
48 -
download
4
description
Review of salaries for shore based and seagoing personnel, performed by Fastream Recruitment
Transcript of 2012 Maritime Salary Review

Maritime Salary ReviewJuly 2012
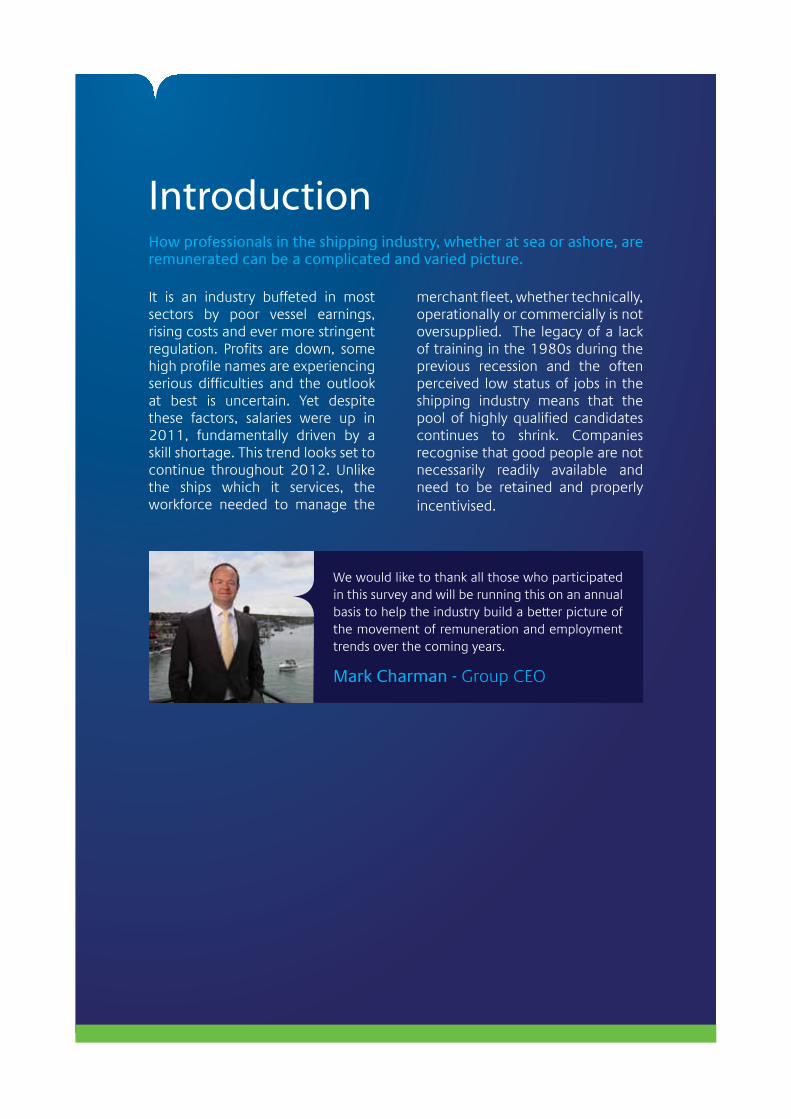
It is an industry buffeted in most sectors by poor vessel earnings, rising costs and ever more stringent regulation. Profits are down, some high profile names are experiencing serious difficulties and the outlook at best is uncertain. Yet despite these factors, salaries were up in 2011, fundamentally driven by a skill shortage. This trend looks set to continue throughout 2012. Unlike the ships which it services, the workforce needed to manage the
merchant fleet, whether technically, operationally or commercially is not oversupplied. The legacy of a lack of training in the 1980s during the previous recession and the often perceived low status of jobs in the shipping industry means that the pool of highly qualified candidates continues to shrink. Companies recognise that good people are not necessarily readily available and need to be retained and properly incentivised.
IntroductionHow professionals in the shipping industry, whether at sea or ashore, are remunerated can be a complicated and varied picture.
Mark Charman - Group CEO
We would like to thank all those who participated in this survey and will be running this on an annual basis to help the industry build a better picture of the movement of remuneration and employment trends over the coming years.

The results of this survey are based on responses from shipping professionals working in every global shipping centre and from seafarers worldwide. It takes in all the world’s major merchant trades, as well as offshore, cruise, superyachts, tugs and other niche sectors. The survey was sent out in April 2012 and received 4,000 responses from shipping industry workers globally.
The data we present here shows some interesting insights into the transition from sea to shore, the variety of packages available to employees and the range of salaries across the industry. The findings are designed to be useful to both employees and employers. We hope that employees, particularly seafarers, will be able to gain a clearer picture of the many career opportunities open to them once ashore and the salaries which they can expect to achieve. All too often transiting to the shore-side sector is seen as something which only the most senior officers can do, but people with five to ten years seafaring experience are most certainly in demand. At the same time, we hope that employers can use this data to help inform them about hiring decisions and internal pay reviews.
Workboat
Tanker
Passenger
Other
Dry cargo
Cellular
Workboat
Tanker
Passenger
Other
Dry cargo
Cellular
Seagoing (vessels worked on): Shorebased (market area):
Response Breakdown:
Survey Summary
NOTE: ALL SALARIES WITHIN THIS DOCUMENT ARE DISPLAYED IN USD$. EXCHANGE RATES HAVE BEEN CALCULATED AS FOLLOWS:USD$1 = EUR 0.63 / GBP 0.77 / NOK 5.99 / SGD 1.27 / IDR 54.46 / CHF 0.94
Ben
efits
S
hore
base
d
Sea
goin
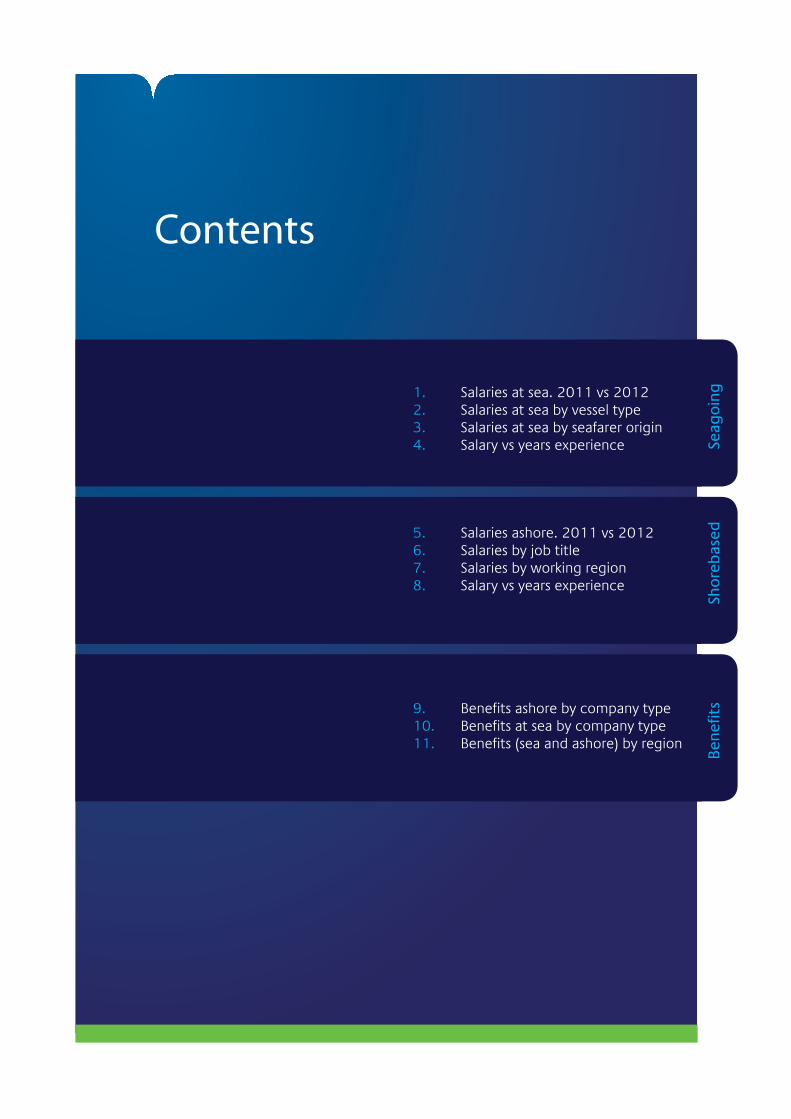
g1. Salaries at sea. 2011 vs 20122. Salaries at sea by vessel type3. Salaries at sea by seafarer origin4. Salary vs years experience
5. Salaries ashore. 2011 vs 20126. Salaries by job title7. Salaries by working region8. Salary vs years experience
9. Benefits ashore by company type10. Benefits at sea by company type11. Benefits (sea and ashore) by region
Contents

01 02 03 04 05 0
Increase 5%+
Increase up to 5%
Static
Decrease
50%
30%
12%
8%
Seafarers are split in two camps – those who have experienced a significant above inflation pay rise and those who have had to accept a pay cut.
A closer look at the data reveals that it is those in the less senior positions who are bearing the brunt of the pay cuts. Yet far fewer of their shore based counterparts have experienced these levels of salary cuts - only 9% on shore reported seeing their pay packet drop last year. Is this a case of out of sight, out of mind?
Salaries at sea.2011 vs 2012
2011 vs 2012 salary changes:
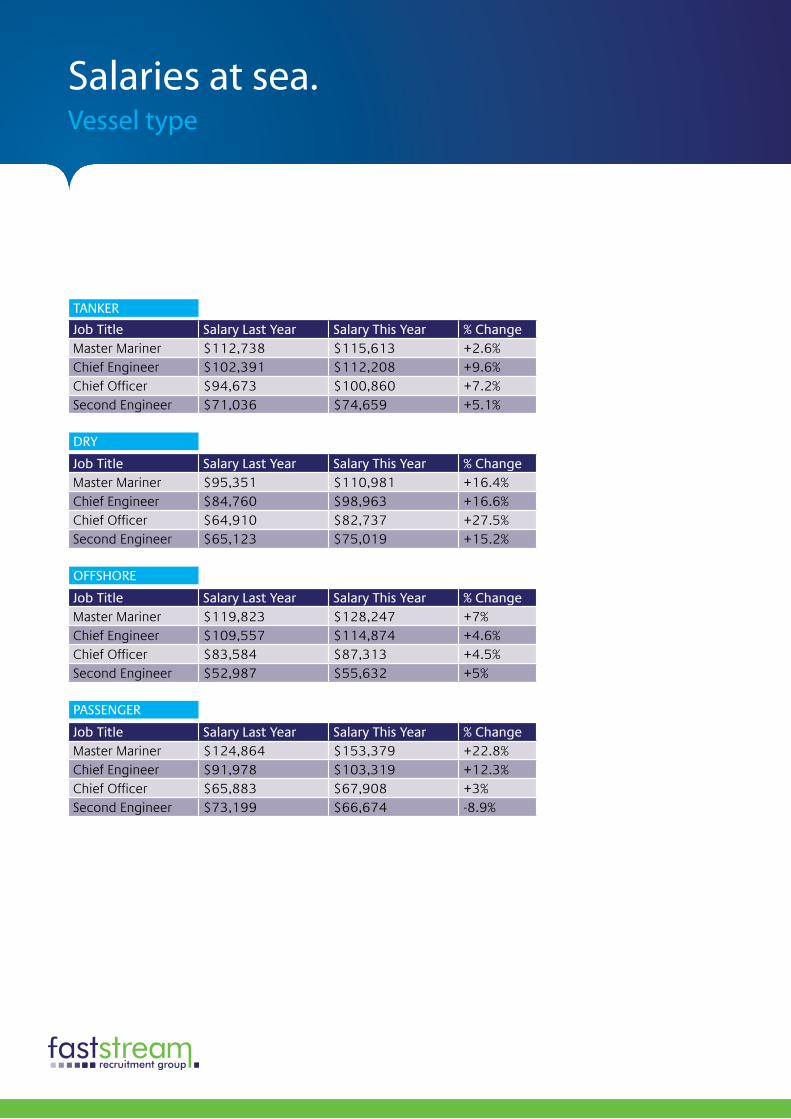
Job Title Salary Last Year Salary This Year % ChangeMaster Mariner $112,738 $115,613 +2.6%Chief Engineer $102,391 $112,208 +9.6%Chief Officer $94,673 $100,860 +7.2%Second Engineer $71,036 $74,659 +5.1%
TANKER
Job Title Salary Last Year Salary This Year % ChangeMaster Mariner $95,351 $110,981 +16.4%Chief Engineer $84,760 $98,963 +16.6%Chief Officer $64,910 $82,737 +27.5%Second Engineer $65,123 $75,019 +15.2%
DRY
Job Title Salary Last Year Salary This Year % ChangeMaster Mariner $119,823 $128,247 +7%Chief Engineer $109,557 $114,874 +4.6%Chief Officer $83,584 $87,313 +4.5%Second Engineer $52,987 $55,632 +5%
OFFSHORE
Job Title Salary Last Year Salary This Year % ChangeMaster Mariner $124,864 $153,379 +22.8%Chief Engineer $91,978 $103,319 +12.3%Chief Officer $65,883 $67,908 +3%Second Engineer $73,199 $66,674 -8.9%
PASSENGER
Salaries at sea.Vessel type

The figures below show that Eastern European seafarers cease to be an “emerging market” or a source of cheap labour.
From Croatia to Poland, there is an excellent network of training institutions which are producing some very able officers. East European engineers are in particular demand. However, when it comes to “client facing” roles, we can see that West Europeans are still perceived by employers to be the most desirable. British, Dutch, German and Scandinavian master mariners in particular are highly regarded and continue to command a significant salary premium over their East European and Asian counterparts. National variations in officers’ salaries are becoming slowly less pronounced and we believe that this trend will continue as increasing numbers of officers enter the workforce from a wide range of regions.
Demand for second and chief engineers has created the desire for employers to consider all nationalities in the engine room. The current most skill-short area is second engineers with five years experience, and it is those candidates in particular who are receiving the top salaries.
Salaries at sea.Seafarer origin
CANDIDATE ORIGIN
Job type Western Europe (Inc. Scandinavia)
Eastern Europe Asia
Master Mariner $138,320 $109,627 $111,422Chief Engineer $104,628 $104,448 $102,740Chief Officer $90,273 $74,653 $74,319Second Engineer $81,871 $81,125 $72,996

Sala
ry (U
S$)
Number of years at sea
0
20000
40000
60000
80000
100000
120000
140000
1 to 5 6 to 10 11 to 15 16 - 20 20 +
Over a 20 year working career at sea, an officer can expect to see his or her salary double in real terms.
The graph below clearly shows a steady growth in income as an officer rises through the ranks. However, the diagram on the right demonstrates that those who move ashore after between 6 and 10 years at sea can see a significant rise in their income compared to what they might have expected had they stayed at sea. This is not to say that all those that come ashore can expect to see an immediate pay rise, but perhaps that many of those who do leave within 10 years are high fliers who have made a rapid progression through the ranks and are also very successful when working ashore.
Salaries at sea.Salary vs experience
Average salary by years at sea: Average shorebased salary for ex-seafarers based on years at sea:
0
20000
40000
60000
80000
100000
120000
140000
Sala
ry (U
S$)
Number of years at sea
1 to 5 6 - 10 11 - 15 16+
01 02 03 04 05 0
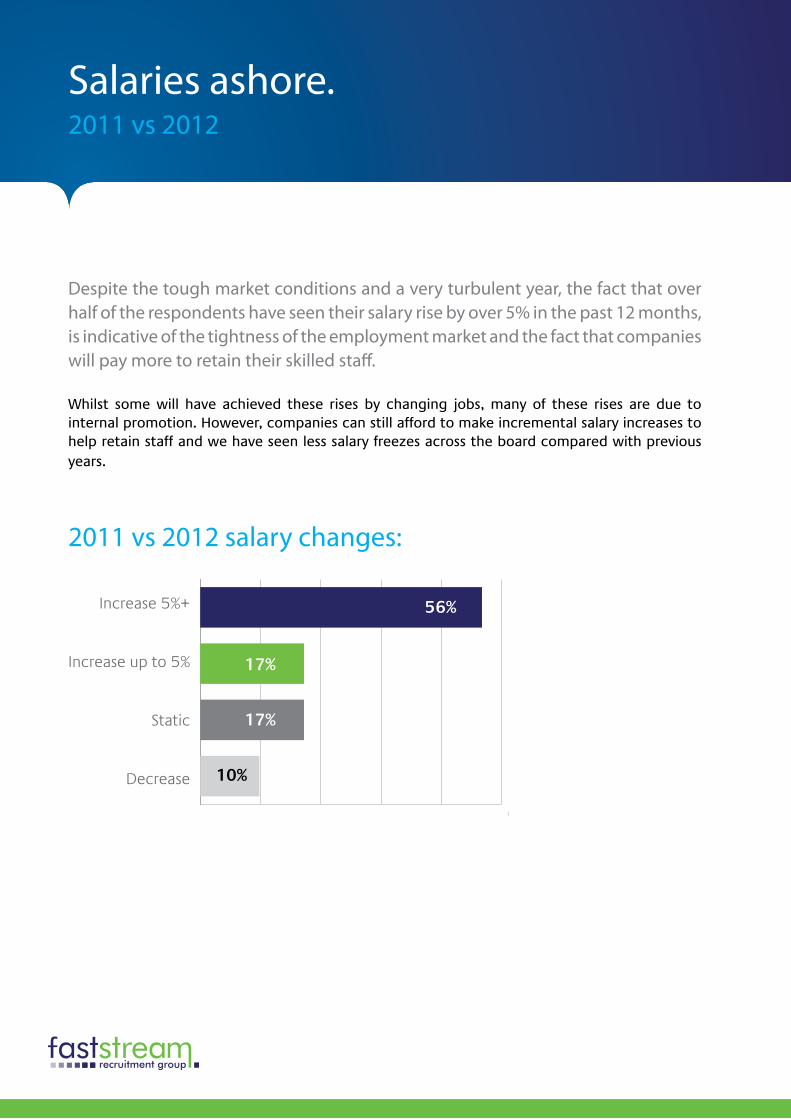
56%
10%
17%
17%
Despite the tough market conditions and a very turbulent year, the fact that over half of the respondents have seen their salary rise by over 5% in the past 12 months, is indicative of the tightness of the employment market and the fact that companies will pay more to retain their skilled staff.
Whilst some will have achieved these rises by changing jobs, many of these rises are due to internal promotion. However, companies can still afford to make incremental salary increases to help retain staff and we have seen less salary freezes across the board compared with previous years.
Increase 5%+
Increase up to 5%
Static
Decrease
Salaries ashore.2011 vs 2012
2011 vs 2012 salary changes:

Job type Annual basic salary Average bonus
Charterer $100,493 13%Chartering Director $227,140 20%Chartering Manager $110,510 18%Fleet/Technical Manager $123,518 16%Fleet Personnel Manager $59,321 8%Marine Consultant $100,743 7%Marine Surveyor $89,705 7%Shipbroker (Chartering) $81,666 26%Ship Operator $82,074 11%Superintendent (Marine) $88,663 10%Superintendent (Technical) $96,456 12%
The table above reveals the range of salaries in the maritime market. An interesting statistic is the closeness in salary between the ship operator and shipbroker. Whilst gauging the average shipbroker’s salary is of course very difficult as it takes in such a wide range of earnings and markets, the fact is that the role of the ship operator has become increasingly highly regarded. A good ship operator can make the difference between commercial success and failure and are in demand not only within shipping companies, but also commodity houses and banks.
We can also see the high levels of salary achieved by marine consultants working for consultancies. Often a big cog in a small wheel when compared to their class and flag counterparts, marine consultancy employees need to be equally comfortable in a boiler suit as they are in a suit presenting their findings to their clients. Not every technical expert has the ability to interpret complex engineering issues to a non-technical audience. Those who can achieve this will find their services very much in demand.
Salaries ashore.Salary by job title
Average salary + bonus
Job type ASIA EUROPE USA MIDDLE EAST
Charterer (all) $153,113 $121,246 $141,444 $111,213
Fleet/Technical Manager $120,613 $129,786 $130,867 $110,191
Fleet Personnel Manager $59,963 $59,102 $58,265 $57,876
Marine Consultant $105,876 $96,199 $117,675 $101,500
Marine Surveyor $81,291 $69,492 $91,045 $79,540
Shipbroker (Chartering) $98,325 $78,298 $90,981 $65,703
Ship Operator $92,217 $77,334 $71,454 $70,681
Superintendent (Marine) $92,716 $81,661 $87,046 $88,367
Superintendent (Technical) $98,175 $97,896 $110,287 $91,103
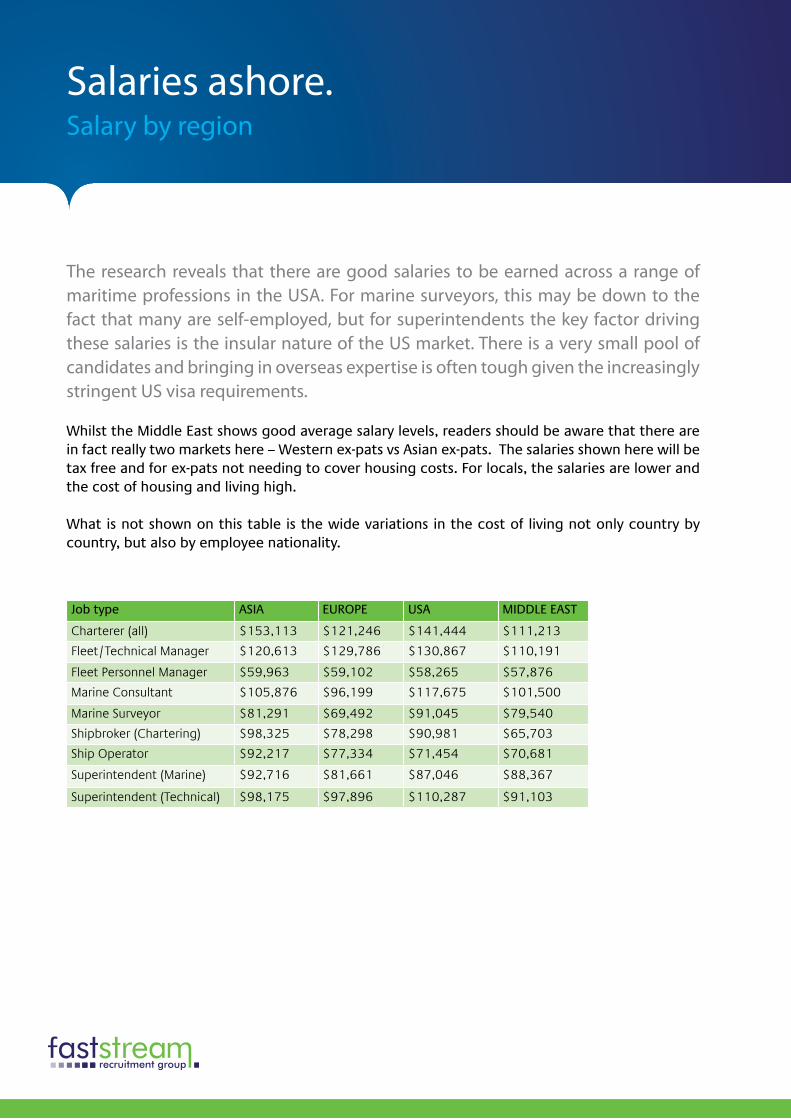
The research reveals that there are good salaries to be earned across a range of maritime professions in the USA. For marine surveyors, this may be down to the fact that many are self-employed, but for superintendents the key factor driving these salaries is the insular nature of the US market. There is a very small pool of candidates and bringing in overseas expertise is often tough given the increasingly stringent US visa requirements.
Whilst the Middle East shows good average salary levels, readers should be aware that there are in fact really two markets here – Western ex-pats vs Asian ex-pats. The salaries shown here will be tax free and for ex-pats not needing to cover housing costs. For locals, the salaries are lower and the cost of housing and living high.
What is not shown on this table is the wide variations in the cost of living not only country by country, but also by employee nationality.
Salaries ashore.Salary by region

0
20000
40000
60000
80000
100000
120000
140000
Salaries ashore.Salary vs experience
1 to 5 6 - 10 11 - 15 16 - 20 20+
Sala
ry (U
S$)
Number of years experience
Average salary by experience
Car allowance
Travel allowance
Paid overtime
Pension
Private health
Life insurance
Bonus
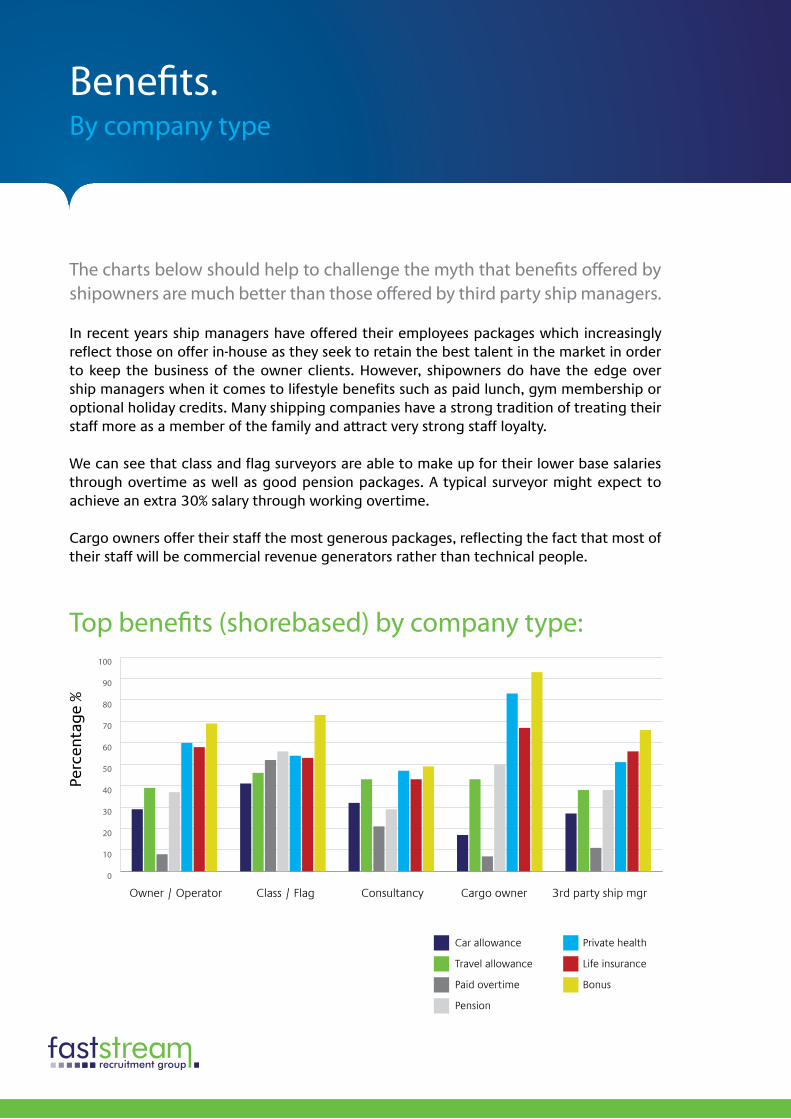
Top benefits (shorebased) by company type:
Owner / Operator Class / Flag Consultancy Cargo owner 3rd party ship mgr
0
10
20
30
40
50
60
70
80
90
100
The charts below should help to challenge the myth that benefits offered by shipowners are much better than those offered by third party ship managers.
In recent years ship managers have offered their employees packages which increasingly reflect those on offer in-house as they seek to retain the best talent in the market in order to keep the business of the owner clients. However, shipowners do have the edge over ship managers when it comes to lifestyle benefits such as paid lunch, gym membership or optional holiday credits. Many shipping companies have a strong tradition of treating their staff more as a member of the family and attract very strong staff loyalty.
We can see that class and flag surveyors are able to make up for their lower base salaries through overtime as well as good pension packages. A typical surveyor might expect to achieve an extra 30% salary through working overtime.
Cargo owners offer their staff the most generous packages, reflecting the fact that most of their staff will be commercial revenue generators rather than technical people.
Benefits.By company type
Perc
enta
ge %

Owner / Operator 3rd party ship mgr
Benefits (seagoing) owner vs ship manager:
Travel allowance
Paid overtime
Pension
Private health
Life insurance
Bonus
Benefits.By company type
0.0
12.5
25.0
37.5
50.0
62.5
75.0
87.5
100.0
Perc
enta
ge %

Top benefits by region:
Car allowance
Travel allowance
Paid overtime
Pension
Private health
Life insurance
Bonus
The difference in the number of companies offering pensions in USA/Europe vs Asia is indicative of the take-up of formal pension systems in the Asia-Pacific which is much lower than in OECD countries.
According to a recent OECD report, the levels range from 56% in Hong Kong to 5.8% in India. China, despite having 159 million members in its pension systems, only has a coverage level of 17%. In comparison, the OECD average is 63% and is as high as 75% in Japan.
Benefits.By region
Asia Europe USA
0.0
12.5
25.0
37.5
50.0
62.5
75.0
87.5
100.0
Perc
enta
ge %

United Kingdom (Group Headquarters)The Quay, 30 Channel WayOcean Village, Southampton, SO14 3TGTel: +44 (0) 23 8033 4444 Email: [email protected] @Faststream
Singapore 10 Hoe Chiang Road, #08-01 Keppel TowersSingapore 089315Tel: (+65) 653 27 201 Email: [email protected]
@Faststream
USA1500 Cordova RoadSuite 210, Fort Lauderdale, Florida 33316Tel: (+1) 954 467 9611 Email: [email protected] @FaststreamUSA
AustraliaThe Park Business Centre45 Ventnor Avenue, West Perth 6005Tel: (+61) 8 9429 8821 Email: [email protected] @Faststream
www.faststream.com
If you would like any more information about trends in your sector or region, contact one of our regional offices.


![Review of Maritime Transport 2013 [Arabic]Review of Maritime Transport 2013 [Arabic] ... 2013 ...](https://static.fdocuments.net/doc/165x107/5e31b798be917c48d84af07a/review-of-maritime-transport-2013-arabic-review-of-maritime-transport-2013-arabic.jpg)