2011–2060 - Environment, Planning and Sustainable ... · serious challenges facing the world, ......
80
Weathering the Change Draſt Acon Plan 2 Pathway to a sustainable and carbon neutral ACT 2011–2060 Opons paper for public comment
Transcript of 2011–2060 - Environment, Planning and Sustainable ... · serious challenges facing the world, ......

Weathering the ChangeDraft Action Plan 2 Pathway to a sustainable and carbon neutral ACT
2011–2060
Options paper for public comment

B OPTIONS PAPER FOR PUBLIC COMMENT
© Australian Capital Territory, Canberra 2011
This work is copyright. Apart from any use as permitted under the Copyright Act 1968, no part may be reproduced without the written permission of the Environment and Sustainable Development Directorate, GPO Box 158, Canberra ACT 2601.
Published by the Environment and Sustainable Development Directorate.Enquiries: Phone Canberra Connect on 13 22 81.
Website: environment.act.gov.au
Printed on recycled paper

PATHWAY TO A SUSTAINABLE AND CARBON NEUTRAL ACT i
MESSAGE FROM THE MINISTER
Climate change is one of the most serious challenges facing the world, requiring considered and forthright action. The ACT Government is committed to transitioning Canberra to become a carbon neutral city that can adapt to a changing climate.
Our planet is experiencing a changing climate as a result of high and increasing levels of greenhouse gas (GHG) emissions produced by human activity. The ACT is not exempt from these global changes and the latest research shows the ACT is likely to experience long term climatic conditions involving drier, hotter and more extreme weather conditions.
A commitment to decisive action on climate change emerged as a shared priority from Time to Talk: Canberra 2030 in 2010 which captured the views and concerns of Canberrans.
Climate change requires a global commitment to stabilise greenhouse gas concentrations in the atmosphere; it is a shared responsibility that all countries must embrace. Leadership must be demonstrated at the local, regional, national and international levels through effective policies and actions.
The ACT has the most ambitious greenhouse gas reduction targets of any jurisdiction in Australia. The Climate Change and Greenhouse Gas Reduction Act 2010 formalised the ACT targets of zero net emission (carbon neutrality) by 2060 and a 40% reduction in greenhouse gas emissions from 1990 levels by 2020.
Success in achieving our GHG reduction targets will depend on action by everyone—government, business, community groups, households and individuals. Not only will we need to be smarter in how we use energy, the energy we use must be cleaner. Choices will need to be made on where we should invest, the new technologies we
should adopt and the lifestyle changes we will need to make.
In considering the choices available to us, the ACT Government is committed to implementing cost effective and sustainable options to achieve the ACT’s GHG reduction targets.
The ACT Government is also committed to involving the community and engaging businesses in addressing climate change. Draft Weathering the Change Action Plan 2 has been prepared to gain community feedback on the ACT’s pathway to zero net emissions and views on suggested outcomes, strategies and actions.
I encourage individuals, the wider community and business to get involved in the decision making process by providing their views to inform the final Action Plan 2.
Simon Corbell MLA Minister for the Environment and Sustainable Development December 2011

ii OPTIONS PAPER FOR PUBLIC COMMENT

PATHWAY TO A SUSTAINABLE AND CARBON NEUTRAL ACT iii
MESSAGE FROM THE MINISTER i
1 EXECUTIVE SUMMARY 1
2 GLOBAL ISSUE REQUIRING LOCAL ACTION 5Vision and outcomes 6Changes in our climate 6Greenhouse gas emissions in the ACT 7Reduction in GHG needed to achieve ACT targets 8Feedback from Time to Talk Canberra 2030 9National and international policy settings 11Achieving the ACT targets 12
3 ACHIEVING THE 2020 EMISSIONS REDUCTION TARGET 13Emissions reduction strategies 14Choosing the right path 15Estimating costs 25Implementing change 27
4 ADAPTING TO A CHANGING CLIMATE 31Climate research and information 32Managing risks 33
5 LEADING A SUSTAINABLE FUTURE 37ACT Government carbon neutrality 38Development of a clean economy 39
6 CONSULTATION 41
APPENDIX 1 REDUCING GHG EMISSIONS IN THE ACT—STRATEGIES AND ACTIONS 44
APPENDIX 2 GLOSSARY/TERMS AND DEFINITIONS 65
APPENDIX 3 RESOURCES AND FURTHER READING 73
CONTENTS

iv OPTIONS PAPER FOR PUBLIC COMMENT

PATHWAY TO A SUSTAINABLE AND CARBON NEUTRAL ACT 1
EXECUTIVE SUMMARY1.

2 OPTIONS PAPER FOR PUBLIC COMMENT
The ACT’s climate change policy is based on a vision that, by 2060, the ACT has become a sustainable and carbon neutral city that is successfully adapting to a changing climate. This vision is supported by four key outcomes:
1. reducing GHG emissions in the ACT
2. ensuring a fair society in a low carbon economy
3. adapting to a changing climate
4. leading a sustainable future.
In November 2010 the Climate Change and Greenhouse Gas Reduction Act 2010 came into effect, establishing ACT emissions reduction targets of zero net greenhouse gas (GHG) emissions by 2060; 40% below 1990 levels by 2020; and 80% below 1990 levels by 2050.
The targets set a clear direction for planning our sustainable future. The Draft Weathering the Change Action Plan 2 (Draft Action Plan 2) has been developed to seek feedback on the pathway towards zero net emissions by 2060.
To inform the community about the ACT Government’s proposed approach to managing climate change and facilitate
discussion and feedback, Draft Action Plan 2 presents:
• a summary of the evidence demonstrating the need for action to reduce and manage the impacts of climate change
• the sources of GHG emissions, based on the ACT Greenhouse Gas Inventory, to help identify opportunities and limitations for reducing GHG emissions from different sectors
• ways in which government and the community can act to achieve our shared climate change goals.
National and international policy settings on climate change are also outlined, including the recently announced national carbon price, which will contribute to the ACT’s efforts to reduce GHG emissions.
Draft Action Plan 2 includes a calculation of the amount of emissions we need to reduce each year to achieve the ACT targets, taking into account projected emissions, expected reduction in emissions from existing measures and a national carbon price.
1. EXECUTIVE SUMMARY
0
1,000
2,000
3,000
4,000
5,000
500
1,500
2,500
3,500
4,500
2011
kt c
O2-
e
Projected emissions with current measures(includes the national carbon price)
ACT emissions reduction challenge to 2020
2020
2040
2060
2212 kt CO2 -e
reduced by 2020
Target trajectory to zero net emissions by 2060
2030
2050
ACT EMISSIONS REDUCTION CHALLENGE TO 2020
Source: pitt&sherry, 2011

PATHWAY TO A SUSTAINABLE AND CARBON NEUTRAL ACT 3
While the Australian Government’s national price on carbon will help reduce emissions in the ACT, it will not be sufficient to meet the ACT’s legislated GHG reduction targets. The remaining gap or challenge is illustrated on the previous page. Even with the carbon price in place, the ACT needs to reduce its GHG emissions by a further 2212 kilotonnes of CO2-e by 2020 to reduce its current level of emissions by 55% in less than ten years.
Possible GHG reduction pathways
Draft Action Plan 2 has assessed the potential to reduce emissions in the ACT from the following six GHG reduction strategies:
1. energy efficient buildings
2. sustainable transport
3. sustainable waste
4. renewable energy
5. gas generated electricity
6. carbon offsets.
Five possible pathways (i.e. individual or mixes of GHG reduction strategies) for achieving the ACT’s 2020 GHG targets are presented to generate community discussion. They include:
1. renewable energy
2. buildings, transport, waste and renewable energy
3. buildings, transport, waste plus gas generated electricity and offsets as required
4. buildings, transport, waste and offsets
5. carbon offsets.
While Draft Action Plan 2 explores the implications of different pathways, it does not calculate the distribution of costs and benefits between different groups such as government, householders and businesses. This will require development of detailed program design, which is premature until a preferred pathway is selected.
Adapting to a changing climateAs well as reducing GHG emissions, the ACT needs to prepare for and manage the risks of unavoidable climate change. Work is already underway across government to understand the risks associated with climate change and identify ways in which the ACT can adapt to climate changes and reduce the potentially undesirable impacts.
Leading a sustainable futureTo maximise the opportunities from the transition to a zero emissions ACT, the ACT Government will provide leadership in becoming carbon neutral by 2020 and proactively supporting the development of a ‘clean tech’ economy.
Consultation and community feedbackDraft Action Plan 2 has been prepared to encourage community feedback that will inform the ACT Government’s future policy on climate change. Details on how to make a submission are outlined in chapter six.
Draft Action Plan 2 seeks community feedback on an appropriate pathway for the ACT, recognising that different pathways have different implications. Pathways should be assessed based on the following:
– how the action/pathway helps meet the emission reduction targets
– the effectiveness of the action/pathway
– the cost of the action/pathway
– the impact on the consumer
– the scalability and materiality of the action/pathway
– reduction in emissions from different sectors (electricity, gas, transport, waste)
– sources of emissions that remain in 2020
– the ability to achieve carbon neutrality in 2060
– the risk profile of the pathway
– practicalities of implementation.
There are trade-offs between pathways in relation to costs, the amount of behaviour change required by the community and the extent to which emissions reduction activity takes place in the ACT (as distinct from elsewhere).

4 OPTIONS PAPER FOR PUBLIC COMMENT
SUMMARY OF STRATEGIES AND ACTIONS IN DRAFT ACTION PLAN 2
Outcome 1: Reducing GHG emissions in the ACT
Strategy 1: Energy efficient buildingsAction 1.1 Improving energy efficiency in
existing commercial buildingsAction 1.2 Increasing energy efficiency
in new commercial buildingsAction 1.3 Increasing energy efficiency
in residential buildingsAction 1.4 Accelerated greenhouse intensive
water heater phase outAction 1.5 Installing co-generation and
tri-generation technologies in large buildings
Strategy 2: Sustainable transportAction 2.1 Reducing use of private vehicles
Action 2.2 Reducing emissions from vehicles
Strategy 3: Sustainable waste Action 3.1 Adopting energy from
waste technologies
Strategy 4: Renewable energy Action 4.1 Securing renewable energy
electricity generation for the ACT
Strategy 5: Gas-fired electricity generationAction 5.1 Securing gas-fired electricity
generation for the ACT
Strategy 6 Carbon offsets, including biosequestrationAction 6.1 Securing carbon offsets
Outcome 2: Ensuring a fair society in a low carbon economy
Strategy 7: Ensuring a fair society in a low carbon economy
Action 7.1 Adjust support for low income households
Action 7.2 Adjust support to improve energy efficiency in vulnerable households
Outcome 3: Adapting to a changing climate
Strategy 8: Climate research and informationAction 8.1 Enhancing knowledge on climate
impacts, vulnerability and capacity to deal with these impacts
Action 8.2 Enhancing decision making through data and information
Strategy 9: Long term water securityAction 9.1 Increasing security of Canberra’s
urban water supply
Strategy 10: BiodiversityAction 10.1 Protecting the ACT’s biodiversity
Strategy 11: Natural disastersAction 11.1 Integrating climate change impacts
into natural disaster and emergency risk management and planning
Action 11.2 Build government and community resilience to climate change impacts
Strategy 12: HealthAction 12.1 Responding to the health impacts
of climate change
Strategy 13: Urban planning and infrastructureAction 13.1 Plan a more sustainable and
compact cityAction 13.2 Promoting innovative and climate
resilient buildings and public spacesAction 13.3 Assessing risks to the ACT’s
infrastructureAction 13.4 Integrating climate change
adaptation and emergency management into land use planning and development decisions.
Outcome 4 Leading a sustainable future
Strategy 14: ACT Government carbon neutralityAction 14.1 Achieving carbon neutrality in ACT
Government by 2020
Strategy 15: Development of a clean economy Action 15.1 Developing a clean economy

PATHWAY TO A SUSTAINABLE AND CARBON NEUTRAL ACT 5
SUMMARY OF STRATEGIES AND ACTIONS IN DRAFT ACTION PLAN 2
GLOBAL ISSUE REQUIRING LOCAL ACTION2.

6 OPTIONS PAPER FOR PUBLIC COMMENT
2. GLOBAL ISSUE REQUIRING LOCAL ACTION
Vision and outcomes
The challenges posed by climate change will require concerted action if we are to avoid serious environmental, economic and social consequences. Scientific evidence shows that accumulated greenhouse gas emissions have already changed global climates and will continue to do so.
The ACT Government’s climate change policy is based on a vision that, by 2060, the ACT has become a sustainable and carbon neutral city that is successfully adapting to a changing climate.
The following four outcomes are designed to support the vision.
Outcome 1: Reducing GHG emissions in the ACT—by achieving the ACT’s GHG reduction targets.
Outcome 2: Ensuring a fair society in a low carbon economy.
Outcome 3: Adapting to a changing climate—strengthening the ACT’s knowledge on climate changes and capacity to manage risks.
Outcome 4: Leading a sustainable future—working together to create a sustainable future.
Changes in our climate
Scientific evidence tells us that our climate is changing globally, regionally and locally. The Intergovernmental Panel on Climate Change (IPCC) Fourth Assessment Report, released in 2007, found the average global surface temperature is expected to increase between 1.8˚C and 4˚C by the end of the century (IPCC 2007).
While climate change is a natural process, it has been significantly accelerated by the emission of greenhouse gases, primarily through the use of fossil based fuels. It is generally accepted by the international science community and a growing number of governments that the world must reduce its emission of greenhouse gases by at least 80% of 1990 emissions by 2050 if we are to have at least a 50% chance of limiting average global warming to 2˚C (Stern 2006). Global warming greater than this is expected to cause dramatic and irreversible changes, such as the melting of the Greenland ice cap and sea level rises, which in turn will lead to further catastrophic changes to our climate. As our scientific understanding of this issue deepens, there is a risk that larger emission reductions may need to be made sooner in order to at least limit dangerous climate change. A fifth assessment report from the IPCC is expected to be released over 2013 and 2014.
Climate change is expected to make our region drier and hotter and increase the incidence of extreme weather conditions. Climate change will result in lower than average, less evenly distributed and less predictable rainfall, meaning drier overall conditions and increased flash flooding.
Future climate change projections are directly incorporated into water planning by ACTEW, the water utility.
The ACT is expected to experience the following climatic changes:
• higher minimum, average and peak day and night temperatures
• increased frequency, intensity and duration of heat waves
• drier average seasonal conditions in autumn, winter and spring.

PATHWAY TO A SUSTAINABLE AND CARBON NEUTRAL ACT 7
ACT Government demand management and infrastructure investment strategies are also focussed on ensuring long term water security.
The impacts of climate change on biodiversity are expected to be serious, even with only a small increase in average temperature (1˚C or 2˚C). Species with restricted climatic ranges, small populations and limited ability to migrate are most likely to suffer dramatic declines or local extinction as suitable habitat disappears in the ACT. Availability of water will also be a major determining factor in the persistence and distribution of species across the landscape.
Climate change projections indicate there are likely to be significant impacts on public health in the ACT. Potential adverse effects on population health will arise from direct impacts, such as heat stress during heatwaves and sunburn, and indirect impacts such as food and waterborne diseases, deaths, injuries, mental trauma and population displacement due to natural disasters and extreme weather events.
Canberra’s structure (layout) and form (buildings and infrastructure) have been planned for liveability, accessibility,
vibrancy and community health, as well as conservation of the environment. In future planning and infrastructure investment, we must build on this legacy to meet contemporary challenges including a changing climate.
Greenhouse gas emissions in the ACT
Since 2005-06, the ACT Government has commissioned an annual ACT Greenhouse Gas Inventory (ACT Inventory). The ACT Inventory includes emissions from use of electricity in the ACT and, following the introduction of the Fuel Sales Data Amendment Act 2007, more accurately reflects fuel consumed in the ACT.
In summary, ACT emissions are dominated by emissions from stationary energy (electricity and gas) used in the residential and commercial sectors and petroleum fuels used in transport. Electricity comprises 63% of ACT emissions—the largest single source. Transport (22%) represents the second largest source of emissions, followed by natural gas (9%). Unlike the other states and territories, the ACT has few emissions from the agriculture and industrial sectors.
TABLE 1: PROjECTED 2011 ACT EMISSIONS BY SECTOR AND ENERGY SOURCE
Sector % Kilotonnes (kt)
Energy source
% Kilotonnes (kt)
Residential 31 1,279 Electricity 62 2,558
Commercial 40 1,650 Gas 9 371
Transport 23 949 Petroleum products
23 949
Other 6 247 Non-energy 6 247
Source: pitt&sherry, 2011

8 OPTIONS PAPER FOR PUBLIC COMMENT
FIGURE 1: ACT EMISSIONS DISAGGREGATED BY SECTOR
Petrol18%
Non-residentialelectricity
37%
Residentialelectricity
26%
All other transport fuels 4%
Non-residential natural gas 3%
Residential natural gas 5%
Industrial processes 3%Waste 2%
Other 1%
Source: ACT Greenhouse Gas Inventory 2009
The latest ACT Greenhouse Gas Inventory is available from environment.act.gov.au
Reduction in GHG needed to achieve ACT targets
In November 2010 the Climate Change and Greenhouse Gas Reduction Act 2010 came into effect, establishing emissions reduction targets of:
• zero net greenhouse gas emissions by 2060
• peaking per person greenhouse gas emissions by 2013
• 40% below 1990 levels by 2020 and
• 80% below 1990 levels by 2050.
These targets were informed by the Legislative Inquiry into Greenhouse Gas Reduction Targets which involved extensive consultation with the ACT community. The targets set a clear direction for planning our sustainable future.
FIGURE 2: ACT GREENHOUSE GAS EMISSIONS TARGET TRAjECTORY
0
1,000
2,000
3,000
4,000
5,000
500
1,500
2,500
3,500
4,500
1980
CO2-
emis
sion
(kt)
1990
2000
2010
2020
2030
2040
2050
2060
Source: pitt&sherry, 2011

PATHWAY TO A SUSTAINABLE AND CARBON NEUTRAL ACT 9
Without action to reduce the ACT’s emissions they will continue to increase, as a result—apart from anything else—of increases in the ACT’s population.
The ACT’s per capita emissions are approximately 12 tonnes of carbon dioxide equivalent emissions, which is lower than any other state or territory. These low per capita emissions are due to the structure of our economy and the lack of large energy intensive industry in the ACT. While overall ACT
per capita emissions are relatively low, our residential sector emissions are relatively high on a per household basis. Our high household emissions are largely due to higher heating requirements in the ACT compared to elsewhere in Australia.
Based on ACT Government population projections and projected emissions (with a carbon price), the ACT will meet its target of peaking per capita emissions by 2013 and will continue to fall over the projected period.
FIGURE 3: PROjECTED PER CAPITA EMISSIONS
Source: ACT Population Projections: 2009-2059, ACT Chief Minister’s Department
0
10
14
2
4
6
8
12
2010
Tonn
es/p
er p
erso
n
2014
2018
2022
2026
2030
2034
2038
2042
2046
2050
2054
2060
Feedback from Time to Talk Canberra 2030
Feedback from the ACT’s Government’s conversation with the Canberra community, Time to Talk Canberra 2030 (see page 10), illustrates that Canberrans have a good understanding of the complexity of climate change issues and the need for climate change to be a key consideration in the effective management of the ACT’s energy and water resources. It also showed that Canberrans understand
the need for efficient and diverse housing and integrated transport and land use.
Through Time to Talk, Canberrans identified what they thought the national capital would look like in the future. What emerged was a vision of a city that was more sustainable, more energy efficient and with a low carbon and environmental footprint. Addressing the impacts of climate change was a consistent theme in the key messages received from the Canberra community.
Addressing the impacts
of climate change was a
consistent theme in the key
messages received from the
Canberra community.

10 OPTIONS PAPER FOR PUBLIC COMMENT
Time to Talk Canberra 2030
In 2010, the ACT Government initiated a process of broad and deep community engagement to provide a picture of the key challenges faced by the Canberra community and how these challenges should be addressed.
Population growth and demographyThrough Time to Talk, the community told us that a key challenge was managing population growth while retaining Canberra’s liveability, community spirit and character as the ‘Bush Capital’.
Canberra’s population is growing at a rate of 1.3% p.a. on average over the next 10 years. Our environmental footprint is 9.2 global hectares per person, which is almost 25% higher than 10 years ago and is 13% above the national average. Energy costs are rising and our bills are getting bigger. To be able to accommodate a larger projected population for the ACT and ensure that we continue to enjoy a high quality of life, we will need to ensure that our city is low carbon, energy efficient and ecologically sensitive.
Management of energy and waterOver 70% of the ACT’s greenhouse gas emissions come from stationary energy, that is, electricity and gas used in houses, office buildings and businesses. Energy use in homes accounts for 26% of our greenhouse gas emissions, and non residential electricity use contributes 37%. Using energy more efficiently not only helps to reduce greenhouse gas emissions; it can also save money.
As climate is a key driver of the water cycle, climate change presents major water resource management challenges. The management and protection of the ACT’s water resources is one of the most important priorities for the ACT Government. Everyone in the ACT has a part to play in ensuring there is enough water for our current needs and for future generations.
Housing diversityThe ACT Government requires buildings to meet energy efficiency standards under the Building Act 2004 and the National Construction Code. All new houses are to be built to the equivalent of a six-star energy efficiency rating, or in the case of apartment blocks (Class 2 buildings), to have an average rating of six-stars across all units
an average rating of six-stars across all units in the building with none less than an equivalent of 5 stars. Sustainable design is a priority and new buildings and retrofits will need to be planned to maximise their environmental performance, particularly in a warmer climate.
Integrating transport and land useTransport currently accounts for 23% of the ACT’s greenhouse gas emissions and this figure is increasing. We can reduce transport emissions and make Canberra a more sustainable city by making our transport more energy efficient (e.g. lower emissions vehicles such as electric vehicles, carpooling, and smarter management of traffic and transport), and encouraging mode shift to public transport, walking and cycling, supported by new infrastructure, land use change, programs, pricing, policy and promotion.
A compact city and quality urban developmentThrough Time to Talk, the community called for a more environmentally responsible city. The community wants Canberra to remain liveable, to offer people a range of lifestyle choices and to be a city at the centre of a vibrant, innovative, well connected region. To do this, effective leadership and successful partnerships across government, the community and industry sectors are important.
Canberra’s role in the regionCanberra is already a regional hub but the community has called for Canberra to re-engage with the region by blurring the borders and strengthening its role as a service centre for the region. Canberra has the potential to be a leader in the region through an innovative approach to environmental sustainability whilst maintaining the ‘Bush Capital’ character that we enjoy.
Ecological Footprint Data Source: Integrated Sustainability Analysis Research Group, University of Sydney, The 2008–09 Ecological Footprint of the population of the Australian Capital Territory, 2010 (commissioned by the ACT Office of the Commissioner for Sustainability and the Environment)

PATHWAY TO A SUSTAINABLE AND CARBON NEUTRAL ACT 11
National and international policy settings
The ACT is taking action in an uncertain policy environment. The shape and timing of an international agreement beyond the current Kyoto Protocol is yet to emerge.
On 10 July 2011 the Australian Government announced details of the Clean Energy Package to reduce carbon pollution across Australia. The package
includes the establishment of a carbon price commencing on 1 July 2012 with an initial price of $23 per tonne of CO2-e, rising at 2.5% a year during the first three years. The carbon price is expected to cover around 60% of Australia’s emissions.
The impact of the Australian Government’s Carbon Price Mechanism has been estimated by pitt&sherry (2011) and is illustrated in Figure 4 with the 2020 and 2060 targets.
FIGURE 4: EFFECT OF A CARBON PRICE ON ACT EMISSION PROjECTIONS
Source: pitt&sherry, 2011
0
1,000
2,000
3,000
4,000
6,000
5,000
2010
Emis
sion
s (k
t CO
2 -e
)
2020
2030
2040
2050
2060
no national carbon pricewith national carbon price
2060 target
2020 target
The implementation of a national carbon price by 1 July 2012 will make an important contribution towards meeting the ACT’s greenhouse gas reduction targets. This will happen in two ways. First, the carbon price is expected to lead to lower GHG intensity in the National Electricity Market, so each unit of electricity consumed in the ACT will, over time, lead to fewer GHG emissions. Second, a carbon price will change the relative prices for emissions intensive goods and will provide businesses and households with incentives to choose low-emission technologies and to use energy and other resources more efficiently.
The underlying premise of carbon pricing is to ensure that individually, and as a society, we account for the environmental impacts of our carbon emissions and have the incentive to reduce those emissions. However, the ACT will also need to implement a range of measures in excess of the national carbon price in order to achieve its own legislated targets, as set out on the following page.
The Clean Energy Package will guide the ACT in how to address voluntary action and how that can result in additional abatement being achieved.

12 OPTIONS PAPER FOR PUBLIC COMMENT
Achieving the ACT targets
Figure 5 illustrates the gap between the ACT’s legislated greenhouse gas targets and projected GHG emissions.
The projected emissions are based on a business as usual projection less the reduction in emissions from the national carbon price and recently announced climate change measures. The projected emissions take into account expected population and economic growth and current national
FIGURE 5: ACT EMISSIONS REDUCTION CHALLENGE TO 2020
Source: pitt&sherry, 2011
To achieve its 2020 target, the ACT needs to reduce its greenhouse gas emissions by around 2212kt CO2-e, to less than half its current level of emissions.
0
1,000
2,000
3,000
4,000
5,000
500
1,500
2,500
3,500
4,50020
11
kt c
O2-
e
Projected emissions with current measures(includes the national carbon price)
2020
2040
2060
2212 kt CO2 -e
reduced by 2020
Target trajectory to zero net emissions by 2060
2030
2050
GreenPower GreenPower is government accredited, emissions free renewable electricity purchased by electricity retailers from accredited renewable energy sources. The ACT recognises GreenPower as a national standard for accrediting renewable energy products sold to Australian electricity customers.
Since 2009, the first offer to any new or reconnecting ACT electricity customer must be an accredited GreenPower product. Customers can choose to accept, refuse, increase or decrease the GreenPower component ranging from 10 to 100% of their total electricity needs. This GreenPower is predominantly sourced from wind farms around Australia (as well as landfill gas generators).
The ACT is, on a per capita basis, the highest user of GreenPower. This reflects high levels of uptake by ACT households and large purchases by organisations including the ACT and Australian Governments and our universities.
Buying GreenPower is one of the most cost effective ways of reducing emissions from electricity production. It also provides a lot of flexibility in relation to the range of renewable electricity sources that can be supported and their location. Through the GreenPower scheme, the ACT community can directly support the development of renewable electricity sources outside the Territory and have confidence the generation would not have occurred without their support.
policies such as the Minimum Energy Performance Standards.
It is estimated that emissions in the ACT will be reduced by around 151kt CO2-e per annum as a result of a range of recently announced measures, including the ACT Feed-in Tariff (70MW), a material recovery facility to sort commercial waste, phase out of electric hot water heaters (under COAG’s National Strategy on Energy Efficiency) and GreenPower (see box below).

PATHWAY TO A SUSTAINABLE AND CARBON NEUTRAL ACT 13
ACHIEVING THE 2020 EMISSIONS REDUCTION TARGET
3.

14 OPTIONS PAPER FOR PUBLIC COMMENT
3. ACHIEVING THE 2020 EMISSIONS REDUCTION TARGET
The most important task for Action Plan 2 is to set out the pathway for achieving the 2020 emissions reduction target. The pathway will determine the preferred actions that take the ACT to its target. Achieving the 2020 target will put the ACT well on the way to achieving its longer term goals as well.
This section outlines the ways in which the ACT Government, businesses and the community can work together to meet the 2020 targets. The aim is to engage the community in a discussion about the merits of different approaches so the final Action Plan 2 reflects a pathway that embodies the community’s aspirations and willingness to change or to bear costs.
The different emissions reduction strategies that could be pursued
in the ACT are set out below. There are five possible pathways which could be followed to meet our GHG targets.
Emissions reduction strategies
In preparing Draft Action Plan 2, the ACT Government has explored the potential to reduce GHG emissions by improving energy efficiency in residential and commercial buildings, reducing emissions from the transport and waste sectors, increasing electricity supplied by renewable energy and gas and purchasing of carbon offsets. A menu of strategies and actions for reducing GHG emissions has been developed (see box below). We welcome views on any other measures that may also be available.
Menu of actions to achieve GHG reduction targets1. Energy efficient buildings
1.1 Improving energy efficiency in existing commercial buildings
1.2 Increasing energy efficiency in new commercial buildings
1.3 Increasing energy efficiency in residential buildings
1.4 Accelerated greenhouse intensive water heater phase-out
1.5 Installing co-generation and tri-generation technologies in large buildings
2. Sustainable transport
2.1 Reducing use of private vehicles
2.2 Reducing emissions from vehicles
3. Sustainable waste
3.1 Adopting energy from waste technologies
4. Renewable energy
4.1 Increasing renewable energy electricity generation for the ACT
5. Gas-fired electricity generation
5.1 Installing gas-fired electricity generation
6. Carbon offsets, including biosequestration
6.1 Securing carbon offsets

PATHWAY TO A SUSTAINABLE AND CARBON NEUTRAL ACT 15
Choosing the right pathWhile each strategy is potentially important, none can individually provide the answer to achieving the interim GHG emissions target or the longer term transition to 2060.
Instead, the strategies need to be coordinated and integrated to ensure the delivery of a considered and cost effective pathway that will meet the ACT’s legislated greenhouse gas reduction targets.
Choosing the right pathway is the most important challenge for government and the community in developing Action Plan 2.
There are potentially many pathway options. Five are presented for community consideration, each using a unique mix of the previously presented strategies. These include:
1. Renewable energy
2. Buildings, transport, waste and renewable energy
3. Buildings, transport, waste plus gas fired electricity generation and offsets as required
4. Buildings, transport, waste and offsets
5. Carbon offsets
The pathways are all designed to achieve the interim 2020 GHG reduction target. Each pathway results in a different distribution of greenhouse gas emissions from the ACT by 2020. Consequently, the decision to adopt a particular pathway now will influence the approaches that may be adopted cost effectively post-2020 in order to achieve the 2060 carbon neutrality goal. At the same time, new technologies and other developments that are hard to predict right now may open up new possibilities in the future.
There are also trade offs between pathways in relation to costs, the amount of behavioural change required by the community and the extent to which emissions reducing activity takes place in the ACT (as distinct from elsewhere).
0
1,000
2,000
3,000
4,000
5,000
500
1,500
2,500
3,500
4,500
2010
kt C
O2-
e
2011
2012
2013
2014
2015
2016
2017
2018
2019
2020
2020 Target
Offsets
Renewable energy
Emissions projection
FIGURE 6: EMISSIONS REDUCTIONS UNDER PATHWAY 1—RENEWABLE ENERGY

16 OPTIONS PAPER FOR PUBLIC COMMENT
Pathway 1: Renewable energy
Overview
Pathway 1 would involve the use of renewable energy (Strategy 4) as the main strategy for achieving emissions reductions. The purchase of a small component of carbon offsets (Strategy 6) is also included, as current modelling indicates that switching to renewable energy for the total ACT electricity supply will be insufficient to meet the 2020 greenhouse gas reduction target on its own (emissions associated with transport fuels, use of natural gas and the waste sector would not be affected by this pathway).
Key points
• Pathway 1 assumes a steady increase in renewable energy capacity until almost all the ACT’s electricity supply is renewable.
• The small shortfall in emissions reduction required to meet the target is gained through the purchase of 126kt offsets to achieve the 2020 target.
• This is a capital intensive pathway, requiring an upfront investment of around $2.7 billion; once constructed, however, low ongoing operational costs are assumed.
TABLE 2: ESTIMATED COST OF PATHWAY 1
Strategy $/t Abatement to 2020
(kt CO2-e)
Cost to 2020 ($m)
Abatement in 2020
(kt CO2-e)
Cost in 2020 ($m)
Cost per capita in
2020
Renewable energy
$41.00 8,404 $243 2,085 $84.00
Offsets $25.00 126 $3 126 $3.00
8,529 $246 2,211 $87 $216.32
Cost of cumulative abatement ($/t)
Cost of abatement in 2020
$29.00 $39.00
Note: All costs have been estimated using a discount rate of 5%, transport costs have been estimated using a discount rate of 7%. Costs are expressed in 2010 dollars.
• The cost of Pathway 1 is based on the current lowest cost source of large scale renewable energy—wind. 1,066 MW of wind capacity is required to switch the ACT’s electricity supply from fossil fuel to renewable energy.
• It is estimated that Pathway 1 would cost an estimated $29 to $39 per tonne. This cost represents the premium that would be required to secure wind energy rather than natural gas, and does not assume the generation of energy within the ACT.
• Implicit in this pathway are the assumptions that no new energy efficiency measures are adopted and that Canberrans do not make lifestyle changes to conserve energy usage, beyond those attributable to the carbon price.
• Petroleum products for transport purposes would become the dominant emissions source in 2020.
• The renewable energy does not necessarily have to be acquired from one large wind farm. Options are available to work with preapproved contractors to purchase wind power from a number of sites. This will be examined pending the outcomes of the consultation process.

PATHWAY TO A SUSTAINABLE AND CARBON NEUTRAL ACT 17
FIGURE 7: ESTIMATED ACT EMISSIONS SOURCES UNDER PATHWAY 1
1,000 2,000
Gas
Other
500 1,500 2,500
Electricity
Transport
0
kt CO2-e
3,000
20202008
Pathway 2: Buildings, transport, waste and renewable energy
Overview
Pathway 2 targets reductions in GHG emissions from buildings (Strategy 1), transport (Strategy 2) and waste (Strategy 3), with the remaining emissions achieved through switching approximately two-thirds of the ACT’s electricity supply to renewable energy (Strategy 4).
Key points
• Pathway 2 involves adoption of a broad range of strategies to achieve the government’s GHG reduction targets and has the appeal of ensuring that more cost effective strategies are fully used before more costly strategies are implemented.
• Lighting, ventilation and air conditioning systems in existing commercial buildings are upgraded and energy efficient technologies are installed in new commercial buildings. The benefits of installing co-generation and tri-generation
systems in large commercial buildings are also realised.
• Thermal performance improvements are made to existing residential buildings with an emphasis on those with low levels of insulation and/or poor weather sealing.
• The greenhouse intensity of major appliances in homes is also decreased by replacement of some forms of electric space heating and the accelerated phase out of electric resistance hot water heaters. Exposure to carbon costs and price risks would be reduced.
• Often the simplest and lowest cost measures to increase the energy efficiency of households occur in houses at the lower end of the star rating scale.
• Reductions in transport emissions are captured by shifting to more sustainable modes of transport (public transport, cycling, walking) and reducing emissions from vehicles through energy efficiency or electric vehicles fuelled by GreenPower electricity.

18 OPTIONS PAPER FOR PUBLIC COMMENT
• The installation of a 30 MW energy from waste facility is expected to be a cost effective source of energy for electricity. The energy from waste facility is likely to involve a capital cost of around $40 million. The waste facility would also reduce waste sent to landfill.
• Pathway 2 still requires significant reliance on renewable energy supplies for electricity. For costing purposes, it assumes the installation of a 650 MW wind facility, with a capital investment cost of around $1.5 billion.
0
1,000
2,000
3,000
4,000
5,000
500
1,500
2,500
3,500
4,500
2010
kt C
O2-
e
2011
2012
2013
2014
2015
2016
2017
2018
2019
2020
2020 target
sustainabletransport
renewable energy
energy efficientbuilding
sustainable waste
emissions projection
• Pathway 2 does not require the purchase of carbon offsets.
• Pathway 2, if adopted, is estimated to deliver cumulative GHG emissions savings from the Territory of 9,844kt CO2-e by 2020, with an estimated cost of abatement of $1.12 to $2.26 per tonne.
• The most cost effective options are implemented first, resulting in the cost of abatement in 2020 being higher than the average cost of abatement over the period from 2011 to 2020.
FIGURE 8: ESTIMATED ACT EMISSIONS REDUCTIONS UNDER PATHWAY 2

PATHWAY TO A SUSTAINABLE AND CARBON NEUTRAL ACT 19
TABLE 3: ESTIMATED COST OF PATHWAY 2
Strategy $/t Abatement to 2020
(kt CO2-e)
Cost to 2020 ($m)
Abatement in 2020
(kt CO2-e)
Cost in 2020 ($m)
Cost per capita in
2020
Energy efficient buildings
$(20.00) 2,233 $(1) 460 $(15)
Sustainable transport
$(118.00) 1,238 $(146) 262 $(31)
Sustainable waste
$(20.00) 719 $(8) 130 $(3)
Renewable energy
$ 41.00 5,654 $166 1,357 $54
9,844 $11 2,207 $5 $12.20
Cost of cumulative abatement ($/t)
Cost of abatement in 2020
$1.12 $2.26
NB: (brackets) denote a negative cost; that is, a net financial saving.
1,000 2,000
Gas
Other
500 1,500 2,500
Electricity
Transport
0
kt CO2-e
3,000
20202008
FIGURE 9: ESTIMATED ACT EMISSIONS SOURCES UNDER PATHWAY 2

20 OPTIONS PAPER FOR PUBLIC COMMENT
Pathway 3: Buildings, transport, waste plus gas-fired electricity generation and offsets
Overview
Pathway 3 is effectively a modification of Pathway 2, in which electricity generation is produced through the installation of gas-fired technology (Strategy 5) rather than renewable energy. Similarly to Pathway 2, reductions in GHG emission are achieved from buildings (Strategy 1), transport (Strategy 2) and waste (Strategy 3). Purchase of offsets (Strategy 6) is required as gas is a lower emission, not zero emission, technology.
Key points
• Pathway 3 involves the installation of a regionally located combined cycle gas turbine (CCGT) facility, which is effectively a natural-gas powered jet engine connected to a generator with heat recovery from the gas turbine used to power a secondary steam turbine.
• A single CCGT unit of 250MW capacity to start operation in 2015 is proposed. Such a unit will be sufficient to supply the ACT’s electricity needs in 2020 when combined with the installation of an energy from waste facility. The upfront cost of a CCGT facility would be in the order of $325 million.
• A CCGT could be complemented by the installation of a 30MW energy from waste facility at a cost of about $40 million. The cost of such a facility is slightly lower per unit of electricity produced than CCGT.
• A CCGT facility could be located within the ACT or in the surrounding region, although the further away from the ACT the facility is located, the higher transmission losses become, decreasing the efficiency of the pathway.
• This pathway assumes the adoption and benefits of improved energy efficiency technologies (consistent with Pathway 2) in residential and commercial buildings, and in transportation.
• Under this pathway, around 627kt in offsets would be required to be purchased in 2020, as the CCGT has a higher greenhouse gas intensity than the wind generation in Pathway 2.
• If adopted, this pathway could reduce greenhouse gas emissions from the Territory by an estimated 1583kt CO2-e in 2020, with the additional 627kt CO2-e from offsets.
• The CCGT is a form of fossil fuel technology that would be subject to potentially increasing fuel costs. Ultimately this technology would need to be phased out at the end of the facility’s effective life to enable the 2060 carbon neutrality target to be met. From this perspective, CCGT can be argued to be an ‘interim’ measure.
• The costs of installing a CCGT facility (around $325 million) would be lower than renewable technology ($750 million) for comparable energy generation. In Table 4, no abatement costs are assumed for the CCGT facility, as this technology represents the ‘business as usual’ solution for new capacity in the NEM, particularly following the introduction of the carbon price.
• A risk with relying on carbon offsets is the current large degree of uncertainty surrounding offset markets and the difficulty in ensuring purchased offsets actually result in real emissions abatement which is maintained through time.
• Pathway 3, if adopted, is estimated to deliver cumulative greenhouse gas emissions savings from the Territory of 11,234kt CO2-e by 2020, with an estimated cost of abatement of -$10.71 to -$15.38 per tonne.

PATHWAY TO A SUSTAINABLE AND CARBON NEUTRAL ACT 21
0
1,000
2,000
3,000
4,000
5,000
500
1,500
2,500
3,500
4,50020
10
kt C
O2-
e
2011
2012
2013
2014
2015
2016
2017
2018
2019
2020
2020 target
CCGT (250MW)
sustainable transport
emissions projection
offsets
sustainable wasteenergy efficientbuildings
FIGURE 10: ESTIMATED EMISSIONS REDUCTIONS UNDER PATHWAY 3
TABLE 4: ESTIMATED COST OF PATHWAY 3
Strategy $/t Abatement to 2020
(kt CO2-e)
Cost to 2020 ($m)
Abatement in 2020
(kt CO2-e)
Cost in 2020 ($m)
Cost per capita in
2020
Energy efficient buildings
$(20.00) 2,233 $(1) 460 $(15)
Sustainable transport
$(118.00) 1,238 $(146) 262 $(31)
Sustainable waste
$(20.00) 719 $(8) 130 $(3)
CCGT $– 5,656 $– 730 $–
Offsets $25.00 1,388 $35 627 $15
11,234 $(120.31) 2,210 $(34) $(82.99)
Cost of cumulative abatement ($/t)
Cost of abatement in 2020
-$10.71 -$15.38

22 OPTIONS PAPER FOR PUBLIC COMMENT
Pathway 4: Buildings, transport, waste and offsets
Overview
Similarly to pathways 2 and 3, reductions in GHG emissions are achieved from buildings (Strategy 1), transport (Strategy 2) and waste (Strategy 3). However, Pathway 4 differs as it includes the purchase of offsets (Strategy 6) rather than pursuing changes in electricity generation to achieve the 2020 target.
Key points
• GHG reduction from buildings, transport and waste in combination can be expected to deliver annual emissions reductions of 852kt in 2020. Offsets of 1,357kt make up the shortfall to the target.
• Pathway 4 involves the adoption of a range of new energy efficiency measures and lifestyle changes by Canberrans to reduce the amount of energy we consume.
• Energy efficiency measures are highly cost effective. Although they
often involve an immediate upfront cost, benefits accrue over a number of years. Frequently the financial benefits derived from reduced energy consumption outweigh the initial up-front cost.
• Pathway 4 is heavily reliant on the use of carbon offsets to achieve the 2020 target.
• A carbon offset is any project that indirectly reduces GHG emissions at one source by investing in emissions reduction activities elsewhere. Offset markets can source offsets from within or outside Australia.
• Offsets vary in terms of the certainty and security of the emissions abatement they deliver. The rules around what may be defined as an offset, and the associated values of those offsets, are fluid and currently under development. The Australian Government’s Carbon Farming Initiative may provide a new framework for offsets in Australia— covering both Kyoto compliant and non-Kyoto compliant activities.
• Offsets do not require structural change in energy use or supply in the
1,000 2,000
Gas
Other
500 1,500 2,500
Electricity
Transport
0
kt CO2-e
3,000
20202008
FIGURE 11: ESTIMATED ACT EMISSIONS SOURCES UNDER PATHWAY 3
PATHWAY TO A SUSTAINABLE AND CARBON NEUTRAL ACT 23
0
1,000
2,000
3,000
4,000
5,000
500
1,500
2,500
3,500
4,500
2010
kt C
O2-
e
2011
2012
2013
2014
2015
2016
2017
2018
2019
2020
2020 target
energy efficientbuildings
sustainable transport
emissions projection
offsets
sustainable waste
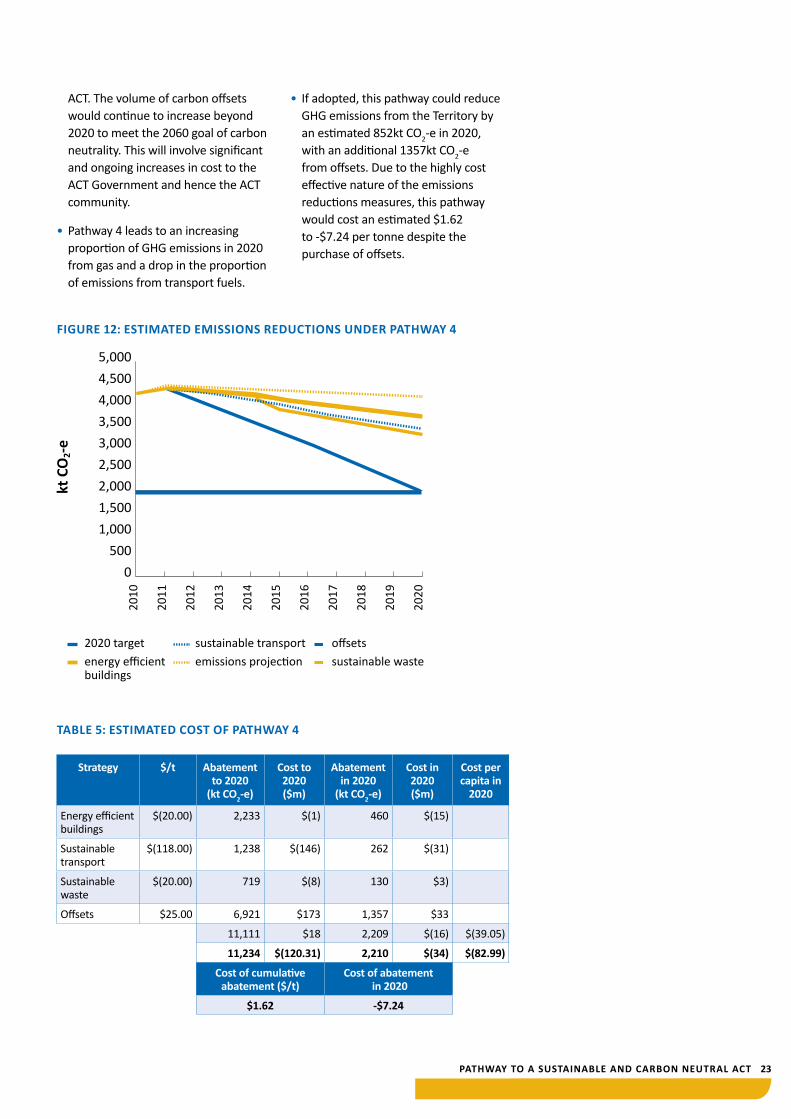
ACT. The volume of carbon offsets would continue to increase beyond 2020 to meet the 2060 goal of carbon neutrality. This will involve significant and ongoing increases in cost to the ACT Government and hence the ACT community.
• Pathway 4 leads to an increasing proportion of GHG emissions in 2020 from gas and a drop in the proportion of emissions from transport fuels.
• If adopted, this pathway could reduce GHG emissions from the Territory by an estimated 852kt CO2-e in 2020, with an additional 1357kt CO2-e from offsets. Due to the highly cost effective nature of the emissions reductions measures, this pathway would cost an estimated $1.62 to -$7.24 per tonne despite the purchase of offsets.
FIGURE 12: ESTIMATED EMISSIONS REDUCTIONS UNDER PATHWAY 4
TABLE 5: ESTIMATED COST OF PATHWAY 4
Strategy $/t Abatement to 2020
(kt CO2-e)
Cost to 2020 ($m)
Abatement in 2020
(kt CO2-e)
Cost in 2020 ($m)
Cost per capita in
2020
Energy efficient buildings
$(20.00) 2,233 $(1) 460 $(15)
Sustainable transport
$(118.00) 1,238 $(146) 262 $(31)
Sustainable waste
$(20.00) 719 $(8) 130 $3)
Offsets $25.00 6,921 $173 1,357 $33
11,111 $18 2,209 $(16) $(39.05)
11,234 $(120.31) 2,210 $(34) $(82.99)
Cost of cumulative abatement ($/t)
Cost of abatement in 2020
$1.62 -$7.24

24 OPTIONS PAPER FOR PUBLIC COMMENT
FIGURE 13: ESTIMATED ACT EMISSIONS SOURCES UNDER PATHWAY 4
Pathway 5: Carbon offsets
Overview
Pathway 5 relies entirely on the purchase of offsets (Strategy 6) to achieve the 2020 target. Pathway 5 is most similar to Pathway 4, however it does not include reductions in GHG emission from buildings (Strategy 1), transport (Strategy 2) and waste (Strategy 3).
Key points
• Pathway 5 would have the same proportion of GHG emissions in 2020 as it does not require structural changes in the use or supply of energy.
• Offsets are less cost effective than reduction in emissions from energy efficiency measures in buildings and transport; however, they are cheaper than alternative supplies of energy.
• Assuming a linear reduction in emissions between 2011 and 2020, around 11,110kt of offsets would have to be purchased by 2020. Based on a market price of $40 per tonne, this would cost an estimated $298 million in 2010 dollars.
• Any offset purchased would need to be consistent with national and international greenhouse gas offset frameworks to ensure additionality.
1,000 2,000
Gas
Other
500 1,500 2,500
Electricity
Transport
0
kt CO2-e
3,000
20202008

PATHWAY TO A SUSTAINABLE AND CARBON NEUTRAL ACT 25
FIGURE 14: ESTIMATED EMISSIONS REDUCTIONS UNDER PATHWAY 5
0
1,000
2,000
3,000
4,000
5,000
500
1,500
2,500
3,500
4,500
2010
kt C
O2-
e
2011
2012
2013
2014
2015
2016
2017
2018
2019
2020
2020 target emissions projection offsets
TABLE 6: ESTIMATED COST OF PATHWAY 5
Strategy $/t Abatement to 2020
(kt CO2-e)
Cost to 2020 ($m)
Abatement in 2020
(kt CO2-e)
Cost in 2020 ($m)
Cost per capita in
2020
Offsets $25.00 11,110 $298 2,210 $54
11,110 $298 2,210 $54 $131.80
Cost of cumulative abatement ($/t)
Cost of abatement in 2020
$26.82 $25.00
Estimating costsThe ACT Government has commissioned a range of research and analysis since 2009 to inform the development of climate change policy options. The findings of these reports have been used to scope, cost and assess the development of emissions reduction options presented in draft Action Plan 2.
Consultants pitt&sherry were commissioned to report on measures that the ACT could adopt to meet the required emissions reduction targets. The analysis by pitt&sherry focuses
firstly on the amount of emission reductions (abatement potential) that could be achieved by each measure and, secondly, on the net cost of achieving those emission reductions.
Net costs are measured as the difference, over time, between the capital and operating costs of the measure and the benefits of either the energy saved (in the case of energy efficiency measures) or the low emission energy produced (in the case of energy supply measures).
The analysis does not attempt to distribute the costs and benefits

26 OPTIONS PAPER FOR PUBLIC COMMENT
between different parties (government, businesses or the community) or assess secondary effects, such as changes in energy prices, associated with these measures. This would require details about the design of specific policy interventions which have yet to be determined. However, the analysis does describe potential policy options that may be relevant for each measure.
Cost per capita in 2020 is calculated by dividing the estimated cost of abatement in 2020 by the forecast population of the ACT. Cost of abatement per tonne of CO2-e is provided for each pathway to allow comparison of estimated costs.
The analysis by pitt&sherry indicates that actions resulting in the efficient use of energy are generally the most cost effective. While energy efficiency measures have upfront costs, these are countered by energy and cost savings over the longer term. In many cases the value of energy savings more than offsets the cost of actions. However, there is a limit to the reduction in emissions that can be achieved through energy efficiency actions; alone, they will not be sufficient to achieve the 2020 target.
Investing in renewable energy generation also has high upfront costs. A wind farm sufficient to supply all the ACT’s electricity needs would require the installation of around 1066 MW of wind generation capacity, requiring an investment of around $2.7 billion. This falls to around 650MW when energy efficiency measures are included to reduce energy needs, with a capital cost of around $1.6 billion.
At a carbon price of around $33 per tonne, wind generation would require a premium of between $40 and $45 per MWh to be competitive with the national electricity market in 2020. However, an advantage of wind farms is they incur relatively low ongoing
operational costs once constructed. Additionally, the cost effectiveness of renewable energy increases over time as the carbon price increases.
Construction of a single combined cycle gas turbine (CCGT) unit of 250MW would also be sufficient to supply the ACT’s electricity needs in 2020 after taking into consideration energy efficiency actions. The upfront cost of a CCGT facility of this size would be around $375 million. With the introduction of a national carbon price, CCGT is likely to become the default option for new generation capacity. Therefore, the abatement cost of CCGT would fall to zero.
Depending on the project type and certification standard provided, Kyoto-compliant abatement credits can range between $15 per tonne CO2-e and $50 per tonne CO2-e. In examining the costs to the ACT of purchasing offsets to meet reduction targets, $40 per tonne has been used.
A feature that distinguishes offsets from the other strategies is that offsets can be thought of as a direct expense that does not deliver ongoing GHG reduction benefits. This means that as the ACT economy grows and the levels of emissions increase, the quantity of offset purchases would also need to increase, as would the total cost.
The ACT Government is conscious that transitioning to a low carbon and sustainable economy will have financial implications for the broader ACT community. We are committed to working with the community to ensure that the needs of low income households and the vulnerable in our community are taken into account when developing our policies and programs.
In general terms the final cost of abatement will depend on policy design decisions which are yet to be made.
The ACT Government is
conscious that transitioning
to a low carbon and
sustainable economy will
have financial implications
for the broader ACT
community.

PATHWAY TO A SUSTAINABLE AND CARBON NEUTRAL ACT 27
Implementing changeEmissions reduction actions
The mix of actions in the final Action Plan 2 will depend on the pathway adopted.
The range of actions that will be selected from to develop Final Action Plan 2 are summarised in Table 7. Through community consultations other actions beyond those listed may be identified. A choice to pursue any one pathway may mean that some actions are not undertaken.
Community feedback on the specific actions associated with each strategy is encouraged as part of the discussion
of pathways for achieving emissions reductions.
Table 7 summarises the estimated potential contribution that each action could make if pursued through Action Plan 2. The table also includes information on the cost effectiveness of each action. Note, the cost analysis does not include any overhead costs associated with implementation. Also some strategies and actions may be easier to implement because, for example, there is less reliance on people changing their behaviour or investment is concentrated rather than dispersed. See Appendix 1 for more detailed analysis of actions and practicalities of implementation.
TABLE 7: EMISSIONS REDUCTION ACTIONS, POTENTIAL AND COST EFFECTIvENESS
Action Description Potential reduction in GHG in 2020 (CO2- e)
Cost effectiveness
1.1 Improving energy efficiency of existing commercial buildings
Commercial buildings are retrofitted to improve energy efficiency through upgrading or replacing:
• heating, ventilation and air conditioning (HVAC) systems
• hot water systems and chillers
• lighting systems.
Buildings and systems are maintained to new performance levels.
87kt Highly cost effective.
Cost of investing in upgrades is estimated at $43 million compared with benefits of an estimated $173 million.
1.2 Increasing energy efficiency in new commercial buildings
New buildings are designed and built to higher energy efficiency standards, reducing energy demand. High efficiency HVAC systems, hot water systems and chillers, and lighting systems are installed.
Buildings and systems are maintained to high performance levels.
102kt Highly cost effective.
Energy efficiencies in new buildings are likely to realise savings in the order of $193 million out to 2031.
1.3 Increasing energy efficiency in residential buildings
Improving the thermal performance of homes by increasing levels of insulation and weather sealing and other simple building upgrades.
Lowering the carbon intensity of energy used—for example by replacing wired-in electric resistive heating with efficient heat pump, gas or solar thermal heating.
122kt Highly cost effective—savings in energy costs will be higher than the initial investment during the life of the asset.
Cost of investing in upgrades is estimated at $231 million compared with benefits of an estimated $245 million.

28 OPTIONS PAPER FOR PUBLIC COMMENT
TABLE 7: EMISSIONS REDUCTION ACTIONS, POTENTIAL AND COST EFFECTIvENESS (CONT)
Action Description Potential reduction in GHG in 2020 (CO2- e)
Cost effectiveness
1.4 Accelerated phase out of greenhouse intensive water heaters
Replacing existing electric resistance waters heaters with less greenhouse intensive water heaters in single dwellings and townhouses by 2020.
This measure accelerates the national phase out of greenhouse intensive water heaters.
39kt Cost effective—savings in energy costs will be higher than the initial investment during the life of the asset.
Cost of investing in upgrades is estimated at $40 million ($2,300 per eligible dwelling) compared with benefits of estimated to be $50 million.
1.5 Install co-generation and tri-generation technologies in large buildings
Tri-generation and co-generation systems work best at larger scales but can be expensive to retrofit. These factors may limit their potential opportunity in the ACT to a small number of systems strategically located to suitable heating and cooling loads.
The assumption is made that office buildings greater than 15,000 m2, two large hospitals and four large shopping malls would benefit from tri-generation
106kt Cost effective—installation in hospitals yield large net benefits, shopping malls provide potential savings over 20 years.
Modelling assumed an average capital cost of $2,500 per kW to install tri-generation systems, including heating and cooling components.
2.1 Reducing use of private vehicles
The Transport for Canberra strategy will promote alternatives to private vehicles
The ACT Planning Strategy will support the creation of a more compact city with urban renewal along transport corridors.
65kt Highly cost effective—savings in energy costs will be higher than the initial investment during the life of the asset.
Benefit to cost ratio of the proposed Frequent Public Transport Network is over 3:1.
Changes can be cost neutral for households provided alterative travel choices are accessible, affordable and convenient.
2.2 Reducing emissions from vehicles
Reduce the emissions of the passenger vehicle fleet.
Improve the efficiency of the public transport fleet.
Support the introduction of electric vehicles into the ACT, powered by 100% GreenPower.
196kt Highly cost effective—savings in energy costs will be higher than the initial investment based on current fuel and motor vehicle prices.
3.1 Adopt energy from waste technologies
Reduced organic material going to landfill.
Increased energy generation from an energy from waste facility.
130kt Cost effective.
Investment and operational costs are estimated at around $60 million against an estimated benefit of $260 million from reduced energy costs.

PATHWAY TO A SUSTAINABLE AND CARBON NEUTRAL ACT 29
TABLE 7: EMISSIONS REDUCTION ACTIONS, POTENTIAL AND COST EFFECTIvENESS (CONT)
Action Description Potential reduction in GHG in 2020 (CO2- e)
Cost effectiveness
4.1 Increase renewable energy electricity generation for the ACT
Installing wind or PV solar electricity generation capacity in the ACT.
Up to 2085kt Wind generation would involve a cost of around $2.5 million per MW.
An indicative capital cost for large-scale PV solar would be around $4 to $5 million per MW.
5.1 Install gas-fired electricity generation
Construction of a combined cycle gas turbine (CCGT) generation plant in the ACT region.
730kt Investment of between $1.2 and $1.3 million per MW.
6.1 Secure carbon offsets
Purchase of accredited offsets, including potentially from biosequestration activities.
Up to 2210kt CO2-e
Cost effective.
$20 to $40 per tonne CO2-e based on purchase of commercial offsets.
Ensuring a fair society in a low carbon economy
Regardless of the pathway chosen for emissions reductions, the ACT Government is committed to ensuring a fair society in a low carbon economy.
As the ACT and Australian economy shifts towards lower carbon and renewable energy sources, the price of energy is expected to increase. Energy price increases can have adverse social implications if people are unable to pay higher energy costs and/or cannot afford the upfront transitional costs required to reduce energy use in response to higher prices.
The ACT Government’s ongoing aim is to build the capacity of all individuals and families to access quality energy services and reduce their carbon footprint.
The ACT Government has already developed a suite of measures to buffer low income households from the cost pressures associated with the long term impacts of climate change. This includes increasing energy concession payments, reviewing utilities concessions, and ensuring low income and other vulnerable households are targeted in energy efficiency and water efficiency programs.
The ACT Government is also helping reduce energy bills through services such as the Home Energy Advice Team, which provides rebates and advice to householders on reducing their energy use.
The main strategies currently being implemented by the ACT Government are outlined in Table 8. Support for low income households is designed to reduce reliance on energy and reduce financial pressure from energy costs.

30 OPTIONS PAPER FOR PUBLIC COMMENT
TABLE 8: ACTIONS TO ENSURE A FAIR SOCIETY
Action Description Milestones
7.1 Adjust support for low income households
ACT Government assistance measures include:
• Energy concession arrangements that are currently helping 22,000 households.
• The ACT Civil and Administrative Tribunal that promotes the socially equitable supply of energy by dealing with hardship cases on a case by case basis.
Review the need for existing measures against the expected and realised impact of Action Plan 2 implementation.
Adjust measures as required.
7.2 Adjust support to improve energy efficiency in vulnerable households
Key programs include:
• Outreach program, which helps low income households to improve their energy and water efficiency through education and retro-fit measures.
• ACTSmart—a one-stop-shop for consumers to gain information and apply for ACT Government water and energy efficiency programs and rebates.
Review the need for existing measures against the expected and realized impact of Action Plan 2 implementation.
Adjust measures as required.
Outreach program
The Outreach program is assisting low income households to become more efficient in their use of both energy and water at home.
The program is implemented through four principal community welfare organisations for their clients who are eligible to participate and for eligible clients referred by other community organisations. The program can provide:
• a professional home energy efficiency assessment to each client
• retrofitting of energy and water saving improvements in the home, such as draught sealing, more efficient lighting, water-efficient showerheads and window treatments such as curtains and pelmets
• an energy efficiency education session delivered in the home of each client and tailored to their individual needs
• replacement of old, inefficient, essential appliances with more efficient models.
Depending on the products and services provided to a given household, it is expected the Outreach program will enable those participating to save over $200 per year on energy bills.
The program is available to concession card holders and other low income households that are experiencing financial hardship, whether they are living in government housing, private rental accommodation or owner occupied housing.

PATHWAY TO A SUSTAINABLE AND CARBON NEUTRAL ACT 31
ADAPTING TO A CHANGING CLIMATE 4.

32 OPTIONS PAPER FOR PUBLIC COMMENT
4. ADAPTING TO A CHANGING CLIMATE
While reducing our carbon footprint is the primary focus of Action Plan 2, the ACT also needs to prepare for some unavoidable changes in the climate. These expected changes were described in section 2.
Adaptation to climate change is about maximising our resilience and capacity to cope with this unavoidable change. This is a collaborative venture that requires action and decision making by governments, business and families in the lead up and during climate changes.
In contrast to GHG reduction, where early and decisive action is needed to help reduce the longer term costs of future climate change, the adaptation challenge requires an informed risk management approach across many areas of government. Our objective is to embed climate change risks into standard risk management frameworks so adaptation is core business for the ACT.
In the next five years the challenge is for the government to further prepare itself and the community for the impacts that may flow from changed climatic conditions. This process is
already well underway. The adaptation strategies currently being implemented by the ACT Government are outlined in Table 9 and include:
• climate research and information
• managing risks.
Climate research and information
Successful climate change adaptation requires that we understand the climate impacts we are likely to face and their implications for our society, economy and the environment.
The ACT Government will improve the quality of information for the ACT.
Through a series of collaborative projects, the ACT Government will develop and maintain a standardised user friendly database containing the most up-to-date, comprehensive, reliable and finest resolution (in terms of space and time) climate change data yet produced for the ACT. The data will help the ACT Government manage the risks associated with a changing climate.
TABLE 9: IMPROvING INFORMATION
Action Description Milestones
8.1 Enhance knowledge on climate impacts in the ACT and region and on the ACT’s vulnerability and capacity to deal with these impacts
Partner with the NSW Government and the University of New South Wales’ Climate Change Research Centre to develop the NSW and ACT Region Climate Model (NARCliM). The NARCliM will generate detailed climate projections for NSW and the Australian Capital Territory.
Partner with the NSW Government on the Integrated Regional Vulnerability Assessment for its South-East State Plan Region. The project helps build the ACT’s capacity to undertake its own integrated vulnerability assessment.
Develop regional climate projections.
Completion of integrated regional vulnerability assessment for the ACT and South-East NSW.
8.2 Make data and other information available in a form suitable for decision making
Provide information and educate the public on climate change issues that affect their lifestyle, behaviour and choices.
Work with the community to implement changed attitudes and behaviours.
Creation of delivery platforms such as online portals for provision of data and information access, for example to climate projections.

PATHWAY TO A SUSTAINABLE AND CARBON NEUTRAL ACT 33
Managing risks
The ACT Government is translating knowledge about the likely impacts of unavoidable climate change into better plans and actions to reduce the risks to water supply, biodiversity, natural disasters, health and the urban environment.
Detailed planning and management activities are occurring across government. The key actions being implemented for each area are summarised in Table 10 and are drawn from the area of government that holds responsibility for planning and management of each issue. These include:
• Strategy 9—long term water security—urban water planning and management by the ACT Government and ACTEW to ensure future long term water security.
• Strategy 10—biodiversity—protecting the ACT’s biodiversity by increasing resilience.
• Strategy 11—natural disasters—preparing the ACT for natural disasters through the National Disaster Resilience Strategy and ACT Emergency Plan.
• Strategy 12—health—ensure population health in a changing climate by implementing Responding to the Health Impacts of Climate Change.
• Strategy 13—urban planning and infrastructure—managing risks to urban infrastructure and building more sustainable urban spaces through the ACT Planning Strategy.
The key risk management actions that flow from this suite of plans and management activities are summarised in Table 10.
TABLE 10: MANAGING RISKS
Action Description Milestones
9.1 Increasing security of Canberra’s urban water supply
A series of infrastructure investments will be made to ensure the ongoing security of Canberra’s water supply. These include:
• increasing the capacity of the Cotter Dam—Enlarged Cotter Dam
• gaining access to additional water sources by constructing a pump and pipeline system from the Murrumbidgee River to the Googong Dam
• purchase of water entitlements by ACTEW as additional water supplies with the water initially being stored in Tantangara Dam
• supplement the urban water supply by constructing urban storm water ponds and using the water to replace potable water for irrigation, for example, of sports fields.
Every five years review environmental flow guidelines to include climate change projections and apply to water sharing plans.
Promoting recycling, water re-use and other ways to reduce demand of potable water in the ACT, where cost effective in managing water security.
Completion of Enlarged Cotter Dam.
Completion of system from Murrumbidgee to Googong Dam.
Expansion of urban storm water ponds network and savings in potable water.
Revised environmental flow guidelines.
Meeting of demand management targets in Think Water Act Water Strategy.

34 OPTIONS PAPER FOR PUBLIC COMMENT
TABLE 10: MANAGING RISkS (CONT)
Action Description Milestones
10.1 Protecting the ACT’s biodiversity
Promote understanding of the potential impacts of a changing climate and build resilience of biodiversity, including through:
• strengthening ecological connectivity
• enhancing the reserve system
• building knowledge and awareness of ACT environmental assets and potential impacts of climate change
• research on key issues related to biodiversity and climate change adaptation, especially related to ecological connectivity, sleeper weeds and pest animals
• strengthening partnerships with land managers.
Release and implementation of a revised Nature Conservation Strategy.
Review and implementation of the Nature Conservation Act 1980. Implementation of pest and weed management and restoration programs.
Implementation of Park Management Plans.
Long term ecological monitoring and completion of research projects.
11.1 Integrating climate change impacts into natural disaster and emergency risk management and planning
The Territory wide risk assessment will prioritise natural disaster risk in accordance with relevant Australian standards and support measures to strengthen communities, individuals, businesses and institutions to minimise the adverse effects of disasters, including the potential impacts of climate change.
Climate change impacts will be integrated into emergency management planning through a strategic approach.
Completion of Territory wide risk assessment.
Ongoing review of the ACT Emergency Plan and sub-plans to ensure they reflect risk priorities.
Completion of the National Disaster Resilience Strategy.
11.2 Build government and community resilience to climate change impacts
The ACT Government will provide a lead on building resilience in the ACT and will provide a framework and tools for government, business and the broader ACT community to assist in this. This will include consideration of climate change impacts.
Resilience is reliant upon physical assets and learned skills and equally upon organisational and community cultures, attitudes and expectations. Business and community engagement will be a vital part of building resilience in the ACT.
Completion of the ACT Resilience Strategy.
12.1 Responding to the health impacts of climate change
Focus areas for action include:
• supporting whole-of-government activities that monitor health impacts related to climate change
• accessing and engaging in research to inform policy
• building community knowledge and resilience, with a particular focus on vulnerable groups
• maintaining a comprehensive strategic response to climate change related emergencies
• embedding consideration of the health impacts of climate change in public policy and service delivery impacts of climate change in public policy and service delivery.
Implement Responding to the Health Impacts of Climate Change.
13.1 Plan a more sustainable and compact city
By focusing on where residential intensification and further commercial activity is appropriate along transport corridors and in urban centres, Canberra can substantially retain its suburban fabric, create more diverse urban environments and become a more efficient, compact city that is more sustainable, socially cohesive and economically resilient.
This will require incorporation of specific planning measures designed to achieve high levels of social cohesion and a diversity of urban environments.
Adopt in 2012 the revised ACT Planning Strategy with subsequent implementation.
Identify transformative projects for transport and urban form.
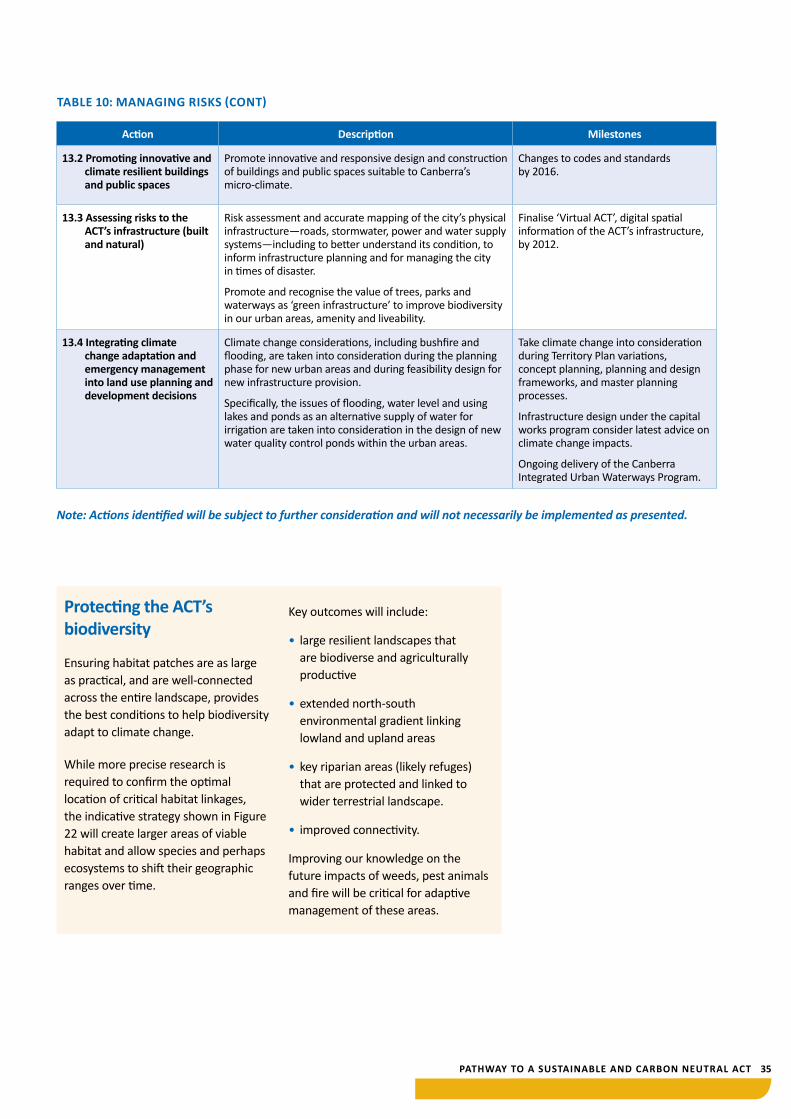
PATHWAY TO A SUSTAINABLE AND CARBON NEUTRAL ACT 35
TABLE 10: MANAGING RISkS (CONT)
Action Description Milestones
13.2 Promoting innovative and climate resilient buildings and public spaces
Promote innovative and responsive design and construction of buildings and public spaces suitable to Canberra’s micro-climate.
Changes to codes and standards by 2016.
13.3 Assessing risks to the ACT’s infrastructure (built and natural)
Risk assessment and accurate mapping of the city’s physical infrastructure—roads, stormwater, power and water supply systems—including to better understand its condition, to inform infrastructure planning and for managing the city in times of disaster.
Promote and recognise the value of trees, parks and waterways as ‘green infrastructure’ to improve biodiversity in our urban areas, amenity and liveability.
Finalise ‘Virtual ACT’, digital spatial information of the ACT’s infrastructure, by 2012.
13.4 Integrating climate change adaptation and emergency management into land use planning and development decisions
Climate change considerations, including bushfire and flooding, are taken into consideration during the planning phase for new urban areas and during feasibility design for new infrastructure provision.
Specifically, the issues of flooding, water level and using lakes and ponds as an alternative supply of water for irrigation are taken into consideration in the design of new water quality control ponds within the urban areas.
Take climate change into consideration during Territory Plan variations, concept planning, planning and design frameworks, and master planning processes.
Infrastructure design under the capital works program consider latest advice on climate change impacts.
Ongoing delivery of the Canberra Integrated Urban Waterways Program.
Note: Actions identified will be subject to further consideration and will not necessarily be implemented as presented.
Protecting the ACT’s biodiversity
Ensuring habitat patches are as large as practical, and are well-connected across the entire landscape, provides the best conditions to help biodiversity adapt to climate change.
While more precise research is required to confirm the optimal location of critical habitat linkages, the indicative strategy shown in Figure 22 will create larger areas of viable habitat and allow species and perhaps ecosystems to shift their geographic ranges over time.
Key outcomes will include:
• large resilient landscapes that are biodiverse and agriculturally productive
• extended north-south environmental gradient linking lowland and upland areas
• key riparian areas (likely refuges) that are protected and linked to wider terrestrial landscape.
• improved connectivity.
Improving our knowledge on the future impacts of weeds, pest animals and fire will be critical for adaptive management of these areas.

36 OPTIONS PAPER FOR PUBLIC COMMENT
FIGURE 15: ENHANCING ECOLOGICAL CONNECTIVITY IS A KEY ELEMENT OF MAKING NATURAL AREAS MORE RESILIENT (ABLE TO ADjUST) TO CLIMATE CHANGE IMPACTS.
The approach to be implemented in the ACT will involve protecting, restoring and linking together fragmented patches of moderate and high quality habitat with natural areas already within reserves (left). This will involve some voluntary conservation on private land.
This approach will be guided by a sophisticated analytical tool (example above) which tells us how to best protect and restore linkages between natural areas. This will allow species to move across greater ranges, allowing increased access to resources, shelter and mates
PATHWAY TO A SUSTAINABLE AND CARBON NEUTRAL ACT 37
LEADING A SUSTAINABLE FUTURE5.

38 OPTIONS PAPER FOR PUBLIC COMMENT
5. LEADING A SUSTAINABLE FUTURE
A zero net emissions Canberra in 2060 will look, feel and be very different to the city we live in today. Substantial changes to technology, the ACT economy and our lifestyles will occur during the transition to a low carbon future.
For Canberra, this transition provides a unique opportunity to demonstrate and showcase the feasibility and benefits of being responsive to climate change. It is recognised that 21st century cities are the largest contributor to energy consumption and climate change. There is an urgent need to find real ways to reduce the impacts of cities and Canberra will become a leader in this process through the action being taken on climate change.
The history and purpose of Canberra means that government is the largest contributor to the ACT economy. As well as changes in the private sector and throughout the community, it is essential that government organisations lead the process of change. The ACT Government will do this by becoming carbon neutral well in advance of the wider economy.
There is also a need to develop new technology, skills and industry to drive the transition. The ACT Government
will be active in the early stages of the transition, working to promote the development of the ACT economy by attracting and developing ‘cleantech’ industries and jobs.
ACT Government carbon neutrality
The ACT Government is responsible for approximately 4% of the ACT’s GHG emissions. These emissions are linked to:
• energy used to heat and cool buildings and power appliances and equipment
• fuel used by public buses and vehicles in the Government fleet
• landfill emissions
• electricity used for lighting, including street lights
• emissions from business travel.
The ACT Government is leading the creation of a sustainable future by putting in place a framework for reducing these GHG emissions that will result in the ACT Government being carbon neutral by 2020.
TABLE 11: ACHIEVE CARBON NEUTRALITY IN ACT GOVERNMENT BY 2020
Action Description Milestones
14.1 Achieve carbon neutrality in ACT Government by 2020
A framework for a whole-of-government approach to reducing GHG emissions has been developed—Carbon Neutral ACT Government Framework.
Implement the Carbon Neutral ACT Government Framework.

PATHWAY TO A SUSTAINABLE AND CARBON NEUTRAL ACT 39
Carbon neutral ACT Government The ACT Government recognises the need to lead by example. It is moving towards carbon neutrality in its own operations. A Carbon Neutral Framework will guide reduction in greenhouse gas emissions in all government operations and services, including through:
• energy efficiency in buildings and street lighting
• green leasing policy
• investigation of co-generation and tri-generation in large scale building facilities such as hospitals
• green vehicle fleet
• waste management practices
• more accurate monitoring and reporting of energy use and emissions, including through creation of a carbon budget for each ACT Government directorate.
ACT Government carbon neutrality is to cover central operations and services such as office accommodation, corporate fleet, ACTION bus fleet, streetlights and education and health services.
Development of a clean economy
The ACT is uniquely positioned in Australia to develop as an Australian sustainable economic hub. The ACT has an engaged and supportive community, is home to some of Australia’s premier research organisations and features an innovative and entrepreneurial business community.
Implementation of Action Plan 2 will catalyse and accelerate changes in the economy and the decision on which pathway to take will have important implications. For example, a decision to
focus on sustainable transport, waste and buildings will have potentially transformative impacts across a number of sectors, while a reliance on a single renewable energy solution or carbon offsets may have limited tangible impact in the short term.
Regardless of pathway chosen, there are some important complementary activities that build the foundations for a clean economy to ensure the ACT can be responsive to new opportunities in provision of expertise, goods and services that can be exported nationally and internationally.
TABLE 12: ACTIONS TO DEVELOP A CLEAN ECONOMY
Action Description Milestones
15.1 Development of a clean economy
Key elements to developing a clean economy are:
• enhance and leverage R&D partnerships
• develop workforce skills to meet the needs of emerging clean industries
• promote Canberra’s locational advantages for the emerging clean technology sector
• Support the growth of emerging and clean tech businesses.
Implementation of the ACT Clean Technology Business Strategy 2011–2015.

40 OPTIONS PAPER FOR PUBLIC COMMENT
World class research and training institutions
The ACT is home to premier research institutes including CSIRO, the Australian National University (ANU), and the University of Canberra which are building knowledge to address high priority climate change issues through integrated research programs.
With its expertise in solar research, the ANU is at the forefront of national and international solar research with innovative approaches to renewable energy solutions for residents and business.
A recently announced ANU project integrates solar hot water and electricity generation into one combined system. The project aims to develop and commercialise an
improved roof-mounted hybrid solar system that has potential for use in domestic, commercial and industrial buildings.
Education is a core area of competitive advantage for the ACT in developing a clean tech economy. The Canberra Institute of Technology (CIT) has been providing leadership to a sustainable Canberra by providing education and training that develops the skills required for developing more sustainable businesses and organisations. This includes incorporating environmental sustainability into teaching curriculum, developing stand-alone environmental programs for industry and government and demonstrating better practices relating to waste, water consumption, recycling, carbon emission and landscaping.
Education is a core area
of competitive advantage
for the ACT in developing
a clean tech economy.

PATHWAY TO A SUSTAINABLE AND CARBON NEUTRAL ACT 41
CONSULTATION6.

42 OPTIONS PAPER FOR PUBLIC COMMENT
6. CONSULTATION
This discussion paper presents a range of options for transitioning the ACT towards carbon neutrality from 2011 to 2020.
Public comments on the actions for stabilising and reducing emissions proposed in this action plan are welcome to inform the finalisation of Action Plan 2.
How do I make a submission?
Written submissions are preferred. In the case of written submissions the following guidelines apply.
• There is no fixed format or length for your submission. However, MS Word compatible format is preferred.
• Email constitutes a valid written submission.
• You may use your submission to convey facts and opinions or to make arguments or recommendations.
• The above suggestions should be treated as a guide. You may provide any comments you consider relevant.
• It would be appreciated if submissions over four pages additionally contain a summary of issues raised in the text.
The ACT Government is unable to assist with any costs incurred by individuals or organisations in preparing their submission.
Are submissions authenticated?
Anonymous submissions or comments will not be accepted. To enable your submission to be authenticated you should include details of:
• your name and address and, if available, your email contact
• whose views you are representing; if you are writing on behalf of an organisation you should clearly identify it and the position of
authority within that organisation that you occupy.
Rejection of a submission
A submission may be rejected if it:
• is purporting to be on behalf of an organisation, the authenticity of which cannot reasonably be established
• contains potentially defamatory statements about named individuals or organisations.
What happens to my submission?
All submissions will, subject to confirmation of authenticity, be considered in preparing the final Action Plan 2, treated as public documents and displayed upon the Environment and Sustainable Development Directorate website, environment.act.gov.au.
All submissions will be acknowledged. Handwritten submissions may be transferred into PDF format or transcribed into typed format so they may be displayed on the website. Submissions will not be returned.
What if I believe my submission is confidential?
You may indicate in your submission that you consider matters raised within the text to be ‘Confidential’ or ‘Commercial-in-Confidence’.
You should clearly mark the top of each page of your submission to this effect. You should also provide a statement or explanation as to why the information may be damaging or why your views should not be subjected to public scrutiny.
All such claims will be considered. However, in the spirit of open and transparent consultation, it is far more effective and useful that all submissions be made available publicly.

PATHWAY TO A SUSTAINABLE AND CARBON NEUTRAL ACT 43
Other ways of providing your views
The ACT Government will maintain discussion forums on the Time to Talk website: timetotalk.act.gov.au
You may participate in the online forums to provide your views.
The ACT Government also will conduct community consultation forums.
Other information
The following documents are available at environment.act.gov.au
• ACT Zero Net Emissions Initiatives: Potential for delivering recommended Legislative Assembly emissions reduction targets (Heuris Partners, October 2009)
• ACT Greenhouse Gas Emissions: Existing Policy Baseline Projections to 2050 (Heuris Partners, February 2010)
• ACT Zero Net Emissions Initiatives: Gap Analysis & Opportunity Identification (Heuris Partners, May 2010)
• ACT Weathering the Change Review Action Plan 1 Review: Final Report (Kinesis, November 2009)
• Action Plan 2: Primer (Kinesis, December 2009)
• ACT Greenhouse Gas Inventory 2008
• Weathering the Change, the ACT’s Draft Climate Change Action Plan 2: An analysis of pathways, costs and benefits (pitt&sherry, July 2011).
Contacting us
The ACT Climate Change Action Plan Secretariat is located within the ACT Environment and Sustainable Development Directorate.
Submissions may be sent to:
Senior Manager—ACT Climate Change Environment and Sustainable Development Directorate GPO Box 158 Canberra ACT 2601
Or emailed to: [email protected]
Submissions received may be viewed at environment.act.gov.au/climatechange
Information is also available through Canberra Connect on 13 22 81.

44 OPTIONS PAPER FOR PUBLIC COMMENT
PATHWAY TO A SUSTAINABLE AND CARBON NEUTRAL ACT 45
REDUCING GHG EMISSIONS IN THE ACT— STRATEGIES AND ACTIONS
APPENDIX 1

46 OPTIONS PAPER FOR PUBLIC COMMENT
APPENDIX 1. REDUCING GHG EMISSIONS IN THE ACT– STRATEGIES AND ACTIONS
Six broad strategies are proposed for reducing greenhouse gas (GHG) emissions. These strategies can be thought of as representing a ‘toolbox’ of possible approaches that could be implemented in the ACT to reduce emissions. The discussion and modelling provided reflects the maximum reduction in GHG emissions that is realistically feasible from each strategy. Further information on the analysis is available in the pitt&sherry report.
The six strategies are:
Strategy 1—Energy efficient buildings
Strategy 2—Sustainable transport
Strategy 3—Sustainable waste
Strategy 4—Renewable energy
Strategy 5—Gas-fired electricity generation
Strategy 6—Carbon offsets, including biosequestration.
Strategy 1 Energy efficient buildingsThis strategy focuses on reducing emissions from the residential and non-residential sectors by using energy more efficiently in our homes, offices, retail spaces and other buildings such as hospitals. This includes actions to reduce energy demand and use lower greenhouse intensive fuel sources and more efficient technology. Modelling assumes that 75% of potential energy savings from the actions are realised.
While there is a strong focus on buildings and major building services, equipment and appliances also use a significant amount of energy. The range of actions included in this strategy will be complemented by improvements of the energy performance of appliances and equipment through measures such as the Minimum Energy Performance Standards (MEPS) program and labelling requirements for electrical and gas appliances and other products affecting energy efficiency.
Action 1.1 Improving energy efficiency in commercial buildings
It has been estimated that the commercial sector has the potential to reduce emissions by 189kt CO2-e by 2020 through upgrading existing buildings and increasing the efficiency of new commercial buildings. In many cases, the value of energy savings more than offsets the cost of actions.
Energy demand in commercial buildings is relatively unresponsive to changes in energy prices. In particular, tenant light and power demand is determined by the businesses leasing floor space and owners may receive little or no return in the short term on efficiency investments. Consequently, the major challenge for the ACT Government is to design a policy instrument that makes businesses responsive to energy prices and drives down commercial building energy demands.
The policy options identified as feasible in the ACT include:
• accelerated application of more stringent performance requirements for new buildings, potentially above minimum standards included in the National Construction Code
• incorporating commercial buildings within a broad-based energy retailer obligation scheme, as discussed above
• targeted incentive programs, requiring government subsidies or loans to ‘tune-up’ existing buildings
• resource efficiency schemes, which involve mandatory audits, reporting and investment in measures with a specified pay-back period
• increasing minimum performance levels in government green leasing arrangements over time
• a benchmarking/certificate scheme that involves the application of penalties for buildings that do not have a ‘certificate’ and fail to meet minimum energy performance standards.
While there is a strong
focus on buildings and
major building services,
equipment and appliances
also use a significant
amount of energy.

PATHWAY TO A SUSTAINABLE AND CARBON NEUTRAL ACT 47
The current energy efficiency standards in the National Construction Code (which comprises the Building Code of Australia and the Plumbing Code of Australia) will deliver important benefits by 2020 and significant
benefits over the longer term. Although all new building work must meet energy efficiency standards, full application of the standard is currently limited to new buildings and major additions or alterations.
FIGURE A.1: ESTIMATED EMISSIONS REDUCTIONS IN COMMERCIAL BUILDINGS
Source: pitt&sherry, 2011
2011
kt C
O2-
e
2013
2015
2017
2019
2020
Measures in new buildingsMeasures in existing buildings
2012
2014
2016
2018
300
250
200
150
100
50
0
Action Description Reduction in GHG in 2020
Cost effectiveness
1.1 Improving energy efficiency of existing commercial buildings
Commercial buildings are retrofitted to improve energy efficiency through upgrading or replacing:
• heating, ventilation and air conditioning (HVAC) systems (up to 63% of building stock)
• hot water systems and chillers (up to 35% of building stock)
• lighting systems including improved lighting controls (up to 65% of building stock).
Building and systems are maintained to new performance levels.
87kt CO2- e
(3.9% of required reduction)
Highly cost effective.
Cost of investing in upgrades is estimated at $43 million compared with benefits of an estimated $173 million.
1.2 Increasing energy efficiency in new commercial buildings
New buildings are designed and built to higher energy efficiency standards, reducing energy demand. High efficiency HVAC systems, hot water systems, chillers and lighting systems are installed.
Buildings and systems are maintained to high performance levels.
102kt CO2- e
(4.5% of required reduction)
Highly cost effective.
Energy efficiencies in new buildings are likely to realise savings in the order of $193 million out to 2031.

48 OPTIONS PAPER FOR PUBLIC COMMENT
Action 1.3 Increasing energy efficiency in residential buildings
It has been estimated that the residential sector has the potential to reduce emissions by 161kt CO2-e by 2020 through upgrading existing residential buildings and improving heating systems. In many cases, the value of potential energy savings more than offsets the cost of actions.
The policy options identified as feasible in the ACT include:
• targeted incentives delivered through programs focussed on realising specific goals
• market-based measures, such as a retailer obligation (ROS) scheme
• the regulatory option of improving housing energy efficiency through building regulations.
Targeted incentives are essentially subsidy schemes, which involve payment by the Government on completion of a specific action, e.g. installing a high performing water heater. An advantage of incentive programs is they can be re-targeted, as necessary, to meet specific objectives, costs can be capped and program expenditures can be well targeted to specific groups or activities. Negative aspects include the need for the government to pick ‘winning’ technologies or activities, which may result in lower cost abatement opportunities being overlooked, and that they impose a direct cost to the ACT Government budget.
Market-based measures, such as a retailer obligation (ROS) scheme,
provide a viable alternative to incentive programs. A ROS scheme involves setting binding annual energy reduction targets for electricity or gas retailers. The energy retailer is able to choose to deliver the energy savings itself or to seek competitive tenders from energy services companies to provide products or facilitate improvements that reduce the energy demanded by ACT residents or businesses. Failure to achieve the stated energy reduction target normally involves the application of a financial penalty on the energy retailer. An advantage of market-based measures is that they do not prescribe particular measures and therefore allow the least-cost solutions to be identified. Energy retailers bear the initial cost of actions, with these costs then passed onto energy consumers.
The most powerful regulatory option for improving housing energy efficiency is legislation for construction, appliances and building services. States and territories possess considerable degrees of freedom to implement locally-appropriate requirements where they are different from the technical standards in the National Construction Code. This provides flexibility for the ACT to consider setting higher standards for new housing (or commercial buildings) in the ACT. Another approach could be to enhance the ACT’s existing residential mandatory disclosure regime. Planning opportunities available to the ACT include progressively increasing population density and encouraging the use of public transit (see 6.2 Implementing Strategy 2—Sustainable transport).

PATHWAY TO A SUSTAINABLE AND CARBON NEUTRAL ACT 49
FIGURE A.2: ESTIMATED EMISSIONS REDUCTIONS FROM THE RESIDENTIAL SECTOR
Source: pitt&sherry, 2011
2011
kt C
O2-
e
2013
2015
2017
2019
2020
Accelerated greenhouse intensive water heater phase out2 star increase in existing dwellings
2012
2014
2016
2018
300
250
200
150
100
50
0
Action Description Reduction in GHG in 2020
Cost effectiveness
1.3 Increasing energy efficiency in residential buildings
Improving the thermal performance of housing—by weather sealing, building shell insulation, external shading, improved windows and window treatments and reduced air infiltration for homes without these features.
Lowering the carbon intensity of energy used—for example by replacing wired-in electric resistive heating (both fixed appliances and in-slab) with efficient heat pump, gas or solar thermal heating.
122kt CO2- e
(5.5% of required reduction)
Highly cost effective—savings in energy costs will be higher than the initial investment during the life of the asset.
Cost of investing in upgrades is estimated at $231 million compared with benefits of an estimated $245 million.
Retailer obligation energy efficiency scheme
The ACT Sustainable Energy Policy outlines an ambitious new initiative, which would require electricity retailers in the ACT to meet specified annual stationary energy saving targets. These targets would be met by implementing energy efficiency measures in ACT homes and businesses. The scheme will be similar to those successfully demonstrated in the United Kingdom, South Australia, Victoria and NSW and that under consideration by the Australian Government. The ACT scheme will be developed in the context of a potential national scheme and will merge with the national scheme when appropriate.
Under the scheme retailers would meet their annual energy saving targets by assisting household and business energy consumers achieve emission reductions through a range of approved efficiency measures. Approved measures may include activities such as replacing inefficient appliances such as old fridges, improving insulation, investing in technologies such as solar hot water systems and more energy efficient lighting. The scheme may also allow for innovative project-based efficiency initiatives to be developed by participating retailers.
The ACT energy savings initiative will include a strong focus on providing support to low income households although this will not preclude all household consumers accessing the
scheme. The scheme will be funded by energy users and will stimulate the broad-scale energy efficiency retrofitting of homes and small to medium sized businesses across the Territory.
A central focus of the initiative will be to provide effective integrated assistance to households and businesses struggling with expected rises in energy costs. In this way the ACT’s energy savings initiative will provide an opportunity to bring together a range of existing energy efficiency support schemes under a common framework.
The ACT energy savings initiative will be progressed through standard Government processes.

50 OPTIONS PAPER FOR PUBLIC COMMENT
If relative energy efficiency improvements in residential buildings are measured on the star rating scale it should be noted the scale is not linear and greatest improvements between star bands are at the lower end of the scale. Often the simplest and lower cost measures such as installing more
effective ceiling insulation and weather sealing doors and windows will also have the greatest effect in lower rated houses. The rating is a calculation of the predicted energy required to heat and cool a dwelling to a comfortable temperature. The star rating scale for Canberra is shown below.
FIGURE A.3: INDICATIVE PERFORMANCE INCREASE OF RESIDENTIAL STAR RATINGS
0
400
800
1,200
200
600
1,000
Hea
ting
and
coo
ling
load
s (M
J/m
2 )
Star rating
1 2 3 4 5 6 7 8 9 10
ACTION 1.4 ACCELERATED GREENHOUSE INTENSIvE WATER HEATER PHASE-OUT
Action Description Reduction in GHG in 2020
Cost effectiveness
1.4 Accelerated phase-out of greenhouse intensive water heaters
Replacing existing greenhouse intensive water heaters with less intensive water heaters—such as gas—boosted solar, high-efficiency instantaneous gas or efficient electric heat pumps.
This measure accelerates the national phase out of electric hot water systems, which allows for water heaters to be replaced at the end of their service life rather than at a specified date, ie. 2020.
39kt CO2-e
(1.8% of required reduction)
Cost effective—savings in energy costs will be higher than the initial investment during the life of the asset.
Cost of investing in upgrades is estimated at $40 million ($2,300 per eligible dwelling) compared with benefits of estimated to be $50 million.

PATHWAY TO A SUSTAINABLE AND CARBON NEUTRAL ACT 51
Action 1.5 Installing co-generation and tri-generation technologies in large buildings
Tri-generation is the production of electricity and heat with the resulting heat used for hot water systems or in cooling systems such as an absorption chiller. Tri-generation has its greatest benefits when scaled to fit buildings or complexes where electricity, heating and cooling are required for extended periods. Such installations include, but are not limited to, data centres, universities, hospitals, shopping complexes and large office buildings.
Tri-generation can also be deployed at a district scale, where multiple buildings can be serviced from a central plant. Co-generation systems (heat and power only) have been used extensively in the United States and Europe. More recently co-generation projects have been planned for Sydney’s central business district.
Options for implementation in the ACT include in large commercial buildings (e.g. Canberra Airport), ACT hospitals and residential districts. The location of much of the ACT’s office and retail building area in town centres makes the district scenario a potentially feasible option.
FIGURE A.4: ESTIMATED EMISSIONS REDUCTIONS FROM TRI-GENERATION IN LARGE BUILDINGS
Source: pitt&sherry, 2011
Action Description Reduction in GHG in 2020
Cost effectiveness
1.5 Installing co-generation and tri-generation technologies in large buildings
Tri-generation and co-generation systems work best at larger scales but can be expensive to retrofit. These factors may limit their potential opportunity in the ACT to a small number of systems strategically located to suitable heating and cooling loads.
The assumption is made that office buildings greater than 15,000 m2, two large hospitals and four large shopping malls would benefit from tri-generation.
106kt CO2- e
(4.7% of required reduction).
Cost effective—installation in hospitals yields large net benefits, shopping malls provide potential savings over 20 years. Some office building installations would be only marginally commercially feasible.
Modelling assumed an average capital cost of $2,500 per kW to install tri-generation systems, including heating and cooling components.
2011
kt C
O2-
e
2013
2015
2017
2019
2020
Tri-generation in large buildings
2012
2014
2016
2018
300
250
200
150
100
50
0
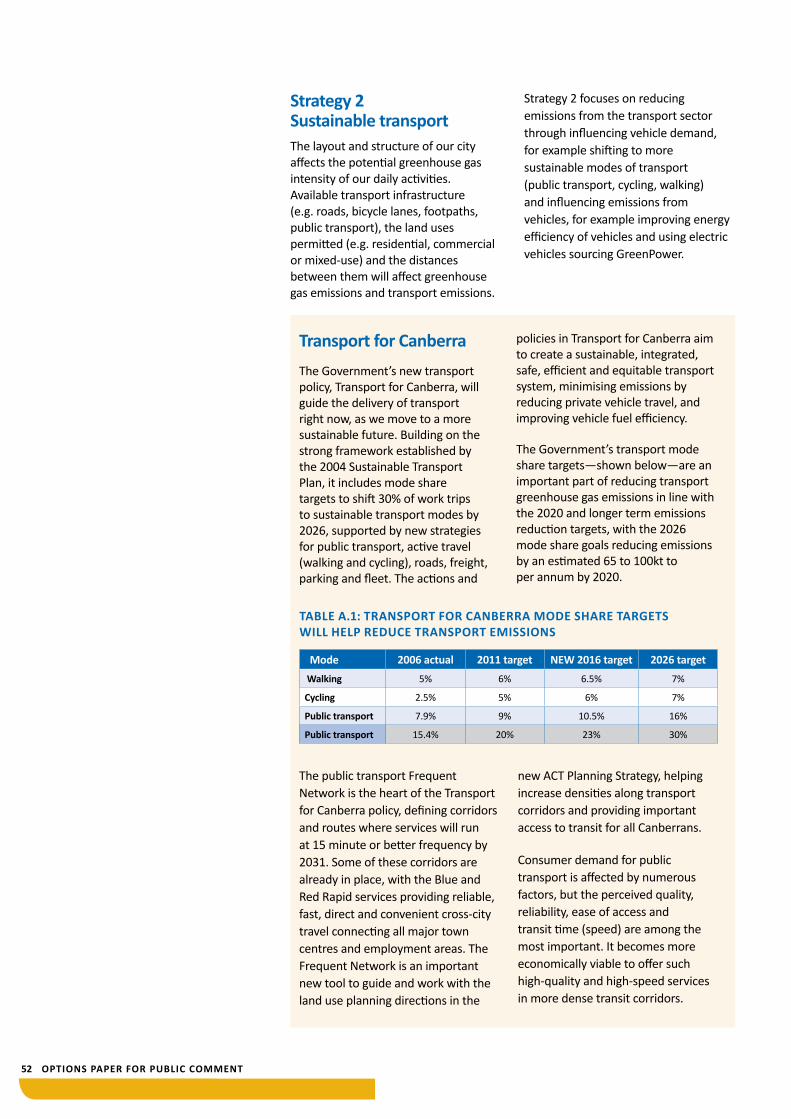
52 OPTIONS PAPER FOR PUBLIC COMMENT
Strategy 2 Sustainable transportThe layout and structure of our city affects the potential greenhouse gas intensity of our daily activities. Available transport infrastructure (e.g. roads, bicycle lanes, footpaths, public transport), the land uses permitted (e.g. residential, commercial or mixed-use) and the distances between them will affect greenhouse gas emissions and transport emissions.
Strategy 2 focuses on reducing emissions from the transport sector through influencing vehicle demand, for example shifting to more sustainable modes of transport (public transport, cycling, walking) and influencing emissions from vehicles, for example improving energy efficiency of vehicles and using electric vehicles sourcing GreenPower.
Transport for Canberra
The Government’s new transport policy, Transport for Canberra, will guide the delivery of transport right now, as we move to a more sustainable future. Building on the strong framework established by the 2004 Sustainable Transport Plan, it includes mode share targets to shift 30% of work trips to sustainable transport modes by 2026, supported by new strategies for public transport, active travel (walking and cycling), roads, freight, parking and fleet. The actions and
policies in Transport for Canberra aim to create a sustainable, integrated, safe, efficient and equitable transport system, minimising emissions by reducing private vehicle travel, and improving vehicle fuel efficiency.
The Government’s transport mode share targets—shown below—are an important part of reducing transport greenhouse gas emissions in line with the 2020 and longer term emissions reduction targets, with the 2026 mode share goals reducing emissions by an estimated 65 to 100kt to per annum by 2020.
TABLE A.1: TRANSPORT FOR CANBERRA MODE SHARE TARGETS WILL HELP REDUCE TRANSPORT EMISSIONS
Mode 2006 actual 2011 target NEW 2016 target 2026 target
Walking 5% 6% 6.5% 7%
Cycling 2.5% 5% 6% 7%
Public transport 7.9% 9% 10.5% 16%
Public transport 15.4% 20% 23% 30%
The public transport Frequent Network is the heart of the Transport for Canberra policy, defining corridors and routes where services will run at 15 minute or better frequency by 2031. Some of these corridors are already in place, with the Blue and Red Rapid services providing reliable, fast, direct and convenient cross-city travel connecting all major town centres and employment areas. The Frequent Network is an important new tool to guide and work with the land use planning directions in the
new ACT Planning Strategy, helping increase densities along transport corridors and providing important access to transit for all Canberrans.
Consumer demand for public transport is affected by numerous factors, but the perceived quality, reliability, ease of access and transit time (speed) are among the most important. It becomes more economically viable to offer such high-quality and high-speed services in more dense transit corridors.

PATHWAY TO A SUSTAINABLE AND CARBON NEUTRAL ACT 53
The government has already begun to invest in this new transport system in the 2010–11 and 2012–13 ACT budgets. Transport for Canberra investments have included:
• new public transport infrastructure, including feasibility, design and construction of major transit ways (Northbourne Avenue, Belconnen to City, Canberra Avenue), ‘Park and Ride’ and ‘Bike and Ride’ facilities
• a real time passenger information system, to be completed by 2013
• an expanded road safety program
• strategic transport studies to investigate demand responsive
transport and transport disadvantage in Canberra
• improvements to the ACTION bus service through expanded ‘rapid’ bus services and network improvements
• active consideration of mass rapid transport options for the Gungahlin to City corridor, including a possible light rail or bus rapid transit system along Northbourne Avenue.
Details of Transport for Canberra, and current projects including many other emissions reducing actions in planning, policy, promotion, pricing, and infrastructure over the short, medium and long term, can be found at transport.act.gov.au.
More sustainable transport has the potential to reduce emissions by 262kt CO2-e per annum by 2020.
FIGURE A.5: ESTIMATED EMISSIONS REDUCTIONS FROM SUSTAINABLE TRANSPORT
Source: pitt&sherry, 2011
2011
kt C
O2-
e
2013
2015
2017
2019
2020
Modal shift and demand managementFleet efficiency
2012
2014
2016
2018
300
250
200
150
100
50
0

54 OPTIONS PAPER FOR PUBLIC COMMENT
Action Description Reduction in GHG in 2020
Cost effectiveness
2.1 Reducing use of private vehicles
The Transport for Canberra strategy supports:
• investment in infrastructure to support public transport, walking and cycling, including mass rapid transit supported by Park and Ride and Bike and Ride
• promoting sustainable transport options
• pricing transport effectively and equitably.
The ACT Planning Strategy will support the creation of a more compact city with urban renewal along transport corridors.
Detailed actions will be identified in consultation with the community through master planning, corridor studies and capital project development.
6kt CO2-e
(2.9% of required reduction).
Highly cost effective—savings in energy costs will be higher than the initial investment during the life of the asset.
Benefit to cost ratio of the proposed Frequent Public Transport Network is over 3:1.
Changes can be cost neutral for households provided alterative travel choices are accessible, affordable and convenient.
2.2 Reducing emissions from vehicles
Reduce the emissions of the passenger vehicle fleet by encouraging people to buy the greenest car than meets their needs.
Improve the efficiency of the public transport (bus) fleet by exploring alternative fuel options, and investigating mass rapid transit for major corridors.
Support the introduction of electric vehicles into the ACT, powered by 100% GreenPower.
65kt CO2-e
(2.9% of required reduction).
Highly cost effective—savings in energy costs will be higher than the initial investment based on current fuel and motor vehicle prices.

PATHWAY TO A SUSTAINABLE AND CARBON NEUTRAL ACT 55
WESTONCREEK
BELCONNEN
WODENVALLEY
CENTRALCANBERRA
GUNGAHLIN
TUGGERANONG
Industrial Area
Harman
OaksEstate
Karabar
Greenleigh
Jerrabomberra
Letchworth Queanbeyan
QUEANBEYAN
Options
Ginninderra Dr
Constitution Ave
Kings Ave
Canberra Ave
Monaro H
wy
Yamba D
r
Yarr
a G
len
Adelaide Ave
Tugg
eran
ong
Pkw
y
Tugg
eran
ong
Pkw
y
Drakeford D
r
Tharwa Dr
Johnson Dr
Ashley D
r
Ath
llon
Dr
Barton Hwy
Gun
gahl
in D
r
Belconnen Way
Isabella Dr
Pockett Ave
Knoke
Ave
W
ood
co
ck Dr
Erindale Dr
Sulwood Dr
Ath
llon
Dr
Hindmarsh Dr
Nam
atijr
a Dr
Molonglo
WestonHindmarsh Dr
Stre
eton
DrWarragamba Ave
Cotter Rd
Ken
t St
Monaro C
r
Capt. Cook Cr
Goyder St
Jerrabomberra Ave
Newcastle St
National Cct
Com
mon
wea
th A
ve
Canberra Ave
Nov
ar S
t
Fairbairn Ave
Barry Dr
No
rthb
our
ne A
ve
Cowp er
S t
Bin
dub
i St
Cou
lter
Dr
Murranji St
Hay
don
D
r
Gun
gahl
in D
rM
iller
St
Antill St
Flem
ingt
on R
d
Hos
kins
St
Limestone Ave
Chuculba Cres
Gundaroo DrOw
en Dixon Dr
Baldwin Dr
King
sfor
d S
mith
Dr
Copeland
Dr
Ginninderra Dr
Southern Cross Dr
Kin
gsfo
rd S
mith
Dr
Starke St
Flor
ey Dr
Cur
ran Dr
Horsepark Dr
Gungahlin Dr
Kosciusko Ave
Mirrabei Dr
Katherine Ave
CanberraInternationalAirport
Charnwood
Dunlop
Flynn
MacgregorLatham
Florey
Holt
HigginsScullin
Page
Hawker
Weetangera
Duffy
MOLONGLO
Holder
Rivett Stirling
Gordon
Bonython
Greenway
Oxley
Kambah
Torrens
Fisher
Waramanga
Chapman
Chifley
Woden
Tuggeranong
Erindale
LanyonMarketplace
Lyons
Curtin
Cook
Belconnen
Aranda
MelbaEvatt
McKellar
Fraser
Spence
Hall
Kinlyside
Moncrieff BonnerNgunnawal
Casey
Taylor
Nicholls
Giralang
Kaleen
Bruce
O'Connor
Deakin
Hughes
Garran
O'Malley
Pearce
Isaacs
Farrer
Wanniassa
Monash
Gowrie
IsabellaPlains
Calwell
Conder
Banks
Theodore
Richardson
Chisholm
Macarthur
Gilmore
Fadden
Red Hill
Narrabundah
Symonston
Griffith
Forrest
Yarralumla
Barton
Kingston
Manuka
Acton
City West Reid
Braddon
Turner
Lyneham
Downer
Dickson
Mitchell
City
Crace
Palmerston
Gungahlin
Forde
HarrisonFranklin
Amaroo
Kenny
Watson
Hackett
Ainslie
Campbell
RussellParkes
Duntroon
Pialligo
Fyshwick
Hume
Majura
TheCauseway
ANU
EPIC
Macquarie
Kippax
Mawson
Legend
Scale
Rapid Services and Stop
Frequent Local Services (15 minute frequency)
Alternative Alignments
Potential Rapid Services(Contingent on future density and roadways)
Potential Frequent Local Services(Contingent on future density and roadways)
Stations
Major Stops
Park and Ride
Bike and Ride
2031 Frequent Network
N
The Frequent Network is made up of the Rapid service and the Frequent Local service. These both run every 15 minutes or less all day, including weekends. The Rapid service, which could be bus rapid transit, light rail, or another mass rapid transit technology, has widely spaced stops so it can quickly cover long distances across the city. The Frequent Local service makes many stops and is designed for local trips in higher density areas.
0
0
0
2.5km
800mWalking @4.8km/h
Cycling @15km/h 10min
10min
Frequent Local Service @20km/h 2.5km
7.5min
7.5min
0 5kmRapid Service @40km/h
FIGURE A.6: STRATEGIC INFRASTRUCTURE DEVELOPMENT TO 2031
Details of Transport for Canberra can be found at: transport.act.gov.au

56 OPTIONS PAPER FOR PUBLIC COMMENT
Low and zero emission vehicles and climate change Transport GHG emissions are currently just under a quarter of the ACT’s total GHG emissions. These emissions can be reduced by a range of approaches including:
• changing forms of transport such as more people replacing driving trips with walking and cycling
• increasing use of public transport so that the fuel used shifts many people
• using more efficient vehicles, including electric vehicles.
Electric vehicles are expected to increase in importance in reducing GHG emissions in the future as their numbers increase and support infrastructure is developed, such as charging stations, and as battery technology improves.
The ACT Government supports the use of electric vehicles and other
low emissions options through lower stamp duty rates fees for low-emission vehicles, registration discounts for electric vehicles, and enabling location of infrastructure. The government is also looking at the impact of more electric vehicles on the ACT’s electricity infrastructure, and is considering steps to ensure the use of electric vehicles results in fewer greenhouse gas emissions than vehicles with internal combustion engines, particularly if the electric vehicles’ electricity also comes from the burning of fossil fuels.
The ACT Government will continue to work to streamline processes for approval of vehicle charging stations and to clarify any other planning or regulatory issues that might further enable the expansion of the ACT electric vehicle fleet, including the ACT Government fleet. The government will consider issues including location and safety of charging points; the reuse and eventual disposal of batteries; and work with other governments to introduce workable national standards.
Strategy 3 Sustainable wasteThe ACT waste stream represents a presently untapped resource for the ACT. A significant amount of waste is interred into landfills, which involves environmental degradation
and ongoing management costs to the ACT Government and residents. Biomass represents a feasible source of renewable energy in the ACT and has the advantage of overcoming intermittency issues related with other renewable energy sources.
PATHWAY TO A SUSTAINABLE AND CARBON NEUTRAL ACT 57
ACT Sustainable Waste Strategy 2010–2015The draft ACT Sustainable Waste Strategy 2010–2015, released in 2011, includes the outcome of ensuring a carbon-neutral waste sector.
Electricity generated from energy-from-waste technologies displaces electricity supplied by the national electricity grid. The GHG emission reduction from adopting energy from waste technologies is estimated to be 130kt CO2-e (based on 100GWh) with an additional 18kt CO2-e of landfill methane emissions avoided.
Energy from waste policy options identified as feasible in the ACT include:
• anaerobic digestion—a biological process where microbes break down organic matter to biogas and digestate
• pyrolysis and gasification—involve heating waste with limited oxygen to produce syngas which can be used to make electricity, heating or cooling (tri-generation)
• biochar—a stable form of carbon that could contribute to reducing the ACT’s greenhouse gas emissions.
The establishment of a thermal conversion facility in the ACT could achieve a number of positive outcomes including increasing resource recovery, reducing GHG emissions through removing organic waste from landfill, generating renewable energy and sequestering carbon through biochar.
The ACT sustainable Waste Strategy 2010–2025 is available from environment.act.gov.au/waste
Action 3.1 Adopt energy from waste technologies
The waste sector represented 104kt CO2-e in 2008 of the ACT’s total greenhouse gas emissions. It provides substantial opportunity to generate energy from waste, displacing emissions from mainly fossil-fuel generated electricity that would be otherwise sourced from the national electricity grid.
The ACT Government is presently considering energy from waste options as it seeks to finalise the draft ACT Sustainable Waste Strategy 2010–2025 which was released in December 2010 with two reports completed by URS-Eco Waste on:
• pre-feasibility assessment of thermal conversion technologies for the Australian Capital Territory
• economic modelling of options for waste infrastructure in the ACT.
These reports favour the use of advanced thermal conversion facilities, such as slow pyrolysis or gasification, to produce agronomic biochar as well as electricity. For modelling purposes it has been assumed a thermal conversion facility would generate 133GWh of electricity by 2020 and avoid 18kt CO2-e of landfill emissions through reduced waste going to landfill. As the fuel consumed is of biogenic origin, there are no net greenhouse emissions from its electricity generation since its emissions are reabsorbed by new biomass.

58 OPTIONS PAPER FOR PUBLIC COMMENT
FIGURE A.7: ESTIMATED REDUCTION IN EMISSIONS FROM ENERGY FROM WASTE
Source: pitt&sherry, 2011
Action Description Reduction in GHG in 2020
Cost effectiveness
3.1 Adopt energy from waste technologies
Reduced organic material going to landfill.
Increased energy generation from an energy from waste facility.
130kt CO2-e
(5.8% of required reduction).
Cost effective.
Investment and operational costs are estimated at around $60 million against an estimated benefit of $260 million from reduced energy costs.
2011
kt C
O2-
e
2013
2015
2017
2019
2020
2012
2014
2016
2018
Sustainable waste300
250
200
150
100
50
0
Strategy 4 Renewable energy
This strategy is significant. Large potential gains are achievable through switching the fuel source for electricity generation towards renewable energy such as solar and wind generation.
In terms of emissions, all renewable technologies are considered to have zero net emissions, but differ in cost and performance characteristics. They generally have the advantage that capacity can be increased by small increments to any desired level, although there will always be some economies of scale to be achieved by
constructing multiple units at the same time, as in the case of solar or wind farms.
As with all capital investments, it is important to select the most cost effective renewable energy sources taking into account capacity, reliability, flexibility, upfront investment requirements and ongoing costs.
The policy options identified as feasible in the ACT include wind and solar generation.
While the selection of specific renewable generation sources is a commercial matter that needs

PATHWAY TO A SUSTAINABLE AND CARBON NEUTRAL ACT 59
to be determined by the market, investment considerations include: site availability, potential energy generation, construction costs, and connection to the national electricity grid.
There are a number of very good sites for wind generation in the immediately surrounding area of south east NSW. Within the borders of the ACT, solar and biomass generation offer the best prospects.
To ensure technical feasibility, it is likely that the construction of new renewable capacity would need to feed into the National Electricity Market (NEM). This would allow variations in output from wind or solar generators to be balanced by other large capacity renewable generators. Renewable energy generators connected to the NEM are made commercially viable through the payment of community subsidies, such as feed-in tariffs or direct government grants.
The ACT’s solar auction and feed-in tariffs Between 2009 and 2011, the ACT Government offered a fixed 20 year feed-in subsidy to micro generators of solar photovoltaic electricity whose capacity was 30 kW or less. The program proved exceedingly popular and was capped at 15 MW of generation capacity.
Starting in 2011, the ACT has also offered a feed-in tariff to medium scaled solar photovoltaic generators that have a capacity of 30 kW to 200 kW. Not-for-profit community groups could qualify for this subsidy. Like the micro feed-in tariff, it has also been capped at 15 MW of generation capacity.
The micro generator cap was reached on 31 May 2011. Amendments to the scheme combining the micro and medium categories were subsequently passed in the Legislative Assembly on 30 June 2011 and enacted on 12 July 2011. The Government voted against these amendments. The resulting surge in demand resulted in the full subscription of the combined 30 MW
cap and the scheme closed on 13 July 2011.
In 2011, the ACT Government also plans to hold an auction for the rights to a feed-in tariff for large-scale solar generators of more than 200 kW capacity. This is the first stage of the ACT’s plan to source up to 210 MW of renewable electricity generation supported by a large scale feed-in tariff. The Territory will pre-qualify bidders on their proven capability, realistic schedule and the likelihood that their facility will be given development, network connection and environmental approvals. The successful bidders will offer the most efficient energy generation from the specified source at the lowest cost.
These feed-in tariffs increase the volume of renewable electricity in our network reducing net ACT’s emissions. The auction process ensures that renewable energy capacity is delivered at the lowest possible cost to the Territory. It can be used to develop specific renewable energy sources or to obtain the lowest generation costs across all sources.
The ACT Sustainable Energy Policy is available at: environment.act.gov.au/energy/energypolicy

60 OPTIONS PAPER FOR PUBLIC COMMENT
Alternative forms of renewable energy generation can be assigned a capacity factor which relates to the extent of generation that can be expected from a unit of capacity over the course of a year. Studies commissioned by the ACT Government recommend
a capacity factor of 30% for wind and 16% for fixed-plate solar.
Based on these factors, the renewable energy capacity required to supply all the ACT’s electricity requirements is 1,066 MW for wind and 1,970 MW for PV solar.
FIGURE A.8: ESTIMATED EMISSIONS REDUCTIONS FROM RENEWABLE ENERGY
Source: pitt&sherry, 2011
2011
2013
2015
2017
2019
2020
2012
2014
2016
2018
Renewable energy3,000
2,500
2,000
1,500
1,000
500
0
Action Description Reduction in GHG in 2020
Cost effectiveness
4.1 Increase renewable energy electricity generation for the ACT
Installing wind or PV solar electricity generation capacity in the ACT.
Up to 2085kt CO2-e
(94% of required reduction)
Wind generation would involve a cost of around $2.5 million per MW.
An indicative capital cost for large-scale PV solar would be around $4 to $5 million per MW.

PATHWAY TO A SUSTAINABLE AND CARBON NEUTRAL ACT 61
Strategy 5 Gas-fired electricity generation
This strategy focuses on reducing emissions by switching the fuel source for electricity generation from predominantly coal fired electricity to gas-fired generation.
The two available options for gas fired generation are open cycle gas turbine (OCGT) and combined cycle gas turbine (CCGT). The technology most relevant for Canberra is air-cooled CCGT, which has a construction lead time of two years. The policy option identified as feasible in the ACT is combined cycle gas turbine.
A key characteristic of CCGT is the modular nature of the investment requirement. The minimum economic size for a stand-alone CCGT power station is today recognised as being at least 150 MW, though most plants proposed for construction around Australia over the next few years are considerably larger (Energy Supply Association of Australia, 2010).
If a new CCGT plant is constructed to provide capacity to supply growth in total national electricity market demand, or as a replacement for old and retired coal plant, it will be more competitive since the cost of any new coal fired capacity will be higher than existing capacity. It is for these reasons that several new gas fired generators have been built in the last few years, and there are a number of potential new gas fired generation projects being actively considered, including some close to Canberra.
Total emissions reductions under this strategy fall short of the 2020 target level. In other words, it is not possible to reach the target simply by supplying all of the ACT’s electricity requirements from a CCGT plant.
CCGT technology is not carbon-free, with actual emissions depending on generation efficiency and location. Under carbon neutrality, any emissions would need to be offset though the purchase of carbon credits.
FIGURE A.9: ESTIMATED REDUCTION IN EMISSIONS FROM GAS-FIRED ELECTRICITY GENERATION
Source: pitt&sherry, 2011
2011
2013
2015
2017
2019
2020
2012
2014
2016
2018
CCGT 235MW2,000
1,800
1,600
1,400
800
200
0
400
600
1,200
1,000

62 OPTIONS PAPER FOR PUBLIC COMMENT
Action Description Reduction in GHG in 2020
Cost effectiveness
5.1 Install gas fired electricity generation
Construction of a Combined Cycle Gas Turbine (CCGT) generation plant in the ACT region.
730kt CO2-e in 2020, depending on the installed capacity.
(33% of required reduction).
Investment of between $1.2 and $1.3 million per megawatt
Strategy 6 Carbon offsets, including biosequestration
A carbon offset is any project that indirectly reduces GHG emissions at one source by investing in emissions reduction activities elsewhere. Strategy 6 recognises the use of carbon offsets to counterbalance emissions from other sectors. Renewable energy and bio-sequestration are the most common forms of carbon offsets. Bio-sequestration involves the capture and storage of greenhouse gases through activities such as tree planting and production of stable forms of carbon, such as biochar that can store carbon in soils.
Project types include renewable energy, such as wind farms, biomass energy or hydroelectric dams. Other projects include energy efficiency projects, the destruction of methane from landfill or intensive agricultural activities (management of manure) and forestry activities.
Offsets vary in terms of the certainty and security of the emissions abatement they deliver. The rules around what may be defined as an offset, and the associated values of those offsets, are fluid and currently under development. The Australian Government’s Carbon Farming Initiative may provide a new framework for offsets in Australia—covering both Kyoto-compliant and non-Kyoto-compliant activities.
For the purposes of meeting the ACT’s legislated emissions reductions targets, two broad options were considered: the use of plantations and the purchase of carbon offsets. Canberra’s urban estate and plantation forests have been identified as potential opportunities for sequestration of large volumes of carbon. An example was provided in the Cotter Dam project where 1000 ha of former pine plantation was revegetated, with estimates that 18,000t of carbon may be sequestered over 11 years.
A second option would be to purchase offsets, either as a primary emissions reduction strategy, or a way of ‘balancing’ actual emissions with its targets.Offsets need to be considered within an overall framework which seeks to reduce emissions through new technologies and changes to energy use. Offsets will not drive forward the technologies required to reduce greenhouse gas emissions in the Territory, nor reduce their costs.
A feature that distinguishes offsets from the other strategies is that offsets can be thought of as a direct expense that does not deliver direct reductions in emissions. This means that as the ACT economy grows and the levels of emissions increase, the quantity of offset purchases would also need to increase, as would the total cost.
Figure A.10 shows the greenhouse gas emissions benefits that offset purchases could deliver for the ACT, assuming that no other strategies are adopted.

PATHWAY TO A SUSTAINABLE AND CARBON NEUTRAL ACT 63
FIGURE A.10: ESTIMATED REDUCTION IN EMISSIONS FROM CARBON OFFSETTING
2011
kt C
O2-
e
2013
2015
2017
2019
2020
Offsets
2012
2014
2016
2018
3,000
2,500
2,000
1,500
1,000
500
0
Action Description Reduction in GHG in 2020
Cost effectiveness
6.1 Secure carbon offsets
Purchase of accredited offsets, including potentially from biosequestration activities.
Up to 2210kt CO2-e
(100% of required reduction).
Cost effective
$20 to $40 per tonne CO2-e.
The Carbon Farming Initiative The Carbon Farming Initiative (CFI) enables crediting of abatement, irrespective of its contribution towards Australia’s Kyoto Protocol target. Abatement may be achieved by:
• reducing or avoiding emissions through capture and destruction of methane emissions from landfill or livestock manure
• removing carbon from the atmosphere and storing it in trees and or soil, for example by growing a forest of farming in a way that increases soil carbon.
These activities will be undertaken as offsets projects. Carbon credits represent abatement of greenhouse gases achieved as a result of offsets projects, and those carbon credits can be purchased and used by an organisation to cancel out or ‘offset’ the emissions they generate during their normal course of business.
Australian Carbon Credit Units (ACCUs), compliant with the CFI scheme, must be created by recognised offsets entities, which identify and then comply with agreed methodologies and be issued, or listed, on the Australian National Registry of Emissions Unit account.

64 OPTIONS PAPER FOR PUBLIC COMMENT

PATHWAY TO A SUSTAINABLE AND CARBON NEUTRAL ACT 65
GLOSSARY/TERMS AND DEFINITIONS
APPENDIX 2
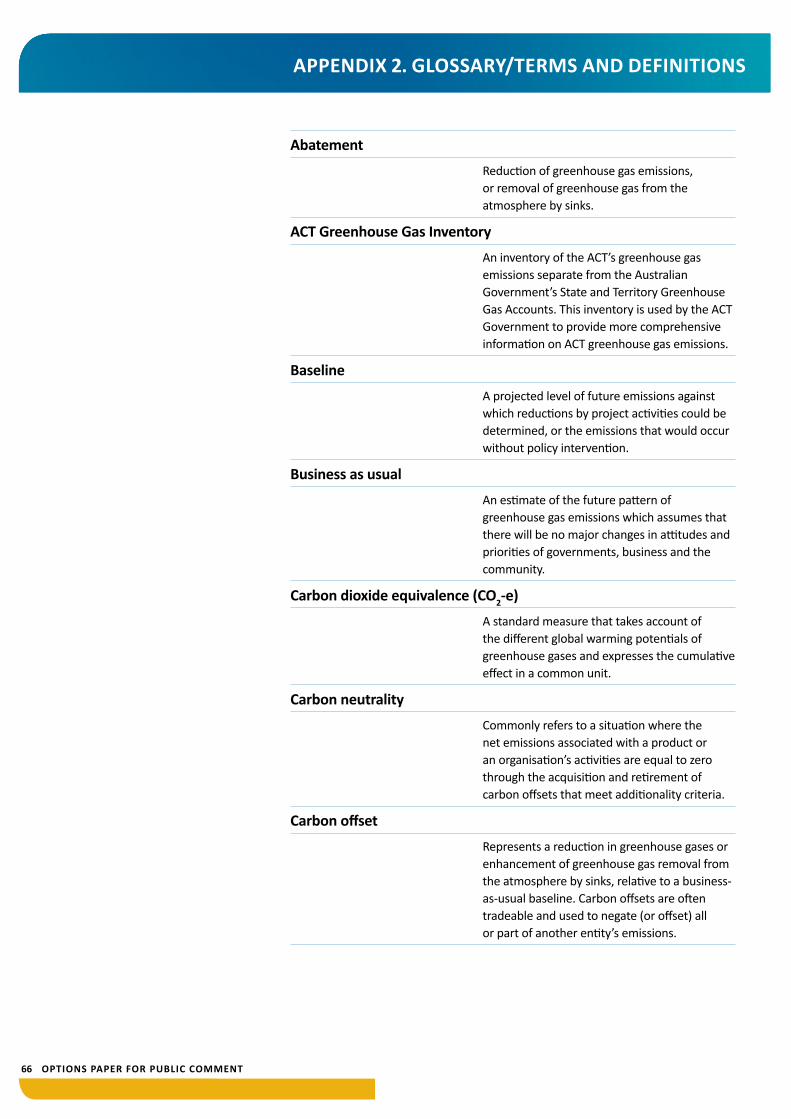
66 OPTIONS PAPER FOR PUBLIC COMMENT
APPENDIX 2. GLOSSARY/TERMS AND DEFINITIONS
Abatement
Reduction of greenhouse gas emissions, or removal of greenhouse gas from the atmosphere by sinks.
ACT Greenhouse Gas Inventory
An inventory of the ACT’s greenhouse gas emissions separate from the Australian Government’s State and Territory Greenhouse Gas Accounts. This inventory is used by the ACT Government to provide more comprehensive information on ACT greenhouse gas emissions.
Baseline
A projected level of future emissions against which reductions by project activities could be determined, or the emissions that would occur without policy intervention.
Business as usual
An estimate of the future pattern of greenhouse gas emissions which assumes that there will be no major changes in attitudes and priorities of governments, business and the community.
Carbon dioxide equivalence (CO2-e)
A standard measure that takes account of the different global warming potentials of greenhouse gases and expresses the cumulative effect in a common unit.
Carbon neutrality
Commonly refers to a situation where the net emissions associated with a product or an organisation’s activities are equal to zero through the acquisition and retirement of carbon offsets that meet additionality criteria.
Carbon offset
Represents a reduction in greenhouse gases or enhancement of greenhouse gas removal from the atmosphere by sinks, relative to a business-as-usual baseline. Carbon offsets are often tradeable and used to negate (or offset) all or part of another entity’s emissions.

PATHWAY TO A SUSTAINABLE AND CARBON NEUTRAL ACT 67
Carbon price
The cost of emitting carbon into the atmosphere. It can be a tax imposed by government, the outcome of an emission trading market or a hybrid of taxes and permit prices.
Carbon sinks
A natural or manmade reservoir that accumulates and stores carbon dioxide for an indefinite period, such as a forest.
Climate change
As defined by the UNFCCC, a change of climate that is attributed directly or indirectly to human activity that alters the composition of the global atmosphere and that is in addition to natural climate variability over comparable time periods.
Commercial buildings
Buildings in which commercial activity predominates, as opposed to housing or industrial activities. This may include accommodation that is commercially provided, e.g student accommodation, hotels etc.
Cost effectiveness
The relative cost of abatement activities measured in dollars per tonne of CO2-e abated ($/tonnes CO2-e).
Delamping
The selective removal of lighting tubes (or ‘lamps’) from fittings and replacing, as necessary, with higher-efficiency lamps. The aim of this activity is to reduce electricity consumption while maintaining sufficient levels of light.
Emissions
The release of greenhouse gases into the atmosphere.
Emissions intensity
The amount of greenhouse gas produced per unit of production.

68 OPTIONS PAPER FOR PUBLIC COMMENT
Energy efficiency
Using less energy to provide the same or improved level of output.
Greenhouse gases (GHG)
The atmospheric gases responsible for causing global warming and climate change. The six Kyoto Protocol classes of greenhouse gases are carbon dioxide (CO2), methane (CH4), nitrous oxide (N2O), hydro-fluorocarbons (HFCs), per-fluorocarbons (PFCs) and sulphur hexafluoride (SF6).
Intergovernmental Panel on Climate Change (IPCC)
Established in 1988, the IPCC surveys worldwide scientific and technical literature and publishes assessment reports that are widely recognised as the most credible existing sources of information on climate change. The IPCC also works on methodologies and responds to specific requests from the UNFCCC’s subsidiary bodies.
Kyoto Protocol
An international treaty created under the UNFCCC in 1997. It entered into force in 2005. Among other things, the Kyoto Protocol sets binding targets for the reduction of greenhouse gas emissions by developed countries and countries in transition. It includes individual emission reduction targets for Annex I countries to be met within the first commitment period of 2008–12.
Minimum Energy Performance Standards (MEPS)
Set the minimum levels of energy efficiency a product must meet for it to be sold in the Australian marketplace.
Renewable energy
Energy which comes from natural resources such as sunlight, wind, rain, tides, and geothermal heat and biomass, which are naturally replenished.

PATHWAY TO A SUSTAINABLE AND CARBON NEUTRAL ACT 69
Renewable Energy Target
A national Renewable Energy Target scheme places a legal obligation on parties who buy wholesale electricity (retailers and large users) to source a certain percentage of their electricity purchases from renewables-based generation. The annual targets are legislated in gigawatt-hours of electricity. Liable parties can demonstrate compliance with the scheme by acquiring and surrendering to the scheme regulator tradeable renewable energy certificates created by accredited renewable energy generators.
Residential buildings
Buildings in which private housing predominates, as opposed to commercial or industrial activities. For modelling purposes, commercially provided accommodation such as student accommodation and hotels are included in commercial buildings.
Class 1 buildings include single dwellings and townhouses.
Class 2 buildings include apartments and flats.
Sequestration
The removal of atmospheric carbon dioxide, either through biological processes (for example, photosynthesis in plants and trees), or geological processes (for example, storage of carbon dioxide in underground reservoirs).
Stationary energy emissions
Includes emissions from fuel consumption for electricity generation, fuels consumed in the manufacturing, construction and commercial sectors, and other sources such as domestic heating.
Sequestration
The removal of atmospheric carbon dioxide, either through biological processes (for example, photosynthesis in plants and trees), or geological processes (for example, storage of carbon dioxide in underground reservoirs).

70 OPTIONS PAPER FOR PUBLIC COMMENT

PATHWAY TO A SUSTAINABLE AND CARBON NEUTRAL ACT 71
FURTHER READING
APPENDIX 3

72 OPTIONS PAPER FOR PUBLIC COMMENT
APPENDIX 3. FURTHER READING
CSIRO 2007, Climate Change in Australia–Technical Report 2007, Commonwealth Scientific and Industrial Research Organisation. http://climatechangeinaustralia.com.au/technical_report.php Accessed 31/3/2011.
R Garnaut, 2011.The Garnaut Review 2011: Australia in the Global Response to Climate Change, Cambridge University Press, Melbourne.
IPCC (Intergovernmental Panel on Climate Change), 2007a: Climate Change 2007: The Physical Science Basis. Contribution of Working Group I to the Fourth Assessment Report of the Intergovernmental Panel on Climate Change. S. Solomon, D. Qin, M. Manning, Z. Chen, M. Marquis, K.B. Averyt, M. Tignor and H.L. Miller (Eds.). Cambridge University Press, Cambridge, United Kingdom and New York, NY, USA, 996 pp.
N Stern, 2006. The Stern Review: The Economics of Climate Change commissioned by Her Majesty’s Treasury. Cambridge University Press, United Kingdom.


![I Overview of the System and the Basic Statistics [1] General … · 2018-06-02 · 6 2010 2030 2055 2060 2010 2030 2055 2060 2010 2030 2055 2060 2010 2030 2055 2060 127.18 million!](https://static.fdocuments.net/doc/165x107/5f7bc0b24d489855d56d059e/i-overview-of-the-system-and-the-basic-statistics-1-general-2018-06-02-6-2010.jpg)