2011/2012 Trends in Executive Development: A Benchmark Report · 2011/2012 Trends in Executive...
49
2011/2012 Trends in Executive Development: A Benchmark Report Research Analysts Bonnie Hagemann, CEO Executive Development Associates John Mattone, President Executive Development Associates, Inc.
-
Upload
trinhtuong -
Category
Documents
-
view
221 -
download
0
Transcript of 2011/2012 Trends in Executive Development: A Benchmark Report · 2011/2012 Trends in Executive...

2011/2012 Trends in Executive Development: A Benchmark Report
Research AnalystsBonnie Hagemann, CEOExecutive Development Associates
John Mattone, PresidentExecutive Development Associates, Inc.


iii | PageCopyright © 2011 by Pearson Education, Inc. or its affiliate(s). All rights reserved. Pearson are trademarks in the U.S. and/or other countries, of Pearson Education, Inc. or its affiliate(s). 8047 07/11
Table of Contents
Tables & Figures 1
Trends in Executive Development 4Major Findings 5
Background on the Study 7Sample 5Selected List of Participating Organizations 5Definitions 5
Part I: The Future of Executive Development 7Key Objectives 5Major Influences 5Hot Topics 5Competency Gap 5Pipeline & High-Potentials 5Future Learning Methods 5Participation in Development Activities 5Board of Directors 5
Part II: Executive Development Operations 7Development Strategy and Policy 5Planning & Needs Analysis 5Program Design and Development 5Fundraising and Staffing 5Measurement and Evaluation 5
Part III: Best and Next Practices 7Best Practices 5Next Practices and Innovations 5
Conclusions 7What Has Changed and What Remains the Same 5Where to Improve 5How to Have an Impact 7


1 | PageCopyright © 2011 by Pearson Education, Inc. or its affiliate(s). All rights reserved. Pearson are trademarks in the U.S. and/or other countries, of Pearson Education, Inc. or its affiliate(s). 8047 07/11
Trends in Executive Development
Approximately every two years since 1983, Executive Development Associates, Inc. (EDA) has conducted a survey to help our clients and colleagues stay abreast of the trends, growth and evolution of executive development. We believe one of the best learning resources is the collective knowledge and experience of executive development leaders and the leading organizations they serve. In today’s aggressive and ever-changing corporate environment, the more lessons we can share with each other, the better. The research mined for the latest and best information with a goal of identifying best practices, emerging needs, top priorities and cutting edge approaches to help those in the field stay abreast of critical trends.
For the 2011/2012 research, we have once again partnered with Pearson’s TalentLens group, a team with deep research expertise, to bring you an in-depth analysis of the trends in Executive Development.
Over the years, we have received more requests for the information that comes from this report than any other piece research we produce. Because of EDA’s extensive network and access to high level corporate leaders and senior decision-makers in Executive Development, we are able to provide you with the most accurate and thorough representation available today of what is happening in the industry.
As you read through this research, you will learn what some of the best companies in the world are doing to develop their current and future executives. You will learn from peers who design and deliver executive development inside of their organizations, and you will hear what industry experts have to say about the 2011/2012 trends. And, you will also be able to benchmark your own organization against best practices.
With the longevity of this research, we are able to show the changes over the years and provide additional insight into the overall design, delivery, costs and results when companies spend time and effort developing their executives. Ultimately you will be able to use this information to positively impact your organization.
With the impact of the economy and much global upheaval, we wondered how the last two years had impacted executive development. The struggles showed up early in the research process, as one company who usually participates in our research said that due to the economic changes and financial cutbacks, they simply had nothing to report and hoped that they would have more next time.
Another person from a Global 1000 company said that due to cutbacks, their development team was smaller than two years ago and expected to do twice as much work with smaller and smaller budgets; therefore, they could not even spare the 30 minutes to complete the report.
In spite of the many challenges leadership and executive development professionals face, innovations and exciting projects are rolling forward like the snowball gathering mass and momentum at the top of the hill. You may wonder why this work is picking up in spite of a lingering recession. Well, demographic shifts alone are forcing corporations, governments, non-profits and educational institutions to evaluate their leadership

2 | PageCopyright © 2011 by Pearson Education, Inc. or its affiliate(s). All rights reserved.
Pearson are trademarks in the U.S. and/or other countries, of Pearson Education, Inc. or its affiliate(s). 8047 07/11
players as well as the strength and depth of their bench. Statistics tell us that Baby Boomers are retiring at a rate of one every eight seconds. In addition, EDA works with companies who already have as many as 60% of their workforce eligible for retirement within the next 3 years.
Furthermore, technology continues to progress at warp speed and the skills senior leaders needed in the past are no longer enough. While great leadership fundamentals remain the same, there is increased pressure to understand the global marketplace, technology advances, develop the leaders of the future and to be able to make complex decisions at the speed of light while simultaneously considering both the macro and the micro level impact on the people and the organization. Executives today are up against some wicked problem, and they are expected to make sound judgments. Here’s what our Advisory Board member, Gillian Stamp, had to say about these judgments in one of her articles:
“ Because judgement is what we rely on in unfamiliar, volatile and ambiguous situations, the exercise of judgement is fraught with uncertainty. It is therefore the responsibility of leaders to build and maintain a framework, a trellis, that can support and cultivate confidence in the judgement of those who work to them, and crucially, confidence in their own judgement. Such frameworks may not seem necessary when life is moving smoothly and problems are ‘tame’. A ‘tame problem’ is one that may be complicated, but has likely occurred before – a combination of experience, knowledge and judgement can be applied to resolve it. ‘Wicked problems’, on the other hand, are the ill-defined, ill-structured, real-life decisions that have incomplete, contradictory and changing requirements.[2] In these situations, experience cannot inform and knowledge is incomplete. Therefore it is when we face wicked problems – when we do not and cannot know what to do – that we are forced to rely most upon our judgement.”
Stamp, Gillian. “Trust and Judgement in Decision-Making.” Gillian Stamp. 2007.
2. Rittel, H., and M. Webber. “Dilemmas in a General Theory of Planning,” Policy Sciences, Vol. 4.
Amsterdam: Elsevier Scientific Publishing Company, Inc., 1973.
Thus, the need to develop corporate executives and high potential leaders has reached an all-time high. In fact, with the 2011 research, we see that the transitions are multi-layered. The overall way we do work is shifting in many ways, the way we develop our leaders is shifting, the demographics are shifting and the necessary leadership style is shifting. As we analyzed the results of the survey, we realized that there is a real and difficult shift as the Baby Boomers, who are still at the helm, struggle to shift their own style from command and control to one of learning, inquiry and inspirational leadership. Many are also still struggling with the concept of transparent leadership and perhaps the most difficult responsibility of all is handing over the reins of the organization to the next generation. This issue is much bigger than just having trouble “letting go.” The bigger issue is that the majority of next generation leaders are just not ready.

3 | PageCopyright © 2011 by Pearson Education, Inc. or its affiliate(s). All rights reserved. Pearson are trademarks in the U.S. and/or other countries, of Pearson Education, Inc. or its affiliate(s). 8047 07/11
We have a few theories about why these up-and-comers are not ready. It could be that the Boomers are hoarding the “suite” seats. It could be that the next generation leaders are Gen Xers, and they are behaving too independently to adequately prepare. It could be that organizations as a whole had their heads in the sand concerning the mass Baby Boomer exodus and just didn’t prepare. Regardless of why, it does seem to be a concern across the organizations that were surveyed that the next generation leaders do not have the seasoning or the skills necessary to lead.
Major Findings As an introduction to this report, we want to highlight 3 emerging trends that stand out as most significant in the 2011/2012 Report:
1. Bench strength: This year bench strength became the most influential condition and the top object in executive development. Survey participants placed a heavy emphasis on the need for a clear succession plan with adequate depth and development of the bench in order to ensure the strength of the succession plan. Warren Buffet once said that “risk comes from not knowing what you’re doing.” No organization wants to run the risk of having senior leaders who do not know what they are doing and with this year’s research we see some fear that this is exactly what is going to happen in many organizations and government sectors. With this need for risk aversion and the impending retirement of the greater part of senior management in the majority of the organizations surveyed, we anticipate bench strength will remain a top priority for years to come.
2. 70-20-10: As the workplace revolutionizes, development efforts are increasingly innovative and learning methods are continuing to shift with the 70-20-10 learning and development model becoming prevalent:
• 70% of learning & development takes place from real-life and on-the-job experiences, tasks, and problem solving. This is the most important aspect of any learning and development plan. For example, the real learning from a skill acquired in a training program, or from feedback, takes place back on the job when the skill or feedback is applied to a real situation.
• 20% comes from feedback and from observing and working with role models. • 10% of learning and development comes from formal training.
− Princeton University Learning Process.
One reason that this learning model is becoming a standard may be that the learning and development function must be tied to the actual strategy and operations of the company. Stand along learning without tying to the results of the organization is rarely tolerated.
Another reason may be the time component. With companies working diligently to become as lean as possible, each employee carries a full and often more-than-full load; therefore, it is increasingly difficult to find the time for extensive learning and development. With the 70-20-10 model, the bulk of the learning happens while work is being conducted. While it’s a great way to learn, there are some things that cannot be learned in that manner and that is when it is time to move into the 20-10 portions of the model. For example if an executive needs to learn from outside experts what is

4 | PageCopyright © 2011 by Pearson Education, Inc. or its affiliate(s). All rights reserved.
Pearson are trademarks in the U.S. and/or other countries, of Pearson Education, Inc. or its affiliate(s). 8047 07/11
happening in the global marketplace or future-oriented trends, this is most likely going to happen outside of the day-to-day work. Or, if he/she is learning new decision-making skills, a business simulation may be more appropriate than on-the-job experience because a simulation is a safe place to learn new skills and test new abilities.
3. Critical Thinking (strategic thinking, creative thinking, problem-solving and decision-making): The most emphasized topic for Executive Development programs this year is Critical thinking and its intertwined components: strategic thinking, creative thinking, problem-solving and decision-making. When we have encountered the need for critical thinking skills in the organizations that we serve, the first question is always “Can critical thinking be learned?” And the answer is yes but not without effort and feedback. Critical thinking is like any other skill (e.g., becoming a good golfer) – it requires practice. But developing critical thinking is more challenging than behavioral skills such as golf, because you can’t easily “see” it and it isn’t developed in class. The skills can be learned in class, but development of critical thinking skills can only come through deliberate practice. EDA Advisory Board member and leadership expert Jim Kouzes said in one of his blogs that
“Deliberate practice is not the same thing as daily execution. It’s not about what we do routinely during the 8, 10 or 12 hours we’re at work. Deliberate practice, as the phrase implies, is about intentionally engaging in an activity that will improve how we execute and how we lead.”
There is much more in the report that stands so we want to dive in, but before we do, we want to say thank you to the executive development professionals who took time out of their busy schedules to participate and share with others their strategies, successes, concerns, and innovations in the development of today’s and tomorrow’s executives.
It is our pleasure to present to you the 2011/2012 Trends in Executive Development.
Background on the Study
The 2011/2012 Executive Development Trends Research Report (“the Report”) is the product of a collaborative partnership between Executive Development Associates Inc (EDA) and Pearson’s TalentLens group (“The Research Partners”). EDA has conducted executive development trends surveys in the United States, and more recently on a global basis, for the past twenty five (25) years. EDA’s research is designed to heighten awareness of the critical trends in executive development and to contribute to ongoing efforts to advance the state of the industry.
Pearson’s TalentLens group has sponsored research, as part of their assessment business, for over 85 years. Pearson is committed to supporting research that increases the field’s knowledge of key talent assessment and management issues.
The information included in this report comes from a variety of sources, including our extensive biennial survey, interviews with leading organizations, and briefings with faculty and external providers of custom executive development solutions.

5 | PageCopyright © 2011 by Pearson Education, Inc. or its affiliate(s). All rights reserved. Pearson are trademarks in the U.S. and/or other countries, of Pearson Education, Inc. or its affiliate(s). 8047 07/11
In addition to providing EDA’s industry expertise, perspective, and insight for the 2011/2012 survey, we also reached out for input from EDA’s Advisory Board made up of the following experts:
• Jim Bolt, Founder, Executive Development Associates, Co-Founder & CEO, FrED, Inc. • Sandy Ogg, Sandy Ogg is an Operating Partner at The Blackstone Group.
Previously, Chief Human Resources Officer for Unilever based in London.• Jim Kouzes, Dean’s Executive Professor of Leadership, Leavey School of Business,
Santa Clara University , and coauthor of the bestselling and award-winning, The Leadership Challenge
• Dr. Gillian Stamp, Director Brunel Institute of Organisation and Social Studies (BIOSS) The Foundation; and former Director, BIOSS.
• George Consolver, Retired Director of Strategy Process, Texas Instruments• Dr. Fariborz Ghadar, W. Schreyer Professor of Management and the Founding
Director of the Center for Global Business Studies at Smeal College of Business, Penn. State University
• Chuck Presbury, Senior Director Leadership Development McGraw-Hill.• Dr. Yury Boshyk, Founding Director, Global Executive Learning• Dr. Vijay Govindarajan, Earl C. Daum 1924 Professor of International Business and
the Founding Director of the Center for Global Leadership at the Tuck School of Business at Dartmouth.
• Dr. Ram Charan, Educator, Author, Consultant to CEOs• Ted Hoff, Vice President, Center for Learning and Development of the IBM
Corporation. • Dr. Mary Jane Knudson, Vice President of Human Resources, Fidelity Investments.• Valerie Norton, Human Resources, Talent Management and Organizational
Development Executive, Strategy and Change Consulting Partner. • Dr. Jerry Davis, Retired Director of the Defense Acquisition University Senior Service
College Fellowship and CEO of Innovative Engineering Solutions.
Research Process The research review process itself involved:
• Reviewing raw data to identify the most significant responses (by percentage) for each question.
• Analyzing and comparing the responses to inter-related questions (either within or across survey sections).
• Analyzing and comparing responses to the same or substantially similar questions across surveys (i.e., across time).
• Evaluating the findings in the context of today’s business environment and international executive development research.
The EDA Advisory Board and other industry experts assisted us by reviewing the survey questionnaire to sug¬gest changes and enhancements, reviewing and analyzing the survey results and lending their expertise and insight to determine the most important findings and implications.

6 | PageCopyright © 2011 by Pearson Education, Inc. or its affiliate(s). All rights reserved.
Pearson are trademarks in the U.S. and/or other countries, of Pearson Education, Inc. or its affiliate(s). 8047 07/11
Sample Eighty one organizations participated in the study, a slightly greater number than our previous trends. Respondents worked in large national and multinational corporations with substantial business operations in the United States (79% had headquarters based in the U.S.). Survey respondents included:
• Chief Learning Officers• Senior Vice Presidents of Human Resources• Heads of Executive and Leadership Development
The majority of the organizations were public (53.9%), followed by private (35.5%) and government and non-profit (10.5%).
We are including the following demographics in order to paint a picture of the organization’s participating in the study, the distribution of industries, number of employees within an organization, and annual corporate revenue is graphically presented.
Figure 1.1. Respondent Organizations: Industry
Figure 1.2. Respondent Organizations: Number of Employees

7 | PageCopyright © 2011 by Pearson Education, Inc. or its affiliate(s). All rights reserved. Pearson are trademarks in the U.S. and/or other countries, of Pearson Education, Inc. or its affiliate(s). 8047 07/11
Figure 1.3. Respondent Organizations: Revenue in U.S. Dollars
Figure 1.4. Class of Business/Organization

8 | PageCopyright © 2011 by Pearson Education, Inc. or its affiliate(s). All rights reserved.
Pearson are trademarks in the U.S. and/or other countries, of Pearson Education, Inc. or its affiliate(s). 8047 07/11
Selected List of Participating Companies
Participating companies include, but are not limited to, the following:
Company
• Emirates Telecommunications Corporation
• Selective Insurance• Taconic• Lam Research Corporation• ItPlanit • Tata Cummins Limited• The Motorists Insurance Group• MSGB• Macy’s Inc• TD Ameritrade• Integra LifeSciences• Booz Allen Hamilton• Residential Credit Solutions• Honeywell• Nouveon• Moog• Navy Federal Credit Union• Unum• The McGraw-Hill Companies• Cabela’s• St Luke’s Hospital & Health Network
• Ferreyros• WellPoint• UPS• Maple Leaf Foods• Gr Michaudville• ATK Aerospace Systems• Trinity Industries• Saudi Aramco• Wyndham • Tompkins• FedEx Express• CAS• VF Corporation• Home Depot• Harris Corporation• Express Services• OGE• Agilent Technologies• MSGB• Telecom NZ LTD• UBS• Entergy• McDonald’s• Welch Allyn

9 | PageCopyright © 2011 by Pearson Education, Inc. or its affiliate(s). All rights reserved. Pearson are trademarks in the U.S. and/or other countries, of Pearson Education, Inc. or its affiliate(s). 8047 07/11
Definitions For the purpose of this report, executives/leaders are defined as anyone who falls into one or more of the following three groups:
1. Members of the BoardThe Chairman of the Board, Board Members, the Chief Executive Officer, the Chief Operating Officer, the President and others filling C-Suite positions for the overall enterprise. All elected officers.
2. Corporate/Organization Vice Presidents (including functional heads)Heads of/Presidents of groups, divisions, business units, or profit centers and their direct reports. All people included in your executive compensation program.
3. High Potential Managers/Leaders A person who has been formally identified as having the potential to fill an executive level position in the future.
4. Development includes any activity that is aimed at broadening or building executives’ knowledge, skill and experience and enhancing their capabilities.
A Look Ahead
Influences on Executive Development Respondents were asked to identify 1 to 3 conditions that are likely to influence their executive and leadership development efforts over the next two to three years.
0% 10% 20% 30% 40% 50% 60%
A lack of bench strength for key jobs or people (succession planning) rose to the top of the influential conditions with 55.7% of the companies identifying this as a major influence. It is clear that the changes in demographics have hit the marketplace and are impacting organizations in a major way. As a result, these shifts are impacting the emphasis on leadership and executive development.
A need for increased collaboration across the organization moved up from #4 in 2009 and 2004 to #2 in 2011. As the transition of the way work is conducted emerges, collaboration is rising as a key to success. Leaders and employees often have too much information coming from too many sources to be able to connect the dots and make informed

10 | PageCopyright © 2011 by Pearson Education, Inc. or its affiliate(s). All rights reserved.
Pearson are trademarks in the U.S. and/or other countries, of Pearson Education, Inc. or its affiliate(s). 8047 07/11
decisions. Therefore, increasing the need to create mass collaboration or collective action toward a common goal and to ensure that all of the divisional, departmental, team and individual goals align with the overall common vision, strategy and goals of the company.
The third most influential condition for executive development is The “next generation” of employees who have different needs, interests and values. Leaders across industries are experiencing the struggle of leading in a new way for a new time. In a quote from the book Decades of Differences: Making it Work1 (HRD Press 2010), we get a glimpse of the issue:
We now have three primary generations in the United States’ workforce. This workforce is currently estimated at approximately 140 million between the ages of 20 to 60.
1. The massive Generation Y (born between 1985 and 2004) 2. The small Generation X (born between 1965 and 1984) 3. The current king of the mountain—the Baby Boomers
(born between 1945 and 1964)
In his book, The Age Curve: How to Profit from the Coming Demographic Storm,1 Gronbach describes it as the “generational parade.”
Every twenty years or so, the United States creates a new generation. Each generation is bound together by similar wants, needs, motives, and events. As they pass through time, all generations age and consume as they go. In other words, there’s a parade moving through our marketplace. But instead of marching, the parade is aging. Those at the front—the oldest—are already disbanding, while the youngest in the back of that parade are just now forming at the fairgrounds. The parade has a pace of its own and we can’t slow it down, speed it up, or change the order of each section… ...for the most part the personality of the generation is determined by something very obvious: its size relative to the generation it follows.
1Hagemann, Bonnie & Gronbach, Kenneth. Decades of Differences. HRD Press, Inc. 2010.

11 | PageCopyright © 2011 by Pearson Education, Inc. or its affiliate(s). All rights reserved. Pearson are trademarks in the U.S. and/or other countries, of Pearson Education, Inc. or its affiliate(s). 8047 07/11
For comparison, we also present the list of key objectives from the 2009 and 2004 and 2000 Trends Surveys:
Table 1. Top 5 Priorities of Executive Development in the Next 2–3 Years
2011 2009 2004 2000
1. Increase bench strength 1 1 4
2. Shape/manage culture
3. Communicate vision and strategy and create alignment 3 3 3
4. Developing capabilities needed to achieve vision and execute strategy
5. Support organizational change/transformation
Accelerate development of high-potentials 2 2
Address key business issues/challenges 4 2
Increase cross-organization coordination and collaboration 5
Support change/transformation 4
Support strategic objectives and implement 1
Develop individual leader capabilities 5
Make talent a competitive advantage 5
As you take a look, you will see that, perhaps surprisingly, Economic Conditions did not show up on the radar as a major influence. Only 15.2% of the companies surveyed indicated that a “Need for Cost Cutting Efforts” will influence their executive development efforts. Eight point nine percent (8.9%) said that they needed to “Improve Shareholder Value” and a tiny 1.3% said that “Downsizing” will be a major influence.
Our experience in the field gives us some insights into this trend. In the companies where we work, adjustments were made for the economic shift in 2008 and continued into 2009. Today, facing economic challenges is not a primary concern because downsizing of staff and efforts has already been done and now financial setbacks have become just another internal barrier to overcome when designing and delivering great executive development efforts. It is no longer a major issue. It is just an issue.
We were also surprised to see that, as in 2009, Corporate Governance and the Increased Need for Action around Social Responsibility remained relatively non-influential with only 1.3% of companies rating them as having an impact.
On the other hand, the issue of bench strength has hit in the top five of influential conditions in every survey since the year 2000. This trend is about succession planning and readiness. According to the 2009 Bersin and Associates/Center for Creative Leadership “High Impact Succession Management Study”, organizations that excel in their human capital/succession management practices:
• Enjoy higher engagement and retention levels of their most talented leaders and future leaders;
• Experience higher quality and customer satisfaction results; and• Realize significantly higher profit levels and revenue

12 | PageCopyright © 2011 by Pearson Education, Inc. or its affi liate(s). All rights reserved.
Pearson are trademarks in the U.S. and/or other countries, of Pearson Education, Inc. or its affi liate(s). 8047 07/11
The Need to Increase Bench Strength. This fi nding was also the number one priority in our 2009 study. In order to increase bench strength, organizations need to be proactive in accelerating the development of high-potentials and emerging leaders. Given the rapid environmental changes organizations face and the large number of people entering retirement age, accelerating the development of the high potential and emerging leader talent pools is vital. As the number of key positions eventually becomes greater than the number of “ready now” candidates who are available, the task of offering accelerated development becomes even more critical as a means to attracting and retaining talent. Organizations that fail to offer such opportunities will lose talent—in numbers and quality-- as people will gravitate toward organizations that offer such opportunities.
Survey participants emphasized in their comments the need for a clear succession plan, well developed bench and the fact that a high percentage of the executive population are nearing retirement.
Going back to the generational parade, if we look at the way the population is moving through the workforce, we can estimate that this trend will continue for another 7 to 10 years. At that point the tip of the Gen Y generation will be seasoned enough to hit the succession charts in a signifi cant way. Once Gen Y enters the succession pool for senior leadership positions, we will have 10 to 15 years of extreme competition and abundant supply.
The Impact of Demographics
Figure 1.6. The Impact of Demographics

13 | PageCopyright © 2011 by Pearson Education, Inc. or its affiliate(s). All rights reserved. Pearson are trademarks in the U.S. and/or other countries, of Pearson Education, Inc. or its affiliate(s). 8047 07/11
Influences on Executive Development
Table 3. Top 5 Highly Influential Conditions 2011
2011 2009 2004 2000
1. Lack of bench strength (56%) 2 1 5
2. Need for increased collaboration across the organization
(32%)4 4
3. “Next generation” of employees with different needs,
interests and values (24%)
4a. Globalization (23%) 5
4b. Rapid growth of the organization (23%)
5a. Mergers/acquisitions (18%)
5b. Need for increased innovation (18%) 5a
Economic conditions 1
Changing business strategies 3 2 1
Need to change corporate culture 5b 4
Increased competition 5c 3 3
Demands of management 2
Top Priorities for Overall Executive Development Efforts and Activities
Survey participants were asked “What 1-3 objectives/priorities will be most important to your efforts in the next 2 to 3 years? Not surprisingly, a full 38.5% said that the number 1 objective is to “Increase bench strength to ensure replacements for key jobs or people.” Going hand-in-hand with the #2 Highly Influential condition of “Increasing Collaboration Across the Organization”, the #2 priority of survey participants is Shaping and Managing Culture. As organizational complexities increase, working as one company with one overall mission and vision is becoming more and more important.
The next priority is ensuring that the company has developed the capabilities needed to achieve the vision and executive the strategy. Regardless of the level and sophistication of the cross organizational communication and collaboration if the capabilities to deliver are not in place, the organization can still end up a loser. Additionally and logically, supporting organization change and transformation come next in the line up as top priorities.
In their comments, survey participants emphasized the new type of leadership that is slowly emerging. This new leadership requires teaching some “old dogs” some “new tricks.” For example, there were multiple comments about the old leadership style of command and control giving way to a more enlightened way such as inspiring leadership, asking versus telling, collaboration and transparency. Today’s workforce wants to know what is going on and have little trouble asking leadership to be held accountable. They want to be addressed in a friendly and informative way and treated as intelligent contributors to the life and future of the company.

14 | PageCopyright © 2011 by Pearson Education, Inc. or its affiliate(s). All rights reserved.
Pearson are trademarks in the U.S. and/or other countries, of Pearson Education, Inc. or its affiliate(s). 8047 07/11
Another trend in the comments was the need for proactive workforce planning, that is to be thoughtful about the type of leaders that are needed to take the organization into the future and then to prepare adequately and speedily in order to meet the leadership and workforce demands. Thus the supply and demand of leadership talent must be analyzed and systematized as efficiently as the supply chain. This includes hiring and managing the high performers, molding and shaping each contributor and removing any dead weight from the workforce.
Table xx. Top 5 Priorities of Executive Development in the Next 2–3 Years
2011 2009 2004 2000
1. Increase bench strength (38.5%) 1 1 4
2. Shape/manage culture (26.9%)
3. Communicate vision and strategy and create alignment (23.1%)
3 3 3
4a. Developing capabilities needed to achieve vision and execute strategy (20.5%)
4b. Support organizational change/transformation (20.5%)
5. Ensure executive talent needed to support growth (19.2%)
Accelerate development of high-potentials 2 2
Address key business issues/challenges 4 2
Increase cross-organization coordination and collaboration 5
Support change/transformation 4
Support strategic objectives and implement 1
Develop individual leader capabilities 5
Make talent a competitive advantage 5
Table x. Top 5 Prioties of Executive Develpment in the Next 2-3 Years
2011
Build awareness of new technology 1.30%
Support/leverage diversity 1.30%
Develop general manager perspectives 1.30%
Launch or advance a major organizational turnaround 1.30%
Provide a forum for top management communication and interchange 0.00%
Develop knowledge of competitors and their strategies 0.00%
Establish identity with the total organization business unit 0.00%

15 | PageCopyright © 2011 by Pearson Education, Inc. or its affiliate(s). All rights reserved. Pearson are trademarks in the U.S. and/or other countries, of Pearson Education, Inc. or its affiliate(s). 8047 07/11
When looking at what isn’t a priority, we found it interesting that the concept of developing knowledge of competitors and their strategies is not on anyone’s agenda for developing executives. In addition, awareness of new technologies and leveraging diversity were also almost non-existent as participants chose their priorities. In actuality, this lack of pursuing and leveraging diversity is showing up in companies with equivalent results. If we look at women in executive roles as one aspect of diversity, here is what we find:
There are currently 15 Fortune 500 companies run by women—the same number as last year, though some of the names have changed. Katharine Graham of The Washington Post was the first female executive to run a Fortune 500 company when the media firm joined the list in 1972. So, a hefty 38 years later, women still only represent 3 percent of Fortune 500 CEOs.2
As priorities shift to fill the leadership gap over the next few years we will be interested to see if leveraging diversity makes its way higher up the priority chart.
Hot Topics for Executive Development
When it comes to designing the best development efforts for an organizations leaders and executives, it is important to choose the right topics, the ones that will provide the most critical insight to advance the individual as a leader and to advance the organization in its overall vision and strategy. We asked survey participants to choose the topics that will be highly emphasize in executive development programs in the next 2 to 3 years. Here is what participants said:
Table xx. Top 5 Trends Survey Year-Over-Year Analysis
2011 2009 2004 2000
1. Critical Thinking (Creative Thinking, Strategic Thinking, Problem Solving and Decision-Making ) (34.6%)
2. Leadership (creating vision, enrolling and empowering others) ( 28.2%)
1 1 1
3. Strategy execution (20.5%) 3 4 2
4. Leading the “next generation” of talent (16.7%)
5a. Leading/managing change (15.4%) 4 2 3
5b. Talent Management (15.4%) 5
5c. Drive for results (15.4%) 2
Business acumen 2 5
Managing human performance 3 5
Strategy formulation 1
When we do a year-over-year analysis, we find the consistency across years simply shows that mastery in these areas is a fundamental part of executive development and leadership overall. Successful leadership requires creating a vision, honing skills in strategy execution and leading/managing change. The one new addition in 2011/2012 is
2 Women, Water & Leadership: Are We Making Progress? Hagemann. Stroope. T&D Magazine. March 2011. Page 50.

16 | PageCopyright © 2011 by Pearson Education, Inc. or its affiliate(s). All rights reserved.
Pearson are trademarks in the U.S. and/or other countries, of Pearson Education, Inc. or its affiliate(s). 8047 07/11
“Critical Thinking”, which 34.6% of our respondents indicated that the number one hot topic for executive development in the next 2-3 years. Twenty-eight point two (28.2%) identified “leadership” as the second hot topic, followed by “Strategy Execution”(20.5%), “leading the next generation” (16.7%), and “leading/managing change”, “drive for results”, and “talent management” (15.4%) all tied for the 5th hottest topic. “Business Acumen (14.1%), which was 5th in the 2009 study, was 8th in the 2011 study.
In the past talent management was viewed as a Human Resource function. Now that the impending talent shortage is a major issue, not only in the halls of the Human Resources department, but in the board room as well, we find that it is a concern even for the C-Suite. Every leader is finding it necessary to think about how to acquire, manage and retain the best talent for his/her organization. One problem to overcome is that often employees from the younger generations do not intend to stay with the same company for their entire career. Instead, they place higher priority on challenging work and opportunities for advancement. Leaders now need to know how to deal with talent just as much as they need to know how to execute strategy.
Concerning Critical Thinking coming up as number one, we should note that this topic was first introduced in 2009 based on the need we saw emerging in the marketplace. EDA and Pearson had both responded to the emerging trend by developing a book, an online university and workshops around the topic. We knew it was an important trend but even we were a little surprised to learn just how much of a trend Critical Thinking really is. In fact, Executive Development expert Jim Bolt had this to say:
“ The most striking result for the 2011 EDA Trends Survey is, I believe for the first time, Leadership is not seen as the #1 topic that will be included in executive development efforts over the next few years. In past surveys Leadership has not only been the top ranked topic but has been considerably higher rated than anything else. Yet, this year, and for the first time, capabilities related to critical and strategic thinking are rated first. This is a significant result begging more thoughtful analysis. I suggest a follow-on discussion is merited to help discover the reasons for this dramatic shift. It could be the most important change in the survey since it was first conducted in the mid-1980’s.”
James F. Bolt, CEO, FRED Inc.
By comparison, Leadership which is defined as “creating vision, enrolling and empowering others” moved to #2. So why the shift? Perhaps leadership is rightfully second to critical thinking. After all, getting to the senior leadership levels require a strong ability to think strategically, creatively, etc. but once a leader reaches the senior level, critical thinking is required on a daily basis. To go further, good leadership may be impossible without good critical thinking. When we reviewed the results, our survey respondents indicated that a leader’s shallow thinking can be very costly to an organization. Successful leaders are able to apply what they know to the challenges of their work. As our survey respondents indicated, organizations today are not so much interested in hiring and retaining walking encyclopedias; rather, they require leaders who are independent decision-makers and problem-solvers and those who can model this behavior to their people and teams.

17 | PageCopyright © 2011 by Pearson Education, Inc. or its affiliate(s). All rights reserved. Pearson are trademarks in the U.S. and/or other countries, of Pearson Education, Inc. or its affiliate(s). 8047 07/11
A strong critical thinker executes the following (RED):
There is significant research by Pearson and other independent researchers that shows a strong relationship between higher scores on the Watson-Glaser Critical Thinking Appraisal® and higher performance, greater upward potential, more effective problem-solving and decision-making, and stronger strategic thinking and planning skills. This is a tool that is often used in pre-employment screening for executive positions.
Based on the authoritative research that clearly connects a leader’s and emerging leader’s Critical Thinking capability with their achieving higher level performance and realizing their potential, combined with the realization that businesses will be more complex tomorrow than they are today—makes this element perhaps the most pivotal leadership element for leaders, future leaders and organizations as they strive to become the best they can be. Simply put, a leader’s ability to make sound decisions, think creatively, problem-solve, plan and implement, as well as execute sound strategic thinking—are all based on superior Critical Thinking (i.e., RED).
Next Generation Leaders: Competency Gaps
When we dig a little deeper and ask participants to tell us what the next generation of leadership talent (the ones who are most likely to fill executive level positions in the next three to five years) are lacking, not surprisingly, we found similarities between the “hot topics” and “development gaps”. The top five competencies most lacking in the next generation of leaders is shown in Table 6
Table 6. Top 5 Competencies Most Lacking in the Next Generation of Leaders
2011 2009
1. Critical thinking (42.3%)
2. Ability to create a vision and engage others ( 30.8%) 3
3a. Cooperates and collaborates with other parts of the business to 1) optimize the operations of our business, and 2) to leverage our collective capabilities in the marketplace to identify and serve customers/clients better than competition (24.4%)
3b. Leading change (24.4%) 2
4. Leadership ( 23.1%)
5. Understands the total enterprise, how the different parts work together to leverage their collective capabilities to serve customers/clients better than the competition ( 21.8%)
5
Strategic thinking 1
Ability to inspire 4

18 | PageCopyright © 2011 by Pearson Education, Inc. or its affiliate(s). All rights reserved.
Pearson are trademarks in the U.S. and/or other countries, of Pearson Education, Inc. or its affiliate(s). 8047 07/11
In addition, critical thinking was identified by 42% of the respondents as being the number one competency future leaders lacked. The “ability to create a vision and engage others around it” was number two (31%), “leading change”, and “cooperates and collaborates with other parts of the business” tied for number three (24%), followed by leadership with 23%. You will notice in the 2011/2009 comparison that Strategic Thinking was number 1 in 2009. This year we replaced strategic thinking with Critical Thinking because the level of thinking is greater than strategic thinking. Strategic Thinking is defined as one part of critical thinking along with problem solving, decision-making, and creative thinking. We included the more comprehensive term in this survey.
Regardless, our respondents agree that the effectiveness of any leader and future leader depends precisely on the quality of their thinking. Critical thinking is that mode of thinking – about any given subject – in which the thinker improves the quality of their thinking by skillfully taking charge of its very structures and by imposing intellectual standards upon them. However, effective critical thinking involves consideration of the full range of possibilities to a problem, including emotional, cognitive, intellectual and psychological.
As we indicated earlier, effective critical thinking is the foundation for sound decision-making and strategic thinking. Decision making is one of the most important tasks that leaders of all levels must execute. This becomes particularly challenging when a leader has incomplete or contradictory information and when the time is short and the impact of the decision is high. Possessing the ability to make wise decisions quickly in the context of the organization’s culture is a crucial skill. The Seven Elements below detail the specific behaviors that define great decision-making (see “Stealth Leadership: Using Assessment & Coaching to Propel Leaders & Organizations to Greatness, EDA):
The Seven Elements of Optimal Decision-Making
1. Using Your Head to Make Rational Decisions: Collecting, analyzing, and utilizing accurate data from multiple relevant sources and objectively assessing the impact of the alternative decisions
2. Using Your Heart by Listening to Yourself and Others: Making decisions that will have wide acceptance and that are aligned with the core values of the organization.
3. Using Your Gut by Trusting Your Instincts: Having a trustworthy gut that instinctively knows the right course of action and being able to effectively remove obstacles that might impede its implementation.
4. Making Wise Decisions by Integrating Your Head, Heart, and Gut: Having clear access to your head, heart, and gut so that the decision made will stand the test of scrutiny and time.
5. Understanding the Organizational Culture: Knowing, respecting, and – in most cases – honoring the organization’s expectations regarding how decisions are best made and executed.
6. Honoring the Organization’s Decision-Making Authority Structure: Fully understanding and utilizing the decision-making lines of authority as well as delegating decision-making where appropriate and effective
7. Factoring in the Context of the Decision: Effectively balancing the situation’s many factors – for example, time urgency, risk level, and strategic priorities – into the final decision.

19 | PageCopyright © 2011 by Pearson Education, Inc. or its affiliate(s). All rights reserved. Pearson are trademarks in the U.S. and/or other countries, of Pearson Education, Inc. or its affiliate(s). 8047 07/11
Leaders at all levels need to fully understand the business of the organization and be able to think and act strategically on an ongoing basis. Organizational environments change rapidly; talented employees have many options for where and how they work and customers have many more choices for where to obtain products and services. When leaders excel in the following competencies, they enable their organizations to reach the highest levels of performance, effectiveness, and efficiency.
Eleven Competency Elements of Knowing the Business: Think & Act Strategically
Know the Business: The Business Environment (3 elements)1. Knowing the Industry: Knowing the key environmental factors, industry trends, and
being professionally networked2. Knowing the Marketplace: Knowing the market, the competition, and your
organization’s strengths and weaknesses3. Knowing the Customers: Knowing the needs and expectations within customer
segments and classes and effectively responding to current and future customer requirements
Know the Business: The Organization (3 elements)4. Knowing the Structure, Systems, and People: Fully understanding how all aspects
of the organization work and fit together, being able to successfully navigate through its systems, and designing an effective organizational infrastructure to support the work
5. Knowing the Products, Services, and Technologies: Maintaining a current and future view of what the organization offers its customers and the technology that supports this, and making deliberate and wise changes to these as needed
6. Knowing the Finances: Understanding and using a variety of financial tools as management tools and using organizational resources effectively and efficiently
Think & Act Strategically (5 elements)7. Creating a Compelling Vision: Developing a values-based, inspiring, and realistic
vision that engages others to use it as a guidepost8. Defining a Viable Mission: Clarifying the business you are in based on your unit’s
or organization’s vision, strengths, limitations, and the desires of your present and future customer base
9. Developing Synergistic Strategies: Crafting a set of strategies that are integrated, leveraged off one another, and that enable those who work for you to achieve the mission and make effective decisions
10. Creating Quantifiable Goals: Setting realistic and quantifiable goals that allow people to stretch their capabilities and achieve the strategies
11. Designing Successful Tactics: Designing actions and activities for accomplishing each goal, utilizing these activities to achieve more than one goal when possible, and developing effective plans for their implementation.
Our respondents also identified “leading change” as a significant gap. Understanding how to do this first requires an understanding of how to manage the three major activities involved with change: (1) Designing what the future of the change should look like; (2) Assessing the current situation in relation to the desired change; and (3) Planning and Managing the transition from the current situation to the desired future.

20 | PageCopyright © 2011 by Pearson Education, Inc. or its affiliate(s). All rights reserved.
Pearson are trademarks in the U.S. and/or other countries, of Pearson Education, Inc. or its affiliate(s). 8047 07/11
Fifteen or more years ago, most “change leaders” first assessed the current situation--then designed the future. Often, however, this strategy only created small improvements because it was only based on “what is” and did not take into account the desired future state. Today, change leaders first design the future in general terms--defining what it is they want to see in the future, then go back and assess the current situation, and then they design the future in more specific terms. A thoughtful and thought-through transition is critical; otherwise, there’s no roadmap for moving from the present to the future. In addition, the Ongoing Business must be managed and led at the same time as the change. This can put a great deal of pressure on leaders to execute the required change and manage business as well.
Lastly, the ability to inspire others and work collaboratively with other parts of the business puts a keen emphasis on a leaders (and future leaders) ability to empower and energize others through self-awareness, empathy, sensitivity and emotional intelligence. Clearly, helping future leaders master these emotional and motivational critical capabilities is vital. However, a best in class development strategy for future leaders must combine the emotional and motivational aspects with the intellectual and business aspects (i.e., critical thinking, strategy, change and execution). It should be noted, similar to our 2009 findings, that our respondents viewed the next generation of leaders as having mastery over the technical side of the business, having high integrity, having the ability to deliver results, and the ability to manage stress.
The Executive Talent Pipeline = High Potentials and Emerging Leaders
We anticipated that the bench strength issue would in fact present itself in the survey results and, so, we decided to include a number of questions about talent pipelines and high potential programs. This year, we added questions that focused on emerging leaders—do such programs and processes exist? What methods are used to identify emerging leaders? Which processes are most effective in accelerating the development of emerging leaders? In what areas does your emerging leader programs/processes need to improve? We asked participants to essentially respond to the same questions for their emerging leader population as their high potential population.
As a reminder, here are the definitions of these two populations:
• “HIGH-POTENTIAL EXECUTIVES”: CURRENT EXECUTIVES WHO SEEM TO HAVE THE POTENTIAL TO FILL POSITIONS ON THE TOP MANAGEMENT TEAM REPORTING TO THE CEO IN THE FUTURE.
• “EMERGING LEADERS”: TYPICALLY YOUNGER LEADERS LOWER IN THE ORGANIZATION WHO SEEM TO HAVE THE POTENTIAL TO FILL EXECUTIVE LEVEL POSITIONS IN THE FUTURE.
Regarding, their high potential populations, we started by gauging progress - asking participants how they would compare their leadership talent pipeline today relative to two years ago. The good news was that 39.7% of the respondents indicated that their talent pipelines were stronger than two years ago. The negative news, was that 41% indicated that their talent pipelines were the same and 16.7% in fact said their pipelines were worse.

21 | PageCopyright © 2011 by Pearson Education, Inc. or its affiliate(s). All rights reserved. Pearson are trademarks in the U.S. and/or other countries, of Pearson Education, Inc. or its affiliate(s). 8047 07/11
How does your leadership pipeline compare today relative to 2 yrs ago
Answers Percent
Stronger 39.70%
About the Same 41.00%
Weaker 16.70%
Don’t Know 2.60%
Given the leadership bench strength issues cited by our respondents in this study, we are surprised that there hasn’t been progress in this area. In 2009, respondents said that 43% thought their pipeline was stronger, 46% thought it was the same and 11% thought it was weaker. Overall, this suggest that the pipeline is weaker than it was only two years ago.
Formal high potential identification processes?When we dive into how the pipleline is created, we asked respondents whether or not they have a formal identification process. While 60.3% of respondents indicated that they had formal high potential identification processes in place, 39.7% do not. Even with those that have introduced formal processes, the results are mixed as we heard the following comments from respondents:
• “high potential programs are a waste of money”;• “the process is administered inconsistently”; • “the criteria used are subjective”; • “we have some elements of formality, but we are still building this capability”.
My organization has a formal high potential identification program
Answers Percent
Yes 60.30%
No 39.70%
Summary 100%
Formal high potential development program?In response to the statement, “My organization has a formal high potential development program”, only 48.7% answered “Yes”. Some of the respondents commented with “still evolving” and “under construction”.
My organization has a formal high potential development program
Answers Percent
Yes 48.7%
No 51.3%
Summary 100%

22 | PageCopyright © 2011 by Pearson Education, Inc. or its affiliate(s). All rights reserved.
Pearson are trademarks in the U.S. and/or other countries, of Pearson Education, Inc. or its affiliate(s). 8047 07/11
Methods were used to assess/identify high potential leaders?When we asked about “which methods were used to assess/identify high potential leaders”, 59.2% indicated that they relied on senior executive opinion, 50.7% relied on performance review information, 42.3% relied on a formal talent review meeting process, 23.9% relied on the opinion of the most immediate manager, 15.5% relied on a custom 360-degree assessment tied to the organization’s competency model, 15.5 % relied on peer review processes, and only 14.1% use psychological assessments (e.g., intra-personal and inter-personal assessments such as the MBTI®, Hogan Assessments, California Psychological Inventory®, etc.)
Table xx. 2011 Top 10 Processes Used to Assess/Identify High Potential Leaders
1. Senior executive opinions 59.2%
2. Performance appraisals 50.7%
3. Formal talent review process 42.3%
4. Perception/judgment of their immediate manager 23.9%
5a. Custom 360 leadership feedback based on your internal competency model
15.5%
5b. Peer review 15.5%
6. Psychological testing 14.1%
7. Generic 360 leadership feedback instrument 9.9%
8. Cognitive ability testing 8.5%
9. An assessment center 7.0%
10. Business simulations 4.2%
Similar to our 2009 trends research senior executive judgments, performance reviews, talent review meetings and “perception” are the most common rating strategies used to determine who the “high potential’s” are. This makes some sense as line management needs to take proper responsibility for talent. However, as we cited in the 2009 study, line leaders need to be better trained to assess and calibrate performance, potential and readiness. Further discussion of how senior leaders and line managers input comes into play is available in the T & D Magazine (July, 2009) article called, “Lessons from the Front-Line: harvesting Tomorrow’s Leaders” by Jim Bolt and Bonnie Hagemann. In this article, Jim and Bonnie review previous EDA research on the criteria line leaders use to identify high potential and the methods used to develop them.
Perception-based surveys, such as 360-degree assessments and performance reviews are excellent tools for calibrating a leader’s present performance. These tools are less effective in calibrating a leader’s potential; therefore, it is interesting and also, concerning, that most organizations continue to rely heavily on such assessments to render decisions regarding a leader’s potential and readiness. Organizations will, over time, mature in their understanding of what constitutes “performance” vs. “potential” (see “Performance vs. Potential” by John Mattone, www.executivedevelopment.com). The art and science of estimating a leaders potential for higher level positions as well as their “readiness” to assume larger roles, must be based more on assessments that measure a leader’s capability or “can do” as opposed to assessments that measure what they “are doing”.

23 | PageCopyright © 2011 by Pearson Education, Inc. or its affiliate(s). All rights reserved. Pearson are trademarks in the U.S. and/or other countries, of Pearson Education, Inc. or its affiliate(s). 8047 07/11
Tools that are effective in helping calibrate potential include some of the psychological assessments identified earlier, which measure a leader’s enduring intra-personal and inter-personal characteristics. In addition, cognitive assessments, such as the Watson-Glaser™ II Critical Thinking Appraisal are very strong at predicting higher level executive success.
Lastly, simulation assessments, such as in-depth assessment centers and on-line leadership simulators such as TalentSIM™, provide additional predictive value since they do measure leadership capability. The irony of this discussion is that despite the overwhelming research and anecdotal evidence that exists in support of these types of potential assessments, the vast majority of organizations continue to rely on tools and processes that are less rigorous and more error-prone. Ultimately, stronger calibration of performance, potential and readiness of leaders should occur prior to managers meeting to discuss talent in their talent review meetings.
Talent Review Meetings:As a point of reference, a talent review meeting is when more senior business leaders in sharing and discussing talent information as a part of the succession management process. These are often facilitated by a learning and development professional and include an overview of each person being reviewed including their:
− resume− performance reviews− overview of their 360 results− actual performance and results− career aspirations− any development efforts, current or past
This discussion is followed by recommendations as to future potential and development efforts needed.
In an interview with Luanne Eskew, Vice President of Human Resources at Freighquote, she noted that they are having considerable success with their executive assessment program. Their program consists of in-depth, structured assessments that provide a complete and objective view of an individual’s talents. The program is not just for high potentials, but is also used to determine who to hire, promote and place on mission critical projects.
“We value this program highly because it provides an objective view to an individual’s strengths and weaknesses. It is an additional piece of intelligence in making a hiring or promotion decisions. Moreover, it has helped the organization understand its key personnel and ensure they are in roles that speak best to their strengths, ultimately, allowing them to better leverage core talents in the best possible way”.

24 | PageCopyright © 2011 by Pearson Education, Inc. or its affiliate(s). All rights reserved.
Pearson are trademarks in the U.S. and/or other countries, of Pearson Education, Inc. or its affiliate(s). 8047 07/11
Emerging LeadersAs we noted earlier, we added an “emerging leader” focus to this year’s survey and the results were revealing. Only 48.7% of respondents indicated that they had a formal emerging leader identification process in place, and 51.3% do not.
My Organization has a Formal Emerging leader Identification Process
Answers Percent
Yes 48.7%
No 51.3%
Summary 100%
Those that do have formal processes in place, similar to their comments with respect to their high potential identification process, indicated that the
− “process is biased and not producing future leaders we require”; “− still informal”; and− “to be rolled out this year”.
In response to the statement, “My organization has a formal emerging leader program”, only 44.9% answered ‘Yes”. To this, respondents also commented that it is “evolving” and “not comprehensive”.
My Organization has a Formal Emerging leader Identification Process
Answers Percent
Yes 44.90%
No 55.10%
Summary 100%
When we asked about “which methods were used to assess/identify emerging leaders”, 52.9% relied on performance reviews, 42.6% relied on senior executive opinions, 38.2% relied on the opinions of their immediate manager, 32.4% relied on a formal talent review meeting, 19.1% relied on peer reviews and custom 360-degree assessments, and only 8.8% relied on business simulations and even fewer respondents relied on the psychological assessments that we discussed earlier.

25 | PageCopyright © 2011 by Pearson Education, Inc. or its affiliate(s). All rights reserved. Pearson are trademarks in the U.S. and/or other countries, of Pearson Education, Inc. or its affiliate(s). 8047 07/11
Table xx. Top Methods used to Assess/Identify Emerging Leaders
Answers Percent
Performance appraisals 52.9%
Senior executive opinions 42.6%
Perception/judgment of their immediate manager 38.2%
Formal talent review process 32.4%
Peer review 19.1%
Custom 360 leadership feedback based on your internal competency model
19.1%
Business simulations 8.8%
An assessment center 8.8%
Generic 360 leadership feedback instrument 5.9%
Cognitive ability testing 5.9%
Psychological testing 5.9%
Executive Coaching 4.4%
Outside firm that specializes in assessment 2.9%
In-basket assessment 1.5%
It is interesting that when we dive below the leaders slotted for the executive pool that the performance appraisals become top priority upon identifying Emerging Leaders. Conspicuously, very few companies that we encounter in our work in the field say that they believe their managers do performance appraisals well.
Earlier, we noted that most of our survey respondents rely heavily on less rigorous methods for estimating a leader’s potential and “readiness” to assume higher level roles, even though there is strong research in support of utilizing more objective, rigorous methods that produce more accurate results (i.e., both in terms of correctly identifying high potentials but also isolating targeted development plans). It is clear that the emerging leader population (some of whom are the Gen Xers but most of whom are the Gen Yers) represents a very large and deep future leadership talent pool—that needs to be correctly identified, cultivated, developed and retained. Our findings and suggestions regarding this critical population are no different than what stated earlier when we discussed high potentials. Ultimately, as our respondents said, “organizations need to mature in how they identify and develop emerging leaders”. We suggest more emphasis on measuring leadership capability (“can do”) using more objective assessments and managerial simulation assessments and combining these results with perception-type assessments in order to generate more accurate estimates of potential and “readiness”.
In fact, we asked respondents to “Describe the areas in which their organizations needed to improve how they identified both their high potentials and emerging leaders. Some of their responses included:
− “we need to increase the application of assessment tools”, − “ we see the need to approach the identification process with more objectivity,
professionalism and information”,− “there needs to be a stronger tie to competencies”, − “there is a need to be more structured in how we identify both groups”,

26 | PageCopyright © 2011 by Pearson Education, Inc. or its affiliate(s). All rights reserved.
Pearson are trademarks in the U.S. and/or other countries, of Pearson Education, Inc. or its affiliate(s). 8047 07/11
− “ although we identify high potentials, there is a lack of understanding what that really means”,
− “there is a need for more objectivity”, and − “there is too much emphasis placed on executive and HR opinions”.
The accurate identification of high potentials and emerging leaders represents a significant gap that most organizations need to start addressing. Beyond this, however, creating developmental experiences and opportunities that propels talent in both groups is also a key priority. Organizations weighed in on the most effective ways to accelerate the development of high potentials and emerging leaders.
Table xx. High Potential Development Emerging Leader Development
Answers Percent Answers Percent
Stretch assignments 53.40% Stretch assignments 50.7%
Mentoring 43.80% Mentoring 42.50%
Executive Coaching 31.50% Internal education/training 27.40%
Action learning (working in teams on real organizational challenges for development purposes)
31.50% Feedback though 360 assessments and other means
27.40%
Job Rotation 31.50% Job Rotation 26.00%
Internal education/training 27.40%
Action learning (working in teams on real organizational challenges for development purposes)
24.70%
Feedback though 360
assessments and other
means
21.90% Internal networks 21.90%
External education/training 16.40% External education/training 19.20%
International assignments/
experience11.00% Executive Coaching 17.80%
Internal networks 9.60% Assignments/experience 9.60%
The results support the 70/20/10 rule, which recommends
− 70% of developmental experiences being “on-the-job”, − 20% of development being through coaching and mentoring, and − 10% of development being accomplished through formal training.
In our 2009 study, we did not focus on emerging leaders so we do not have comparative data for that group; however, with respect to high potentials, the use of stretch assignments, coaching, mentoring, and action learning continue to be the most prevalent methods used by organizations to develop high potentials.
While we don’t display the data below, the most significant finding in our 2011 study related to this topic, is the overall reduction—across the board—of the use of all methods. For example, in our 2009 study, 74% of the respondents indicated they used “stretch assignments” (53.4 % reported in 2011); 61% indicated they used “executive

27 | PageCopyright © 2011 by Pearson Education, Inc. or its affiliate(s). All rights reserved. Pearson are trademarks in the U.S. and/or other countries, of Pearson Education, Inc. or its affiliate(s). 8047 07/11
coaching” (31.5 % in 2011); 57% indicated they used “action learning” (31.5% in 2011); and 44% used “mentoring” (43.8% in 2011). As expected, similar to our results in 2009, formal training, such as “internal education” and “external training” are on the list but clearly are identified as having lower overall impact than either coaching or on-the-job experiences.
Regarding the emerging leader population, the use of stretch assignments (50.7%), mentoring (42.5%), internal education (27.4%), feedback through 360-degree feedback (27.4%), job rotation (26%), action learning (24.7%), and leveraging internal networks (21.9%) were the most prevalent methods used by organizations. The prevalence of mentoring, stretch assignments, and action learning is similar to the high potential population, however, executive coaching is not used nearly as much (17.8%) and the use of internal education (27.4%) assumes much more of an important role with this population as compared to the high potential population.
We suggest that the use of internal education with emerging leaders makes a lot of sense as the focus of ascending from an individual contributor role to leadership role certainly requires formal education and learning on how to transition and execute as a leader. One intriguing approach that respondents indicated they used more extensively with emerging leaders than high potentials is the use of leveraging internal networks. Ten point eight percent (10.8%) of the respondents indicated they use this methodology with high potentials and by comparison, 25% indicated they use this methodology to develop emerging leaders. One EDA advisor, George Consolver, noted that shared learning activities that include both formal and informal access to top leaders are invaluable. Through access to top leaders, both high potential and emerging leaders realize they are valued, and the informal time gives both the top leaders, high potentials and emerging leaders an opportunity to get to get to know each other and to learn from each other as the learning goes both ways. While an emerging leader may gain strategic insight from a senior executive, the senior executive may learn day-to-day struggles and intricacies that impact the overall strategic direction.
We were surprised by the significant reduced focus by our survey respondents on the development of their high potentials and emerging leaders. Against the backdrop of a tough economy and budgetary constraints, these results make some sense; however, against the backdrop of the external (e.g., impending retirements, demographic) and internal challenges (e.g., driving business results, revenue and profits), these results make no sense.
Participation in Executive Development Activities
An important decision for many companies is to determine how many days per year top executives, vice president’s, and high potential leaders should devote to development and what type of development activities they should engage in. We asked respondents to estimate the percentage of top executives, VP executives, and high potential managers who will participate in formal development activities on an annual basis as well as the number of days per year they would participate.
Our work in the field informs us that organizations have an extensive range of effort and participation when it comes to executive development. Some of the largest organizations in the world do little more than standard Human Resource requirements while others spend millions of dollars per year to invest in their most valuable asset, their talent.

28 | PageCopyright © 2011 by Pearson Education, Inc. or its affiliate(s). All rights reserved.
Pearson are trademarks in the U.S. and/or other countries, of Pearson Education, Inc. or its affiliate(s). 8047 07/11
The survey results are shown in Table ___. The means (averages) are presented, but it is important to note that the range across organizations was significant across the three groups. The percentage of executives organizations expect to participate in various developmental activities on an annual basis ranged from 0 to 100 and the number of days in the classroom ranged from 0 to 150. A quick look at Table ___ shows that respondents expect 51.04% (by comparison 38% in 2009’s survey) of top executives, 56.29% (53% in 2009) of vice president’s, and 53.49% of high potentials (64% in 2009) will participate in development activities in the next year.
At first glance, we found it somewhat surprising that there was a percentage increase for top executives. When we looked deeper, however, it is clear that there is more board involvement and corporate governance currently (as compared to even two years ago) as it relates to ensuring that senior executives are truly equipped with the knowledge and skills to implement and drive strategy. What we found interesting was the overall percentage decrease in anticipated development for high potentials. In fact, we expected that the numbers for high potentials and VP level executives would be higher as these are the groups preparing to replace the retiring baby boomers. Other results in the trends survey suggest that participation percentages should be much higher in order for companies want to remain competitive.
Table x. Percent of Executives Participating in Development
Level Participating (Mean) # of Days in the Classroom (Mean)
Top Executive 51.04% 5.71
VP Executive 56.29% 10.51
High Potential 53.49% 11.2
Table x. Number of days of Classroom Type Development (per year per person)
Level 2011 2009
Top Executive 6 4
VP Executive 11 6
High Potential 11 8
29 | PageCopyright © 2011 by Pearson Education, Inc. or its affiliate(s). All rights reserved. Pearson are trademarks in the U.S. and/or other countries, of Pearson Education, Inc. or its affiliate(s). 8047 07/11
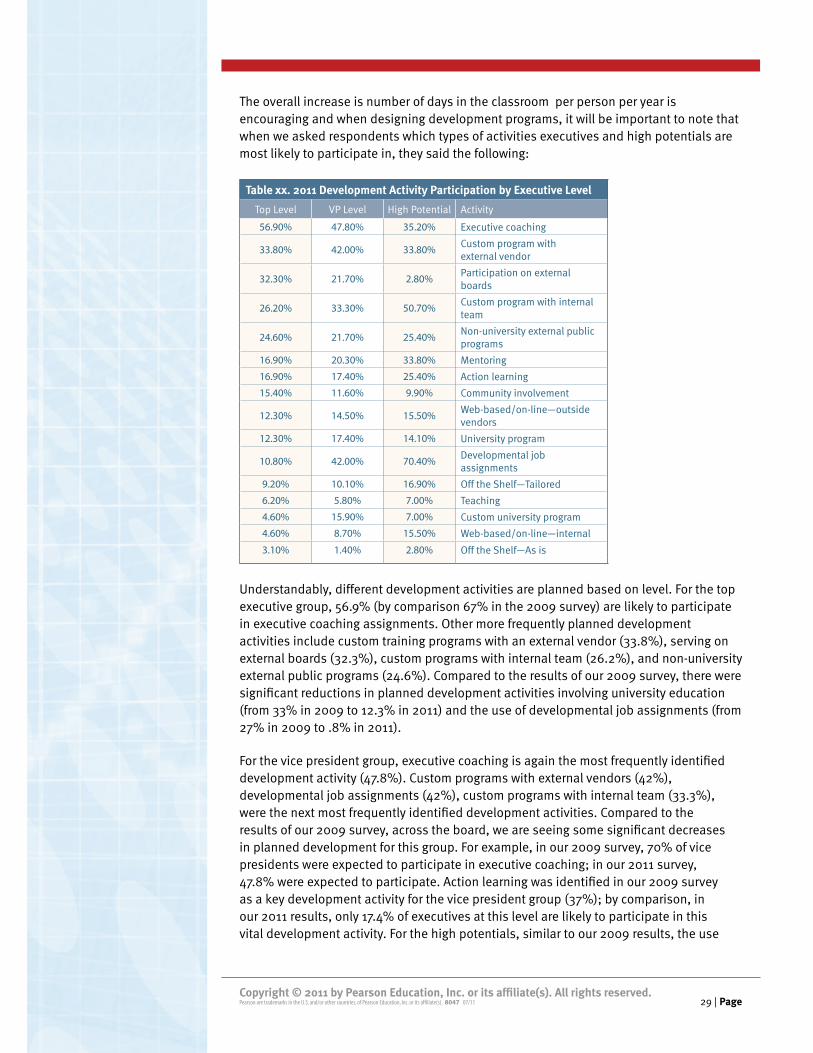
The overall increase is number of days in the classroom per person per year is encouraging and when designing development programs, it will be important to note that when we asked respondents which types of activities executives and high potentials are most likely to participate in, they said the following:
Table xx. 2011 Development Activity Participation by Executive Level
Top Level VP Level High Potential Activity
56.90% 47.80% 35.20% Executive coaching
33.80% 42.00% 33.80% Custom program with external vendor
32.30% 21.70% 2.80% Participation on external boards
26.20% 33.30% 50.70% Custom program with internal team
24.60% 21.70% 25.40% Non-university external public programs
16.90% 20.30% 33.80% Mentoring
16.90% 17.40% 25.40% Action learning
15.40% 11.60% 9.90% Community involvement
12.30% 14.50% 15.50% Web-based/on-line—outside vendors
12.30% 17.40% 14.10% University program
10.80% 42.00% 70.40% Developmental job assignments
9.20% 10.10% 16.90% Off the Shelf—Tailored
6.20% 5.80% 7.00% Teaching
4.60% 15.90% 7.00% Custom university program
4.60% 8.70% 15.50% Web-based/on-line—internal
3.10% 1.40% 2.80% Off the Shelf—As is
Understandably, different development activities are planned based on level. For the top executive group, 56.9% (by comparison 67% in the 2009 survey) are likely to participate in executive coaching assignments. Other more frequently planned development activities include custom training programs with an external vendor (33.8%), serving on external boards (32.3%), custom programs with internal team (26.2%), and non-university external public programs (24.6%). Compared to the results of our 2009 survey, there were significant reductions in planned development activities involving university education (from 33% in 2009 to 12.3% in 2011) and the use of developmental job assignments (from 27% in 2009 to .8% in 2011).
For the vice president group, executive coaching is again the most frequently identified development activity (47.8%). Custom programs with external vendors (42%), developmental job assignments (42%), custom programs with internal team (33.3%), were the next most frequently identified development activities. Compared to the results of our 2009 survey, across the board, we are seeing some significant decreases in planned development for this group. For example, in our 2009 survey, 70% of vice presidents were expected to participate in executive coaching; in our 2011 survey, 47.8% were expected to participate. Action learning was identified in our 2009 survey as a key development activity for the vice president group (37%); by comparison, in our 2011 results, only 17.4% of executives at this level are likely to participate in this vital development activity. For the high potentials, similar to our 2009 results, the use
30 | PageCopyright © 2011 by Pearson Education, Inc. or its affiliate(s). All rights reserved.
Pearson are trademarks in the U.S. and/or other countries, of Pearson Education, Inc. or its affiliate(s). 8047 07/11
of developmental assignments (70.4%) was identified as the number one planned development activity, followed by custom programs developed by the internal team (50.7%), executive coaching (35.2%), mentoring (33.8%), custom programs with external vendors (33.8%), mentoring (33.8%), and action learning and non-university external public programs (25.4%). Similar to the results with the previously discussed groups and, consistent with the theme in this report, we are seeing an alarming disconnect between critical development planning and resource planning across all executive groups and the levels that will be required by all organizations to ensure they survive and remain competitive.
The backdrop of external and internal challenges is real, and it will be of vital importance for all organizations to increase their planned commitment to developing their leaders and future leaders now that the economy is improving. In Warren Buffet’s biography, The Snowball, he indicates that he gets most excited during a down market. This is when he moves aggressively to buy undervalued stocks and positions himself and his companies so that when the economy turns, his gains are significant. This is a great time for organizations to position themselves by aggressively developing their key talent during the downturn in order to be strategically positioned for success as the economy regains its momentum. If we are at the bottom of the downturn and on our way up, there is still time to get ahead of the competition when it comes to executive development.
Board of Directors
Continuing the tradition started in 2004, we asked respondents about the types of development activities their organizations are providing to Board Members. In our own experience, we see companies engaging the Board of Directors more and more in the oversight of the organization as well as the development of the talent. We have seen Board members participate in formal executive development programs as a participant, have specially designed development just for them, act as mentors to senior executives, teach in executive education as subject matter experts and participate in talent review sessions.
Board member participation is often considered crucial as Director roles are gaining in complexity. They must adhere to increased regulation and legal responsibilities as well as execute their role of offering strategic guidance to the leaders of the organization. By participating in their own development and in the development of the executives, they are able to better fulfill their role as well as gain indepth and valuable insight into the leadership of the company and individual aspects of the executive team. In addition, this participation can help them make informed decisions when necessary to vote on C-Suite successors.

31 | PageCopyright © 2011 by Pearson Education, Inc. or its affiliate(s). All rights reserved. Pearson are trademarks in the U.S. and/or other countries, of Pearson Education, Inc. or its affiliate(s). 8047 07/11
From the 2011 survey, the list of development activities for boards is rich and includes leadership development, strategic reviews, talent reviews, and board governance activities. Listed below are some additional development activities that are respondents identified:
• Team building and participation in assessments• Leadership dialogues with executives• Action learning• Attendance at Board Governance Conferences• Two-day training programs for new Board members• Four days per year interacting with key leaders• External thought leaders brought in as guest speakers• 20 hours training per year (vision, mission, values, ethics, societal and business
trends)
Executive Development Operations
Developing Strategy and Policy Activities EmphasizedGoing forward, the top strategic priorities (see Table ___) are the creation of strategies and systems that integrate all executive leadership activities (e.g., emerging leader and high potential identification and development; internal leadership/executive development programs; external development, etc.). Forty-five point three percent (45.3%) of our respondents cited this as the number one activity that will be emphasized in the next 2 to 3 years. Compared to our 2009 survey, this strategy moved up from number two indicating a need to add structure and where possible simplification to potentially complicated matrix of activity.
In this year’s survey, the number two identified strategy is benchmarking “best practice” organizations (36%) which can be done in multiple ways. One is by comparing data using a report such as this one and another way is to conduct a proprietary study targeting exactly which processes and strategies to benchmark against and diving deep into selected areas.
The number three policy and strategy activity to be emphasized is the use of systematic measurement and evaluation to measure impact (32%), number four was the creation of a core corporate curriculum (28%) and number five was 2009’s number one—creation of a strategy and system that integrates all talent management processes (25.3%).
The need to integrate and “optimize” various elements of either talent management or leadership systems has been a recurring theme since 2004. As mentioned, 2009’s number one strategy (talent management), is now number five. We think these results indicate that organizations, while still focused on talent management, have made positive strides in the talent management arena. However, with respect to integrating leadership development, we think with this imperative now moving to number one on the list, that this is in fact a positive sign that organizations are going to make a good faith effort in the next 2 to 3 years to improve how they practice and operate in this critical area.

32 | PageCopyright © 2011 by Pearson Education, Inc. or its affiliate(s). All rights reserved.
Pearson are trademarks in the U.S. and/or other countries, of Pearson Education, Inc. or its affiliate(s). 8047 07/11
Table xx. 2011 Top 5 Strategy and Policy Activities to be Emphasized
1. Creation of a strategy and system that integrates all executive/leadership development activities (external leadership/executive education/development; internal leadership/executive education programs; high-potential identification and development
45.3%
2. Benchmarking “Best Practice” organizations 36.0%
3. Use of systematic measurement/evaluation to determine the impact of your efforts 32.0%
4. Creation of a core corporate curriculum (required courses) 28.0%
5. Creation of a strategy and system that integrates all executive/leadership talent management activities (attraction, retention, performance management, executive/leadership development, succession planning, performance management, etc.)
25.3%
Planning and Needs Analysis Activities EmphasizedTailoring programs to effectively meet the needs of executives is the starting point of a well-developed program. It is also an area where organizations have often missed the opportunity to provide significant impact by assuming that one piece of data such as an engagement survey or best places to work report adequately identify what needs to be included. In addition, senior executive opinions often weigh in so heavily that other, potentially more accurate data, is completely missed.
Table __ shows the major ways respondents plan to identify executive development needs.
Table xx. 2011 Top 5 Planning and Needs Analysis Activities to be Emphasized
1. Use of top management requests/suggestions to identify needs 43.6%
2. Use of 360 feedback results to identify development needs 43.6%
3. Analysis of aggregate talent review results of the target population 30.8%
4. Use of formal performance/competency studies to select objectives/content 29.5%
5. Survey or interviews conducted with the managers of prospective participants to identify needs
23.1%
6. Use of an Advisory Board or Steering Committee 23.1%
7. Survey or interviews conducted with the managers of prospective participants to identify
needs19.2%
The top two methods—“Top management input” and “Use of 360-degree survey results”—were the top two methods identified in our 2000, 2004 and 2009 research. Again, in 2011, these two methods were number one and two. The third method, “Analysis of talent review results of the target population”, again, was the same as what reported in 2000, 2004 and 2009. This level of continuity suggests that development professionals continue to favor the perspective of senior management in combination with 360-degree survey results. This is not surprising, as we would expect that while most senior executives do not have a deep perspective of training needs; however, their input, perspective and “buy-in” are vital to ensure the success of any developmental initiative. The use of formal “competency studies” came in fourth in 2011 and finally number five was “interviewing prospective participants to identify needs”. There is no doubt that as we have analyzed the trends since 2000, that “interviewing prospective participant’s”, has dropped as a preferred method for identifying needs. That said, our advisory board and executive team believe that this method is an important way for identifying needs as long as it is coupled with the other methodologies identified here.

33 | PageCopyright © 2011 by Pearson Education, Inc. or its affiliate(s). All rights reserved. Pearson are trademarks in the U.S. and/or other countries, of Pearson Education, Inc. or its affiliate(s). 8047 07/11
The majority of our respondents did not believe that their organization does an adequate job of analysis and planning. At EDA, we believe that like physicians, prescription without diagnosis is malpractice and can potentially cause harm. We recommend that a formal process be in place to ensure a thorough understanding of the needs and a strong foundation on which to build the executive development processes.
Program Design and Development Activities EmphasizedInfluential conditions, such as the economy, lack of bench strength, demographic shifts, changing objectives, and changing content requirements all combine to influence program design and development. Table __ shows how these various factors are impacting the types of activities that will be emphasized in the next two to three years.
Table xx. 2011 Top 5 Types of Activities Emphasized in 2–3 years
1. Internal design of strategies, courses/programs 63.2%
2. Formal or informal training to upgrade design/development skills of internal executive/leadership development staff
44.7%
3. Use of outside consulting firm to design and develop strategies, courses/programs 39.5%
4. Research or benchmarking on new program designs and learning methods 27.6%
5. Use of outside university experts to design and develop strategies, courses/programs 18.4%
6. Systematic measurement/evaluation procedures to determine business impact, ROI, etc. 17.1%
7. Systematic measurement/evaluation procedures to determine impact on individual performance
14.5%
The anticipated increase in the use of internally designed programs continues to be a notable shift from previous surveys. In 2004, the use of outside consultants was clearly the most preferred approach for designing programs. In 2009, the results shifted to internally designed programs and again in 2011, we are seeing similar results. Reinforcing the validity of this shift, is the rise in importance of “training to upgrade internal staff in design/development skills”, which is now number two—up from number four in the 2009 survey. This shift to a focus on internal resources is primarily due to budgetary constraints. That said, however, the use of outside consulting firms to design and develop programs is still seen as very important—coming in at number three. Number four was “researching and benchmarking new program designs”, which did not make the top five list in 2009 and number five was “using outside university experts”, which also did not make the top five list in 2009. The two that dropped from the top five in the 2011 survey, although they are still cited as being important were: “systematic evaluation procedures to measure impact” and “systematic evaluation procedures to measure impact on individual performance”. We know from both experience and research that organizations have made positive strides in the measurement area and as a result—while still important—these areas compared to other design and development priorities are seen as not as critical at this time.
Methods of Development that will be Emphasized in the Next 2 to 3 Years:When we turn our attention to which methods will be emphasizes in the next two to three years, we found an interesting phenomenon because Mentoring came up as the number one method emphasized while we learned earlier that executives are most likely to participate in executive coaching. On the other hand, mentoring is extremely effective when it is done well and typically budget friendly as well.

34 | PageCopyright © 2011 by Pearson Education, Inc. or its affiliate(s). All rights reserved.
Pearson are trademarks in the U.S. and/or other countries, of Pearson Education, Inc. or its affiliate(s). 8047 07/11
Figure 1.10. Methods that will be Emphasized in the Next 2 to 3 Years
0 5 10 15 20 25 30 35
Returning to the 70-20-10 breakdown for learning and development, we asked participants what they felt was their best use of on-the-job development. (i.e. 70% on-the-job learning). The respondents indicated that the number one way was to put someone in a job assignment where he or she was truly stretched. (44.2%). After a significant drop, this was followed by special assignments (29.9%) and being coached at 22.1%.
Funding and StaffingOperationally, executive development seems to have a steady stride that is only mildly affected by current economic conditions. Similar to our 2009 results, most organizations expect the total amount expended on executive development to increase (54.8%) or stay the same (34.2%). A more detailed breakdown appears below:
Table 14. Amount Spent on Executive Development in the Next 2–3 Years
2011 2009
Increase considerably 10% 9%
Increase some 45% 43%
Remain the same 34% 32%
Decrease some 11% 14%
Decrease considerably 0% 2%
Average Annual Expenditure per Executive
Formal external classroom education/development events (such as university executive)
Internal classroom-based education/development events (including action learning and outdoor experiential events)
Development job assignments, special projects, etc.
Average: $32,255.81 US Average: $29,193.17 US Average: $29,891.90 US
43 companies 41 companies 42 companies

35 | PageCopyright © 2011 by Pearson Education, Inc. or its affiliate(s). All rights reserved. Pearson are trademarks in the U.S. and/or other countries, of Pearson Education, Inc. or its affiliate(s). 8047 07/11
What’s interesting is that our 2011 survey results verified what organizations said they were going to do in 2009 regarding their increasing their average expenditure: External training average expenditure in 2009 was $23,531 (in 2011-$32,255.81); Internal training average expenditure in 2009 was $16,887 (in 2011-$29,193.17); and Coaching, mentoring and on-the-job average expenditure in 2009 was $6,748 (in 2011-$29,891.90). The good news is that if this trend continues—which we believe it will—our next survey results will show significant average increases again across the three developmental approaches we have identified here.
Executive development is, of course, an expense. When organizations must cut back on their expenses they can take the opportunity to innovate. Some of our respondents identified a number of innovative approaches that combine strength and vitality with fiscal restraint. Here are some examples:
− “ systematic and scheduled senior executive involvement in driving quality talent management,
− “review and feedback processes”; − “community service programs”; − “the use of connected learning that combines on-line with social networks”.
Who Pays?When it comes to who foots the bill, the most common practice of funding is for corporate to pay for all costs (38.6%), followed by charging some of the costs to the participants budget (28.6%), followed by having the business unit pay (25.7%), followed by having corporate pay some of the costs (20.0%). Seven point one percent (7.1%) indicated “other”, which included business units paying travel, and combinations of those identified earlier. These results are fairly similar to what we saw in 2009, except that number one and two flipped.
Table x. Source of Funding for Executive Development Programs
Corporate pays for all costs 38.6% 36.2
Some costs are charged back to the participants’ budget 28.6% 42.0%
Business units pay all costs 25.7% 27.5%
Corporate charges back to the participants’ budgets 20.0% 21.7%
Other 7.1% 5.8%
Staffing
Similar to our 2009 results, the number or people serving in roles committed primarily to the field of executive development at headquarters varied widely, ranging from 0 to 20, with company size impacting the numbers. The majority of respondents’ expected the number of executive development staff at headquarters to either “increase” (24.6%) or “remain the same” (64.4%). These results are similar to our 2009 findings and is fitting with the trend of increased internal design and delivery. In addition, the number of people serving in roles committed primarily to the field of executive development throughout the entire organization also varied (see Figure 3). Again, similar to our 2009 findings, respondents expected the number of executive development staff across the entire organization to either “increase” (25.7%) or “remain the same” (64.3%).

36 | PageCopyright © 2011 by Pearson Education, Inc. or its affiliate(s). All rights reserved.
Pearson are trademarks in the U.S. and/or other countries, of Pearson Education, Inc. or its affiliate(s). 8047 07/11
Figure 1.5. Number of Executive Development Staff at Company
Measurement and Evaluation
The process of program and individual performance measurement is now standard operating procedure, with the Kirkpatrick Model serving as the primary method of measurement. For those unfamiliar with the Kirkpatrick Model,
Kirkpatrick’s model, created by Dr. Don Kirkpatrick in the 1950s, focuses on measuring four main outcomes that are related to good training and development programs. The four levels that he identifies are listed below.
Figure 1.6. Title?
BusinessResults
Behaviorin the
WorkplaceLearningResults Learners’
Reactions
Level 4Results
Level 3Behavior Level 2
Learning Level 1Reaction
• Level 1: ReactionTo what degree participants react favorably to the training
• Level 2: LearningTo what degree participants acquire the intended knowledge, skills, attitudes, confidence, and commitment based on their participation in a training event
• Level 3: BehaviorTo what degree participants apply what they learned during training when they are back on the job
• Level 4: ResultsTo what degree targeted outcomes occur as a result of the training event
and subsequent reinforcement

37 | PageCopyright © 2011 by Pearson Education, Inc. or its affiliate(s). All rights reserved. Pearson are trademarks in the U.S. and/or other countries, of Pearson Education, Inc. or its affiliate(s). 8047 07/11
New methods are emerging as well, contributing to a richer picture of the outcomes and benefits of executive development.
When it comes to Executive Development, measurement and evaluation is an area where much change has occurred over the past seven years, and, in general, we believe that the profession is moving in the right direction. More organizations are evaluating results and behavioral change based on their development efforts, as opposed to measuring participant reaction. Figure ____ shows that executive development professionals expect that Level 4 evaluation will become more prevalent in the next two to three years than they did in 2009. Ironically, in our 2011 findings, we see respondents indicating somewhat less of a focus on measuring behavioral change (29.7% expect to extensively use Level 3 measures as compared to 39% who reported they would in our 2009 study). That being said, when the groups who indicate either an extensive or moderate use of Level 3 measures are combined, the percentage jumps to 68.8%.
Figure x. Level of Evaluation Used in the Next 2-3 Years
Level 1: Reaction 2011 2009
Seldom Used 9% 16%
Moderately Used 32% 22%
Extensively Used 59% 62%
Level 2: Learning
Seldom Used 14% 31%
Moderately Used 60% 43%
Extensively Used 27% 25%
Level 3: Behavior
Seldom Used 32% 28%
Moderately Used 41% 33%
Extensively Used 27% 39%
Level 4: Results
Seldom Used 51% 33%
Moderately Used 19% 41%
Extensively Used 30% 26%
Jim and Wendy Kirkpatrick of Kirkpatrick Partners, offered their assessment and review of the 2011 “Measurement of Impact/Results” section of our 2011 survey:
“It is encouraging to see the meaningful questions asked in this survey. It is even more encouraging to see strong intentions on the part of learning and performance managers to monitor and measure key on-the-job executive development behaviors and the impact of those behaviors.
The variety of evaluation methods planned to measure and monitor on-the-job behaviors and their impact is impressive. Specifically, a good balance exists between observation, work review, surveys, interviews, and action plan monitoring. Unfortunately, nearly one third of respondents do not plan to assess Level 3, which will leave them “flying blind” with their executive leadership initiatives.

38 | PageCopyright © 2011 by Pearson Education, Inc. or its affiliate(s). All rights reserved.
Pearson are trademarks in the U.S. and/or other countries, of Pearson Education, Inc. or its affiliate(s). 8047 07/11
The planned methods for measuring business outcomes are surprisingly good, with true strategic business outcomes standing out as the popular choice. This provides the opportunity to create a strong chain of evidence linking training to learning, behavior, and ultimate results. It was heartening to see that nobody attempted to isolate the impact of training events, as in the form of an ROI calculation. This shows the rapid trend away from such outdated attempts at demonstrating value. However, over half the respondents either do not know how or do not see the value in connecting executive leadership initiatives to business outcomes. This will put them in the undesirable position of having little in the way of compelling evidence to demonstrate the ultimate value of their efforts.
Finally, a significant discrepancy existed between what respondents plan to do and their current practices. It is our sincere hope that these good intentions and strong plans actually come to fruition in the next two years. Practitioners around the world have discovered how to overcome barriers and evaluate Levels 3 and 4. Hopefully, this trend will continue and strengthen.”
We asked respondents to comment on the various methods they use to measure individual and business performance and similar to our 2009 results, a number of themes emerged:
Individual Performance• Using 360-Degree surveys that are tied to performance objectives and/or
competency models; using a pre-and post-test design• Extensive use of key performance indicators (KPI’s) to measure individual
performance• Self-assessments by individual of their personal development plan completion
with follow-up by direct manager• Performance ratings, promotions, lateral moves and special assignments
Business Performance• Bench strength measures (e.g., strength of pipeline; “ready now” candidates per
key role; number of “ready later” candidates for each key role; diversity in the succession pool; retention rates of those in succession pool, etc.)
• Financial metrics (e.g., correlating executive development investment with revenue including increased sales, profitability, EBITDA, shareholder value, etc.)
Best Practices in Executive Development
When respondents were asked about the best practices most critical to success of an executive development program, we were pleased to see that being “Linked to Strategy” hit the top of the list, with 72.1% ranking this as number one (in 2009, 88% of our respondents identified this as number one). This best practice—linking executive development to strategy was first introduced by Jim Bolt in his 1985 Harvard Business Review article, “Tailor Executive Development to Strategy”.
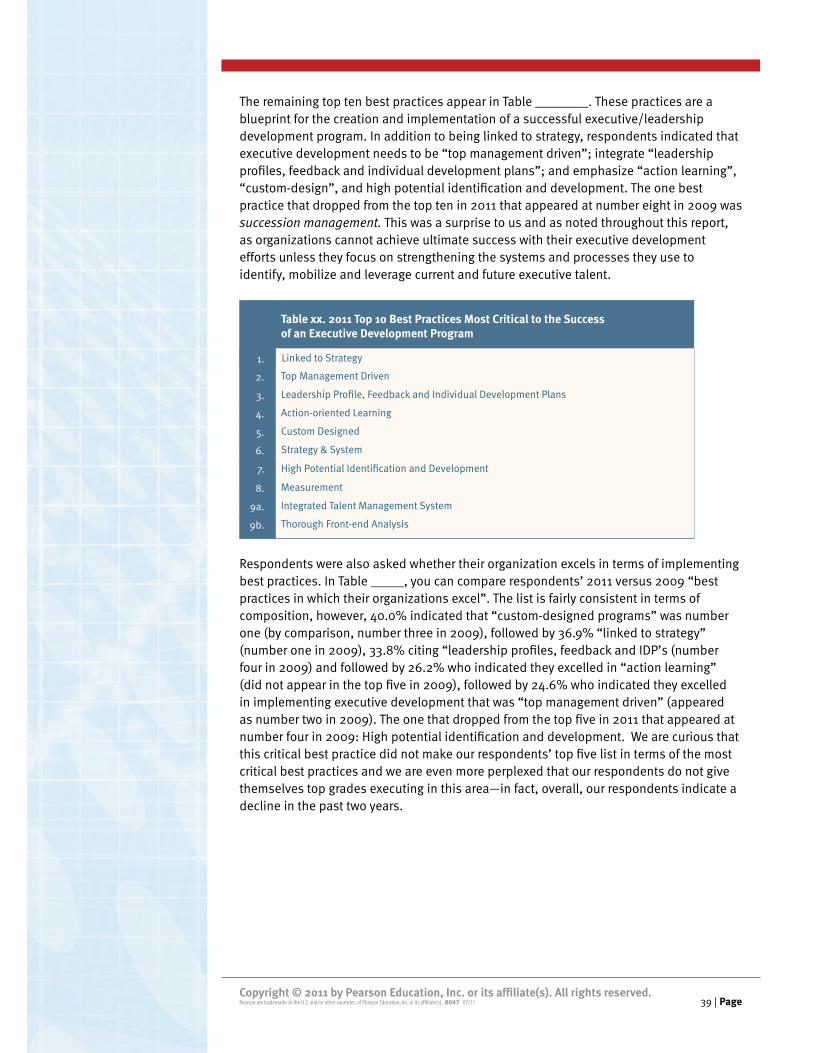
39 | PageCopyright © 2011 by Pearson Education, Inc. or its affiliate(s). All rights reserved. Pearson are trademarks in the U.S. and/or other countries, of Pearson Education, Inc. or its affiliate(s). 8047 07/11
The remaining top ten best practices appear in Table ________. These practices are a blueprint for the creation and implementation of a successful executive/leadership development program. In addition to being linked to strategy, respondents indicated that executive development needs to be “top management driven”; integrate “leadership profiles, feedback and individual development plans”; and emphasize “action learning”, “custom-design”, and high potential identification and development. The one best practice that dropped from the top ten in 2011 that appeared at number eight in 2009 was succession management. This was a surprise to us and as noted throughout this report, as organizations cannot achieve ultimate success with their executive development efforts unless they focus on strengthening the systems and processes they use to identify, mobilize and leverage current and future executive talent.
Table xx. 2011 Top 10 Best Practices Most Critical to the Success of an Executive Development Program
1. Linked to Strategy
2. Top Management Driven
3. Leadership Profile, Feedback and Individual Development Plans
4. Action-oriented Learning
5. Custom Designed
6. Strategy & System
7. High Potential Identification and Development
8. Measurement
9a. Integrated Talent Management System
9b. Thorough Front-end Analysis
Respondents were also asked whether their organization excels in terms of implementing best practices. In Table _____, you can compare respondents’ 2011 versus 2009 “best practices in which their organizations excel”. The list is fairly consistent in terms of composition, however, 40.0% indicated that “custom-designed programs” was number one (by comparison, number three in 2009), followed by 36.9% “linked to strategy” (number one in 2009), 33.8% citing “leadership profiles, feedback and IDP’s (number four in 2009) and followed by 26.2% who indicated they excelled in “action learning” (did not appear in the top five in 2009), followed by 24.6% who indicated they excelled in implementing executive development that was “top management driven” (appeared as number two in 2009). The one that dropped from the top five in 2011 that appeared at number four in 2009: High potential identification and development. We are curious that this critical best practice did not make our respondents’ top five list in terms of the most critical best practices and we are even more perplexed that our respondents do not give themselves top grades executing in this area—in fact, overall, our respondents indicate a decline in the past two years.

40 | PageCopyright © 2011 by Pearson Education, Inc. or its affiliate(s). All rights reserved.
Pearson are trademarks in the U.S. and/or other countries, of Pearson Education, Inc. or its affiliate(s). 8047 07/11
Table xx. Best practices in which your organization excels
2011 2009 2004
1. Custom Designed Linked to Strategy Custom Designed
2. Linked to Strategy Top Management Driven Linked to Strategy
3. Leadership profile/feedback/ IDPs Development Plans
Custom Designed Top Management
4. Action-oriented LearningHigh Potential Identification/Development
Leadership Profile/Feedback/IDPs
5. Top Management DrivenLeadership profile/feedback/IDPs
Action Learning
Innovations in Executive Development
In the 2011 survey we continued the tradition of asking respondents to describe the most new and innovative practices they were aware of in the field of executive development. In our 2009 survey, the use of “leader-as-teacher” came to the forefront. In 2011, the use of “connected learning”, that goes beyond e-learning and leverages the power and knowledge of those who comprise social networks, came to the forefront.
Listed below are several respondents’ comments that illustrate the innovative practices that could become trends in the next few years:
• Action learning tied to strategic imperatives• Connected learning – very different than e-learning• In-Market activities that benchmark like and dissimilar best practices of competing
and non-competing companies• Theater presentations of concepts to a target group• Business simulation competitions, closely customized to the realities of the actual
business• More executive training topics, course durations, coaching lengths and a variety of
training methods to ensure executive development is a “holistic approach”.• Sounding Board – executives are given access to a “strategic thought partner”
who acts as a sounding board on any issue. The executive uses the information to further his/her thinking.
• Targeted development for newly hired executives—executive on-boarding• Community service programs which take executives out of their “comfort zone” and
encourages volunteerism and teamwork• Systematic and scheduled senior executive involvement in driving quality talent
development, review and feedback processes• Mentoring and coaching—when done effectively
Of course the standard methods of development such as custom-designed executive development, university executive education, action learning and coaching were also heavily emphasized even though they are not considered new.
41 | PageCopyright © 2011 by Pearson Education, Inc. or its affiliate(s). All rights reserved. Pearson are trademarks in the U.S. and/or other countries, of Pearson Education, Inc. or its affiliate(s). 8047 07/11
Conclusions
What Has Changed? What Hasn’t Changed?The need to increase bench strength (i.e., succession planning). This was the key finding in our 2009 study. Again, in our 2011 study, our respondents cited the importance of being proactive in accelerating the development of both high potentials and emerging leaders. Survey participants emphasized the need for clear succession plans, and a well-developed bench in light of the high percentage of executives who plan to retire in the next five to ten years. Unfortunately, in our 2011 study, we see a dis-connect between what respondents are citing as critical and their executing on those same imperatives (more on this when we share our recommendations).
Similar to our 2009 study, senior executive judgments, performance reviews, talent review meetings and “perception” were again the most commonly cited rating strategies used for determining who the high potential and emerging leaders are. What’s different, in our 2011 study, however, are respondents’ admitting the need to use more objective assessments in combination with perception-based assessments in order to calibrate performance, potential to assume other key roles, and readiness to assume those roles. The irony of this is that despite the overwhelming evidence in support of the use of more rigor and objectivity especially when estimating potential and readiness, most organizations continue to over-emphasize subjectivity and the use of current performance measures--which often have very little to do with predicting likely future performance in more challenging and difficult roles.
Understandably, organizations continue to deploy different developmental approaches based on level. For top executives and vice presidents we continue to see the use of executive coaching as the number one development strategy. Coaching is highly targeted, individual and personal and highly regarded by executives at these levels. The use of custom-designed programs provided by external vendors and internal staff continue to be popular methods for developing executives. For vice president’s and high potentials, we continue to see the use of developmental job assignments and internal custom programs as popular methods for development, followed by mentoring and coaching.
The singular most significant change in our 2011 report is that Critical Thinking has supplanted Leadership as the number one topic anticipated for the next two to three years. This is significant since Leadership has been number one in our Trends in Executive Development Report for 25 years. Leadership is now number two, followed by strategy (which has consistently appeared since 2000), and “leading the next generation”, which is new to the list. Our respondents consistently identified critical thinking as a key foundation skill for executing effective decisions, problem solving, creative thinking and strategic thinking. Clearly, both the pace and complexity of business and the rate of change require executives to have heightened ability in recognizing assumptions, evaluating arguments, and drawing clear and valid conclusions—certainly more so than in years past. Jim Bolt, EDA founder and current CEO of the FrED Forum, emphasized the following evaluation:

42 | PageCopyright © 2011 by Pearson Education, Inc. or its affiliate(s). All rights reserved.
Pearson are trademarks in the U.S. and/or other countries, of Pearson Education, Inc. or its affiliate(s). 8047 07/11
“ The most striking result for the 2011 EDA Trends Survey is, I believe for the first time, Leadership is not seen as the #1 topic that will be included in executive development efforts over the next few years. In past surveys Leadership has not only been the top ranked topic but has been considerably higher rated than anything else. Yet, this year, and for the first time, capabilities related to critical and strategic thinking are rated first”.
Finally, we are continuing to see positive change in the way executive development is measured and evaluated. One reason for this is the almost universal acceptance of the Kirkpatrick Model as a methodology for evaluating the impact of executive development programs. While progress has been made, there are still discrepancies that exist between positive intent and execution.
As always, we are a stickler for practicality. Therefore, we hope that you will be able to put the information in this report to immediate use in your organization. We have listed below what we call our “20-2020” (20 leadership development components that will drive success for any organization through the year 2020)—based on our extensive experience and working with organizations across the Globe—that will help you drive more effective executive (and future leader) development in your organization:
1. Promote leaders and identifying future leaders and putting them into the leadership pipeline based upon the relevant competencies required for success.
2. Identify at least 2 candidates who are “ready now” and 2 “future” candidates for each mission critical role throughout the organization
3. Promote “top shelf” executive talent which is vetted using multi-method executive assessment
4. Reduce “top shelf” executive talent turnover with thorough onboarding when an executive takes on a new position and by having regular career and development discussions to ensure that each high performer is properly challenged and utilized.
5. Establish a succession management process that is perceived to be fair.6. Insist on a succession management process and tools that are “user friendly”.7. Effectively and correctly identifying high potential and emerging leaders using
multi-method executive assessment.8. Implement talent review meetings that effectively integrate performance,
objective assessment data, potential, and readiness information.9. Conduct talent review meetings that accurately calibrate a candidate’s potential
and readiness based on integrated diagnostic information.10. Ensure that talent review meetings include isolating development plans for
successors and high potentials.11. Include talent review meetings that focus on leveraging diversity and setting
development plans/goals for minority successors.
Recommendations for Your
Organization

43 | PageCopyright © 2011 by Pearson Education, Inc. or its affiliate(s). All rights reserved. Pearson are trademarks in the U.S. and/or other countries, of Pearson Education, Inc. or its affiliate(s). 8047 07/11
12. Ensure that senior management that is involved and supports executive development and succession management processes.
13. Determine that executive development programs and coaching that are linked to the overall strategy and the company as well as the leadership competencies required for success now, and into the future—based on current and anticipated market conditions and resulting business strategy.
14. Set executive development programs and coaching goals that are linked to objective assessment results.
15. Drive executive development programs that are multi-faceted (i.e., 70-20-10).16. Have executives and future leaders create Individual Development Plans (IDP’s)
based on a combination of subjective feedback from their manager, objective assessment results and results from succession planning meetings with the help of a coach.
17. Arrange for executives and future leaders to partner with their hiring executive in creating their IDP’s.
18. Create a way for executives to track their development progress/certify their knowledge and skills as they progress through development programs.
19. Have a personal passion and plan for ensuring that leadership development efforts do produce an effective return on investment.
20. Possess a passion and plan for ensuring that leadership development is a continuous process—not “event” driven.
Final Thoughts
We would like to make a few final recommendations based on the feedback from the 2011
Trends Survey:
• Diagnose. Use this report as your starting point to start diagnosing the strengths and needs of your executive development processes, tools and programs. of the next step after an initial comparison is to truly benchmark your companies programs and processes against those of others and calibrate your effectiveness.
• Benchmark and Create Action Plan: Once an initial Benchmark is established, develop a formal plan to increase overall effectiveness of your executive development processes and programs.
• Senior Leadership. Your senior executive team is critical to success—therefore, we recommend working sessions with this team to review survey results and discuss how your organization compares and contrasts with the key findings and best practices highlighted in this report.
• Connectedness. Align your executive development systems, strategy, plan, processes and tools with a concrete view of your organization’s future—including an understanding of current and anticipated market and business conditions, as well as the resulting business strategy, structure, role and leadership competencies required to drive success in your organization—now, and into the future.
• Calibrate and Re-Calibrate. Based on the leadership competencies required for success, passionately assess and calibrate your leader’s and future leader’s capability (“can do”), commitment (“will do”), and connectedness/alignment (“must do”) using well-constructed and valid performance reviews, 360-Degree assessments, and objective assessments to generate a more accurate view of performance, potential and readiness indicators.

44 | PageCopyright © 2011 by Pearson Education, Inc. or its affiliate(s). All rights reserved.
Pearson are trademarks in the U.S. and/or other countries, of Pearson Education, Inc. or its affiliate(s). 8047 07/11
• Leverage. Create targeted and specific Individual Development Plans (IDP’s) that enable leaders and future leaders to sustain their key strengths and capabilities but also address their development opportunities using 70-20-10.
• Succession Management. Adhere to the components listed above. Succession review meetings should be a powerful way for your organization to deploy executive talent (and future executive talent), however, there needs to be more open and honest discussion about candidates based on more objective performance, potential and readiness information.
• Mindset. The best predictor of Future Sustained Superior Performance (FSSP) is not past performance. If this represents the predominant mindset in your organization—we would predict a less than desirable future for your organization. Your mindset needs to be that FSSP is the result of a leaders current performance plus integrating objective and perception-based assessment results plus leveraging these results into specific and targeted IDP’s. Marshall Goldsmith has written and talked about this concept for years: “What Got You Here—Won’t Get You There”.
• Critical Thinking. Leaders and future leaders need to “raise the bar” in this area which our survey respondents identified as the number one leadership topic anticipated in the next 2-3 years.
• Generational Differences. Leaders and future leaders need to become more equipped to understand and work with different generations.
• Accountability and Measurement. Create accountability by tying executive development to the core leadership competencies and to executives’ annual performance measures. Also, establish and implement individual and business metrics that you can correlate with your executive development efforts and
outcomes and be passionate about reporting on these metrics quarterly.
How to Obtain This Research
The full industry report will be available for purchase at executivedevelopment.com. We will be presenting highlights of this research at webinars and other events throughout the coming year.
Benchmark Your Organization
If you are interested in benchmarking your organization against the best practices developed in this industry study, please contact us. Our Rapid Cycle DiagnosticSM and Advisory Council service will provide your organization with the data, recommendations, and strategic insights to determine the best course of action to maximize the efficiency and effectiveness of your executive development strategy.
For more information on our research and services, please contact Executive Development Associates at 866.EXEC.DEV.

45 | PageCopyright © 2011 by Pearson Education, Inc. or its affiliate(s). All rights reserved. Pearson are trademarks in the U.S. and/or other countries, of Pearson Education, Inc. or its affiliate(s). 8047 07/11
About Us
Executive Development Associates is a leader in creating custom-designed executive development strategies, systems and programs that help organizations build the capabilities needed to achieve their strategic objectives. Our specialty areas include:
1. Executive & High Potential Development
2. Executive Coaching
3. Executive Assessment
EDA leads the way in the use of executive development to help organizations successfully address their marketplace challenges and accelerate the execution of their business strategy. With our proven ability to achieve results we create measurable improvements in both individual executive performance and business outcomes.
Executive Development Associates 4 NE 10th, #171 Oklahoma City, OK 73104 - USA
Contact Information Toll Free: 866.EXEC.DEV (393.2338) Phone: 405.751.3300 Fax: 405.751.3313 [email protected] executivedevelopment.com
Pearson’s TalentLens publishes scientific assessments that are used globally to hire and develop the 21st century workforce. Our instruments measure critical thinking, problem solving, and a range of job skills to deliver data-driven insights that inform and clarify an organization’s human capital decisions. Learn more at TalentLens.com.
Pearson’s TalentLens19500 Bulverde Road San Antonio, TX 78259 USA
Contact InformationPhone: 888.298.6227 Fax: 800.232.1223TalentLens.com
Proprietary Notice
Copyright © 2009 Executive Development Associates and Pearson Education, Inc. or its associates. All rights reserved. Rapid Cycle Diagnostic SM is a registered trademark of Executive Development Associates. No materials from this study can be duplicated, copied, republished, or re-used without written permission from Executive Development Associates. The information and forecasts contained in this report reflect the research and studied opinions of Executive Development Associates and Pearson Assessments analysts.