2009 Ecommerce Benchmark Report - MarketingSherpa
23
Data for Ecommerce Marketers: 180 Charts & Tables 2009 Ecommerce Benchmark Report Note: This is an authorized excerpt from the full MarketingSherpa 2009 Ecommerce Benchmark and Report. To purchase and download the entire Report, go to: http://www.SherpaStore.com or call 877-895-1717 EXCERPT
Transcript of 2009 Ecommerce Benchmark Report - MarketingSherpa

Data for Ecommerce Marketers:180 Charts & Tables
2009EcommerceBenchmark Report
Note: This is an authorized excerpt from the full MarketingSherpa 2009 Ecommerce Benchmark and Report. To purchase and download the entire Report, go to: http://www.SherpaStore.com or call 877-895-1717
EXCERPT
MarketingSherpa’s 2009 EcommerceBenchmark ReportUS $197 / ISBN: 978-1-932353-93-8Copyright © 2009 by MarketingSherpa LLC
All rights reserved. No part of this report may be reproduced or transmitted in any form or by any means, electronic or mechanical, including photocopying, recording, faxing, emailing, posting online or by any information storage and retrieval system, without written permission from the Publisher.
To purchase additional copies of this report, please visit http://www.SherpaStore.com
Yes, bulk discounts are available for multiple copies. Contact:Customer ServiceMarketingSherpa LLC+1 (877) 895-1717 (outside US, call +401-247-7655)[email protected] 499 Main StreetWarren, RI 02885 USA
Lead AuthorStefan Tornquist, Research Director
Contributing AuthorSergio Balegno, Senior Analyst
Tim McAtee, Senior Analyst
EditorsIrina Missiuro, Research Editor
MarketingSherpa 2009 Ecommerce Benchmark Report
3 © Copyright 2000–2009 MarketingSherp LLC. It is forbidden to copy this report in any manner.
For permissions contact [email protected]. For more copies, visit http://www.SherpaStore.com
Director’s Note Welcome to the 2009 edition of MarketingSherpa‟s Ecommerce Benchmark Report. It‟s been
two years since the last edition, and it‟s an understatement to say that much has changed. These
challenging times inspired us to examine areas of marketing where information and best
practices could drive new sales, attract new customers and quickly build brand. The goal of this
book is to provide practical benchmarks and guidelines to help you:
Raise shopper-to-buyer conversions
Lower shopping-cart abandonment rates
Budget for tactics that are working for your type of ecommerce business
Identify new initiatives in search, email or social media to move the needle
Measure success and evaluate opportunity with nearly 1,500 of your peers
As you work with the 180 charts, tables and graphs in this report, we hope you will benefit from
these highlights:
#1. Information and collective wisdom from 1,481 ecommerce marketers
Ecommerce marketers of every kind responded to our April survey, which may be the largest of
its kind. This logic-driven tool allowed us to optimize the kinds of information we received from
each respondent as we tried to explore their individual areas of expertise.
#2. Benchmark data through multiple lenses
Throughout this Report, we‟ve broken responses into at least four major groups; those selling
products vs. services and targeting consumers vs. businesses. In many areas, we‟ve isolated the
data in other ways, such as company size or organizational attitudes.
#3. Lessons of the “Highly Knowledgeable”
In online sales & marketing, knowledge is power. Some organizations are further along in
implementing advanced web analytics and marketing automation…and we‟ve separated out their
responses to discover what‟s important to learn from their experience.
We hope this Report arms you for the year ahead, which promises to be just as interesting as the
year behind us. Whenever you find yourself wishing for a piece of data or an exploration of a
best practice, let us know by emailing us at Research (at) MarketingSherpa (dot) com. We want
you in the driver‟s seat.
Our best wishes for a growing and profitable 2009 and 2010.
Stefan Tornquist, Research Director

MarketingSherpa 2009 Ecommerce Benchmark Report
4 © Copyright 2000–2009 MarketingSherp LLC. It is forbidden to copy this report in any manner.
For permissions contact [email protected]. For more copies, visit http://www.SherpaStore.com
Executive Summary
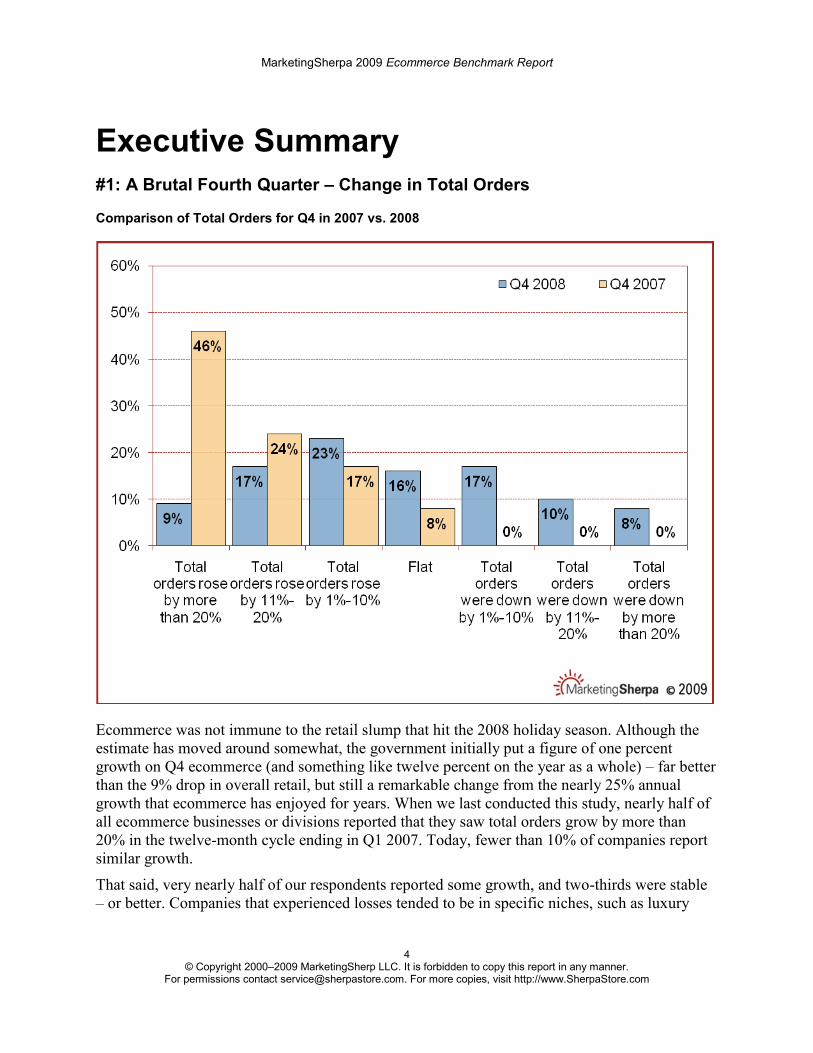
#1: A Brutal Fourth Quarter – Change in Total Orders
Comparison of Total Orders for Q4 in 2007 vs. 2008
Ecommerce was not immune to the retail slump that hit the 2008 holiday season. Although the
estimate has moved around somewhat, the government initially put a figure of one percent
growth on Q4 ecommerce (and something like twelve percent on the year as a whole) – far better
than the 9% drop in overall retail, but still a remarkable change from the nearly 25% annual
growth that ecommerce has enjoyed for years. When we last conducted this study, nearly half of
all ecommerce businesses or divisions reported that they saw total orders grow by more than
20% in the twelve-month cycle ending in Q1 2007. Today, fewer than 10% of companies report
similar growth.
That said, very nearly half of our respondents reported some growth, and two-thirds were stable
– or better. Companies that experienced losses tended to be in specific niches, such as luxury

MarketingSherpa 2009 Ecommerce Benchmark Report
5 © Copyright 2000–2009 MarketingSherp LLC. It is forbidden to copy this report in any manner.
For permissions contact [email protected]. For more copies, visit http://www.SherpaStore.com
goods and apparel. Looking forward, there‟s reason for optimism that ecommerce, at least, will
again enjoy significant growth by midyear.
Lost in the storm of the economic downturn is the natural maturation of ecommerce and the
slower growth that goes with it. Projections from early 2008 were already pegging ecommerce
growth to hover around 10% after a year or two around fifteen percent. Essentially, the downturn
has compressed that early period, and pushed us into modest but stable increases. To be sure,
traditional retail would be delighted with ten percent annual growth.
We‟ll spend the rest of this report looking at ways to take advantage of that growth.
#2: Assertive Marketing & Optimism – Especially from SMBs
Budget Attitudes by Product Type & Organization Size
Companies using ecommerce are taking a more aggressive stance toward budgeting through the
downturn than the business world as a whole. Compared to a general business sample researched
by MarketingSherpa, the ecommerce segment is 30% more likely to describe its attitude as
„aggressive‟ or simply „normal.‟ Like the broader business world, however, large companies
(over $50MM in annual revenues) are more likely to take a cautious or even pessimistic view.
MarketingSherpa 2009 Ecommerce Benchmark Report
6 © Copyright 2000–2009 MarketingSherp LLC. It is forbidden to copy this report in any manner.
For permissions contact [email protected]. For more copies, visit http://www.SherpaStore.com
History suggests that companies which invest in their brand and market presence emerge from
down economies in a stronger position than those who choose to pull back. In some respects, a
recession creates conditions which favor companies that choose to invest.
Competition tends to be less aggressive. With most budgets (or at least most large
budgets) being scaled back, there‟s room for mid-sized companies to improve their
position against market leaders.
Brand impressions are cheap, in every medium. Except for certain hyper-niche trade
publications, space has never been cheaper. Whether it‟s online or in print or broadcast,
now is a great time for companies to make themselves known. For those in a position to
lock-in campaigns over the long term, current savings can be extended into the future as
well.
Likewise, talent is at a discount. Whether it‟s brining new people in-house as employees
or contractors, or simply reworking vendor relationships, there‟s an excess of talent
available for the first time since the tech bubble burst.
Finally, downturns create the fear of bankruptcy and broken supply chains. It‟s important
to project stability and health to current and potential customers. One way to do that is
through brand and PR spending. Not only will you stake a larger claim thanks to bargain
CPMs, but you‟ll benefit from implicit financial strength.
#3: Abandonment is Down… Why?
Top Methods of Reducing Shopping-Cart Abandonment – Analyst & Marketer Views
Ranking
Analysts Marketers
Usability - making the cart work more easily 1 1
Optimizing product pages 2 4
Reducing price “surprises” 3 2
Identifying volume/time-based discounts/special offers 4 3
Perpetual shopping carts 5 6
Offering alternative payment options 6 7
Moving registration/offers to after the purchase 7 5
The downturn has created a short-term spike in abandonment rates, but that‟s an aberration in an
overall reduction since our last study. Although it depends somewhat on the type of targeted
customer, there‟s been real improvement, and we wanted to understand why. Above is a list of
some key best practices – explored at length in the report – with a ranking score given by a panel
of analysts who specialize in process and purchase optimization.
The two groups disagree somewhat, but the importance of all of these practices shouldn‟t get lost
in the competitive shuffle – they‟re all worth exploring and perfecting.

MarketingSherpa 2009 Ecommerce Benchmark Report
7 © Copyright 2000–2009 MarketingSherp LLC. It is forbidden to copy this report in any manner.
For permissions contact [email protected]. For more copies, visit http://www.SherpaStore.com
#4: Social Media is Here, But…
Low-Cost Traffic Sources Compared
There‟s no doubt that social media is an immensely important trend or perhaps even a sea change
in how we buy, sell and communicate. Still, the chart above puts the role of social and Web 2.0
tactics in some kind of perspective when compared to search engine optimization and tried-but-
true house email. For the time being, the main drivers of traffic are the known quantities of SEM
(free and paid), email and display.
Still, companies that dismiss social tactics on this basis will be left behind. Social media is
essentially a set of technologies and practices that enable the oldest and most powerful marketing
there is – word of mouth. In the long term, social media may have a positive effect on margins
by rewarding sellers for qualities beyond price, such as customer service, on-time delivery, social
awareness and the like. In the short term, it makes sense for companies to build an expertise and
social presence while consumers and business people are still in the process of building their
networks. Like the early days of email, it‟s probably a lot easier to make a name on Twitter or
Facebook today than it will be in five years.

MarketingSherpa 2009 Ecommerce Benchmark Report
8 © Copyright 2000–2009 MarketingSherp LLC. It is forbidden to copy this report in any manner.
For permissions contact [email protected]. For more copies, visit http://www.SherpaStore.com
#5: Social Tactics Role Varies by Organization
Large Companies Rate Effectiveness of Social Tactics
For many, social marketing efforts are in their early stages, but exciting things are happening.
Those marketers who report the best results with newer tactics tend to be those who also have
expertise in the more „traditional‟ aspects of online marketing and are marrying the old and new.
Above, we see how companies generating more than $50MM in revenue see the effectiveness of
social and Web 2.0 tactics (which are explored in more detail later in the report). Amazingly, the
new phenomenon of Twitter is already competing with more established media, as is the use of
social site profiles. Interestingly, large companies rate both tactics more highly than some
smaller competitors. It may be that marketers relish the flexibility and responsiveness of social
tactics in the context of the typically slow-moving marketing processes of large companies.
It‟s important to understand how we measure success for these emergent tactics. The history of
online marketing is the story of an ongoing dispute about which measures are important and how
we count them. At this stage, most marketers rate social tactics as being better for the more
abstract roles of building brand awareness and enhancing/influencing brand reputation. In fact,
when we asked marketers how social media matched up with common goals, generating leads
and increasing online sales were at the bottom of the list.
The danger is that we may miss the larger, tangible impact of social efforts if we insist on hard
numbers before putting in place the kinds of tools that can truly measure them. Online display

MarketingSherpa 2009 Ecommerce Benchmark Report
9 © Copyright 2000–2009 MarketingSherp LLC. It is forbidden to copy this report in any manner.
For permissions contact [email protected]. For more copies, visit http://www.SherpaStore.com
advertising has suffered because banners don‟t generate many clicks. But this is an example of
the wrong measure being applied. Banner ads are branding mechanisms, not true direct response
tools, but they are judged on that basis. Similarly, if we look for immediate clicks from social
media efforts, we will be missing most of their impact.
#6: What We Don’t Know Can Hurt Us
Accuracy of Knowledge of Paid Search Conversion Rates by Company Focus & Size
With everything facing marketers today – reduced budgets, smaller teams, expanding
responsibilities – it‟s easy to lose sight of the importance of measurement and tracking. Some
may even actively avoid measurement for fear of having inefficient marketing spend exposed.
Above, we see that even in the high ROI world of paid search marketing, many companies are
ignorant of essential metrics – only 41% of B2B ecommerce companies know their paid search
conversion rates exactly. And although having a „general idea‟ is better than having none, it
creates room for error in what can be the most efficient arena for marketing today.
But search marketing is only one area of ecommerce marketing where the argument for accurate
measurement has never been stronger. Websites play an ever increasing role in consumer and
business purchases, even for those companies that generate the bulk of their revenue through
offline sales. That means that we have an opportunity to observe how our customers and
prospects view, research and buy our products and services. The only way to do this successfully

MarketingSherpa 2009 Ecommerce Benchmark Report
10 © Copyright 2000–2009 MarketingSherp LLC. It is forbidden to copy this report in any manner.
For permissions contact [email protected]. For more copies, visit http://www.SherpaStore.com
over the long term is through analytics. With each innovation in media and technology, customer
behavior gets more nuanced, but the need for tracking doesn‟t diminish.
With compressed margins and international competition, selling online is a business where a few
percentage points mean the difference between profit and loss. The companies (and individual
marketers) who will thrive in ecommerce over the long haul are those that truly understand
what‟s happening under the hood of their marketing and their businesses.
#7: It’s Not All About Price
Consumer Products Marketers Rate Engagement & Sales Tactics
In lean economic times it‟s natural for consumers to place a great emphasis on price, and
retailers have implemented drastic price reductions to maintain cash flow and clear shelves. Even
so, there are tactics and tools which can increase revenues without further decreasing slim
margins. First among these is generating the perception of scarcity through limited
time/inventory promotions, which are no less effective online that they have been for centuries in
the marketplace. That speaks to some measure of brand loyalty to ecommerce sites, since another
source for products is often just a search away. In that vein, loyalty programs also get good
marks. Points, miles and accumulated discounts tend to have a greater psychological power than

MarketingSherpa 2009 Ecommerce Benchmark Report
11 © Copyright 2000–2009 MarketingSherp LLC. It is forbidden to copy this report in any manner.
For permissions contact [email protected]. For more copies, visit http://www.SherpaStore.com
their monetary value would suggest. After all, “3,000 awards miles” sounds lot better than $30 in
real-world dollars.
But the presentation and information around products are also powerful variables, and ones that
can be affected without cutting prices or implementing expensive and complicated membership
programs. 74% of respondents who have implemented consumer reviews (and/or ratings) report
that they are an effective way of increasing sales and engagement. A similar number endorse the
implementation of product videos, which can tell a story more powerfully than any product page
or list of features can.
Interactive, dynamic ecommerce sites are a far cry from the static online stores of a decade ago.
It‟s now possible to create a truly enjoyable and unique online shopping experience and,
therefore, much easier to build loyalty and brand affection. Price will always be a major factor in
the buying process, but the increasingly interconnected world of consumer and business shopper
is evolving. We‟re headed for an online marketplace where investments in customer service and
customer experience are rewarded by the opinion of the masses and the dollars of the individual.

TABLE OF CONTENTS
Table of Contents ......................................................................... ii
Introduction .................................................................................. 2
Executive Summary .................................................................... 3
#1: A Brutal Fourth Quarter – Change in Total Orders ........ 3
Comparison of Total Orders for Q4 in 2007 vs. 2008 .... 3
#2: Assertive Marketing & Optimism – Especially
from SMBs Budget Attitudes by Product Type & ........... Organization Size ............................................................ 4
#3: Abandonment is Down…Why?...................................... 5
Top Methods of Reducing Shopping Cart Abandonment – Analyst & Marketer Views ........................................... 5
#4: Social Media is Here, But…............................................ 6
Low Cost Traffic Sources Compared .............................. 6
#5: Social Tactics Role Varies by Organization .................... 7
Large Companies Rate Effectiveness of Social Tactics . 7
#6: What We Don’t Know Can Hurt Us ................................ 8
Accuracy of Knowledge of Paid Search Conversion ..... Rates by Company Focus & Size ................................... 8
#7: It’s Not All About Price .................................................... 9
Consumer Products Marketers Rate Engagement
& Sales Tactics ................................................................. 9
Section 1: Ecommerce Industry Trends & Benchmarks .........................................................................11
1.01 Government Data Confirms Slowing Growth ............11
1.02 Order Growth Slowed ................................................. 12
1.03 How Economic Uncertainty is Affecting Marketing
Budgets 9/2008 ................................................................... 13
1.04 Marketing Budget Cuts, Q4 2008
(B-to-B vs. B-to-C) ............................................................... 14
1.05 Marketing Budget Cuts, Q4 2008
(by Size of Organization) .................................................... 14
1.06 Observed Impact of Economy on Large Orgs .......... 15
1.07 Shift #1 – From Brand to Direct .................................. 16
1.08 Shift #2 – From Traditional to Online ......................... 17
1.09 Attitudes toward Marketing Spend – B2B ................. 18
1.10 Attitudes toward Marketing Spend – B2C ..................19
1.11 Attitudes toward Marketing Spend – Large Orgs. (Over $50MM) .................................................................................19
1.12 Marketing Department Staffing – B2B ....................... 20
1.13 Marketing Department Staffing – B2C ....................... 21
1.14 Marketing Department Staffing – Large Orgs. (Over .. $50MM) ................................................................................ 21
Challenges to Ecommerce ......................................... 22
1.15 Business Products ....................................................... 22
1.16 Business Services........................................................ 23
1.17 Consumer Products..................................................... 24
1.18 Consumers Services ................................................... 25
1.19 “High Knowledge” Organizations .............................. 26
Business Products Companies ............................... 27
1.20 Change in Orders 2008 vs. 2007 ................................ 27
1.21 Change in Q4 Shopping Cart Size 2008 .................... 28
1.22 Percentage of Repeat Customers............................... 28
1.23 Charge-Back Rate ........................................................ 29
1.24 Return Rate .................................................................. 30
1.25 Marketing Expense Percentage ................................. 30
1.26 Marketing Tactics’ Place in Budget............................. 31
Business Services Companies ................................ 32
1.27 Percentage of Repeat Customers............................... 32
1.28 Charge-Back Rate ........................................................ 32
1.29 Return Rate .................................................................. 33
1.30 Marketing Expense Percentage ................................. 34
1.31 Marketing Tactics’ Place in Budget............................. 34
Consumer Products Companies ............................ 35
1.32 Change in Orders 2008 vs. 2007 ................................ 35
1.33 Change in Q4 Shopping Cart Size 2008 .................... 36
1.34 Percentage of Repeat Customers............................... 37
1.35 Charge-Back Rate ........................................................ 37
1.36 Return Rate .................................................................. 38
1.37 Marketing Expense Percentage ................................. 38
1.38 Marketing Tactics’ Place in Budget............................. 39
Consumer Services Companies ............................. 40
1.39 Percentage of Repeat Customers............................... 40
1.40 Charge-Back Rate ........................................................ 40
1.41 Return Rate .................................................................. 41
1.42 Marketing Expense Percentage ................................. 41
1.43 Marketing Tactics’ Place in Budget............................. 42
Large Organizations (Over $50MM in Sales) . 43
1.44 Percentage of Repeat Customers............................... 43
1.45 Shopping Cart Abandonment Rate ............................ 43
1.46 Charge-Back Rate ........................................................ 44
1.47 Return Rate .................................................................. 44
1.48 Marketing Expense Percentage ................................. 45
1.49 Marketing Tactics’ Place in Budget............................. 45
Tracking Financial Metrics ........................................ 46
1.50 Customer Lifetime Value – B2B .................................. 46
1.51 Cost of Obtaining Customer – B2B ............................ 46
1.52 Cost of Retaining Customer – B2B ............................. 47
1.53 Shopping Cart Abandonment – B2B .......................... 47
1.54 Customer Lifetime Value – B2C .................................. 48
1.55 Cost of Obtaining Customer – B2C ............................ 49
1.56 Cost of Retaining Customer – B2C ............................. 49
1.57 Shopping Cart Abandonment – B2C .......................... 50
Offline Commerce Metrics ........................................ 51
1.58 Percentage of Repeat Customers – Offline
Companies .......................................................................... 51
1.59 Charge-Backs as a Percentage of Total Orders – Offline Companies .......................................................................... 51
1.60 Returns as % of Total Sales – Offline Companies...... 52
1.61 Marketing Costs as % of Total Revenue – Offline
Companies .......................................................................... 52
1.62 Fourth Quarter Revenue Comparison 2007 vs. 2008 .. – Offline Companies ........................................................... 53
Section 2: Ecommerce Sites & Metrics ............ 54
2.01 Sources of New Website Visitors ............................... 54
Website Tactics & Tests ................................................ 55
2.02 Consumer Website Tactics Usage & Efficacy ............ 55
2.03 Shopping Cart Tests .................................................... 56
Cart Abandonment ......................................................... 57
2.04 Reducing Abandonment – Two Views ....................... 57
2.05 Shopping Cart Abandonment – B2B ......................... 58
2.06 Shopping Cart Abandonment – B2C ......................... 58
2.07 Shopping Cart Abandonment Rate – Business Products Companies .......................................................................... 59
2.08 Shopping Cart Abandonment Rate – Business Services Companies .......................................................................... 59
2.09 Shopping Cart Abandonment Rate – Consumer ......... Products Companies........................................................... 60
2.10 Shopping Cart Abandonment Rate – Consumer ......... Services Companies ........................................................... 60
Tools & Promotions ....................................................... 61
2.11 Business Products ....................................................... 61
2.12 Business Services ....................................................... 62
2.13 Consumer Products .................................................... 63
2.14 Consumer Services ..................................................... 64
2.15 Site Management & Marketing in B2C Products...... 65
2.16 Site Management & Marketing in B2C Services ...... 66
2.17 Recommended Test Variables ..................................... 67
Section 3: Marketing Tactics & Testing ............. 68
3.01 How Marketing Tactics Are Managed – B2B .............. 68
3.02 How Marketing Tactics Are Managed – B2C ............. 68
3.03 How Marketing Tactics are Managed – Large Orgs. .... (Over $50MM) ..................................................................... 68
Tactics Compared – Free Media ............................. 69
3.04 Business Products....................................................... 69
3.05 Business Services ....................................................... 70
3.06 Consumer Products .................................................... 71
3.07 Consumer Services ..................................................... 72
3.08 “High Knowledge” Organizations .................................... 73
3.09 Large Organizations (Over $50MM) .......................... 74
Tactics Compared – Paid Media ............................. 75
3.10 Business Products ....................................................... 75
3.11 Business Services ........................................................ 76
3.12 Consumer Products .................................................... 77
3.13 Consumer Services ..................................................... 77
3.14 “High Knowledge” Organizations ............................. 78
Tests Compared ................................................................ 79
3.15 Business Products ....................................................... 79
3.16 Business Services ....................................................... 79
3.17 Consumer Products .................................................... 80
3.18 Consumer Services ..................................................... 80
3.19 “High Knowledge” Organizations ............................. 81
Affiliates ............................................................................... 82
3.20 Affiliate Revenues – Consumer Products .................. 82
3.21 Affiliate Revenues – Consumer Services .................. 83
3.22 Merchant SEM Policies – 2009 vs. 2007 .................... 84
3.23 Attracting & Empowering Affiliates – Consumer
Products ............................................................................... 85
3.24 Attracting & Empowering Affiliates – Consumer
Services ................................................................................ 86
3.25 Affiliate Challenges ..................................................... 87
3.26 Monitoring Affiliate Email .......................................... 88
Email Tactics ....................................................................... 89
3.27 Offer Benefits to Encourage Consumer Opt-ins ....... 89
3.28 Business Products....................................................... 90
3.29 Business Services ....................................................... 91
3.30 Consumer Products .................................................... 92
3.31 Consumer Services ..................................................... 93
3.32 “High Knowledge” Organizations ............................. 94
3.33 Emailed Coupons – Use in Online Stores ................. 95
3.34 Emailed Coupons – Offline Use ................................. 96
3.35 Types of Online Coupons ............................................ 97
3.36 Coupon Redemption Rates ........................................ 98
Offline Tactics ......................................................................... 99
3.37 Tactics Compared – Business Products ..................... 99
3.38 Tactics Compared – Business Services ...................... 99
3.39 Tactics Compared – Consumer Products ................. 100
3.40 Tactics Compared – Consumer Services ................. 100
Search... .................................................................................101

3.41 Online Budget vs. % Spent on PPC ..........................101
3.42 Paid Search Conversion Rates vs. Average ............ 102
3.43 Natural Search Conversion Rates vs. Paid .............. 103
3.44 Google CPC - B-to-C Direct Ecommerce vs. Lead... 104
3.45 CPC by Keyword Type - B-to-C Direct Ecommerce . 105
3.46 Agency Pros Rank SEM Challenges ........................ 106
3.47 Search Marketing Practices – 2007 vs. 2009 ........... 107
3.58 SEM Practices – B2B ................................................. 108
3.49 SEM Practices – B2C ................................................. 109
3.50 SEM Practices – Large Orgs ......................................110
3.51 SEM Practices – “High Knowledge” Orgs. ............... 111
3.52 Effect on Brand Recall Among Ad Exposed
Searchers ............................................................................112
3.53 Effect on Brand Favorability Among Ad
Exposed Searchers ............................................................113
3.54 Effect on Purchase Intent Among Ad
Exposed Searchers ............................................................114
3.55 ROI of Geo-targeting .................................................115
Social Media & Web 2.0 .............................................116
3.56 Marketers Agree (or Disagree) that Social Media
Will... ..................................................................................116
3.57 How Effective is Social Media Marketing and
PR at Accomplishing These Goals ....................................117
3.58 Tactics Compared – Business Products ....................118
3.59 Tactics Compared – Business Services .....................119
3.60 Tactics Compared – Consumer Products ................. 120
3.61 Tactics Compared – Consumer Services ................. 121
3.62 Tactics Compared – Large Orgs. (Over $50MM) ..... 122
3.63 Tactics Compared – “High Knowledge” Orgs. ........ 123
3.64 Recommended Metrics to Track ............................... 124
Section 4: Conversion Rates ......................125
4.01 Conversion: One Metric with Many Definitions ..... 125
Tracking Marketing Statistics .................................................. 126
4.02 Paid Search Conversion Rates – B2B ...................... 126
4.03 House Email Offer Conversion Rates – B2B ........... 127
4.04 Paid Search Conversion Rates – B2C ...................... 127
4.05 House Email Offer Conversion Rates – B2C ........... 128
Business Products ................................................................... 129
4.06 Paid Search Conversion ........................................... 129
4.07 Natural Search Conversion ...................................... 129
4.08 House Email Conversion .......................................... 130
4.09 3rd Party Email Conversion ..................................... 130
Business Services .................................................................... 131
4.10 Paid Search Conversion ............................................ 131
4.11 Natural Search Conversion ....................................... 131
4.12 House Email Conversion .......................................... 132
4.13 3rd Party Email Conversion ..................................... 132
Consumer Products ..................................................... 133
4.14 Paid Search Conversion............................................ 133
4.15 Natural Search Conversion ...................................... 133
4.16 Comparison Shopping Engines ............................... 134
4.17 House Email Conversion .......................................... 134
4.18 3rd Party Email Conversion ..................................... 135
4.19 Affiliate Conversion................................................... 135
Consumer Services ...................................................... 136
4.20 Paid Search Conversion ........................................... 136
4.21 Natural Search Conversion ...................................... 136
4.22 Comparison Shopping Engines ............................... 137
4.23 House Email Conversion .......................................... 137
4.24 3rd Party Email Conversion ..................................... 138
4.25 Affiliate Conversion .................................................. 138
“High Knowledge” Organizations ...................... 139
4.26 Paid Search Conversion ........................................... 139
4.27 Natural Search Conversion ...................................... 139
4.28 Comparison Shopping Engines ............................... 140
4.29 House Email Conversion .......................................... 140
4.30 3rd Party Email Conversion ..................................... 141
4.31 Affiliate Conversion .................................................. 141
Glossary of Terms .......................................................... 142
Research Partners ......................................................... 155
Appendix: Demographic Profile of Survey Respondents ..................................................................... 156
A1.01 Revenue of Respondent Organizations ................. 156
A1.02 Online/Offline Profile .............................................. 156
A1.03 Respondent Product Types ..................................... 157
A1.04 Respondent Sales Channels .................................. 157
A1.05 Size of Respondent Marketing Departments ........ 159
To Dos... ................................................................................ 160
First email my PDF copy to:
Then mail my printed copy to:
Name Title
Organization
Address
City State/Prov Country Zip/Postal
Phone(incaseofquestions)
Chargemy:MasterCardVisa AMEX
Card# Exp.Date
PrintCardholderName
Signature
ORBillMe* CheckEnclosedtoMarketingSherpaLLC
*Billing:IunderstandIwillnotreceivetheGuidesuntilpaymentisreceived
(werespectyourprivacy)
About
PraisedbyTheEconomist,HarvardBusinessSchool’sWorkingKnowledgeSite,andEntrepreneur.com,MarketingSherpaisaresearchfirmpublishingbenchmarkdataandhow-toguidanceformarketingprofessionals.
237,000marketersreadourexclusiveCaseStudynewsletterseveryweek,andthousandsattendourannualSummitsonemail,subscriptionsales,andb-to-bmarketing.
100%SATISfACTIONGuARANTEE
MarketingSherpaguaranteesyoursatisfaction.Ifanythingweselldoesn’tmeetyoursatisfaction,returnitfora100%hassle-freerefundimmediately!
MarketingSherpaLLC499MainStreet,Warren,RI,02885Phone:877-895-1717(ifoutsidetheuScall401-247-7655)fax:(401)247-1255
2009 Ecommerce Benchmark Report includes:
• 180charts,tablesandgraphs
• Primaryresearchfrom1,481ecommercemarketers
• Benchmarkdataanalyzedthroughmultiplelenses
• ComparisonofMarketingtacticsandhowtheytest
• MetricsforconsumerandB2Becommercesitesof varyingsizes
Yes! I want to increase my shopper-to-buyer conversions. My order is risk-free because it’s covered by MarketingSherpa’s 100% satisfaction guarantee.
PDF Only $197
Fax form to: (401) 247-1255
Fax form to: (401) 247-1255
Practical ecommerce data to help you improve your shopper-to-buyer conversions
ISBN:978-1-932353-93-8