109228 Contemporary Issues in Development Economics 0415251362
250
-
Upload
zainal-wiryawan -
Category
Documents
-
view
33 -
download
3
Transcript of 109228 Contemporary Issues in Development Economics 0415251362


R E C T O RU N N I N G H E A D
Contemporary Issues in DevelopmentEconomics
This new collection of articles puts the very latest issues in economic develop-ment under the microscope, exploring them from a variety of perspectives.
Beginning with an assessment of the current state of play in development,the authors move forward to examine neglected issues such as human develop-ment, gender, brain drain, military expenditure and post-colonial theory.While analysing the problems of external debts, technology transfer and newtheories of international trade, the relationship between developing anddeveloped economies is fully explored. The book also examines the importanttopics of financial reform, structural adjustments and the role of the IMF inthe new financial architecture.
The highly respected contributors subject these critical issues to thoroughanalysis with suggestions towards resolving some of these problems, makingthis an indispensable book that researchers and students of developmenteconomics cannot afford to miss.
B.N. Ghosh is Professor of Economics at the University of Science, Malaysia.He is also Director (Hon.) of the Centre for the Study of Human Develop-ment, Leeds, England and Editor of the International Journal of HumanDevelopment. B.N. Ghosh is the editor and author of several books, includingGlobal Financial Crises and Reforms: Cases and Caveats, also published byRoutledge.

Routledge studies in development economics
1 Economic Development in the Middle East
Rodney Wilson
2 Monetary and Financial Policies in Developing Countries
Growth and stabilizationAkhtar Hossain and Anis Chowdhury
3 New Directions in Development Economics
Growth, environmental concerns and government in the 1990sEdited by Mats Lundahl and Benno J. Ndulu
4 Financial Liberalization and Investment
Kanhaya L. Gupta and Robert Lensink
5 Liberalization in the Developing World
Institutional and economic changes in Latin America, Africa and AsiaEdited by Alex E. Fernández Jilberto and André Mommen
6 Financial Development and Economic Growth
Theory and experiences from developing countriesEdited by Niels Hermes and Robert Lensink
7 The South African Economy
Macroeconomic prospects for the medium termFinn Tarp and Peter Brixen
8 Public Sector Pay and Adjustment
Lessons from five countriesEdited by Christopher Colclough
9 Europe and Economic Reform in Africa
Structural adjustment and economic diplomacyObed O. Mailafia

10 Post-Apartheid Southern Africa
Economic challenges and policies for the futureEdited by Lennart Petersson
11 Financial Integration and Development
Liberalization and reform in Sub-Saharan AfricaErnest Aryeetey and Machiko Nissanke
12 Regionalization and Globalization in the Modern World Economy
Perspectives on the Third World and transitional economiesEdited by Alex F. Fernández Jilberto and André Mommen
13 The African Economy
Policy, institutions and the futureSteve Kayizzi-Mugerwa
14 Recovery from Armed Conflict in Developing Countries
Edited by Geoff Harris
15 Small Enterprises and Economic Development
The dynamics of micro and small enterprisesCarl Liedholm and Donald C. Mead
16 The World Bank
New agendas in a changing worldMichelle Miller-Adams
17 Development Policy in the Twenty-First Century
Beyond the post-Washington consensusBen Fine, Costas Lapavitsas and Jonathan Pincus
18 State-Owned Enterprises in the Middle East and North Africa
Privatization, performance and reformEdited by Merih Celasun
19 Finance and Trade in Developing Countries
Edited by Rohinton Medhora
20 Contemporary Issues in Development Economics
Edited by B.N. Ghosh
21 Mexico Beyond NAFTA
Edited by Martín Puchet Anyul and Lionello F. Punzo


Contemporary Issues inDevelopment Economics
Edited byB.N. Ghosh
London and New York

First published 2001by Routledge11 New Fetter Lane, London EC4P 4EE
Simultaneously published in the USA and Canadaby Routledge29 West 35th Street, New York, NY 10001
Routledge is an imprint of the Taylor & Francis Group
© 2001 Selection and editorial matter B.N. Ghosh; individual chapters© 2001 the contributors
All rights reserved. No part of this book may be reprinted orreproduced or utilised in any form or by any electronic, mechanical,or other means, now known or hereafter invented, includingphotocopying and recording, or in any information storage or retrievalsystem, without permission in writing from the publishers.
British Library Cataloguing in Publication DataA catalogue record for this book is available from the British Library
Library of Congress Cataloging-in-Publication DataContemporary issues in development economics / edited by B.N. Ghosh.
p. cm. -- (Routledge studies in development economics ; 20)Includes bibliographical references and index.1. Economic development. I. Ghosh, B.N. II. Series
HD82 .C574825 2001338.9--dc21 00–045950
ISBN 0-415-25136-2
This edition published in the Taylor and Francis e-Library, 2005.
“To purchase your own copy of this or any of Taylor & Francis or Routledge’scollection of thousands of eBooks please go to www.eBookstore.tandf.co.uk.”
ISBN 0-203-99612-7 Master e-book ISBN
(Print Edtion)

Contents
List of tables ixList of figures xiNotes on contributors xiiPrefatory note xivIntroduction xv
1 Development in development economics 1B.N. GHOSH
2 Human development, military expenditure and social wellbeing 16MASUDUL ALAM CHOUDHURY
3 The problem of brain drain 40B.N. GHOSH AND RAMA GHOSH
4 Gender and development: transforming the process 57GALE SUMMERFIELD
5 Food security in developing countries 70RANDY STRINGER
6 External debt, government expenditure, investment and growth 105G.S. GUPTA
7 The pure theory of international trade, globalization,growth and sustainable development: agenda for the future 119M.R. AGGARWAL
viii Contents
8 Knowledge, technology transfer and multinational corporations 136SHANKARAN NAMBIAR
9 The International Monetary Fund: functions, financial crises and future relevance 154GEORGE KADMOS AND PHILLIP ANTHONY O’HARA
10 Economic development and environmental problems 187JOHN ASAFU-ADJAYE
11 Globalization as Westernization: a post-colonial theory of global exploitation 211OZAY MEHMET
Index 224

Chapter Title ix
Tables
2.1 Some critical macroeconomic indicators for Indonesia 26
2.2 Various human development indices and theircomponents for Indonesia, 1995 28/29
2.3 Estimation of elasticities of HDI improvement to reduction in military expenditure, Middle Eastern HDI-countries, 1995 32
3.1 Income lost by India per emigrant 455.1 Per capita food supplies for direct human consumption 755.2 Per capita food supplies 76/775.3 Comparison of results of global cereals projections
to 2010 795.4 Relationship between arable land per person and
calories/per capita/day 805.5 Undernourished population by region and country 82/835.6 Food security related data in ten of the most improved
countries 845.7 Food security related data in twelve of the least
improved countries 855.8 Food security related data in ten of the most populated
countries 865.9 Returns to nutrition investments 976.1 External debt and debt indicators of developing
countries 1076.2 External debt, government expenditure, investment
and growth of large developing countries 110–1136.3 Variables and correlation coefficients 1167.1 Quantum of tariffs and non-tariff barriers (before and
after the Uruguay Round), 1988–1995 126

x List of tables
7.2 Quantum of tariffs (before and after the UruguayRound), 1988–1995 127
7.3 Regional free trade arrangements, share of world trade, 1994 129
7.4 Economic regional arrangements (1987–1990) bynumber of arrangements 129
7.5 Growth in regional trade agreements, 1940–1990 13010.1 Global economic trends, 1965–1997 18910.2 Real annual domestic product growth 18910.3 A selection of EKC studies 197

Chapter Title xi
Figures
2.1 Systemic interactions among agents, variables andtheir relations 20
2.2 Simulation of a social wellbeing function withHDI estimates 25
10.1 The Malthusian population model 18810.2 Gross domestic product and energy use in selected
Asian countries 19110.3 Life expectancy and energy use in selected Asian
countries 19210.4 A hypothetical EKC for sulphur dioxide 19310.5 Production possibilities frontier for market goods
and environmental services 19511.1 A model of exploitation on the IEs/EPZs 218

xii David Corkill
Contributors
M.R. Aggarwal is Professor of Economics, Department of Economics,Panjab University, Chandigarh, India. He was also the former Director ofthe Indian Council of Social Science Research (Northern Region).
John Asafu-Adjaye is Lecturer in the Department of Economics, Universityof Queensland, Brisbane, Australia. He has extensive working and con-sulting experience in Papua New Guinea, Brunei, Indonesia, Philippinesand China.
Masudul Alam Choudhury is Professor of Finance and Economics jointlywith the Department of Finance and Economics, King Fahd Universityof Petroleum and Minerals and the School of Business, the UniversityCollege of Cape Breton, Sydney, Nova Scotia, Canada. He is also theDirector of the Centre of Humanomics and the Editor of Humanomics.
B.N. Ghosh is Professor of Economics, School of Social Sciences, Universityof Science, Malaysia, 11800 Penang, Malaysia and former member of theSenate. He has provided short-term consultancies to various organisationsincluding the University Grants Commission and the United NationsDevelopment Programmes. Prof. Ghosh is the Director (Hon.) of theInstitute for the Study of Human Development at Leeds, England and theEditor of International Journal of Human Development.
Rama Ghosh is Lecturer in the Department of Economics, DAV College forMen, Sector 10–A, Chandigarh, India.
G.S. Gupta is Professor of Economics and Finance, Indian Institute ofManagement, Ahmedabad, India. He is a consultant to several organis-ations including Government of India, Reserve Bank of India, NationalAcademy of Administration, Resource Management Corporation (US)and International Cooperative Alliance, British Council.

Notes on contributors xiii
George Kadmos is a Doctoral Researcher in the Department of Economics,Curtin University, Australia.
Ozay Mehmet is Professor and Development Economist in the NormanPeterson School of International Affairs, Carleton University, Ottawa,Canada.
Shankaran Nambiar is Lecturer in Economics, International College atPenang, Malaysia where he teaches on the University of Sydney pro-gramme. His areas of specialisation are: institutional economics andeconomic development.
Phillip Anthony O’Hara is Associate Professor of Political Economy andDirector of the Global Political Economy Research Unit in theDepartment of Economics, Curtin University, Australia. He is theAssociate Editor of the Review of Social Economy and the Editor ofEncyclopedia of Political Economy (Routledge, 1999). He is also on theEditorial Board of Ashgate Publishers’ series on Alternative Voices inEconomics.
Randy Stringer is the Deputy Director, Center for International EconomicStudies, School of Economics, University of Adelaide, Australia. He wasalso an economist with the FAO (United Nations) during 1990–6.
Gale Summerfield is the Director of the Office of Women in InternationalDevelopment and Associate Professor in Human and CommunityDevelopment at the University of Illinois at Urbana Champaign, USA.Her areas of specialisation are: gender aspect of economic reforms,economic developments and the regional development of China andVietnam.

xiv David Corkill
Prefatory note
Some of the pressing contemporary issues in development economics havebeen in existence for many years. In fact, some of the issues like humandevelopment are indeed as old as human civilisation. But these issues wererecognised formally very late, and only since the inception of developmenteconomics as a special branch of mainstream economics in the 1950s.Unfortunately many of these basic issues could not be resolved during thelast century, while some other issues have indeed become problematic in thecurrent century.
The basic purpose of the present volume is to examine some of thecentral issues in the economic development of Third World countries. Theissues presented here are fundamental to human development, resourceallocation, technological progress and international interactions betweendeveloping and developed countries. The development implications of suchinteractions have not yet been sufficiently understood by all. Hence, the needfor such a volume.
There are myriad contemporary issues that currently confront developmenteconomics. This book, however, focuses mainly on those issues which arevery basic and those which are related to the political economy ofinternational development and underdevelopment. I am sure that the volumepresents most of the more important issues in these areas of developmenteconomics.
In the preparation of the volume I have incurred intellectual indebtednessto many. I am thankful to the contributors who in spite of their busyworking schedule have written valuable pieces for this volume. My thanksare also due to Abdul Hamid Abdul Wahab, Executive Officer, for hisimpeccable secretarial assistance and to Ms Marina Cheah for typing out aportion of the manuscript. However, none of them is responsible for theerrors that might have crept in.
B.N. GHOSH

Introduction
There are indeed many ways of considering contemporary issues in develop-ment economics. These issues can be looked at from the perspective ofeconomic backwardness of domestic economies in terms of policy failuresand/or implementation failures or resources inadequacy and/or sub-optimalityin the allocation of resources. The problems that arise out of domesticmarket failure and/or government failure are generally manifested in in-creased degrees of unemployment, inflation and poverty.
In the open and exposed economies of the Third World, economicbackwardness or the slow rate of economic development in many of theseless developed countries (LDCs) is a result of international forces which aregenerally working against these countries. In the context of the new inter-national economic disorder, the developed countries (DCs) are able tomanipulate things in their favour and against the LDCs which have lessbargaining power in the international political market.
A close look at the development of development economics will make itabundantly clear that many of the important issues relating to the develop-ment of LDCs have either been willy-nilly neglected or have not beensatisfactorily resolved. These issues have both domestic and internationalramifications. For instance food security is predominantly a domestic issue,and the issue of debt trap for LDCs is basically an international one. How-ever, some issues which originated primarily as domestic issues do also haveinternational manifestations and ramifications. These issues, among others,are technology transfer, brain drain, human development and so on.
The contemporary issues in development economics pertain more to theinternational issues, though these might have been basically experiencedas micro-issues for domestic economies of LDCs. Prominent among theseissues are human development, brain drain, gender and development, foodsecurities, external debt, technology transfer and the role of the IMF in thecontext of the new financial architecture that the present world monetarysystem is attempting to build up. However, the issues that are adumbratedhere are not the only issues, but these are of course the major ones. It shouldbe clear that the contemporary issues are not the very recent issues. Some of
Chapter Title xv

the issues have arisen since the inception of development economics in the1950s and some issues have cropped up subsequently with the temper oftime. As Ghosh’s chapter on the ‘Development in development economics’reveals, there have been occasional paradigm shifts in developmenteconomics. In the initial stages, it was responsible for many theoreticalinnovations in devising theories and models of development for the poorcountries. However, in later years, more particularly in the 1970s, it wasrealised that the blind application of western growth models was not onlyinappropriate but also harmful because these caused enormous maldevelop-ment in LDCs. It was also the decade when one could discern the growingeconomic domination of DCs over LDCs through trade and aid, and theincreasing debt burden of these countries. It was realised that, in reality,trade was not an engine of growth but was a mechanism for immiserisinggrowth (Bhagwati 1958).
After the 1980s, many contradictions were found in simple economisticparadigms of development, and there was an apparent failure of theconventional theories of development. The new international economicorder lost its momentum, and was regarded by many scholars as a system ofnew international economic disorder. Contrary to expectation and earlierpromise, less capital and less technology flew to LDCs. In the words of W.A.Lewis (1984), development economics was completely in the doldrums. As amatter of fact, economic underpinnings of the development paradigms cameunder serious scrutiny once again in the 1990s with the feminist movementtaking the lead (O’Connell 1997: 119–20). The earlier notion of women anddevelopment was subsequently replaced by the more comprehensive notion ofgender and development.
Be that as it may, the issue of globalisation was the most publicised andconfused slogan of the last decade and it is feared that MNC-led globalis-ation may unleash a regime of unequal competition between DCs andLDCs.
However, in spite of various rhetoric and slogans, the primary focus in thelast decade shifted from the question of underdevelopment to the problemcaused by maldevelopment. The issue of human development attracted theattention of social scientists and policy-makers. It was realised that develop-ment does not necessarily mean that one should have more, but that oneshould be more. As A.K. Sen asserts, the scope of development economics inthe past was very narrow, concentrating too much on growth and too littleon development (Sen 1983 and 1989). Development economics has been lesssuccessful in characterising development involving human capabilities,qualities, freedom, justice and equalities.
However, the construction of human development indices to measurehuman development has been a significant innovation in recent years.Masudul Choudhury’s chapter on ‘Human development, military expend-iture and social wellbeing’ makes a conceptual and empirical treatment ofhuman development in terms of the prevailing human development indices
xvi Introduction

and a new interactive index called the social well-being function. The chapterconcludes that there exists a dire need for developing an interactive index ofhuman development explaining the political economy of complex relationsof development at the grass-roots level. The human development indices(HDI) are found to be linear composite measures which cannot explain thesocio-econo-political and institutional forces that predominate the process ofglobalisation. The chapter also questions the supposed inverse relationbetween military expenditure and social well-being which has been the basisof the IMF’s generalised inference. In fact, the flow of official developmentassistance has not increased to LDCs in spite of a decline in militaryexpenditure; rather, presumably, there has been a decrease in social well-being in the crisis-ridden developing countries.
Related to human development, more particularly to the development ofhigh-quality manpower (HQM), is the problem of brain drain from LDCs. Itis a phenomenon of one-way migration of HQM from LDCs to DCs. Thiscrucial manpower is employed in strategic industries and positions, and themigration of this strategic manpower causes enormous dislocation and lossto LDCs. The chapter by B.N. Ghosh and Rama Ghosh on ‘The problem ofbrain drain’ analyses the causes, extent and the consequence of brain drainfrom the developing economies. According to them, the problem of braindrain is a part of the explanation of economic backwardness and reversetransfer of technology. The loss, as a result of the migration of HQM, ismore overwhelming than the gain from foreign assistance from the DCs. Thereverse transfer of technology, in this sense, can be looked upon as a moredetrimental dimension of brain drain.
The problem of brain drain is generated and intensified by the deliberateneo-imperialist policy of DCs which are still exploiting the LDCs underthe new garb of aid and assistance. The exploitation continues unabated inthe sense that while in the pre-industrial revolution period the imperialistcountries drew physical capital from the colonies, in the post-industrialrevolution period they are drawing away HQM without paying any com-pensation. The surplus extraction still continues and is intensified fromLDCs by the DCs. Brain drain is responsible for the intensification ofinternational inequality in the matter of distribution of HQM.
Another dimension of human inequality is manifested in the socialreconstruction based on sex differences and is commonly known as genderinequality. Since the 1970s, the issue of gender and development has becomea lively issue in development economics. It is generally argued that differ-ences in material endowments and earnings are often due to the existence ofa gender gap. The ownership and control of property is a crucial determinantof economic differentials between men and women (Aggarwal 1994).
Gale Summerfield’s chapter, ‘Gender and development: transforming theprocess’, examines gender issues in the process of development. She concen-trates on the shifting focus on gender and development since 1970. Whereasin the 1970s the main focus was the status of women in the developing
Introduction xvii

countries and the study of impacts of policy changes on women, it graduallyshifted to the study of the active role of women in development and therelative disparities between men and women. The chapter then explains themore recent key themes in the realm of women and development, includingculture and identity, migration, property rights, socio-economic securitiesand so on.
In a very meaningful way, the issues of gender inequality and humandevelopment can be said to be interrelated with the issue of food security. InSoutheast Asia, Latin America and sub-Saharan Africa, women farmersproduce more than half the basic food. However, their contributions areoften downplayed by male chauvinists. Be that as it may, the importance offood security can hardly be overestimated as the most important basicnecessity for human existence and development.
Randy Stringer’s chapter on ‘Food security in developing countries’examines in this context the issues relating to entitlements for food, progressin food security, food security and poverty, food security and sustainabledevelopment and related issues. The concern for food security is growing inevery type of country in the modern world, for food is not only a basicnecessity but also a strategic item. And as such, in many countries, theincorporation of the issue of food security has become part and parcel ofgeneral development planning. Growth strategies are focusing more andmore on the promotion of diversified farming and agrarian activities, andnew technologies are being developed not only to increase food productionbut also to lower the cost of food production. All this is important because,in spite of economic growth, in many countries calorie consumption percapita went down during 1995–97 as compared to 1979–81, and thepercentage of undernourished population increased in many countries ofAsia, Latin America and sub-Saharan Africa. The present picture is indeedgloomy, but there is still hope in the sense that there are enormouspossibilities both for increasing production through increased intensivecultivation of old land and extension of cultivation of new land and alsothrough better systems of distributive management. For poor countries thereis of course a limit to the buying of food from foreign countries usingborrowed money on a long-term basis because these countries are already inthe debt trap, and debt for consumption is generally regarded as unpro-ductive in nature.
G.S. Gupta’s chapter, ‘External debt, government expenditure, investmentand growth’, reveals that external debt and debt servicing of manydeveloping countries have overtaken the rate of growth of the economyduring the last two decades. While Latin America and Caribbean regions areheavily indebted, the sub-Saharan Africa region tops the list in terms of debtto GNP ratio. The middle-income developing economies are highly indebtedand their debt to GNP ratio is the highest.
The debt crisis has been coupled with serious internal social dislocation inmany of the Third World countries, and this was partly caused by the policy
xviii Introduction

of loan-pushing by the developed rentier nations in the 1970s (Basu 1991).The regime of finance capital which pushed up the so-called aid andassistance to developing countries was found to be unjust in many ways. Thiswas one of the reasons why the poor countries demanded a higher share oftrade than aid. However, a better access to trade is not the panacea, for tradeis often based on unequal exchange.
As is well known, the pure theory of international trade established thesuperiority of free trade over restrictive trade practices. M.R. Aggarwal’schapter on ‘The pure theory of international trade, globalization, growthand sustainable development: agenda for the future’ asserts that in thecontext of market imperfection in trade, the state has to play an importantrole, but its role in the desired direction has remained rather insignificant.The growth of regionalism is an important development in recent yearswhich gives larger opportunities for the member countries to expand theirtrade. The unrestricted growth of MNC-led trade may be dangerous forecological balance and sustainable development in LDCs. Trade liberalis-ation indeed has to be done with care and circumspection; the new capitalistslogan of globalisation is bound to unleash the forces of unequal competi-tion between DCs and LDCs. Here comes the positive role of the domesticstate and international economic order to develop and diffuse environment-friendly technology to maintain sustainable development. Trade andtechnology are closely interrelated. Trade is not merely a channel for physicalgoods and resources, it is also a channel for knowledge and technology.
Shankaran Nambiar’s chapter, ‘Knowledge, technology transfer and multi-national corporations’ examines the phenomenon of technology transferfrom the viewpoint of the economics of knowledge. The chapter analyses theknowledge that is useful for the formation and transfer of technology. In thiscontext, the role of MNCs is explained in the generation and transfer oftechnological knowledge. Nambiar also considers issues relating to thechannels of technology transfer, the loss of information that technologyinvolves and the impact of globalisation.
Along with global transfer and exchange of technology, there takes placeglobal financial transfer and exchange. The IMF is the central regulator andcoordinator of the world financial system and obviously its role is verycrucial for the smooth functioning of the world financial system. In theirchapter, ‘The International Monetary Fund: functions, financial crises andfuture relevance’, George Kadmos and Phillip Anthony O’Hara havecritically evaluated the role and functioning of the IMF in the light of itschanging organisational dynamics and the real-world operation of globalfinancial crises. While the IMF has been successful in many respects, it hasalso failed in many areas. In the future, the IMF’s efforts should be directedat ensuring that the financial system is progressing in the right direction andthat the fault line, if any, is detected and rectified as early as possible. Thefuture relevance of the IMF will depend on its ability to act as a global centralbank and to perform the roles of monitoring and supervision, cooperation
Introduction xix

with and assistance to nations, policy formulation and implementation andto effectively create a new financial architecture that serves all types ofcountries, developed and developing, equally well.
The issue of economic development is also closely related to the problemof environment. John Asafu-Adjaye’s chapter, ‘Economic development andenvironmental problems’, reviews the debate on the trade-offs betweeneconomic development and environmental problems. He concludes thateconomic growth is necessary to achieve both economic development and acleaner environment. However, this process does not occur automatically.The chapter argues that in countries that have obtained low levels ofenvironmental pollution, institutions have played a significant role. Thechapter also presents policy responses to reduce national and global levelenvironmental degradation.
Environmental pollution is a global problem, and whether globalisationwill increase it or not is anybody’s surmise. Ozay Mehmet in his chapter,‘Globalization as Westernization: a post-colonial theory of global exploit-ation’, observes that western capitalism is too pro-capital and too exploitativeto fit in the Global Village. Therefore, globalisation of capitalism has workedas a tool of global inequality. The author has made a number of sanesuggestions to reform the system of globalism to suit the countries of theThird World. These reforms include regulation of trade and capital move-ment, introduction of the system of empowerment and entitlement, uni-versalisation of basic worker rights, introduction of international socialpolicy and democratisation of world institutions like the IMF, WTO and theWorld Bank. In fact, global development must evolve from multi-culturalglobal consent.
References
Agarwal, Bina (1994) ‘Gender and command over property: a critical gap ineconomic analysis and policy in South Asia’, World Development, vol. 22, no. 10.
Basu, Kaushik (1991) The International Debt Problem, Credit Rationing and LoanPushing: Theory and Experience, Princeton Studies in International Finance, no.70, Princeton.
Bhagwati, Jagdish (1958) ‘Immiserising growth: a geometrical note, Review ofEconomic Studies, June.
Lewis, W.A. (1984) ‘ The state of development theory’, American Economic Review,vol. 74, March.
O’Connell, Helen (1997) ‘The 1990s: new alliances, new directions’, Development,March.
Sen, A.K. (1983) ‘Development: which way now?’, Economic Journal vol. 93,pp. 745–62.
—— (1989) ‘Development as capability expansion’, Journal of Development Planning,vol. 19, pp. 41–58.
xx Introduction

1 Development in developmenteconomics
B.N. Ghosh
Introduction
After the Second World War, the poverty and backwardness of some of theworld countries became extremely conspicuous. Many reasons, includingcolonial exploitation, devastation by war, war-induced inflation and the like,could possibly be said to be responsible for such a sad state of affairs inmany countries. It is precisely at this time that the subject of developmenteconomics (DE) came into being to study the problems of backwardness andunderdevelopment of these nations. To be precise, DE started as a sub-discipline of economics in the early 1950s. However, over the decades it hada number of paradigm shifts, and the enthusiasm and gusto with which thesubject took off in the 1950s and through the 1960s became somewhatmellowed in subsequent decades.
The basic objective of the present discussion is to make an assessment ofwhat has really been learnt about development economics in the last fiftyyears or so. The discussion here is organised into five sections. Section oneoutlines the differentia specifica of development economics, followed by ataxonomy of basic theories of development and underdevelopment inSection two. Section three gives a brief analysis of the paradigm shifts of DEfrom the 1950s to the 1990s, and the visible change in the trajectory of DEwill be discussed in Section four, and Section five will make some partingobservations.
Differentia specifica of DE
Development economics was basically designed to theorise on economicbackwardness of the less developed countries (LDCs) and apply the theor-etical knowledge to the analysis of particular problems of underdevelop-ment, low income and poverty, and to find ways and means to solve theseproblems. The generalisations in DE are often based on hypothesis testing ofmicroeconomic case studies (Stern 1989: 599).
DE is indeed a blend of many types of issues and questions, including theanalysis of causation and its perpetuation, and policies towards solution of a
R E C T O RU N N I N G H E A D

host of problems relating to underdevelopment. The epistemic basis oftheories of DE in general has been the broad manifestation of the syndromeof poverty and underdevelopment prevalent specifically in LDCs. The purposeof DE has been mainly to study the phenomenology of underdevelopment,and to prescribe appropriate policies to eradicate it. Theorising on develop-ment has been based on the study of the symptoms and diagnosis of economicbackwardness. Theories developed by development economists have encom-passed the theoretical underpinnings of empirical facts drawn across the boardfrom socio-econo-political realms of life of many poor countries.
However, over the years, the area of investigation of DE has transgressedthe boundaries of pure economics, and has trespassed into the fields of otherallied disciplines. This is the reason why DE is often regarded as the subjectof trespass. As a matter of fact, the fine line of demarcation of DE becameincreasingly blurred in the decades following the 1950s. At the presentmoment, it is indeed very difficult both conceivably and observably topinpoint the precise scope and ontology of development economics. Thesubject has become over-expanded so much so that almost any type of studyunder the sun can be brought conveniently within the analytic umbrella ofDE. Although this has produced certain positive externalities for the subject,it has also been responsible for its lack of specialisation, direction and focus.Be that as it may, the subject of DE has remained and is still popular especi-ally among the students of Third World countries, though its importanceand charisma among the doctoral researches might have been somewhatreduced in DCs, as Arthur Lewis has made us believe (Lewis 1984: 1).
The popularity of the subject at the academic research level has wanedperhaps because of disillusionment with the subject as a problem-solvingpragmatic discipline. In the early theories of development, there was somesort of permeating optimism that the subject would be able to take theLDCs out of the morass of penury and pauperism (Bhagwati 1984: 24). Butnothing of that sort has happened in actual practice in the LDCs. In thewords of A.K. Sen, the ‘would-be dragon-slayer seems to have stumbled onhis sword’ (Sen 1983: 745). One should, however, note that while theorisinghas remained innocuous in DE, things may have gone haywire at the levelsof policy formulation and its implementation.
Theorising on underdevelopment and development
Theories and strategies of development of LDCs have been based on theoriesof underdevelopment which were developed mostly in the 1950s and 1960s.There are basically two strands of thoughts and theories explaining eco-nomic backwardness: (i) structural-cultural theories and (ii) linear stagetheories.
Structural-cultural theories seek to explain underdevelopment in terms ofstructural factors such as rigidities and inelasticities in the supply of factors,sub-optimal occupation structure, and the inability of the economy to respond
2 B.N. Ghosh

to price mechanisms to increase agricultural output and thereby to containinflation. Underdevelopment in these countries is also explained in termsof market imperfections and sub-optimal allocation of resources. Thestructural-cultural models also view institutional rigidities responsible forthe proliferation of dualism of various types, such as sociological dualism(Boeke), ecological dualism (Geertz), financial dualism (Myint), techno-logical dualism (Higgins) and foreign enclave dualism (Myint) as importantconstraints for economic development. A dualistic structure makes inter-action among the entities difficult, and stands in the way of progress. Myrdaldemonstrates how a growing sector generates backwash effect for theunderdeveloped sector or region. The spread effect of growth/developmentcannot often be absorbed by the backward sector owing to structural-cultural inhibitions and insulation.
Due to structural inflexibilities, structural adjustment necessary fordevelopment often becomes impossible. In the context of limited capital,both physical and human, limited or no modern technology, fixed factorproportions existing in backward economics (Eckaus) lead to overt andcovert unemployment and underemployment, particularly in labour-surpluseconomies. All these may end up with the situation of low income, lowsaving, low investment, and low income again. This creates a system thatbegets a vicious circle of poverty among poor nations (Nurkse). Lack ofadequate stock of capital and of modern technology stands in the way ofexploitation of resources which may be abundant in many backward eco-nomies. Considered from a different perspective, limited income, consump-tion and demand are said to be primarily responsible for limited marketinvestment, employment and income. Thus, both demand and supply sidesof the vicious circle can substantiate the fact that poverty generates poverty.Hence, the maxim: a country is poor because it is poor.
Socio-economic behaviour of people in LDCs remains highly culture-bound, and the traditional cultural milieu is found to be partly responsiblefor economic backwardness. People have low aspiration (Mellor) and limitedtarget level of income, giving rise to backward-sloping supply curve oflabour, low productivity, unemployment and underemployment. Too muchdependence on fate, and metaphysical belief in other-worldly pursuits,coupled with indifference and ignorance of the materialistic economiccalculus, creates a mind-set that easily tends to neglect the importance ofpopulation control in LDCs. Needless to say, a very high rate of growth ofpopulation has been looked upon as a factor primarily responsible for lowper capita income and poverty.1 The low-level equilibrium trap (Nelson) isfound to be one of the main reasons for the perpetuation of economicbackwardness. Many theories of development have come to the conclusionthat sporadic, inadequate and unbalanced sectoral investment cannot give asufficient boost to creating a situation of sustainable development. Valuesystem, institution and culture can indeed, to a great extent, be regarded asthe basic constraints on growth and development.
Development in development economics 3

Another way in which culture is looked upon as an associated factorimpeding economic development is the culture of foreign domination anddependency. The international structuralist model has two main versions: thefalse paradigm version (Todaro 1977: 91–2) and the colonial dependencymodels (Samir Amin, Gunder Frank, Emmanuel, Dos Santos, Marini andothers). The false paradigm version contends that the advice given byinternational institutions on economic development of the LDCs is harmful.There is a kernel of truth in the paradigm which is being recognisedpresently by the Southeast Asian countries which recently went for IMFbailout packages. The dependency theories in general have brought home thefact that the so-called backward countries were indeed rich countries interms of resource endowments, and that the resources from these foreign-dominated colonies (periphery) had been transferred to the exploitativeforeign colonial powers (centres). Dependency has created internationaldualism that has exacerbated the economic distance between DCs andLDCs.
The distinguishing point of many dependency writers is that they treat thesocial and economic development of LDCs as being conditioned by externalforces: the dominance over LDCs by other powerful DCs. As Gabriel Palmaasserts, the most distinguishing feature of dependency theory is its focus onthe interplay between internal and external structures in the analysis ofunderdevelopment (Palma 1985: 139). The main line of analysis of thedependency model is based on two approaches: (i) a surplus extractionapproach and (ii) an unequal exchange approach. Frank and Amin, amongothers, show that the present-day LDCs are underdeveloped because theirsurplus resources have been taken away by the DCs. Emmanuel and othersmaintain that there is unequal exchange between DCs and LDCs, and thatthere is a transfer of value from the latter to the former. LDCs are compelledto sell their goods at prices below their values, and purchase goods fromDCs at prices above their values. In the international interaction at manylevels, the exploitation still continues unabated. In the pre-industrialrevolution period, the DCs used to take away resources from their coloniesin the form of physical capital, while in the post-industrial revolution period,they have been draining the human capital resources (brain drain) fromLDCs (Ghosh 1999: 46).
The second strand of thought explaining underdevelopment is in termsof linear stage model mainly popularised by W.W. Rostow (1960). However,prior to Rostow, Karl Marx in his theory of social formation pointed outthat there were three important stages of social and economic developmentthat one could encounter before entering into the most progressive stage ofcapitalist development. These three stages were: primitive communism,slavery and feudalism. In a five-fold classificatory schema of stages ofgrowth, Rostow observed that the LDCs were backward as they were notyet prepared to enter into the stage of perceptible development (take-off)due to lack of required level of saving and investment.2 The LDCs are
4 B.N. Ghosh

dominated by traditional societies and some of them were passing throughthe stage of pre-conditions for take-off. Thus, to Rostow, each country hasto graduate through the natural stages of backwardness before it can finallyattain the stage of economic development.
The requirements for development are indeed multi-dimensional, andhence, different theories had to focus on different issues and dimensions.However, it is recognised by all that the most essential need for developmentand growth is capital accumulation and investment, reminiscent of theclassical theory of growth. Many economists including Harrod, Domar andRagnar Nurkse harped on the need for investment for accelerating economicgrowth. Harrod and Domar’s theory provided a formula for measuringgrowth: growth is measured by the reciprocal of capital-output ratio timesthe rate of investment (or saving). The formula is handy and simple, and waslater on used both as a growth model and as a planning model. Theimportance of investment lies in the dual functions that it performs: incomegeneration and capacity creation.
The threshold theory suggested that investment would have to be of acritical minimum amount (Leibenstein) so that growth-retarding factors likepopulation explosion and so on can be swamped out by the growth-inducingfactors. In this connection, Rosenstein Rodan suggested the theory of bigpush, and Ragnar Nurkse and H. Leibenstein separately put forward theview that what was essential for sustained development was the strategy ofbalanced growth for making investment in different sectors mutuallysupportive. Hans Singer, however, maintained that balanced growth doctrineis applicable only to subsequent stages of sustained growth rather than tothe breaking of deadlock (Singer 1958: 10). That investment is the kingpin ofgrowth was also acknowledged by H.W. Singer, W.W. Rostow and RobertHirschman. But Hirschman prescribed the strategy of unbalanced growth,for he believed that investment in some strategically selected leading sectorscreates further investment opportunities, and growth gets momentumthrough a process of communication from growing points to the stagnantpoints. However, it was soon realised that the debate between balancedgrowth and unbalanced growth was based on false consciousness, for thereare many common grounds between these so-called two strategies. PaulStreeten (1959 and 1963) contended that it was possible to reformulate thechoice between balance and imbalance. As a matter of fact, balanced andunbalanced growth need not be mutually conflicting, and an optimumstrategy of development should combine some elements of balance as wellas imbalance (Mathur 1966: 137–57).
For quite some time, the discussion on saving/investment became aprominent issue in DE. Ragnar Nurkse expressed his note of optimism forLDCs by pointing out that, although these economies contained a hugeamount of disguised unemployment and surplus labour, the stock ofredundant labour could be utilised for rural capital formation, and disguisedunemployment implied disguised saving potential. However, whereas Nurkse
Development in development economics 5

prescribed the strategy of shifting the surplus labour from rural to urbanareas, Gunnar Myrdal found the strategy to be quite counterproductive,because the industrial sector in LDCs did not have sufficient pull factor, andcould not create sufficient job opportunities for rural labour. Some of theLDCs in Asia did emphasise the development of agriculture for food andfibre, but the realisation of saving potential could not be translated intoaction. Some of the Southeast Asian countries, prominently Malaysia, placedmore emphasis on industrial development and followed a Preobrazhensky-type of model of squeezing agriculture. And labour was withdrawn fromagriculture for the development of the industrial sector: the Lewis model wasin operation. However, this was not a suitable strategy for the labour-surpluseconomies of Indonesia, India, Pakistan and Bangladesh.
The question then precisely becomes tangential to the choice of tech-nique. The debate between capital-intensive vs. labour-intensive methods ofproduction became a lively issue in the past, and A.K. Sen made an attemptto resolve the debate by pointing out that no technique of production isalways distinctly superior to the other and that there is nothing like a once-for-all choice of technique (Sen 1962: 57).
Harking back to the crucial question of investment, the main pressingissue that was identified was: how to increase saving and investment forhigher rate of growth (Rostowian take-off)? Nurkse observed that invest-ment was limited by the extent of the market. Chenery and Strout discussed,in their two-gap model, the two constraints to development, namely, savingconstraint and foreign exchange constraint. Since endogenous possibilitiesfor augmenting saving and trade were found to be rather bleak, many theoriesin DE proposed the importance of foreign aid and foreign trade. Trade wasregarded as important not only as a channel for goods and services but alsoas a channel for new ideas and technology. Many countries adopted the twinpolicy of export promotion and import substitution, and Schumpeterianrisk-takers and innovators got the reward (Bhagwati 1984: 30).
Nevertheless, in the process of interaction through the foreign sector,some countries opened up more than the others and allowed differentdegrees of liberalisation and privatisation through multinational capitalismand foreign direct investment. Although foreign technology could not betransferred fully to the newly industrialising economies for various reasons,improved technology was made available to augment production andexports.3 All these made it possible to realise a growth rate of between 8 and9 per cent per year in the Asia Pacific region, which was nothing short of amiracle (World Bank 1993).
There are indeed many reasons why growth rate differs and why somecountries lagged behind while some went ahead of others (Denison 1967).Apart from capital stock, technology, high-quality manpower and the like,the role of state has remained a contributory factor to the process of growthand development. On the basis of resource-use efficiency which ensuresefficient utilisation of factors of production, and the level of economic
6 B.N. Ghosh

growth which ensures effective direction or channelling of resources, thedeveloping world can broadly be divided into mainly three categories: almoststationary or very slow-moving economies, developing economies and newlyindustrialising economies. These economies have, accordingly, non-particip-atory or least participatory state, marginal state, and strong and expansivestate (Ghosh 1998: 108–12). The marginal, very weak or unstable states(noodle states) in many Asian countries, including India and Bangladesh,have been found to be responsible for the low rate of economic growthcompared to the strong visible hands of states of the ASEAN economieswhich experienced a high rate of economic growth. According to the WorldBank (1993), the economic success of the East Asian economies is, to a largeextent, due to the strong power of its states. On the other hand, a weak stateremains soft not only in policy formulations but also in policy implement-ation. And government failure and market failure in such economies areprimarily responsible for all sub-optimalities and systemic dysfunction.
Countries where economic development or growth has remained sluggishhave in general also experienced a poor structuralist and/or institutionalistrole of state; but bureaucracy, on the other hand, gained substantiallythrough the activities of rent-seeking (Krueger 1974), and in some countries,including India, it became a dominant class both economically and politically(Bardhan 1989). In contradistinction to it, in the East Asian economies,where economic growth has remained consistently high for a long period oftime, bureaucracy has been found to be rather ineffective and weak.
Paradigm shifts in DE
Ever since its inception as a new subject, DE has been pursuing its basicdesideratum of amelioration of poverty, increase in employment andincome, elimination of diseases, malnutrition and under-nutrition in theworld, especially in the Third World, by means of growth and development.It is in this sense that one can say that there is a continuity of purpose andaction sustained by DE over the last fifty years. However, in spite ofpurposive unicity and continuity, DE has been experiencing new challengesand constraints, and the response to these issues and problems has inducedparadigm shifts in the subject which will be discussed in the presentsection.4
The 1950s can be described as a decade of theoretical innovations in DE.Many theories of development that were put forward during this periodattempted to explain the existence of underdevelopment from variousperceptual angles, and accordingly suggested remedies to the problem ofbackwardness and poverty. The approach was simplistic and non-technical,easily comprehensible by planners and policy-makers. The attainment ofeconomic growth was the fundamental objective set for the Third Worldcountries, for it was presumed that economic growth could automaticallysolve the problems of poverty, unemployment and other associated problems.
Development in development economics 7

The 1960s are often regarded as the golden period and a decade ofoptimism in development economics (Singer 1997: 16–17). Development wasmore objectively defined as a blend of growth and change. While newtheories of growth and development were forthcoming, some of the oldtheories and issues were refined and reconciled. Influenced by the Keynesianeconomic theory, a positive role was assigned to the state to manageeconomic growth and development. It was thought that foreign aid andtechnical assistance from DCs would be able to make a dent on poverty andunemployment. Many Third World countries initiated economic planningwith gusto and grit but the outcome was not commensurate with the efforts.It was soon realised that despite concerted efforts for a decade, and therealisation of around 5 per cent economic growth by LDCs, the basicproblem of poverty and inequality in these countries could not be per-ceptibly reduced. And on the other hand, the economic gap between DCsand LDCs was widening. The optimism with which the decade started offcould not be sustained, and a sense of pessimism entered the arena of DE.
The 1970s can be looked upon as a decade of reappraisal. The achieve-ment of 5 per cent rate of growth was not sustainable, and poverty andinequality intensified in most of the poor countries.5 Economic growth asthe basic desideratum of DE was challenged by many economists, and it wasthought that blind application of western growth models was not onlyinappropriate but also harmful, for these caused enormous maldevelopmentto LDCs. All these called for limits to growth.
At the other end of the spectrum, one could discern growing economicdomination by DCs through trade and aid. The debt burden of LDCsstarted increasing, and it was realised that trade was not the engine ofgrowth; rather, it was a mechanism immiserising growth.6 The negativeexternalities of large industrial projects in terms of ecological costs lookedconspicuously overwhelming. The new international economic order reflectedthese issues for the first time.
Basic human needs, including education, health and employment and thelike, were regarded as the correct components of development and werereflected in the formulation of a basic needs approach to developmentpopularised by the World Bank and the UN Research Institute for SocialDevelopment.7 The agenda for employment generation was the main agendain this development decade. The most significant achievement of thisdevelopment decade was the realisation that it was distribution rather thanproduction per se which was necessary for ensuring the basic needs requiredfor human development.
The 1980s were characterised as a lost decade in development economics formany obvious reasons, of which the following remain important: first, in thecourse of time, many contradictions became evident in the simplistic econo-mistic paradigm of development (Wignaraja 1997: 81–3). Developmentbecame unstable and volatile in many countries (Esteva 1998: 46) and therewas an apparent failure of conventional theories of development.
8 B.N. Ghosh

Second, the welfare state of the Keynesian type no longer brought anyhope for solving the problems relating to underdevelopment and poverty;and at other end of the continuum, there was a smouldering discontent bothagainst capitalism and socialism for their failure to show a viable road togrowth and development in poor countries. Third, while the countries in theSouth were trying to find out alternative driving forces for socio-economicchanges in the desired direction, they constantly castigated the North asresponsible for their sad plight: the North–South debate became morevociferous and vitriolic. Fourth, the new international economic order lostits momentum, and could be dubbed as a system of new internationaleconomic disorder. Contrary to the expectation of people, less capital andless technology flowed to the LDCs from DCs; and there was also a reversetransfer of technology from the poor to the rich countries. Fifth, there was anapparent disillusionment with aid and trade as mechanisms for helping thedesired process of development. Both trade and aid became means forsurplus extraction from the poor countries. The temper of the time suggestedalternative strategies for people’s empowerment, participation and grass-roots development with top-down planning processes, settlement of genderconflict, elimination of, or at least a reduction in, ecological imbalance, anda powerful civil society that could bring about social changes.
Thus, there were indeed many types of debates, conflicts, issues andquestions during the decade. But there were no synthesis and solutions in theoffing, and neither was there any new consensus on the feasible strategicaction and direction. In the words of W.A. Lewis, development economicswas in ‘a complete doldrums’.
The 1990s will go down in the annals of DE as the decade of new visionand new direction. The decade has witnessed attempts for redevelopmentafter years of maldevelopments in the Third World countries. The entiredevelopment process so far based on state planning and patronage came infor serious criticism, and more reliance was placed on the market as anorganising mechanism for global relations (Harcourt 1997: 5–8). Privatisation,which was already on the agenda in many developing countries, occupied thefront seat in terms of priority. But towards the end of the decade, thelimitations of free market mechanism came to the surface with the financialcrisis of the East Asian economies. Perhaps it was a new perception.Economic underpinnings of the development paradigms came once againunder critical scrutiny with the feminist movement taking the lead(O’Connell 1997: 119–20). Instigated by the Beijing conference of 1995, thewhole gamut of issues concerning gender was recast, and the earlier notionof women in development was replaced by the more comprehensive issue ofgender and development.
There has been mounting pressure from the Third World to reform theUN, to democratise the WTO, and to make the international institutionsmore accountable and transparent in their dealings. It was realised that theold institutions like the IMF and World Bank need structural changes to
Development in development economics 9
effectively deal with the financial crisis of the Asian countries. The civilsociety movement which was prominent in the early 1990s became verypositive and innovative in its agenda for action, asking for all-round policychanges both within and without. Globalisation was the most publicisedand confused slogan in this decade. It reminds one of the exploitativeglobalisation of the nineteenth century, and many well-informed groupshave been trying to spin away from it because MNC-led globalisation mayunleash a regime of unequal competition between DCs and LDCs, and thismay be destructive to economic and social development processes. Thesegroups are engaged in achieving self-sufficiency and autonomy whilerecognising limits to competition in the globalised world. The focus, how-ever, shifted from the question of underdevelopment to the problem causedby industrial development. Human and social dimensions of development,which were emphasised in international conferences from 1992 to 1996, aregoing to get the upper hand, and are likely to be the basic theme song of DEin the new millennium.
The future of DE
DE, as it appears, has not yet outlived its utility, and economists do stronglyfeel that there is a dire need for the discipline. If this is correct, then DE hasa future. Most of the fundamental prescriptions of traditional DE are stillvalid today. For instance, what Hans Singer was emphasising as the mech-anics of development in the early 1950s (i.e. the importance of a higher rateof saving and investment and the need for changes in the occupationaldistribution of population for economic development) does still retain itsprescriptive value (Singer 1952). As A.K. Sen observes, the broad policythemes of traditional DE are still relevant, and the discipline of DE doeshave a central role to play in the field of economic growth in developingcountries, and its problematic is rather limited (Sen 1983: 753 and 745).Albert Hirschman also believes that conditions for healthy growth of DEseem to be remarkably favourable: the problem of world poverty is not yetsolved, but encouraging in-roads to the problem have been and are beingmade (Hirschman 1986: 3).
Sen has argued that in the past the scope of DE was very narrow, con-centrating too much on growth and too little on development (Sen 1983 and1989). DE has been less successful in characterising development involvinghuman capabilities. Development has to be interpreted in terms of humanparticipation, empowerment, entitlement, justice, equality and freedom. Tosegregate human consideration from DE is like playing Hamlet without thePrince of Denmark. Development does not necessarily mean that one shouldhave more but that one should be more. This concept of development, whichwould predominate in future, implies human development as opposed to themeaningless amassing of material goods for meta-needs.
10 B.N. Ghosh
To be precise, DE will have to consider the following substantive issues infuture which have been rather neglected in the past:9 (i) the issues andproblems relating to human development; (ii) the study of institutions andtheir dimensions: exogenous/endogenous, functional/dysfunctional, and thecapability of the institutions to absorb the shock of market failure which isvery pervasive in LDCs (Knight 1991: 21); (iii) various dimensions oftechnology and technology transfer need to be studied by DE in order toassess their impact on economic development – the causes and effects of lowtechnology equilibrium, and the possibilities for reverse engineering, alsoneed careful study; (iv) it would be imperative to make more detailedanalysis of the causes and consequences of government failures and marketfailures in LDCs. Why is privatisation successful in some countries while it isnot extensively practised in others? Why is it that some states can pursueeffective development policies and some do not (Bardhan 1988). Develop-ment economists need to know the nature, policy and motivation ofgovernments and the rent-seeking bureaucratic behaviour in different typesof economies, and the impact of dirigisme on development and under-development. Such a type of study analysing the tension between govern-ment failures and market failures belongs to the area of political economy;(v) the study of various constructive and destructive dimensions ofglobalisation on development, including the issues on accountability, equityand democratisation, could occupy quite some time in the new millennium.And along with this would be the need to re-examine the political economyof international institutions and of North–South relations with respect toissues involving human rights, technology transfer, ecology, trade and so on.It is very likely that political economy of development would emerge as amore powerful and promising area of DE for studying the phenomenologyof both national and international events.
The aforesaid issues cannot always be properly visualised and appreciatedthrough the dazzling light of formal theoretical analysis, which may blur thevision. These need to be studied by DE through empirical analysis, andmicroeconomic methodologies may often have to be pressed into service.Moreover, to realise the truth value, the DE may have to cross the traditionalboundaries of economics, and thus have to be transcendental and eclectic inapproach.
On the question of methodology, DE will have two alternatives to choosefrom. First, if DE is to be a strong and pure academic discipline, it has to bemore sophisticated and rigorous in its approach without being vitiated bysoft and simple methodological reductionism. Second, however, if it has tobe interdisciplinary, which it is, then it will have many methodological trade-offs. In future, the second possibility seems to be more appropriate for thesurvival and expansion of DE. As a matter of fact, the disciplinary bound-aries between economics and other disciplines cannot be regarded as sacro-sanct (Toye 1985: 13).
Development in development economics 11

Concluding observations
In the movie Casablanca, the police chief, when something goes wrong, alwaysgives an order to round up the usual suspects. This has somehow become thepublic attitude towards DE. When something goes wrong, or a specificdevelopment objective (say, poverty reduction) cannot be achieved, there isoften a general proclivity to put the blame squarely on DE, although, con-ceivably, it does not have any complicity. Be that as it may, DE is anevolutionary subject, and one can learn many positive lessons from it eitheras a practitioner, or a policy-maker, or as a researcher. A few of these lessonsmay be mentioned here by way of obiter dicta, which need to be kept in mindwhile evaluating the performance of DE.
First, no policy, strategy or theory can have universal applicability inanalysing development-related problems, and there is no once-for-all solu-tion to the problem of underdevelopment. Second, economic developmenthas many facets and dimensions, and therefore it can be studied fromdifferent perspectives: economic, social, political and so on. Third, DE hashelped us to understand and differentiate between many myths and realitiesthrough its empirical epistemics. For instance, for so long Malthusian theorytaught us that overpopulation is the fundamental cause of poverty. However,DE has given us a new insight that in many developing countries poverty isnot caused by higher population growth, but that higher population isinduced by poverty. Despite economic growth, there may be poverty andsocial underdevelopment, and even some amount of unemployment andunderemployment. We must recognise the unpalatable fact that we havereached the age of the end of full employment, and this seems to be anirreversible phenomenon. Fourth, the issues relating to human developmentare indeed convoluted issues, and it would be too much to judge the successor failure of DE in terms of its ability to solve human problems. The solutionto these problems is a function of political will, resource availability, policyparameters and their implementations, over which DE qua DE has hardlyhad any influence. Economic decisions are essentially political in nature.
In a very controversial monograph, Deepak Lal has asserted that thedemise of DE is likely to be conducive to the health of both the economicsand the economies of LDCs (Lal 1983: 109).10 While it is not the purpose ofthe present discussion to enter into polemical dialectics over this subjectiveeffusion, in view of what has been adumbrated in the earlier section, andfrom the quantity and quality of meaningful research in the subject, it can bereiterated with the words of Arthur W. Lewis that development economics isstill alive and well (Lewis 1984: 10). As an interdisciplinary subject, itsumbilical cord is tied with a number of closely interactive social sciences fromwhich DE will be able to draw the necessary élan vital for its sustenance. Aninterdisciplinary subject never dies, though its lustre may fade in the course oftime.
It would be rather sacrilegious to contend, as many economists really do,that no good theories or studies are coming up in DE any more, and that the
12 B.N. Ghosh

milk cow has already dried up. To get out of this kind of intellectual myopia,one really needs to see the good work being published in academic journalslike the Journal of Development Studies, Economic Development and CulturalChange and the Journal of Development Economics, to name only a few, andalso the books on DE from international publishers. The subject is stillmaking significant contributions of a reputable academic standard, and likea lady’s word, the final word in development economics should not be takenas the last word.
Notes
1 The positive relationship between population growth and poverty was firstbrought out by the Malthusian theory of population. The theory propagated theidea that overpopulation is responsible for poverty, unemployment, famine andso on. However, many studies in development economics have brought home thefact that it is poverty which is responsible for higher population growth
2 According to Rostow, take-off will require a productive investment of over 10 percent of national income. He estimated that a 2 per cent per annum increase innet national product per capita would require a regular investment of 10.5 to12.5 per cent of the net national product.
3 One of the reasons for the low degree of technology transfer (TT) is the low andlimited capability of the local workers to absorb the technology (Ghosh 1998b:155). Other reasons include the high cost of technology transfer, and in somecases, the technology suppliers are rather reluctant to transfer technology. Ourstudy of TT in electronics, electrical and supportive industries in Penang(Malaysia) came to the conclusion that while the rooting process of TT is quitesatisfactory, the diffusion effect of the acquired technology was not very per-ceptible in Malaysia (Narayanan et al. 1994).
4 The major achievements and failures of DE have been elaborated on by manyacademic journals, see Development (March, 1997) and Development Practice(August, 1998), among others.
5 For instance, poverty intensified in India and China. In India, poverty increasedfrom 34 per cent in 1960–1 to 52 per cent in 1972–3. Jan Myrdal’s study showedthat poverty increased in China after the end of the 1960s (Myrdal 1966).
6 For an elaboration on the idea of immiserising growth, see Bhagwati (1958).7 The basic needs included physical and cultural needs. The basic needs approach
can be regarded as social indicators of development. Initially, the following sixbasic needs were considered: nutrition, basic education, health, sanitation, watersupply and housing and related infrastructure (Hicks and Streeten 1979).
8 The UNCTAD Report (1974) observed that US foreign aid to LDCs amount to$3.1 billion in 1970; but the income gained by the United States through braindrain, the seed-corn technology, amounted to $3.7 billion in the same year. Thestudy makes it quite clear that it is really the poor countries which are, onbalance, aiding the rich developed countries, and not the other way round(Ghosh 1999: 46).
9 Most of the issues considered here are also elaborated on by J.B. Knight (1991),John Toye (1985), P. Bardhan (1988) and others.
10 Deepak Lal’s frontal attack against the dirigiste dogma highlighting pro-government controls and anti-price mechanism in the 1960s is no longer valid
Development in development economics 13

now. Moreover, the present-day world has been really experiencing the limitationof free market mechanism, and hence, the need for some amount of governmentcontrol, supervision and direction. DE has experienced both government failuresand market failures. Therefore, a mixed economy type of model in DE seems tobe more appropriate; but all these do not imply the demise of DE
References
Bardhan, P. (1988) ‘Alternative approaches to development economics’, in H.Chenery and T.N. Srinivasan (eds), Handbook of Development Economics, vol. 1,Amsterdam: North Holland.
—— (1989) ‘The third dominant class’, Economic and Political Weekly, 21 January.Bhagwati, J.N. (1958) ‘Immiserising growth: a geometrical note’, Review of Economic
Studies, June.—— (1984) ‘Development economics: what have we learned?’, Asian Development
Review, vol. 2, no. 1.Denison, E.F. (1967) Why Growth Rates Differ, Washington, DC: The Brookings
Institution.Esteva, Gustavo and Madhu, Suri Prakash (1998) ‘Beyond development, what?’,
Development in Practice, August.Ghosh, B.N. (1998a) A Tale of Two Economies, Delhi: New Academic Publishers.—— (1998b) Malaysia: The Transformation Within, Kuala Lumpur: Longman.—— (1999), ‘Brain Drain’, in Phillip O’Hara (ed.) Encyclopedia of Political Economy,
London and New York: Routledge.Harcourt, Wendy (1997) ‘The search for social justice’, Development, vol. 40, no. 1.Hicks, Norman and Paul Streeten (1979) ‘Indicators of development’, World Develop-
ment, June.Hirschman, Albert (1986) ‘The rise and decline of development economics’, Develop-
ment, vol. 3, p. 3.Knight, J.B. (1991) ‘The evolution of development economics’, in V.N.
Balasubramanyam and Sanjay Lall (eds) Current Issues in DevelopmentEconomics, London: Macmillan.
Krueger, A.O. (1974) ‘The political economy of the rent-seeking society’, AmericanEconomic Review, vol. LXIV, June.
Lal, Deepak (1983) The Poverty of Development Economics, Hovart Paperback,London: Institute of Economic Affairs.
Lewis, W.A. (1984) ‘The state of development theory’, American Economic Review,vol. 74, no. 1 (March), pp. 1–10.
Mathur, Ashok (1966) ‘Balanced vs. unbalanced growth’, Oxford Economic Papers,July, pp. 137–57.
Myrdal, Jan (1966) Report from a Chinese Village, USA: Signet Book Edition.Narayanan, Suresh, Lai, Yew Wah, Ghosh, B.N., Omar, Ismail and Fatah, Abdul
(1994) Technology Transfer to Malaysia, Kuala Lumpur: UNDP.O’Connell, Helen (1997) ‘The 1990s: new alliances, new directions’, Development,
March, pp. 119–20.Palma, Gabriel (1985) ‘Dependency theory of underdevelopment’, in G.M. Meier
(ed.), Leading Issues in Economic Development, London: Oxford University Press.Rostow, W.W. (1960) The Stages of Economic Growth: A Non-Communist Manifesto,
London: Cambridge University Press.
14 B.N. Ghosh

Sen, A.K. (1962) The Choice of Technique, Oxford: Blackwell.—— (1983) ‘Development: which way now?’, Economic Journal, vol. 93, pp. 745–62.—— (1989) ‘Development as capability expansion’, Journal of Development Planning,
vol. 19, pp. 41–58.Singer, Hans W. (1952) ‘The mechanics of economic development,’ Indian Economic
Review, August, pp. 397–9.—— (1958), ‘The concept of balanced growth and economic development’, University
of Texas Conference, April.—— (1997), ‘The 1960s: a decade of optimism’, Development, vol. 40, no.1, March.Stern, N. (1989) ‘The economics of development: a survey’, Economic Journal, vol.
99, pp. 597–685.Streeten, P. (1959) ‘Unbalanced growth’, Oxford Economic Papers, June.—— (1963) ‘Balanced versus unbalanced growth,’ Economic Weekly, April.Todaro, M.P. (1977) Economics for a Developing World, London: Longman.Toye, John (1985) ‘Dirigisme and development economics’, Cambridge Journal of
Economics, vol. 9, March, pp. 1–44.Wignaraja, Ponna (1997) ‘The 1980s: seeds for change’, Development, March 1997.World Bank (1993), The East Asian Miracle, London: Oxford University Press.
Development in development economics 15

2 Human development, militaryexpenditure and social wellbeing
Masudul Alam Choudhury
Human Development Index
Introduction
What is the Human Development Index? The Human Development Report ofthe UNDP defines it as the statistical measure that indicates the degree towhich the experience of development in various countries is contributing toenlarging ‘human capabilities and functionings’ (UNDP 1998). The under-lying assumption is that socio-economic development involves a large andexpanding spectrum of factors that are not purely economic in nature asthe neoclassical orientation to the study of resource allocation would makeus believe. On the contrary, development is the result of a spectrum ofinteractions among factors ranging from economic to ethical, social andinstitutional ones, all of which must be brought together in a cogent waywithin a systems approach to the study of the interactions that ensue asthese various factors feedback and interrelate with each other through theuniversal perspective of a general system.
Background
The study of social, economic and political factors in economic theory is nota new undertaking. Yet the methodological orientation of this body ofconceptualization and its application in that light make a substantivedifference from the way that ethics is treated in neoclassical economic theoryand all those parts of economic theory affected by their intrinsic dependenceon economic rationality, marginalism and optimization criteria. The fact ofthe matter is that the presence of such seemingly, though not essentially,interdisciplinary social, institutional, political and ethical factors interrelatein a vastly interactive way in today’s study of global issues and problems.
A good example of the above case is that of financial volatility thatrecently plagued the global order. Here we find a combination of institu-tional, political, ethical and economic factors combining to cause the uncer-tainties that have left so many ruined. If we are to study the so-calledeconomics of trust and honest business ethics as defined in terms oftransparency of business activities, structural policy and organizational
16 Author name

reform to control wastage and non-performing loans in giant projects (IMF1999), we must consider preference changes under the effects of appropriatepolicies. Such preferences are then of the endogenous nature as they give riseto and are enforced by underlying normative issues of reform that ought to betaken up by institutions. On the other hand, the analyst must take stock ofthe crony capitalism and speculative behaviour of large investors who deal inportfolio investments, move funds at will across national economies and takeadvantage of the IMF’s Capital Accounts Liberalization program (Fisher1997), the OECD’s Multilateral Agreement on Investments, and the WTO’sbinding clauses affecting TRIMs and TRIPs (SESRTCIC and ICDT 1994).
On the macroeconomic front we note that a $20 billion-plus flight ofcapital from East Asian economies has led these countries into a long-terminstability of costly structural adjustment and downsizing in governmentspending. The Human Development Report 1998 (UNDP 1998) points outthat even though the fortunate rich have gained from globalization in termsof increasing consumption, this has been to the detriment of the poor:
The poorest 20% of the world’s people and more have been left out ofthe consumption explosion. Well over a billion people are deprived ofbasic consumption needs. Of the 4.4 billion people in developingcountries, nearly three-fifths lack basic sanitation. Almost a third haveno access to clean water. A quarter does not have adequate housing. Afifth have no access to modern health services. A fifth of children do notattend school to grade 5, and so on in the list of deprivation.
To this human deprivation is to be added the spectre of long-term unemploy-ment and falling GDP per capita that has followed the recent financial crisisin many of the East Asian economies even after their two to three decades ofeconomic progress. Structural downsizing of institutions has caused asudden withdrawal of social services, health services and subsidies to theneedy citizens. The result has been increasing poverty levels.
The debt burden has remained almost everywhere too high in the leastdeveloped countries. For instance, in the heavily indebted countries of sub-Saharan Africa debt is higher than their GNP levels. These countries spentmore in debt repayments than their export earnings. That is, the officialdevelopment assistance that came into these countries for developmentalpurposes was reversed in payments of outstanding debt. Even on the face ofdebt repayment, the debt stock of the sub-Saharan African countriesincreased by $33 billion. Consequently, we note that a large proportion ofthe IMF loans paid to these debt-ridden countries is found to reverse in theform of debt payments. The social sector remains impoverished.
Macroeconomic stabilization of the external sector of indebted countries,as well as of those devastated by the incidence of financial turmoil arisingfrom the use of monetary and trade-related policies at the expense of fiscalexpansion, has proven to be ineffective and risky. This is particularly due to
HD, military expenditure and social wellbeing 17

the unpredictable relationship existing between interest rate movement andthe exchange rate volatility in developing countries affected by the financialcrisis (Obstfeld 1998). There has failed to be any predictable relationshipbetween these two indicators as short-term interest rate movements arehinged on prime rates set in the industrial countries and by the intent toengender motivation to hold and generate savings at home.
The motivation to hold interest rates high in the face of low exchange rateregimes is once again driving the afflicted countries of East Asia towardstheir traditional economic growth-oriented goals. Yet it was this very goalthat lay behind the cause of the economic and financial turmoil in thesecountries as economic growth relied predominantly on loanable capital andportfolio investments. Both of these were endemic in causing massive debtsand speculative investments rather than real sectoral developments in thenational economies. The uncertainty of economic growth as a nationalpolicy goal is found to be once again fraught with the spectre of that kind ofeconomic and financial frailty which only recently caused the financial andeconomic collapse of the East Asian economies even after their two to threedecades of unprecedented non-inflationary economic growth.
Besides, economic growth in a neoclassical economic framework meansdelayed attention to the social sector that may never return if uncertaintiesride the crest of future economic change. This kind of marginal substitutionbetween economic growth and distributive equity as a goal of attainingeconomic efficiency that contests with the goal of distributive equity, hasremained embedded in the East Asian economic model. Consequently,macroeconomic stabilization policies in the framework of a growth model ofeconomic recovery lose their effectiveness with the use of monetary andtrade-related policies that favour savings and investments of short-termcapital at the cost of fiscal policy. Monetary policy favouring the trend toprivatization looks for short-run profitability. The result is highly unstablecapital flows into speculative and risky portfolios. In Malaysia, for instance,growth-oriented development planning, the accumulation of external debtcaused by the pressure of capital-intensive economic expansion, a steepincrease in speculative portfolio investments, resulted in the financial crisis ofthe Kuala Lumpur Stock Exchange. This ultimately caused the unit trustsheld by the poor (Amanah Saham Bumiputeras) to be steeply devalued in theKLSE. Poverty alleviation and economic sensitivity were not sustained.
Thus we find that the prescribed global economic policies proved to fosteran adverse selection game played by national governments and their citizenryas they entered global regimes with long-term binding commitments onpolicy clauses. The so-called economics of adverse selection in the case ofglobal financial volatility became an interplay of factors affecting malevolentpreferences of large speculative investors, the preferences of smaller-scalefollowers who adopt herding behaviour, of institutional enforcement of theuncertain regimes that ensue, and the costly consequences that adverselyaffect the long-term economic recovery of nations. Some have identified a
18 Masudul Alam Choudhury

problem of ‘trilemma’ in global financial integration in terms of the goals ofgreater integration, proper economic management and national sovereignty.It is the national sovereignty that remains in tradeoff with the other twocomplementary goals (Summers 1999).
The same kinds of implications as mentioned above can be associatedwith the enormous amount being spent in military expenditure in the MiddleEastern countries in spite of their claim that this establishes stability andthereby economic growth. There are serious implications on social wellbeingthat need to be examined here in the light of the alternative allocations ofmilitary expenditure that can be realized. Yet one needs to be cautious here,because military expenditure in many of the Middle Eastern countries is arepercussion of the status quo established in the region by the self-interestedgovernments of the West.
Objective
Our objective in this paper is to delineate a general systems outlook on socio-economic development studied by means of the composite human develop-ment indices. The composite indexes associated with the Human Develop-ment Index (HDI) are the Human Poverty Index (HPI), the Gender-relatedIndex (GDI) and the Gender Empowerment Index (GEI) (UNDP 1998).
We will explain the interrelationship between the human developmentrelated indices and these with socio-economic development in the context ofstudying a holistic system of interactions. This will carried out by means ofthe social wellbeing criterion function. We will explain this substantive con-cept and the systemic interrelationships within the framework of thepolitical economy of development, meaning the study of interrelationshipsamong economic, social, ethical and institutional factors underlying thehuman development spectrum.
Definitions of terms
We will first define the indices related to human development in order to setthe scene for the analytical part of this paper.
Human Development Index is the combined index of life expectancy atbirth, the adult literacy rate, combined enrolment ratio and the adjustedGDP per capita in purchasing power parity (PPP$). The HDI is computedby UNDP (1998) using the formula,
HDI�(actual xi value�minimum xi value)/(maximum xi
value�minimum xi value),
where xi denotes the value for the factor under consideration among, i�lifeexpectancy, adult literacy rate, enrolment rate, adjusted GDP (PPP$).The income variable is discounted at the threshold world averageincome level. For details one may refer to the Human DevelopmentReport.
HD, military expenditure and social wellbeing 19

Corresponding to the formula for HDI is also the Gender-related Develop-ment Index, GDI. For details in the computation of this measure one canrefer to the HD Report.
Human Poverty Index, HPI, is a composite of the following factors:
1 percentage of people not expected to survive to the age of 40 years fordeveloping countries (P1) (60 for industrialized countries) (P1);
2 illiteracy rate (‘functional illiteracy rate’ for industrialized countries)(P2);
3 economic deprivation indicated by percentage of people not havingaccess to fresh water and health services, and percentage of underweightchildren under the age of five (P3).
For developing countries the HPI is computed by, HPI-1�[1/3(P1�P2�P3)]1/3. Likewise for industrialized countries, HPI-2�[1/3(P1�P2�P3�P4)]1/3, where, P4 denotes the rate of long-term unemployment.
Gender Empowerment Measure, GEM, is calculated by the percentageshares of men and women in managerial, administrative, professional andtechnical jobs, and parliamentary positions, and the shares of earnedincome in agricultural and non-agricultural activities to average wages andearnings.
Clearly, the issues of health and vital statistics, earning power, distribu-tion in economic opportunities by earnings, empowerment and gainfulemployment together with both the contribution of such factors to GDP percapita as well as the effect that GDP per capita has on these factors, form agamut of interconnected variables. Such an interrelationship can be under-stood with the help of Figure 2.1.
In Figure 2.1, elements such as ‘human activities’ and ‘environment andnatural resources’ denote boxes of inherent variables. The ‘agents’ box isshown. The circular flow of arrows denote interactions among agents,variables and the relations formed by such variables.
20 Masudul Alam Choudhury
Figure 2.1 Systemic interactions among agents, variables and their relations.
Source: OECD 1994. Environmental Indicators (Paris, France).

The social wellbeing criterion function
The kind of systemic understanding of the organization of change in humaninterrelations as depicted in Figure 2.1 is referred to by Drucker as ‘thesociety of organizations’ (Drucker 1998). However, our concept of anorganization is that of a system of regulated and predictable interrelation-ships among the agents and variables of change. This feature makes thelearning process of an organization depend upon continuously emergingcomplementarity among the interactive factors. Such a knowledge-sharingamong agents, variables and their relations is derived from the balancingingredients of shared welfare, cost-effectiveness and both risk as well asproduct diversification. The latter reduces unit costs of generating organiz-ational possibilities by extending sharing, creativeness and innovationsamong agents and projects (Choudhury 1998).
From this underlying principle of universal complementarity (Choudhury1996) arises the substantive concept of social wellbeing, which we choose inthis paper as the criterion for the evaluation of human development. SocialWellbeing Function is the objective criterion function for studying comple-mentarity among the coordinated and knowledge-sharing variables, agentsand relations of the organization or the system under examination. Such amass of interrelationships leads to the simulation of the social wellbeingfunction through interactions among the variables. Agents, variables andtheir relations form a general systems approach to the study of the politicaleconomy of social wellbeing or human development.
The interactions existing among the variables imply the configurationsshown in Figure 2.1. They carry with them the different elements of humandevelopment as mentioned earlier. Finally, when the general systems-orientedinteractive phenomenon feeds into a discursively human environment in itsrelationship with the expanding domain of enlarging human possibilities,then a predictable and evolving knowledge-induced objective criterion of thecommon good is attained. The objective criterion that is formed out of theunderlying dynamics of such a ‘globally’ interactive, integrative andevolutionary system of knowledge-sharing among the variables, agents andtheir relations, is termed in this paper as the Social Wellbeing Function. Agood account of the ethical perspectives of social wellbeing as adeontological function for public policy making is provided by Sen (1991).
Social wellbeing as so understood is a criterion premised on the principleof universal complementarity among the variables, agents and their inter-relations. It is thereby a combination of the positive and normative criteriaof social evaluation. In the case of human development, the concept ofsocial wellbeing defines the choices that society makes in terms of establish-ing complementarity among the factors that define the various indexes asdefined earlier. The extended context of complementarity is realized by thechoices of technology, modes of production, preferences on consumptionand the social as well as the institutional framework that enhance thesepossibilities. The context here is at once of a national and a global one in the
HD, military expenditure and social wellbeing 21

midst of the vastly interactive, integrative and evolutionary framework oflearning among the knowledge-induced variables, agents and their relations.This kind of momentum provides the inner dynamics of the general systemsframework of the interactive, integrative and creatively evolutionary featurethat characterizes the social wellbeing criterion.
The concept of social welfare as found in the literature of welfare eco-nomics and social choice theory (Arrow 1963) is quite different from that ofsocial wellbeing. That is because of the intrinsic marginal rate of substitutionfound entrenched in the entire theoretical and hence public policy context ofsocial welfare. Even in the case of public goods in such a neoclassicalobjective criterion function, the method of resource allocation within publicgoods and between public goods and private goods is based on the tradeoffprinciple of marginal rate of substitution between these goods taken up inbundles of contestable goods. This feature of marginalism becomesindispensable in neoclassical resource allocation because it is overwhelmed bythe optimization, steady-state equilibrium and price-determination conditionsof a social welfare optimization model. This feature remains intact even in thecase of a multi-objective general system of constrained dynamicmaximization model (Bellman 1957). In the end, therefore, the essentialpresence and continuous learning by knowledge-sharing that remains as thefundamental causation of interactions, integration and creative evolution ofhuman possibilities, dissipates under the terminal condition of optimality andequilibrium. Human innovation ends (Shackle 1971).
Optimal resource allocation in the case of social welfare, social choice andtheir applications requires the axiom of economically rational behaviour.Besides, the pre-condition of economic rationality is necessary for theexistence of terminal optimal-equilibrium points. In the case of extendingsuch preferences to the institutional context, we learn from the commentsmade by Whittaker (1987) on Arrow’s theory of organization (1974), andfrom the organizational perspectives of Simon’s models of man (1957), thatthe learning capacity which leads to continuous systemic complementarity bya combination of the normative actions of public policy and their positiveeffects in the world of organization, remains impervious in social welfare andsocial choice models. Whereas, they remain pervasive in the social wellbeingmodel. The only exception in the social wellbeing function with respect to thecessation of continuous learning behaviour and its complementing effect onvariables, agents and their relations is for the instantaneous short run. But thisis an exceptional case that is of little interest in general equilibrium systemsunder the effect of knowledge-induction characterizing global issues.
A formal presentation of the social wellbeing function of human development
A formal way of looking at the general systems outlook with respect to theSocial Wellbeing Function, SW(.), incorporating human development indicescan be represented as follows:
22 Masudul Alam Choudhury

Simulate {�} SW(h1, h2, h3, h4)[�], (1)
Subject to hi�fi (hj, hk, hl)[�],
where hr denotes the various human development indices as defined abovewith, r�i, j,k,l�HDI, GDI, GEM, HP, and i≠j≠k≠l.fi(.) denotes functional interrelations among the various humandevelopment indices as shown.� denotes the knowledge-sharing variable. Knowledge appears in thegeneral system as ordinal values assigned institutionally or bysystems modelling to the interactions that pervade continuouslyamong agents, variables and their relations.
The appearance of [�]-value indicates the universal knowledge inductionof the human development indices by the underlying knowledge-sharingvariable. An example of this is shown in Figure 2.1.
Finer disaggregations of the above functional relations, agents and vari-ables can be obtained by going to detailed levels in the variables that charac-terize the various human development indices. This presents a meaning ofdecentralization that arises from finer decision-making and complementaryprocesses with increasingly complex system of interrelationships.
An example of interactions among the hr-indexes is the following: totalHDI can be enhanced by cooperative economic activities generated amonggenders. A cooperative enterprise between the rich and poor in secondarylines of production and projects ultimately leads to an improvement inskills and human resource development, which thereby alleviates poverty.Increased skills and human resource development in turn increase produc-tive economic activities that lead to higher earnings, more employment andenterprise. Consequently, gender empowerment is attained; increased GDPper capita results. The higher values of HDI in turn feed into more resourcemobilization in attaining the same kinds of diversity in the reinforcing cyclesof interrelationships.
Yet nothing of this is a sheer automatic market process. Rather, marketsare coordinated with the institutional norms and public policies to guide thesystemic transformation processes. Every response in terms of enhancedresource mobilization engendering more of the same interactions is the resultof the knowledge-sharing process between institutions, agents, variables andtheir dynamic knowledge-induced interrelationships.
The interactive implications of Figure 2.1 are once again seen here in thecontext of human development. Every circular flow is marked by theattainment of convergent �-values that comes about by interactions amongmany such knowledge values and emerging diversity of human possibilities.These convergent �-values mark regimes of social consensus on given issuesunder discourse. The continuity of the circular interrelations at higher levelsof realization of resource mobilization is the meaning of creative evolution.Such a creative evolution is to be understood as the ethical relationship of
HD, military expenditure and social wellbeing 23
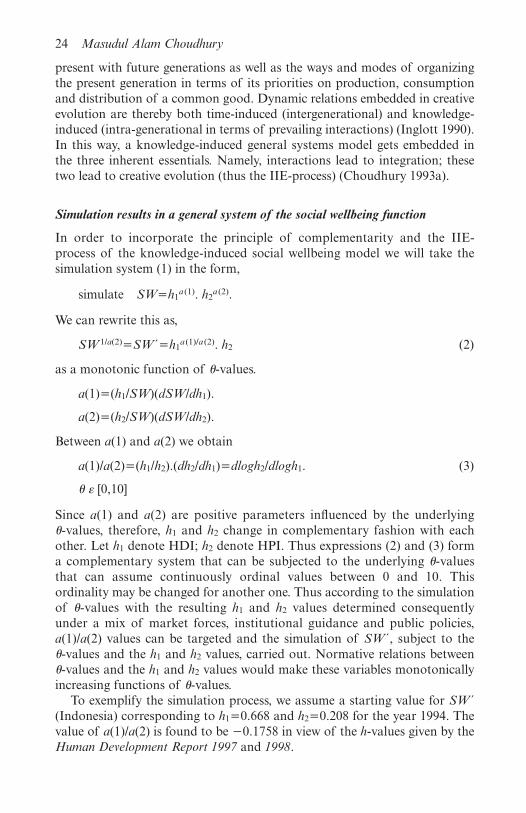
present with future generations as well as the ways and modes of organizingthe present generation in terms of its priorities on production, consumptionand distribution of a common good. Dynamic relations embedded in creativeevolution are thereby both time-induced (intergenerational) and knowledge-induced (intra-generational in terms of prevailing interactions) (Inglott 1990).In this way, a knowledge-induced general systems model gets embedded inthe three inherent essentials. Namely, interactions lead to integration; thesetwo lead to creative evolution (thus the IIE-process) (Choudhury 1993a).
Simulation results in a general system of the social wellbeing function
In order to incorporate the principle of complementarity and the IIE-process of the knowledge-induced social wellbeing model we will take thesimulation system (1) in the form,
simulate SW�h1a (1). h2
a (2).
We can rewrite this as,
SW1/a(2)�SW´�h1a (1)/a (2). h2 (2)
as a monotonic function of �-values.
a(1)�(h1/SW)(dSW/dh1).
a(2)�(h2/SW)(dSW/dh2).
Between a(1) and a(2) we obtain
a(1)/a(2)�(h1/h2).(dh2/dh1)�dlogh2/dlogh1. (3)
� � [0,10]
Since a(1) and a(2) are positive parameters influenced by the underlying �-values, therefore, h1 and h2 change in complementary fashion with eachother. Let h1 denote HDI; h2 denote HPI. Thus expressions (2) and (3) forma complementary system that can be subjected to the underlying �-valuesthat can assume continuously ordinal values between 0 and 10. Thisordinality may be changed for another one. Thus according to the simulationof �-values with the resulting h1 and h2 values determined consequentlyunder a mix of market forces, institutional guidance and public policies,a(1)/a(2) values can be targeted and the simulation of SW´, subject to the �-values and the h1 and h2 values, carried out. Normative relations between�-values and the h1 and h2 values would make these variables monotonicallyincreasing functions of �-values.
To exemplify the simulation process, we assume a starting value for SW´(Indonesia) corresponding to h1�0.668 and h2�0.208 for the year 1994. Thevalue of a(1)/a(2) is found to be �0.1758 in view of the h-values given by theHuman Development Report 1997 and 1998.
24 Masudul Alam Choudhury

Next with a proper mix of social and economic policies, institutionalcoordination in the process of decision-making with endogenous changes inthe preferences of households and producers on the nature of goods andservices in demand and supply, �-values get simulated. Consequently, thevalues of a(1)/a(2) and of h1 and h2 vary monotonically with the �-values. Thisis done by setting a range of values for a(1)/a(2) by observing the values fordlogh2/dlogh1�(percentage change in h2)/ (percentage change in h1) in recentyears.
For the period 1994–5, the Human Development Report 1997 and 1998 yielddlogh2/dlogh1��0.0029/0.0165��0.1758 Consequently, the simulated valueof SW´ is determined. In general we obtain the simulation system,
SW´�SW1/a(2)�h1a(1)/a(2). h2�h1
�0.1758. h2
For h1�0.668, h2�0.208, SW´�0.208�0.668�0.1758. We will consider this asour stage 1 of the simulation corresponding to the ordinal value of ��1.
In stage 2 for the ordinal assignment of ��0, h1�0.679, h2=0.202,SW´�0.202�0.679�0.1758. Here the choice of � is below that for the firststage because SW´(stage 2) < SW´(stage 1).
Alternatively, in the context of further simulating a normative value ofthe above-mentioned values, we may choose dlogh2/dlogh1�1. Consequently,for h1�0.679, h2�0.202, SW´�h1.h2�0.1372. We will consider this to bestage 3 of our simulation corresponding to the ordinal value of ��3, for nowSW´(��3) > SW´(��1).
Such a simulation of the human development values would proceed withother recursive choices in accordance with the human development focusand in the context of prevailing policy/institutional conditions in Indonesiawith the knowledge-forming ordinal values being assigned, such as ���*.
The computed values corresponding to one such simulation is given inFigure 2.2.
HD, military expenditure and social wellbeing 25
Stage 1:[��1, h1�0.668, h2�0.208, a(1)/a(2)��0.1758; SW´(1)�0.208�0.668�0.1758]
↓Stage 2:
[��2, h1�0.679, h2�0.202, a(1)/a(2)��0.1758; SW´�0.202�0.679�0.1758]↓
Stage 3:[��3, h1�0.679, h2�0.202, a(1)/a(2)�1; SW´�0.1372]Here a(1)/a(2)�1 is assumed as a target value for ��3,
indicating that poverty index is directly responding to gains in human developmentindex.
Stage 4:[��4, h1�0.681, h2�0.277, a(1)/a(2)�1; SW´�0.1886]
etc.
Figure 2.2 Simulation of a social wellbeing function with HDI estimates.
Source: Human Development Report 1999.

Clearly SW´(��2)<SW´(��1); but SW´(��3)>SW´(��1). Also, SW´(��4)>SW´(��3)>SW´(��1), a monotonic increase. These relations pointto a non-linear scenario to arise from the simulation of human developmentas the process proceeds rather than human development being associatedwith an optimization of the social wellbeing index.
We note in the above simulation of the social wellbeing function of humandevelopment that the attainment of target values of the h-indices, the post-evaluation of SW´-values, and further creative evolution of similar patternsof change in the IIE framework, depend centrally on emerging �-values.These simulated �-values are the result of agent-specific, institutional andscientific relations among the variables (e.g. as in the case of ecology).
In the case of Indonesia we can infer a number of policy directions fromthe above simulation result in the light of the prevalent conditions (IMF1999). Table 2.1 points out that between 1997 and 1998 severe decline inoutput growth has been accompanied by high inflation pressure and externalsector imbalance. In the face of high inflation and a plummeting exchangerate, Indonesian interest rates had to be increased substantially.
On the human development front we note that while macroeconomicindicators such as the pursuit of economic growth by export orientation andstructural adjustment are policies for attaining high economic growthregimes, the same may not be to the benefit of social wellbeing. Structuraladjustment under the IMF policy agenda has always meant a downsizing ofbusinesses and a reduction in subsidy. For Indonesia, such measures havefallen on the common man. Employment and real earnings have declined torecord low in recent decades, proving that the goal of economic growth wasalways fraught with underlying uncertainties, and these have now let up inthe face of increased dependence on foreign capital followed by outflow.
26 Masudul Alam Choudhury
Table 2.1 Some critical macroeconomic indicators for Indonesia (percentages)
1997 1998
Q1 Q2 Q3 Q4 Q1 Q2 Q3 Q4
Output growth 7.7 6.6 3.3 2.4 �4.0 �12.3 �18.4 �19.5Inflation 5.2 5.1 6.0 10.1 29.9 52.2 79.7 79.2Import value growth 11.0 �7.8 �2.6 �10.1 �31.3 �26.9 �31.2 �38.8Export value growth 10.4 7.5 9.6 2.4 �1.0 �10.5 �6.3 �22.4
Crisis Asian countries:(billions US dollars)
1993 1994 1995 1996 1997 1998 1999 2000
Net private capital flows 31.9 33.2 62.5 62.4 �19.7 �45.3 �25.7 �11.1Net direct investment 6.7 6.5 8.7 9.5 12.1 4.9 8.6 8.3Net portfolio investment 16.5 8.3 17.0 20.0 12.6 �6.5 �3.3 5.9Other net investment 8.7 18.4 36.9 32.9 �44.5 �43.6 �30.9 �25.4
Source: IMF, May 1999, World Economic Outlook.

Much of this is found to be made of portfolio investment (Table 2.1). Netdomestic investment remained low and marked a negative outflow.
In the light of human development perspectives as indicated by targets forsocial wellbeing simulated in Figure 2.1, the Indonesian political economyshould focus more on the internal restructuring of resource mobilization byand among the local communties. This calls for opening up domestic pro-duction for the large domestic markets, developing enterpreneurship, entitle-ment and empowerment. This could result in a turnaround in domesticinvestment and its retention while encouraging foreign direct investment tofurther enhance entrepreneurship at home. Speculative portfolio investmentsmust be avoided. The capital markets and financial instruments must thus bedirected to real economic activities away from speculation. The revenues sogenerated should then be allowed to flow within the domestic economythrough incentives on financing modes and newly developed investmentalternatives that are accessible by the local entrepreneurs. Governmentrevenues would be based on an accentuation of incomes and fiscal policieswith attention to monetary policy where this can enhance the other policies.There is very little wisdom for Indonesia at this time in repeating the debaclethat followed years of blind pursuit of the growth paradigm of growth-ledeconomic development, wherein dependence rather than self-reliance markedthe human development future of the citizenry. Poverty alleviation and eco-nomic security were not sustainable. The same social and economic scenariohas also marked the prevalent status of the bumiputeras in Malaysia.Dependence, rentiership and deepening moral hazard caused by economicuncertainty and crony capitalism, rather than self-reliance and entrepreneur-ship, followed regimes of economic growth (Mehmet 1988).
Comparative examination of trends in the components ofhuman development indices
In the case of simulating progress towards a better human developmentfuture in the above social wellbeing treatment, we need to examine whichpriorities need most immediate attention for Indonesia. Here we refer toTable 2.2.
A comparison of the vital HD-indices and their components for Indonesiawith the average for the corresponding medium range human developmentindices reveals a robust state for the former. A priority area for attention bypublic policy is the need for improvement in the health of children under theage of 5 years. Hence in our simulation exercise interrelating HDI to HPI-1,the priority of child wellbeing can be one of the critical areas where greaterefforts within the Indonesian development plans should be made.
Yet another inference we can draw from the comparative statistics given inTable 2.2, and from the prevailing financial, economic and political turmoilraging in Indonesia, is that sheer human development indices computed asisolated measures from each other cannot answer the nature of interrelation-
HD, military expenditure and social wellbeing 27

28 Masudul Alam Choudhury
Table 2.2 Various human development indices and their components for Indonesia,1995 (value and percentages)
Indonesia, Human Development Index (value): 0.679Life expectancy 64.0Adult literacy rate 83.8Gross enrolment ratio 62.0Adjusted real GDP (PPP$) value 3,971
Medium Human Development (value): 0.670Life expectancy 67.5Adult literacy rate 83.3Gross enrolment ratio 66.0Adjusted real GDP (PPP$) Value 3,390
Indonesia, Gender-related Development Index (value): 0.651Life expectancy 65.8 (F) 62.2 (M)Adult literacy rate 78.0 (F) 89.6 (M)Gross enrolment ratio 59.1 (F) 61.3 (M)Share of earned income 33.0 (F) 67.0 (M)
Medium Gender-related Index (value): 0.656Life expectancy 69.7 (F) 65.4 (M)Adult literacy rate 76.9 (F) 89.5 (M)Gross enrolment ratio 63.7 (F) 64.9 (M)Share of earned income 36.4 (F) 63.6 (M)
Indonesia, Gender Empowerment Measure (value): 0.365Seats in parliament held by women 11.4Female administrators and managers 6.6Female professional and technical workers 40.8Women’s share of earned income 33.0
Medium Gender Empowerment Measure (value): N.A.
Indonesia, Human Poverty Index (percentage): 20.2People not expected to survive to age of 40 years 13.0Adult literacy rate 16.2Population without access to
Safe water 38.0Health services 7.0Sanitation 49.0
Underweight children under the age of 5 years 34.0Children not reaching grade 5 10.0Real GDP per capita
Poorest 20% ($) 1,422Richest 20% ($) 6,654
People below income poverty line$1.00 a day 14.5National poverty line 8.0

ships among the critical components. The study of such interrelationships inhuman development indices is important for identifying the feedback causeand effect interrelationships among the critical priority areas for publicpolicy development. One such interactive index that we have proposed in thischapter is the social wellbeing function studied within a systemic frameworkof interrelationships with respect to human development indices. Subse-quently, these indices can be further disaggregated into their componentsand a more extended general system, adopted with respect to a moreextensive specification of the social wellbeing function, can be undertaken.
We note that an important composite index that has not been taken up inthe computation of the human development measures is that reflecting thenature of politico-economic analysis. Such an index permits the study ofinteractions among the composite indices and their variables. Once againsuch an index can be taken as the social wellbeing function within thegeneral systems oriented specification shown by the expressions in (1). Theidea of political economy is understood here in terms of the interactive,integrative and evolutionary features of the IIE-process. In the absence ofsuch features, the composite measures of human development indices remainto be isolated indicators in themselves. They simply indicate the state ofhuman development measures as they are, but have no power of explainingthe normative factors underlying goals and directions for socio-economictransformation.
In the case of Indonesia, for instance, such linear composite measures ofhuman development could not point out the social disorder that wasbrewing just prior to the financial and economic crisis. The brewing socialdisorder was clouded by sheer socio-economic indicators, as institutionalparticipation of the common citizens in the construction of the future vision
HD, military expenditure and social wellbeing 29
Table 2.2 (continued)
Medium HPI-1 Estimates (value): N.A.People not expected to survive to age of 40 years 9.0Adult literacy rate 19.6Population without access to
Safe water 31.0Health services 13.0Sanitation 61.0
Underweight children under the age of 5 years 19.0Children not reaching grade 5 11.0Real GDP per capita
Poorest 20% ($) 848Richest 20% ($) 5,750
People below income poverty line$1.00 a day 25.9National poverty line 15.0
Source: UNDP 1998, Human Development Report 1998.

of Indonesia remained ignored. A grassroots participatory vision calls fordecentralized involvement of all ranks of society in economic, institutionaland political processes. Consequently, transparency in economic dealings, thefinancing of giant projects without the common weal, and the costly way ofbuilding Indonesia on risky foreign capital along with the flight of speculativecapital from Indonesia, remained hidden in the political hegemony of anautocratic government. The absence of grassroots participation contributedto the subsequent financial, economic and political demise of Indonesia.Thus the absence of a measure in the existing linear forms of the humandevelopment indices that could explain the political economy of developmentdid not lend full meaning to these indices for Indonesia.
In the absence of a truly interactive measure of the type shown by thesocial wellbeing function, the linear forms of the human developmentindices could not provide both the normative as well as the positive effects ofhuman participation in the national planning of Indonesia (World Bank1997). In the absence of such an interactive process-oriented measure forevaluation of the economic and political process in Indonesia, theIndonesian government instead took to the enactment of macroeconomicpolicies. These proved to be those prescribed by the International MonetaryFund. They led the Indonesian economy into a spiral of contraction insubsidy, structural downsizing of economic enterprises, high unemployment,spiralling inflation, soaring interest rates and rigorous fiscal restraint.Monetary and structural adjustment policies that were adopted could notstabilize the exchange rate, price levels and debts in the face of an outflow offoreign capital and foreign reserves. High interest rates together with thepolitical uncertainty discouraged foreign direct investments. In the end, themacroeconomic policies adopted could not tackle the structural problemsof development that lay at the grassroots level. The integration ofmacroeconomic policies with the microeconomic policymaking reduced theusefulness of the human development indices as meaningful indicators forsocio-economic development for Indonesia.
Social wellbeing and military expenditure
In this part of the chapter I will use yet another measure of social wellbeingto show that in the context of military expenditure and social wellbeing therehas been less than sound result for many of the Middle Eastern countries. Ihave provided empirical evidence below.
Our objective in this section is to estimate the degree to which any per-ceptible cutback in military expenditure would have had an effect onincreased spending on social wellbeing in recent times. We will measure thisrelationship between military expenditure cuts and social wellbeing bymeans of statistical trends in the percentage change in human developmentindex relative to the percentage change in military expenditure. Sucha measure is the elasticity of social wellbeing with respect to military
30 Masudul Alam Choudhury

expenditure cutback. By investigating such a sensitivity index between HDIand military expenditure we will show that the recent observation by theIMF on the existence of an inverse trend between social spending andmilitary expenditure for a sample of countries surveyed does not explainthe issue of sensitivity between the two indicators. The IMF conclusionthus remains incomplete and inadequate for policy development relating tomilitary expenditure and social spending in attaining social wellbeing. Weneed to use more extensive methods to arrive at appropriate results forpolicy inference.
Present state of military expenditure and social wellbeing in developing countries
Table 2.3 points out that the statistical observation made by the IMFrespecting a reduction in global military expenditure in recent years (IMFSurvey, June 1999) and its enhanced effect on social spending, cannot beestablished in terms of the sensitivity relationship between HDI and militaryexpenditure. One would wish the decline in military expenditure to result inan increase of funds made available by the peace dividends for their use insocial uplift, including debt relief for the least developing countries (SouthCommission 1990; Stockholm Initiative 1991). Consequently, a realignmentof international relations under the globalization agenda on trade and socio-economic development should have resulted in a development fund formeeting new challenges of social and economic transformation in thedeveloping countries.
The debate surrounding the costs and benefits to the developing countriesof globalization has been a vehement one. Today this debate extends fromissues relating to the moral duties of the industrialized countries in coveringthe costs and debacles of uncertainty brought about by privatization andeconomic restructuring agenda in the developing world to problems ofsustainability of development under capitalist globalization (Thurow 1996).The debate can be encapsulated in our measure of social wellbeing.
The social wellbeing measure has its roots in economic theory (Sen 1982).Yet it has not been investigated thoroughly in the literature on ethics andeconomics, which is the underlying theme of this paper. Consideration ofethics and economics in issues of development is one that turns arounddeontological consequentialism where Sen (1987) and Rawls (1971) havecontributed. The duty-bound stance of morality in promoting socialwellbeing of the developing world by development organizations, far frombeing a self-centered game of Eurocentric hegemony, should in fact belooked upon as a duty that brings common benefits to the recipient and thedonor. In the consequentialist perspective, the market process, even in theface of privatization and globalization, should be one that leads towardsethical ways of realizing economic exchange. Examples of such commonbenefits are to be found in issues of human ecological sustainability on the
HD, military expenditure and social wellbeing 31
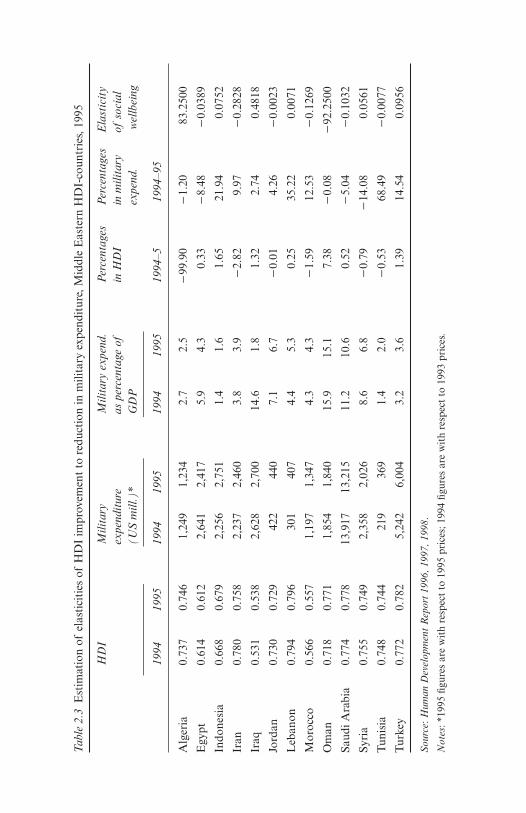
32
Tab
le 2
.3E
stim
atio
n of
elas
tici
ties
of
HD
I im
prov
emen
t to
red
ucti
on in
mili
tary
exp
endi
ture
,Mid
dle
Eas
tern
HD
I-co
untr
ies,
1995
HD
I M
ilita
ry
Mili
tary
exp
end.
Per
cent
ages
Per
cent
ages
E
last
icit
yex
pend
itur
e as
per
cent
age
ofin
HD
I in
mili
tary
ofso
cial
(US
mill
.)*
GD
Pex
pend
.w
ellb
eing
1994
1995
1994
1995
19
94
1995
1994
–519
94–9
5
Alg
eria
0.73
70.
746
1,24
91,
234
2.7
2.5
�99
.90
�1.
20
83.2
500
Egy
pt0.
614
0.61
22,
641
2,41
75.
9 4.
30.
33�
8.48
�0.
0389
Indo
nesi
a0.
668
0.67
92,
256
2,75
11.
4 1.
61.
6521
.94
0.07
52
Iran
0.78
00.
758
2,23
72,
460
3.8
3.9
�2.
829.
97�
0.28
28
Iraq
0.53
10.
538
2,62
82,
700
14.6
1.
81.
322.
740.
4818
Jord
an0.
730
0.72
942
244
07.
1 6.
7�
0.01
4.26
�0.
0023
Leb
anon
0.79
40.
796
301
407
4.4
5.3
0.25
35.2
20.
0071
Mor
occo
0.56
60.
557
1,19
71,
347
4.3
4.3
�1.
5912
.53
�0.
1269
Om
an0.
718
0.77
11,
854
1,84
015
.9
15.1
7.38
�0.
08�
92.2
500
Saud
i Ara
bia
0.77
40.
778
13,9
1713
,215
11.2
10
.60.
52�
5.04
�0.
1032
Syri
a0.
755
0.74
92,
358
2,02
68.
6 6.
8�
0.79
�14
.08
0.05
61
Tun
isia
0.74
80.
744
219
369
1.4
2.0
�0.
5368
.49
�0.
0077
Tur
key
0.77
20.
782
5,24
26,
004
3.2
3.6
1.39
14.5
40.
0956
Sou
rce:
Hum
an D
evel
opm
ent
Rep
ort
1996
,199
7,19
98.
Not
es:*
1995
figu
res
are
wit
h re
spec
t to
199
5 pr
ices
;199
4 fig
ures
are
wit
h re
spec
t to
199
3 pr
ices
.

ethical side (Korten 1996) and in sustainable development on the economicside (Brundtland 1987). The resources for both of these goals reinforce thoseof the other through complementarity between themselves rather than bymarginal substitution as found in neoclassical economics (Daly 1992). Arange of interactive issues and variables including policy parameters is thenfound to exist in complementarity among each other within the criterion ofsocial wellbeing (Choudhury 1993b).
In Table 2.3, the elasticity measure, EHDI,M, for social wellbeing repre-sented by HDI, is given by,
EHDI,M�%(change in HDI)/% (change in military expenditure).
The value for EHDI,M is expected to be negative if the IMF hypothesis of aninverse relationship between social spending and military expenditure forinculcating social wellbeing were to hold. Hence a value such as, EHDI,M��0.0389 (Egypt) would conform with this inference. However, EHDI,M�83.25(Algeria) does not conform with the IMF’s expected relationship betweenmilitary expenditure and social wellbeing represented here by HDI. Manysimilar country-specific anomalies are found in Table 2.3. See the note at theend of the chapter for a further formalization of the elasticity conceptsensitivity introduced here.
Let us make an interpretation of the elasticity of social wellbeing.Although in many cases in Table 2.3 it is true that a cutback in militaryexpenditure is observed to be associated with an increase in HDI, yet this isnot a generalized fact. In several cases the two indicators are found to havemoved up or down together. The elasticity concept provides the degree ofsensitivity between HDI as a measure of social wellbeing included in whichis social spending and military expenditure. The HDI being a composite ofseveral social variables would be an appropriate measure to test thehypothesis of an inverse relationship between HDI and military expenditure.The IMF has recently tried to draw an observation that global cutback inmilitary expenditure has brought about enhanced social spending. The samewould also have been expected of returns from the so-called peace dividendsto the developing countries following the end of the East–West détente. Thepeace dividends were never realized.
According to the underlying hypothesis here we would expect that anincrease in military expenditure would be followed by a decrease in HDI andvice versa. The elasticity would then be a negative value. However, if the twoindicators move together then the elasticity would acquire a positive value.The magnitude of the elasticity value would indicate the sensitivity betweenboth indicators moving together, either upwards or downwards. Because ofthis anomaly in the interpretation of the elasticity of social wellbeingrepresented by the percentage change in HDI with respect to the percentagechange in military expenditure, we infer that there cannot be a meaningfulaffirmation of the observation made by the IMF. We are examining this
HD, military expenditure and social wellbeing 33

question with respect to the issue of sensitivity between the two indicators.The IMF has estimated a slowdown in global military expenditure of 2.3–2.5per cent of world GDP by the year 1998 (IMF Survey, June 1999). In 131countries surveyed the percentage share of GDP for military expenditure isfound to have remained almost unchanged between 1997 and 1998. Theinference that the IMF makes out of this trend is that the slowdown inmilitary expenditure has led to an increase in social spending.
Yet when we study the relational question between HDI as a measure ofsocial wellbeing and military expenditure (expansion or contraction) bymeans of the elasticity measure conveying sensitivity between the twoindicators, we cannot ratify the IMF’s inference for the sample of countriesin Table 2.1. Thus the inference derived from the sample of countries studiedby the IMF cannot provide a generalized relationship which the IMF intendsin the following words (IMF Survey, June 1999: 187): ‘In these countries thereduction in military outlays was accompanied by an increase in spending oneducation and health care as a proportion of GDP and total spending.’Besides, it is also not correct to conclude in generalized terms that ‘educationand health care spending fell in relation to GDP between 1993 and 1997’ inthe Middle East countries (IMF Survey, June 1999: 187).
According to our argument it is the sensitivity of HDI to military expen-diture that is the important criterion for deriving any relational inferencebetween the two indicators. A mere observation of trends in militaryexpenditure and spending on health and education as percentages of totalspending and GDP, is not sufficient to arrive at any meaningful conclusionon the relationship between social wellbeing and military expenditure for thepurpose of policy development.
We also note from Table 2.3 that there was no predictive relationshipduring 1994–5 between military expenditure as a percentage of GDP and ameasure of social wellbeing. We can readily note from the relationship givenbelow that no precise inference for policy development on social wellbeingcan be made in this regard from the IMF’s observation on an inverserelationship between military expenditure and social spending as percentagesof GDP.
The quantitative inadequacy of the simple relationship between socialwellbeing and military expenditure
To prove our contention relating to the inadequacy of the simple nature ofthe IMF’s observation in explaining the relationship between social spendingand military expenditure, we proceed as follows:
Consider the relationship,
M/Q�a; that is, M�a.Q,
where, M denotes military expenditure; Q denotes GDP; a is the (M/Q) ratio.
34 Masudul Alam Choudhury

We rewrite the above expression as,
%(change in M)�a.%(change in Q).
In terms of the elasticity relationship of Table 2.3 we can write,
%(change in HDI)/EHDI,M�%(change in M)�a.%(change in Q).
Thereby, %(change in HDI)�a. EHDI,M . %(change in Q).
Thus, %(change in HDI)/%(change in Q)�(M/Q). EHDI,M.
Since the sign of EHDI,M remains dubious with respect to the variablerelationship between HDI and M, as shown in Table 2.3, therefore therelationship between HDI and Q in terms of percentage changes and the(M/Q) ratio also remains dubious. Such a dubious result thereby, does notcontribute to policy development relating to social wellbeing.
Conclusion: policy perspectives
We note that the human development indices have been a significant innov-ation in the computation of measures of development compared to thetraditional reliance on the indicator of real GDP per capita. The mostimportant perspective in this regard has been the treatment of ethical issuessurrounding poverty, entitlement and empowerment taken up by gender (Sen1986). Yet when it comes to the explanation of the forces underlying thepolitical economy of development as a complex process of interrelationshipsamong agents, variables and their relations, the human development indicesare still found to be linear composite measures. They cannot explain theeconomic, social, institutional and political forces that ride the crest of theglobalizing process in which today’s nations are engulfed.
In recent times, the economic and financial turmoil in East Asianeconomies has adequately proven that macroeconomic policy enactmentgoverned by a predominantly monetarist agenda promoting privatization,economic efficiency, economic productivity and savings regimes with highinterest rates and risky investor behaviour at the expense of proactivefiscalism, cannot comprehend the microeconomic social needs that lie at thegrassroots (UNDP 1999). Since human development indices focus on theethical issues of development (Goulet 1995), it is important for them toproject both the normative as well as the positive nature of interactionsinvolving the grassroots in every echelon of national planning. A furtherimprovement of the human development indices should be along thesedirections. We have proposed one such interactive measure in a knowledge-induced framework of the interactive, integrative and evolutionary model ofdevelopment. Its criterion function was substantively defined as the socialwellbeing function.
HD, military expenditure and social wellbeing 35

Our brief examination of the question of estimating the relationshipbetween military expenditure and social wellbeing shows that this is a sub-stantively involved exercise. It cannot be simply established in a straight-forward way by observing trends in military and social spending aspercentages of GDP. Such an observation has been the basis for IMF’sgeneralized inference on a suspected inverse relationship between globalmilitary cutback and social spending. Yet contrary to this fact, the peacedividends that were supposed to flow to the developing countries after theend of the East–West détente did not occur. The flow of Official Develop-ment Assistance to the developing countries has not increased so as toenable these countries to maintain their social safety net even in the face of adecline in military expenditure. Between 1994 and 1995, which is our time-period of study, ODA per capita to developing countries changed from amere US$10.6 to US$11.0, ignoring inflationary effects on these amounts inthe recipient countries. For the least developing countries the change inODA per capita was from US$28.3 in 1994 to US$29 in 1996, being furthersubject to discounting for inflation (UNDP 1996, 1997).
The social wellbeing criterion used in this paper in terms of percentagechange in HDI with respect to percentage change in military expenditure isessentially a measure of sensitivity of the relationship between militaryexpenditure and social spending. We arrived at the inference that neithera reduction nor an expansion in military expenditure is a necessary andsufficient cause for betterment or worsening of the percentage change in HDI,taken up in all possible combinations in several of the thirteen countriesexamined in Table 2.3.
A host of important variables are to be considered in understanding therelationship between military expenditure and social spending. This wouldinclude the cause and effects of such other variables on the relationshipbetween social wellbeing and military expenditure. For example, defenceexpenditure may in fact be a necessity for the purpose of internal security ofnation states at a time of unresolved regional conflicts, even as the worldprogresses towards greater economic integration under globalization. Thereis also the need for additional premiums, perhaps raised by the Tobin Tax oninternational capital flows, to stabilize the economies that have been batteredby the global financial and economic turmoil. In such countries, economicrestructuring and fiscal restraints together with the losses to marginal saversin capital markets have caused a substantial decline in social wellbeingdespite the cutback in military expenditure.
Thus the relationship between social wellbeing and military expenditureneeds to be studied within a complex of conditions, variables and relations.Some of these variables may well be complements to each other rather thanbeing substitutes in relation to defence expenditure for reasons of nationalsecurity. Consequently, one cannot infer readily that a generalized inverse rela-tionship between military expenditure and social spending is a necessary impli-cation of social wellbeing, as the IMF would otherwise expect us to believe.
36 Masudul Alam Choudhury

Note
The nature of the elasticity of social wellbeing in terms of HDI and M implies thatHDI and military expenditure are related to a social wellbeing function of the type,
log (HDI)�E . log (M)�autonomous coefficient.
That is, HDI�A.ME, with A>0 as an autonomous coefficient; E<0, if the IMFinference on an inverse relationship between military expenditure and social spending(incorporated in HDI as a measure of social wellbeing) is to hold.
Contrarily, in our case of measuring sensitivity between the two variables, HDIand M, E remains a testable parameter, on the basis of which policy development canbe charted. The complexity of the relationship arises from the fact that HDI and Mcan be together related to variables such as ODA, Peace Dividends (PD), NationalSecurity (NS). Through these variables it is quite possible that a general system likethe following could engender complementarity rather than substitution between HDIand defence expenditure:
HDI�HDI(ODA, PD, NS); M�M(ODA, PD, NS) are functional relations.
HDI�A.ME would imply that
HDI(ODA, PD, NS)�A.[M(ODA, PD, NS)]E.
Now a system of circular causation equations can result for each of the (ODA, PD,NS)-variables in terms of the other ones, even if any of the two, HDI or M, were tobe targeted by policy goals.
The complexity of the above system will multiply if A becomes institutionallyinduced as in the case of a technological change parameter. This would likelyhappen since our variables in the above system of equations are all time-dependent.
References
Arrow, K.J. (1963) Social Choice and Individual Values, New Haven, Conn.: YaleUniversity Press.
—— (1974) The Limits of Organization, New York: W.W. Norton.Bellman, R. (1957) Dynamic Programming, Princeton, NJ: Princeton University Press.Brundtland, G.H. (1987) Our Common Future, New York: Oxford University Press.Choudhury, M.A. (1993a) ‘A critical examination of the concept of Islamization of
knowledge in contemporary times’, Muslim Education Quarterly, vol. 10, no. 4,pp. 3–35.
—— (1993b) ‘Towards a general theory of Islamic social contract’, in The UnicityPrecept and the Socio-Scientific Order, Lanham, Madison: The University Press ofAmerica.
—— (1996) ‘Why cannot neoclassicism explain resource allocation and developmentin the Islamic political economy?’, in E. Ahmed (ed.) Role of Private and PublicSectors in Economic Development in an Islamic Perspective, Herndon, VA:International Institute of Islamic Thought, pp. 17–45.
—— (1998) ‘Human resource development in the Islamic perspective’, in Studies inIslamic Social Sciences, New York: St. Martin’s Press, pp. 146–79.
HD, military expenditure and social wellbeing 37
Daly, H.E. (1992) ‘From empty-world to full-world economics: reorganizing anhistorical turning point in economic development’, in R. Goodland, H. Daly, S.el-Serafy and B. von Droste (eds) Environmentally Sustainable Economic Develop-ment: Building on Brundtland, Paris: UNESCO.
Drucker, P. (1998) ‘The new society of organizations’, in On the Profession ofManagement, Boston, MA: Harvard Business Review Book, pp.115–31.
Fischer, S. (1997) Capital Account Liberalization and the Role of the IMF,Washington, DC: IMF, Sept.
Goulet, D. (1995) Development Ethics, A Guide to Theory and Practice, New York:The Apex Press.
International Monetary Fund (1999) ‘Military spending continues to stabilize; somecountries increase social spending’, IMF Survey, June.
Inglott, P.S. (1990) ‘The common heritage and the rights of future generations’, in S.Busuttil, E. Angius, P.S. Inglott and T. Macelli (eds) Our Responsibilities TowardsFuture Generations, Malta: Foundations for International Studies.
Korten, D. (1996) When Corporations Rule the World, London: Earthscan.Mehmet, O. (1988) Development in Malaysia, Poverty, Wealth and Trusteeship, Kuala
Lumpur: The Institute of Social Analysis.Obstfeld, M. (1998) ‘The global capital market: benefactor or menace? Journal of
Economic Perspectives, vol. 12, no. 4 (Fall), pp. 9–30.Rawls, J. (1971) A Theory of Justice, Cambridge, MA: Harvard University Press.Sen, A. (1987) ‘Economic behaviour and moral sentiments’, in On Ethics and
Economics, Oxford: Basil Blackwell.—— (1982) ‘Rights and agency’, Philosophy and Public Affairs, vol. 11, no. 1
(Winter).—— (1986) ‘Poverty and entitlement’, Poverty and Famines, an Essay on Entitlement
and Deprivation, Oxford: Clarendon Press.—— (1991) ‘Well-being, agency and freedom’, in On Ethics and Economics, Oxford:
Basil Blackwell.SESRTCIC (Statistical, Economic and Social Research and Training Center for
Islamic Countries) and ICDT (Islamic Center for Development of Trade) (1994)‘The Uruguay Round of trade negotiations: a preliminary assessment’, Journal ofEconomic Cooperation among Islamic Countries, vol. 15, nos. 1–2, pp. 1–91.
Shackle, G.L.S. (1971) Epistemics and Economics, Cambridge: Cambridge UniversityPress.
Simon, H.A. (1957) ‘A comparison of organizational theories’, in Models of Man,New York: John Wiley & Sons, pp. 170–82.
South Commission (1990) ‘North–South relations and the management of theinternational system’, in The Challenge to the South, Oxford: Oxford UniversityPress.
Stockholm Initiative (1991) Common Responsibility in the 1990s, the StockholmInitiative in Global Security and Governance, Stockholm: The Prime Minister’sOffice.
Summers, L.H. (1999) ‘Distinguished lecture on economics in government: reflectionson managing global integration’, Journal of Economic Perspectives, vol. 13, no. 2,pp. 3–18.
Thurow, L. (1996) The Future of Capitalism, London: Nicholas Brealey Publishing Ltd.UNDP (United Nations Development Program) (1996, 1997) Human Development
Report, New York: Oxford University Press.
38 Masudul Alam Choudhury

—— (1998) Human Development Report 1998, New York: Oxford University Press.—— (1999) Human Development Report 1999, New York: Oxford University Press.Whittaker, J.K. (1987) ‘The limits of organization revisited’, in Feiwel, G.R. (ed.)
Arrow and the Foundations of the Theory of Economic Policy, London: MacmillanPress Ltd., pp. 565–83.
World Bank (1997) ‘Eradicating human poverty worldwide – an agenda for the 21stCentury’, in World Development Report 1997, New York: Oxford University Press.
—— (1998) World Development Report 1998. Knowledge for Development, New York:Oxford University Press.
HD, military expenditure and social wellbeing 39

3 The problem of brain drain
B.N. Ghosh and Rama Ghosh
Introduction
The Biblical prediction that ‘unto every one who hath shall be given; andfrom him that hath not, even that he hath shall be taken away’ is perhapsbest illustrated by the developed capitalist countries’ efforts to draw awaystrategic manpower from the poor countries. Brain drain, representing theoutflow of underutilised or overutilised skilled manpower from the lowdeveloped countries (LDCs) to developed countries (DCs) en masse, and ona regular scale, has received a considerable amount of attention in theliterature on economic development of the Third World countries.1 Theproblem of brain drain has been made a part of the explanation ofeconomic backwardness and reverse transfer of technology.
The nationalist and internationalist approaches to the problem of braindrain have led to diametrically opposite findings. While to an internation-alist, brain migration is a welfare-income-development maximising naturalprocess, to a nationalist, it is a perverse process leading to loss of income,welfare and development, and a widening of international inequality betweenDCs and LDCs. However, the international political economy aspects ofbrain drain have not been analysed in detail. Needless to say, the back-wardness of the developing countries is the main cause of brain drain, andconversely, it is the brain drain itself which contributes to curbing thedevelopment process of these countries. This is so because the outflow ofhigh quality manpower (HQM) constitutes a loss to the sending country inthe sense that although such manpower is vitally important in the drama ofdevelopment of LDCs, it is wooed away by the deliberate neocolonialistpolicy of the DCs. The losses involved in brain drain have severalsocioeconomic dimensions.2 It is an empirical truth that a country followinga colonial development policy generates a higher magnitude of brain drainthan is otherwise possible.
It is a pity that international trade in beans and bananas has been welldocumented, but not the import and export of human capital; and while theexport of even an ordinary commodity fetches its price, the export of brainpower never brings anything back to its owner country. On the contrary, the
40 Author name

claim for compensation to the LDCs has just been ignored or willy-nillybrushed aside by the DCs through apologetic theorising by the so-calledinternationalists to protect the colonial interests.3 They also design theoreticmodels to demonstrate that free flow of factors of production, which is apart and parcel of basic human rights, ensures maximisation of income,output and welfare and that, since the LDCs cannot productively absorb theHQM, its outflow does not constitute drain but is simply an overflow,relieving the affected countries of their menacing problem of educatedunemployment (Baldwin 1970). However, this type of approach to theproblem is based on feather-bedding arguments.
The present chapter seeks to argue that the problem of brain drain isgenerated and intensified by the deliberate neo-imperialistic policy ofdeveloped capitalist countries which are still exploiting the LDCs under thenew cloak of so-called foreign aid and development assistance programmes.In fact, brain drain can be viewed as a problem of reverse flow of technologyfrom the LDCs to the DCs rather than the other way round. The exploit-ation continues unabated but in a different fashion in the sense that, while inthe pre-industrial revolution period the capitalist countries drew resourcesfrom the colonies in the form of physical capital, in the post-industrialrevolution period they are drawing away the human capital resources fromthe LDCs. The motive and the effect in both the cases remain more or lessthe same with only small nuances. A strong case can be made for thepayment of compensation to the LDCs for the use of their HQM by theDCs. This may be in the form of a consolidated price or the sharing ofincome-tax to be imposed on immigrants. Whatever may be the modusoperandi of the payment, an adequate compensation must be ensured bycreating favourable international public opinion, pressurising the DCs andby resorting to help from the UN and the socialist-minded group ofcountries. The LDCs should unite and wage a protracted struggle to end theneocolonialist regime of the developed capitalist world.
Brain drain or brain overflow?
One of the serious misconceptions of our times is the belief that brainexodus from the less developed countries (LDCs) to the developed countries(DCs) represents a single malady. As a matter of fact, different types ofmigration of high quality manpower cannot justifiably be brought within asingle analytic umbrella, though this is what has happened in contemporaryliterature on the phenomenon of brain drain.
Migration of HQM or brain migration may be due to several differentsets of socioeconomic forces. Like the common cold, brain migration is not asingle malady, but a loose generic category covering a variety of specificcomplaints and conditions. The phenomenon of migration of HQM fromLDCs can justify the use of the term brain, but we should be cautious inusing the term drain. In fact, all brain drain constitutes brain migration, but
The problem of brain drain 41

brain migration does not necessarily constitute brain drain. Brain drain isonly a part of brain migration.
For analytical reasons, it is necessary to identify each and every type ofbrain exodus distinctly. This also becomes helpful for formulating differentpolicies for different types of brain migration. There are mainly four types ofbrain migration: brain drain, brain overflow, brain exchange and brainexport. We have elsewhere analysed these categories in detail (Ghosh andGhosh 1982).
Brain exchange and brain export do not apparently have any markedrepercussions on the LDCs for these are essentially based on quid pro quo.Brain overflow is from the surplus category of HQM, and often helpful forLDCs, to ease the problem of educated unemployment. Brain drain is a one-way permanent migration of productively employed HQM mostly fromLDCs to DCs. Needless to say, the outflow of this strategic manpowercreates many structural maladjustments and produces enormous negativeexternalities and thereby retards the process of economic development of thebrain-losing country. The gain derived from the brain overflow is more thanoffset by the loss sustained due to brain drain. The advantages of thephenomenon of brain overflow have often been overplayed by the writers ofcapitalist countries. As a matter of fact, brain overflow often involvesuneducated and semi-educated manpower which is not permitted to inflowby the immigration laws of developed countries (DCs). Thus, the importanceof brain overflow as the source of supply of valuable forex in LDCs isgradually declining. But on the other hand, the gravity of the problem ofbrain drain for LDCs is gradually increasing as these countries have limitedstocks of physical capital, HQM and a narrow technology frontier.
The seed-corn technology
In the case of technology formation, needless to say, brain power (humancapital) plays a crucial role. ‘It is people plus machines that make technology,but increasingly people.’4 The technology gets embodied in human beings.Physical capital at the most embodies technology of the latest vintage; buthuman capital embodies both present and future technology. Physical capitalalso rapidly depreciates and its rate of obsolescence is rather quick. Thus, inthe field of formation and use of technology, brain power has an edge overthe physical capital.
In a highly developed country, the maintenance and acceleration of growthnecessitate a highly sophisticated research and development (R&D) industrywhich is essentially dependent on team research and organisation requiringnot brawn but brain. There has been a noticeable transition in the developedcountries from manufacturing to tertiary production and from goods toservices of different varieties. In a country like the United States the develop-ment of industries, like spacecraft and defence, necessitates continuousresearch and innovation for attaining the type of supremacy it wants in order
42 B.N. Ghosh and Rama Ghosh

to sustain its position as a leading capitalist and a powerful nation. However,the United States is a country of immigrants and much of its strength lies inthe contributions of its foreign population absorbed in the mainstream.
The most important item in international intercourse today is not food,fuel or fibre, but transaction in technology. The USA every year exportstechnology to the extent of $9,000 million but imports only $1,000 millionworth of technology. The important countries in the world technologymarket are Germany, France, Japan and Canada. To correct the structuralimbalance created by the rapid spurt in the demand for HQM as against itsalmost static supply, the USA has to import HQM – the seed-corn tech-nology – from the LDCs. This transaction in HQM is made in such an evasiveway that ultimately no price for the use of HQM is required to be paid to thecountry that supplies the HQM. A strange pattern to purchase indeed.
The imported seed-corn technology is then processed scientifically,pressed into service and exported through multinationals, mainly to theLDCs. Capital exports coupled with the export of technology on a hugescale to LDCs leads at least to three consequences:
1 Through the sale of costly and inappropriate western technology, thedependence of the LDCs on the DCs becomes enhanced.
2 The selling country becomes a rentier nation and gets richer by thefattening returns on investment, and royalties on the export of tech-nology. Every year, the LDCs pay to the United States billions of dollarsas dividends, fees and royalty.
3 The multinational corporations assume a more significant role in trans-lating into practice the neocolonial interests of the developed capitalistcountries.
In fact, American technology is produced largely by the HQM of theThird World. For instance, during 1958–66, brain drain from India increasedeight-fold and a large part of this increase was directed to the USA. In 1967,physical brain drain from India to the USA was 1,425 skilled personnel(Ghosh 1968: 163). Between 1960 and 1976, 420,000 HQM left the LDCs forthe DCs. No less than 25,000 people migrate to the DCs every year(UNCTAD 1975). The USA is a mature but still growing nation, havingapparently unlimited demand for labour. It should be noted that, at the latestage of development, growth does not become so much machine-based as itis based on human talent, ingenuity and skill. The USA’s intake of HQMbetween 1949 and 1970 increased six times, from 2,517 to 16,492. In thisoutflow, the percentage share of HQM from developed countries to the USAdecreased; but that of the LDCs increased.5 In the USA, 80 per cent of theresearch is done by 100 large firms who employ more than 60 per cent of theHQM. Needless to add, the present technological supremacy of the USAwould be difficult to maintain if the supply of HQM to America werestopped or reduced. Instead of importing raw materials, the DCs are now
The problem of brain drain 43

importing brain from the LDCs without giving any compensation. Thisshows that, in international economic relations, the colonial-metropolitannexus still prevails. The HQM is purchased as raw materials, turned intofinished products and sold out to colonies at an exorbitant direct andindirect price. Thus, modern LDCs provide both the sources of rawmaterials (HQM) and the market for the goods purchased by the capitalistcountries like America. This sort of technological imperialism leads to whatcan be called international ‘backwash effect’, making the poor areas poorerand the rich areas richer.
The reverse transfer of technology
It is very often claimed by the DCs that capitalist countries have beenhelping the LDCs by giving them aid and assistance. This apparentlyinnocuous statement has to be taken with a caveat. Let us give it a closelook. According to the UNCTAD report, US aid to the LDCs in 1970amounted to $3.1 billion. As against this, the income gained by the USAthrough brain drain from the LDCs amounted to $3.7 billion (Governmentof India 1975–6 and Mainstream 1974). This shows that whatever aid isgiven by the USA to the LDCs is more than compensated for by the braingain. The highest contribution to the net income gained by the USA is madeby developing countries, particularly Asia. In 1970, according to UNCTAD,3,141 skilled Indian people immigrated to the USA. This represented a lossof $75 million, the per capita cost of a specialist being $5,000. But Indiareceived in the same year $55 million as foreign aid from the USA. Thisshows that India lost more than she gained. Each of the following countriesreceived a milliard dollars’ worth of aid after World War II: India, Brazil,Chile, Columbia, Iran, Israel, Pakistan, South Korea, Taiwan and Turkey.But these are also the countries which provided about two-thirds of thoseprofessionals who settled in the USA. The USA sends as many experts to thedeveloping countries as she receives from them via brain drain.6 But thetelling tale of exploitation is adequately revealed by the fact that, while theUSA does not pay a single buck for the brain obtained from the LDCs, sheis highly paid for the services of her experts who happen to be mostly theHQM from the countries. Thus, the leader cunningly rides on the laggardsand wins the rat race of the capitalistic game.
The loss sustained by the developing countries on account of brain drainis enormous. As many as 38,000 HQM, who migrated to the United States in1962–6, represented a loss of $7.6 milliard. Between 1949 and 1961, about3,922 skilled personnel left India for the USA, and this represents a value of$1,055 million.7 The UN report states that India relinquished an amount of$1.7 million in the form of brain drain to the USA, Canada and France upto 1966 and this sum amounted to $5.6 million in 1967. The income lost byIndia per skilled emigrant, under alternative parametric values, is shown inTable 3.1.
44 B.N. Ghosh and Rama Ghosh

According to the study made by UNCTAD, the cost of an Indianengineer is $32,000, a doctor $44,000, a natural and social scientist $33,000and a graduate $17,000. On this basis, India can be said to have lost$188,419,000 on account of brain drain of 5,439 HQM between 1958 and1966. If per capita education cost is taken to be $20,000 as is found in manycareful studies, the developing countries’ contribution to the USA becomesnearly $45 million every year without corresponding compensation. Thus,the LDCs’ assistance to the USA becomes more overwhelming thanAmerican aid to these countries. It is in this sense that the concept of reversetransfer of technology from the LDCs to the DCs can be looked upon as amore detrimental dimension of the brain drain problem. Foreign capitalinvestment by the DCs ensures the principal along with the interest; but theoutflow of HQM from the LDCs constitutes a permanent loss. Whateverforeign aid is given by the DCs is more than taken away by the shrewd tradepractices, unfavourable terms of trade, mounting debt servicing and highroyalty charges. As a matter of fact, the reverse flow of technology nullifiesthe tall claim for neo-imperialist aid to the Third World.
The loss of technology cannot, however, be translated in terms ofoutput, income productivity, for the realisation of the technologicalpotentiality encompasses a variety of considerations. But it cannot begainsaid that the loss of technology is more harmful than the loss of skill.To the extent to which brain drain involves a reverse flow of technology, themovement of HQM will account for the persistent and ever-widening gapbetween the rich and the poor areas. It will also reduce the capacity of theLDCs to borrow and assimilate foreign technology. In fact, the USA’sexport of technology to the LDCs is of old vintage. She never parts withthe current technology but rather monopolises the technology of presentand future (Timofeyev 1975). The DCs claim that they are trying to help theeconomic development of the LDCs, but, on the other hand, they enactimmigration laws that encourage the flight of skilled labour. These aremutually contradictory activities in as much as brain drain jeopardises thetechnological base and hence the development tempo of such poorcountries. It is a historical truism that no metropolitan country is ever reallyinterested in the real development of the colonies. Had it been a policy tohelp the LDCs, the DCs would have allowed the immigration of ordinaryunskilled labour. But they have altogether stopped the immigration of
The problem of brain drain 45
Table 3.1 Income lost by India per emigrant
Skill category Arts, science and commerce graduates Engineers
High $30,000 $61,000Medium $17,000 $32,000Low $8,000 $13,000
Source: UNCTAD, Reverse Transfer of Technology, as quoted in Mainstream, 16 November1974, p. 48.

unskilled labour, and encourage the immigration of only skilled labour. Thedeliberate government policy facilitated the change-over from proletarianmass transfer to professional elite migration. The process of brain drain hasbecome faster since the change in the immigration laws in many developedcountries.
In the field of technology, the western models are promiscuously applied.The software variety of technology transfer from the LDCs to the DCs isdenied by the latter on the ground that knowledge is a universal public good.But it is strange that the same notion about knowledge is not entertained bythe DCs in the matter of patent which is the embodiment of universalknowledge. Out of three million current patents in the world, the LDCs holdonly 30,000. If knowledge is a public good, why do the DCs charge for theexport of technology which is based on knowledge? The answer to thisquestion smacks of clear neo-imperialistic design which admits of nohumanitarian or moral consideration about the struggle for economicdevelopment by the LDCs.
According to an estimate made by a Belgrade expert, over 300,000 expertsfrom the LDCs migrated to the DCs in the early 1960s and most of themtook up jobs in the USA and Britain (Adams 1968). To educate these people,the LDCs invested $5 billion. This amount is higher than the amount of aidgiven by the USA and the UK ($4 billion) to the LDCs during the sameperiod (Tribune, October 1982).This once again corroborates the notion ofreverse transfer of technology. Brain drain is costing the LDCs annuallybetween $4,000 and $5,000 million. The same amount can be said to be thedirect gain of the brain-receiving countries. India’s gross loss due to thebrain drain of 15,000 persons every year comes to $75 million. However, shegained annually $30 million by way of remittance. Thus, India’s annual netloss comes to $45 million. Thus, between 1961 and 1972 the UK, the USAand Canada got brain aid of $4,400 billion from the LDCs. The study madeby IDRC, Canada, reveals that the foreign aid of these three countries to theLDCs amounted to only $46 billion. Even if we add the remittances, brainaid still far outweighs the foreign aid (Tribune, January 1982).
The DCs encourage brain drain from the LDCs mainly for the followingreasons:
1 the workers are readily available ‘on tap’ without any educationexpenditure on them by DCs;
2 competent scholars can be had at a cheap rate;3 during rough times, they can be retrenched, During the mid-1970s,
economic recession in Europe forced about 1.2 million workers to returnhome;
4 employment does not involve any permanent commitment;5 educational investment of a huge amount of money may be saved;6 some amenities may be denied to foreign workers; and7 without HQM, technology cannot be assimilated.
46 B.N. Ghosh and Rama Ghosh

The domestic education system of the LDCs is so designed that people arebeing prepared for western workshops. These countries also give more valueto westernised education and offer better salaries to foreign educated people.There is, thus, a positive temptation to go abroad. Brain drain is partly theresult of our faulty education system. Foreign monopoly firms in the UKand the USA persuade the students to study in their countries. Many USfirms recruit specialists from abroad. Needless to say, the American suprem-acy of space technology cannot be sustained without foreign scientists.Many of the Third World scientists are working in NASA and are playing acrucial role in the space shuttle programme. Disparity in domestic emolu-ment structure creates dissatisfaction which is ultimately responsible for theexodus of brain; but such an inequality is produced by a capitalist method ofeconomic awards and punishment.
Harmful consequences
Be that as it may, brain drain from the LDCs has had many harmfulconsequences (Jolly and Seers 1972: 365–9). Brain drain raises the domesticwage in international professions, but the local professionals’ wage remainsthe same. Hence, inequality is accentuated. Second, for want of HQM, itbecomes difficult to properly utilise the modern technology. Third, shortagesof skilled manpower create dislocations and bottlenecks. Fourth, brain drainbrings about internal migration of HQM from villages to towns. This sort ofinternal brain drain disturbs unfavourably rural–urban professional distribu-tion. Fifth, the returnees bring in inappropriate technology, wrong modelsand inappropriate education from abroad. Over 40 per cent of R&D expensesin the DCs are on defence and space research to which brain drain is directed.The spillover effects do not benefit the LDCs. Last, the returnees and foreignexperts increase the domestic wage, show preference for foreign items andfavour capital-intensive techniques and inappropriate ideologies and policies.
One negative phenomenon in the LDCs, and for which neocolonialism islargely responsible, is the problem of brain drain (Tarabrin 1982:. 271ff.). Thedrain is caused by the greed of the DCs, which want to accumulate more andmore surplus. Students receiving western education do not generally comeback home. The reasons are many: inability to find a good job, restrictedscope for promotion, possibility of underemployment/unemployment, lackof planning in education and training, conflict with the authorities and soforth. But the crucial reason is the neocolonial policy of buying HQM fromthe LDCs. In the face of scientific and technical revolution in the DCs, thedemand for HQM is very rapidly increasing but not so much the supply.Hence, the wooing away of brain from the LDCs. Capitalist countries aremaking laws so that skilled foreigners can become naturalised citizens ofthose countries very easily.
However, it is with the active participation of experts of the LDCs thatnumerous and costly research and military programmes are being carried out
The problem of brain drain 47

in the DCs. Dean Rusk, a secretary of state of the United States, onceadmitted that, for the USA, the importance of immigration was determinednot so much by the number of the new arrivals as by their quality. Withoutforeign scholars, the USA could not have entered the atomic age in 1945. Itis not surprising to note that 57 per cent of immigrants to America are PhDand Master degree-holders and 33 per cent of the American Nobel prizewinners are immigrants. As much as 51 per cent of the brains of the LDCsare engaged in R&D industries in the USA. The cost of training a specialistin the USA is $55,000. America saved $31.3 billion by importing brain fromthe LDCs between 1949 and 1977. According to the estimate made byUNCTAD, this figure is precisely $100 billion (UNCTAD 1972). The systemof brain drain from the LDCs to the DCs is perpetuated by many businessfirms, industries and companies. Way back in 1913, Lenin foresaw thegrowth of the system of brain drain among the developed and less developedregions, and we in our times experience its perpetuation.
Brain drain involves the loss of strategic manpower from the keypositions in a country. As such, it will create many dislocations and require adrastic organisational change. The losses involved in brain drain, as calcu-lated by Comay, Bowman, Myers, Sjasstad, Weisbrod and others through thepresent value approach, are found to be very high indeed (Ghosh and Ghosh1982). The losses involved in brain drain are of many types, e.g. loss ofpresent production, loss of future production, loss of present saving, lossof future saving the emigrants should have made, loss of taxes and loss ofpotential innovations and so forth. First, the LDCs would experience theloss of valuable skilled personnel. Skill formation in these countries ispalpably sluggish although the requirement is really very high. In fact, highlyskilled manpower is a rare commodity in any country. These countries aredesperately in need of both physical and human capital, and certainlycannot afford to lose strategic manpower. Second, brain drain involves theloss of money invested in education, training and skill formation.8 At present,there are 250,000 professionally skilled Indians in the USA. Presuming theaverage education and training cost of a specialist to be $200,000, the losssustained by India so far as a result of brain drain to America alone comesto $50 billion.
Highly qualified strategic persons are essential for capital and skillformation, education, research and training, infrastructure-building andeconomic and social development. Thus, by brain drain, the LDCs becomelosers and poorer and development is halted. Brain drain leads to more andmore inequalities in the distribution of skilled manpower in the world.International inequality accentuates because of the fact that, whereas braindrain reduces the income and production of the emigrating country, it makesthe economic position of the DCs better off. Myrdal argues that themovement of skilled personnel is harmful to the sending countries, becausesuch economies suffer from the ‘backwash effect’ as a result of brain drain.The LDCs become more and more backward due to brain drain.
48 B.N. Ghosh and Rama Ghosh

A report prepared by ARE for UNESCO points out that brain drain is animmoral process hampering progress in the developing economies anddepriving them of badly needed skilled personnel. Brain drain is morallyobtuse in at least two senses: (i) the strategic manpower of the LDCs iswooed away, and (ii) no compensation is paid to the brain-sending countriesby the brain-receiving countries. Brain drain damages the morale of thosewho cannot emigrate. The demoralising consequences erode the socio-psychological milieu and lead to national frustration. The leadership and thecreative contribution to science, technology and development, which theemigrating people would have made, are lost by the sending country as aresult of brain drain. The indirect costs of brain drain are many. Some ofthese are: slowdown in production, weakening of administrative and execu-tive structures, rebuilding of skill, apathy of the state to skill formation andso on. By brain drain, the intellectual climate of the country is very muchadversely affected. Without the intelligentsia, the idea of progress cannot bespread effectively. Thus, brain drain hampers social development, modern-isation and economic growth.
Thomas Romans observes that migration of HQM reduces the averageeducational level of the country (Romans 1974). The emigration of HQMwidens the technological gap and increases the technological dependence ofthe domestic country. When the process continues, people train themselves athome with the sole aim of ultimately emigrating abroad, and in the process,the national moral value, culture and tradition are neglected. A decline inmoral values results in selfishness, careerism and even corruption. All theseadversely affect patriotism, national solidarity and creative activity. The lossof critical manpower, which can influence government policies, is a seriousloss, particularly for the politically and economically weak developingeconomies. As a matter of fact, external economies involved in brain drainare indeed very large.
The more skilled the emigrant, the more likely is the possibility ofunemployment in the sending country, at least temporarily. The emigrationof managerial class will automatically reduce some employment (Romans1974). If an engineer under whom 15 persons are working leaves the country,all these people become unemployed until his position is filled. There is highcomplementarity of HQM to other productive resources. The flight of HQMfrom the domestic economy leads to a reduction in productivity. The lossfrom brain drain is enormous in the short period. In the long run, the loss ofHQM is partly replaced in a growing economy. Brain drain may involvezero-sum game and the propagation of research results may be constrainedby patent or by CIA secrecy requirements. Thus, the brain-sending countrycannot take any advantage of the superior knowledge of its brain livingabroad.
The study by Grubel and Scott (1966) comes out with the observationthat international migration of human capital reduces military and economicpower by a very small amount in the short-time horizon, and, in the long
The problem of brain drain 49

run, the loss disappears. Only under rare circumstances, brain drain couldreduce welfare. However, the short-run loss is more than outweighed by thebenefits of emigration. The findings of Grubel and Scott have beenchallenged by Berry and Soligo (1969), among others. They demonstratedthat emigration causes loss to a nation. A similar conclusion is upheld byWeisbrod (1966) and Bhagwati and Hamada (1974). Depending upon thestructure and the institutional set-up of a country, brain drain can be said tohave varying welfare effects, as observed by Bhagwati and Hamada. Braindrain of highly gifted manpower results in welfare loss for the sendingcountry. Anteny Ward regards brain drain as a manifestation of exploitationof less developed countries by developed capitalistic countries (1975). Heobserves that over the generations, the majority of emigrants are reduced toan exploited and marginal group in the society. In an empirical studyconducted in 1972, UNCTAD calculated income gains to the receivingcountries and income losses by the sending countries as a result of braindrain (UNCTAD 1972). The loss is found to be indeed staggering. Aitkin’sstudy demonstrated that brain drain not only reduces welfare but it alsoredistributes income from unskilled labour to the remaining skilled labour(1968). What is good for the USA is not necessarily good for the wholeworld, remarks Brinley Thomas.
Harry Johnson’s analysis was not able to show any welfare gain as a resultof brain drain, though he, as an internationalist, intended to rigorouslydemonstrate it (1967: 404–5). According to Johnson, the marginal loss willvanish when the supply of professionals increases as a result of theirincreased price. The conclusion of Johnson is not at all tenable, at least ontwo counts. First, the increased supply of professionals is not simply afunction of enhanced price. Granted it to be so, an increased supply ofHQM will once again decrease the price, and, therefore, the subsequentsupply. Second, the increased supply of HQM, given the domestic absorbingcapacity, will lead to more brain drain which will sustain the net loss ofconsumers’ surplus. Thus, Johnson’s analysis could not effectively prove thepositive welfare implication of the brain drain process (Ghosh and Ghosh1982: Ch. 5).
The welfare implications of brain drain can be related to capital thatmigrants take along or leave behind. If capital is left behind, capital–labourratio will increase and income gain would be substantially high for the non-migrants; but if capital is taken along, capital loss will more than outweighthe income gain, and, as a result, society will experience welfare loss (Grubeland Scott 1966; Berry and Soligo 1969).
Brain drain involves loss of capital in two senses: (i) loss of gifted,experienced and very highly qualified and skilled human capital, and (ii) lossof physical capital accompanying the permanent emigrants and also the lossof their working capital. It is to be recalled that brain overflow representingunemployed HQM does not involve the loss of capital, for the unemployedbrain presumably cannot create any capital or does not have any working
50 B.N. Ghosh and Rama Ghosh

capital. If we take the above explanations to be correct, brain drain willmake the capital–labour ratio lower in the domestic economy in which casecapital loss would more than offset the income gain. It is clear that braindrain reduces a country’s total stock of social capital. Therefore,productivity will come down after some time and along with that the wagelevel, thereby reversing and worsening the position. Our analysis is based onthe presumption that the value of an emigrant’s capital, both physical andhuman, is higher than the country’s average per capita endowment of humanand physical capital. If this presumption is correct, as seems plausible, thewelfare loss as a result of brain drain indeed becomes very high. However,the net loss in the domestic economy is apparently more than offset by theincrease in the migrants’ income. While the domestic economy loses as aresult of emigration of skilled personnel, the emigrants themselves gain.
The remittance factor
In the case of brain overflow, there being no question of output loss, therealisation of saving potential will directly lead to net income gain. But, forbrain drain, capital loss and hence output and production loss will morethan swamp out the income gain. No doubt, the migrants earn more incomebut there is no satisfactory system to compensate the losses to those leftbehind. Society does not compensate the losers. Thus, the migration ofHQM from the LDCs is not a Pareto optimal situation. True, remittancesare repatriated in the cases of brain drain and brain overflow; but theremittances are not adequate, regular and compulsory, specially in the caseof brain drain. As our survey reveals, the brain drain is directed mostly todeveloped countries where the skilled personnel take their families alongwith them. They do not send substantial amount to their relatives in LDCs,and it is also not possible for them to send a large sum of money aftermeeting the expenditure for their families and making the necessary savingsfor the rainy days. It has been observed that a large part of the migrants’income is spent on the education and training of their wards. Brain drainfrom LDCs is mainly from the upper middle class and rich families. Thisimplies that not only the average cost of living of the migrants is high butthat they have had a propensity to spend on conspicuous consumption whichnot merely reduces the amount of remittances but also reduces the effectivesaving potentials of their relatives in LDCs out of their remitted amount.
In this context, the findings of two other studies made in India may becorroborative (Mathew 1980). Remittances are a special type of transferpayment in the sense that these are essentially a transfer of personal incomeused partly for consumption and partly for investment. Very little empiricalwork has gone into the question of channelisation of the resources arisingout of the remittances of productive investment. However, two studiesundertaken by the Bombay Chamber of Commerce and Industry in respectof the impact of inward remittances received in certain villages of Kerala
The problem of brain drain 51

and Gujarat have made some interesting observations about the pattern ofuse of the remitted money.
These studies show that a good part of the remittances are channelled inthe form of high expenditure on consumer goods, purchase of durable goodsand property, or investment in securities, trade and business includingspeculation. According to one study, the impact of remittances received incertain villages of Kerala does not seem to have triggered off an era ofsustained growth in the state (Mathew 1980). The study, particularly,pinpoints the fact that much of the money flowing into the state from abroadhas not been used for productive purposes. Investment in debentures, sharesand securities has been almost nil. These observations, thus, indicate that thesavings of the Indians employed abroad were not channelised for develop-ment purposes according to the national priorities. It can, therefore, bestated that brain drain cannot lead to an adequate compensatory payment tothe losers, and it cannot cover the public and private cost of human capitalinvolved in brain drain, even if it partly meets the private cost.
Brain drain deprives the emigration country of the saving and investmentwhich the migrants would have made, had they not emigrated abroad.Presumably, the amount of this relinquished saving and investment is prettyhigh because these skilled personnel are well within the high-income margin.In most of these cases, surplus was being generated in the economy as wagelevel fell far short of the level of the marginal productivity of such types oflabour. The economy is deprived of this surplus at present and in future, asbrain drain occurs. The state exchequer sustains a loss in one more respect.Through brain drain, the government loses a huge amount of tax moneyeach year which would have been contributed to the exchequer by the brainswho are generally high-income persons and in whose case tax is much higherthan the marginal cost of public goods they consume. Thus, the governmentis deprived permanently of an important source of net revenue. All thesefindings unmistakably substantiate the fact that brain drain is not merely awelfare-cum-income reducing phenomenon, but it also considerablyhampers the growth process of a low developed country on many counts,one of which is the conspicuous trend of the reverse transfer of technologyfrom the LDCs to the DCs.
With definite plans and programmes, brain drain and brain overflow canpartly be converted into brain export. The LDCs may well export con-sultancy services to the DCs, or may exchange brain for capital, equipmentand materials. Instead of sending the surplus HQM individually, it would bemore worthwhile to send it as government-sponsored teams, and export thesurplus manpower on a regular and systematic basis with prescribed termsand conditions. Export-oriented R&D organisations manned by surplusbrain can be undertaken by a brain-surplus country. If export of physicalcapital can earn income, human capital export should also entitle thesending country to a similar type of return. On this basis, a compensatorybrain migration policy may be formulated by the LDCs. Brain exchange may
52 B.N. Ghosh and Rama Ghosh

be an important channel for the exchange of knowledge and expertise andcross-fertilisation of ideas and values. When brain export to developedcountries is not possible, surplus brain may be sent to those LDCs onexchange or export basis where it is in short supply. Some of the LDCs, forexample Africa and Malaysia, still remain the net importer of technical andscientific manpower. What is required is a cast-iron strategy and an organis-ational network at the state and national levels to promote a planned exportof manpower. India, Bangladesh and Indonesia have tremendous potentialfor the export of human capital in the present century.
Concluding observations: towards a scheme of compensation
There should be a forum for redressing the unjust exploitative developmentpolicy of the capitalist world. The LDCs have to wage a historical strugglefor emancipation in the real sense of the term and for the compensatorypayment from the DCs against the outflow of the HQM. The brain-importing capitalist countries must be pressurised to pay for the brain, in thesame way as physical capital import is paid. The migration of HQM shouldbe considered as an item in the balance of payment. The object of compen-sation would be to offset losses already incurred by a country; whereas theaim is to prevent those losses by regulating abnormal migration of HQM.But compensation has remained a mere idea which has never reached eventhe stage of preparation of bilateral or multilateral agreements. True, suchan agreement has not been formally demanded by the LDCs. The LDCs donot demand compensation perhaps because of the fear that such a demandwill reduce their aid from the USA. But it must be understood that aid is inno way connected with compensation for the migration of human capital. Itis, no doubt a fact that a large number of brain-sending countries, e.g.Pakistan, Jordan, South Korea, India, Lebanon, Turkey and so on, receiveremittances. But, nevertheless, the remittances are irregular and do not coverthe shadow price, or private plus public costs of the migrated brain. Theearnings in the form of remittances are poor compensation for the lastingand serious loss inflicted by the outflow of HQM.
The question of compensation has never been seriously entertained by thedeveloped capitalist nations. According to them, no compensation should bedemanded and paid for the brain whose opportunity cost is zero or whichremains unproductive in the country of origin. Such a line of reasoning isentirely preposterous, for it is always the surplus product that a country maybe interested in selling out. The people who raise objections against com-pensation put forward the following points: (i) non-returnees are small innumber, (ii) emigrants do not decrease the per capita income of those whoremained at home, (iii) emigrants are non-productive, (iv) non-returnees donot worsen the educational situation in the home country, (v) actual loss, ifat all, is very insignificant,9 and (vi) scientists are not ordinary exportablecommodities.
The problem of brain drain 53

The foregoing arguments, needless to say, are gross misrepresentations of thefacts and are too weak and tendentious to justify the non-payment of compen-sation. Rationally considered, there should be no dispute over the question ofpayment of compensation in principle, although differences may arise in themodus operandi of such payment. As payment for human capital import, thegovernment of the recipient country could refund a fixed percentage of immi-grants’ income tax to the country of origin.10 Such a tax will have two objec-tives: (i) rendering some benefits to LDCs, and (ii) discourage brain drain.
The compensatory payment in the form of a tax may be spread over anumber of years, or it may be once-for-ever lump-sum exit tax, as in theUSSR. A consolidated price for the export of the commodity brain powermay also be realised in the exporting country from the outgoing humancapital. A surtax may be imposed on the earnings of the skilled emigrants.The income tax collected by the brain-importing developed countries may berouted to the concerned LDCs through the United Nations. Anotherproposal is that the brain-exporting LDC would levy the tax and theimporting DC will collect it. The tax may be ratified by a special treaty at theUN with the provision that the proceeds from the tax would go to the UN tobe distributed via UNDP, or to the proposed new UN special Fund forLDCs, to be used for the purpose of development. The estimates of the taxrevenue from the surtax were calculated at $500 million from the USA andCanada based on 1976 figures (Ghosh and Ghosh 1982: 137). An alternativeproposal was an extension by the developing countries of their taxjurisdiction over income from foreign sources so long as the individualsremain citizens of the developing countries and possibly by an internationaltreaty for some years after their loss of citizenship of the original developingcountries. The regular domestic income tax schedule of the developingcountries would then be extended to the emigrants, giving them credit,however, for the tax paid by them to the host developed countries inaccordance with those countries’ normal tax regimes. Several countries, e.g.the USA, the Philippines and Mexico, have already started extending theirtax jurisdiction over non-resident citizens; but an international treaty wouldbe necessary to implement this system with its tax credit feature on a generalbasis. No doubt, imposition and collection of tax on brain drain wouldinvolve some amount of difficulty; but that does not make it unworkable inpractice. The Third World countries must jointly cooperate to pressurise theDCs to favourably consider the issue of compensation, and, if need be, theinterposition of the UN and the socialist-minded countries may be sought ingiving the idea of compensation a practical shape.
Notes
1 Brain drain has not been properly defined in the literature. It is very often con-fused with brain overflow. While the former is from the employed category, thelatter is from the unemployed human capital stock. The literature on brain drain
54 B.N. Ghosh and Rama Ghosh

is fairly extensive. Since it is not possible here to quote the entire body ofliterature, we mention Walter Adams (ed.) The Brain Drain, Macmillan, NewYork, 1968, which contains a fairly large number of contributions. See also B.N.Ghosh and Rama Ghosh, Economics of Brain Migration, Deep & Deep, NewDelhi, 1982.
2 The loss can be interpreted in terms of the loss of educational investment, thecost of relinquished alternatives, the loss of life-time income, the loss of intereston invested capital and also the social loss. The external diseconomies involvedin brain drain are really very high.
3 Brain drain is sometimes described as an emotive nationalistic nonsense. SeeHarry Johnson, ‘An internationalist model’, in W. Adams, op. cit., and ‘Someeconomic aspects of brain drain’, Pakistan Development Review, Autumn, 1967.Also see E.J. Mishan, ‘The brain drain: why worry so much?’, New Society,2 November 1967.
4 Modern technology has become increasingly a function of brain power. See‘Summary view of UNESCO’s activities in connection with transfer oftechnology’, in International Seminar on Technology Transfer, Seminar Papers,vol. I, CSIR, New Delhi, 1973, p. 52.
5 The percentage share of DCs in the outflow of HQM to America was 70.4 in1955–6, but it came down to 30.8 in 1970–1; while for LDCs, it went up from 25in 1955–6 to 69.20 in 1970–1.
6 A report of the Committee on Government Operations acknowledges this fact.See ‘Scientific Brain Drain from the Developing countries’, Committee onGovernment Operations, US House of Representatives, 90th Congress, SecondSession, 23 Report, Washington, 1968, p. 56.
7 See the calculations made by Jahangir Amuzegar, ‘Brain drain: the irony offoreign aid policy’, Economia Internationzale, November 1968, vol. XX, p. 703.
8 For the extent of monetary loss, see B.N. Ghosh and Rama Ghosh, Economicsof Brain Migration, Deep & Deep, New Delhi, 1982.
9 Prof. Shearer has put forward such an argument. See J.C. Shearer, ‘In defence ofthe traditional view of the brain drain problems’, International Educational andCultural Exchange, Fall 1961, pp. 17–25.
10 The tax proposal is made, among others, by Jagdish Bhagwati. See J. Bhagwati,The Brain Drain and Taxation II: Theory and Empirical Analysis, North Holland,Amsterdam, 1976.
References
Adams, Walter (1968) (ed.) The Brain Drain, New York: Macmillan.Aitkin, N.D. (1968) ‘International flow of human capital’, American Economic
Review, June.Amuzegar, Jahangir (1968) ‘Brain drain: the irony of foreign aid policy’, Economia
Internazionale, November.Baldwin, G. (1970) ‘Brain drain or overflow’, Foreign Affairs.Berry, R.A. and Soligo, R. (1969) ‘Some welfare aspects of international migration’,
Journal of Political Economy, September–October.Bhagwati, J. and Hamada, Koichi (1974) ‘The brain drain: international integration
of markets for professionals and unemployment’, Journal of DevelopmentEconomics, vol. 1, November 1974.
The problem of brain drain 55

Ghosh, B.N. (1968) Population Theories and Demographic Analysis, Meerut:Meenakshi Prakashan, p. 163.
Ghosh, B.N. and Ghosh, Rama (1982) Economics of Brain Migration, New Delhi:Deep & Deep.
Government of India (1975, 1976) Economic Survey, New Delhi, and Mainstreamno. 16, 1974.
Grubel, H.B. and Scott, A.D. (1966) ‘The international flow of human capital’,American Economic Review, May.
Johnson, H. (1967) ‘Some economic aspects of brain drain’, Pakistan DevelopmentReview, Autumn.
Jolly, R. and Seers, Dudley (1972) ‘Brain drain and the development process’, in G.Ranis (ed.) The Gap Between Rich and Poor Nations, London: Macmillan.
Mathew, T.J. (1980) ‘Export of manpower’, Economic Times, 23 February.Mishan, E.J. (1967) ‘The brain drain: why worry so much?’ New Society 27.Patinkin, D. (1968) ‘A nationalist model’, in W. Adams (ed.) The Brain Drain, New
York: Macmillan.Romans, T.J. (1974) ‘Benefits and burdens of migration’, Southern Economic Journal,
JanuaryShearer, J.C. (1961) ‘In defence of the traditional view of the brain drain problems’,
International Educational and Cultural Exchange, Fall.Tarabrin, E.A. (ed.) (1982) Neocolonialism and Africa, Moscow: Progress Publishers.Thomas, Brinley (1972) Migration and Urban Development: A Reappraisal of British
and American Long Cycles, London: Methuen.Timofeyev, Anukin (1975) Aid or Neocolonialism, Moscow.Tribune (1982) Chandigarh, January.Tribune (1982) 29 October.UNCTAD (1972) Transfer of Technology and Economic Effects of Brain Drain, New
York: UN.—— (1975) Study on Brain Drain, 5th edition, Manila: UN.Ward, Anteny (1975) ‘European migratory labour: a myth of development’, Monthly
Review, December.Weisbrod, B.A. (1966) ‘Discussion’, American Economic Review, May.
56 B.N. Ghosh and Rama Ghosh

4 Gender and development
Transforming the process
Gale Summerfield
Introduction
Development is a process that began well before the written record; it takesdifferent shapes in different places and times. Women have contributed to thisprocess as well as men, though their efforts have received less recognition orremuneration. The academic field of economic development is a much morerecent phenomenon; it became an area of economic inquiry after World WarII, as international trade expanded and many former colonies gainedindependence. Dissatisfaction with neoclassical emphasis on markets fuelledgovernment planning to increase the pace of development. Policy-makerspromoted state planning, employment programs and rapid capital accumul-ation (Sen 1984; Hirschman 1981). Most development economists focused ongrowth as necessary and sufficient for development in the early years, rarelynoticing the existence of gender disparities in programs and policies.
Inequities in development have been addressed by a variety of socialmovements over time, but most of them have not been recorded or pub-lished. This is especially true for those movements comprised mostly ofwomen (Basu 1995). The first systematic, academic study of these problemswas Ester Boserup’s Woman’s Role in Economic Development (1970) thatmarked the beginning of the multi-disciplinary field of Women inDevelopment (or Women in International Development: WID). Boserupnoted that, with development programs, women often do not gain as muchas men and may be marginalized from prior opportunities.
In the early years, WID brought together scholars, practitioners, andpolicy-makers/advocates who focused on the inclusion of women in thedevelopment process. Much of the work centered on reporting the status ofwomen in developing countries and then on identifying the impacts ofpolicy-related changes on women – with passive overtones of impliedvictimization. Gradually the focus shifted to a more active, agency view ofwomen in the process of socio-economic development; strategies and agencybecame central to the discussion along with more substantial challenges todevelopment models (Aslanbeigui, Pressman and Summerfield, forthcoming;Jackson and Pearson 1998). Relative disparities between women and men
Chapter Title 57

replaced the focus on status, and gender analysis and discussion of socialconstructs accompanied or replaced the concentration on women as a group.Mainstreaming of gender issues in organizations (such as the World Bankand UNDP) became a common goal – though not always a reality, and WIDwas more frequently referred to as Gender and Development (GAD)(Murphy 1997).
Key themes in WID/GAD have been: employment and income (stressingexport processing, microenterprise, and informal sector activities), micro-finance, political participation, education, and intrahousehold allocation oftime and income including reproductive activities and other unpaid work.More recently, these have been complemented by analysis of culture andinstitutions, identity, property rights and environmental policy. This chapteraddresses these themes in the context of the economic transformationpolicies (structural adjustment programs, transition of socialist economies tomarket economies, and the process of globalization) that have beenprominent in the 1980s and 1990s. The Asian Crisis of 1997–8 demonstratedthat structural adjustment and transition policies continue to be integralcomponents of crisis prevention and management. The chapter concludeswith a brief discussion of forward-looking themes including: methodologicalapproaches and increasing multi-disciplinary collaborations; migration andglobalization; socio-economic security, caring labor, and macroeconomicmodeling; and the process of including the researched at all phases ofpolicy-making and research.
Economic transformation policies and WID/GAD themes
The 1970s were characterized by a growing awareness of the links betweendeveloping and more developed countries, calls for a new internationaleconomic order, expanding trade and globalization. Although developmenttheory had some success in industrialization, capital accumulation, mobiliz-ation of under-employed labor power and planning (Sen 1984: 486–7),corruption and inefficiency were common. Countries that pursued import-substitution stagnated while the export-oriented economies of Asia thrived.
During the 1970–2000 period, countries around the world have increas-ingly stressed trade liberalization and the use of markets rather thangovernment planning, regulation and other forms of intervention. Thegovernments of highly indebted countries have been forced to accept thesepolicies as conditions for further loans from the World Bank and Inter-national Monetary Fund. The former socialist countries of Europe and Asiahave undertaken such policies at least partly voluntarily. As policy-makersformulated and implemented reforms, they ignored gender issues or omittedthem from the discussion.
During the 1980s and 1990s critiques of the human and gender impactsof the policies gained momentum; by the late 1980s the internationalfinancial institutions began to include some discussion of the social safety
58 Gale Summerfield

net and differential impacts of policies on women and men. Despite greatregional variation, scholars discovered a striking similarity in gender impactsof restructuring and transition policies.1
Employment changes and income
A host of policies – privatization of government-owned firms and para-statals, cuts in government spending, solicitation of foreign investment,devaluations of exchange rates and reduction of tariffs – resulted in differentemployment opportunities for women and men. Throughout Latin Americaand Africa, unemployment became a more pressing issue, especially in the1980s. Even in growing economies, such as China, state firms were compelledto layoff workers as policies stressed cost reduction and increased competi-tion. Around the globe, women were disproportionately represented amongthe laid-off and unemployed. Export-oriented textile and electronic plantsthat opened with foreign investment, however, generally preferred to hirewomen for assembly-line work. The availability of these low-paying, rela-tively unskilled jobs coincided with demographic changes and the pressuresof survival that increased women’s labor force participation duringrestructuring. Only a fraction of the labor force found work in export-processing jobs, and the majority of women hired by these plants were intheir teens or early twenties. In countries undergoing reform, womencontinued to be concentrated in traditional, low-paying sectors. As employ-ment in state firms and government offices declined, millions of womenopened microenterprises or worked in small businesses run by their families.Informal-sector work mushroomed since official licenses were expensive andthe process of obtaining them was time-consuming.
Scholars who focused on women and men as active agents in the course ofeconomic transformation identified self-owned microenterprises and jobs incompanies based on foreign investment (transnationals or joint-ventures) asthe main employment strategies associated with the reforms. Women runmany of the microenterprises, especially those selling street foods (Tinker1997; Boris and Prugl 1996). Even when they are not involved in selling foodor other products, women are active in their preparation and various home-based activities. Many governments in developing countries take a hostilestance against the informal sector, considering it a relic of the past, a threatto new businesses, and a means of tax avoidance; the bulldozing of vendingstalls has been a common practice. Policy-oriented research, however, hasstressed the valuable role these activities play in augmenting the income ofthe poor – improving housing, nutrition and other basic needs of the familyeven if they don’t succeed in getting people over the poverty line. Suchinformal-sector activity also may help reduce stealing, drug dealing, and sexwork. Convinced by these studies, some governments have adopted a morepositive attitude toward informal-sector activities, including making formalregistration easier, locating markets for stalls in busy locations, providing
Gender and development 59

clean water and trash collection to improve hygiene, and instituting trainingclasses (Tinker 1997).
Opening private businesses in a market environment requires assets orcredit (through formal channels, money-lenders, family loans or overseasremittances). Women usually have less access to either; in many countrieswomen do not have the legal right to own a business or property. Manybusiness transactions require some use of credit. Thus, programs to makecredit more available, especially to women, have become central to thestrategy of governments and nongovernmental organizations. The GrameenBank in Bangladesh is the most famous organization for providing micro-credit, but numerous variations exist around the world, including manytraditional savings clubs. The Grameen Bank approach involves meetingswhere participants agree to support a list of tenets including family planning;loans can also be made for housing with the requirement that the woman’sname must be on the contract as sole or joint owner.
While microcredit programs are an important part of survival strategiesin market-oriented economies, they are limited in scope, and researchershave noted serious problems with reliance on this form of developmentstrategy (Hulme 2000; Goetz and Sen Gupta 1996). Loans are frequentlygiven to women who then have the obligation to repay them. Often, however,their husbands use the loans; this may still increase family well-being if theuse is productive and the husband makes the loan payments, but it becomesa wasted resource if used for non-productive consumption (such as alcohol).Arguments over the use of the loan have also been associated with domesticviolence. Studies indicate that women are most likely to benefit from theloans when they are educated, have cooperative husbands, and have personalaccess to the market; women who are in worse situations still need otherprograms (UNIFEM 2000). Little attention has been given to analyzing thecircumstances of women whose businesses fail or whose loans aremisdirected. Risk is significant; although some microentrepreneurs do muchbetter than they would in formal jobs, others would be better off with thesecurity of a steady income (Tinker 1997; Elson 1995).
A broader-based strategy has developed in response to the needs ofhome-based microentrepreneurs and to address the problems of microcreditprograms. The best known organization is SEWA (Self-Employed Women’sAssociation) of India. Others include Homenet International and Women inInformal Employment: Globalizing and Organizing (WIEGO). Theseprograms provide a full range of support activities, such as preventing thelocal police from harassing street vendors. They provide an important sourceof communication, organization and support for home-based workers whowould otherwise be isolated.
Political participation
To participate fully in society, a person must have political as well aseconomic representation. Women rarely hold as many political seats as men;
60 Gale Summerfield

and in some countries (such as Kuwait) they are still struggling for the rightto vote. Quotas for women’s participation that are being tried in India at thelocal panchayat level give women more representation. Political quotas havebeen abandoned during socialist countries’ transition to capitalism. In thesecountries, women face the paradox of being elected less often but nowhaving more voice to make decisions when they are elected. In China, villagelevel elections are leading the way in terms of change and are viewed as keyto a more democratic process. Women have held the top leadership positionsin some developing countries, for example India, the Philippines, andPakistan; but they have been relatives of men who have previously been inoffice. Still, in the USA and other industrialized countries, even womenrelatives have been less successful at getting elected to high levels.
Women’s organizations and NGOs provide an alternative way to powerfor many women in developing countries. These institutions allow them toaddress specific issues directly without the requirements of time and moneythat formal political participation requires. They can overcome or circum-vent corruption, a problem common in entrenched political parties.
Education
Formal schooling provides the background, contacts and entrance require-ments to opportunities in politics and the economy. With increasingglobalization, education is associated with the flexibility to adapt tochanging conditions (Hill and King 1995). Knowledge-intensive output isreplacing more traditional types of production (World Bank 2000). Indeveloping countries, the marginal social gains from girls’ education are atleast as high as those from boys’ education but the private net benefits maybe less, resulting in parents’ decisions to provide schooling for sons ratherthan daughters (discussed further in the following section on intra-household allocation). Alternatives to formal education and reform oflearning systems and incentives are current agenda items in this area.
Intra-household allocation
One focus of the gender and development field is to examine how policy andsocial changes play out within the household. This contrasts to themainstream economic approach of taking the household as a harmoniousunit making decisions through an altruistic dictator (Becker 1991).WID/GAD is heavily influenced by Amartya Sen (1990), who views thehousehold as including aspects of collaboration and of conflict. Income isnot always pooled; family members argue over housework, leisure, andspending decisions; and spouse and child abuse occur too often to confirmthe model of a fully cooperative household (Sen 1990; Haddad et al. 1995).According to Sen, factors outside the household which empower women tomake a more visible contribution in society and the household strengthentheir bargaining power within the family. Education, employment oppor-
Gender and development 61

tunities and political participation increase agency (Sen 1995). A woman’sability to earn income also provides security for the family, especially intimes of economic upheaval associated with economic restructuring. Women’semployment is especially important given that female-headed households areincreasingly common.
Reform-related changes have given rise to questions such as how home-based microenterprise affects women’s well-being and agency in contrast toformal-sector employment. Control of the enterprise including decision-making power, visibility and amount of earnings, and child care arrange-ments all influence the contribution to women’s well-being. In general,expanding capabilities appear to correspond to an expansion of real choicesabout how to earn income and raise children. Development programsincreasingly realize that gender issues must be explicitly addressed at alllevels of policy design and implementation; furthermore, a participatoryapproach to policy design and reform is optimal. Research indicates thatwomen spend a greater percentage of their earnings on children and basicfamily needs (Blumberg et al. 1995). It matters whether the woman is thedesignated or joint recipient of program benefits or if the husband hasexclusive contact with development workers.
Wife abuse is an accepted tradition in many societies. In some countrieskilling is condoned as an honor crime if adultery is suspected. In others,routine beatings are said to be a sign that a man loves his wife. Women’sorganizations have become active in opposing honor crimes, dowry-relatedextortion, rape, and beatings. Female police units have been set up incountries such as Brazil and India so that women can feel more comfortablediscussing rape and other problems.
Scholars have begun to study the roles of other individuals in the co-operative-conflict context. Daughters and sons, for example, have differentopportunities in many societies. Mothers and fathers may provide educationand other opportunities to their sons instead of their daughters because sonsare expected to provide for them in old age and have better opportunities toearn a higher income. With economic reforms, higher fees for education,increased opportunities to operate home-based enterprises, and migration ofsome household members to the city or other countries have increased theschool drop-out rate for girls (Summerfield 1997). In the 1990s, a contrastingphenomenon has been observed in some countries (Pakistan, parts ofIndonesia during the Asian Crisis, Latin America), where relatively moregirls than boys attend school (especially at primary levels). Reasons for thishave not been thoroughly investigated but job opportunities for boys orbiases from development programs to aid girls’ education may be responsible(in Aslanbeigui et al., forthcoming).
Perceptions become distorted by social conventions. Women in develop-ing countries frequently cannot distinguish their own well-being from that oftheir family (Sen 1990). While some researchers have focused only on theindividual, many analyze issues in terms of individuals within the house-
62 Gale Summerfield

hold, the household and the broader community (see Tinker andSummerfield 1999). Indeed, the perception that well-being is tied to con-forming to traditions may lead women to pass on hurtful traditions (foot-binding in China or genital mutilation in sub-Saharan Africa) (Papanek1990). The interplay between policy and family allows development analyststo better appreciate the changing nature of the family and household.
Culture and institutions
Patriarchy and preference for sons run deep in most societies. Such biases arebuilt into the institutional system as it evolves. Job opportunities, legal rights,transfer of property (often patrilineal), residence patterns (virilocal in manytraditions) and reliance on sons for support in old age are typical genderedsocial constructs. At the micro level, the family is an institution that offerssupport and security at the same time that it reinforces women’s secondary rolein society through unpaid labor, lack of legal rights (e.g. requiring a husband’spermission to work or enter into contracts) and silence on domestic violenceagainst women. Economic transformation threatens the family as a traditionalinstitution; yet little has emerged to replace the family’s role in offeringsecurity. Family members migrate, divorce becomes more common, diseasessuch as HIV/AIDS lead to the demise of parents in their prime. Developmentstrategies that address these issues include institutionalizing social securitysupport systems (which also help in crises) that include pensions,unemployment insurance, support for those not in the formal labor marketwho lose their income during a crisis, and parental leave. The family as aninstitution needs to be reformulated to permit more equal treatment of itsmembers (Jaquette and Wolchik 1998; Tinker and Summerfield 1999).
Transnational/multinational corporations represent another level of theinstitutional structure of society; they have evolved over the decades andtheir influence continues to grow. Transnationals are the prime movers of theglobalization process. The structural reforms required by the IMF andWorld Bank that stress export-oriented industrialization, and repayment ofloans from commercial banks and financial institutions have accelerated theprocess. Companies from the United States and the United Kingdom nolonger dominate; developing countries also operate transnationals in othercountries. Some postulated that transnationals would replace the nation stateas the primary political force, especially since the role of state appears to beshrinking. In 2000, however, the process appears to be more complex.Although market reformers often pose the state and market as oppositional,many development economists stress that a more accurate statement centerson the appropriate role for each. Markets cannot satisfy all social goals, andethical issues play as much of a role as efficiency (Aslanbeigui and Medema1998). The proliferation of Western culture and business has generated acritique of post-colonial destruction of existing cultures and a renewedacademic interest in identity (Escobar 1995).
Gender and development 63

Globalization has spurred another area of institutional analysis: newways of addressing workers’ needs. Nongovernmental organizations such asSEWA play a crucial role in the new institutional process. They provide analternative to formal political participation that is dominated by the wealthyand plagued by corruption. Separate women’s organizations play a sig-nificant role in addressing women’s issues and in building women’s ‘voice’. Inthe 1990s, NGOs have been influential in international conferences. Theirinput, for example, resulted in a program of action from the InternationalConference on Population and Development in Cairo in 1994, stressingwomen’s education and employment in population planning policies. Themeeting of representatives from NGOs at the Fourth World Conference onWomen in China in 1995 was the largest gathering of this type. The dynamicinteraction of these NGOs holds a significant promise for stimulatingrelevant policy-oriented research and grassroots activities in the wake of theconferences.
The UN Conferences themselves are an institutional format for bringingtopics to public attention and identifying a set of goals for government pro-gress reports. During the 1990s, the environment, population and develop-ment, social development, women’s issues and housing have been topics forthe meetings and follow-up sessions.
One of the greatest disparities between women and men is in ownershipof property (Agarwal 1994; Tinker and Summerfield 1999). With reformsthat stress privatization and markets, women’s rights to own propertybecome even more significant. For joint ownership, women as well as menmust sign the contracts. Women’s traditional rights to land and housing haveusually come through the husband. If he dies or they are divorced, the wifefrequently loses her rights to the property. Although sons may maintainrights to property when their father dies, if they are underage, these rightsare often not acknowledged.2 Legal rights must be enforced to guarantee realcapabilities and provide security. In 1999, the Supreme Court of Zimbabwetook a significant step backward when it ruled that traditional law wouldsupersede civil law, in effect removing women’s rights to property ownership.Critical institutional strategies would use new institutions such as NGOs tohandle some of the responsibilities that governments would have addressedand to transform other institutions, such as the family, into more equitableunits.
Environmental policy
The accelerating pace of environmental degradation has made sustainabilitya key aspect of development policies. The environment, however, is still notaddressed consistently in policies and analysis (Wee and Heyzer 1995). Inaddition, while the ‘brown’ issues of pollution and extinction are compelling,the ‘green’ issues of environmentally friendly processes should also beaddressed. Because men and women have different socially constructed
64 Gale Summerfield

gender roles, they interact with the environment differently. Men are morelikely to find work in the forestry industry, for example, while women aremore likely to lose their access to fuel wood and vegetation that theyscavenge from the forest floor (Ireson 1996). Women are more likely to spendextra time fetching clean water when sources near their homes becomepolluted. They and their children are more likely to be affected by indoorpollution from inadequately ventilated charcoal stoves, or contaminationassociated with home-based microenterprises.
Women comprise more than two-thirds of the world’s poor and tend to bemore vulnernable to natural disasters and associated hunger and famine thanmen. Traditional discrimination in India has led to later hospital admissionsfor women during famines, resulting in higher mortality (Kynch and Sen1983). Targeted feeding programs during famines have been identified withdeprivation of girls in order to qualify the family for the program. Alternativestrategies include: early intervention by permitting a free press to reportproblems, democratic political processes that are less tolerant of famine(although endemic hunger often remains a problem), and temporarygovernment work programs that support income and food markets. Thesework programs during a crisis must be broad enough to reach more than afraction of those affected and include jobs for women as well as men (Drèzeand Sen 1985). Policies aimed at relieving endemic hunger are not genderneutral either since they are introduced into situations where women and girlsare disadvantaged; one study indicated, for example, that direct feedingprograms had a more beneficial effect on girls’ health than programs thatdistributed food for the family to consume at home (Sen and Sengupta 1983).
Women have been the main subsistence agricultural producers in sub-Saharan Africa for years, and with trade liberalisation policies, they areincreasingly the main agricultural workers in countries like China andVietnam. With increased trade, more fertilizer and pesticides are importedand used. Often protective measures are inadequate; inappropriate useharms the workers, often women, who apply the products, and the consumersof the agricultural output – in the cities or, when they are exported, in othercountries. Better labeling in appropriate languages, diagrams and trainingprograms would be useful.
Some environmentally friendly products have expanded with trade liberal-ization. In particular, growing and exporting medicinal herbs has becomea source of income for women in countries like Vietnam (Tinker andSummerfield 1999). Economic crises and cuts in health-care spending haveincreased the demand for traditional medicines as people switch from usingexpensive medical clinics and doctors.
Forward-looking themes
Methods and rhetoric continue to evolve. Researchers are increasinglylooking for new methodological approaches; especially influential are Sen’s
Gender and development 65

capabilities and entitlements concepts and the post-structuralist, post-colonial works by various authors (Sen 1990, 1995; Nussbaum and Glover1995; Escobar 1995; Jackson and Pearson 1998). Transnational issuesoverlap with areas of local feminisms, decreasing the projection of ‘theother’ in both South and North. Multi-disciplinary exchanges are increasing,bringing diverse fields and theories together: for example, art and politicaleconomy, or medicine and communications. Poor women help carry outtheir own surveys instead of being ‘the researched’ (UNCHS 1996); ordinarypeople equipped with video cameras tape their own documentaries.
As the field of women, gender and development looks to the future, somethemes continue in importance; new issues emerge. The field continues tobring together scholars, practitioners and policy-makers. This is a strength.Policy-oriented research links the academy with the real world and helpspractitioners discern whether the cases they are involved with arerepresentative. Women’s movements are working for change in manycountries, in many different ways. These movements are one reason to keepwomen an integral focus of the field as well as the gender disparities.
The focus on women brings in organizational activities and centers onabsolute changes in well-being. Gender stresses the crucial area of relativedisparities and brings men as well as women into the dialog. At the sametime, gender can be used inappropriately by people uncomfortable withwomen’s issues to deflect the analysis away from women or to ‘sanitize’ it(Jackson and Pearson 1998). Both concepts – women and gender – are neededfor a full understanding of changing capabilities because relative disparitiesmay be shrinking even though absolute levels of ‘goods’ like education arefalling (hardly a desirable outcome) and vice versa.
Economic transformation policies and the process of globalizationcontinue to shape the environment of most of the world’s people. The AsianCrisis of 1997–8 illustrates that we can expect crises to recur; to date, theresponse by local governments and the international financial institutionshas relied mainly on the same type of policies observed in the earlier DebtCrisis with slightly more emphasis on the social safety net. Women as well asmen need to be actively involved in reforming the international financialarchitecture so that responses to crises will be more appropriate to thespecific circumstances and include an explicit focus on gender aspects(Aslanbeigui and Summerfield 2000).
Globalization affects employment, bringing women and men into moreinteraction with the market. It contributes to the growing labor-forceparticipation rates of women, though many of the job opportunities are inlow-level, low-wage work with few chances for advancement; it alsocontributes to the growing flexibility, informalization, and contingencynature of the labor force. Financial crises, wars, crime and environmentalproblems are leading to more focus on socio-economic, as well aspolitical, security (Baud and Smyth 1997; Summerfield 2001). Studies ofcaring labor and methods of modeling macroeconomic changes with
66 Gale Summerfield

gender included are being examined (Cagatay et al. 1995; Grown et al. 2000).Crossing borders reflects the growing interest in breaking the view of ‘us’
versus ‘them.’ Migration, between countries as well as from rural and urbanareas, is an expanding area of interest as urbanization and globalizationaccelerate the process. Women are compelled to migrate for remunerativereasons, leaving behind their children and families. Indonesia’s experienceduring the Asian Crisis illustrates that reverse migration, especially in timesof economic upheaval, also occurs; in Indonesia during 1997–8, theagricultural sector had to absorb many of the newly unemployed urbanresidents. The line between more developed and developing countries is lessdistinct; problems and policies, as well as people, cross borders. Area studiesand ethnic studies are finding common themes.
Thus, the paradigm is shifting from the earlier emphasis on growthto human-centered, environmentally aware development policies. Expansionof people’s opportunities and capabilities and the security to exercise theseopportunities become goals of development in global perspective. Thisprocess requires participation from women and men of different classes,ages, and backgrounds at all levels of decision-making and research.
Notes
1 See Beneria and Feldman 1992; Aslanbeigui, Pressman and Summerfield 1994;Bakker 1994; Sparr 1994; Elson 1995; and Pyle and Summerfield 2000.
2 In a recent case in Kenya, when the husband in a family with five adolescentsons died, his brothers claimed the land for their own use.
References
Agarwal, Bina (1994) A Field of One’s Own: Gender and Land Rights in South Asia,New York: Cambridge University Press.
Aslanbeigui, Nahid and Gale Summerfield (2000) ‘The Asian crisis, gender, and theinternational financial architecture,’ Feminist Economics, vol. 6, no. 3, pp. 81–103.
Aslanbeigui, Nahid and Steven Medema (1998) ‘Beyond the dark clouds: Pigou andCoase on social cost’, History of Political Economy, vol. 30, no. 4, Winter, pp.601–625.
Aslanbeigui, Nahid, Steven Pressman and Gale Summerfield (eds) (forthcoming)Strategies and Policies in the Age of Economic Transformation, London: Routledge.
—— (eds) (1994) Women in the Age of Economic Transformation, London:Routledge.
Bakker, Isabella (ed.) (1994) The Strategic Silence: Gender and Economic PolicyLondon: Zed.
Basu, Amrita (1995) The Challenge of Local Feminisms: Women’s Movements inGlobal Perspective, Boulder, CO: Westview Press.
Baud, Isa and Ines Smyth (eds) (1997) Searching for Security: Women’s Responses toEconomic Transformations, London: Routledge.
Becker, Gary S. (1991) A Treatise on the Family, Cambridge, MA: Harvard UniversityPress.
Gender and development 67

Beneria, Lourdes and Shelley Feldman (eds) (1992) Unequal Burden: EconomicCrises, Persistent Poverty, and Women’s Work, Boulder, CO: Westview Press.
Blumberg, Rae Lesser, Cathy A. Rakowski, Irene Tinker and Michael Monteon (eds)(1995) EnGENDERing Wealth and Well-Being, Boulder, CO: Westview Press.
Boris, Eileen and Elisabeth Prugl (1996) Homeworkers in Global Perspective: InvisibleNo More, New York: Routledge.
Boserup, Ester (1970) Woman’s Role in Economic Development, New York: St Martin’sPress.
Cagatay, Nilufer, Diane Elson and Caren Grown (1995) ‘Introduction’, WorldDevelopment, vol. 23, no.11, pp. 1827–36.
Drèze, Jean and Amartya Sen (1989) Hunger and Public Action, Oxford: ClarendonPress.
Elson, Diane (1995) Male Bias in the Development Process, 2nd edition, Manchester:Manchester University Press.
Escobar, Arturo (1995) Encountering Development: The Making and Unmaking of theThird World, New Jersey: Princeton University Press.
Goetz, Anna Marie and R. Sen Gupta (1996) ‘Who takes the credit? gender, powerand control over loan use in rural credit programs in Bangladesh’, WorldDevelopment, vol. 24, no. 1, pp. 45–63.
Grown, Caren, Diane Elson and Nilufer Cagatay (2000) ‘Growth, trade, finance, andgender inequality’, in World Development, vol. 28, no.7, pp. 1145–56.
Haddad, Lawrence, Lynn Brown, Andrea Richter and Lisa Smith (1995) ‘The genderdimensions of economic adjustment policies: potential interactions and evidenceto date’, World Development, vol. 23, no. 6, pp. 881–96.
Hill, Anne and E. King (1995) ‘Women’s education and economic well being’,Feminist Economics, vol. 1, no. 2, pp. 21–46.
Hirschman, Albert O. (1981) ‘Rise and decline of development economics’, in Essaysin Trespassing, Cambridge: Cambridge University Press.
Hulme, David (2000) ‘Impact assessment methodologies for microfinance: theory,experience and better practice’, World Development, January, pp. 79–98.
Ireson, Carol (1996) Field, Forest, and Family: Women’s Work and Power in RuralLaos, Boulder, CO: Westview Press.
Jackson, Cecile and Ruth Pearson (eds) (1998) Feminist Visions of Development:Gender Analysis and Policy, London and New York: Routledge.
Jaquette, Jane S. and Sharon L. Wolchik (eds) (1998) Women and Democracy: LatinAmerican and Central and Eastern Europe, Baltimore and London: Johns HopkinsUniversity Press.
Klasen, S. (1999) ‘Does gender inequality reduce growth and development? Evidencefrom cross-country regressions’, Policy Research Report on Gender and Develop-ment, Washington, DC: The World Bank.
Kynch, Jocelyn and Amartya Sen (1983) ‘Indian women: well-being and survival’,Cambridge Journal of Economics, no. 7, pp. 363–80.
Murphy, Josette (1997) Mainstreaming Gender in World Bank Lending: An Update,Washington, DC: The World Bank.
Nussbaum, Martha and Jonathan Glover (eds) (1995) Women, Culture and Develop-ment: A Study of Human Capabilities, Oxford: Clarendon Press.
Papanek, Hanna (1990) ‘To each less than she needs, from each more than she cando: allocations, entitlements, and value’, in Irene Tinker (ed.) PersistentInequalities: Women and World Development, New York and Oxford: OxfordUniversity Press, pp. 162–81.
68 Gale Summerfield

Pyle, Jean and Gale Summerfield (2000) ‘Economic restructuring’, in Janice Petersonand Margaret Lewis (eds) The Elgar Companion to Feminist Economics, Cheltenham,UK and Northampton, MA: Edward Elgar, pp. 289–302.
Sen, Amartya (1984) ‘Development: which way now?’, in Resources, Values andDevelopment, Cambridge: Harvard University Press, pp. 485–508.
—— (1990) ‘Gender and cooperative conflicts’, in I. Tinker (ed.) Persistent Inequalities:Women and World Development, New York: Oxford University Press, pp. 123–49.
—— (1995) ‘Agency and well-being: the development agenda,’ in Noeleen Heyzer(ed.) A Commitment to the World’s Women, New York: UNIFEM, pp. 103–12.
Sen, Amartya and S. Sengupta (1983) ‘Malnutrition of rural children and the sexbias’, Economic and Political Weekly, p. 19.
Sparr, Pamela (ed.) (1994). Mortgaging Women’s Lives: Feminist Critiques of StructuralAdjustment, London: Zed.
Summerfield, Gale (1997) ‘The development of economic development: 1980–95’, inN. Aslanbeigui and Y.B. Choi (eds) Borderlands of Economics: Essays in Honor ofDaniel R. Fusfeld, London and New York: Routledge, pp. 92–108.
Summerfield, Gale (ed.) (2001) Risks and Rights in the 21st Century, special sym-posium edition, International Journal of Politics, Culture, and Society, vol. 15, no. 1.
Summerfield, Gale and Irene Tinker (1997) ‘The family and economic trans-formation in developing countries: impacts and strategies, a symposium based onissues raised at the NGO forum of the United Nations’, Fourth World Conferenceon Women, Huairou, China, August 30–Sept. 9, 1995’, Review of Social Economy,vol. 55, Summer.
Tinker, Irene (1997) Street Foods: Urban Food and Employment in DevelopingCountries, New York and Oxford: Oxford University Press.
Tinker, Irene and Gale Summerfield (eds) (1999) Women’s Rights to House and Land:China, Laos, Vietnam, Boulder: Lynne Rienner Publishers.
UNCHS (1996) Women’s Empowerment: Participation in Shelter Strategies at theCommunity Level in Urban Informal Settlements, New York: United Nations.
United Nations Development Fund for Women (UNIFEM) (2000) Progress of theWorld’s Women, New York: United Nations.
Wee, Vivienne and Noeleen Heyzer (1995) Gender, Poverty and Sustainable Develop-ment: Towards a Holistic Framework of Understanding and Action, Singapore:ENGENDER and UNDP.
World Bank (2000) Engendering Development: Policy Research Report on Gender andDevelopment, Washington, DC: World Bank.
World Development (1995) Special Issue: ‘Gender, adjustment and macroeconomics’,vol. 23, no. 11, November.
Gender and development 69

5 Food security in developingcountries
Randy Stringer
Introduction
Food security and hunger are age old problems that endure today. Morethan 820 million people are chronically undernourished because they areunable to obtain sufficient food by any means. Chronic malnutrition resultsfrom a continuously inadequate diet, reducing physical capacity, loweringproductivity, stunting growth and inhibiting learning. Over time, chronicmalnutrition kills, blinds and debilitates. Yet enough food is produced world-wide to provide adequate food for all. The current global population ofsome 6 billion people have 15 per cent more food available per capita thanhad the world’s 3 billion people some four decades ago. After fifty years ofsubstantial economic growth, steady progress in agricultural productivity,remarkable increases in per capita food availability, and numerous inter-national and national efforts to address hunger, food security remains aformidable global problem.
Food security implies an individual has access at all times to enough foodfor an active and healthy life. Food security has numerous interrelateddimensions. Availability of food and access to food are the two mostcommon defining characteristics of food security. Availability and access tofood are affected by population growth, demographic trends, economicdevelopment, government policies, income levels, health, nutrition, gender,environmental degradation, natural disasters, refugees, migration, diseaseand concentrated resource ownership. Nations increasingly understand thatmany of these problems cannot be resolved by one country or group; theytranscend national borders, spreading starvation, instability and environ-mental degradation throughout the region and around the world.
During the early 1990s, food security issues pushed their way back onto acrowded international agenda. Not since the ‘world food crisis’ of the early1970s had the international community focused so much attention on theseemingly never ending race between food production and populationgrowth.1 Record-low levels of global food reserves in the mid 1990s, weather-related crop failures, financial and economic crisis, policy-induced declines infood production and doubts about the long-term sustainability of the
70 Author name

Earth’s resource base to meet future global demands focused increasingattention on food security. In addition, many of yesterday’s issues are backon today’s agenda because of renewed concerns over declining growth ratesfor cereal yields, falling investment levels in agricultural research, and thepersistence of large numbers of malnourished people throughout the develop-ing world.
Moreover, economic liberalisation, privatisation efforts, government spend-ing reductions and the globalisation of investment and manufacturing beganraising new concerns about agriculture’s ability to compete for resources.Stabilisation policies, structural adjustment programmes and transitions fromsocialist to market-oriented economies influence sectoral and regional growthpatterns, modify incentive structures, shift relative factor prices and reshapeeconomic and social institutions. These far-reaching national-level reforms ineconomic, financial and political systems alter agriculture’s capacity to attractor retain land, water, labour and investment.
Regional and multilateral trade agreements as well as internationalConventions on biological diversity, forestry, wetlands, fisheries and climatechange have important implications for food production, consumption andtrade, further complicating food security policy choices. Because foodsecurity is fundamental to national security and economic growth, agricul-ture gradually began to play a more dominant role in the policy debatesabout how to restructure domestic economies, reorganise public sectoractivities, and expand regional and global trade and environmental agree-ments.
This chapter reviews food security issues in developing countries. Thefollowing section explores the evolving nature, characteristics and conceptualissues associated with food security, focusing on the various policyapproaches used to address hunger and how those policies have changedover time. The third section discusses how food security is measured,providing an overview of regional experiences. The fourth section examinesthe relationship between food security, economic development and poverty.The fifth section assesses the topical issue of environmental sustainability.The sixth section attempts to explain why the too often ignored relationshipbetween gender and food security is so crucial to a successful reduction infood insecurity. The final section provides some concluding remarks.
Food security: a question of supply or access?
Throughout the 1970s, the food security debate focused primarily on thecollective ability of the world’s nations to produce enough food to feed arapidly expanding population. Most studies during this period tended todefine food as cereals (Reutlinger 1977a; Valdés and Siamwalla 1981;Konandreas et al. 1978). Record low levels of cereal stocks and high cerealprices in the early 1970s raised fears about the long-term prospects of theworld food system. The 1974 World Food Conference convened to address
Food security in developing countries 71

this growing perception that the world was moving irrevocably toward foodshortages and to suggest mechanisms to protect food supplies from majorcrop failures.
The solutions that emerged focused on enhancing production possibilities,establishing national-level self-sufficiency targets, coordinating world foodstocks and implementing import stabilisation policies (UN 1975; S. Maxwell1994). For the most part, developing countries tended to pursue food self-sufficiency goals through agricultural policies and programmes that wouldincrease domestic food production to meet national level targets. Even today,some countries still equate food security with food self-sufficiency, eventhough widespread evidence demonstrates that hunger coexists with abundantfood supplies at regional, national and international levels.
Sen (1981) initiated the shift in thinking that helped broaden food securityanalysis from this narrow focus on national and global food suppliesto include an access dimension faced by millions of households andindividuals. Empirical evidence demonstrated that, while availability of foodsupplies is important, access to food by individuals is the greater constraint(Sen 1981; Ravallion 1987; Drèze and Sen 1989, 1990; Ravallion 1997).Access to food depends on an individual’s access to resources, technology,markets, social networks and food transfer programmes. The opportunitiesto produce or obtain food by any of these means were described by Sen asentitlements.
Sen provided the theoretical basis for entitlements to food by demon-strating its relevance in famine situations (S. Maxwell 1994; Devereux 1993),pointing out that during the Ethiopian famine of 1972–4, food output,supplies and consumption at the national level were normal, yet 50 to 200thousand people starved to death. Most died because they could not affordto buy food. These findings drew attention to the need for policy-orientedgrowth strategies aimed at providing an economic environment conducive tobroad-based development, poverty reduction and access to food. Strategiesto complement existing projects aimed at increasing food production andmeeting national-level food self-sufficiency targets.
During the 1980s, researchers further enriched the food security debate byfocusing attention on important distinctions between the household andindividual as an appropriate unit of analysis. A key contribution emergingfrom this debate is that access to food by individuals is linked to their controlover household income and household resources (S. Maxwell 1994; Evans1991; Reutlinger 1985; Sahn 1989; Sen and Sengupta 1983). The policyimplications can be enormous. For instance, research found that non-wagehousehold income in urban Brazil has a much more positive effect on childhealth if it is controlled by mothers (Thomas 1991). Food security researchin Kenya and Malawi found that: (a) child nutritional status is influenced bythe interaction of income and gender of household head rather than just oneor the other, and (b) household food security is influenced by total house-hold income, and the proportion of income controlled by women has a
72 Randy Stringer
positive and significant influence on household caloric intake (Kennedy andPeters 1992).
The importance of nutritional security as a fundamental component offood security also began to emerge during the 1980s. Earlier approaches tofood security that relied on target consumption levels (e.g. 80 per cent of theWorld Health Organisation’s average required daily calorie intake) wereshown to be inadequate for several reasons (S. Maxwell 1994). First,individual nutritional requirements vary a great deal depending on age, job,size and health (Payne and Lipton 1994). Second, behavioural characteristicsare important influences on nutritional status including breast-feeding,sanitation habits and the use of local foods (World Bank 1995). Third,research suggested that micronutrient deficiencies, infections, diseases,intestinal parasites and environmental factors contributed to malnutrition asmuch as calorie deficiencies (Strauss and Thomas 1998; Del Rosso 1992;Tomkins and Watson 1989). Fourth, nutritional status has important effectson the quality of household labour resources (Kennedy and Bouis 1993).
During the 1990s, the food security literature expanded greatly to addressmarket-oriented economic growth, agricultural development, poverty reduc-tion, demographic trends, rising incomes, changing food consumptionpatterns, gender issues and the environment. In particular, market-orientedeconomic growth became sine qua non for reducing poverty and improvingfood security. Broad development lessons suggested the need for a greateremphasis on markets, removing anti-agricultural policy bias, and emphasis-ing trade to promote growth, improve welfare and provide greater access tofood (Stamoulis 1995). Specific development experiences, however, point toimportant caveats. First, the manner in which development strategies achieveeconomic growth and the number of people who participate and benefit areas important as the increased economic growth itself. Second, economicgrowth alone is insufficient to eliminate hunger. Third, as D. Maxwell andWiebe (1998) point out, a complete definition of food security needs toincorporate three dimensions of access to food: (1) sufficient food to meetevery individual’s needs; (2) individuals must have the ability to generatesufficient food without sacrificing their endowments (Wiebe 1994); and (3)societies must be able to protect individuals from shocks, i.e. loss of job,disasters, financial crisis, etc.
Addressing these caveats became increasingly daunting for policymakers ascountries opened their domestic markets to world market price signals as partof their overall policy reforms and market liberalisation. In particular,concerns rose that deregulated markets would affect food prices. The evidenceshows that for more than fifty years, food supplies have been sufficient toensure that international food prices increased less than other prices. Actionstaken by governments, the private sector, and international agencies criticallyinfluence the short- to medium-term prospects (Anderson 1995).
Price fluctuations in world markets will persist because world productionfluctuations are the dominant cause of price instability and those fluctu-
Food security in developing countries 73

ations are in part weather-determined. Price stabilisation strategies thatlooked to government interventions to vary the world’s publicly held grainstocks will be less significant in the future with the implementation of theUruguay Round agreement, involving as it does reductions in price supportprogrammes in developed countries and hence cuts in world food surpluses.Any resulting increase in world price instability, if fully transmitted todomestic markets, would upset food-deficit developing countries. However,government stockholders were not aiming to stabilise international foodprices (and, even if they were, they were not necessarily successful). Govern-ment programmes did crowd out private stockholders who could havecontributed to the stabilising of international food prices. Therefore, the fearin food-deficit low-income countries of increased food insecurity followingimplementation of the Uruguay Round is not well founded (Anderson 1997;Johnson 1998).
Projections by FAO, IFPRI, the World Bank and others indicate that ifgovernments pursue appropriate macroeconomic and sectoral policies andexpand investment in agriculture, agricultural productivity will increase,global grain production will keep up with demand, and real cereal prices willcontinue the downward trend of the last fifty years (Alexandratos 1995;Islam 1995; Pinstrup-Anderson et al. 1997; Rosegrant and Ringler 1997;World Bank 1992c; Johnson 1998; Anderson et al. 1996).
In low-income countries where people spend a high proportion of theirincome on food, even small food price increases can be detrimental to thewell-being of the urban and rural poor. Many of the poorest people in low-income countries also depend on agriculture – directly or indirectly – fortheir livelihoods, and rising crop prices may actually increase their realincomes and food intake.
Measuring progress in food security
The two most common measures of food security are: (1) whether adequatefood supplies are available, and (2) whether individuals have sufficient accessto those food supplies.2 Food availability is measured in calories available perperson per day at the country, regional and global levels. Both the mean andthe variance of available supplies matter. The total quantity of foodstuffsproduced in a country is added to the quantity imported and adjusted forchanges in stocks, seed, wastage, livestock feed and non-food usages. In themid 1990s, about 50 per cent of the world’s cereal production was used fordirect human consumption, and 37 per cent was used for feed (Alexandratos1995).
In the developing countries as a group, progress in per capita foodsupplies has been nothing short of remarkable, increasing from 1,960calories in the early 1960s to more than 2,600 calories by 1995/97 (Table 5.1).This 34 per cent gain per person is particularly impressive given that it tookplace during a period in which developing country population more than
74 Randy Stringer
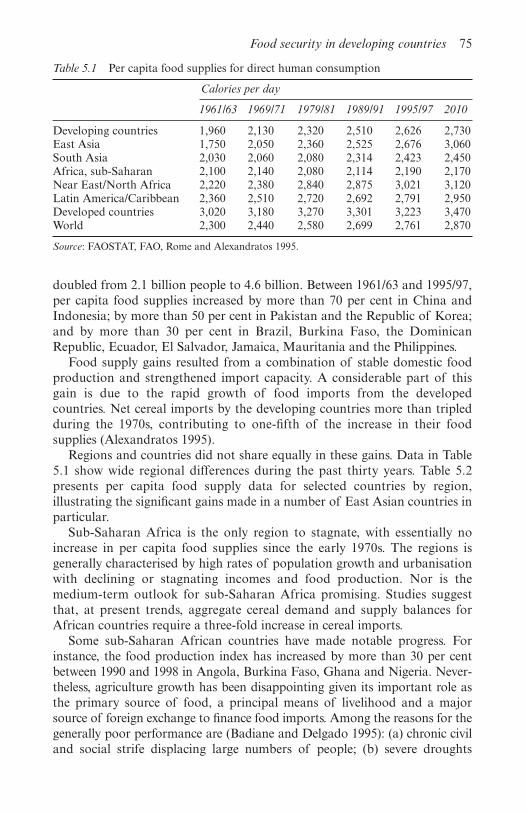
doubled from 2.1 billion people to 4.6 billion. Between 1961/63 and 1995/97,per capita food supplies increased by more than 70 per cent in China andIndonesia; by more than 50 per cent in Pakistan and the Republic of Korea;and by more than 30 per cent in Brazil, Burkina Faso, the DominicanRepublic, Ecuador, El Salvador, Jamaica, Mauritania and the Philippines.
Food supply gains resulted from a combination of stable domestic foodproduction and strengthened import capacity. A considerable part of thisgain is due to the rapid growth of food imports from the developedcountries. Net cereal imports by the developing countries more than tripledduring the 1970s, contributing to one-fifth of the increase in their foodsupplies (Alexandratos 1995).
Regions and countries did not share equally in these gains. Data in Table5.1 show wide regional differences during the past thirty years. Table 5.2presents per capita food supply data for selected countries by region,illustrating the significant gains made in a number of East Asian countries inparticular.
Sub-Saharan Africa is the only region to stagnate, with essentially noincrease in per capita food supplies since the early 1970s. The regions isgenerally characterised by high rates of population growth and urbanisationwith declining or stagnating incomes and food production. Nor is themedium-term outlook for sub-Saharan Africa promising. Studies suggestthat, at present trends, aggregate cereal demand and supply balances forAfrican countries require a three-fold increase in cereal imports.
Some sub-Saharan African countries have made notable progress. Forinstance, the food production index has increased by more than 30 per centbetween 1990 and 1998 in Angola, Burkina Faso, Ghana and Nigeria. Never-theless, agriculture growth has been disappointing given its important role asthe primary source of food, a principal means of livelihood and a majorsource of foreign exchange to finance food imports. Among the reasons for thegenerally poor performance are (Badiane and Delgado 1995): (a) chronic civiland social strife displacing large numbers of people; (b) severe droughts
Food security in developing countries 75
Table 5.1 Per capita food supplies for direct human consumption
Calories per day
1961/63 1969/71 1979/81 1989/91 1995/97 2010
Developing countries 1,960 2,130 2,320 2,510 2,626 2,730East Asia 1,750 2,050 2,360 2,525 2,676 3,060South Asia 2,030 2,060 2,080 2,314 2,423 2,450Africa, sub-Saharan 2,100 2,140 2,080 2,114 2,190 2,170Near East/North Africa 2,220 2,380 2,840 2,875 3,021 3,120Latin America/Caribbean 2,360 2,510 2,720 2,692 2,791 2,950Developed countries 3,020 3,180 3,270 3,301 3,223 3,470World 2,300 2,440 2,580 2,699 2,761 2,870
Source: FAOSTAT, FAO, Rome and Alexandratos 1995.

76 Randy Stringer
Table 5.2 Per capita food supplies
Percentage Calories per day change
1979/81 to 1979–81 1989–91 1995–97 1995/97
Sub-Saharan Africa
Liberia 2,524 2,124 2,042 �19Burundi 2,025 1,911 1,687 �17Madagascar 2,418 2,157 2,019 �17Central Africa Rep. 2,321 1,915 1,978 �15Somalia 1,826 1,715 1,573 �14Tanzania 2,277 2,216 2,000 �12Congo DR 2,074 2,106 1,823 �12Angola 2,147 1,798 1,900 �12Rwanda 2,286 1,950 2,052 �10Zambia 2,180 2,065 1,958 �10Malawi 2,279 1,977 2,068 �9Côte d’Ivoire 2,828 2,554 2,575 �9Cameroon 2,346 2,168 2,144 �9Kenya 2,146 1,916 1,977 �8Mozambique 1,922 1,782 1,782 �7Zimbabwe 2,230 2,146 2,095 �6Niger 2,168 2,041 2,051 �5Congo Rep. 2,221 2,188 2,133 �4Sierra Leone 2,109 2,020 2,047 �3Namibia 2,206 2,214 2,141 �3Guinea 2,270 2,056 2,250 �1Lesotho 2,248 2,222 2,236 �1Swaziland 2,467 2,653 2,479 1Uganda 2,214 2,302 2,168 2Senegal 2,349 2,293 2,403 2Gabon 2,416 2,447 2,527 5Botswana 2,124 2,320 2,228 5Sudan 2,252 2,155 2,379 6Togo 2,186 2,292 2,336 7Mauritius 2,669 2,838 2,923 10Chad 1,648 1,740 1,959 19Benin 2,046 2,297 2,466 21Mauritania 2,123 2,557 2,616 23Mali 1,758 2,157 2,208 26Gambia 1,805 2,442 2,304 28Burkina Faso 1,694 2,087 2,181 29Nigeria 2,002 2,419 2,750 37Ghana 1,743 2,075 2,617 50

Food security in developing countries 77
Table 5.2 (continued)
Percentage Calories per day change
1979/81 to 1979–81 1989–91 1995–97 1995/97
Asia
Korea DPR 2,378 2,502 1,980 �17Mongolia 2,168 2,203 1,920 �11Laos 2,079 2,088 2,056 �1Sri Lanka 2,314 2,201 2,288 �1Philippines 2,229 2,395 2,363 6Papua New Guinea 2,101 2,164 2,230 6Thailand 2,193 2,235 2,351 8Malaysia 2,724 2,758 2,938 8Bangladesh 1,914 2,068 2,082 9Pakistan 2,159 2,396 2,461 14Vietnam 2,099 2,198 2,471 18India 2,077 2,335 2,466 19Cambodia 1,716 1,936 2,045 19Nepal 1,905 2,371 2,315 22China 2,315 2,653 2,834 22Myanmar 2,318 2,625 2,853 23Indonesia 2,176 2,617 2,900 33
Latin America and Caribbean
Cuba 2,927 3,081 2,417 �17Venezuela 2,759 2,390 2,388 �13Haiti 2,042 1,769 1,837 �10Nicaragua 2,270 2,238 2,181 �4Uruguay 2,857 2,552 2,796 �2Jamaica 2,647 2,594 2,595 �2Mexico 3,114 3,080 3,108 0Dominican Rep. 2,270 2,259 2,282 1Paraguay 2,545 2,454 2,570 1Guatemala 2,289 2,418 2,336 2Bolivia 2,133 2,162 2,195 3Costa Rica 2,587 2,716 2,686 4Chile 2,665 2,540 2,774 4Panama 2,271 2,346 2,425 7Brazil 2,667 2,772 2,933 10El Salvador 2,297 2,446 2,547 11Peru 2,130 2,029 2,363 11Honduras 2,117 2,302 2,366 12Ecuador 2,359 2,499 2,660 13Colombia 2,293 2,411 2,591 13
Source: FAOSTAT 1999.
during the 1980s and early 1990s; (c) the long-term consequences of the ColdWar era on agriculture and rural development policy; and (d) the overallmismanagement of natural resources.
Per capita food supplies in the Latin America and Caribbean (LAC)region progressed steadily until the 1980s. LAC is the most urbanised andthe most resource-rich of the developing country regions. LAC has 8 percent of the world’s population, 23 per cent of the arable land, more than 45per cent of the forests and 30 per cent of its fresh water. The region alsoincludes countries with some of the most concentrated land ownershippatterns and income inequalities in the world. Agricultural production isdominated by large commercial farms. This lack of access to land is oneimportant reason why about 75 per cent of the region’s populations live inurban areas, as the landless rural poor are forced to migrate to cities insearch of income-generating opportunities.
With 60 per cent of the world’s population, Asia’s overall performancewas sufficiently strong to pull up the global average. South Asia recordedlittle progress until the 1980s, however. Asia’s food supply gains have resultedprimarily from increased domestic food production. Despite East Asia’srapid industrialisation, grain self-sufficiency decreased only marginally, from98 per cent to 96 per cent, over the two-decade period from 1970 to 1990.3
During the same twenty-year period, the ratio of food imports to totalimports in Asia declined from 15 per cent to 5 per cent. Anderson et al.(1996), using an integrated economy-wide model, conclude that the foodsecurity provided by high levels of cereal self-sufficiency in the Asia region isunlikely to be threatened.4
Ever increasing food supplies are forecast over the next few decades(Table 5.1). FAO forecasts that food supplies will increase by 10 per cent perperson in the developing countries during the twenty-year period from 1990until 2010: food supplies will be more than 3,000 calories for East Asia,2,450 calories for South Asia, 2,950 for Latin America and only 2,170 forsub-Saharan Africa (FAO 1996b). FAO, IFPRI and the World Bank allproject substantial global increases in cereal production and consumptionthrough 2010 (see Table 5.3).5 All the developing regions are expected to relyon industrial country cereal exports (Australia, Canada, France and theUnited States). For the developing countries, the forecasts project cerealproduction growth rates of 1.8 to 2.1 per cent, with population growth ratesof 1.7 per cent.
Attempts to understand how some countries have succeeded in increasingfood supplies while others have failed is difficult given the wide range ofexperiences. In many countries, productivity growth contributed greatly tofood security through cereal yield increases, particularly in rice and wheat.The combined effect of agricultural reforms and improved technologieshelped to increase Asia’s average rice yield level from 2 tonnes per hectare in1966 to more than 3 tonnes per hectare in the 1980s (Agcaoili and Rosegrant1995). This sustained technological performance in cereal production greatly
78 Randy Stringer

enhanced the region’s food supplies. Cereal availability for human consump-tion in 1990 reached 201 kg per capita in East Asia and 156 kg in SouthAsia, compared with an average of 164 kg for the world (Alexandratos1995).
To date, world food production has increased continuously becausecropped area has expanded and productivity per unit area has increased.Table 5.4 presents country examples of the arable land available per personcompared with per capita food supplies. No apparent relationship existsbetween a country’s ability to provide available food supplies and its arableland supply. For many countries, technological change accounted for muchof the food productivity growth over the last three decades, including geneticimprovements to major crops and livestock and the adoption of improvedfarming techniques (including irrigation, fertiliser use, herbicides designed tokill weeds without harming the crops, and mechanised cultivation andharvesting methods).
The combination of these techniques with cultivars of higher yieldpotential is estimated to be responsible for more than half of the gains infarm yield (Oram 1995). In densely populated countries, however, there islittle scope for further expansion of agricultural area. A study on the upperlimits of the natural resource base for food production shows that the Asianregion has the least leeway in the world for increasing food productionwithout new technologies (Penning de Vries et al. 1995).
Food security in developing countries 79
Table 5.3 Comparison of results of global cereals projections to 2010 (million tons, rice milled)
Sub-Saharan Latin America South East Rest ofAfrica and Caribbean Asia Asia the world
ProductionActual 1989/91 54.7 97.0 202.8 431.4 940.6Projected to 2010
Alexandratos 110.0 159.0 292.0 638.0 1,135.0Agcaoili and Rosegrant 86.0 152.0 297.0 579.0 1,291.0Mitchell and Ingco 83.0 144.0 282.0 626.0 1,176.0
Total useActual 1989/91 64.7 111.4 203.3 459.1 891.3Projected to 2010
Alexandratos 129.0 185.0 302.0 673.0 1,045.0Agcaoili and Rosegrant 118.0 165.0 307.0 616.0 1,200.0Mitchell and Ingco 96.0 172.0 312.0 691.0 1,037.0
Net tradeActual 1989/91 �8.5 �11.3 �3.2 �27.4 54.1
Alexandratos �19.0 �26.0 �10.0 �35.0 90.0Agcaoili and Rosegrant �32.0 �13.0 �10.0 �37.0 94.0Mitchell and Ingco �14.0 �28.0 �31.0 �59.0 132.0
Source: Islam 1995.

After three decades of fairly steady growth in agricultural productivity,growth rates of food production have begun to lag. Warning signs includedeclining growth of arable and irrigated areas; increasing competition forresources between agriculture and other sectors; declining use of inputs suchas fertiliser and pesticides due to environmental and health concerns; fallingworld food prices which discourage investment in agriculture, and neglect ofagricultural research at national levels. For instance, rice yields in Indonesiahave dropped from 5.2 per cent in the 1971–83 period, to 3.1 per cent in1984–90, to less than 3 per cent today. In China, rice yield growth rates haveslowed from more than 4 per cent a year in the late 1970s to about 1.6 percent a year during the 1980s (Pinstrup-Anderson 1994).
These trends indicate that it would be imprudent to assume that yieldswill rise as in the past, unless actions are taken to raise research investmentlevels and improve the application of technology to natural resourcemanagement and to genetic improvements in key crops such as rice. Theability to maintain a stream of technical innovations will be a major deter-minant of food supply growth (Pardey et al. 1996).
Despite the overall success in food production at the global level and inevery region except Africa, access to food and the lack of essential nutrientsremain serious problems. In the world’s poorest regions and countries, one-third of deaths among children are due to malnutrition (Del Rosso 1992).About one-half the deaths of children worldwide are associated withmalnutrition, some six million deaths each year (WHO 1997). The totalnumber of undernourished in developing countries is around 790 million(FAO 1999). An additional 34 million are in industrial and transition
80 Randy Stringer
Table 5.4 Relationship between arable land per person and calories/per capita/day
Arable land per person (ha)
Calories/capita/day 0.1 ha Between More than(95/97 average) or less 0.1 and 0.3 ha 0.3 ha
Less than 2,200 Korea DPR Zimbabwe ChadBangledesh Laos ZambiaLiberia Kenya AfghanistanTanzania Congo DR Mongolia
Nigeria Cameroon
2,200–2,800 Sri Lanka Senegal CubaPhilippines Pakistan TogoVietnam India SudanColombia Honduras Brazil
Greater than 2,800 China Myanmar ArgentinaMalaysia Mexico UruguayIndonesiaMauritius
Source: Author’s calculations based on FAO data.

countries. The majority of undernourished live in Asia, accounting foralmost two-thirds (526 million). India has more undernourished than all ofsub-Saharan Africa. Nevertheless, undernutrition is especially severe in mostof Africa. Of the 340 million people living in 26 African countries, 44 percent are chronically undernourished. Only six other countries in the worldhave such high rates (Afghanistan, Bangladesh, Haiti, Korea DPR,Mongolia, and Yemen).
The vast majority are chronically malnourished because they either donot produce enough food or cannot afford to buy enough food. Table 5.5provides data on the proportion of population undernourished for selectedcountries by region. The countries are ranked by percentage improvement inundernutrition between 1979/81 and 1995/97. The data indicates that in sub-Saharan Africa, undernutrition is less concentrated than in the Asian andLatin American and Caribbean regions. In Africa, two countries (Congo DRand Mozambique) account for 25 per cent of the undernourished popul-ation. In Asia, China and India account for 70 per cent and in LatinAmerica, Brazil, Haiti, Mexico, and Peru account for 60 per cent.
Attempts to find factors contributing to success in increasing foodsecurity rarely reveal a set of common traits. No two countries are alike. Oneof the most common characteristics explaining success in decreasing theproportion of the population undernourished and in raising per capita foodsupplies is strong economic growth rates. Table 5.6 presents a series ofvariables for ten of the most successful countries, illustrating GDP growthrates greater than 4 per cent for all of these countries except Ecuador andNigeria. Even in those two countries, GDP growth outpaced populationgrowth. In contrast, most countries with significant increases in theproportion of undernourished had negative or very low GDP growth rates(Table 5.7). Bostwana and Uganda are notable exceptions. Table 5.8 providesfood security related data for ten of the world’s most populated developingcountries, showing important gains in all countries (except Mexico) duringthe 1980s, with further gains in all countries except Bangladesh, Mexico andthe Philippines during the 1990s.
The chronic malnutrition in these countries is inextricably linked to poverty.Poverty begets hunger, predictably and monotonously. The malnourishedhave little or no access to land, jobs, income or social support from theirfamily, community or society. Food-insecure households include small andmarginal farm families, landless agricultural workers, fishing villagers andforest dwellers. In many of these rural households, malnutrition is theprimary cause of death among children. Evidence from South Asia furthersuggests that rural females, especially girls under 5 years old, are dispropor-tionately vulnerable to food insecurity and nutritional risks withinhouseholds (Bardhan 1982; Dasgupta 1987; Muhavi and Preston 1991). Inmany African countries, a large proportion of the food-insecure are warvictims (Christiaensen 1994).
Food security in developing countries 81

82 Randy Stringer
Table 5.5 Undernourished population by region and country
Percentage Percentage NumbersPopulation of improvement of under-1997 population in under- nourished(000’s) undernourished nourished (000’s)
1979/81 to 1979–81 1990–92 1995–97 1995/97 1997
Sub-Saharan Africa
Madagascar 14,620 18 34 39 �117 5,701.8Côte d’voire 14,064 7 14 15 �114 2,109.6Central Africa
Rep. 3,420 22 45 42 �91 1,436.4Liberia 2,402 22 49 42 �91 1,008.8Tanzania 31,417 23 30 40 �74 12,566.8Burundi 6,362 38 44 63 �66 4,008.1Kenya 28,446 25 47 41 �64 11,662.9Cameroon 13,924 20 30 32 �60 4,455.7Rwanda 5,962 24 40 37 �54 2,205.9Zambia 8,585 30 39 45 �50 3,863.3Congo DR 47,987 37 36 55 �49 26,392.9Angola 11,715 29 50 43 �48 5,037.5Malawi 10,067 26 45 37 �42 3,724.8Somalia 8,821 55 70 73 �33 6,439.3Zimbabwe 11,215 30 40 39 �30 4,373.9Niger 9,764 32 41 39 �22 3,808.0Namibia 1,622 25 26 30 �20 486.6Congo Rep. 2,709 29 32 34 �17 921.1Mozambique 18,443 54 66 63 �17 11,619.1Lesotho 2,016 26 31 28 �8 564.5Sierra Leone 4,420 40 44 43 �8 1,900.6Guinea 7,325 30 37 31 �3 2,270.8Swaziland 925 14 9 14 0 129.5Uganda 20,000 31 23 28 10 5,600.0Senegal 8,772 19 19 17 11 1,491.2Botswana 1,541 28 19 25 11 385.3Sudan 27,718 24 31 20 17 5,543.6Togo 4,284 31 29 23 26 985.3Chad 7,086 69 58 46 33 3,259.6Gabon 1,137 13 11 8 38 91.0Mauritius 1,133 10 6 6 40 68.0Mali 10,436 59 30 29 51 3,026.4Burkina Faso 11,001 64 32 30 53 3,300.3Gambia 1,189 57 17 25 56 297.3Benin 5,629 36 21 15 58 844.4Mauritania 2,461 35 15 13 63 319.9Nigeria 103,898 40 13 8 80 8,311.8Ghana 18,656 61 29 11 82 2,052.2

Food security in developing countries 83
Table 5.5 (continued)
Percentage Percentage NumbersPopulation of improvement of under-1997 population in under- nourished(000’s) undernourished nourished (000’s)
1979/81 to 1979–81 1990–92 1995–97 1995/97 1997
Asia
Korea DPR 22,981 19 16 48 �153 11,030.9Mongolia 2,537 27 34 48 �78 1,217.8Sri Lanka 18,274 22 29 25 �14 4,568.5Laos 5,032 32 31 33 �3 1,660.6Bangladesh 122,650 42 34 37 12 45,380.5Thailand 59,736 28 27 24 14 14,336.6Philippines 71,430 27 21 22 19 15,714.6Papua New
Guinea 4,499 31 27 24 23 1,079.8Pakistan 144,047 31 20 19 39 27,368.9India 966,192 38 26 22 42 212,562.2Vietnam 76,387 33 28 19 42 14,513.5Cambodia 10,478 62 41 33 47 3,457.7Malaysia 20,983 4 3 2 50 419.7Nepal 22,316 46 21 21 54 4,686.4China 1,244,202 30 17 13 57 161,746.3Myanmar 43,936 19 9 7 63 3,075.5Indonesia 203,380 26 10 6 77 12,202.8
Latin America and Caribbean
Cuba 11,068 3 3 19 �533 2,102.9Venezuela 22,77 4 11 15 �275 3,416.6Jamaica 2,516 8 12 11 �38 276.8Uruguay 3,265 3 7 4 �33 130.6Haiti 7,810 47 63 61 �30 4,770.2Mexico 94,281 5 5 6 �20 5,656.9Nicaragua 4,679 26 29 31 �19 1,450.5Dominican Rep. 8,097 25 28 26 �4 2,105.2Guatemala 10,519 17 14 17 0 1,788.2Paraguay 5,088 13 18 13 0 661.4Bolivia 7,774 26 25 23 12 1,788.0Costa Rica 3,748 8 6 7 13 262.4Panama 2,722 22 18 17 23 462.7Chile 14,625 7 8 5 29 731.1Peru 24,367 28 40 19 32 4,629.7Honduras 5,981 31 23 21 32 1,256.0Brazil 163,700 15 13 10 33 16,370.0El Salvador 5,911 17 12 10 41 591.1Colombia 40,043 22 17 12 45 4,805.2Ecuador 11,937 12 8 5 58 596.9
Source: FAO 1999.

Tab
le 5
.6F
ood
secu
rity
rel
ated
dat
a in
ten
of
the
mos
t im
prov
ed c
ount
ries
Cal
orie
sP
erce
ntag
e of
Pop
ulat
ion
Ara
ble
Ave
rage
Per
cent
age
Per
cent
age
per
capi
tapo
pula
tion
(000
s)la
nd p
eran
nual
GD
Pim
prov
emen
tim
prov
emen
t in
per
day
unde
rnou
rish
edpe
rson
grow
thin
dai
lypr
opor
tion
of
(ha)
avai
labi
lity
popu
lati
onof
calo
ries
unde
rnou
rish
ed
1995
/97
1995
/97
1997
1997
1980
–90
1990
–97
1979
/81
to19
89/9
1 to
1979
/81
to19
89/9
1 to
1989
/91
1995
/97
1989
/91
1995
/97
Gha
na2,
617
1118
,656
0.15
3.0
4.2
1926
5262
Per
u2,
363
1924
,367
0.15
�0.
36.
2�
516
�43
53U
rugu
ay2,
796
43,
265
0.39
0.4
4.0
�11
10�
133
43In
done
sia
2,90
06
203,
380
0.09
6.1
7.5
2011
6240
Nig
eria
2,75
08
103,
898
0.27
1.6
2.8
2114
6838
Ecu
ador
2,66
05
11,9
370.
132.
03.
16
633
38C
hile
2,77
45
14,6
250.
144.
28.
3�
59
�14
38Su
dan
2,37
920
27,7
180.
600.
47.
7�
410
�29
35M
alay
sia
2,93
82
20,9
830.
095.
38.
61
725
33V
ietn
am2,
471
1976
,387
0.07
4.6
8.6
512
1532
Sou
rce:
Aut
hor’s
cal
cula
tion
s ba
sed
on F
AO
STA
T 1
999,
Rom
e:FA
O a
nd W
orld
Ban
k D
evel
opm
ent
Indi
cato
rs 1
999.

Tab
le 5
.7F
ood
secu
rity
rel
ated
dat
a in
tw
elve
of
the
leas
t im
prov
ed c
ount
ries
Cal
orie
sP
erce
ntag
e of
Pop
ulat
ion
Ara
ble
Ave
rage
Per
cent
age
Per
cent
age
per
capi
tapo
pula
tion
(000
s)la
nd p
eran
nual
GD
Pim
prov
emen
tim
prov
emen
t in
per
day
unde
rnou
rish
edpe
rson
grow
thin
dai
lypr
opor
tion
of
(ha)
avai
labi
lity
popu
lati
onof
calo
ries
unde
rnou
rish
ed
1995
/97
1995
/97
1997
1997
1980
–90
1990
–97
1979
/81
to19
89/9
1 to
1979
/81
to19
89/9
1 to
1989
/91
1995
/97
1989
/91
1995
/97
Cub
a2,
417
1911
,068
0.33
––
5�
220
�53
3K
orea
DP
R1,
980
4822
,981
0.07
––
521
1620
0C
ongo
DR
1,82
355
47,9
870.
141.
6�
6.0
2�
133
�53
Gam
bia
2,30
424
1,18
90.
163.
62.
235
�6
70�
47B
urun
di1,
687
636,
362
0.12
4.4
�3.
6�
6�
12�
16�
43M
ongo
lia1,
920
482,
537
0.52
5.4
�0.
62
�13
�26
�41
Ven
ezue
la2,
388
1522
,777
0.12
1.1
2.2
�13
0�
175
�36
Tan
zani
a2,
000
4031
,417
0.10
–2.
7�
3�
10�
30�
33B
otsw
ana
2,22
825
1,54
10.
2210
.34.
59
�4
32�
32U
gand
a2,
168
2820
.000
0.25
2.9
7.4
8�
626
�22
Gua
tem
ala
2,33
617
10,5
190.
130.
84.
16
�3
18�
21M
exic
o3,
108
694
,281
0.27
0.7
2.2
�1
10
�20
Sou
rce:
Aut
hor’s
cal
cula
tion
s ba
sed
on F
AO
STA
T 1
999,
Rom
e:FA
O a
nd W
orld
Ban
k D
evel
opm
ent
Indi
cato
rs 1
999.

Tab
le 5
.8F
ood
secu
rity
rel
ated
dat
a in
ten
of
the
mos
t po
pula
ted
coun
trie
s
Cal
orie
sP
erce
ntag
e of
Pop
ulat
ion
Ara
ble
Ave
rage
Per
cent
age
Per
cent
age
per
capi
tapo
pula
tion
(000
s)la
nd p
eran
nual
GD
Pim
prov
emen
tim
prov
emen
t in
per
day
unde
rnou
rish
edpe
rson
grow
thin
dai
lypr
opor
tion
of
(ha)
avai
labi
lity
popu
lati
onof
calo
ries
unde
rnou
rish
ed
1995
/97
1995
/97
1997
1997
1980
–90
1990
–97
1979
/81
to19
89/9
1 to
1979
/81
to19
89/9
1 to
1989
/91
1995
/97
1989
/91
1995
/97
Chi
na2,
834
131,
244,
202
0.10
10.2
11.6
157
4324
Indi
a2,
466
2296
6,19
20.
175.
86.
012
632
15In
done
sia
2,90
06
203,
380
0.09
6.1
7.5
2011
6240
Bra
zil
2,93
310
163,
700
0.33
2.7
3.4
46
1323
Pak
ista
n2,
461
1914
4,04
70.
156.
34.
211
335
5B
angl
ades
h2,
082
3712
2,65
00.
064.
34.
78
119
�9
Nig
eria
2,75
08
103,
898
0.27
1.6
2.8
2114
6838
Mex
ico
3,10
86
94,2
810.
270.
72.
2�
11
0�
20V
ietn
am2,
471
1976
,387
0.07
4.6
8.6
512
1532
Phi
lippi
nes
2,36
322
71,4
300.
071.
03.
37
�1
22�
5
Sou
rce:
Aut
hor’s
cal
cula
tion
s ba
sed
on F
AO
STA
T 1
999,
Rom
e:FA
O a
nd W
orld
Ban
k D
evel
opm
ent
Indi
cato
rs 1
999.

Food security, poverty and agricultural growth
The vast majority of the poor live in rural areas (Lipton and Ravallion 1995;World Bank 1990; Bidani and Ravallion 1993; Datt 1994; and World Bank1992a). In East Asia, nearly 90 per cent of the poor live in rural areas(Johansen 1993). In Mexico, Central America and the Andean countries ofSouth America, more than 60 per cent of the poor live in rural areas undermuch worse conditions than those in urban areas (Valdés and López 1999).Ironically, hunger is concentrated in regions where the majority of thepopulation produce food, but where available food supplies are among thelowest in the world. A comparative study of seven Asian countries docu-ments how much more the rural poor depend on agriculture for jobs, incomeand food relative to the rural non-poor (Quibria and Srinivasan 1991).
A general consensus emerged during the 1990s that policymakers tendedto ignore or underestimate the poverty reduction potential of their agricul-tural sectors. The evidence suggests that periods of high agricultural growthrates are associated with falling rural poverty and increasing food security(Binswanger and von Braun 1991; Timmer 1992; Bell and Rich 1994;Johnson 1993). Strong agricultural growth leads to: (1) lower food prices (forurban consumers and rural net-food buyers); (2) increased income-generating opportunities for food producers and jobs for rural workers (thusreducing rural–urban migration, with positive consequences for real urbanwage rates); and (3) positive intersectoral spillover effects including migra-tion, trade and enhanced productivity (Lipton and Ravallion 1995; Timmer1992). For example, in both China and Indonesia, rapid agricultural growthsubstantially reduced rural poverty, improved food security in both rural andurban sectors, and provided a significant demand-side stimulus for non-agricultural goods and services.
Improving access to food and nutrition increases learning capacity andschool performance and leads to longer school attendance, fewer school andwork days lost to sickness, and also leads to higher earnings, longer worklives and a more productive work force. These are essential to economicgrowth. And economic growth is essential for increasing incomes, reducingpoverty and improving food security. The manner in which developmentstrategies achieve growth, however, and the number of people who particip-ate in and benefit from it are as important as the growth itself.
Economic growth is fundamental to achieving a sustainable balancebetween food production and food needs. In the past fifty years of develop-ment, some of the most impressive improvements in food security have beengained by those countries managing their economies to achieve broad-basedeconomic benefits (Binswanger and Deininger 1997; Stamoulis 1995). Themanner in which governments control economic policies determines whetheror not households prosper, poverty declines and food security increases. Theincentives provided by government policies are among the most powerfulmeasures national governments can use to influence how economic, social,institutional and natural resources are managed.
Food security in developing countries 87

National governments can use policies to affect agricultural sector per-formance through their impact on growth, equity, stability and sustainability;to affect poverty by influencing incomes, prices, trade and institutionalstructures; and to affect food security by modifying food prices, ruralemployment, allocation of productive resources, wages and incomes amongboth agricultural and non-farm rural producers.
By ignoring the poverty reduction potential of their agricultural sectors,policymakers allow macropolicies to inhibit rural sector growth throughdirect and indirect taxation of food producers, traders and exporters(Krueger et al. 1991; Bautista and Valdés 1993). In contrast, a non-discriminatory policy environment for agriculture and unskilled labour ismore likely to promote a sustainable growth pattern that is essential forimproving food security.
Agricultural sectors are growing relatively slowly, a trend of decliningagricultural comparative advantage in the process of industrialisationexperienced by structural changes in developing countries worldwide. Theshare of agricultural output in total production in developing countries as agroup has declined from 26 per cent in the early 1960s to 13 per cent in 1997.For the same period, agriculture’s share of GDP fell from 40 to 18 per centin East Asia; 43 per cent to 25 per cent in South Asia, 17 per cent to 8 percent for Latin America and the Caribbean and 28 per cent to 18 per cent forsub-Saharan Africa.
Within the existing production possibilities, many developing countriesare exploring the scope for increasing agricultural output at relatively lowcost through agricultural policy reforms. This is highlighted by theexperience of China’s institutional and market reforms (Findlay 1996).Significant potential grain output increases appear to be possible by closingthe gap between current actual farm performance and best practice (Huangand Kalirajan 1996; Lin and Shen 1994).
Structural characteristics of the world’s population are also changing inways that affect food security. United Nations projections suggest that worldpopulation will increase by about 3.5 billion by 2020 to reach a total of 7.5billion (United Nations 1999). While the population growth rate will fall, thegreatest absolute number of the additional people will live in Asia, wherepopulation will increase by more than 1.5 billion by 2020. China’s popul-ation will expand to around 1.5 billion people, and India to more than 1.3billion. In addition, between 1995 and 2020, developing country urbanpopulations are expected to double, increasing from 1.7 billion to 3.4 billion(United Nations 1998).
Thirty years ago, 80 per cent of the population in developing countrieslived in rural areas. In the early 1970s, only one city in sub-Saharan Africahad more than half a million inhabitants; by 1990, 10 per cent of the region’spopulation lived in cities of more than one million people, and by 2000,nearly 40 per cent of the population live in urban areas. In the next thirtyyears, the number of people living in cities in developing countries will
88 Randy Stringer

quadruple from one billion to four billion individuals. This imposing shifttowards a more urban world calls for a different set of institutions, markets,infrastructure and food policies. These structural changes also modify farmlabour supplies and pose important challenges for food security.
This demographic transformation profoundly affects food consumption.As countries urbanise, consumer diets and behaviours change dramatically.Urban dwellers consume less grain and more meat, dairy products and fishthan their rural counterparts, even after accounting for differences in incomeand prices (Huang and Bouis 1996). Direct per capita consumption of cerealas food has declined over the past three decades in the rapidly growingeconomies. In those countries with continued economic growth, changingfood demand structure will be reflected in reduced direct demand for foodgrains but increased indirect demand for feed grains.
Delgado et al. (1999) outline seven livestock-related implications of risingincomes, increased urbanisation and population growth in developingcountries:
1 rapid worldwide increases in consumption and production of livestockproducts;
2 increasing share of developing countries in total livestock productionand consumption;
3 an ongoing change in the status of livestock production from small-scalelocal activities to global activities;
4 increased substitution of meat and dairy products for grains in diets;5 rapid rise in the use of cereal-based feeds;6 greater emphasis on grazing resources and more intensive production
closer to cities; and7 the emergence of rapid technological change in livestock production and
processing in industrial systems.
Food security and sustainable development
Within several years of publication of the Brundtland Report in 1987 (WCED1987), sustainable development had become a dominant feature of develop-ment thinking. By the time delegates met in 1992 for the United NationsConference on Environment and Development (UNCED), the internationalcommunity’s guiding principles on sustainable development implied thatagriculture should widen its focus from expanding production and increasingyields to include sustainable management of ecological processes, environ-mental services and social goods.
Despite a message of harmony, however, the concept of agricultural sus-tainability raises tension between market-driven economic growth strategies,social pressures for a more equitable distribution of economic opportunitiesand the need to maintain environmental productivity, ecological services andbiodiversity to fulfil future economic and social aspirations. Often, this
Food security in developing countries 89

tension is expressed in emotional debates over how food security and agri-cultural activities conflict with environmental objectives in both developedand developing countries and whether poverty in the developing countries orhigh consumption levels in the industrial countries contribute more toenvironmental degradation (Mink 1993).
International Conventions on biodiversity, forestry and climate change,however important, may have negative implications for the world’s foodsupply, at least in the short term. For example, the climate change Conven-tion raises the possibility of establishing carbon taxes and would result inhigher energy costs, new input mixes and changing technologies. Thecombination would imply higher production costs for food producers andhigher prices for consumers. Furthermore, since transformation of forestland into agricultural land accounts for the majority of deforestation overthe past ten years, international agreements that constrain forest conversionwill alter future food production possibilities.
Increasing resource scarcity and environmental degradation also affectfood security. UNCED represents an important expression of the inter-national community’s recognition of these matters. In many parts of thedeveloping world, expanding populations and shortages of fertile land,water and forests are already contributing to expelling farmers from agri-culture and creating thereby a class of ‘environmental refugees’ (Homer-Dixon et al. 1993)
Contemporary development also includes concepts of inter-generationalequity and justice. For the first time in human history, the world communityis collectively attempting to understand how today’s actions may affect theplanet’s ecosystems one hundred years into the new millennium. Incorpor-ating this broad range of values into sustainable food production isappealing and necessary, but difficult in practice. The question frequentlyposed is: how can resources be used today to greatly enhance food securitybut in such a way that their capacity to generate production for futuregenerations at the same level is not diminished?
Population pressure, institutional constraints (e.g. property rights andconcentrated ownership), market failures and government policies are allblamed for inducing food production patterns and practices that result insoil, water and wind erosion, nutrient mining, waterlogging, salinisation,forest destruction, sedimentation and marine pollution. Resource degrad-ation contributes to rural poverty, urban migration and erratic foodproduction. This deterioration in the production potential of naturalresources is a major concern for future food security (Anderson 1992;Rosegrant and Ringler 1997; Stringer 1997).
Agricultural and food production practices misuse and degrade land, soiland water resources in a variety of ways. Clearing steep forested hillsidescauses water and wind erosion; applying pesticides and chemical fertilisersadds toxic materials; burning vegetation cover destroys organic layers; andextensive use of farm machinery and livestock grazing compact soils. An
90 Randy Stringer
estimated 15 per cent of the world’s soils (1,965 million ha) are considered tobe moderately to extremely degraded: 1,094 million ha due to water erosion,548 million ha due to wind erosion, and the remainder due to a combinationof salinisation, nutrient decline and physical compaction (UNEP 1991). InAsia, an estimated 453 million ha are considered to be moderately toextremely degraded: 315 million ha due to water erosion, 90 million ha dueto wind erosion, 41 million ha due to chemical degradation and 6 million hadue to physical degradation.
Standardised surveys conducted by the Global Assessment of Human-induced Soil Degradation document considerable damage to 1.96 billion haor 15 per cent of the world’s soils (UNEP 1991). Water erosion accounts for55 per cent of the damage followed by wind erosion (28 per cent), nutrientdecline (7 per cent), salinisation (4 per cent), and physical compaction (3 percent).
Soils suffering from severe to extreme degradation means that theiroriginal biotic functions are damaged and reclamation is at worst impossibleand at least difficult or costly. Yield reduction in food crops due to thesevarious forms of soil erosion can be significant. In Africa, yield reductioncaused by past erosion is estimated at 9 per cent (FAO 1996c).
This process of resource degradation contributes to rural poverty, urbanmigration and erratic food production. As previously noted, the majority ofthe rural poor live and work in ecologically fragile, economically marginaland environmentally degraded areas. Protecting environmentally vulnerableareas and making them more productive requires long-term investments.Poor and subsistence producers in fragile areas lack the capital necessary toinvest in natural resource protection; they tend to have high rates of timepreference; and, normally, are unable even to avoid the impacts of environ-mental degradation on their existing production base. This deterioration inthe production potential of natural resources is a major concern for Asia’sfuture food security.
Poverty often induces food producers to degrade natural resources andenvironmental services even though they depend heavily on a sustainedresource base for survival. At the same time, government programmes andpolicies aimed at alleviating poverty often contribute to environmentaldegradation by directly encouraging or unintentionally subsidising environ-mental degradation (Bromley et al. 1980; Barnes and Olivares 1988; Dasguptaand Maler 1990; Leach and Mearns 1991; Vosti et al. 1992; Mink 1993).
For example, clearing of forested hillsides by poor and landless families isone of the major causes of deforestation and watershed degradation, yetgovernment policies exacerbate the problem, producing intense and lastingimpacts on forest resources. Numerous studies document how taxation policy,terms of forest concessions, administered prices, controlled transportation offorest goods, land and tree tenure insecurity, tariff and non-tariff barriers tointernational trade, investment incentives, agricultural sector strategies andmacroeconomic policies have affected negatively the economic motivations,
Food security in developing countries 91
management and conservation of forests (Contreras-Hermosilla 1993;Barbier et al. 1993; Panayotu 1993; Repetto 1986; World Bank 1992b).6 Thefundamental problem for policymakers remains how to address the under-lying causes, including poverty, hunger, access to land, and the lack of jobsand income-generating opportunities.
Resource degradation presents a direct threat to food security. For poorrural communities at the margin of subsistence, resource degradation meansgreater food production instability as the frequency of poor harvestsincreases. In most developing countries, population pressure and povertyappear to be linked to much of the land and water degradation, overgrazing,deforestation and fuelwood scarcity; evidence suggests that much of theresponsibility lies with inappropriate government policies (Panayotou 1993;Pearce and Warford 1993).
Price subsidies (e.g. fertiliser, pesticides, credit and water) encourageexcessive use of inputs by farmers; poorly defined or enforced propertyrights and restrictions on the length of land leases encourage excessiveintensity of cultivation. Correcting these distortions through policy reformalleviate these pressures on the food-producing resource base. A recent studyof long-term trends in the quality of soil in China and Indonesia isheartening, for it finds no evidence of net deterioration during the past half-century or more (Linhert 1996, 1999). Evidently in those cases at least,farmers have been investing enough back into the soil over that period to atleast offset the gross damage done by poor farming practices or policies.
In recent years, increasing international concern has focused on waterdegradation and food security linkages.7 The principal concern is thatgrowing water scarcity and misuse of freshwater pose serious threats to long-term food security and sustainable development. Competition amongagriculture, industry and cities for limited water supplies is alreadyconstraining development efforts in many countries (Gleick 1998; Bhatia andFalkenmark 1992; Homer-Dixon et al. 1993; UNCED 1992). As populationsexpand and economies grow, the competition for limited supplies willintensify; so will conflicts among water users.
Throughout the world, food depends increasingly on irrigation, so foodsecurity is closely linked with water security. Some 40 per cent of the world’sfood comes from the irrigated 17 per cent of the total cultivated land;around one-fifth the total value of fish production comes from freshwateraquaculture; and current global livestock drinking water requirements are 60billion litres per day (forecasts estimate an increase of 0.4 billion litres peryear). The majority of the incremental production comes from irrigation asfarmers struggle to maintain crop yield growth to keep production in linewith population and incomes.
Irrigation’s contribution to food security in China, Pakistan, Egypt,Morocco and India is widely recognised (Stringer et al. 1993). In India, 55per cent of agricultural output is from irrigated land. Moreover, averagefarm incomes increased from 80 to 100 per cent as a result of irrigation,
92 Randy Stringer

while yields doubled over prior rainfed conditions and incremental labourdays used per ha increased from 50 to 100 per cent. In Mexico, one-half thevalue of agriculture production and two-thirds the value of agriculturalexports is from the one-third of the arable land that is irrigated.
Irrigation provides opportunities to increase and stabilise incomes andfood production, while gains in productivity lower food prices and raise farmearnings. Irrigation offers more reliability, higher yields and a more diversi-fied choice of cropping patterns; it also makes other yield-increasinginnovations more attractive for investment and provides opportunities forgrowing high-value crops.
Even though water shortages are occurring throughout the world, misuseis widespread. Numerous studies document how small communities andlarge cities, farmers and industries, developing countries and industrialeconomies are all mismanaging water resources (Repetto 1986; World Bank1992b; Gleick 1998; Postel 1992). Surface water quality is deteriorating inkey basins from urban and industrial wastes. Groundwater is being pollutedfrom surface sources and irreversibly damaged by saltwater intrusion.Overexploited aquifers are losing their capacity to hold water and lands aresubsiding. Cities are unable to provide adequate drinking water supply andsanitation facilities. Waterlogging and salinisation are diminishing the produc-tivity of irrigated lands. Decreasing water flows are reducing hydroelectricpower generation, pollution assimilation and fish and wildlife habitat. Thevery ecosystems responsible for producing water and maintaining ourhydrological cycles and its many related services are insufficiently monitoredand poorly understood (Gleick 1993; Dasgupta and Maler 1990).
In the mid-1980s, Repetto estimated that average subsidies to irrigation insix Asian countries covered 90 per cent of the total operating and main-tenance costs (Repetto 1986). Case studies indicate that irrigation fees are onthe average less than 8 per cent of the benefits derived from irrigation. Despitethese huge investments and growing subsidies, irrigation performance indic-ators are falling short of expectations for yield increases, area irrigated andtechnical efficiency in water use. As much as 60 per cent of the waterdiverted or pumped for irrigation is wasted (Stringer et al. 1993). Althoughsome losses are inevitable, in too many cases this excess water seeps backinto the ground, causing waterlogging and salinity. As much as one-quarterof all irrigated land in developing countries may suffer from varying degreesof salinisation (FAO 1993). Moreover, stagnant water and poor irrigationdrainage significantly escalate the incidence of water-related diseases, result-ing in human suffering and increased health costs.
The dilemma facing policymakers is that irrigated agriculture is expectedto produce much more in the future while using less water than it uses today.At present, 2.4 billion people depend on irrigated agriculture for jobs, foodand income – some 55 per cent of all wheat and rice output is irrigated. Overthe next thirty years, an estimated 80 per cent of the additional food suppliesrequired to feed the world will depend on irrigation (IIMI 1992).
Food security in developing countries 93

Improving resource management requires recognising how agriculturalland, water and forest resources are linked to the national economy. Equallyimportant is understanding how alternative economic policy instrumentsinfluence resource use across different economic sectors; between local,regional and national levels; and among households, food producers andfirms.
Gender and food security
Policymakers have only recently begun to recognise that meeting worldfuture food needs depends more than ever on the capabilities and resourcesof women. Women produce more than half the food grown in developingcountries. Women farmers in sub-Saharan Africa produce more than three-quarters of the region’s basic food, manage some two-thirds of marketingand at least one-half of the activities required for storing food and raisinganimals (Gittinger 1990; Saito 1994). In addition, they are now cultivatingcrops and taking on tasks traditionally undertaken by men and are increas-ingly making decisions on the daily management of farms and households.Women account for more than two-thirds of food production in Asia andsome 45 per cent in Latin America and the Caribbean (FAO 2000). InSoutheast Asia, women provide up to 90 per cent of labour for rice cultiv-ation and much of the labour for food storage, handling and marketing, andthey predominate in small businesses that process food throughout thedeveloping world. They also are responsible for the feeding, nutrition andhealth of hundreds of millions of families.
With few exceptions, women must fulfil these multiple jobs with little orno access to productivity-enhancing resources and services such as credit,education, training, technical assistance, marketing networks and healthcare. A study on credit use in five African countries found that womenreceived less than 10 per cent of the credit awarded to male smallholders andonly 15 per cent of the world’s agricultural extension agents are women(FAO 2000). Women compose the poorest segment of rural populations andmake up more than 70 per cent of all people living in absolute poverty(World Bank 1990).
Women could more effectively improve food access, availability and stabilityif development policies recognised and responded to their needs and cap-abilities. This requires: ensuring equal access to and control of productiveresources; increased participation in decision-making and policy formulationat all levels; greater opportunities for income and employment; andreductions in time and other constraints on productivity. A World Bankstudy estimates that the rate of return on investments in women’s educationis of the order of 12 per cent in terms of increased productivity (Saito 1994).The study concludes that farm-specific yields would increase from 7 per centto 22 per cent. Increasing women’s primary schooling alone would increaseagricultural output by 24 per cent.
94 Randy Stringer

The recent expansion of women’s roles in food production and provisionmakes this issue even more pressing. Land scarcity, deterioration ofagricultural incomes, armed conflict and diseases reduce male labour inmany rural areas, increasing the number of de facto or de jure female-headedhouseholds. As a result, women are taking on new agricultural and income-earning responsibilities in addition to their traditional workload.
The assumption of these new roles bears many hidden costs for women,for their families and for the economy in general. For example, in sub-Saharan Africa, the steady migration of males to cities and other areas tolook for wages or a job in the informal sector places women at the focalpoint of responsibility for farm work. Raising agricultural productivity andoutput and improving household food security demands a greater emphasison women farmers, including policy reforms to improve women’s access toland and credit, their ability to contract labour, and their willingness toadopt technology and utilise technical assistance.
Most governments have signed various international agreements, treatiesand Conventions since the 1970s, pledging to pay greater attention to theneeds of women, particularly rural women, and to focus more efforts andresources on raising their productivity. Despite these commitments, however,the pace of change has been slow and many development efforts are still notreaching significant numbers of women as intended (Snyder et al. 1996). Theneglect of women and the resulting losses in potential productivity gains andin opportunities for economic growth are most obvious in the agriculturalsector, where women are taking on greater responsibility for food productionwithout a commensurate increase in agricultural inputs, resources andsupport services.
The reasons behind the failure to reorient development benefits towardswomen in agriculture are well documented (Snyder et al. 1996). Critics pointto the continued exclusion of women from the design, planning, appraisal,implementation, management, monitoring and evaluation of ruraldevelopment activities. They also cite inadequate research that continues toignore or underestimate women’s contributions to farm activities. Otherreasons for poor results range from lack of female leadership and appro-priate resources in recipient governments to gender biases inside donoragencies.
Summary
Throughout the developing world, the heightened role of food security ispressuring governments to modify sectoral policies to accommodate newdemands for safeguarding the opportunities of future generations by pro-tecting the earth’s natural systems. The food-insecure compose heterogeneousgroups, characterised by location, occupational patterns, asset ownership, race,ethnicity, age and gender. Programmes to improve food security need to betailored to the need and circumstances of each group.
Food security in developing countries 95

Successful development experiences suggest that significant, complement-ary improvements in food security, poverty reduction and sustainable develop-ment can be made when policymakers:
1 seek policy portfolios suited to broad-based growth and build in flexibil-ity to adjust this portfolio over time in response to new developments;
2 remove unfair market privileges, input subsidies and price incentiveswhich decrease competition in output, input and credit markets, raisecosts to consumers and taxpayers, and encourage overuse and misuse ofresources;
3 ensure that equity and gender play a central role in decisions aboutappropriate responses to food security and sustainability concerns;
4 focus public sector actions on those rural development services under-provided by the private sector; and
5 revitalise public and private investments in agricultural research toencourage new technologies for sustainable development.
Targeted interventions to accelerate the hunger reduction process arebecoming an important component in the growth-based food securitystrategy to deal with the wide range of shocks faced by households, includingloss of job, crop failures, seasonal food shortages, economic crisis orrecession, natural or human-caused disasters, etc. Two approaches to directinterventions are used: the growth-mediated security policy and the support-led security policy (Drèze and Sen 1989). In the first approach, as the benefitsof economic growth accumulate, they are targeted to low-income groupsthrough public work programmes, food subsidies and job training projects. Inthe second, investments in income transfer programmes, health care andeducation are initiated even before the proceeds from economic growth arecaptured. The data in Table 5.9, comparing the returns in lifelong wages fromalternative interventions, emphasise the importance of matching specific foodand nutrition policy variables to cost effectiveness programmes. Indeed, onlythe generalised food subsidy programme shows a loss, with every $1.00 spenton generalised food subsidies returning $0.90 in lifelong wages.
Development lessons suggest the best role for the public sector is toprovide a conducive policy environment and basic rural infrastructure,including roads, irrigation, safe drinking water, sanitation and electrificationto take full advantage of their direct effects on food security throughproductivity gains, lower transaction costs and employment creation; andtheir indirect effects on agricultural growth through the strengthening oflinkages between public and private investment.
Successful development records indicate these public investments andpolicy attention should concentrate on resource-poor, high-poverty ruralareas where food security depends on increasing production and resiliencethrough diversification of production systems and of economic activities.For example, growth strategies should promote diversified farming systemsand diversified economic activities.
96 Randy Stringer

In resource-poor rural areas, important food security activities for thepublic sector include: providing educational, technological and financialsupport to encourage mixed farming systems that mitigate environmentalconsequences by integrating livestock, tree crops, and annual crops; estab-lishing training programmes on soil fertility and organic matter management,moisture conservation, erosion control and nutrient recycling; encouragingdiversity in research and extension efforts to accommodate site-specificdifferences in resource-poor and fragile areas and involve farmers in theprocess; establishing secure property rights for both private and commonproperty resources including forests, pastures and watersheds; and providingnutrition-related extension services to increase food availability through homegardens, urban agriculture, food processing and preservation.
In high-potential agricultural areas with fertile soils and favourableclimates, environmentally friendly intensification and specialisation requirecompetitive markets, good management practices and timely information.Policy reforms alone can often lower costs and improve environmentalincentives for small-scale processors, transporters and traders. Other low-costmeasures include adjustments in extension programmes and informationsystems to incorporate environmental production approaches such asintegrated pest management, integrated plant nutrition systems and ruralenergy use. In specific cases, funds must be allocated to rehabilitate, conserveand monitor resource use.
As the supply of high-potential agricultural land dwindles in developingcountries, per capita food production gains rely increasingly on expandingoutput per unit of land. Over time, the extensive land margin shrinks and the
Food security in developing countries 97
Table 5.9 Returns to nutrition investments
Programme Returns to programme dollar in lifelongwages and decreased disability*
Food supplements 1.4Nutrition education 32.3Nutrition as part of primary health care 2.6Food subsidies 0.9School feeding 2.8Iron pills supplementation for pregnant women 24.7Iron fortification of flour 84.1Iodine supplementation for reproductive age women 13.8Iodised salt 28.0Vitamin A supplementation for all children under 5 50.0Vitamin A fortification of sugar 16.0
Source: McGuire 1996 cited on World Bank’s web page, www.worldbank.org/html/extdr/hnp/nutrition/tnan.htm.
*For each dollar spent on a programme, this much is returned in increased lifelong wages anddecreased disability discounted to the present.

costs of further expansion become too high relative to intensification. Tocompensate for this shrinking crop land base in both absolute terms andrelative to population size, countries are turning to land-saving technologiesto underpin their advances in food productivity growth. The development,use and appropriateness of land-saving technologies depend on a number offactors including: large amounts of private and public sector investments inhuman capital and physical infrastructure; a national and global system ofresearch in biological, physical and social sciences; institutions to developand extend new technologies; and well-developed local, domestic andinternational markets for both factor and product markets.
Notes
1 Among the recent international development agencies focusing on how globaltrends are influencing food security are the World Bank’s Conference onOvercoming Global Hunger (1993), the ongoing initiative by the InternationalFood Policy Research Institute, 2020 Vision for Food, Agriculture and theEnvironment (1995–6), the International Fund for Agricultural Developmentsponsored Conference on Hunger and Poverty (1995), and the United NationsFood and Agricultural Organisation’s World Food Summit (1996).
2 Food security is a necessary but not sufficient condition for nutritional security.Micronutrient deficiencies, infectious diseases, intestinal parasites, and environ-mental factors can contribute to malnutrition even for people with access toadequate food supplies.
3 Self-sufficiency in other food commodities in East Asia also increased: pulsesincreased from 106 to 109 per cent, and vegetable oils from 132 to 146 per cent,from the early 1970s to the early 1990s.
4 The study’s conclusion includes the importance of continued technical progressin agriculture; an excessive emphasis by existing studies on grains relative tomeat, livestock products and processed foods in East Asian economies(especially China); and the importance for agriculture to be part of any regionalfree trade agreement in APEC – excluding agriculture would reduce potentialglobal welfare gains by nearly half (Anderson et al. 1996).
5 See the Appendix to Part II in Islam (1995) for a comparison of these threemajor food supply, demand and trade studies. For a detailed analysis of eachstudy see Mitchell and Ingco (1993) for the World Bank; Alexandratos (1995) forFAO and Agcaoili and Rosegrant (1995) for IFPRI.
6 See FAO (1994) and Contreras-Hermosilla (1993) for Asian examples.7 For example, in January 1992, the UN System sponsored the International
Conference on Water and the Environment (ICWE) in Dublin. The ICWE calledfor innovative approaches to the assessment, development and management offreshwater resources. In addition, the ICWE provided policy guidance for theUN Conference on Environment and Development (UNCED) in Rio de Janeiroin June 1992. UNCED highlighted the need for water sector reforms throughoutthe world. In 1993, the World Bank issued a comprehensive policy paper definingits new objectives for the water sector. FAO recently established an InternationalAction Programme on Water and Sustainable Agricultural Development.Likewise, UNDP, WHO, UNICEF, WMO, UNESCO and UNEP and theregional development banks have developed water sector strategies papers. The
98 Randy Stringer
1990 Montreal meeting, NGOs Working Together, focused attention on drinkingwater supply and sanitation. The Canadian International Development Agency,the French Ministry of Cooperation, the German Agency of Technical Cooper-ation, the Overseas Development Administration (UK) and the US Agency forInternational Development have developed water resources strategies for foreignassistance.
References
Agcaoili, M. and M. Rosegrant (1995) ‘Global and regional food supply, demandand trade prospects to 2010’, in N. Islam (ed.) Population and Food in the EarlyTwenty-First Century: Meeting Future Food Demands of an Increasing Population,Washington, DC: IFPRI.
Alexandratos, N. (1995) World Agriculture Towards 2010, An FAO Study, New York:John Wiley and Sons.
Anderson, K. (1992) ‘Agricultural policies, land use and the environment’, the 14thDenman Lecture, Cambridge: Grant for the University of Cambridge (CIESReprint no. 16), University of Adelaide.
—— (1995) ‘Agricultural competitiveness after the Uruguay round’, Review ofMarketing and Agricultural Economics, vol. 63, no. 3, pp. 351–62.
—— (1997) ‘Agricultural policy reform under the Uruguay round: impact on Asian-Pacific developing countries’, Journal of the Asia Pacific Economy, vol. 2, no. 3,pp. 303–31.
Anderson, K., B. Dimaranan, T. Hertel and W. Martin (1996) ‘Asia-Pacific foodmarkets and trade in 2005: a global, economy-wide perspective’, AustralianJournal of Agricultural and Resource Economics, vol. 41, no. 1, pp. 19–41.
Badiane O., and C.L. Delgado (1995) A 2020 Vision for Food, Agriculture, and theEnvironment in Sub-Saharan Africa, Washington, DC: IFPRI.
Barbier, E., J. Burgess, J. Bishop, B. Aylward and C. Bann (1993) ‘The economiclinkages between the international trade in tropical timber and the sustainablemanagement of tropical forests’, Yokohama: International Timber Trade Organis-ation.
Bardhan, P.K. (1982) ‘Little girls and death in India’, Economic and Political Weekly,vol. 17, no. 36, pp. 1448–50.
Barnes, D.F. and J. Olivares (1988) ‘Sustainable resource management in agricultureand rural development projects: a review of bank policies, procedures and results’,Environment Department Working Paper no. 5, Washington, DC: World Bank.
Bautista, R. and A. Valdés (1993) The Bias against Agriculture: Trade and Macro-economic Policies in Developing Countries, San Francisco: ICS Press.
Bell, C. and R. Rich (1994) ‘Rural poverty and agricultural performance in post-independence India’, Oxford Bulletin of Economics and Statistics, vol. 56, no. 2,pp. 111–33.
Bhatia, R. and M. Falkenmark (1992) ‘Water resource policies and the urban poor:innovative approaches and policy imperatives’, background paper for theInternational Conference on Water and Development, Dublin, Ireland.
Bidani, B. and M. Ravallion (1993) ‘A new regional poverty profile for Indonesia’,Bulletin of Indonesian Economic Studies, vol. 29, no. 3, pp. 37–68.
Binswanger, H.P. and K. Deininger (1997) ‘Explaining agricultural and agrarian policiesin developing countries’, Journal of Economic Literature, vol. 35, no. 4, pp. 1956–2005.
Food security in developing countries 99

Binswanger, H.P and P. Landell-Mills (1995) ‘The World Bank’s strategy for reducingpoverty and hunger’, Environmentally Sustainable Development Studies andMonographs Series no. 4, Washington, DC: World Bank.
Binswanger, H.P and J. von Braun (1991) ‘Technological change and commercializationin agriculture: the effect on the poor’, World Bank Research Observer; vol. 6, no. 1,pp. 57–80.
Bromley, D., D. Taylor and D. Parker (1980) ‘Water reform and economic develop-ment: institutional aspects of water management in the developing countries’,Economic Development and Cultural Change, vol. 28, no. 2, pp. 365–87.
Christiaensen, L. (1994) Food Security: From Concept to Action, Brussels: BelgianAdministration for Development Cooperation.
Contreras-Hermosilla, Arnoldo. (1993) ‘Forestry policies in India’, Paper preparedfor the South Asia Region Seminar on Forestry Management and SustainableDevelopment, Kandy, Sri Lanka, 4–9 October 1993.
Dasgupta, P. (1987) ‘Selective discrimination against female children in rural Punjab,India’, Population and Development Review, vol. 13, no. 1, pp. 77–100.
Dasgupta, P. and I. Maler (1990) The Environment and Emerging Development Issues,Helsinki: World Institute for Development Economics Research.
Datt, G. (1994) Poverty in India, 1951–91, Poverty and Human Resources Division,Washington, DC: World Bank.
Del Rosso, J. (1992) Investing in Nutrition with World Bank Assistance, Washington,DC: World Bank.
Delgado, C., M. Rosegrant, H. Steinfeld, S. Ehui and C. Courbois (1999) ‘Livestockto 2020: the next food revolution’, 2020 Vision for Food, Agriculture, and theEnvironment Discussion Paper 28, Washington, DC: IFPRI.
Devereux, S. (1993) Theories of Famine, New York: Harvester Wheatsheaf.Drèze, J. and A. Sen. (1989) Hunger and Public Action, Oxford: Oxford University Press.—— (1990) The Political Economy of Hunger, vols 1–3, Oxford: Oxford University
Press.Evans, A. (1991) Gender Issues in Rural Household Economics, IDS Bulletin, vol. 22,
no. 1.FAO (Food and Agriculture Organization of the United Nations) (1990) An Inter-
national Action Programme on Water and Sustainable Agricultural Development,Rome: FAO.
—— (1994) Forest Development and Policy Dilemmas, Rome: FAO.—— (1996a) Food Security Situation and Issues in Asia and the Pacific, Twenty-third
FAO Regional Conference for Asia and the Pacific, Apia, Samoa, 14–18 May.—— (1996b) Food Agriculture and Food Security, The Global Dimension, WFS96/
Tech/1, Rome: FAO.—— (1996c) Food Production and Environmental Impact, World Food Summit
Technical Background Documents, No. 11, Rome: FAO.—— (1999) The State of Food Insecurity, Rome: FAO.—— (2000) http://www.fao.org/Gender/en/agrib4–e.htm .Findlay, C. (1996) ‘Grain output growth potential in China’, paper presented at the
International Workshop on Output Growth Potential, Market Development andInternationalisation in China's Grain Sector, 4–5 October, Beijing.
Gittinger, J. (1990) Household Food Security and the Role of Women, World BankDiscussion Paper No. 96, Washington, DC: World Bank
Gleick, P. (1993) Water in Crisis, New York: Oxford University Press.
100 Randy Stringer

—— (1998) The World’s Water 1998-99: The Biennial Report on Freshwater Resources,Washington, DC: Island Press.
Homer-Dixon, T., J.H. Boutwell and G.W. Rathjens (1993) ‘Environmental changeand violent conflict’, Scientific American, February.
Huang, J. and H. Bouis (1996) Structural Changes in the Demand for Food in Asia,Food, Agriculture, and the Environment Discussion Paper, no. 11, Washington,DC: IFPR.
Huang, Y. and K.P. Kalirajan (1996) ‘Potential of China’s grain production: evidencefrom the household data’, paper presented at the International Workshop onOutput Growth Potential, Market Development and Internationalisation inChina's Grain Sector, 4–5 October, Beijing.
IIMI (International Irrigation Management Institute) (1992) Developing Environ-mentally Sound and Lasting Improvements in Irrigation Management: The Role ofInternational Research, Colombo, Sri Lanka: IIMI.
Islam, N. (1995) Population and Food in the Early Twenty-First Century: MeetingFuture Food Demands of an Increasing Population, Washington, DC: IFPRI.
Johansen, F. (1993) Poverty Reduction in East Asia: The Silent Revolution, WorldBank Discussion Papers 202, Washington, DC: World Bank
Johnson, D.G. (1973) World Agriculture in Disarray, London: Macmillan Press Ltd.—— (1993) ‘The role of agriculture in economic development revisited’, Journal of
Agricultural Economics, vol. 8, pp. 421–34.—— (1998) ‘Food security and world trade prospects’, American Journal of
Agricultural Economics, vol. 80, no. 5, pp. 941–7.Kennedy, E. and H. Bouis (1992) Linkages Between Agriculture and Nutrition:
Implications for Policy and Research, Washington, DC: IFPRI.Kennedy, E. and P. Peters (1992) ‘Household food security and child nutrition: the
interaction of income and gender of household head’, World Development, vol.20, no. 8, pp. 1077–9.
Konandreas, P., B. Huddleston and V. Ramangkura (1978) Food Security: AnInsurance Approach, Research Report No. 4, Washington, DC: IFPRI.
Krueger, A.O., M. Schiff and A. Valdes (1991) ‘Agricultural incentives in developingcountries: measuring the effects of sectoral and economy wide policies’, WorldBank Economic Review, vol. 2, pp. 255–71.
Leach, M. and R. Mearns (1991) ‘Environmental change, development challenge’,IDS Bulletin, vol. 22, no. 4, p. 15.
Lin, J. and M. Shen (1994) ‘Rice production constraints in China: implicationfor biotechnology initiative’, paper presented to the International Workshop onRice Research Prioritisation in Asia, Los Banos: International Rice ResearchInstitute.
Linhert, P.H. (1996) ‘Soil degradation and agricultural change in China andIndonesia’, CIES Seminar Paper 96-14, Adelaide: CIES.
—— (1999) ‘The bad earth? China's soils and agricultural development since 1930s’,Economic Development and Cultural Change, vol. 47, no. 4, pp. 701-36.
Lipton, M. and M. Ravallion (1995) ‘Poverty and policy’, in J. Behrman and T.N.Srinivasan (eds) Handbook of Development Economics Vol IIIB, Amsterdam:Elsevier Science BV.
Maxwell, D. and K. Wiebe (1998) Land Tenure and Food Security: A Review ofConcepts, Evidence, and Methods, Land Tenure Center Research Paper no. 129,Madison: LTC.
Food security in developing countries 101

Maxwell, S. (1994) ‘Food security: a post-modern perspective’, Institute of Develop-ment Studies, Working Paper No. 9, University of Sussex.
Mink, S. (1993) Poverty, Population and the Environment, World Bank DiscussionPaper 189, Washington, DC: World Bank.
Mitchell, D.O. and M.D. Ingco (1993) The World Food Outlook, Washington, DC:World Bank.
Muhavi, D.K. and S.H. Preston (1991) ‘Effects of family composition on mortalitydifferentials by sex among children in Matlab Thana, Bangladesh’, Population andDevelopment Review, vol. 17, no. 3.
Oram, P. (1995) The Potential of Technology to Meet World Food Needs In 2020,Washington, DC: IFPRI.
Panayotou, T. (1993) Green Markets: The Economics of Sustainable Development, SanFrancisco: ICS Press.
Pardy, P.G., J.M. Alston, J.E. Christian and S. Fan (1996) Summary of a ProductivityPartnership: The Benefits from US Participation in the CGIR, Discussion Paper,Environment and Production Technology Division, Washington, DC: IFPRI
Payne, A. and M. Lipton (1994) How Third World Households Adapt to DietaryEnergy Stress: The Evidence and the Issues, IFPRI Food Policy Review,Washington, DC: IFPRI.
Pearce, D. and J. Warford (1993) World Without End, Economics, Environment andSustainable Development, New York: Oxford University Press.
Penning de Vries, F., H. Van Keulen, R. Rabbinge and J.C. Luyten (1995) BiophysicalLimits to Global Food Production, Washington, DC: IFPRI.
Pinstrup-Anderson, P. (1994) World Food Trends and Future Food Security, FoodPolicy Statement, no. 18, Washington, DC: IFPRI.
Pinstrup-Anderson, P., P.R. Pandya-Lorch, and M.W. Rosegrant (1997) The WorldFood Situation: Recent Developments, Emerging Issues, and Long-Term Prospects,Washington, DC: IFPRI.
Postel, S. (1992) Last Oasis: Facing Water Scarcity, New York: W.W. Norton &Company.
Quibria, M.G. and T.N. Srinivasan (1991) Rural Poverty in Asia: Priority Issues andPolicy Options, Manila: Asian Development Bank.
Ravallion, M. (1987) Markets and Famines, Oxford: Oxford University Press.—— (1997) ‘Famines and economics’, Journal of Economic Literature, vol. 35,
September, pp. 1205-42.Repetto, R. (1986) Skimming the Water: Rent-Seeking and the Performance of Public
Irrigation Systems, World Resources Institute Research Report no. 4, December.Reutlinger, S. (1977a) Food Insecurity: Magnitudes and Remedies, World Bank
Working Paper no. 267, Washington, DC: World Bank.—— (1977b) ‘Malnutrition: a poverty or a food problem?’, World Development, vol.
5, no. 8, pp. 715-24.—— (1985) ‘Food security and poverty in LDCs’, Finance and Development, vol. 22,
no. 4, Washington, DC: IMF.Rosegrant, M. and C. Ringler (1997) ‘Environmental and resource policies: implic-
ations for global food markets’, paper presented at the 41st Annual Conference ofthe Australian Agricultural and Resource Economics Society, 20–24 January,1997, Pan Pacific Hotel Gold Coast.
Sahn, D.E. (1989) ‘A conceptual framework for examining the seasonal aspects ofhousehold food security’, in D.E. Sahn (ed.) Seasonal Variability in Third World
102 Randy Stringer

Agriculture: The Consequences for Food Security, Baltimore: Johns HopkinsUniversity Press.
Saito, K.A. (1994) Raising the Productivity of Women Farmers in Sub-Saharan Africa,World Bank Discussion Paper, no. 230, Africa Technical Department Series,Washington, DC: World Bank.
Schuh, G.E. (1974) ‘The exchange rate and U.S. agriculture’, American Journal ofAgricultural Economics, vol. 56, no. 1.
Sen, A. (1981) Poverty and Famines: An Essay on Entitlement and Deprivation,Oxford: Clarendon Press.
—— (1990) ‘Food, economics, and entitlements’, in J. Drèze and A. Sen (eds) ThePolitical Economy of Hunger, vol. 1, Oxford: Oxford University Press.
Sen, A. and S. Sengupta (1983) ‘Malnutrition of rural children and the sex bias’,Economic and Political Weekly, vol. 18, pp. 855–64.
Snyder, M., F. Berry, and P. Mavima (1996) ‘Gender policy in development assistance:improving implementation results’, World Development, vol. 24, no. 9, pp. 1481–94.
Stamoulis, K. (1995) ‘Agricultural development in the economy-wide context:approaches to policies and strategies’, in N. Alexandratos (ed.) World AgricultureTowards 2010, An FAO Study, New York: John Wiley and Sons.
Strauss J. and D. Thomas (1998) ‘Health, nutrition and economic development’,Journal of Economic Literature, vol. 36, June, pp. 766–817.
Stringer, R. (1997) The Environment, Economics and Water Policies, CIES PolicyDiscussion Paper 97/02, Adelaide: CIES.
Stringer, R., R.A. Young and I. Carruthers (1993) ‘Water policies and agriculture’, inThe State of Food And Agriculture, Rome: FAO.
Thomas, D. (1991) Gender Differences in Household Resource Allocation, Populationand Human Resources Department, Living Standards Measurement Study,Working Paper, no. 79, Washington, DC: World Bank.
Timmer, P. (1992) ‘Agriculture and economic development revisited’, AgriculturalSystems, no. 40, pp. 21-58.
Tomkins, A. and F. Watson (1989) Malnutrition and Infection, AdministrativeCommittee on Coordination Subcommittee on Nutrition, Nutrition PolicyDiscussion Paper, no. 5, New York: United Nations.
Umale, D.L. (1993) Irrigation Induced Salinity: A Growing Problem for Developmentand the Environment, World Bank Technical Paper, no. 215, Washington, DC:World Bank.
UNCED (United Nations Conference on Environment and Development) (1992)Agenda 21, Chapter 18, ‘The protection of the quality and supply of freshwater’,New York: United Nations.
UNEP (United Nations Environment Programme) (1991) UNEP/ISRIC GlobalAssessment of Human-induced Land Degradation (GLASOD), Wageningen, theNetherlands and Nairobi, Kenya: UNEP.
United Nations (1975) Report of the World Food Conference, New York, 5–16November, New York: United Nations.
—— (1998) World Urbanization Prospects: The 1996 Revision, New York: UnitedNations.
—— (1999) World Population Prospects: The 1996 Revision, New York: UnitedNations.
Valdés, A. and A. Siamwalla (1981) ‘Chapter 1: Introduction’, in A. Valdés (ed.) FoodSecurity for Developing Countries, Boulder: Westview Press.
Food security in developing countries 103

Valdés, A. and R. López (1999) ‘Fighting rural poverty in latin america: new evidenceand policy’, paper presented at the American Agricultural Economics AssociationMeetings, Nashville, Tennessee, 8–11 August.
Vosti, S.A., T. Reardon and W. von Urff (1992) Agricultural Sustainabilty, Growthand Poverty Alleviation: Issues and Policies, Washington, DC: IFPRI.
Wiebe, K. (1994) ‘Household food security and cautious commercialization inKenya’, PhD Dissertation, University of Wisconsin, Madison: University ofWisconsin.
WCED (World Commission on Environment and Development) (1987) Our CommonFuture, London: Oxford University Press.
WHO (World Health Organisation) (1997) Global Database on Child Growth andMalnutrition, Geneva: WHO.
World Bank (1986) World Bank Development Report, New York: Oxford UniversityPress.
—— (1990) World Bank Development Report, New York: Oxford University Press.—— (1992a) China: Strategies for Reducing Poverty in the 1990s, Washington, DC:
World Bank.—— (1992b) ‘Development and the environment’, World Development Report,
Washington, DC: World Bank.—— (1992c) ‘Price prospects for major primary commodities’, Washington, DC:
World Bank.—— (1995) Poverty and Hunger: Issues and Options for Food Security in Developing
Countries, Washington, DC: World Bank.
104 Randy Stringer
6 External debt, governmentexpenditure, investment and growth
G.S. Gupta
Introduction
The full employment theory of the classical school has been proved wrongby the real life experiences of the world since the Great Depression. Thoughthe Keynesian theory of the possibility of both full as well as below fullemployment equilibrium has the limitations of ignoring the role of expect-ations and policy lags, among others, its prescription of enlarging theeffective (aggregate) demand to remove unemployment is still valid. For adeveloping economy, a relatively easy way to expand aggregate demandwould be through an increase in government expenditure financed throughraising external debt. Thus, external debt, to the extent it is sustainable,could be a way to alleviate the problem of unemployment and to push upgrowth.
Demand could be pushed up through attracting foreign direct investmentas well. However, this requires the presence/creation of incentives for suchinvestments. Further, though foreign investments do create employment inthe host country, their profits go to the foreign investors. If the return oninvestment exceeds the cost of borrowing (which is often true), foreign directinvestments become inferior to external borrowings (foreign portfolioinvestment). Also, from the investors’ point of view, direct investments aremore risky than lending, particularly if it is in a developing externaleconomy. However, external debt has one disadvantage over foreign directinvestment, as the former has fixed obligations for its servicing, while thelatter is to be serviced if and only when it yields profit. Grants from abroadare also a source of foreign funds but they depend on the donor countriesand they are associated with the social stigma of ‘mercy’.
External debt : dimension and distribution
Borrowing and lending externally has prevailed for over a century and thedebt crisis of the 1980s was not the first one to be experienced. However,instead of going into its history, here we concentrate on the debt and theassociated crisis which was triggered by the OPEC (Organisation of Petroleum
Chapter Title 105

Exporting Countries) decision to raise the crude oil price significantly from$2.59 to $11.65 a barrel in 1974 and again in 1978 and thereafter to take it to$32 a barrel by 1981. This led to the transfer of many billions of dollarsfrom the oil-importing countries to the oil exporters. The oil importersbecame suddenly poor and oil exporters were flooded with money. Thesepetro dollars were recycled in the forms of lendings and borrowings throughbanks, which led to the growth of external debt.
Debt trends
The World Bank publishes data on external debt and related variables ofdeveloping countries (numbering 136) on a regular basis. These reveal thatthe total of such debt increased from $603 billion in 1980 to $2,171 billion in1997 (see Table 6.1). This marks an annual growth rate of 7.8 per cent, whichis greater than the economic growth rate achieved by this group of countriesduring the corresponding period. An intra-period analysis of the dataindicates that the growth rate was much higher (8.5 per cent) during 1980through 1995 than between 1995 and 1997 (3.1 per cent). The debt service(interest plus amortization) increased from $91 billion in 1980 to $269 billionin 1997, indicating an annual growth rate of 6.6 per cent. Debt service as aproportion to debt outstanding stands at around 12 per cent on average,which is quite low, indicating the softness of external debt.
A careful examination of the various debt indicators during approxi-mately the last two decades (see Table 6.1) reveals that between 1980 and1997 the ratio of:
(a) the debt to GNP has increased from 21 per cent to 35 per cent;(b) the debt to exports (of goods and services, including workers’ remit-
tances) has increased from 85 per cent to 134 per cent;(c) debt service to exports has gone up from 13 per cent to 17 per cent;(d) international reserves to debt fell from 6.8 per cent to 6.4 per cent; and (e) concessional debt to total debt went up from 18 per cent to 20 per cent.
The first four of the above five ratios indicate the ability of the borrowers toservice the debt and each one of them has moved in the unfavourabledirection over time. Thus, the debt burden is up not only in terms of theabsolute burden but also in terms of the ability to service the same. The lastratio, the share of the concessional debt to total debt, has shown an upwardtrend, which is a welcome change, but it still accounts for only a smallfraction (one-fifth) and the trend is rather small. There is no rule of thumbto ascertain the debt sustainability. However, an analysis of the debt to GNPratio, debt to exports ratio and debt service to exports over time for thedeveloping countries’ group as a whole suggests a fairly comfortableposition. Debt servicing has remained a small fraction of exports and thedebt to GNP ratio at about one-third. The debt crisis could have been caused
106 G.S. Gupta

External debt, expenditure and investment 107
Table 6.1 External debt and debt indicators of developing countries(US$billions/per cent)
No. of End of year Annual countries growth
rate
1980 1985* 1990 1995 1996 1997 1980–96/97
A Debt of all countries ($ billion) 136 603 991 1,444 2,043 2,095 2,171 7.8
1 Total debt (21) (35) (35) (39) (36) (35)2 Total debt service 136 91 134 160 230 262 269 6.6
B Debt indicators of all countries ( per cent) 136
3 Total debt/exports 136 85 183 162 149 137 134 2.74 Total debt service/ 13 25 18 17 17 17 1.6
exports5 Int’l reserves/total 136 6.8 14.7 7.9 6.9 6.4 6.4 -0.3
debt6 Concessional debt/ 136 18 15 21 21 20 20 0.6
total debt
C Debt of region ($ billion) 136
7 East Asia and 65 166 239 447 447 512 12.9Pacific (EAP) 16 (16) (29) (37) (36) (34) (32)
8 Europe and Central 76 158 221 354 370 389 10.1Asia (ECA) 28 (9) (20) (17) (36) (34) (32)
9 Latin America and 257 390 475 637 656 678 5.9Caribbean (LAC) 27 (36) (61) (46) (39) (37) (38)
10 Middle East and 84 – 182 216 212 217 5.7North Africa (MENA) 10 (18) (38) (35) (31) (29)
11 South Asia (SA) 7 38 68 130 157 152 154 8.6(17) (25) (34) (31) (27) (26)
12 Sub-Saharan Africa 84 – 196 231 227 223 5.9(SSA) 48 (34) – (75) (82) (78) (71)
D Debt by income and indebtedness ($ billion) 136
13 Severely indebted and 36 57 122 210 241 233 – 8.2low income (31) (38) (139) (111) (94) –
14 Severely indebted and 12 185 392 414 557 589 – 7.5middle income (34) (58) (48) (39) (38) –
15 Moderately indebted 13 43 109 138 166 161 – 8.6and low income (19) (30) (36) (38) (34) –
16 Moderately indebted 16 184 193 363 565 577 – 7.4and middle income (34) (24) (46) (51) (47) –
17 Other developing 59 134 175 318 515 536 – 9.1countries (10) (22) (17) (25) (23) –
Source: World Bank : Global Development Finance (1998) and earlier issues of World Debt Tables.
Notes: (a) Numbers in parentheses are per cent of GNP. (b) *1985 data are not quitecomparable with other years. (c) – data not available.

not by the solvency constraint but by the liquidity trouble, for the proportionof foreign exchange reserves to external debt stood only at around 7 per centduring 1990s, whereas it was around 15 per cent in 1985.
Debt by region
The 136 developing countries have been classified according to the sixregions. The data on the distribution of their debt over time by this classific-ation are included in Table 6.1 above. The Latin America and Caribbeanregion has been owing the most while the South Asia region the least. Thedebt of these two regions has increased at the annual rate of about 5.9 percent and 8.6 per cent, respectively, during the seventeen years of this analysis.The region with the second largest debt is East Asia and Pacific, whose debthas grown at the annual rate of 12.9 per cent, which is the highest rateamong all the six regions. This happens to be the region which has attainedperhaps the highest rate of economic growth during the period of thisanalysis. This gives some credibility to the theory of ‘debt-led growth’. Theregion with the lowest growth rate in debt happens to be the Middle Eastand North Africa, where the growth rates have been relatively small.
In terms of the external debt relative to GNP, sub-Saharan Africa topsthe list, with a debt ratio of over 70 per cent in four out of the five years forwhich data are reported here. Latin America and the Caribbean take thesecond position with the ratio hovering around 40 per cent in five out of thesix years. In other regions, the debt ratio has generally been in the thirtiethpercentile. Europe and Central Asia, and South Asia have been the regionswith the lowest proportion of debt to GNP.
Debt by income and indebtedness1
Of the 136 developing economies, 36 have been classified as the severelyindebted low-income countries, 12 as severely indebted middle-income, 13 asmoderately indebted low-income, 16 as moderately indebted middle-income,and the remaining 59 as the other (less indebted) developing countries. Asexpected, the group of middle-income countries owes the most in terms ofthe debt size. However, the group of the severely indebted, low-incomecountries does not always have the highest debt to GNP ratio, and this maybe true even for the combined group of all the low-income countries. Inparticular, the middle-income countries’ debt proportions have been higherthan the poor countries in the 1980s. This observation is significant in viewof the debt crisis of the 1980s, which is analysed later in this chapter.
The debt to GNP ratio has varied between the low of 10 per cent in 1980for ‘other’ developing countries and 139 per cent in 1990 for the severelyindebted low-income countries. While all the other groups have a debt ratioof less than 50 per cent in all but one case, the severely indebted low-incomecountries group has this ratio close to or in excess of 100 per cent all through
108 G.S. Gupta

the 1990s. The only comfort one finds here is that the ratio of this group haswitnessed a declining trend since 1990, whereas it had experienced anupward trend during the 1980s. The debt ratio has a declining trend also forthe severely indebted middle-income group and this is so since 1985.
Debt by country
Global Development Finance provides data on external debt of the 138countries that report public and publicly guaranteed debt under the DebtorReporting System (DRS). The World Development Report gives detailed dataon many economic variables of 130 countries. The two lists of countries,though somewhat overlapping, are partly distinct. Since we wish to analyseexternal debt in relation to some variables which measure economic growth,we have selected all the countries which are included in both the lists andwhose population is no less than 15 million in 1998. This sampling pro-cedure has reduced the number of countries to 44, whose data on selectvariables are provided in Table 6.2.
Of these 44 selected countries, 18 fall in the group of severely indebted, 13moderately indebted and 13 less indebted. In terms of the income group, 18belong to the low-income category and the rest to the middle-income group.By region, their classification is as follows:
East Asia and Pacific (EAP) 6Europe and Central Asia (ECA) 8Latin America and Caribbean (LAC) 8Middle East and North Africa (MENA) 7South Asia (SA) 5Sub-Saharan Africa (SSA) 10
—44
Thus, the sample of 44 large developing countries is quite representative interms of their various groupings.
The extent of debt could be analysed in terms of its absolute size and thesustainability of debt in terms of the debt to GNP ratio. The countrieswhose external debt in 1997 exceeded $100 billion include Brazil, China,Indonesia, Mexico and the Russian Federation. Of these five countries,China alone belongs to the poor country group, but it is the country with thehighest population in the world. Even the other four countries have arelatively large population. Ten out of these 44 countries have the debt toGNP ratio in excess of 100 per cent. This group consists of Congo, Ethiopia,Ghana, Madagascar, Mozambique, Nigeria, Syria, Tanzania, Vietnam andYemen. Eight of these are poor economies and barring Nigeria and Vietnamall have a relatively small population. Thus, in general, the large middle-income countries have a high external debt and the small poor countrieshave a high external debt to GNP ratio.
External debt, expenditure and investment 109

Tab
le 6
.2E
xter
nal d
ebt,
gove
rnm
ent
expe
ndit
ure,
inve
stm
ent
and
grow
th o
fla
rge
deve
lopi
ng c
ount
ries
(U
S$ b
illio
n/pe
r ce
nt)
Cou
ntry
gro
upE
xter
nal d
ebt
Cen
tral
gov
t.to
tal
Gro
ss in
vest
men
tG
row
th r
ate
(US
$ bi
llion
)ex
pend
itur
e as
%
as %
of
GD
P(%
of
annu
alof
GD
Pav
erag
e)
Cou
ntry
Reg
ion
Inco
me
Inde
bted
-ne
ss19
8019
9019
9619
8019
9619
8019
9819
80–9
019
90–9
8
1A
lger
iaM
EN
AM
iddl
e Se
vere
19.4
27.9
33.2
–29
.739
272.
71.
2(4
7)(4
7)(7
7)2
Arg
enti
naL
AC
Mid
dle
Seve
re27
.162
.293
.818
.214
.025
22�
0.4
5.3
(36)
(46)
(32)
3B
angl
ades
hSA
Low
Mod
erat
e4.
2312
.816
.1–
7.4
2221
4.3
4.8
(33)
(58)
(51)
4B
razi
l L
AC
Mid
dle
Seve
re71
.512
0.0
179.
020
.233
.823
212.
73.
3(3
2)(2
8)(2
5)5
Chi
leL
AC
Low
Mod
erat
e12
.119
.227
.428
.021
.021
274.
27.
9(4
6)(6
7)(3
8)6
Chi
naE
AP
Low
Les
s4.
5055
.312
8.8
–8.
035
3910
.211
.1(2
)(1
6)(1
6)7
Col
ombi
aL
AC
Low
Mod
erat
e6.
9417
.228
.913
.4–
1918
3.6
4.2
(21)
(45)
(35)
8C
ongo
D
emo.
Rep
.SS
AL
owSe
vere
4.
7710
.312
.812
.48.
336
353.
31.
0(3
3)(1
20)
(212
)9
Egy
pt,A
rab
Rep
.M
EN
AM
iddl
eL
ess
19.1
32.9
31.4
50.3
34.3
2819
5.4
4.2
(89)
(79)
(46)
10E
thio
pia
SSA
Low
Seve
re0.
828.
6310
.119
.9–
1320
1.1
4.9
(150
)(1
27)
(169
)

11G
hana
SSA
Low
Seve
re1.
403.
876.
2010
.9–
623
3.0
4.2
(32)
(67)
(100
)12
Indi
aSA
Low
Mod
erat
e20
.683
.789
.813
.315
.820
235.
86.
1(1
2)(2
9)(2
6)13
Indo
nesi
aE
AP
Mid
dle
Seve
re20
.969
.912
9.0
22.1
14.6
2431
6.1
5.8
(28)
(64)
(60)
14Ir
an,I
sl.R
ep.
ME
NA
Mid
dle
Les
s4.
509.
0221
.235
.723
.230
–1.
74.
0(5
)(8
)(1
5)15
Jam
aica
LA
CM
iddl
eSe
vere
1.91
4.67
4.04
41.5
–16
342.
00.
1(7
8)(1
23)
(94)
16K
azak
hast
anE
CA
Mid
dle
Les
s –
–2.
92–
––
36–
�6.
9(1
4)17
Ken
yaSS
AL
owM
oder
ate
3.38
7.06
6.89
25.3
28.9
2918
4.2
2.2
(48)
(87)
(77)
18M
adag
asca
rSS
AL
owSe
vere
1.24
3.72
4.18
–17
.315
131.
11.
3(3
1)(1
27)
(105
)19
Mal
aysi
aE
AP
Mid
dle
Mod
erat
e6.
6115
.339
.828
.521
.930
325.
37.
7(2
8)(3
8)(4
2)20
Mex
ico
LA
CM
iddl
eM
oder
ate
57.4
104.
415
7.1
15.7
15.5
2726
0.7
2.5
(31)
(41)
(49)
21M
oroc
coM
EN
AM
iddl
eM
oder
ate
9.25
23.7
21.8
33.1
33.3
2422
4.2
2.1
(51)
(95)
(61)
22M
ozam
biqu
eSS
AL
owSe
vere
–4.
685.
84–
–6
21�
0.1
5.7
(360
)(3
79)
23M
yanm
arE
AP
Low
Seve
re
1.50
4.70
5.18
15.8
10.1
2113
0.6
6.3
(–)
(–)
(–)
24N
epal
SAL
owL
ess
0.21
1.64
2.41
14.3
17.5
1821
4.6
4.8
(10)
(44)
(53)

Tab
le 6
.2(c
onti
nued
)
Cou
ntry
gro
upE
xter
nal d
ebt
Cen
tral
gov
t.to
tal
Gro
ss in
vest
men
tG
row
th r
ate
(US
$ bi
llion
)ex
pend
itur
e as
%
as %
of
GD
P(%
of
annu
alof
GD
Pav
erag
e)
Cou
ntry
Reg
ion
Inco
me
Inde
bted
-ne
ss19
8019
9019
9619
8019
9619
8019
9819
80–9
019
90–9
8
25N
iger
iaSS
AL
owSe
vere
8.92
33.4
31.4
––
2120
1.6
2.6
(14)
(131
)(1
01)
26P
akis
tan
SAL
owM
oder
ate
9.93
20.7
29.9
17.5
23.8
1817
6.3
4.1
(42)
(50)
(46)
27P
eru
LA
CM
iddl
eSe
vere
9.39
20.1
29.2
19.5
16.5
2925
�0.
35.
9(4
8)(6
3)(4
9)
28P
hilip
pine
sE
AP
Mid
dle
Mod
erat
e17
.430
.641
.213
.418
.529
251.
03.
3(5
4)(6
9)(4
7)
29Po
land
EC
AM
iddl
eL
ess
43.1
49.4
40.9
–42
.226
241.
84.
5(5
5)(8
9)(3
1)
30R
oman
iaE
CA
Mid
dle
Les
s9.
761.
148.
2944
.831
.440
200.
5�
0.6
(14)
(3)
(24)
31R
ussi
an F
ed.
EC
AM
iddl
eL
ess
–59
.812
4.8
–24
.7–
20–
�7.
0(1
0)(2
9)
32Sa
udi A
rabi
aM
EN
AM
iddl
eL
ess
––
––
–22
200.
01.
6
33So
uth
Afr
ica
SSA
Mid
dle
Les
s–
–23
.621
.134
.728
161.
21.
6(1
9)
34Sr
i Lan
kaSA
Low
Les
s1.
845.
878.
0041
.427
.734
244
5.3
(46)
(74)
(58)

35Sy
rian
Ara
b R
ep.
ME
NA
Mid
dle
Seve
re
3.55
17.1
21.4
48.2
23.8
2829
1.5
5.9
(27)
(148
)(1
31)
36T
anza
nia
SSA
Mid
dle
Seve
re2.
456.
417.
41–
––
16–
2.9
(145
)(1
60)
(130
)
37T
haila
ndE
AP
Mid
dle
Mod
erat
e8.
3028
.190
.818
.816
.529
357.
67.
4(2
6)(3
3)(5
0)
38T
urke
yE
CA
Mid
dle
Mod
erat
e19
.149
.479
.821
.326
.918
255.
44.
1(2
7)(3
3)(4
3)
39U
gand
aSS
AL
owSe
vere
0.69
2.58
3.67
6.2
–6
153.
27.
4(5
6)(6
1)(6
1)
40U
krai
neE
CA
Mid
dle
Les
s–
–9.
34–
––
20–
�13
.1(2
2)
41U
zbek
ista
nE
CA
Mid
dle
Les
s–
–2.
32–
––
23–
�1.
9(1
0)
42V
enez
uela
LA
CM
iddl
eM
oder
ate
29.3
33.2
35.3
18.7
16.9
2616
1.1
2(4
2)(7
0)(5
4)
43V
ietn
amE
AP
Low
Seve
re–
23.5
26.8
––
–29
4.6
8.6
(115
)(1
15)
44Y
emen
,Rep
.M
EN
AL
owSe
vere
1.68
6.35
6.36
–32
.8–
22–
3.8
(130
)(1
35)
(120
)
Sou
rces
:aW
orld
Ban
k:G
loba
l Dev
elop
men
t F
inan
ce,1
998
and
earl
ier
issu
es.
bW
orld
Ban
k:W
orld
Dev
elop
men
t R
epor
t,19
99–2
000.
Not
es:a
Num
bers
in p
aren
thes
es a
re p
er c
ent
ofG
NP.
b N
ot a
vaila
ble.

Looking at the trend in external debt across the developing economies, wenotice a general increase. Of the 44 countries, the debt has increased overtime for 38 countries and this includes all the countries which have eitherhigh debts or high debt to GNP ratio. However, when we look at the debt toGNP ratio, we find a mixed trend. It reveals an upward trend for tencountries and either a falling or fluctuating trend for the remaining 34countries. Five of these ten countries belong to the group of either the highdebt or high debt to GNP ratio of the previous paragraph. These are Congo,Ghana, Mozambique, Mexico and the Russian Federation. These countriesappear to have the most serious debt problem. The first three are small inpopulation, poor in per capita income and belong to sub-Saharan Africa.The last two are relatively large and with middle income. Russia could be introuble due to the fall out of the erstwhile USSR, and the problem of Mexicois well known.
Debt crisis and resolution
Most of the external debt of all the developing countries is sovereign orguaranteed by the corresponding government. All independent nations aresovereign and they cannot be challenged in any court of law for not servicingtheir external debt obligations either as per the agreed time schedule or evenotherwise in terms of the amounts due. However, default in debt servicing ofeither kind certainly affects adversely the country’s global reputation as wellas the internal functioning of the defaulting country. Besides, the creditornations may impose sanctions against the defaulting countries in terms of theseizure of the latters’ assets in their countries (if any), trade restrictions, futureborrowings, etc. These lead to an increase in the ‘country risk’ for defaultingnations, which worsens the future borrowing prospects, inter alia. Thus, thedebt-servicing time schedule is to be adhered to as much as possible, despitesome economists’ suggestions that debtor nations should default.
The post-Bretton Woods period of about three decades passed awayrather well in terms of the international transactions and finance, includingthe external debt. The 1974 and 1978 oil price hikes by OPEC led to aphenomenal increase in external borrowings/lendings, which resulted in theappearance of the debt crisis of Mexico in 1982. The crisis soon spread toseveral other countries in Latin America and Africa. A group of 15 countrieswas identified as the severely indebted nations, which needed some salvation.The factors which have been argued to have triggered this crisis include:
(a) heavy borrowings by oil importing countries to finance increasing oilimport bills;
(b) lending rush due to the flood of petro dollars with banks from oil export-ing nations without ensuring proper project appraisal;
(c) capital flight out of the debtor nations.
114 G.S. Gupta

The International Monetary Fund (IMF), World Bank and the UnitedStates, among other developed countries, resorted to deliberations amongthemselves as well as with the countries faced with the debt crisis. Thesolutions suggested/implemented, the plans worked out, and the groupsformed for the purpose are known as
• Baker Plan• Brady Plan• Toronto terms• Enhanced Toronto terms• Houston terms• Naples terms• Paris club• London club/terms• IMF conditionalities
These involved country-by-country rescheduling of debt servicing, debtreduction/forgiveness, new loans to complete/continue the running of viableprojects and thence to improve the repayment prospects, debt to equityswaps, etc. The IMF conditionalities of austere economic surveillance wereimposed on the countries who availed themselves of these concessions/benefits. Thus, the defaulting nations were forced to pursue policies thatwould sharply cut their current account deficits, such as a reduction in fiscaldeficits, devaluation and opening of their economies. In consequence, whilethe objective of the reduction in the current account deficit may have beenachieved, some of these countries experienced a fall in their per capitaincomes, increase in unemployment and an acceleration in the rate ofinflation. The 1980s have been described as a ‘lost decade’ for many LatinAmerican countries.
The debt crisis has to be the joint responsibility of both the debtor as wellas the creditor countries. Accordingly, while dealing with this issue, debtorshave suffered through the imposition of certain macro-economic sanctionsand disciplines on them, and the creditors have suffered by way of debtdiscounts and rescheduling of debt servicing.
Debt and economic performance
Economic performance of a nation is governed by many factors and externaldebt could be one of them. There are several channels through which thisrelationship takes place. These include debt overhang/crowding out, accessto international financial markets and the level of uncertainty in the debtorcountry. All these theories argue for a negative relationship between externaldebt, and each of investment and economic growth. External debt doesprovide a source of funds for investment and thereby induces growth but itsexistence hampers them subsequently.
External debt, expenditure and investment 115

Table 6.2 includes data on central government expenditure as well as grossinvestment, both as proportions to GDP, and on the economic growth ratesof the 44 large countries for two periods. To see the bi-variate relationshipbetween external debt and each one of the other pertinent variables, thevarious correlation coefficients (Pearsonian) have been computed, and thesame are reported in Table 6.3.
As the results in the table above would reveal, none of the correlationcoefficients is highly significant. The highest significance level of 6.8 per centis for the positive correlation between debt 1996 and investment to GDPratio 1998. The other significant coefficients at the level of 20 per cent orbelow are the positive correlations between the debt to GNP ratio of 1980and 1990 (average) and the average growth rate during 1980–90, and betweenthe same two variables during the second period, i.e. 1990 and 1996 (average)and the average during 1990–98.
In terms of the signs of the correlation coefficients, all four correlationsare positive between the debt and the growth rate variables. Though correl-
116 G.S. Gupta
Table 6.3 Variables and correlation coefficients
VariablesCorrelation Significance
A B coefficient level
1 External debt, average Growth rate during 0.0904 0.589of 1980 and 1990 1980–90
2 External debt to GNP Growth rate during 0.2211 0.182ratio, average of 1980 1980–90and 1990
3 External debt, average Growth rate 1990–8 0.1580 0.306of 1990 and 1996
4 External debt to GNP Growth rate 1990–8 0.1968 0.200ratio, average of 1990 and 1996
5 External debt 1980 Govt. expenditure to �0.1309 0.499GDP 1980
6 External debt 1996 Govt. expenditure to �0.1367 0.463GDP 1996
7 External debt to GNP Govt. expenditure to 0.1610 0.4041980 GDP 1980
8 External debt to GNP Govt. expenditure to 1996 GDP 1996 �0.1146 0.539
9 External debt 1980 Investment to GDP 1980 0.1743 0.302
10 External debt 1996 Investment to GDP 1998 0.2805 0.068
11 External debt to GNP Investment to GDP 1980 1980 �0.1303 0.442
12 External debt to GNP Investment to GDP 1996 1998 0.0418 0.790

ations are devoid of causation, they do suggest a positive relationship betweenexternal debt and economic growth, and this thus supports the theory ofdebt-led growth. Between debt and government expenditure, three out of thefour correlations are negative, and thus they argue that external debt may becrowding out government expenditure, The three out of the four correlationcoefficients between the different measures of debt and gross investment arepositive, which negates the hypothesis of a negative relationship betweenthese two variables.
Although debt sustainability has no unique testing procedure, the debtto GNP ratio does throw some light on it. The average values of this ratiofor the 44 countries in Table 6.2 for 1980, 1990 and 1996 come to 35.7, 67.3and 66.3 per cent, respectively. Thus the ratio, while almost doubled duringthe decade of the 1980s, has remained nearly at the same level during thefirst six years of the 1990s. The Latin American debt crisis of the 1980sthus did not arrest the increasing trend of the debt to GNP ratio. This onlysuggests that, in general, the debt sustainability could not be an issue forthe debt crisis. An examination of the country-wise data suggests that thecountries which had significantly been above the average debt to GNP ratioin at least two of the three years for which the data are given in Table 6.2include Congo, Ethiopia, Jamaica, Madagascar, Morocco, Mozambique,Nigeria, Syria, Tanzania, Vietnam and Yemen. By this yardstick, thesecould be the countries in the region of external debt trap. The countrieswhose debt to GNP ratio was rather low relative to the average includeChina, Colombia, India, Iran, Kazakhstan, Malaysia, Mexico, Nepal,Romania, Russia, South Africa, Thailand, Turkey, Ukraine and Uzbekistan.Surprisingly the latter list has countries like Mexico, Russia and someSouth-East Asian countries which have recently suffered a financial crisis.This only underlines the inadequacy of the debt to GNP ratio as data onwhich to judge the matter and/or to suggest that the default could arise notjust for the inability to service but also due to the lack of the willingness toservice the debt.
Conclusions
Both the external debt as well as the debt service of the 136 developingcountries have grown at the rate higher than the economic growth rateachieved by the group of these countries during the last two decades. If debtleads to a smoothening of the consumption of both the borrowers as well asthe lenders, and enhances the productivity of capital through its properallocation and diffusion of technology, then the growth in external debt isgood. However, if the debt is used for building up the defence services and/orfor unproductive uses (like financing consumption or revenue expenditures),and particularly if it is raised when there is already idle capacity in theeconomy, it is an unwarranted economic activity. This chapter could not gointo such details due to the paucity of the necessary data.
External debt, expenditure and investment 117

External debt has grown both in absolute size as well as in relation to theability and liquidity to service the same in the last two decades. However, theratios are still quite comfortable for the group of all the developing countriesas a whole. In terms of the regional groupings, while the Latin American andCaribbean region owes the most, sub-Saharan Africa tops the list in terms ofthe debt to GNP ratio. The analysis of developing countries by income andindebtedness has indicated that the middle-income countries not only owethe most, they also have the highest debt to GNP ratio. The country-wiseanalysis of the 44 large developing countries has found that the countrieswhich have suffered the debt crisis are not necessarily the ones which had themost unfavourable indices of debt sustainability.
External debt and economic growth are found to have had a positivecorrelation. Even debt and investment have witnessed a generally positivecorrelation. The chapter thus suggests that the capital-poor countries couldaspire to grow faster than otherwise through external debt if they are able touse both the domestic capital and the borrowed funds productively.
Note
1 For the classification of countries on this basis, see World Bank, Global Develop-ment Finance, 1998, vol. I, pp. 65–6.
References
Claessens, Stijn et al. (1996) Analytical Aspects of the Debt Problems of HeavilyIndebted Poor Countries, Policy Research Working Paper, no. 1618, Washington,DC: World Bank.
Dooley, M.P. and K.M. Kletzer (1994) ‘Capital flight, external debt and domesticpolicies’, Federal Reserve Bank of San Francisco Economic Review, no. 3, pp. 29–37.
Eichengreen, B. and P.H. Lindbert (1989) The International Debt Crisis in HistoricalPerspective, Cambridge and London: MIT Press.
Grossman, H.I. and J.B. Van Huyak (1988) ‘Sovereign debt as a contigent crisis,excusable default, repudiation and reputation’, American Economic Review, vol.78, no. 5, pp. 1088–97.
Klein, T.M. (1994) External Debt Management, An Introduction, Washington, DC:World Bank.
Krugman, Paul (1985) ‘International debt strategy in an uncertain world’, in GordonSmith and J.T. Cuddington (eds) International Debt and Developing Countries,Washington, DC: World Bank.
Organisation for Economic Cooperation and Development (1992) Financing andExternal Debt of Developing Countries, 1992 Survey, Paris: OECD.
Sachs, J. and S.M. Collins (eds) (1989) Developing Country Debt and EconomicPerformance, vol. 1–3, NBER and Chicago: University of Chicago Press.
118 G.S. Gupta

7 The pure theory of international trade, globalization, growth andsustainable development
Agenda for the future
M.R. Aggarwal
Introduction: the historical perspective
The pure theory of international trade, as expounded by classical, neo-classical, and modern economists, seeks to provide an explanation of thefactors, originating both from demand and supply side which tend toinfluence the observed pattern of trade flows and specialization amongnations, and their welfare implications measured in terms of Paretooptimality, for each of the trading partners and for the world as a whole. Theprinciple of comparative advantage was developed by Torrens (1808) andused by Ricardo (1817) to explain the pattern of trade and the benefitsflowing from free trade and competition. Ricardo argues that trade betweencountries arises because of the relative differences in the pre-trade prices ofthe goods, on the assumption that the relative production costs of goods andhence relative prices (PX/PY) in a closed economy, under competitiveequilibrium conditions in both commodity and factor markets and a simpleproduction function with the single input and constant returns, are entirelydetermined by relative labour inputs (LX/LY), i.e.:
and the differences in the pre-trade domestic price ratios of the goods andthe comparative advantage and disadvantage, in costs between countries willbe mainly due to differences in relative labour productivity. The theoryassumes, among other things, immobility of the factors of production inter-nationally, with negligible transport costs, and unchanged technology, factorinputs and demand patterns.
Ricardo in doing so made a substantial advance from Adam Smith’sposition: whereas Smith (1937) argues that trade between two countries isbeneficial if each has an absolute advantage over the other in the productionof a good, Ricardo’s ‘Constant Cost’ model shows that substantial gains are
PP
LL
x
y
x
y
=
Chapter Title 119

also possible in cases where one of the countries has an absolute advantageover the other in the production of both the goods, measured in terms ofdifferences in relative labour productivity between nations. This can beexpressed algebraically as a1/b1>a2/b2> 1 where a1 and a2 are the outputfactor ratios for country 1 and b and b are for country 2. The overall welfareimplications of the classical model, assuming equilibrium world price ratiolying between the pre-trade cost-ratios of the trading partners, are themaximization of global trade, real output, and resource efficiency throughexchange and specialization with free trade; and benefits to all the partnerswhich may or may not be equally distributed due to differences in elasticityof each other’s demand.
J.S. Mill introduced in a satisfactory way ‘demand conditions’ and madeRicardian analysis a full general equilibrium analysis. Eyebrows were raisedby theorists, notably J.S. Mill (1937) and J.E. Cairnes (1874), by way ofviolent criticism about several of the restrictive assumptions on whichRicardo’s doctrine was based, particularly labour theory of value as ananalytical tool and straight line transformation frontier, but despite theircriticism they could not cast much doubt on the practical relevance of thetheory and in fact the principle stood very well against these attacks byabsorbing successfully many of these criticisms and relaxing several of theassumptions.
Haberler (1950), the main architect of the neo-classical theory and withleanings towards classical tradition, successfully couched Ricardo’s doctrinein terms of ‘opportunity’ rather than ‘real costs’, and a social indifferencemap, thus liberating the classical theory from the labour theory of value,while recognizing the existence of many factors and varying returns to scaleand introducing concavity to the original production possibility curve.Intellectually it must be regarded as a remarkable achievement as it lifted thetheory out of the real cost strait-jacket in which it had been entrenchedfor so many generations but it could not explain the causes of the costdifferentials in the production of trading partners. Most of the subsequentformal developments of the theory by Learner (1953), Leontief (1953) andMeade (1952) were built on the foundations laid by his analysis.
Swedish economists Heckscher (1919) and Ohlin (1933), unlike Smith,Ricardo and Mill, laboured hard to provide root causes of the relativedifferences in labour productivity. The standard Heckscher–Ohlin (H–O)model, which was refined by Samuelson (1939), and later on by Learner(1980) by assuming two-country, two factors of production, with fixedquantities at any point of time (endowment ratio), constant returns to scale(strong factor intensity assumption), and by postulating functional relationbetween relative factor endowments, factor price ratios and commodityprices, concludes that trade mainly arises due to factor intensity differencesin the production functions of two goods, coupled with the observeddifferences in relative factor endowments of the countries. It follows then
120 M.R. Aggarwal

where L,K and PL and PK refer to amount of labour, capital and factorrentals respectively. In other words, the theorem asserts that a country willexport that commodity which is produced with the relatively large amountsof its relatively abundant factor. The propositions, however, may not lead tothe same results, as ‘relative abundance/scarcity’ was defined in more thanone way. Whereas the physical definition rests on differences in relative factorendowments, the price definition rests on differences in the ratio of autarkyfactor rentals. The major differences between the classical and H–O theoremlie in (a) the explicit separation between the ‘positive’ aspects and ‘normativeor welfare’ aspects of trade which depend upon meta-economic criteria, and(b) assuming identical inter-country differences in the production function.Johnson (1954) has synthesized various attempts to elaborate the H–Omodel by giving more stress on ‘demand factors’ which Ohlin considered as‘mere curiousity’, but the basic formulation of the model in fact more or lessremains the same. Further, Heckscher stated that under specifiableconditions, free trade equalizes pre-trade differences in factor rentals,although Ohlin was of the view that due to restrictive assumptions, fullfactor price equalization may not occur. Stolper and Samuelson (1941),Uzawa (1959) and Samuelson (1939) again set forth the Ricardo–Viner pure rent model with which they attempt to vindicate Ohlin’s partialequalization hypothesis. Also, it should be noted that though the terms‘factor prices’ and ‘factor rentals’ are used interchangeably, they do notconvey the same meaning, as the prices of the factors means the rentals forthe services of the productive factor and not the factor prices. Thegeneralization of the H–O theory by Vanek and later on by Learner wasdisappointing for, instead of explaining trade flows in actual goods, it showsabstract amounts of factors of production embodied in the trade flows.
The findings of empirical studies since the late 1940s on Ricardian and H–O theorem, under both ‘static’ and dynamic conditions, have immenselyshaken many widely accepted views about the causes of the operation andstructure of trade. MacDougall (1951) by using multiple regression analysisand later on Stern (1975), Kravis (1970) and Bela Balassa (1963) carried outempirical tests by comparing productivity of labour in manufacturingindustries in the USA which do lend, in fact, a powerful support to theRicardian model of trade. However, results remain quite inconclusive asBhagwati (1969), using MacDougall’s data as a sample for 25 industrialproducts with and without ‘log’, was not able to find any systematic andsignificant correlation between relative labour costs and export prices, thusrefuting the Ricardian hypothesis. Leontief’s evidence (1953), widely knownas the Leontief paradox, based on input–output technique and US 1947data, though inconclusive had enormous impact on the pure theory of trade
LK
LK
PP
PPA B
L
K
L
KA B
>
=
<
Globalization and sustainable development 121

and generated a considerable amount of rethinking among economists aboutthe proximate determinants of exports in the 1950s and 1960s. Studies madeby Bhardwaj for India (1962), Tatemoto and Ichimura (1959) for Japan, andWahl (1961) for Canada, and Ellsworth and Clark (1975) coupled with Arrow,Minhas Chenery and Solow’s study using CES production function (1963) asto the existence of reversibility remain inconclusive in supporting orrejecting the H–O theorem. And in fact some of the studies did suggest thata relatively capital-rich country may not always export relatively capitalintensive goods and vice versa.
The modern theories
The basic developments in the area of trade from classical to neo-classicalare intellectually commendable, provided the restrictive assumptions onwhich these theories are based are well recognized. Modern theorists,notably Linder (1961), Kravis (1970), Posner (1961), Vernon (1979) andHufbauer (1966), partly criticized these attempts for not taking intoaccount the dynamic influences and tried to provide alternative explanationsof the observed pattern of trade, which cannot be labelled as complete.Linder’s thesis is that a large volume of trade in manufactures of a country,with each of her trading partners among the industrialized countries havingidentical factor endowments, can be explained, given the operation of theeconomies of scale in the home market in the exportable product, andsimilarly in the general economic conditions, through the similarity in‘demand patterns’. The theory however lacks precision and rigour as theconcept of ‘representative’ demand used in the analysis and omission ofsome of the trading countries are not exactly formulated. The technologygap theory, propounded by Posner (1961), sets out to explain the flow ofmanufactured goods in the advanced countries in terms of innovation andimitation even within identical overall factor endowments and demandconditions, but failed to explain its exact definition, the reasons for itsexistence. The commodity composition and direction of trade, according toRaymond Vernon’s ‘product cycle model’ (1966) could be predicted due tothe interaction of the various stages of development through which anexportable product is likely to pass in its life cycle. This means a country,before it can export a good, must first of all develop an internal market, reapthe economies of scale and continue innovating to retain its technologicallead and hence its comparative advantage. This theory seems to be applicableonly in the case of consumer durables, in terms of time span from innov-ation to eventual high consumer demand. On the basis of strong theoreticalfoundations Kravis reaches the conclusion that availability of scarce naturalresources or ‘supply elasticities’ and domestic agricultural supportprogrammes between trading partners is the fundamental cause of trade,which are mildly supported by Bhagwati. Trade tends to be confined togoods which are not available at home – in the absolute sense. Findlay,
122 M.R. Aggarwal

however, says that this theory is only true in a very special case, while thereare as many countries as there are commodities and each country has onlyone input. According to Grubel and Lloyd (1975), inter-industry trade isquite compatible with the H–O model but the products of intra-industry areexchanged between the trading partners in the industrialized countries on alarge scale, in the manufactured goods. Models with imperfectly, instead ofperfectly competitive markets are indeed needed to explain such a trade. Thelevel of intra-industry trade of industry can be measured by the followingindex given by Balassa (1968):
where Xj and Mj are the values of the exports of good j by a country, andmatching imports of good j respectively. Here 0 ≤ Bj ≤ 100.
Thus, when Bj tends towards zero, trade comprises either exports orimports only, indicating that inter-industry trade is taking place. When Bj
tends towards 100, exports are matched by imports, and the proportion ofexchange which is an intra-industry type tends towards its maximum.
Empirical studies of various cost functions in some of the industrializedcountries have found widespread evidence of increasing returns to scale insome of the cases, due to economies of scale which in turn can generatemutually beneficial trade, even with identical factor endowments and zeroopportunities for new product developments.
One may, from the above review, conclude that there does not exist anysimple explanation or theory for the observed pattern of trade betweendifferent countries at any given point of time. It is true, more than ever before,for international trade has become in recent times a highly complexphenomenon, and the global trading system is in disarray, with the lowestinternational cooperation since World War II, and in fact under suchsituations it is quite unreasonable to expect any one explanation to accountfully for the observed pattern of trade flows. At the present juncture, what isneeded is a broad theory which may merge most of the possible explanatoryfactors into a ‘composite variable’, which makes theoretical sense and standsvery well in empirical investigation. However, on the whole, it can be said withcertainty that the neo-classical factor proportion theory which has evolvedover time comes out at the top as compared to other theories in terms ofsound theoretical framework, empirical testing, explanatory power and its usein understanding the crucial factors responsible for predicting the observedpatterns in trade and production flows, and influencing policy decisions.
From the foregoing, it is clear that the pure theory of international tradeestablishes the superiority of free trade among nations over trade withrestrictions/managed trade, i.e. of competition both in factor and goodsmarket, the invisible hand over interference. Indeed, the theory fundamentallyis an extension of the theory of optimization.
B
X – M
X + Mjj j
j j
=
×100
Globalization and sustainable development 123

Globalization, role of state and development
Under the Structural Adjustment Programme (SAP), most of the developingareas in the various regions of the world, including India, have taken, duringthe 1980s and 1990s, numerous measures in the different sectors of theireconomies (both internal and external) to integrate with the rest of the worldin order to reap the gains from global free trade based on exchange andspecialization.
In some quarters, it is thought that under the current process of reforms,the ‘state’ will have no role to play as an economic actor, which is a totallymistaken view. The role of state under perfect competition, markets,information and absence of externalities, ignoring the problem of incomedistribution, no doubt is minimal but it had and continues to play asignificant role where ‘imperfections’ exist in the market. In India andelsewhere what actually has happened during the last four decades is that thestate has attempted to do much of what it cannot or should not do and ithas done too little where it should have actually done more. Irrational policyintervention by the state in the different sectors has created seriousdistortions which in turn have reduced the overall economic and social ratesof growth. The role of the state has to be redefined. It now must providepublic services and goods, educational and infrastructural facilities, specifyclearly the rules of the game for active players, both in the private and publicsectors, provide adequate investment in human capital development, create astable macro-economic environment, as these cannot be left to market forces.This is in fact clear from the development experience of newly industrializedcountries (NIC).
The export-led growth strategy based on transnational private foreigninvestment, without doubt, paid rich dividends in the newly industrializedcountries. The high degree of openness measured in terms of ratio ofexports and imports to national income and rates of growth in exports whichare found to be statistically significant and positively correlated with thechanges in real income coupled with consistent and sound macro-economicfiscal, monetary and exchange rates, which besides minimizing numerousrigidities and distortions in the product and commodity markets (getting theprices right), discouraging rent-seeking behaviour, helped them to exploitexisting comparative advantages – all of them actively interplayed foreconomic transformation and expansion. In other words, favourable externalenvironment, ‘getting the prices right’ and ‘getting polices right’ worked in amutually reinforcing manner for their remarkable economic performance.
However, an in-depth examination of the various policies pursued by theNICs in the past reveal that the state played an active but selectiveinterventionist role through budget discipline, managing exchange rates,devising institutional frameworks marked by strong government disciplineover the private sector, and the complete commitment of the government toexports that has helped minimize the resource costs. This means that ‘getting
124 M.R. Aggarwal

prices right’, will not be enough to accelerate the process of economicgrowth in developing areas but has to be supplemented effectively by otherwell-targeted protectionist polices in the different sectors.
The global economic climate remained quite growth-conducive in the1970s to some of the countries in Asia and Latin America which had highrates of growth of real per capita product. However, it seems it will becomeless favourable and more shaky in the near future due to global paymentsand imbalances particularly of the USA, secular decline of developedcountries from lending resulting in an overall shortage of liquidity and highcost of capital, a slow-down in the worldwide aggregate real income andoutput due to past disinflationary policies. All this may further lead to atightening of the availability of capital and increased protectionism, ageneral shift from tariffs to non-tariff barriers, i.e. state participation intrade, para tariffs, specific limitations on trade flows and technical and legalregulations, and their expected unilateral intensification due to the fear ofdirect and indirect displacement in the import competing sectors havingrelatively low productivity of labour (Tables 7.1 and 7.2). Practically, wemay, if this trend continues, pass into what Friedman (1977) calls an ‘era ofmanaged trade’ from an ‘era of free trade’. In fact, a more or less similarsituation may emerge on the international scene, if appropriate economicmeasures are not taken by the super economic powers, as was witnessed afterWorld War I when trade dependency ratios increased despite a rising wave ofprotectionism. The South including India may become to a large extent thevictim of the deterioration in the world economy. Admittedly, there will bephasing out, within the next ten years (2005), of the import quotas ontextiles and clothing in place under MFA, under the final Treaty of UruguayRound of GATT negotiated at Marrakesh by 115 countries in April 1994. Atpresent there are 134 members out of which 80 per cent are developing, leastdeveloped and transition economies. At the time of the birth of GATT, therewere 23 member countries, of which 11 were from developing areas. And outof the 30 countries which are negotiating to join, all belong to under-developed countries and transition economies. However, the fact remainsthat free trade at the global level will work as an engine of economic growthonly if all forms of non-tariff barriers are reduced progressively by theNorth, and the WTO must devise effective dispute settlement procedures forcutting such abuses, keeping in view the larger interests of the relatively lessdeveloped areas.
However, there is a clear need for addressing the unfinished business of theTokyo and Uruguay Rounds, inter alia, tariff peaks and tariff escalation infood, textiles, clothing, footwear and leather industries, the postponementuntil 2005 of any meaningful removal of restraints in developing countries’exports of textile and clothing, embryonic liberalization of trade in agri-culture, abuse of anti-dumping procedures, the problem of rules of origin andtechnical standards and environmental barriers, so that the poor, the weakand vulnerable are able to partake of the benefits of global trade.
Globalization and sustainable development 125

Tab
le 7
.1Q
uant
um o
fta
riff
s an
d no
n-ta
riff
barr
iers
(be
fore
and
aft
er t
he U
rugu
ay R
ound
),19
88–1
995
(per
cent
ages
)
Sec
tor
US
AE
UJa
pan
Can
ada
1988
1993
Uru
guay
1988
1993
Uru
guay
1988
1993
Uru
guay
1988
1993
Uru
guay
Rou
ndR
ound
Rou
ndR
ound
Raw
mat
eria
l6.
04.
83.
116
.41.
87.
78.
97.
64.
95.
23.
71.
6
Agr
icul
ture
,5.
43.
52.
718
.021
.195
11.1
10.4
7.0
6.4
4.4
2.3
fore
stry
and
fishi
ng
Min
ing
and
2.3
2.3
2.3
0.0
3.7
4.2
3.5
0.4
0.4
0.4
0.7
0.7
quar
ryin
g
Man
ufac
turi
ng8.
16.
73.
716
.820
.39.
211
.910
.76.
96.
52.
10.
2
Sem
i-fin
ishe
d33
.332
.211
.134
.029
.43.
127
.627
.126
.715
.313
.10.
8m
anuf
actu
ring
good
s
Fin
ishe
d22
.021
.87.
923
.724
.24.
25.
33.
72.
38.
78.
92.
0m
anuf
actu
ring
good
s
All
prod
ucts
24.1
23.6
8.5
25.9
25.2
4.3
13.7
12.6
11.1
10.3
9.5
1.6
Sou
rce:
Mic
hael
Dal
y an
d H
iroc
ki K
uwah
aran
,‘T
he im
pact
of
the
Uru
guay
Rou
nd o
n ta
riff
s an
d no
n-ta
riff
barr
iers
to
trad
e’,T
he W
orld
Eco
nom
y,vo
l 111
,no
.2,1
998.

Tab
le 7
.2Q
uant
um o
fta
riff
s (b
efor
e an
d af
ter
the
Uru
guay
Rou
nd),
1988
–199
5 (p
erce
ntag
es)
Sec
tor
US
AE
UJa
pan
Can
ada
1988
1993
Uru
guay
1988
1993
Uru
guay
1988
1993
Uru
guay
1988
1993
Uru
guay
Rou
ndR
ound
Rou
ndR
ound
Raw
mat
eria
l3.
23.
32.
56.
06.
08.
43.
83.
83.
83.
43.
33.
4
Agr
icul
ture
,3.
84.
13.
28.
58.
59.
35.
15.
14.
03.
63.
53.
5fo
rest
ryan
d fis
hing
Min
ing
and
1.0
1.0
0.3
0.8
0.8
0.3
0.5
0.3
0.3
2.7
2.8
0.7
quar
ryin
g
Man
ufac
turi
ng2.
32.
31.
85.
25.
49.
23.
43.
42.
72.
52.
44.
2
Sem
i-fin
ishe
d7.
07.
03.
87.
37.
34.
46.
66.
84.
89.
99.
44.
0m
anuf
actu
ring
good
s
Fin
ishe
d6.
36.
64.
37.
88.
18.
07.
87.
85.
29.
89.
65.
8m
anuf
actu
ring
good
s
All
prod
ucts
6.2
6.4
4.0
7.5
7.6
6.1
6.9
7.0
4.8
9.1
8.9
5.0
Sou
rce:
Mic
hael
Dal
y an
d H
iroc
ki K
uwah
aran
,‘T
he im
pact
of
the
Uru
guay
Rou
nd o
n ta
riff
s an
d no
n-ta
riff
barr
iers
to
trad
e’in
Qua
d,T
he W
orld
Eco
nom
y,vo
l 111
,no.
2,19
98.

The rate of growth of an economy, in terms of Solow and Swan’s neo-classical growth model and Harrod and Domar’s growth model, given thecapital–output ratio, will be largely influenced by the ratio of savings to realincome (S/Y) which in turn will determine the required amount of investmentin order to realize planned rates of economic growth on the assumption thatsavings will be productively used. And obviously, a decrease in the requiredlevel of investible resources due to either external or internal factors wouldlead to a fall in the rate of growth. But the adverse impact of a lower volumeof investment could be mitigated by achieving a greater ‘efficiency’ in the useof scarce investment resources, partly through a reduction in the capital–output ratio. Output and exports of manufactures and semi-manufacturesproduced efficiently would find easy and ready markets in the highlycompetitive markets of the West where the South is simply a price taker. Infact, increasing efficiency in the use of resources in various sectors of theeconomy, combined with productivity, should become the centre of broadeconomic policy and management in the South. What it actually means is thatmarket-oriented friendly policies will act as an engine of economic growthwith greater force, through the deepening of structural reforms at the ‘internallevel’. Some of the possible interrelated measures, i.e. a balance betweenincrease in productivity and increase in real wage rate, maintaining realisticand competitive exchange rates and price stability, which could be takenwithout much effort, would go a long way in meeting the desired objectives.
One of the most pervasive and characteristic features of the 1980s hasbeen the remarkable renaissance of ‘regionalism’, through the formation oftrade blocks in Europe, North America and South and South-East Asia. TheUSA, within four decades after World War II, remained firmly committed tomultilaterism but was opposed to regionalism. However, negotiations forforming a Canada–USA free trade agreement were initiated in 1983 and theprocess was completed in 1988. Later on, NAFTA, comprising the USA,Canada and Mexico and APEC (1989), a loose grouping of 18 Pacific Rimcountries including the USA, Japan and China, came into existence in orderto promote free trade among themselves. In 1994, the APEC memberscommitted themselves to form a FTA by 2010 for the higher-incomecountries. The USA also aimed to form a FTA embracing 34 democracies inthe Western Hemisphere (except Cuba) by 2005. The EC was enlarged from9 members to 12 in 1986 and 15 in 1994. Now the group is having a commoncurrency, the Euro. The world in fact is witnessing a paradoxical situation.As the pace of globalization is gaining momentum, the urge among thecountries all over the world to club together at regional level is becomingstronger (Tables 7.3, 7.4 and 7.5). According to the WTO, it has been notifiedof almost 180 regional trade arrangements. India is not a member of any ofthese groups except SAPTA, where the volume of intra-regional trade isvirtually negligible. In fact under SAPTA, all the members have practicallyagreed to disagree on all major issues during the last decade. It would be verydifficult for the developing areas under these circumstances to increase their
128 M.R. Aggarwal

Globalization and sustainable development 129
Table 7.3 Regional free trade arrangements, share of world trade, 1994
Group % share
EU 22.8Euro Med 2.3NAFTA 7.9Mercosur 0.3FTAA 2.6*AFFTA 1.3Australia – New Zealand 0.1APEC 23.7
Total 61.0
Source: C. Fred Bregsten, Foreign Affairs, May/June 1996.
Note: *Excluding sub-regions.
Table 7.4 Economic regional arrangements (1987–1990) by number of arrangements
1987 1988 1989 1990
By sectoral composition
Steel 38 52 50 39Agricultual and food products 20 55 51 59Automobiles and transport equipment 14 17 20 23Textiles and clothing 28 72 66 51Electronic and Clothing 11 19 28 37Footwear 8 14 18 21Other 15 32 56 54Total 134 261 289 284By protected markets
European Community 69 137 173 n.aUnited States 48 62 69 n.aJapan 6 14 14 n.aOther industrial countries 11 47 32 n.aEastern Europe – 1 1 n.aTotal 135 260 288By restrained exporters
Japan 25 34 70 n.aEastern Europe 20 45 41 n.aKorea 24 25 38 n.aOther industrial countries 23 59 57 n.aOther developing countries 42 98 83 n.aTotal 134 255 289
Source: Harold Sander and Andras Inotai (ed.) World Trade after the Uruguay Round,Prospects and Policy Options for 21st Century.

rates of growth of exports, hence income, in the markets of G-3 despite alltheir efforts to integrate with the emerging world trading system. Though theGATT has sanctioned the formation of such regional groups under itsarticle XXIV, ‘regionalism’ violates the central principle of GATT of non-discrimination and certainly cannot go hand in hand with the spirit of globalinternationalization. In such a situation, the importance of increasing intra-regional trade in the developing areas currently is immense as it wouldpromote their collective economic growth, besides increasing and furtherstrengthening the sense of unity and solidarity. According to Aggarwal thereexists a vast scope for expanding intra-regional trade which is extremely lowin the various groupings despite so many years of regional economiccooperation. The lack of complementarity and its potential erosion throughthe erection of tariffs and non-tariff barriers in production structures,following the self-sufficiency policies in the basic and capital goods sectors,
130 M.R. Aggarwal
Table 7.5 Growth in regional trade agreements, 1940–1990
1 Number of arrangements
Signatories over time 1940s 1950s 1960s 1970s 1980s 1990s
Western Europe 0 1 4 13 3 8North Africa/W. Asia 0 0 1 0 0 0Latin America 0 2 3 1 2 1Asia/Oceana 0 1 3 3 2 3North America 0 0 0 0 1 1Sub-Saharan Africa 1 1 3 0 0 1C. & E. Europe 0 0 0 0 0 21
2 Inter-regional trade agreements entering into force
Signatories over time 1940s 1950s 1960s 1970s 1980s 1990s
Western Europe and C.E. Europe 0 0 0 5 1 37
Western Europe and North Africa/W. Asia 0 0 4 21 0 3
Western Europe and Sub-Saharan Africa 0 0 1 2 0 0
Western Europe and others 0 0 1 2 2 1
Oceana and Sub-Saharan Africa 0 1 0 0 0 0
North America and Latin America 0 0 0 0 1 2
North America & N. Africa/West Asia 0 0 0 0 0 5
C.E. Europe & N.Africa/W. Asia 0 1 1 1 1 0
Source: Harold Sander and Andras Inotai (ed.) World Trade after the Uruguay Round,Prospects and Policy Options for 21st Century.

are the most important internal factors explaining the low level of intra-trade. This is quite in evidence from the low and declining values of theindex RCAX/RCAM (take the case of SAARC) given by Balassa and TradeIntensity Index (TII), where
and trade intensity index of country i with country j:
where XK,i is the export of product K by country i, Xi is the total exports ofcountry i, XK,w is the world exports of product K, XW is world exports, MK,i
is the import of product K by country i, Mi is total imports of country i,MK,w is world imports of product K, and MW is world total imports. Xi,j, Xi,
Mj, Mw and Mi represent exports of country i to country j, total exports ofcountry i to total imports of country j, total world imports, and imports ofcountry i respectively.
There is no general agreement on the precise meaning of sustainabilitybut it is taken to mean in some quarters improving the quality of human lifewhile living within the carrying capacity of supporting eco-systems, i.e.assets such as the ozone layer, fertile soil and healthy wetlands which provideservices people rely on to live and which we do not know how to replace.Another definition focuses on balancing social, economic and ecologicalgoals, and aims at meeting a broad range of human needs and aspirations,including health, literacy and political freedom as well as purely materialneeds. Sustainable development, however, according to the BrundtlandReport (1987), is an alternative design for development which by definition isenvironmentally benign and eco-friendly, i.e. those who reap the fruits ofeconomic development today must not make future generations worse off byexcessively degrading the earth, using its exhaustible resources and pollutingits ecology and environment; it states that the resultant economicdevelopment which erodes natural capital has catastrophic consequences.This concept now has been recognized as a ‘true index’ of development ascompared to the traditional one-dimensional measure of development – realincome per capita – which has been replaced by the Physical Quality of Life(PQLI) index, based on basic human needs. This is based on recognition ofthe fact that pollution of the environment by various types of acidsgenerated as a result of the speeding up of the process of industrializationand exports has altered the chemistry of the atmosphere at a rapid pace, andgiven rise to various social costs which are only noted after a certain time.
TII =
−
X
X
M
M Mi,j
i
j
W i
RCAXX
X
X
X
RCAMM
M
M
M
K,i
i
K,w
w
K,i K,w
w
=
=
i
Globalization and sustainable development 131
Bhagwati (1993) is of the view that globalization and internationalizationof trade and capital through the entry of MNCs, GATT (now WTO) andNAFTA will not upset the balance between economic progress and ecologyand will in fact promote growth in the long run. On the other hand, HermanE. Daly of the World Bank and followers assert that growth flowing fromfree trade will harm both environment and welfare. This seems to be partlytrue as the unrestricted operation of the MNCs may become the primethreat to environment due to (i) ‘greenhouse effect’ and (ii) their ability tolocate their plants in developing areas in order to escape the strict environ-mental standards imposed by their own countries, (iii) having control ofmore than 70 per cent of traded goods and 80 per cent of the total worldland devoted to export-oriented crops; (iv) major users of fossil fuels whichrelease carbon dioxide in the atmosphere. The irresponsible use of heavyequipment, indiscriminate cutting of forests and widespread serial sprayingand sale of domestically banned, outdated and dangerous chemicals must beblamed on MNCs having monopoly power over natural resources. Second,the developing countries in fact may be pressurized into over-exploiting theirnatural resources in order to meet external financial obligations which havegrown exponentially, and to increase exports. And it is regrettable that noexisting theory of trade and the WTO (established in January 1995) takesinto account adequately the dimension of sustainable development.
The main objective of liberalization and globalization at present is toachieve infinite growth in a world of finite resources, which is neitherpossible nor desirable. Hence, protection of the environment must be a part ofthe guiding principles of the WTO as most of the developing countries havebecome its members. Also it immediately calls for an active role of the state,both at the national and international level, to minimize the negative impact,i.e. hidden social and environmental costs of excessive trends towardsglobalization. In order to achieve these objectives, a major responsibility lieson the shoulders of advanced economies to develop new, gentle and eco-logically sustainable technologies, i.e. technologies which maximize theproductivity of natural resources and not of labour, so that nature’s infinitestore-house is not exhausted. The North must set positive examples for theSouth showing that it is possible to reconcile economic prosperity withenvironmental problems. It is important to note in this connection thatthough it is a mistake to expect to achieve too many objectives with the helpof the WTO, some beginning could be made in this direction.
The suggestions of T.N. Srinivasan (1999) in this regard, that the Trade-related Intellectual Property Rights (TRIPS) may be taken out of the WTOand handled by the World Intellectual Property Organisation (WIPO), thatthe Committee on Trade and Environment (CTE), whose main aim is simplyto identify between trade measures and environmental concern, be wound upand that the issue of environment be tackled by UNEP, and that labour beexcluded from the purview of GATT and handled by ILO, will go a long wayin satisfying the aspirations of the South. He further opines that the issue of
132 M.R. Aggarwal

regional arrangements could be dealt with by introducing a ‘sunset clause’whereby preferences available to members of the regional group against theworld be extended to all the WTO members in, say, five years. Lastly, hesuggests that agricultural trade could be brought under GATT very easilywithout changing the main structure of the WTO.
Towards some generalizations
Several broad generalizations may be derived from the foregoing analysis. Thefinal success of the policies of globalization and market-oriented reforms,from the point of view of the South’s overall economic and social growth andthe revitalization of the future world trading order, will, to a great extent,depend on a marked improvement in the global macro-economic environ-ment, making it conducive to sustainable development. The spread ofrecovery from the USA to the rest of the North is vital to ease the costs ofthe adjustment process. Success also depends on the will of the industrializedcountries to reduce non-tariff barriers and overcome internal structuralimpediments to growth by maintaining low rates of inflation and interestand adjusting their macro-domestic policies consistently with those of otherdeveloped countries. The creation of such a global framework, of coopera-tion rather than confrontation, would contribute towards support of thewider interests of the South. All this needs to be coupled with a strongcommitment and concerted efforts by the South to extend and deepenongoing internal and external reforms and to increase intra-regional tradethrough the progressive elimination of tariff and non-tariff barriers. Thus byavoiding inappropriate trade liberalization and pursuing programmes ofcomplementary expansion, world trade can create a favourable climate forgood governance.
References
Aggarwal, M.R. (1992) ‘Prospects of trade expansion in the SAARC region’, TheDeveloping Economies, vol. 30, March: Tokyo.
Arrow, K.H., H. Chenery, B. Minhas and R. Solow (1961) ‘Capital laboursubtitution and economic effeciency’, Review of Economics and Studies.
Balassa, Bela (1963) ‘An emperical demonstration of classical comparative cost’,Review of Economic Statistics, vol. 45, pp. 231–8.
—— (1965) ‘Tariff protection in industrial countries: an evaluation’, Journal ofPolitical Economy, vol. 1, no. 23, pp. 579–94.
—— (1968) ‘Tariff protection in industrial countries and its effects on the exports ofprocessed goods from developing countries’, Canadian Journal of Economics, no.1, pp. 583–94.
Bhagwati, J. (1964) ‘On the equivalence of tariffs and quotas’, in Walter Laqueur(ed.) Trade Tariffs and Growth, London: Weidenfeld and Nicholson.
—— (1971) ‘The pure theory of international trade: a survey’, in Walter Laqueur(ed.) Trade, Tariffs and Growth, London: Weidenfeld and Nicholson.
Globalization and sustainable development 133

—— (1991) The World Trading System at Risk, Princeton: Princeton University Press.Bhardwaj, R. (1962) ‘Factor proportions and the structure of Indo-US trade’, Indian
Economic Journal, vol. 10.Cairnes, J.E. (1874) Some Leading Principles of Political Economy, London:
Macmillan.Ellsworth, P.T. and Leith J. Clark. (1975) The International Economy (5th edition),
New York: Macmillan.Friedman, M. (1977) ‘Nobel lecture: inflation and unemployment’, Journal of
Political Economy, vol. 1, no. 35, pp. 451–72.Grubel, H.G. and H.G. Johnson (eds) (1971) Effective Tariff Protection, Geneva:
Graduate Institute of International Studies.Grubel, Herbert and Peter Lloyd (1975) Intra-Industry Trade, London: Macmillan.Haberler, G. (1950) ‘Some problems in the pure theory of international trade’,
Economic Journal, vol. 1, no. 10, pp. 223–40.—— (1961) A Survey of International Trade Theory, Special Papers in International
Economics, no. 1, Chapter II, Princeton: Princeton University Press.Heckscher, F. (1919) ‘The effects of foreign trade on the distribution of income’,
Ekonomiske Tidskrift, reprinted in H. Ellis and I.A. Metzler (eds) (1948) Readingsin The Theory of International Trade, Homewood: Illinois, Irwin.
Hufbauer, Garry C. (1966) Synthetic Materials and the Theory of International Trade,London: Duckworth.
Hufbauer, G. and J. Chilas (1974) ‘Specialisation by industrial countries: extent andconsequences’, in H. Gierschfed, The International Division of Labour : Problemsand Perspective, Tubingen: J.C.B. Mohr.
Johnson, Harry (1950) ‘Optimum Welfare and Maximum Revenue Tariffs’, Review ofEconomic Studies, vol. 19, pp. 28–35.
—— (1954) ‘Optimum tariffs and retaliation’ Review of Economic Studies, pp. 142–3—— (1955) ‘Economic expansion and international trade’, Manchester School of
Economic and Social Studies, vol. 23, pp. 95–112.Krause, L.B. (1959): ‘U.S. imports and the tariff ’, American Economic Review, vol.
49, pp. 542–51.Kravis, Irwin B. (1970) ‘Trade as a handmaiden of growth. Similarities between the
19th and 20th centuries’, Economics Journal, vol. 80, pp. 850–72—— (1984) ‘Comparative studies of national income and prices’, Journal of
Economic Literature.Krueger, Anne (1974) ‘The political economy of the rent seeking society,’ American
Economic Review vol. pp. 64, 291–303.Krugman, Paul (1979) ‘Increasing returns, monopolistic competition and inter-
national trade’, Journal of International Economics, vol. 9, pp. 469–79.Learner, Edward E. (1980) ‘The Leontief paradox re-examined’, Journal of Political
Economy, vol. 88, pp. 495–503Learner, A.P. (1953) Essays in Economic Analysis, London: Macmillan.Leontief, Wassily (1953) ‘Domestic production and foreign trade: the american
capital position re-examined’ Economia Internationale, vol. 7, pp. 3–32.Linder, Staffan (1961) An Essay on Trade and Transformation, New York: John Wiley.Lipsey, R.G. and K. Lancaster (1956–7) ‘The general theory of second best’, Review
of Economic Studies, vol. 24, pp. 11–32.MacDougall, G.D.A. (1951) ‘British and American exports. A study suggested by the
theory of comparative costs, part 1’, Economic Journal, vol. 61, pp. 697–724.
134 M.R. Aggarwal

Meade, J. (1952) The Theory of International Economic Policy, vol. 1. The Balance ofPayments, London: Oxford University Press.
Mills, J.S. (1937) Principles of Political Economy, London: Longman Green.Minhas, B.S. (1962) ‘The homohypallagic production function, factor intensity,
reversals and the Heckscher-Ohlin Theorem’, Journal of Political Economy, vol. 1,no. 60, pp. 138–56
Ohlin, B. (1933) Inter-Regional and International Trade, Cambridge, MA: HarvardUniversity Press.
Panchmukhi, V.R. (1993) ‘The emerging international trading order’, RIS Digest,September.
Posner, M.V. (1961) ‘Technical change and international trade’, Oxford EconomicPapers, vol. 13, pp. 333–41.
Ricardo, David (1817) The Principles of Political Economy and Taxation, London:Dent edition 1973.
Samuelson, Paul (1939) ‘The gains from international trade’, Canadian Journal ofEconomics and Political Science, vol. 5, pp. 195–205.
—— (1948) ‘International trade and the equalisation of factor prices’, EconomicJournal, vol. 1, no. 8, pp. 163–84.
Smith, Adam (1937) The Wealth of Nations, New York: Modern Library.Sriniwasan TN (1999) WTO Symposium on Trade and Development, 17–18 March.Stern, Robert M (1975) ‘Testing trade theories’, in P.B. Kenen (ed.) International
Trade and Finance, Cambridge: Cambridge University Press, pp. 3–49.Stolper, F. and P.A. Samuelson (1941) ‘Protection and real wages’, Review of
Economic Studies.Tatemoto, M. and S. Ichimura (1959) ‘Factor proportions and the foreign trade. The
case of Japan’, Review of Economics and Statistics, 41, pp. 442–8.Torrens, R. (1808) The Principles and Practical Operation of Sir Robert Peels Act of
1844 Explained and Defended, 3rd edn, London: Longman.Uzawa, H. (1959) ‘Prices of factors of production in international trade’,
Econometrica, vol. 27, pp. 448–68.Vanek, Jaroslav (1959) ‘ The natural resources content of foreign trade (1870–1955)
and the relative abundance of natural resources in the USA’, Review of Economicsand Statistics, pp. 146–53.
Vernon, Raymond (1979) ‘The product cycle hypothesis in a new internationalenvironment’, Oxford Bulletin of Economics and Statistics, vol. 41, pp. 255–6.
Wahl, D.F. (1961) ‘Capital and labour requirements for Canada’s foreign trade’,Canadian Journal of Economics and Political Science, vol. 27, pp. 349–58.
World Bank (1993) The East Asian Miracle Economic Growth and Policy, Oxford:Oxford University Press.
Globalization and sustainable development 135

8 Knowledge, technology transfer and multinational corporations
Shankaran Nambiar
Introduction
Technology transfer poses interesting challenges to the economist in view ofthe profound implications it generates. The multiplicity of issues thattechnology transfer impinges upon gives it, in large part, its importance. Thisis particularly so since the areas it affects are important to an economy. Onefundamental issue that arises as a consequence of technology transfer is thatof global markets. Those early commentators, Marx and Engels (1967:81–4), accurately anticipated that with modern industry we would have the‘universal inter-dependence of nations’. They further added: ‘The intel-lectual creations of individual nations become common property.’
Although Marx and Engels were not referring directly to technologytransfer, their remarks could very well apply to technology transfer. As amatter of fact, it is increasingly realised that knowledge is the cornerstone ofgrowth. Zysman and Cohen (1983) note that the newer technologies such asinformation processing form the industrial infrastructure for economies,assuming the importance that roads and bridges played during the industrialrevolution. Knowledge and information are the basis for technology. Whilesome aspects of the knowledge and information that constitute technologycan be concealed, with technology transfer other aspects become ‘commonproperty’.
In Schumpeter’s analysis (Schumpeter 1934) innovators and innovationare central sources of economic growth. Changes to knowledge assume therole of bringing improvements in the efficiency of firms and industries.Schumpeter’s characterisation sees periodic waves of innovation in thecapitalist system, where newer technologies act as the engine for replacingolder, inefficient firms and industries with more efficient firms and industries.
The theme of knowledge as the stimulus for growth takes a new form inRomer’s formulation of growth. Romer (1986, 1994) and Lucas (1988) arguein favour of the endogenity of growth. The new growth theorists realise thatincreases in output are the outcome both of physical and human capital.Knowledge in its various manifestations, as education, research and develop-ment, skills and training, influences and determines human capital, resulting
136

ultimately in technological progress. The role of knowledge, via humancapital, is quite distinct from changes in physical capital, which is exo-genously determined.
This chapter examines the phenomenon of technology transfer from theviewpoint of the economics of knowledge. The first section will discussaspects of knowledge that are useful in building a construct with whichtechnology transfer can be analysed. The second section will introduce therole of multinational corporations (MNCs) as a site on which knowledgeand learning occur. The third section will go further to examine the role ofMNCs in the transfer of technology. The fourth section will list the variouschannels through which technology transfer can take place. The purpose ofdoing this is to consider in some detail, in the fifth section, the loss ofinformation that comes about through technology transfer. Finally, someconcluding remarks will be made.
Modelling knowledge
Paul David’s (1993: 216) Simplest Linear Model (SLIM) perceives thegeneration of knowledge as taking a linear causal sequence in which,
(1) fundamental science yields discoveries, which lead to (2) experi-mental findings of applied science, which leads to (3) acts of invention,which provide stimuli and basis for (4) entrepreneurial acts ofinnovation (commercial introduction of novel products and productionmethods), which incite (5) imitation and so bring about (6) diffusion ofthe new technology into general use.
(David 1993: 216)
The SLIM model emphasises the importance of research, experimentationand reverse engineering. The foundations of knowledge generation would beabsent if countries did not invest sufficiently in research and development(R&D). The trajectory taken in developed countries might follow the SLIMmodel quite closely, leading ultimately to Step 6, where the diffusion oftechnology extends to the transfer of technology. It can be argued thatknowledge is generated differently in developing countries, where newlyindustrialising countries (NICs) learn from the diffused technology thatoriginates from developed countries (Nambiar 1996). NICs can imitate thetechnology available in developed countries, and by imitation can learn touse the technology, thus acquiring the knowledge associated with technologythat has been learnt through imitation.
Romer (1994: 12), by asserting that ‘technological advance comes fromthings that people do’, draws attention to the fact that technologicaladvancement comes not just from the formal research that is conducted inlaboratories but through the informal learning processes that accompany thegeneration of knowledge. Romer’s assertion can be understood more clearly
Knowledge, technology transfer and MNCs 137

if we consider David’s (1993) distinction between ‘structured’ and ‘tacit’knowledge. Structured knowledge is knowledge that comes in codified formsand can be represented as research reports, journal articles and formulae.
Blueprints, circuit diagrams and manuals are further examples of struc-tured knowledge. Structured knowledge must, however, be complementedwith tacit knowledge. Tacit knowledge is knowledge resulting fromexperience and practice. It is the kind of knowledge that comes out ofexposure to routines, through experience, and from learning by observationand learning by doing.
The different ‘things that people do’ to bring about technologicaladvancement would include creating a technology policy, creating highereducational levels in science and technology and, most importantly,facilitating the exchange of knowledge. At one level it is necessary that thoseparticipating in the creation and extension of knowledge share in a commonlanguage of codes, conventions, symbols and assumptions. At another level,it is necessary that there be a culture that enables structured knowledge to belearnt and transmitted. In order that this be done, knowledge has to beexperientially acquired, transferrred by demonstration in a contextualsetting, and absorbed.
The MNC is a crucial conduit for learning and the transfer of knowledge.In this regard MNCs have an interesting role to play since their production isglobally dispersed, their markets are equally spread out, and learning andthe transfer of knowledge (or more specifically, technology, in this case) isjust as global in nature. In spite of the extent of dispersion, the process oftechnology transfer is governed by economic rationality. Profit maximisationremains the central objective of MNCs with the costs of (and benefits from)the loss of knowledge being a decisive factor in determining the decision totransfer technology.
MNCs and the transfer of technology
Hymer correctly observed the growth and development of the MNC. Herealised the logical necessity of such an organisation and noted the roleMNCs had to play in the development of capitalism. Hymer (1972: 60)commented that:
[t]he multinational corporation, because of its great power to planeconomic activity, represents an important step forward over previousmethods of organizing international exchange. It demonstrates the socialnature of production on a global scale. As it eliminates the anarchy ofinternational markets and brings about a more extensive and productiveinternational division of labour, it releases great sources of latent energy.
With the advent of the internationalisation of capital and MNCs, theoverlap between the nation-state and the territorial extent of the firm has
138 Shankaran Nambiar

ceased to coincide. As far as international markets are concerned, MNCsare in the best possible position to plan activity since their activities spanover several geographical territories and relevant markets.
This is not to say that nation-states as atomic units have no use. It mightbe useful at this point to mention that Murray (1971) distinguishes six statefunctions: (1) guaranteeing property rights, (2) encouraging economicliberalisation, (3) providing economic ochestration, (4) ensuring theprovision of inputs, (5) intervening for social consensus, and (6) managingthe external relations of a capitalist system.
It is obvious that without the involvement of the state, technologycannot be developed. Murray acknowledges, for instance, the contributionof the state to R&D expenditure. In recent years, the developed countrieshave been making valiant efforts to promote liberalisation throughinternational organisations such as APEC, GATT, and more recently,through the WTO.
Having mentioned that the nation-state does have its role to play insupporting the economy, it follows that by effectively performing itsfunctions the state encourages the growth of MNCs. As mentionedpreviously, it is nonetheless the responsibility of MNCs to integrate theiractivities across geographical space. It is in recognition of this fact that aglobal industry is defined as one where there is ‘some competitive advantageto integrating activities on a worldwide basis’ (Porter 1986: 19).
In response to this definition, it is noteworthy that Kobrin (1991: 31–2)suggests three sources through which MNCs gain strategic advantages.First, MNCs can take advantage of the factors of production that areglobally available, selecting resources that are cheaper. Second, centrallycontrolled multinational operations enable MNCs to provide
sources of competitive advantage such as the ability to transfer learningacross markets, increased returns to basic R&D, exploitation of ambig-uous national jurisdiction, subsidization across markets, diversificationin terms of adverse economic or political conditions in individualcountries, and the ability to scan for new technologies or market oppor-tunities worldwide.
(Kobrin 1991: 31; italics added)
Third, it is only MNCs that are able to take advantage of the economiesof scale of markets in many countries, rather than national markets whichare too small to support efficient business activity.
MNCs and nation-states work in tandem to increase an economy’scompetitive advantage. The state provides necessary conditions such as therequired institutional structure (property rights, laws), the global environmentof liberal economic exchange (free markets, removal of barriers to trade andexpatriation of funds), and domestic support for the growth of knowledge(funding of universities, R&D). With these necessary conditions in place, the
Knowledge, technology transfer and MNCs 139
MNCs then utilise them so as to create their competitive advantage.Knowledge and learning are important factors in this scheme of affairs.
The globalisation of production carries with it the implication of theglobalisation of knowledge. Fundamental education and research are,generally, undertaken in developed countries. This knowledge is thenacquired by MNCs in the developed countries, which build upon what theyhave acquired for their industrial and commercial purposes. The trans-mission of knowledge can, subsequently, take two routes: (1) the exchange ofknowledge between two MNCs, or (2) the exchange of knowledge betweenan MNC and its subsidiary.
MNCs can develop their strategic advantage by forming alliances withactual or potential competitors. The stronger and more confident MNCsrealise that globalisation is a process that cannot be denied. It would bepossible, in the short term, for a developed country to insulate itself fromany technology transfer leakages; but that would, in the same stroke, act as abarrier to the inflow of knowledge. Simon (1991: 17) persuasively remarks:
one could argue that it is counterproductive for any country, especiallythe United States, to spend the energy to close its borders and to try toshut off the multiplicity of technology transfer mechanisms that haveproliferated over the last decade or so. After all, from the Americanperspective, a good argument could be made that it has in fact been thecontribution of foreigners, studying and conducting research in the USin both science and engineering, that has been a primary source ofAmerican technological advance.
If MNCs are to adopt an open policy, then they would be more robust ifthey cooperated at least on the basis of knowledge-related joint ventures.MNCs can form alliances by trading their specialised skills. They canexchange their technological developments, or gain access to patents,licences, customer markets, raw materials and other inputs.
MNCs such as Phillips, Toshiba, Motorola and Boeing have been knownto have forged inter-firm ventures where the objective of enriching their know-ledge bases was, in some way, a consideration. Most significant, perhaps,have been the strategic alliances and partnerships in the informatics sectorwhich has witnessed a large number of accords being signed betweenWestern European countries and Japan. The United States has formedalliances with Japan, South Korea and Taiwan.
An interesting example of the exchange of knowledge is that involvingMotorola of the United States and Toshiba of Japan in 1987 (Simon 1991:19). The nature of the exchange involved Motorola transferring its micro-processor technology to Toshiba, in return for which Toshiba was supposedto pass on its memory technology to Motorola. That aspect of the exchangerevolved around enhancing the respective knowledge capabilities of the twoMNCs. This was supplemented by a purely commercial exchange, where
140 Shankaran Nambiar

Toshiba was expected to assist Motorola in expanding its sales into theJapanese electronics market. This exchange indicates the extremely sensitiveposition that knowledge possesses, and the risks that MNCs must be pre-pared to take if they are to develop their mutual technological capabilities.
Having established the important role that MNCs have to play in thetransfer of technology, we need to consider the possible processes throughwhich technology transfer occurs. The next section provides such afoundation, so that we may draw upon this to analyse the resulting loss ofinformation due to technology transfer and assess its economic impact.
Channels of technology transfer
One possible framework for categorising the transfer of technology is basedon the different channels through which the process can take place. Enos etal. (1997) enumerate foreign direct investment, joint ventures, subcontract-ing, strategic alliances, South–South transfers and international agencies asroutes through which technology can be transferred. Mansfield (1995: 146)notes that the export of goods is one important channel of technologytransfer. This is made possible because the exporters will help the buyers oftechnology to use it efficiently, perhaps by imparting appropriate training.The export of goods makes imitation and reverse engineering possible. Asecond channel is through licensing agreements (i.e. patents, trademarks, andtechnical assistance). Joint ventures provide a third channel for technologytransfer. Finally, in Mansfield’s scheme, the establishment and utilisation ofsubsidiaries overseas lays the ground for the transfer of knowledge throughtraining by assisting in upgrading technology and by extending technicalinformation and capabilities.
Foreign direct investment and the export of goods are channels of tech-nology transfer where the process of technology transfer is completelyunintended. These routes have been known to provide the impetus forimitation and reverse engineering. Other routes through which technologytransfer can occur, that is, through licensing agreements and the establish-ment of subsidiaries overseas, will result in transfer mechanisms that arepredictable. In fact, the nature of production, with the advent of increasingautomation and flexible production systems, has necessitated subcontractinglinks, which, in turn encourages technology transfer.
A study undertaken by Narayanan et al. (1994) confirms the huge role ofknowledge in technology transfer. This study also models a possible pathwaythrough which knowledge is transferred. Narayanan et al. propose a four-stage framework involving: (1) the importing and adoption of foreigntechnology, (2) the acquisition of operating, maintenance and repair skills,(3) innovation, and (4) the diffusion of technology. This model clearlyindicates that access to technology (by the adoption of foreign technology) isthe precondition for any learning to take place. Once access to technology isguaranteed, then the development and growth of knowledge can take place.
Knowledge, technology transfer and MNCs 141

By using and implementing technical sequences, even if this be done only byinstruction, workers acquire structural and tacit knowledge. At this stage thepractical dimension of knowledge is cultivated since workers are able toprogress beyond the ambit of technical articles, textbooks, manuals andcircuit diagrams that exist outside of a practical manufacturing context. Theprocess of knowledge acquisition is seen to deepen if it is possible to applywhat has been learnt, to extend the principles and techniques that have beenlearnt, and to modify and innovate in order to adapt to changing situationsor circumstances. The ultimate test of having fully acquired knowledge isexhibited when a firm is in a position to distribute the knowledge it nowpossesses to other firms.
The growth of MNCs and the proliferation of markets and productionacross the globe have resulted in the dispersion of knowledge. Althoughstates, too, participate in technology transfer, MNCs have a particularlysignificant contribution to make. The acquisition of knowledge and itsdiffusion are central to the process of technology transfer. But while MNCsneed to encourage technology transfer for their own profit-maximisationpurposes, they are nonetheless subject to information loss.
Technology transfer and information loss
Technology transfer implies the loss of information to the firm that origin-ally was in possession of a bundle of knowledge. Whether it be informationthat is acquired through reverse engineering, imitation or subcontracting, theknowledge that is gained by the follower firm is information lost for the firmthat was the technology leader. In the case of information that is lost as aconsequence of goods that a firm exports – goods that a firm in theimporting country can disassemble and thereby gain valuable knowledge –there is little that can be done. To perfectly conceal such knowledge it wouldbe necessary to protect the commodity from falling into the hands of anypotential competitor, an impracticable solution.
In the case of knowledge that an MNC willingly transfers as technology,as in franchising or in the case of information that is predictably lost insubcontracting, the MNC has some measure of control. Yet, if a firmdecides to enter into a relationship that entails technology transfer it isbecause the firm that transfers knowledge finds that its marginal benefitis at least equal to the additional cost incurred from transferring anadditional unit of knowledge (Narayanan 1992). If in spite of the cost to afirm due to the information lost the firm still decides to support the growthof ancilliary firms, it is because of factors such as the high cost ofimporting raw materials, the objective of keeping inventory levels low andthe need to get a quick supply of inputs from ancilliary firms (Rasiah 1989,1994).
Nevertheless, technology transfer often does not result in any loss ofdominance to an MNC because the ancilliary firms that supply the MNCs
142 Shankaran Nambiar

with their requirements do not have the requisite capital or expertise toduplicate the entire range of operations that an MNC typically possesses.
Understanding the nature of information loss in technology transfer ismade clearer if it is recognised that there is, at one end of the spectrum, asubset of information that an MNC would possess which is fairly obvious,routine and non-exclusive (Nambiar 1997b). This variety of information issought out by technology followers; it is information that can be costlesslyacquired by most firms. Firms would make no effort to protect the safety ofsuch information, and little will be done to protect the loss of informationfrom this subset. It would, in fact, be cost-ineffective to attempt to control ormonitor information loss arising from this category of knowledge.
At the other end of the spectrum of knowledge exists information that ishighly valued and extremely specialised. Information such as this is highlyexclusive; and possession of such knowledge is what gives a firm its monopo-listic advantage. This category of information requires an investment if it isto be protected. A firm would find it economically rational to commit itselfto sunk costs so as to prevent any loss of information coming from thiscategory.
There is an intermediate range of information that exists between the topband that is highly valued and the bottom band which is trivially available.The bundles of information in this subset are worthy of monitoring becausealthough they may not be exclusive to the firm, they are still not common-place information. This category of information a firm might be willing totrade, if sufficiently attractive, and if it helps improve the firm’s overallposition in the long run. The bundles of information in this subset are anexample of those that MNCs transfer to ancilliary or subcontracting firms.Ancilliary firms produce inputs or components for MNCs on the basis oftechnology and expertise that MNCs extend to the ancilliaries from thissubset of information.
Considering the fact that there are two important classes of information(that is, information that a firm cannot afford to lose at any cost, andinformation that a firm can afford to exchange) it has been observed that anMNC can characteristically expect to face losses through several routes(Nambiar 1997b). One source of loss is through staff mobility, when workerswho have acquired tacit knowledge in various fields of expertise carryforward this expertise with them to the firm that they are joining. A secondsource of loss occurs when workers carry to their work places the structuredknowledge that they gained while at their previous firms of employment.Finally, inadequate institutional support can encourage information loss.This happens when intellectual property rights, copyright and patent laws,and the implementation of these laws, for instance, is not effectively imple-mented and enforced in an economy.
Clearly, the revelation of information has crucial economic consequencesfor a firm. The extent of information revealed or lost will directly impingeupon a firm’s profits and market share. MNCs in Malaysia were slow to
Knowledge, technology transfer and MNCs 143

transfer technology in the late seventies and eighties (Chee and Chan 1982;Fong 1988). At that stage in the development of technology transfer inMalaysia, the technology that was used in Malaysia was often of a lowerorder than that in the host country. No attempt was made to adapt thetechnology employed from the parent company to suit Malaysian conditions.If there was any transfer of expertise at all it was at the level of impartingmanagerial and administrative skills to Malaysians.
The issue of optimal information revelation is of relevance to MNCs now.Taking the case of technology transfer in the Malaysian electronics andelectrical industry, the MNCs located in Malaysia are faced with a freshproblem. Increased production costs in the home country, intense pricecompetition and decreasing market shares have forced MNCs to locate theirfirms in Malaysia (Rasiah 1989; Hill 1989). Further, improved qualityrequirements, quicker delivery periods, the advent of automation andimproved production processes necessitate technology transfer (Salih andYoung 1989; Rasiah 1989). With the increased use of automation and theintroduction of flexible production systems, more subcontracting links havebeen established out of necessity (Rasiah 1994). The changing scenario oftechnology transfer makes it imperative that the level of informationrevelation is an important constraint that has to be taken into account indetermining optimal profits.
Globalisation and the transfer of technology
We have so far discussed how technology can be transferred and the rolethat MNCs play in this process. In examining technology transfer we haveidentified knowledge, its creation and diffusion, as crucial issues. Know-ledge has been acknowledged to play the crucial role in technology transferthat it does in its various forms and stages. This includes all aspects andphases of learning, where the acquisition of information is seen to be apart of the overall process of knowledge accumulation. Knowledge plays afundamental and pervasive role in technology transfer. It would thereforebe fairly accurate to describe the transfer of technology as the transfer ofknowledge.
The global character of production and the matrix of relationships(between states, MNCs, R&D centres across countries and local firms)naturally makes an impact on the transfer of technology. The problem iscomplex because of the many agents involved, their dispersion over geo-graphical space, the division of processes (and labour) and the vastinterlinkages. Globalisation has far-reaching effects, but the impact ofglobalisation is felt more sharply (1) in the sphere of production, (2) oncapability development, and (3) on the role of nation-states in relation toMNCs. The interaction of these three factors influences the texture oftechnology transfer in the face of globalisation. Obviously, the nature andextent of technology transfer is determined by a multitude of factors, but a
144 Shankaran Nambiar

consideration of the aforementioned factors would give a broad sense of therelation between globalisation and technology transfer.
Before proceeding further it is perhaps useful to clarify what is meant byglobalisation. McGrew (1992) gives a comprehensive definition when heasserts:
Globalisation refers to the multiplicity of linkages and interconnectionsbetween the states and societies which make up the present worldsystem. It describes the process by which events, decisions, and activitiesin one part of the world come to have significant consequences forindividuals and communities in quite distant parts of the globe.Globalisation has two distinct phenomena: scope (or stretching) andintensity (or deepening). On the one hand, it defines a set of processeswhich embrace most of the globe or which operate world-wide; theconcept therefore has a spatial connotation. . . . On the other hand, italso implies an intensification of the levels of interaction,interconnectedness or interdependence between the states and societieswhich constitute the world community. Accordingly, alongside thestretching goes a deepening of global processes.
Using McGrew’s definition as a point of departure, two characteristics regard-ing globalisation emerge. They involve:
1 the increasing interconnectedness or interdependence between states andsocieties, and
2 the coordination of processes, decisions and activities although they arefragmented and globally dispersed.
The feature of interconnectedness lies at the root of the complexity ofglobalisation. This is because production processes are decentralised andlocated across the globe. In addition, the division of labour takes a globalcharacter; and markets are created and penetrated across geographicalboundaries. All of this implies linkages between firms (local and MNC),states, R&D centres (private and public) and educational institutions. Giventhe global nature of production, division of labour and markets, it isnecessary that institutions be developed so that common standards, weights,rules, engineering processes, symbols and notations are used (North 1990).
The shared institutions between states, firms and workers would make theexchange of knowledge possible. Shared institutions are a prerequisite forthe exchange or transfer of knowledge, regardless of whether this knowledgepertains to technology, managerial systems or research findings. Commoninstitutions must be supported by a common system or body of knowledgeor technology, if knowledge or technology is to be transferred. For example,only if two engineers from two different countries share the same conven-tions, scientific symbols and notation, and manufacturing principles, would
Knowledge, technology transfer and MNCs 145

they be able to discuss, say, a circuit diagram and how the experiencesresulting from its use in one country can be modified or transplanted into afactory in another country. Shared conventions and mutually accessibleinstitutions become more and more necessary with the increasing globalis-ation of production.
The global dimension of production, requires, first of all, good linksbetween production and R&D. A close interconnection between bothelements facilitates innovation and improved corporate performance (Sagal1978; Souder and Padmanabahn 1989). Howells and Wood (1993) enumeratefive issues that exacerbate the need for a closer interface between productionand R&D. First, the longer time span for R&D, which in turn involves largercosts, stands in conflict with shorter product life cycles. Second, the growthin external research and the increasing technical collaboration between firms,higher education institutes (HEIs) and research institutes leads, again, toincreased costs, and to the problem of coordination. This issue is notsimplified with globalisation. Third, the R&D-production interface comesunder pressure because of the need for closer proximity with targetedmarkets and suppliers. Fourth, different R&D ‘cultures’ exist and thesecultures must interlock with production. On a global basis, the problem ofcoordination and match between R&D cultures and production in differentcountries is heightened because of national preferences and priorities. Thespatial and temporal problems that come with geographical distances alsoadds to the challenge of achieving smooth interaction between R&Dcultures and the cultures peculiar to production in specific countries. Fifth isthe problem of globalisation per se, or the problem arising simply fromhaving to contend with differences in time and distances in space, whichcreates what Howells and Wood (1993: 97) term ‘as “space-time” com-pression associated with the need to coordinate global operations andresources within increasingly tight time schedules’.
A second major way in which production is affected by globalisation isthrough sourcing and supplier relations. MNCs have the option of sourcingfor materials and components from suppliers who are located close to theheadquarters. Alternatively, MNCs can source from overseas firms whichmay (or may not) be associated with the MNCs’ operations overseas. Bydecentralising or globally dispersing their sources of supply, MNCs canbenefit from the best suppliers. Corporations can then take advantage ofcountries which have an edge in particular technologies, labour skills, com-petitive cost conditions or governments that offer incentives, subsidies orfiscal benefits. On the positive side, MNCs have found that the globalisationof supply linkages and subcontracting has resulted in improved productquality, lower manufacturing costs and shorter delivery times.
Globalisation has, in a manner of speaking, brought states and firmscloser, bringing the focus onto production and markets rather than ontostates. This spatial compression offers a conducive environment for tech-nology transfer. Changing trends in production, particularly flexible manu-
146 Shankaran Nambiar

facturing systems, the interrelationship between firms, R&D centres andHEIs in different countries, and overseas supply chains and subcontracting,all provide opportunities for technology transfer. Subcontractors and othersuppliers have to acquaint themselves with the standards, processes, methodsand other requirements as expected of them by the parent MNCs. Very oftenMNCs are quite willing to equip their subsidiaries with the necessaryexpertise, thus facilitating the transfer of technology. Also, globalisationleads to an expansion in the number and type of overseas subsidiaries.Although MNCs can take advantage of scale and scope economies byemphasising product standardisation and centralised control, to do so woulddetract from gains through innovativeness and adaptation to market needs(Howells and Wood 1993: 107). By encouraging innovativeness and adapt-ation, the parent MNCs, while monitoring the manufacturing operations oftheir overseas firms, transfer knowledge, generally speaking. In specificinstances, the parent companies technically assist their subsidiaries withprocess innovations so that market needs can be promptly and effectivelymet. In doing this the subsidiaries gain from technology transfer.
To what extent subsidiaries are able to gain from technology transferdepends on the technological capabilities they possess. In fact, within thecontext of globalisation the relationship between capability developmentand globalisation is an interesting issue. Capability development and global-isation have a reciprocal relationship in the sense that states and firms musthave the capacity to take advantage of the benefits that can accrue throughglobalisation. On the other hand, globalisation forces states and firms toadapt and make changes because the ramifications and forces associatedwith globalisation are so powerful that a country which ignores the changingglobal situation will be marginalised.
An abundance of natural resources is of prime importance in agriculturallyrelated and extractive industries. Countries that rely on primary commoditiesin order to attract MNCs are susceptible to the fluctuations so widelyassociated with these industries. Small countries like Singapore and HongKong do not have the physical area to attract such industries, which by theirnature are land-extensive. Even a country like Malaysia, which was historicallydependent on primary commodities, has come to realise that more sophistic-ated capabilities must be developed if they are to achieve greater growth.
In engineering industries, for instance, a high level of technologicalcapability is necessary. The greater the need for technological capability themore sophisticated the technology involved (Pavitt 1984). In addition, theremust be an abundant supply of local technical and managerial skills. Whilethese skills may not be of a very high order, they must be sufficiently high inorder to absorb the transfer of technology from the parent firm. Also, withflexible manufacturing systems, the presence of a high degree of decen-tralisation, the segmentation of production, the use of multi-sourcing andthe reliance on a developed network of suppliers, it becomes necessary tohave the capabilities to foster the requisite interrelationships.
Knowledge, technology transfer and MNCs 147

As Lall (1997: 242) comments: ‘In many process industries, there is littleneed to depend on suppliers of components and specialized inputs. Inengineering industries, however, efficiency depends on specialization and adense network of linkages between subcontractors, suppliers and servicefirms.’ Clearly, before the linkages can be established, the subcontractors,suppliers and service firms must have the expertise, technology and financialability to tolerate costs and uncertainty. MNCs would be drawn to allocatetheir investments in economies where these preconditions are satisfied. Thehigher technology investments will be located in those economies which havemore satisfactory preconditions. Local capabilities must be adequatelydeveloped if local firms are to attract foreign direct investment. In particular,local firms stand in a better position to enjoy technology transfer if theypossess the required capabilites in the following areas:
• labour skills• manufacturing know-how• materials handling• machinery maintenance• managerial skills • networking of subcontractors and suppliers.
Much must be done by the state if an economy is to develop a satisfactorylevel of technological capability. Firms can contribute to capability develop-ment; but they can do so only within the context of the overall developmentthat is determined by the state. This in turn leads us to the role that statesplay under conditions of globalisation.
The pressures exerted by globalisation demand that the state makes itseconomy more receptive to knowledge. This implies being capable of absorb-ing knowledge, creating knowledge and utilising knowledge. Without denyingthat physical infrasture must be improved, telecommunications facilities beextended, and credit availability be accessible, there is a fundamental need toextend the knowledge base of an economy. Very broadly, this can be achievedby encouraging research and by emphasising human resource development.
Technological change must be recognised to be an endogenous factorrather than as an exogenous element that is imposed upon an economy. Thisperspective takes the view that economies can grow if they actively takemeasures to develop factors that enhance growth (Romer 1986; Lucas 1988).Romer (1994: 3) expresses this position succinctly when he notes that thenew growth theory ‘distinguishes itself from neoclassical growth byemphasising that economic growth is an endogenous outcome of aneconomic system, not the result of forces that impinge from outside’.
It has been observed that education and training have a special role toplay in promoting growth (Grossman and Helpman 1994). In fact, the newgrowth theorists see capital as including both physical and human capital. Itthen stands to reason that the state has to invest in improving the quality of
148 Shankaran Nambiar

education and training. Only then will labour be better skilled, and so moreprepared to absorb new technical capabilities. At a higher level, betterqualified labour (including engineers and researchers) would be better pre-pared to engage in R&D and to contribute to product and process innov-ation. The state’s role, aside from maintaining a good educational system(primary, secondary and tertiary education), would have to be extended toimparting technical and industry-specific skills training. Most developingcountries concentrate on education as delivered by schools and universities,but not on imparting skills that are relevant to manufacturing needs. In termsof Lall’s typology (1997: 248), the sort of education and training that we arepresently discussing is useful for operational purposes (i.e. to manage andoperate production facilities designed and built by foreign partners), and forduplication (i.e. to expand output without foreign assistance). It may even beadequate to ensure technological self-reliance (i.e. to adapt existing systems,technologies, or to adapt to them); but definitely inadequate to supportinnovation (i.e. to extend existing technologies or to generate newtechnological solutions without any foreign assistance).
A state has to encourage R&D if it is to promote innovation in theeconomy. At the level of the state, some measures towards achieving thisobjective can be attained by planning for a comprehensive science andtechnology (S&T) policy. Such a policy would include interaction betweenprimary and secondary industries, R&D institutions and HEIs. The state’sparticipation in planning and coordinating research programmes would alsobe necessary. Further, the S&T infrastructure must be strengthened andprivate sector involvement in S&T must be encouraged.
Government participation in the commercialisation of R&D activities isnecessary to foster R&D activities. This is because the private sector has noeconomic incentive to finance research that is likely to benefit other firms.The private manufacturing sector will not find it rational to invest in theproduction of services that possess the characteristics of public goods. Suchresearch, when conducted, will be intra-firm and so would not produce anypositive externalities. If research findings are to find their way into the publicdomain, it is necessary for the state to fund appropriate research projectsbecause research can consume long periods of time, carry high levels of risk,and, often, show little promise of quick and profitable returns. It is in thisrespect that the state must intervene, both to provide insurance and to‘market’ research once commercially viable outcomes are produced.
Government policies to encourage S&T, R&D and to raise the level ofeducation and skills training are long-term policies. The effects of thesepolicies bear fruit over a long period of time and they help a country tomake the technological leap. Broadly speaking, a country’s set of knowledgecapabilities has to be extended both if it is to be able to absorb thetechnology that it must utilise and to adapt this technology. If thisfoundation is not available, it goes without saying that an economy will nothave the necessary preconditions in order to innovate and to generate its
Knowledge, technology transfer and MNCs 149

own body of technological capabilities without the assistance of MNCs andother foreign partners.
Within a more immediate timeframe, a country can design its industrialpolicy in order to attract foreign investment. Typically, developing countrieshave offered incentives such as tax exemptions and pioneer status toinvestors. They have also curtailed the development of trade unions, and sohave offered the incentive of a docile labour force. In addition to goodinfrastructure, free trade zones and licensed manufacturing warehouses havebeen established by developing countries. But these measures which have hadtheir success in the seventies and eighties were directed at industries whichwere labour-intensive in their production processes, and were low in valueaddition. However, the rapid pace of globalisation, the changing nature oftechnologies and the shift from low-skilled, labour-intensive production tohigh-skilled, capital-intensive production places a larger burden on know-ledge as an input in the production function. This implies that states indeveloping countries have to adopt a different strategy to take advantage ofglobalisation.
Conclusion
With the globalisation of production processes the transfer of technology isinevitable. Interesting insights can be gained by examining technologytransfer from the perspective of knowledge and information revelation.There are two immediate advantages to adopting a knowledge-based per-spective in studying technology transfer. First, by changing one’s vantagepoint to that of a knowledge-based perspective one is relieved of the undueimportance that is attached to the physical aspects of technology transfer.Indeed, technology transfer cannot be confined to machines and equipment;and technology transfer cannot be carried out in the absence of knowledge.Second, knowledge has costs that are attached to it. There are costs attachedto acquiring knowledge, there are costs attached to imparting knowledge;and the loss of information impacts upon profits. All of this makes the roleof knowledge in the process of technology transfer worthy of examination.
This chapter has concentrated on the role of MNCs in the transfer oftechnology. While MNCs are an important component in the process oftechnology transfer they are not the only agents that facilitate the process.Governments, universities and research centres are other conduits for thetransfer of technology. In fact, the transfer of technology can be expedited ifa comprehensive science and technology policy is devised.
Research in the area of technology transfer must look at the interactionbetween the different agents that can promote technology transfer in termsof their motivation to encourage the process and the decision-makingproblems that they encounter in the absence of perfect information. Thiscan be extended to include the effects of path dependence and lock-in. Withthe freer flow of knowledge, firms and economies can escape the less
150 Shankaran Nambiar

productive routines that they have committed themselves to. This is aproblem which can generate an interesting line of research.
References
Chee, P.L. and P. Chan (1982) ‘Factor proportions problem and the transfer oftechnology: a case study of MNCs in Malaysia’, Discussion Paper Series no.82–08, Council for Asian Manpower Studies, University of the Philippines.
David, P.A. (1993) ‘Knowledge, property, and the system dynamics of technologicalchange’, proceedings of the World Bank Annual Conference on DevelopmentEconomics 1992, The World Bank.
Enos, J., S. Lall and M. Yun (1997) ‘Transfer of technology’, Asian-Pacific EconomicLiterature, vol. 11, no. 1.
Fong, C.O. (1988) ‘Multinational corporation in ASEAN: technology transfer andlinkages with host economies’, a paper presented at the 13th Annual Conferenceof the Federation of ASEAN Economic Associations, Penang.
Grossman, G.M. and E. Helpman (1994) ‘Endogenous innovation in the theory ofgrowth’, Journal of Economic Perspectives, vol. 8, no. 1.
Hill, D.J. (1989) ‘Future of the semiconductor industry in Malaysia: an Americanviewpoint’, in S. Narayanan and R. Rasiah, et al. (eds) Changing Dimensions ofthe Electronics Industry in Malaysia: The 1980s and Beyond, Malaysian EconomicAssociation and Malaysian Institute of Economic Research: Kuala Lumpur.
Howells, J. and M. Wood (1993) The Globalisation of Production and Technology,London: Belhaven Press.
Hymer, S. (1972) ‘The multinational corporation and the law of uneven develop-ment’, in H. Radice (ed.), International Firms and Modern Imperialism, Middlesex:Penguin Books.
Kobrin, S.J. (1991) ‘The implications of global integration for the national control oftechnology’, in T. Agmon and M.A. Von Glinow (eds) Technology Transfer inInternational Business, New York: Oxford University Press.
Lall, S. (1997) ‘Investment, technology and international competitiveness’, in J.H.Dunning and K.A. Hamdani (eds) The New Globalism and Developing Countries,Tokyo: United Nations University Press.
Lucas, R.E. Jr (1988) ‘On the mechanics of economic development’, Journal ofMonetary Economics, vol. 22, no. 1.
McGrew, A. (1992) ‘Conceptualising global politics’, in A.G. McGrew and P.G.Lewis (eds) Global Politics: Globalization and the Nation State, Cambridge: PolityPress.
Mansfield, E. (1995) ‘Technological change and the international diffusion of tech-nology: a survey of findings’, in E. Mansfield (ed.) Innovation, Technology and theEconomy, Aldershot: Edward Elgar.
Marx, K. and F. Engels (1967) The Communist Manifesto, Middlesex: Penguin Books.Murray, R. (1971) ‘The internationalization of capital and the nation state’, in H.
Radice (ed.) International Firms and Modern Imperialism, Middlesex: PenguinBooks.
Nambiar, S. (1996) ‘Knowledge, learning and the transfer of technology: some issuesand the Malaysian experience’, Borneo Review, vol. 7, no. 1.
—— (1997a) ‘Knowledge and its place in Malaysian industrialisation’, in B.N.
Knowledge, technology transfer and MNCs 151

Ghosh, Y.K. Lai and S. Narayanan (eds), Industrialisation in Malaysia: SomeContemporary Issues, Kuala Lumpur: Utusan Publications.
—— (1997b) ‘Information and profits: the case of technology transfer in theMalaysian electronics industry’, Asian Academy of Management Journal, vol. 2,no. 2.
—— (1998) ‘State and firm in technology transfer: the case of the Malaysianelectronics and electrical industry’, Asian Economies, vol. 27, no. 3.
—— (1999) ‘Fostering technology trnsfer: the case of the electronics and electricalindustry in Malaysia’, in B.N. Ghosh and M.S. Salleh (eds), Political Economy ofDevelopment in Malaysia, Kuala Lumpur: Utusan Publications.
Narayanan, S. (1992) ‘MNCs and the transfer of technology to ASEAN: anexploratory framework’, in B.N. Ghosh, Y.K. Lai and S. Narayanan (eds)Industrialisation in Malaysia: Some Contemporary Issues, Kuala Lumpur: UtusanPublications.
Narayanan, S., Y.W. Lai. and K.G. Cheah (1994) ‘Evaluating technology transfer: ananalytical framework and an application to the electronics and electrical sector inMalaysia’, in K. Erdener and S. Mohamed (eds) Capitalising the Potentials ofGlobalisation – Strategies and Dynamics of Business, Proceedings of the ThirdAnnual World Business Congress, Philadelphia, PA: Pennsyvania State University.
North, D. (1990) Institutions, Institutional Change and Economic Performance,Cambridge: Cambridge University Press.
Pavitt, K. (1984) ‘Sectoral patterns of technical change: towards a taxonomy and atheory’, Research Policy, vol. 13.
Porter, M. (ed.) (1986) Competition in Global Industries, Cambridge: Harvard BusinessSchool Press.
Rasiah, R. (1989) ‘Technology change and the electronics industry: the impact onPenang in the 1980s’, in S. Narayanan and R. Rasiah et al. (eds) ChangingDimensions of the Electronics Industry in Malaysia: The 1980s and Beyond, KualaLumpur: Malaysian Economic Association and Malaysian Institute of EconomicResearch.
—— (1994) ‘Flexible production systems and local machine-tool subcontracting:electronics components transnationals in Malaysia’, Cambridge Journal of Eco-nomics, vol.18.
Romer, P.M. (1986) ‘Increasing returns and long-run growth’, Journal of PoliticalEconomy, vol. 22, no. 1.
—— (1994) ‘The origins of endogenous growth’, Journal of Economic Perspectives,vol. 8, no. 1.
Sagal, M.W. (1978) ‘Effective technology transfer – from laboratory to production’,Mechanical Engineering, vol. 10, no. 4.
Salih, K. and M.L. Young (1989) ‘Economic restructuring and the future of thesemiconductor industry in Malaysia’, in S. Narayanan and R. Rasiah et al. (eds)Changing Dimensions of the Electronics Industry in Malaysia: The 1980s andBeyond, Kuala Lumpur: Malaysian Economic Association and Malaysian Instituteof Economic Research.
Schumpeter, J. (1934) The Theory of Economic Development, London: Oxford Uni-versity Press.
Simon, D. (1991) ‘International business and the transborder movement oftechnology: a dialectic perspective’, in T. Agmon and M.A. Von Glinow (eds)Technology Transfer in International Business, New York: Oxford University Press.
152 Author name

Souder, W.E. and V. Padmanabahn (1989) ‘Transferring new technologies from R&Dto manufacturing’, Research and Technology Management, September–October.
Zysman, J. and S.S. Cohen. (1983) ‘Double or nothing: open trade and competitiveindustry’, Foreign Affairs, Summer.
IMF: functions, financial crises, relevance 153

9 The International Monetary Fund
Functions, financial crises and future relevance
George Kadmos and Phillip Anthony O’Hara
Introduction
The purpose of this chapter is to critically evaluate the role and functioningof the International Monetary Fund (IMF) in the light of its changingorganisational dynamics and the real-world operation of financial crises. Thechapter commences with an examination of the purpose and role of the IMFset in an historical context. Then we look at the IMF in action during therecent financial crises in Mexico, Asia and Russia. Finally, we examine therelevance of the IMF for the future operation of capitalism. We concludethat the institutional dynamics needed in the future will centre on a globalcentral bank, plus the critical role of monitoring and supervision, cooper-ation with nations and institutions, policies which negate rigid blueprints,and technical and financial assistance to nations.
Purpose and role of the IMF
The International Monetary Fund was established as a monetary institutionresponsible for monitoring global monetary conditions. The IMF’s lendingpowers were designed to enable it to carry out this role. However, given its‘global’ position as the only truly international monetary institution, theIMF remains a mystery to most people. Considerable confusion exists aboutthe IMF’s role and activities, and even more confusion exists over thedifferences between the IMF and World Bank. Not surprising, the IMF hastaken a battering from various corners over its inability to carry out its roleconstructively and many believe that the IMF has outlived its usefulness in amodern global economy. The IMF is largely seen as a powerful and generally‘euro-centric’ political institution coercing poor nations to adopt economicpolicies unsuited to the needs of their fragile economies.
According to the IMF (1999: 1):
Article I [of the IMF Charter] specifies that the IMF is to promoteinternational monetary cooperation; to facilitate the expansion of inter-national trade, and thus contribute to high employment and real incomegrowth; to promote exchange stability; to assist in the establishment of a
154

multilateral system of currency payments and in the elimination offoreign exchange restrictions; to give confidence to members by makingresources temporarily available under adequate safeguards in order tominimize the disruption from adjustment of balance of paymentsproblems; and to help reduce balance of payments disequilibria.
The IMF believes that it has no ‘real’ power: its influence is derived fromits ability to negotiate with its members and persuade them to adopt macro-economic policies that are suited to improving their economic conditions.Strictly speaking, it is true that the IMF has no ‘real’ power; but it yieldsconsiderable influence over its ability to place conditions on loans to members.It is these conditions that ensure the IMF opinions carry weight in the globalcommunity. It is therefore necessary to appreciate the exact role and purposeof the IMF. Hence this section will investigate the origins of the IMF andprovide a brief summary about how it lends to member countries.
Origins of the International Monetary Fund
The establishment of the International Monetary Fund is a remarkable featconsidering what the fund’s original members were willing to surrender inorder to establish an untried and rather idealistic concept. The need for aninternational monetary agency became apparent during the Great Depres-sion during the 1930s. According to Horsefield (1972: 4), the depressionprecipitated a mammoth collapse in commodity prices and world trade, thedepth of which had not been experienced before. The gold value of worldtrade declined by 47.5 per cent between 1929 and 1932. No nation wasimmune from the contagion effects of the depression. Individual govern-ments moved to devalue their currencies in order to restore their competitivepositions.
One of the consequences of the depression was the widespread loss ofconfidence in paper money that had previously been backed by the goldstandard. The standard had defined the value of each currency in terms of agiven amount of gold. Following the depression, nations preferred to tradeexclusively in gold, which raised the demand for gold far above the levelsthat supply could satisfy. Given that the values of international currencieswere questioned, many nations abandoned the gold standard in order toprotect their gold stocks. Trading between economies became difficult,especially considering that some nations remained on the gold standardwhile others did not. This only exacerbated the effects of the depression,destroying export markets throughout the world. Many other nations,desperate to find new export markets or keep existing ones, artificially madetheir goods appear cheaper by devaluing their national currencies so as toundercut the trade of other nations selling the same products.1 Thesepractices did little but encourage retaliation between nations that thwartedthe economies overcoming the depression.2
The IMF: functions, financial crises, relevance 155

The depression reinforced the need to establish an international frame-work that could help to smooth future economic downturns and preventthem developing into global recessions. Once victory seemed inevitableduring World War II, Allied governments were concerned that the worldeconomy would slump back into depression after the cessation of hostilities.Governments began to seriously consider ways to prevent another worlddepression. Both the United States and United Kingdom worked closely tosteer the world’s economies away from the fate that had gripped the worldthrough the 1930s.
Harry Dexter White (1892–1948) and John Maynard Keynes (1883–1946)are generally recognised as the founding fathers of the organisation.According to Horsefield (1972: 3) both men were convinced that an economiccollapse after World War II could be avoided by massive internationalcooperation. White in the United States and Keynes in the United Kingdomproposed similar plans for the establishment of an international monetarybody. However, though the plans were ‘generally’ similar, each plan reflecteddifferent purposes according to the individual needs of each economy. Thedepression in the United States had stemmed principally from domesticdevelopments including the burst of the speculative bubble that hadinfluenced the United States stock market. As the depression spread globally,international economies devalued their currencies in order to maintain theircompetitive position. This hampered United States export programs thatendeavoured to find a way out of the depression. The United States wantedto prevent the competitive devaluation that had taken place throughout the1930s and ensure the stability of currencies. The United Kingdom, on theother hand, faced different constraints to the United States. Whereas thedepression was largely a domestic phenomenon in the US, the depression hitthe United Kingdom export industry heavily. The UK economy was farmore reliant on international trade. Keeping her competitive position inter-nationally was paramount to the United Kingdom. Keynes proposed amechanism by which individual countries could adjust their exchange ratesaccording to their individual needs.
The Bretton Woods Conference
The Bretton Woods Conference, comprising delegates from forty-four nations,took place at Bretton Woods, New Hampshire, USA in July 1944. TheConference agreed to establish two international monetary institutions: theInternational Monetary Fund (IMF) and the International Bank forReconstruction and Development (IBRD). The latter organisation becamewhat is commonly known as the World Bank. The IMF began operations inWashington, DC in May 1946. It then had thirty-nine members.3 The BrettonWoods Conference agreed on a number of conditions with which nations hadto be willing to comply if they wanted to become members. Each prospectivemember had to agree to establish a par value for its currency that would fix the
156 George Kadmos and Phillip A. O’Hara

value of the currency to the US dollar or gold.4 The aim of this was to preventfluctuations in national currencies, especially artificial devaluations that hadcaused much damage during the depression.5 Nations also had to agree toconvert each other’s currencies at par value.6 This would help to stabiliseinternational trade and make it easier for nations to purchase goods from eachother. Members also had to agree to contribute to the running of the IMF.Each ‘quota’ is based on the volume of international trade, national incomeand international reserve holdings that each nation holds. Nations wererequired to contribute part of their contribution in gold and the remainder intheir own currency.7 Quotas are used to finance loans made to membercountries in times of economic need.8 They also have two other importantfunctions. One is to determine how much each member is able to borrow fromthe fund. The more the member contributes, the more the member is able toborrow in times of need. The second purpose of quotas is to determine thevoting power of each member. Quotas have changed over time, depending onchanging circumstances. The IMF uses a system of weighted voting power.9
The allotment system is designed to recognise and protect the interests ofthose members who contribute the most to the IMF. The more a membercontributes in the form of quotas, the larger is their voting power.10
The Bretton Woods agreement sought to create order by coordinatingeconomic policy globally through adherence to a set of agreed exchangerates, by liberalising trade flows, and by providing external finance tocushion balance of payments adjustment. At the same time, the World Bankwas given the task of providing longer-term finance in circumstances where aneed existed but private capital failed to meet it. Early on, the principalglobal financing need appeared to be to support European economic recon-struction. However, after this had been achieved, largely through MarshallAid, attention shifted to the financing needs of developing countries.
The lending arrangements of the IMF
In order to summarise the IMF’s lending arrangements it is important tounderstand the type of nations the IMF deals with. Williamson (1982: 13)separates IMF debtor nations into two categories. The first includes allmajor industrial and newly industrial nations as well as the major socialistnations (prior to the break up of communism) that are able to access fundsfrom both the IMF and from the international capital market. These nationsdo not need to borrow from the IMF to finance deficits and only turn to thefund during crises that undermine their creditworthiness. The second groupof debtor nations include most of the poorer developing nations that havelittle access to international capital markets and are thus reliant on the fundsfrom the IMF. Since the early 1970s, the IMF’s clientele has increasinglycome from this second group, to the point that predominantly, the IMF isnow totally devoted to this group. The fund’s relationship to these twogroups is obviously quite different.
The IMF: functions, financial crises, relevance 157

An important component of IMF lending is the conditions that areplaced on each individual loan. Conditionality refers to the policies thatdebtor nations are expected to adopt when obtaining credit from the IMF.According to Williamson (1983) the IMF’s original Articles of Agreementdo not make specific provision for the attachment of conditions on loans.These conditions have evolved over the course of the IMF and reflect chang-ing patterns in IMF lending. These conditions are separated into loans thatare based on ‘high conditionality’ and those based on ‘low conditionality’.The conditions are intended to ensure that the debtor nation is able toimplement the necessary reforms that will prevent recourse.11 This of course,depends on whether the crisis that brought the nations to the IMF wastemporary or not. If it was temporary, then the nations may borrow on ‘lowconditionality’ that is, the IMF may consider current policies to be suitedand expects the policies to be appropriate in the long term. If the cause ofthe crisis is considered more long term and deep seated, then funding mayonly be given on ‘high conditionality’ and the debtor nation will be forced tochange its policies in order to convince the IMF that the nation is makingthe right decisions to prevent further economic instability.
The IMF’s current lending activities can be summarised as follows.Nations can be separated between those that can obtain commercial lines ofcredit and those that are unable to obtain commercial credit. The first groupof nations do not generally require IMF funds, they have access to inter-national capital markets, but they will find it expedient to use the fund nowand again when it is offered on favourable terms. Many of these nations usethe IMF as a lender of first resort and not a lender of last resort.12 It isgenerally agreed that the fund should be seen as a lender of last resort andthat nations should try to obtain credit via the international capital marketbefore requesting funds from the IMF. The second group are highly relianton IMF funds; they have little access to international capital markets andcan only obtain funds through the IMF. The IMF places varying degrees of‘conditions’ on its funds. Both ‘high conditionality’ loans and ‘low con-ditionality’ loans are available to the second class of nations. Increasingly,the IMF lends more on high conditionality than low conditionality. Eventhough they are resented in many instances, high conditionality loans givepoor nations access to IMF advice and knowledge. The suitability of thisknowledge can be questioned. Is the IMF in a proper position to understandthe difficulty of each nation and the specific policies needed to solve theindividual’s economic problems?
The IMF in action: Mexican, Asian and Russian economic crises
The changes taking place in international markets during the last decadehave been unprecedented during this century. In less than ten years, theglobal economy has witnessed a liquidity crisis in Mexico, severe recession inAsia and contagion effects from this in Russia and Latin America. In
158 George Kadmos and Phillip A. O’Hara
analysing the relevance of the International Monetary Fund, it is importantto closely monitor its performance over the past decade in handling thechanges that have swept foreign markets. This section will discuss the IMF’srole in three major crises: the Mexican, Asian and Russian economicdownturns.
The Mexican crisis 1994–1995
The Mexican economy has been plagued with crises over the past two andhalf decades. In fact the recent bout of financial crisis is the fourth to hit thevulnerable economy since 1975. If one is to analyse the Mexican crisis of1994–5, it is imperative that it is undertaken with an understanding of theeconomic fortunes of the Mexican economy over several decades. Fromabout the 1950s to the early 1970s, Mexico was a financially stable countrywith high growth and relatively low inflation. Mexico benefited from thesharp increase in oil prices during 1973–4, which generated significantlyhigher export revenue. International capital, mainly from the Middle East,flowed in via European banks, providing excellent investment opportunities.
According to Hoskins and Coons (1995) the 1976–7 crisis was caused bymassive government spending on programs designed to improve Mexico’sexport capacity. The Mexican government implemented expansionarypolicies that created large fiscal deficits and generated large capital inflows,causing an overvalued currency. Instead of using the opportunity to openher markets, Mexico retained restrictive trade practices that limited importand export growth. As a result, external debt tripled from 1970 to 1976. Theprograms failed to lift Mexico’s export performance, which increased un-certainty among investors. The US government provided over $300 millionand the IMF over $960 million to the Mexican authorities to stabilise itscurrency.
By the early 1980s the Mexican economy was vulnerable to changingconditions and perceptions in international capital markets. Peach andAdkisson (1997) report that rising interest rates and falling oil prices hit theeconomy hard, resulting in a capital market revaluation of the peso. Thegovernment of the day devalued the peso by more than 40 per cent. Investorsreacted to the devaluation in the same manner as they had done during thepast two financial crises. The peso continued to depreciate, causing asignificant debt crisis. Debt levels skyrocketed during 1982 as the economysuffered the consequences of easy credit and the restrictive trade policies ofthe 1970s.
Camdessus (1995) reports that throughout the 1980s the Mexican economystruggled under its crushing debt burden. Per capita GDP growth from 1981to 1988 was �2 per cent per year. Government spending on public servicessuch as health and education fell under the debt burden. The focus shifted tomarket-oriented reforms. Mexico cut government spending while refocusingon social needs, reforming the tax system, privatising state enterprises, and
The IMF: functions, financial crises, relevance 159

liberalising trade.13 The 1988 crisis was no different to the previous two.Once again the catalyst for the crisis was the flight of foreign capital follow-ing further political unrest and devaluation. Again billions of dollars wereprovided by the IMF and the US government to help authorities stabilise thepeso.
The Mexican government, headed by the populist President Salinas,accelerated liberal reforms during 1989 with considerable emphasis onprivatisation and encouraged greater foreign investment than ever before. Ontop of this, Salinas deregulated the banking industry and permitted newforeign financial institutions to enter the domestic market. Carlos Salinas wasdetermined to shape a new Mexico into the twenty-first century and as suchhad a profound impact on Mexico. In fact, according to Boothe (1995: 1),investment capital totalling some US$70 billion entered the country between1986 and 1994.14 Most of this investment flowed in from the United States,Japan, Germany and Canada. Major American and international corpor-ations built vast franchise operations throughout the country. The signing ofthe North American Free Trade Agreement (NAFTA) between the UnitedStates, Mexico and Canada also increased Mexico’s economic prospects. WhenNAFTA was passed, one of the primary arguments was that trading withMexico would create new jobs in America. The argument prevailed despitehistorical and research studies indicating that NAFTA would encouragemovement of manufacturing and labour-intensive jobs to Mexican nationals,at the expense of American jobs. Though Mexico’s population totalled 90million, it was never realised by those supporting NAFTA in the United Statesthat only 10 million of the population was classified as middle class andtherefore could afford to purchase American products.15 About 200,000people in Mexico control most of the wealth, with thirty-two families, allbillionaires, controlling the vast bulk of wealth in Mexico.
The Mexican economy under Salinas enjoyed considerable success in thelate 1980s to early 1990s. However, the successes did not come without aprice. The government was determined to maintain a fixed exchange rateand supported the peso through international borrowing. According toWilliamson (1995) the massive increase in public debt was supported by anequally large increase in private debt. Thus an over-reliance on credit,increased consumer spending, an inefficient fixed exchange rate and balloon-ing in short-term debt set the scene for a major financial crisis. The crisisoccurred in 1995 and was the worst crisis to hit that country since the 1930s.During late 1994 higher interest rates in the United States pushed ratessignificantly higher in Mexico. Mortgage rates on homes soared as high as 70per cent while credit card rates topped 10 per cent per month. OrdinaryMexican citizens who had enjoyed a steady rise in their standard of livingsuddenly found that their well-paid jobs were insufficient to meet their debtcommitments. Fiscal and monetary policies were changed to focus oncreating the conditions necessary for abating inflationary pressures and,ultimately, achieving a sustainable reduction in interest rates.
160 George Kadmos and Phillip A. O’Hara

Monetary authorities were also struggling throughout 1994 to keep theMexican currency at its fixed-rate level. By December 1994, Mexico’s foreignreserves had been depleted to about US$5 billion and, according to Gil-Diaz(1997), the authorities were facing the prospect that up to US$23 billion ofTesebono liabilities (short-term debt) would not be rolled over once theymatured. The Mexican government was unable to persuade anyone to lendthem the capital needed to avoid a financial crisis. The government faced twoprospects: to increase interest rates to the level that would stop the flight offoreign capital or to print the money it needed to survive. The first optionwould probably strangle investment and cause massive unemployment. Thesecond would probably cause hyperinflation, increasing Mexico’s exports inforeign markets. Either way, the prospects were bleak for the authorities. TheMexican economy experienced a severe recession in 1995. Real GDP fell byclose to 7 per cent, although it hit bottom around mid-year. Domestic demandcollapsed following the March 1995 stabilisation measures.16 This, togetherwith improved international competitiveness, brought the current accountclose to balance. Inflation peaked at 52 per cent in the twelve months toDecember.
The crisis which hit Mexico was the result of several policy mistakes thatprecipitated international investor panic. According to Goldman (1996), thepolitical risk to equity holders increased substantially with the assassinationof a prominent presidential candidate.17 The central bank compensated therise in interest rates by expanding domestic credit. Investors converted thecredit into dollars, draining Mexico of its reserves of foreign exchange. In anattempt to reduce the cost of government borrowing, the central bankconverted its short-term ‘peso’ denominated debt into short-term ‘dollar’denominated debt. The policy actions taken in 1994 resulted in the govern-ment holding a considerable amount of short-term dollar denominated debtwhile its stock of foreign reserves had dwindled to dangerous levels. Thegovernment began to seriously consider devaluing the currency. TheMexican government’s first attempt to devalue the currency on 20 Decemberpanicked investors. The peso slumped drastically, raising all ‘dollar’ denomin-ated debt. The result was a severe liquidity crisis. This also contaminateddomestic credit conditions, precipitating the threat of a collapse in thebanking system.
The IMF rescue package designed for Mexico consisted of two com-ponents. The first, according to Camdessus (1995), involved a strongadjustment program aimed at reducing the external current account deficitfrom 8 per cent of GDP to 1 per cent of GDP in twelve months. The secondcomponent consisted of a large-scale international rescue package designedto stabilise the peso and encourage the return of international capital.Mexico initially negotiated an external support package amounting to aboutUS$18 billion dollars, comprising $9 billion from the US government, $3billion from US commercial banks and $6 billion from other foreigngovernments. Within a few weeks the amount had risen to the US$40 billion
The IMF: functions, financial crises, relevance 161

range, while by the end of February the rescue package had reached a finalsize of US$52 billion.18 The package of external support also included $17.8billion of credits from the International Monetary Fund, $10 billion inshort-term loans from central banks via the Bank for InternationalSettlements, and several billion dollars of loans from other governments inNorth and South America.19 The disbursement schedule was subject toMexico sticking to its programmed restraint in government spending andmonetary growth. As a source of collateral the Mexican government agreedto have importers of Mexican oil products make payment through anaccount at the Federal Reserve Bank of New York.
Since the 1995 crisis the Mexican economy has bounced back strongly.According to an IMF Bulletin (1998), real GDP growth in Mexico hastopped 5 per cent per year since 1996 and employment in the formal sectorhas risen by 14 per cent against pre-crisis levels. However, the goodperformance should be put in perspective. Real wages are still 20 per centlower than in 1994 and despite four years of growth, per capita output hasrisen by around only 3 per cent.20 One of the major challenges for Mexico inthe future will be to create employment for the rapidly growing labour force– nearly one million people enter the labour market every year. In addition,Mexico’s foreign debt appears to be more manageable, a fact highlighted bythe government’s recent repayment, in full and ahead of schedule, of theemergency line of credit extended by the US government at the height of thecountry’s recent economic crisis.
Asian economic crisis 1997–1998
The crisis that swept Asia during 1997–8 was the largest economic crisis tohit that region this century. However, like the crisis in Mexico, the Asiancrisis was either largely unexpected or its severity was not taken seriously.Why there appeared to be such faith in the ability of the regional economiesto bounce back is astonishing considering the magnitude of the crisis.Taking the first three months of 1998 as an example, $700 billion had beenwiped off Asia’s main stock markets, with some nations losing 90 per cent ofthe value of their currency.
In Asia, the economic fundamentals had been solid for decades. Govern-ment budgets had been balanced for years, current account deficits werecontrollable and currencies had enjoyed considerable stability that aided thestrong growth over the previous two decades. In that period Asian economieshad grown enormously through intensive investment in export-led industries.The catalyst for Asian growth had been the low level of real exchange ratesor relative prices between East and West adjusted for the nominal exchangerate. Massive profit and volume opportunities generated export-led growthin high price and income markets.
A combination of inadequate financial supervision, poor risk assessmentand the maintenance of relatively fixed exchange rates caused the Asian
162 George Kadmos and Phillip A. O’Hara

crisis. These factors led banks and corporations to borrow large amountsof international capital, much of it short-term, denominated in foreigncurrency, and unhedged. As the recession in Japan and the economic slow-down in Europe diverted investments to Asia, much of the funds were usedto finance speculative real estate or stock market acquisitions. According toMayer (1998: 1) ‘what was new in this crisis was the predominance ofinterbank lending as the source of trouble’. Reassured by lender of lastresort facilities, domestic banks often failed to gather minimum informationon how their customers intended to repay their loans. Investment in South-East Asia skyrocketed, with increasing short-run profit expectations. Ofcourse the validation of short-run profit expectations by realised profitdepends upon the level of investment activity. For decades short-run profitexpectations validated the level of investment in Asia. Increased competitionfrom other powerhouses in Asia, specifically China, have stripped Asiannations of their traditional export markets. The loss of these markets hassignificantly reduced Asian business profitability. This in turn reduced short-run profit expectations but did not reduce investment demand. Henceinvestment continued to surge ahead while profit expectations fell.
But this is only one side of the coin, and ignores the contribution madeby private firms and the financial system to instability in the last few years.Economic instability in Asia has been exacerbated by what Minsky wouldcall the endogenous credit expansion propelled by deregulated financial pro-cesses.21 In Asia’s case, a loose monetary policy and expansionary bankingcredit (much of it financed from overseas) have had an enormous influenceon the region’s economies.22 Governments loosened monetary policy andencouraged investment projects to be evaluated using euphoric prospectivecash flows. The general decline in risk aversion thus set off both growth ininvestment and exponential growth in the price level of assets.
As was the case in Mexico, short-term foreign currency-denominated debtexacerbated Asia’s problems via currency attacks and accelerated investorpullout. However monetary authorities were well aware of the increase inshort-term debt but little attention was paid to the danger signs that wereappearing. Even though the IMF was fully aware of these massive foreigncapital inflows, no action was taken to restrict such inflows because authoritiesperceived the funds to be diverted to favourable investment projects that wouldprovide continued high rates of economic growth. The massive capital inflows,especially in Indonesia’s case, were directed at inefficient speculated assets suchas property and stock assets. In many instances, solvent firms found them-selves in severe trouble due to collapsing currencies. The combination offalling property and stock prices coupled with a general slowdown led to aself-perpetuating process of corporate insolvencies and bank failures thataccelerated currency depreciations. This only caused a further selling of homecurrencies, making firms even less profitable.23
Owing to its unique role in safeguarding the stability of the internationalfinancial system, the IMF played a central role during the crisis. The IMF’s
The IMF: functions, financial crises, relevance 163

goal was relatively simple – to restore stability and confidence in the regionand divert the crisis spreading to the rest of the world. The IMF’s immediateresponse was to aid the three economies most affected by the crisis –Thailand, Indonesia and Korea – and avoid a contagion effect elsewhere.According to Lane (1999: 45) the IMF responded to the Asian crisis byadopting three main policy responses: the first consisted of supporting andfinancing large packages used to stabilise the fall in the domestic cur-rencies,24 the second involved persuading governments to adopt sweepingreform processes aimed squarely at the structure of each economy, and thethird entailed convincing governments of the need for immediate change inmacroeconomic policy to counteract the crisis itself. The IMF encouragedthe governments to adopt harsh economic reforms. This included acontractionary monetary policy designed to restore confidence in the foreignexchange market, a tightening of fiscal policy to ensure that governmentdeficits were at a minimum, structural reforms to the impediments of furthereconomic growth, and an improvement in the financial supervision of thebanking sector.
The IMF was committed to restructuring bank and financial structures inorder to help re-establish investor confidence. Monetary policy was designedto check the downward spiral of exchange rates and to prevent such ratesmoving away from fundamental levels. The decision to allow currencies tocontinue to float freed governments from trying to defend indefensiblepegged rates. The IMF implemented a thorough round of structural reformsaimed at the heart of the weaknesses of the financial systems. The IMF’slong-term strategy of reforming Asia’s financial markets had merit. Evidencedoes suggest that the nations with the most open financial markets in South-East Asia have been affected less by the economic crisis. Indonesia,Malaysia, Singapore and Thailand all introduced financial liberalisationpolicies of removing interest rate restrictions and mobilising savings in the1970s, which were soon followed by dismantling current account and capitalaccount controls.25 While Malaysia and Singapore had dismantled allcontrols, and had taken steps to further deepen and develop their financialsystems as far back as 1978, the other two with large rural economies are stillin the process of complete change. Thus Singapore and Malaysia, which hadgained substantially from greater openness to the rest of the world, havebeen affected less by the currency crisis. Indonesia and Thailand, which arestill in the process of complete reform, have been hit the hardest.
With hindsight it is now clear that the initial IMF reforms in 1997 failedto restore investor confidence and the economies slipped during 1998 furtherand further into crisis. A large part of this failure can be attributed to thefact that external creditors were not convinced that IMF rescue packageswere sufficient to restore currencies to a level that would improve theirdebtors’ ability to service foreign-denominated short-term debts. Moreimportantly, the IMF reform programs were aimed at improving theeconomy as a whole, not the ability of individuals to repay their debt.
164 George Kadmos and Phillip A. O’Hara

Restoring creditor confidence was even more difficult considering that themajority of debt was held by private individuals or organisations and not bythe government.
Many economists believe that monetary policies were not tightenedsufficiently or for long enough in the immediate pre-devaluation phase of theemerging crises in the developing Asian economies. Had monetary policybeen tightened adequately in order to defend exchange rates in the first partof 1997, it is possible that the crisis might have been moderated, if notavoided. However, the IMF did call on Indonesia to tighten monetary policyduring initial negotiations between the two in 1997. In fact, Indonesiaaccepted the IMF’s conditions in 1997 that specifically instructed that nationto tighten monetary policy. Indonesia was incapable of implementing thetight monetary policy that the IMF had wished mainly because its bankingand financial systems were on the brink of collapse. Leading into 1998,Indonesia’s banking system was severely weakened by a combination ofbank collapses and the fall in the rupiah which compounded losses andbankruptcies. Indonesia’s central bank, Bank Indonesia, found itself in thepredicament of trying to provide the much-needed liquidity on one hand,while sticking to the IMF program of tight monetary policy. At least in thiscase, the choice was obvious. Without knowing whether banks were facinginsolvency or liquidity problems, Bank Indonesia indiscriminately providedthe liquidity to prop up the payment system. The end result was that BankIndonesia had no intention, at least at this stage, of adhering to the IMF’s1997 program schedule. As such the IMF was forced to modify their 1997agreement during the latter half of 1998, again calling for tight monetarypolicy. This time the economy had at least stabilised albeit slightly, and BankIndonesia was more successful in adhering to the new agreement, especiallyconsidering the currency had appreciated away from crisis levels.
Given the situation in Indonesia, it is doubtful whether higher interestrates would have been favourable to international capital flows, consideringthat companies’ liquidity problems were already exacerbated following therupiah collapse. On the balance of probabilities, it would seem that inter-national capital markets had already ‘tried and convicted’ the Indonesiaeconomy. Higher interest rates would have worsened the situation fordomestic economic activity and sent many more businesses to the wall.Given that the international market had abandoned Indonesia, it wouldseem logical that Bank Indonesia would abandon the IMF’s program andsatisfy domestic liquidity requirements.
The situation in Korea and Thailand was quite different to that ofIndonesia. The IMF called for tight monetary policy in both countries, as ithad done with Indonesia in 1997 and both countries were able to adhere tothis policy. Such restrictive monetary policy prevented the currencies fromcollapsing to the same extent as Indonesia’s, and as such, monetary auth-orities were much more successful in adhering to the IMF’s programs. Thisof course reflects the differences in the severity of the crises in each country.
The IMF: functions, financial crises, relevance 165

Thailand and Korea were not facing the banking collapses that Indonesiawas facing nor did it experience the severe currency depreciation thatIndonesia faced. As such, monetary authorities were far better equipped tostick to IMF programs than were monetary authorities in Indonesia.
A major lesson from the Asian crisis is the need for the IMF to be fullyaware of the severity of any approaching crisis. The IMF clearly miscalcul-ated the true extent of the crisis.26 Aghevli (1999) states that the IMF wasunaware of the full extent of Thailand’s problems because their currency wasbeing heavily supported by the government’s intervention in the forwardmarket. The IMF apparently had no idea that most of that country’s foreignreserve was being used to stabilise the baht until the government finallyapproached the IMF in mid 1997 with the news that their foreign reserveswere nearly depleted.27 Austerity policies promoted by the IMF clearlymissed their mark and misrepresented the true causes of the crisis. It doesappear that a significant part of the IMF mistake lay in poor forecasts. Thismay be partly due to the information the IMF was receiving from thecountries themselves. Every time the IMF received additional information,its fiscal proposals were adjusted. This did not help to stabilise an alreadyvolatile economy. The signals sent to the market were detrimental to quickrecovery. Had the IMF known the true picture, its response may have had amuch faster positive influence on stabilising the economies.28
The programs set up by the IMF and agreed to by the authorities weremeant to restore investor confidence and reverse the flight of internationalcapital flows that had crippled the exchange rates. It is now clear that theinitial IMF programs were less successful in Thailand and Korea and faileddismally in Indonesia. Market confidence was not restored and exchangerates continued to fall throughout the first half of 1998. Such currencydepreciations compounded corporate debt, which weakened bankingsystems even further. The vicious cycle had set in. The more the currencyfell, the more debt corporations accumulated; the weaker the banking andfinancial systems, the further the currency fell. The IMF had completelyunderestimated the severity of the crisis. This underestimation was notrestricted to the IMF, the entire financial world had also discounted thecrisis. But the fact that the IMF had done so highlights the inadequacies ofthe IMF at present. Its inability to correctly gauge the economy andtherefore implement appropriate policy is a serious flaw.
Asia appears to be recovering – albeit slowly. Economies are approachingpre-crisis levels spurred on by an increase in domestic demand, especiallyprivate consumption. In many economies, fiscal policy has been usedmoderately to encourage faster recovery. Exports are also slowly increasingto take advantage of a strong economy globally. The exceptions to the ruleremain Indonesia and Thailand, though both economies have stabilisedsignificantly and trends suggest that economic activity will pick up through-out the next twelve months. It will be important that the lessons learntduring the crisis are adhered to and that recovery does not provide a false
166 George Kadmos and Phillip A. O’Hara

sense of security to authorities. Many reforms are still either in process oryet to be tackled. Asia can rebound again, but important challenges willneed to be faced before the economies are able to be as successful in the firstfew decades of the new millennium as they had been during the last fewdecades of the previous one.
The Russian crisis 1997–1998
Following the several waves of pressure on emerging markets since 1997 thathad emanated mainly from Asia, Russia became a new source of contagionduring August 1998, causing global confidence to deteriorate. Prior to theAsian economic crisis, the Russian economy had stabilised after earlierproblems and its stock market had risen 150 per cent for the twelve monthsending June 1997. Russia has had a torrid run in moving towards a marketeconomy. Sanders (1998) reports that GDP in Russia fell 42 per cent between1992 and 1995, while industrial production fell 46 per cent over the sametime. The Russian people have been devastated by several years of economicturmoil. Since the Soviet Union collapsed, real income has plummetednearly 40 per cent. A quarter of the population now lives under thesubsistence level while a third live under the poverty line. One-quarter of theworking force is either not paid at all, or paid months in arrears.
However, by the second half of 1997 the Russian economy began to feelthe effect of the Asian crisis as foreign investors withdrew from the market.29
A decline in world oil prices and a blow-out in the Russian budget exacer-bated the contagion effects from the Asian crisis.30
By May 1998 the situation was so severe that the economy was on the vergeof collapse. In an attempt to control the exchange rate, the Russian centralbank increased interest rates on government bonds to 200 per cent a year. Italso supported the currency on the open market by purchasing its currency inan effort to keep the exchange rate at an acceptable level. It became obviousthat the Central Bank could not support the currency forever and that it wasonly a matter of time until the government had to borrow even more funds tosupport the ruble. It was also obvious that the Russian government would beforced to negotiate yet another bailout package with the IMF.
The IMF prescription for Russia was no different to the advice it gaveMexico and Asia: fiscal and monetary contraction, liberalisation andprivatisation of markets and banking sector reform. The IMF agreed in July1997 ‘in principle’ to a $22.5 billion dollar bailout, which included previouslycommitted funding from the IMF as well as funds from the World Bank andthe government of Japan. The IMF’s objective was to provide foreigncurrency reserves that would enable Russia to defend the ruble long enoughto implement the reforms needed to achieve long-term stability. However, byAugust the Russian Central Bank announced that it was incapable ofsupporting the currency any longer and the ruble fell 300 per cent, from 6.2rubles per US dollar to over 20.
The IMF: functions, financial crises, relevance 167

It is, however, now obvious that the IMF and its $22.5 billion bailoutfailed to rescue Russia. Investor confidence was not strengthened, the stockmarket continued its decline, and interest rates on government bonds againclimbed above 200 per cent. The causes for cynicism about Russia run deep.A number of interrelated difficulties have combined to cause a generalbreakdown of the Russian economy. The first problem relates to fiscal policy.The Russian budget deficit had been running at about 7.5 per cent of GDPfor several years while the taxation system had completely broken down andis totally ineffective. The process of collecting taxes is also considered to beinefficient and corrupt. Gaidar (1999) believes that a soft budget constraintcoexisting with a soft administrative constraint exacerbated the Russiancrisis, whereas in the former Soviet economy, soft budget constraints existedwith hard administrative constraint, ensuring a rigid control over theappointment and performance of managers. The soft budget constraint wasseen as a consequence of ‘a state budget process far removed from consider-ation of efficiency and profit’. This problem is not restricted to Russia alone:nearly all the post-communist economies have suffered the consequences ofsoft budget constraints and soft administrative constraints.
Gaidar (1997: 13) lists two main points of criticism of the IMF’s responseto the Russian economy prior to the Asian crisis. The first includes the factthat the IMF lost precious time to aid the Russian economy by taking itstime to influence the Russian reform process. The IMF’s packages were toolittle too late and ‘condemned Russia to prolonged crisis and stagnation’; thesecond fault lay in the programs the IMF suggested in the first place. Exces-sive tightness and dogmatism of IMF programs that were inappropriate toRussia’s needs condemned them to fail. In a ‘postsocialist era, due to aspecial structure of the economy, inflation has a nonmonetary character,which is why ordinary stabilisation programs directed at slowing down therates of money growth are not applicable in those conditions’.
The post-communist national economy is full of goods and servicesconsidered inferior in both quality and price compared to other inter-national markets. Clearly a major problem is to do with government mis-management and lack of expertise. Russia has an inadequate level of trainedand experienced labour. The move from ‘communism’ to the ‘free market’has left a wide gap in training and expertise that Russia is finding difficult tofill. As such, the Russian legal and legislative system is inappropriate for thenew market economy. The end result is that the legal and political system ininept, corrupt and unwilling to solve Russia’s economic problems. The IMFbailout has helped to calm the Russian financial markets and moreimportantly given the government crucial breathing space to implement itsreform agenda. The fundamental problem with the Russian economy hasless to do with bad IMF advice and more to do with domestic policyinaction. The Russian government and people themselves have shown littleenthusiasm in adopting the necessary reforms that will complete transitionto a market economy. The result is that Russia is caught between its old selfand a haphazard attempt to conform to a market economy.
168 George Kadmos and Phillip A. O’Hara

Such an economic and political structure is not conducive to marketstability. The loans made by the IMF and the conditions that accompaniedthem could never be seriously meet.31 The Russian government was bothincapable and unwilling to carry out the necessary reforms that accompaniedIMF loans.32 On the part of the IMF, it was unable to convince the Russiangovernment to carry out the reform process, but continued to pay thetranche payments.33 The IMF continues to play a pivotal role in Russia’sprogress. But it is often criticised as being the cause of Russian economicproblems. However, without the IMF most probably Russia’s problemswould be more severe.34 The IMF is a critical influence pushing towardreform in Russia.
Concluding remarks on financial crises
There are striking similarities between the three crises that have been discussedto date. With respect to Mexico and Asia, the crises were largely unanticipated.Mexico and most of Asia ‘appeared’ to be running sound economies. Mexicohas been enjoying a good run since the mid 1980s and the Asian Miracleappeared to never end in Asia. This provided ideal opportunities for investors.Once problems started investor confidence changed abruptly, leading to boutsof panic and massive outflows of foreign capital. Similarly, the suddeninterruption of capital flows unleashed a deep crisis in domestic financialmarkets, threatening the stability of the economies.
What exacerbated the problems in both Mexico and Asia was the fact thatMexico and most of Asia operated pegged exchanged rate systems. Thismade it difficult for governments to defend their currencies during the crises.In both instances, stocks of foreign capital were at dangerous levels due toefforts to stabilise local currencies. Efforts to stabilise the currency viainterest rate raises caused severe negative impacts on the financial systemsand spilled over into the banking systems. The fact that both Mexico andmost of Asia run pegged exchange rate systems encouraged investors toborrow in foreign currencies and transfer the risk from the investor to thebanks. In Mexico, as in Asia, appreciation of the real exchange rate, growingshort-term external debt, and the size of the external current account deficit,compounded by the weakness of the financial system, exerted strongpressure on the foreign exchange market. This resulted in drasticdevaluations as it became impossible to defend currency parities indefinitelyby drawing down reserves and raising interest rates, particularly in light ofthe weakness of domestic financial systems.
In all three cases, important information pertaining to the level of foreignreserve levels was withheld from the IMF. With respect to Asia, this wasespecially the case in Thailand. Investors were therefore uninformed aboutthe true extent of the economic problems. Once investors were confrontedwith the problems, they behaved accordingly. The crisis in Mexico, Asia andRussia shows that the global capital market exposes and punishes economicweaknesses especially those that are unanticipated. It is also clear that the
The IMF: functions, financial crises, relevance 169

global market brings the increased risk of global contagion. It is thereforeessential that governments adopt appropriate policies. However, whatappears to be more important than coherent economic policy is the freetransparency of financial systems. This raises the question of the ability tomonitor and supervise capital markets. Economies must be open andinformation made available to investors. Unlike in Mexico, IMF rescuepackages in both Asia and Russia included substantial structural reforms inthe banking and financial sectors. These reforms were the main part of theIMF rescue packages aimed at restoring investor confidence and ensuringpositive rates of economic growth in the future.
The IMF has been offering the same structural ‘template’ for troubledeconomies for over two decades. Three main instruments appear to havebeen used by the IMF in Mexico, Asia and Russia: tight monetary policydesigned to increase local interest rates and prop up falling currencies; tightfiscal policy via increased taxation and lower government spending in orderto reduce the government deficit; and liberalisation of financial markets inorder to remove restrictions on foreign capital flows while placingrestrictions on domestic bank lending practices. The consequences of thesepolicies are also similar. In Mexico, Asia and Russia the IMF policiesdesigned to stabilise the economy in the long run also helped to destabilisethem in the short run. High interest rates and restrictions on credit restrictedconsumer demand and forced many profitable businesses to the wall. This inturn led to further unemployment, reductions in production and a furtherfall in investor confidence.
Relevance of the IMF for the future
The past decade has witnessed a systematic reduction in internationalbarriers to goods, services and capital across national borders. Thesechanges pose new challenges to the international community. Industrial anddeveloping nations alike are now more exposed to shifts in their externalpositions than ever before. The crises that hit Asia and Russia have nowbecome a familiar feature of the global economy. This raises the question ofthe relevance and future role of the International Monetary Fund. The IMFtoday is remarkably different to the one that was established in 1945, and theworld economy is fundamentally different. The IMF’s main functions todayare somewhat different from those it was empowered to perform fifty-fouryears previously.
Many commentators believe that the IMF has lost its relevance andtherefore should be abolished.35 The Fund’s performance during the Asianand Russian crises has given what was a very small minority increased vigourto press their case for the IMF’s termination. Many others believe that thehundreds of billions of dollars that have been lent to developing nationssince the Fund’s inception have actually damaged their prospects andreduced their rate of growth. Instead of promoting stable economic growth,
170 George Kadmos and Phillip A. O’Hara

many believe that the IMF has encouraged financial profligacy and inter-national dependency. Most of all, these critics are concerned that the IMFhas supported corrupt regimes that dominate workers. Apart from this, thedebt burden that these developing economies carry stifles economic growthto the point that governments are barely covering the interest payments ontheir loans, let alone investing in their infrastructure.36
Niskanen (1999: 331) argues that there are three reasons why the IMFshould be abolished. First, the IMF is incapable of fulfilling the role oflender of last resort because it is unable to create high-powered money andcannot react quickly to prevent liquidity crises. The time taken once anapplication for funds is received is time consuming. IMF loans are onlygranted after lengthy negotiations between the borrowing nation and theIMF council. Therefore the IMF is incapable of preventing collateraldamage caused by a crisis; it is, however, capable of mopping up the damagedone once the crisis has emerged. Second, the IMF has not been effective inpersuading borrowing nations to adopt the macroeconomic policies neces-sary to prevent further crises. For example, many of the poorer developingcountries such as Mexico are requiring assistance regularly. With the numberof nations that require continual assistance, it may appear that the IMF hasnot been successful in persuading the respective governments to turn theireconomies around.37 Third, because the loan process is time consuming,borrowing nations often find themselves with IMF funds which are too little,too late. Often IMF assistance cannot ensure exchange rate stability, result-ing in depreciation of domestic currencies that only serve to increase theamount owed in domestic currency to meet the obligations made in foreigncurrency.
Calls for the abolition of the IMF originate predominately in the majorindustrial nations. Without the IMF, however, poorer nations would havelittle access to funds. These countries are unable to obtain funds from inter-national capital markets and are therefore reliant on the IMF. Internationalcapital markets lend little money to poor nations that are in need of massivestructural changes. What is clear is that, despite the problems the IMFobviously has, its role is still important and therefore we need to improve theIMF in order for it to be relevant in the future.
Global Central Bank and a second Bretton Woods
The Mexican, Asian and Russian crises have highlighted the need to reformthe International Monetary Fund. In the future, the IMF should move frombeing an institution that predominantly acts as a lender of last resort tobeing one that monitors and coordinates global macroeconomic policieswith domestic governments. The relevance of the IMF hinges on its successin achieving this goal. To a large extent, this will depend on how the IMFrelates to the major industrial powers. As it stands now, the IMF has littleinfluence with these governments. The IMF must be seen to be the premier
The IMF: functions, financial crises, relevance 171
monetary institution not just by the poorer nations, but by the majorindustrial powers as well.
The relevance of the IMF and the role it should play in the future isobviously dictated by the environment in which it is forced to operate. Soros(1999: 56) paints the future correctly by stating that ‘the essential point isthat the global capitalist system is characterised by not just global free tradebut more specifically by the free movement of capital’. It is thereforedoubtful that the IMF, in its current role, is useful in playing an active andbeneficial role in the future. Currently, the IMF performs three mainfunctions: surveillance and analysis of member nations’ economies and theinternational economy as a whole, lending to member nations, and offeringtechnical assistance and training. Historically, the fund has performed thesecond role under its main goal of being a ‘stabilisation fund’. According toSoros (1999), international capital flows are too volatile, and this can subjectrecipient economies to crises that are too large and frequent. At the momentthere are few controls over international banking activities. At presentbankers are encouraged to increase their lending, and corporations, throughthe taxation system, have an incentive to increase leverage ratios. Therefore asystem of capital controls similar to the proposal put forth by Malaysia maybe necessary. The crises in Asia that spread to Russia and then on to LatinAmerica highlight the dangers of contagion. It is therefore important thatthe world finds a solution to the dangers of excess volatility and the threat ofcontagion.
What the world needs is a global monetary institution that is capable ofregulating the new global market and preventing future crises from turninginto severe depressions. The experiences both in Mexico and in Asia high-light the damage that can be done in a modern system of free capitalmobility. In both cases, investor panic led to the devaluation of localcurrencies, destroying strong economies. Of course, the uninhibited access offoreign capital exacerbated the problems. Credit and finance were too easilyaccessible in many cases and there were no controls on how these funds werebeing used. Lack of transparency withheld information from investors. Thiscontributed to a series of panics that caused major runs on currencies. It isclear in this global market that no one government is powerful enough todefend against a run on its currency. The global market is too big for anyone player – and it will get bigger. Even the largest economic power – theUnited States – will not be immune to the global economy.
There appears to be strong grounds for a second Bretton Woods-typeconference. It is true that since the IMF was established in 1944, theinternational financial system has evolved to the extent that largely restrictsthe IMF’s capability to stabilise world markets. It is therefore time torestructure the IMF so it can carry out a more integral role in the globaleconomy. This includes allowing the IMF to take a proactive role inpreventing future crises – not just stabilising them once they have arrived. Atpresent, the IMF’s influence in preventing crises is limited. The future IMF
172 George Kadmos and Phillip A. O’Hara

must move away from stabilising economies after crises to an institution thatendeavours to prevent crises.
The IMF therefore must be active in four areas: monitoring global trends,coordinating global macroeconomic policy between domestic governmentsand itself, providing appropriate assistance to economies in need (whileconsidering domestic issues when recommending policy changes), andproviding technical assistance wherever possible. Of course, the IMF canhave a role in many other areas, but these activities should form the core ofits operations into the next century.
Monitoring and supervision
The IMF needs to continue to monitor the international monetary systemand the world economy as a whole. Its relationship with the governments ofits members must be strengthened, especially the relationship with the majoreconomic powers. The IMF will continue providing important financial andtechnical assistance to developing and transitional economies. Theenormous growth in international capital markets has rendered the IMFineffective in the major industrial nations, while its role in the developingand transitional economies is unclear and fragile. The recent crisis in Asiaand Russia highlights the need for the IMF to be better equipped tominimise the risk of contagion. The higher the risk of contagion, the higherthe risk of irrational behaviour among investors. The IMF needs to ensurethat it has enough cash on hand to meet its members’ borrowing needs in theevent of an economic crisis.
The key to preventing another crisis, and one in which the IMF needs tobe involved, is transparency. The experiences during the Asian and Russiancrises show that governments are reluctant to provide a complete picture oftheir economic situation often until it is too late. Both Russia and Thailandwithheld important information pertaining to their economies that the IMFshould have known before recommending policies. This succeeded in exacer-bating the effects of the crisis in Asia and Russia, which could have beenavoided if the information was known sooner. Lane (1999: 47) agrees thatthe IMF must be better equipped to monitor the situation within domesticeconomies and that the IMF requires ‘improvements in standards for datadissemination and steps to increase the transparency of policies that helpmarkets to improve their pricing of risk, inhibiting the build up ofimbalances, and also spur policymakers to take timely action to addressvulnerabilities’.
The IMF has a role to play when monitoring moral hazard. Foreignlenders and domestic borrowers must be aware of the risks involved inbehaving in ways counter to financial stability. Domestic governments mustalso take responsibility for the workings of their own banking systems. Whatwas made apparent during the Asian crisis is the point that good economicmanagement by the domestic government is not sufficient to prevent a
The IMF: functions, financial crises, relevance 173
financial crisis. As previously stated, most of the fiscal and monetary policiesadopted by Asian governments were appropriate. What they lacked wassound financial supervision and good corporate practices.
Mayer (1998) highlights the need for ‘some sort of registry that would callattention to any bank’s or national banking system’s continuing increase inshort-term borrowings from financial firms’. The IMF is empowered underArticle IV of its Charter to exercise ‘firm surveillance over the exchange ratepolices of its members’. According to the IMF’s Annual Report (IMF 1992:15):
The effectiveness of Fund Surveillance has less to do with strengtheningthe principles of surveillance and more to do with the willingness ofmember countries to consider fully the views expressed by the inter-national community – through the forum – in formulating and adoptingtheir macroeconomic and structural policies.
IMF surveillance should concentrate on the cause of such crises and thepolicies required to smooth the adverse effects on both domestic and globalmarkets. Surveillance can also provide the early warning required, ensuringthat policies and measures are in place to ensure that the adverse effects areless unstable. Good surveillance should reduce the collateral damage and therescue packages required in assisting troubled economies. Surveillanceshould also highlight vulnerabilities in members’ economies. Suchvulnerabilities can be addressed before problems occur. Inadequateeconomic information can add to the severity of crises facing domesticeconomies and prevent authorities from providing the correct policy adviceto ensure an economy is in the best position to ride out the crisis.
Cooperation
Because of the globalisation of capital markets, monetary and fiscal policiescan no longer be made on the basis of exclusively domestic considerations.Approximately US$1.3 trillion is traded every day in world currency markets.The sheer size of the new global market means that without joint action,individual central banks have little influence in the market. Monetaryauthorities will need to make some adjustment in order to enable them tofunction effectively in an interdependent world. Economic policy will need tobe far more coordinated than ever before. The IMF stands well placed to havea significant impact in ensuring that governments closely work together inorder to achieve ‘global’ goals in the future. At present, the IMF appears tohave little influence in the major industrial economies.38 According to Fischer(1995: 171), the IMF has evolved into a ‘specialised development agency’ thatacts as a lender of last resort to the poorer economic nations.
The need to integrate the former ‘communist’ countries and shape thepoorer nations in Africa and Asia has provided a new challenge for the
174 George Kadmos and Phillip A. O’Hara

IMF.39 However, its effectiveness in carrying out these challenges depends onits own relationship with the major industrial countries. The relevance of theIMF, therefore, depends on how well it deals with its richer members and ifit is able to persuade them to follow global rather than domestic interests.The IMF was founded predominantly by the United States and the UnitedKingdom. During the first few decades, the IMF served both the interest ofthe major industrial powers as well as the interest of the emergingeconomies. The institution was created by the major economies in order tostabilise an unstable global economy. The post-war (1950s–1960s) boom inthe major industrial economies can to some degree be attributed to thesuccess of the IMF and World Bank.
The major industrial countries account for over two-thirds of worldproduction and, therefore, their support is crucial if the appropriate changesare to be made. The problem with the international economic community, asFischer (1995) recognises, is that the major industrial economies have shownlittle inclination to alter their domestic economic policies unless such changeis in their ‘best interest’. The IMF needs to encourage greater financial sectorcooperation to promote stability and to avoid currency runs. It needs toencourage individual governments to implement stricter control on theirbanking systems while providing a better safety net in case of trouble. Riskcontrol should be improved by encouraging better disclosures concerninginterbank lending, while the government encourages better market disciplineby exercising closer monitoring activities. Good fiscal and monetary policymust encompass improved compliance monitoring by the central banks.While individual central banks are ideally suited to monitor domesticactivities, the IMF is well placed to monitor global trends.
The IMF must also encourage better cooperation between the majoreconomies and the developing nations. Central banks from the majorindustrial economies are well equipped to monitor domestic lendingactivities. Central banks in major industrial economies have developed welllaid out rules of supervision. Though domestic lending practices are wellmonitored, the same cannot be said for international lending practices. It isclear most foreign capital pouring into developing economies originatesfrom the major industrial powers. Guitian (1994) believes that bettersupervision of foreign capital would help smaller vulnerable economies byreducing their country risk and satisfying investors that an increase inforeign capital will be put to good use. Currently there is no global centralbank that monitors these flows. It is appropriate that the IMF take a largerrole in this area.
Recommending appropriate policies
The IMF has encouraged rapid liberalisation irrespective of the condition ofthe relevant banking and financial system. Many commentators believe thatthe pace of change placed on some economies by the IMF causes instability
The IMF: functions, financial crises, relevance 175

rather than enhancing stability. Meyer (1999) believes that ‘we have to matchthe pace of capital account liberalisation with careful consideration ofexchange rate regimes and efforts to improve corporate governance and bankregulation and supervision’. He goes on to say that:
The sequencing perspective also suggests that the story behind the crisisin emerging Asian economies may have less to do with the inherentinstabilities of global capitalism than with a mismatch between theevolution of institutions and policies and the pace of liberalization offinancial markets and the capital account, the critical entry points toglobal capitalism.
(Meyer 1999: 152)
Taylor (1997: 146) states that IMF packages attempt to promote fastereconomic growth as well as economic reform by ‘stabilising’ the macroeconomy then ‘adjusting’ the market by implementing sweeping reforms.Many economists believe that the IMF acts too swiftly and thereforeimplements policies that ‘overkill’ the causes of the crisis being felt. Insteadof stabilising the economy, many believe, IMF policies contract economiesinto recessions. The result is the adoption of IMF policies that end upbackfiring on economies that are not ‘ready’ for the pace of reform.40 Forinstance, Taylor believes that IMF policy is too influenced by what he callsthe ‘Washington consensus’ which amalgamates traditional macroeconomicstabilisation policies such as market deregulation, supply-side reform andprivatisation of public enterprises into one. The Washington consensus isconsidered to be inappropriate in all circumstances and should not be usedby the IMF or World Bank as a ‘template’ for global restructuring.
There is considerable debate that debtor nations should have the right todecide for themselves how they wish to adjust when confronted with apermanent adverse shock.41 If the nation fails to implement appropriatepolicies suited to their domestic needs, they then should be forced to acceptthe IMF’s conditions without exception. The unwillingness of Russia tocommit to any reform agenda has probably convinced the internationalcommunity that the best method is to coordinate policy between domesticgovernments and the IMF. Although the IMF states that its policies arealways agreed on beforehand, it is clear that domestic governments have littleinfluence when much-needed IMF funds are in the balance. The IMF mustrecognise the independence of each economy and avoid using ‘templatepolicies’ when negotiating IMF loans. The speed at which financialliberalisation is undertaken must be appropriate for the economy inquestion. The IMF needs to be better aware of the limitations of eacheconomy it deals with. While the benefits of financial liberalisation areplentiful, the speed at which it takes place is crucial. Should a country beexposed to too much change it will experience structural setbacks that maynot just jeopardise the economy in question, but eventually the region in
176 George Kadmos and Phillip A. O’Hara

which it resides. Aghevli (1999: 31) admits that most Asian economies‘liberalised short term capital inflows before foreign direct investment, whenthey should have done it the other way around’. The result was a‘combination of partial liberalisation and structural rigidities that meantcapital was invested without regard to risk’.
Technical and financial assistance
The IMF has been extensively involved in the provision of technicalassistance since its inception. The Fund currently provides assistance in awide variety of fields including fiscal and monetary policy, balance ofpayments, exchange rate, trade and finance and statistical collection. TheIMF assistance packages are usually provided in conjunction with financialassistance, though there are cases where the provision of technical assistanceonly has been considered appropriate.
The goal for the IMF is to ensure that transitional economies are able toaccess much-needed foreign capital without making their economy volatileto the crises that have plagued Mexico, Asia and Russia. It is thereforeimportant that the IMF is able to provide the expertise needed to transformthese economies at a pace that is commensurate with their capacity todevelop sound regulatory and institutional structures. The IMF must alsoensure that moral hazard problems are attended to. Financial intermediarieshave little incentive to adopt safe lending practices when their actions areguaranteed by a higher institution. Though there was no direct guarantee tointermediaries in Asia, the perception was widespread that governmentswould bail out institutions that found themselves gravely in danger.
The IMF must continue providing the technical assistance that economiesneed to move from closed inefficient markets to global capitalist markets.The problems in Russia are exacerbated by the lack of trained and skilledprofessionals in the areas of economics and finance. Russia’s successfultransformation to an open market economy depends on it attaining sufficientskills and experience. The IMF should work closely with major industrialeconomies to ensure that all developing nations attain the necessary skills toensure a stable market.
In addition to providing the necessary technical assistance, the IMFshould be equipped to provide the necessary financial assistance duringmajor economic crises. Soros (1999: 60) proposes a new global monetarycurrency (a new ‘SDR’) that would be used to supplement members’ currentassets. He proposes the establishment of an ‘International Credit InsuranceCorporation’. The new institution would guarantee, up to a certain limit, theloans that member states make with private financial institutions.42 If themember state were to default on its debt payments, the IMF would pay thosedebts up to the limits the member state has agreed with the IMF. The IMF,acting as the global central bank, would effectively become the lender of lastresort to the global economy.
The IMF: functions, financial crises, relevance 177

Many opponents of the IMF are totally against the idea of giving theIMF more money. These economists believe that current capital markets areable to provide the funds to liquidity-constrained economies at interest ratesthat reflect the level of country risk. Private markets are therefore in the bestposition to lend money to these economies. The IMF increases moral hazardand sends a message to investors that they can invest with little fear of atotal loss. Moral hazard results in excessive risk-taking because investors areshielded from losing all their money. The private market is seen on the otherhand as preventing moral hazard problems from arising. Private financialinstitutions are less likely to accept riskier investment projects if they havelost their safety net.43 The market would also be able to provide fundsnecessary quickly, and as such, prevent investors from fleeing from onemarket to the next. Many believe that the IMF should have allowed theprivate sector to sort out the problems in Asia. Private institutions couldhave renegotiated debt with their creditors. The role of the IMF would havebeen one of consultation and not involvement. However, no matter whichway you look at it, the so-called ‘private sector’ view fails to appreciate theextent of the Asian crisis. Once many of the Asian currencies had collapsed,debtors were either insolvent or close to bankruptcy and the prospect ofrenegotiating any further lending would have been near impossible. If somehad been successful, the terms that they would be forced to accept would nothave been conducive to long-term recovery.
However, in order to work, the IMF must have power to prevent any onemember falling into too much debt with private institutions. There should bea limit to the extent that any one nation can borrow. This is imperative if thenew central bank is to work. The guarantee limits placed on each memberstate should be sufficient to pay the vast majority of that member’s debts.If a member were to default on debts that were well above the guaranteedlimit provided by the IMF, such guarantees might not be sufficient inpreventing further crises and contagion effects. It might be possible to extendguarantees above those which were originally agreed upon, thereby allowingmembers to increase their debt burden, but only if the total value of worlddebt did not exceed the total value of guarantees. The IMF needs to be ableto fend off not just a regional crisis, such as the Asian economic crisis, butalso a global crisis that endangers the whole world. Unless the ‘global freemarket’ is appropriately monitored and controlled, it will always have thepower to destroy international capital markets.
The future role of the IMF should be changed from ‘ex-post stabilisation’to ‘prevention’. This can only be achieved by allowing the IMF to have realpower to carry out its role. One method would be to convene a secondBretton Woods conference. As stated previously, the key is to align the majorindustrial powers. There appears to be widespread contempt for the IMF insome of the major industrial powers – especially the United States. Thesepowers must be brought back into the fold and a new agreement reached.The worst possible outcome is for the world to do nothing until a major
178 George Kadmos and Phillip A. O’Hara

financial crisis forces it to act. If the world adopts the necessary adjustmentsnow, it will go a long way in preventing a major global crisis. Economiccrises are as natural as booms. It is clear that the more global marketsbecome, the greater the risk of contagion and the greater the collateraldamage inflicted once a crisis does occur. Therefore, monetary authoritiesshould act sooner rather than later.
Conclusion
The IMF has had extensive influence in the post-war world economy. Thisinfluence ranges from the resurrection of many war-torn industrial economiesafter World War II to the adoption of the Bretton Woods agreement onexchange rate management. During the 1960s and 1970s the IMF wasprominent in the integration of the newly industrialising countries into theinternational economy. The IMF was also significantly involved in thetransition from a fixed rate system to one of flexible exchange rates. TheIMF has also been successful in preventing wider collateral damage follow-ing the debt crisis of the early 1980s and is now involved in reshaping theformer communist countries into market economies.
The IMF’s future is important for the stability of the financial system as awhole. In all three financial crises, in Mexico, Asia and Russia, the crux ofthe problem appears to be the failure of domestic governments to controllarge current account deficits, inefficient exchange rate systems, the burstingof speculative bubbles in the property and stock markets, the transition ofpreviously tightly regulated markets into free market systems, and the failureof monetary authorities to provide the prudential supervision required in anopen market. In all three cases, the weakness of the banking and financialsectors played a significant role in the severity of the crises. IMF effortsshould be directed at ensuring that banking and financial systems areappropriate and capable of handling the changing trends.
The lessons learnt from the Mexican, Asian and Russian crises clearlyshow the need for a global monetary authority that is able to monitordevelopments while having the financial clout to implement swift remedies.The common mistake made by the IMF during the Mexican, Asian andRussian crises was that it failed to gauge the true extent of the problemsbeing faced. This resulted either in inappropriate policy being recommendedor in decisions being made too little, too late. The IMF should have moreeffective surveillance over countries’ economic policies and practices. Thisincludes the power to force full disclosure of relevant financial and economicdata to the market. The IMF also has a role to play in encouraging betterprudential supervision by central banks and encourage them to adoptacceptable ‘best practice’. It is clear that the integration of financial marketsmust be undertaken in an orderly way and in the best interests of theintegrating economy. It would appear that the IMF has paid too muchattention to the speed with which many markets were reforming their
The IMF: functions, financial crises, relevance 179

economies, which aided instability within the market. Financial liberalisationmust be undertaken carefully. The IMF is well placed to ensure that this isaccomplished. The IMF is also well placed to promote regional and globalcooperation between emerging markets and established markets.
The fixed exchange rate system has been abolished in favour of a moreflexible exchange rate regime. The mobility of capital is also much freer thanit was fifty years ago, while the market’s ability to punish weak economies ismuch greater. Economies are far more integrated than they were and theconsequences of a player’s actions can permeate across international marketsquickly. With the emergence of the global economy and the ease with whichmarkets can be punished for the ills of their governments, severe crises areprobably becoming the norm. The pulse of the global economy is investorconfidence. Once this confidence is damaged, it takes an enormous effort torestore. The loss of confidence can cause investors to behave erratically.Erratic investor behaviour affects exchange rates and stock prices. Inaddition, weakness in one economy can increase the likelihood of problemsin another. The collateral damage caused by contagion can damage worldmarkets for a long time.
The relevance of the IMF can be summed up in four main areas: surveil-lance, coordination, good policy proposals and a continuous supply oftechnical and financial assistance. Proper IMF surveillance will play a crucialrole in the prevention of future crises. The IMF must increase its monitoringof international capital markets, including assessing the risks involved infurther opening capital markets. In addition to increasing surveillance, theIMF must promote greater openness between its members and itself andbetween the members themselves. The IMF must improve the availability ofinformation between capital markets. The IMF is also well placed toencourage governments to improve their banking systems in order to preventthe unsupervised lending arrangements that were partially responsible forthe Asian crisis.
Freer information will help to prevent small economic shocks turning intomajor global crises. The IMF is well placed to improve information betweeninterbank and inter-government lending. Third, the IMF must establishsound economic policies that are suited to individual economies. All toooften, the IMF has used ‘template’ fiscal and monetary proposals that are illsuited to the economy in question. Unless the IMF understands localconditions its efforts to stabilise economies will prove futile. The IMF shouldencourage economies to modernise, but they must do so in an efficient andprudential manner. This will help to maximise the benefits and minimise therisks associated with restructuring an economy. Furthermore, financialglobalisation has increased the speed with which disturbances in one countrycan be transmitted to others. The new global economy, although a cause ofimproved economic conditions for many, has increased the likelihood of amajor global economic crisis. The IMF’s role in preventing this crisis isparamount. What is therefore needed is a second Bretton Woods conference
180 George Kadmos and Phillip A. O’Hara

to effectively make the IMF the new ‘global central bank’. The IMF musthave the power and resources to prevent a global crisis. It will only be able toaccomplish this task if it has the support of the major industrial powers. Justas the United States and United Kingdom were willing to concedeconsiderable autonomy to the IMF during its inception, the major industrialpowers must show the same goodwill now and concede again in order toensure a stable global market. It is also important that the second conferencebe held sooner rather than later. The worst-case scenario is for the world todo nothing until a major global crisis forces it to act.44
Notes
1 Under a fixed exchange rate system a government can adjust its balance of pay-ments by trading its domestic currency for foreign currency or gold. Currencydevaluation depreciates the domestic currency with respect to foreign currencies.Reciprocal to this is the appreciation of foreign currency with respect to thedomestic currency. Because foreign currency is now worth more, domestic goodsare cheaper in foreign stores, stimulating an increase in the demand for domesticexports.
2 Governments that devalue their currency in order to stabilise a chronic imbalancein their balance of payments often succeed in only weakening the currency’sinternational acceptance as legal tender.
3 The IMF now has 182 members.4 Of course, this was abandoned in 1972, when the United States removed itself
from the gold standard. Most nations now have flexible exchange rates that floatfreely and are not fixed to any specific level.
5 Gold was also set at US$35 per ounce.6 An agreement was also reached to set upper and lower limits within which
exchange rate fluctuations were permitted in response to market conditions. Atthe time of the conference the IMF set this limit at 1 per cent in either direction.
7 As at January 1999, the total value of quotas is approximately SDR 212 billion(about US$300 billion).
8 Quotas are assessed every five years and can be changed according to the needsof the IMF and the economic prosperity of the member.
9 Each member has a basic allotment of 250 votes; in addition, it obtains onevotes for each 100,000 SDR it contributes to the fund.
10 The United States, being the largest economy, contributes most to the IMF,about 18 per cent of the IMF’s funds. It subsequently has the largest number ofvotes, about 18 per cent of total votes.
11 Dell (1981) states that there should exist a degree of conditionality that shouldvary depending on the size and ‘originality’ of the deficit. The author proposesthat funding should be made available to other forms of deficits and not just thosethat originate due to export shortfalls. Nations may fall into deficit because ofwars in neighbouring countries, natural disasters, protectionism in developedcountries or the position of the world business cycle.
12 Williamson (1982: 18) states that India used the IMF as a lender of first resort inNovember 1981 when it obtained a $5 billion loan. Critics believe that India hadnot exhausted its credit with the commercial banks before approaching the IMF.
The IMF: functions, financial crises, relevance 181

13 Camdessus (1995) reports that Mexico achieved good economic performancesbefore the crisis. Inflation fell from 160 per cent in 1987 to 8 per cent in 1993.Economic growth, which had languished at zero between 1985 and 1988,increased to 3 per cent in 1993. The problem of course, is that this increase inpositive economic activity paved the way for Mexico’s worsening current accountdeficit. By 1993, Mexico’s current account deficit rose to 6.5 per cent of GDPand was principally financed by short-term debt. As early as February 1994, theIMF stressed to the government the need to reduce the current account deficit inorder to offer some defence against a sudden reversal of capital flows.
14 Of the some $70 billion dollars invested in Mexico, only $10 billion actuallywent into new factories, industry, capital creation, and job creation entities. Therest went into speculation, debt service, and into the coffers of the thirty-twowealthiest haciendas of Mexico. Much of it flowed into offshore banks andinvestment houses.
15 Eighty-five per cent of Mexican lived on an income equivalent to that of thelowest 10 per cent in the United States.
16 The Mexican economic crisis has inflicted havoc in almost all of Latin America’sfinancial markets. Central America did not escape the consequences of theMexican economic crisis. The region was inundated by enormous trade deficits,as well as volatility in the levels of foreign reserves. The most pressing challengesfacing Central American leaders are to promote exports and narrow tradedeficits, stabilise currencies, stimulate investment, and deter short-term capitalflight.
17 According to Goldman (1996: 94) Mexico’s political system is failing to work asit should. ‘An out-of-control power play among different political groupsdominates Mexican politics.’ Goldman blames a large part of Mexico’s problemson the breakdown in the taxation system.
18 Opponents to the US/IMF bailout of Mexico argue that the Mexican devalu-ation led to a vast US$15 billion US trade deficit with Mexico. According tothem, the bailout has gone further than just ‘stabilising’ a regional economy; ithas significantly aggravated the US trade deficit. They also argue that Americanjobs are increasingly moving south to Mexico.
19 The IMF loan amounts to over seven times Mexico’s IMF quota of $2.4 billion,and at the time, were unprecedented in the history of the IMF.
20 However, according to Rogers et al. (1997: 147) the Mexican banking systemcontinues to struggle with the economic effects of the December 1994 devalu-ation of the peso, and since January 1997 it has faced the further challenge ofconforming to US generally accepted accounting principles (GAAP). Restruc-turing is under way: by the end of 1995, eleven banks, holding more than 70 percent of the banking system’s assets, had been recapitalised.
21 In retrospect, the Financial Instability Hypothesis can explain a large part of theAsian crisis. For a good review of Minsky’s hypothesis see Minsky (1982).
22 According to Aghevli (1999: 28) the ‘massive capital inflows and weakeningexports were reflected in widening current account deficits. To make mattersworse, a substantial portion of the capital inflows was in the form of short-termborrowing, leaving the countries vulnerable to external shocks.’
23 Aghevli (1999: 28) believes that domestic allocation of the huge amount offoreign investment was inefficient because of ‘weak banking systems, poorcorporate governance, and a lack of transparency in the financial sector’.
182 George Kadmos and Phillip A. O’Hara

Weakening exports combined with increased foreign borrowing cause adeterioration in current account deficits.
24 According to the IMF (1999), some US$35 billion was approved by the IMF in1997 for Indonesia, Thailand and Korea, while the IMF arranged anotherUS$77 billion of additional funding from the major supporting economies. InJuly 1998, a further US$1.3 billion from the IMF and US$5 billion from othersources were arranged specifically for Indonesia.
25 See Ariff (1996) for discussion on how Indonesia, Malaysia, Singapore andThailand liberalised their financial markets.
26 In retrospect, the initial policies recommended by the IMF were based on falseinformation and unrealistic expectations that proved to be inappropriate. Thecause of the crisis had little to do with fiscal thriftiness and moves to tightenfiscal spending proved to exacerbate the problems.
27 The IMF also did not know that the South Korean government has also beenpropping up their own currency and that the country’s foreign reserves wereslowly being used.
28 According to Aghevli (1999: 30) had the ‘IMF known how rapidly internationalreserves were falling in Thailand, and subsequently in Korea, policy adjustmentscould have been made earlier’.
29 According to Cohen (1998: 1) the Asian crisis was not the only factor in thedecline in market confidence. Foreign investors became extremely cautious whenthe Russian parliament passed legislation prohibiting foreign ownership of morethan 25 per cent of the national electricity monopoly that at that time alreadyhad foreign ownership of over 28 per cent. The state owned Oil Company, withoil reserves worth ten of billions of dollars, was suppose to be privatised but wasunable to attract the US$2.1 billion asking price.
30 Oil and gas are responsible for up to 75 per cent of Russia’s foreign currencyearnings. Oil prices dropped approximately 30 per cent between 1997 and 1998,severely decreasing the earnings of Russia-based companies as well as govern-ment receipts.
31 The IMF had already loaned Russia over $18 billion since 1992. Then thereforms that the IMF demanded Russia adopt were either never carried out ordone so half-heartedly.
32 The IMF has been highly critical of the way the Russian government has beentackling the economic crisis so far. IMF deputy director Fischer (1998) lashedout against the Russian government, which, he said, had misinformed the IMFabout the size of Russia’s reserves in gold and hard currency back in 1996. Inaddition, Russia had not done enough to restructure the country’s bankingsystem, and has not shown the political will to tackle these and other sensitiveproblems.
33 A large percentage of payments to the IMF are used to repay the fund onprevious loans. The yearly interest payment on Russian loans amounts toapproximately US$17.5 billion.
34 This is not to say that the IMF was without fault in its dealings with Russia. TheIMF should have encouraged the Russian government more to adopt thechanges necessary. In addition, the revaluation of the currency was probably settoo high, making Russian goods less attractive compared to those being suppliedin Asia and elsewhere.
35 See Crook (1991) for a concise account of the criticism directed against the IMF.
The IMF: functions, financial crises, relevance 183

36 Mexico is now the largest borrower from both the IMF and World Bank withdebts exceeding $180 billion. Mexico must meet interest repayments of the orderof $25–$30 billion each year.
37 This argument is not without substance. India has been the highest benefactorfrom the IMF, receiving about US$55 billion since 1955, but still today over 40per cent of the population still lives in severe poverty.
38 Italy and the United Kingdom were the last industrial countries to receive IMFfunding in 1977. Both countries sought help from the IMF after the first oil shockto control their balance of payments following the move to flexible exchangerates.
39 After two decades of development planning financed largely by the IMF andWorld Bank, sub-Saharan Africa today has a lower per capita income than it didwhen the aid started.
40 Taylor (1997: 149) believes that IMF reform agendas are often ‘intellectually ill-informed and counterproductive in practice’. He questions the advantages ofadopting Anglo-American policies in many economies. For instance, in Chile,Mexico, Turkey and Eastern Europe, such policies have benefited ‘industrialistswho gain from liberalisation, financial speculators, households in the top 10–20per cent of the income distribution who can afford to pay for an array of new con-sumer goods and the economic technocracy which puts new policies in place’. Therest of the population, including the other 80 per cent of the workforce, are losers.
41 Taylor (1997: 150) supports less IMF conditionality and a greater sympathy forindividual circumstances. Taylor even suggests reverse conditionality, wheredomestic governments propose suitable economic policies to the IMF that areideally suited to their own individual requirements.
42 According to Bird (1996) the demand for IMF assistance is inversely related toeconomic growth and development. If economists want to encourage less IMFlending, they should favour helping recipient economies to expand their produc-tive capacity. Many who oppose IMF lending also support trade practices thatfavour large industrial economies and prevent smaller economies from growing.
43 Rowlands (1996) reports that empirical evidence suggests that IMF lending canactually help restore investor confidence and reduce the flight of foreign capitalduring a crisis. As such, IMF lending to vulnerable economies can help attractadditional private investment.
44 For detail on more recent changes to the global financial achitecture, see O’Hara(forthcoming).
References
Aghevli, B.B. (1999) ‘The Asian Crisis: causes and remedies’, Finance andDevelopment, June, pp. 28–31.
Ariff, M. (1996) ‘Effects of financial liberalisation on four South East Asian markets,1973–94’, ASEAN Economic Bulletin, vol. 12, no. 3, pp. 325–37.
Bird, G. (1996) ‘Borrowing from the IMF: the policy implications and recentempirical research’, in World Development, vol. 24, no. 11, pp. 1753–60.
Boothe, B.B. (1995) ‘Texas and Mexico, immediate impact of the Mexican Crisis’, FortWorth, Texas: Ben Boothe and Associates.
Camdessus, M. (1995) ‘Drawing lessons from the Mexican Crisis: preventing and
184 George Kadmos and Phillip A. O’Hara

resolving financial crises-the role of the IMF’, Address at the 25th WashingtonConference of the Council of the Americas on ‘Staying the Course: Forging aFree Trade Area in the Americas’, Washington, DC, 22 May.
Cohen, A. (1998) ‘Russia’s meltdown: anatomy of the IMF failure’, Backgrounder,no. 1228, The Heritage Foundation, 23 October.
Crook, C. (1991) ‘Survey: The IMF and the World Bank’, mimeo, University ofCalifornia, Berkeley.
Dell, S. (1981) ‘On being grandmotherly: the evolution of the IMF conditionality’,Essays in International Finance, no. 144, Princeton: Princeton University Press.
Fieleke, N.S. (1994) ‘The International Monetary Fund 50 years after BrettonWoods’, New England Economic Review, September/October, pp. 17–30.
Fischer, S. (1995) ‘The IMF and the World Bank at fifty’, in H. Genberg, The Inter-national Monetary System: Its Institutions and its Future, New York: Springer-Verlag.
Gaidar, Y. (1997) ‘The IMF and Russia’, American Economic Review: Papers andProceedings, vol. 87, no. 2, pp. 13–16.
—— (1999) ‘Lessons of the Russian crisis for transition economies’, Finance andDevelopment, June, pp. 6–8.
Gil-Diaz, F. (1997) ‘The Origins of Mexico’s 1994 financial crisis’, The Cato Journal,vol. 17, no. 3, pp. 51–63
Goldman, D.P. (1996) ‘Under the volcano’, Forbes, vol. 158, no. 10, pp. 94–103.Guitian, M. (1994) ‘The IMF as a monetary institution: the challenge ahead’,
Finance and Development, September, vol. 31, no. 3, pp. 38–41.Horsefield, J.K. (1972) The International Monetary Fund 1945–1965: Twenty Years
of International Monetary Cooperation, vol. 1, Washington, DC: InternationalMonetary Fund.
Hoskins, W.L. and J.W. Coons (1995) ‘Mexico: policy failure, moral hazard, andmarket solutions’, Policy Analysis, no. 243, October.
IMF (1992) International Monetary Fund Annual Report – 1992, Washington, DC:International Monetary Fund.
—— (1998) IMF Bulletin, Washington, DC: International Monetary Fund.—— (1999) ‘The role of the IMF: financing and its interactions with adjustment and
surveillance’, Pamphlet Series no. 50, Washington, DC: International MonetaryFund.
Krueger, A. (1998) ‘Whither the World Bank and the IMF?’, Journal of EconomicLiterature, vol. 36, pp. 1983–2020.
Lane, T. (1999) ‘The Asian Financial Crisis: what have we learned?’, Finance andDevelopment, September, pp. 44–7.
Martinez, G.O. (1998) ‘What lessons does the Mexican Crisis hold for the recovery inAsia’, Finance and Development, vol. 35, no. 2.
Mayer, M (1998) ‘The Asian disease: plausible diagnoses, possible remedies’, WorkingPaper No. 232, The Brookings Institution.
Meyer, L.H. (1999) ‘Lessons from the Asian Crisis: a central banker’s perspective’Working Paper No. 276, The Jerome Levy Economics Institute.
Minsky, H.P. (1982) ‘The financial instability hypothesis: a restatement’, in author’sCan It Happen Again, New York: M.E. Sharpe, Inc., pp. 90–115.
Niskanen, W.A. (1999) ‘Reshaping the global financial architecture: is there a role forthe IMF?’, Cato-Journal, vol. 18, no. 3, pp. 331–4.
O’Hara, P.A. (forthcoming) ‘Recent changes to the IMF, WTO and FSP: a new
The IMF: functions, financial crises, relevance 185

global social structure of accumulation for long wave upswing?’, Review ofInternational Political Economy.
Peach, J. and R. Adkisson (1997) ‘Enabling myths and Mexico’s economic crises:1976–1996’, Journal of Economic Issues, vol. 31, no. 2, pp. 567–74.
Rogers, J.E, A. Zubikarai and R.H. Muhlestein (1997) ‘Mexico’, InternationalFinancial Law Review, July, pp. 147–8.
Rowlands, D. (1996) ‘New lending to less developed countries: the effect of the IMF’,Canadian Journal of Economics, vol. 29, pp. s443–s446.
Sanders, B. (1998) ‘The IMF’s disastrous plan for Russia’, The Christian ScienceMonitor, Vermont.
Soros, G. (1999) ‘Capitalism’s last chance?’, Foreign Policy, no. 113, Winter, pp.57–65.
Taylor, L. (1997) ‘The revival of the liberal creed – the IMF and the World Bank in aglobilised economy’, World Development, vol. 25, no. 2, pp. 145–52.
Williamson, J. (1982) The Lending Policies of the International Monetary Fund,Washington, DC: Institute For International Economics.
—— (1983) IMF Conditionality, Washington, DC: Institute for InternationalEconomics.
—— (1995) ‘Causes and consequences of the Mexican Peso Crisis’, remarks made tothe Institute for International Economics, 14 March.
186 John Asafu-Adjaye

10 Economic development andenvironmental problems
John Asafu-Adjaye
Introduction
The effect of human beings’ activities on the environment has been thesubject of much debate and controversy over the past three hundred years.In 1798, Thomas Malthus argued in An Essay on the Principle of Populationthat food production increases in arithmetic progression whereas the humanpopulation increases in geometric progression. Therefore, over time,population growth would outstrip food supply leading to famine, starvation,disease and death (Malthus 1872). All of these factors would serve as a‘natural’ check on population, resulting in a drastic reduction in populationgrowth (Figure 10.1). To avoid this calamity, he proposed solutions such asdrastic reduction in the reproductive rate, delay in marriages and sexualabstinence. Malthus’ predictions earned the economics profession tags suchas the ‘profession of doom’ and ‘dismal science’.
The rise of modern ‘environmentalism’ can be traced to the 1960s whenthe increase in environmental pollution led to a rise in public environmentalawareness. After the energy crisis of the 1970s, the Malthusian debate wasresurrected with neo-Malthusians launching an attack on the virtues ofeconomic growth. In 1972, the neo-Malthusian group ‘The Club of Rome’published the results of a study entitled The Limits to Growth (Meadowset al. 1972), which attracted extensive media coverage. The study reachedthree major conclusions. First, at the prevailing annual rates of consumptionthe world would run out of mineral resources within 100 years, resulting in asudden collapse of the world economic system. Second, this calamity wouldnot be averted by piecemeal solution to the myriad of problems. Third, theonly solution to the collapse would be an immediate reduction in economicgrowth, population growth and pollution.1
Environmentalists argue that international regulation of trade is neces-sary to ‘build environmental responsibility into economic activity’ and toensure that ‘trade meets the goals of environmentally sustainable develop-ment’ (Hair 1993). As trade has become globalised, environmentalists claimthat the magnitude of environmental degradation has worsened. Accordingto Herman Daly, ‘further growth beyond the present scale is overwhelmingly

likely to increase costs more rapidly than it increases benefits, thus usheringin a new era of “uneconomic growth” that impoverishes rather than enriches’(Daly and Cobb 1989).
Environmentalists are opposed to the concept of free trade on the basis of‘market failure’.2 According to this view, since the market ‘fails’ to protectenvironmental values to the desired degree, there is a need for government tointervene in the market place. Most environmentalists view economic growthas incompatible with environmental quality and therefore advocate politicalconstraints on economic activity both domestically and internationally. It istrue that all economic activities do impact on environmental quality to somedegree. However, government intervention in every case would be imprac-tical and may be sub-optimal in some cases.
On the other side of the debate, there are those who believe that economicgrowth is necessary in order to achieve economic development and a cleanerenvironment. Numerous empirical studies have been conducted to prove thatthere is a positive link between economic growth and environmental quality.3
In this chapter, we review the relationship between economic developmentand the environment. In light of the evidence presented, we address whatpolicy measures could be taken to mitigate the environmental impacts ofeconomic growth.
The chapter proceeds as follows. The following section sets the discussionin context by briefly reviewing global economic and environmental trends.
188 John Asafu-Adjaye
Figure 10.1 The Malthusian population model.Source: Adapted from Asafu-Adjaye (2000).

The third section addresses the contentious issue of whether economicdevelopment can only be achieved at the expense of environmental quality.Empirical research on the relationship between economic growth and environ-mental quality is briefly reviewed. The fourth section section addresses thepolicy implications of the environment–development debate, while the fifthsection concludes.
Global economic and environmental trends
Economic trends
The global economy has witnessed a boom during the past thirty years. Totalglobal output of goods and services increased from US$9.4 trillion to overUS$25 trillion between 1960 and 1990 (UNDP 1996). Table 10.1 indicatesthat the world economy grew steadily between 1965 and 1997 at a rate of justover 3 per cent per annum. However, there was regional imbalance in thedistribution of this growth. In particular, the East Asian (and Pacific) regioneconomies grew at an average rate of 7.3 per cent per annum. In contrast,the sub-Saharan African countries grew at a rate of 2.6 per cent per annum.
Economic development and environment 189
Table 10.1 Global economic trends, 1965–1997
% GNP growth p.a. % value added growth p.a.
Total Per capita Agriculture Industry Services
World 3.2 1.4 2.2 – –East Asia and
Pacific 7.3 5.4 4.0 9.5 7.8Latin American
and Caribbean 3.5 1.3 2.6 3.2 3.9South Asia 4.6 2.3 2.8 5.5 5.6Sub-Saharan
Africa 2.6 �0.2 1.9 2.3 3.2
Source: World Bank (1999).
Table 10.2 Real annual domestic product growth
1991–7 1998 1999 2001a
World 2.3 1.9 1.8 2.8East Asiab 7.2 7.7 0.3 4.5Latin American and Caribbean 3.4 2.0 0.8 3.9South Asia 5.7 5.2 4.4 5.2Sub-Saharan Africas 2.1 2.1 2.5 4.0
Source: World Bank (1999).aForecast.bIncludes Indonesia, Republic of Korean, Malaysia, the Philippines and Thailand.

Large parts of the developing world have missed out on the past threedecades of economic growth. For example, since 1980, about a hundreddeveloping countries have experienced economic decline or stagnation; inseventy of these countries, average incomes in the late 1990s were below 1980levels (UNDP 1997).
Much of the rapid growth of the global economy has been brought aboutby globalisation. Globalisation has created a near ‘borderless’ world and hasfacilitated free trade and flows of private capital between countries. Globaltrade increased from US$4,345 billion to US$6,255 billion between 1990 and1995. Transfers of net private capital into low-income and middle-incomecountries amounted to US$180 billion in 1995, compared to officialdevelopment assistance of US$64 billion (World Bank 1999).
The growth of the global economy has brought with it several benefits suchas improvement in health and living conditions. For example, in manydeveloping countries, infant mortality rates have declined, life expectancy hasincreased and illiteracy rates have declined over the past three decades.However, disparities in poverty and income distribution persist betweenregions and within countries. Absolute poverty in parts of Africa, LatinAmerica and the Caribbean has increased, and the gap between the developedand developing countries has widened. According to the 1998 HumanDevelopment Report, of the 4.4 billion people in developing countries, nearlythree-fifths lack basic sanitation; almost a third have no access to clean water;a quarter do not have adequate housing. A fifth have no access to modernhealth services; a fifth of children do not attend school to grade 5; and aboutone-fifth do not have enough dietary energy and protein (UNDP 1998).
Within some regions and countries, the gap is increasing as well. In LatinAmerica and the Caribbean, the richest 20 per cent of the population haveaverage incomes of more than US$17,000; for the poorest 20 per cent, theaverage income is US$930 (UNDP 1997). Even in the relatively well off Eastand Southeast Asian countries, income gaps appear to be widening. Wealthdisparities between urban and rural areas are growing in China, Indonesiaand the Philippines. In Thailand it is estimated that gap between the rich andthe poor more than doubled between 1981 and 1992.
Economic growth is required to meet the needs of a growing population.However, rapid growth has serious implications for our physical environ-ment. Expansion of agricultural land is essential to produce more food.4
Activities such as land clearing and the use of pesticides have potentialadverse environmental impacts. Industrial production is required to house,clothe and feed the population. However, some industrial processes result inthe production of air and water pollution, as well as the generation of toxicwaste products.
Environmental trendsEnergy is a vital input to transportation, industrial production and agricul-tural production. It also provides other important domestic services such as
190 John Asafu-Adjaye

heating, cooling and lighting. Currently, the industrialised countries areresponsible for most of the increase in manmade greenhouse gases in theatmosphere, accounting for about 70 per cent of carbon dioxide (CO2)emissions even though they account for less than 20 per cent of globalpopulation (UN 1997). However, energy demand is projected to increaserapidly in the developing countries. It is estimated that developing countryshare of world energy demand will increase by almost 40 per cent by 2010,which will be more than double that of total OECD energy consumption.
Figure 10.2 shows that there is a strong correlation between energy useand economic growth, while Figure 10.3 reveals a similar relationshipbetween energy use and social indicators such as life expectancy. Based onthese facts, it can be concluded that in order not to retard social andeconomic development, energy consumption in the developing countries willneed to increase. It is instructive to note, however, that per capitaconsumption in the developing countries will still be lower than in theadvanced countries. To achieve sustainable development, there is the need tosearch for efficiencies in energy use and to gradually move towards renewableforms of energy such as wind, thermal and solar energy.
Is economic growth compatible with environmental quality?
Since the early 1990s, the economic growth–environment debate has beenresurrected again with the emergence of empirical studies that indicate thatenvironmental quality can eventually decrease with increase in economicgrowth. These studies argue that there is an inverted U-shaped relationship
Economic development and environment 191
Figure 10.2 Gross domestic product and energy use in selected Asian countries.Source: World Bank (1999).

between pollution levels and income growth. That is, there is an increasinglevel of pollution for people living in lower income countries. However, asincomes rise, pollution levels decline. This phenomenon has been namedthe environmental Kuznets curve (EKC) after Simon Kuznets whopostulated a similar relationship for income inequality and income levels(Kuznets 1955).
The basic premise of the EKC is that at very low levels of economic growth,environmental effects are low. However, as development proceeds, the rate ofpollution increases. At higher levels of economic development, various factors(e.g. structural change, improved technology) cause pollution levels to decline.An example of an EKC for sulphur dioxide is shown in Figure 10.4. A typicalfeature of the EKC is the inverted U shape which suggests that pollution levelsreach a maximum level with respect to income levels, after which it begins todecline. The maximum level of pollution is referred to as the ‘turning point’and forms the focus of the debate about pollution control. If it is a fact thatthe EKC hypothesis is true, then one must expect developing countries toincrease pollution levels at early stages of development.
Economists have proposed various theoretical models to explain theinverted U shape of the EKC. These models include: (a) overlapping-generations models; (b) production/consumption models of pollution and(c) political economy models.
Overlapping-generations models
John and Pecchenino (1994) employ the overlapping-generations frameworkof Samuelson (1958) and Diamond (1965) to offer a theoretical explanation
192 John Asafu-Adjaye
Figure 10.3 Life expectancy and energy use in selected Asian countries.Source: World Bank (1999).

for why an inverted U relationship might exist between economic growth andenvironmental quality. In this approach, short-lived individuals makedecisions about the accumulation of capital and the provision of a publicgood, environmental quality, where the decisions have long-lasting effects.
In the stylised model, economic agents live two periods, working youngand consuming while old. The young allocate their wages between invest-ment in capital goods and investment in environmental goods, which is apublic good. Economic agents derive utility from consumption andenvironmental quality. Their consumption degrades the environment whichis left to future generations. However, investment in capital improves thetechnology available to future generations.
John and Pecchenino (1994) show that economic agents in economieswith little capital (or high environmental quality) may choose not tomaintain the environment. As agents accumulate capital, the consumptionexternality causes degradation of the environment, resulting in a negativecorrelation between economic growth and environmental quality. On theother hand, in economies with high capital levels, agents can choose a mix ofsavings and maintenance such that a higher capital stock is associated with ahigher level of environmental quality.
Under their framework, it is also possible for some environmental pro-blems to improve at low-income levels, while others worsen even in richeconomies. For example, in the case of water quality, returns to maintenanceare high and agents may be willing to give up large amounts of consumptionin return for improvements in quality. On the other hand, for otherpollutants (e.g. carbon dioxide), returns to maintenance may be low andagents may value environmental quality relatively less.
Economic development and environment 193
Figure 10.4 A hypothetical EKC for suplhur dioxide.Source: Asafu-Adjaye (1999).

Production/consumption models
Pollution can arise from consumption and production of goods and servicesor the use of environmental inputs in either of these activities. Lopez (1994)presents a very simple model comprising two production sectors, weakseparability between pollution and other inputs, constant returns to scale,exogenous prices and technical progress. In this model, when private pro-ducers consider only their marginal costs (MPC) (i.e. do not pay for pollu-tion), increased output levels lead to increase in pollution levels regardless oftechnological progress and preferences. However, when producers pay themarginal social cost (MSC), that is, MPC plus the price of pollution, thenthe relationship between output and pollution levels depends on preferencesand technology. If it is assumed that preferences are non-homothetic, thechange in pollution, with increasing output, depends on the elasticity ofsubstitution in production between pollution and other inputs, as well as thedegree of relative risk aversion. In this case, the degree of relative riskaversion is defined as the rate at which consumers’ marginal utility declinesas they increase their consumption of goods and services. For certainplausible values of these two parameters (i.e. elasticity of substitution andrisk aversion) pollution levels may rise at low-income levels and decline athigh-income levels, leading to the inverse U shape.
McConnell (1997) has proposed an EKC model in which pollution isgenerated by consumption but reduced by abatement. In this model, utility isdefined as an additive function of consumption (C) and pollution (P). Thatis,
U�U(C, P) (1)
where pollution is a function of consumption and abatement (A). That is,
P�P(C, A) (2)
It is assumed that output is equal to consumption plus abatement. That is,
Y�C�A (3)
McConnell (1997) assumes that a social planner maximises Equation (1)subject to the constraint, Equation (3). He goes on to demonstrateconditions under which an inverted U curve may or may not be generated bychanges in the sign of the income elasticity of demand for environmentalquality. McConnell shows that it is possible for pollution to decline with azero-income elasticity of demand for environmental quality, or to increasewith a high-income elasticity of demand for environmental quality.
Antle and Heidebrink (1995) have used the concept of the productionpossibilities frontier (PPF) to show why economic growth and environmentalquality may not necessarily be mutually exclusive. They define an economy
194 John Asafu-Adjaye

that produces two goods, market goods (x) and environmental services (e).The production functions are defined as
x�x(L, K, Z) (4)
e�e(E) (5)
where L is labour and other variable inputs used to produce market goods; Kis environmental capital stock used to produce x; Z is conventional capitalstock (e.g. structures, machinery, etc.) and E is environmental capital stock(e.g. forests, soil, water) used to produce environmental services. Bothproduction functions are assumed to be concave. The marginal product of Eis assumed to be negative for the production of market goods (Equation 4)at high levels of capital utilization, but is always positive for the productionof environmental services (Equation 5).
Figure 10.5 shows a PPF generated from Equations 4 and 5. According toneoclassical economic theory, equilibrium is achieved when the marginal rateof technical substitution is equal to the price ratio of E and x. Assuming E isa pure public good, which is often the case with environmental services, thisequilibrium will occur at point B, where the slope of the PPF approachesinfinity. The rational producer will only apply units of the environmentalcapital stock beyond point B where its marginal productivity is zero. That is,there is no economic incentive to totally exhaust the environmental capitalstock.
Economic development and environment 195
Figure 10.5 Production possibilities frontier for market goods and environmentalservices.
Source: Adapted from Antle and Heidebrink (1995).

Technological change shifts the PPF from ACB so that a higher level ofmarket goods production could correspond to either more (point D) orfewer (point F) environmental services in a market economy. The mainimplication of this theory is that, even if environmental quality is a purepublic good, economic growth and environmental quality improvement arenot necessarily mutually exclusive if there is technical change. In thisframework, it is possible for public policies (e.g. environmental regulations)to move the economy to point D, where more market goods and moreenvironmental services are produced. However, it is also possible for somegovernment policies (e.g. large-scale dam projects) to move the economy tosay, point F, where the level of environmental services is reduced.
Political economy models
Many EKC studies model pollution levels as a function of per capita incomewithout specifying the links between these two variables. According toGrossman and Krueger (1991), the strongest link is an induced policyresponse, which is, in turn, induced by popular demand: to quote Grossmanand Krueger
As nations or regions experience greater prosperity, their citizensdemand that more attention be paid to the non-economic aspects oftheir living conditions. The richer countries tend to have relativelycleaner urban air and relatively more stringent environmental standardsand stricter enforcement of their environmental laws than middle-income and poorer countries.
(Grossman and Krueger 1991: 372)
Most environmental goods and services display public goods characteristics.That is, they are often zero-priced or underpriced. The solutions toenvironmental problems therefore require the issue of market failure to beaddressed. According to the political economy approach, as a country’s percapita income increases, it becomes better able to address the issue of marketfailure through the political process.
To conclude this section, the point needs to be made that there is notmuch difficulty in constructing a model that would generate EKC-typecharacteristics. The challenge is to find empirical evidence that backs up thetheory. In the following section we review a selection of various empiricalstudies, which have attempted to support or refute the EKC hypothesis.
A review of EKC studies
Grossman and Krueger (1991) conducted the path-breaking study in the EKCliterature as part of a wider study to assess the environmental impacts of theNorth American Free Trade Agreement (NAFTA). The study utilised panel
196 John Asafu-Adjaye

data from the Global Environmental Monitoring System (GEMS) project toestimate EKCs for SO2, dark matter, and suspended particulate matter (SPM)for a number of cities worldwide.5 Regression variables including a cubicfunction of per capita GDP (PPP dollars), a time trend and trade intensitywere used. The analysis confirmed that ambient concentrations of SO2 anddark matter exhibit EKCs with turning points lying between $4,000 and $5,000in 1985 US dollars (see Table 10.3). Although they found that economic
Economic development and environment 197
Table 10.3 A selection of EKC studiesa
Study Environmental Turning point Countries/cities/indicator (US$ per capita) time period
1 Grossman and SO2 4,000–5,000 Cities worldwideKrueger (1991) Dark matter
2 Shafik and SO2 3,000–4,000 149 countries,Bandyopadhyay SPM 1960–90(1992) Deforestation
3 Panayotou SO2 3,000 55 developed and(1993, 1995) NOx 5,000 developing
SPM 4,500 countries, 1987–8Deforestation 823
4 Panayotou SO2 5,000 Cities in 30 (1997) developed and
developingcountries, 1982–4
5 Cole et al. Carbon monoxide 25,100 7 regions, 1960–91,(1997) Total energy use 22,500 24 OECP countries,
CFCs and halons 15,400 1970–90, 38 countries,1986, 1990
6 Cropper and Deforestation 4,760 64 countries inGriffiths (1994) 5,420 Africa, Latin
America7 Antle and Afforestation 2,000 93 countries, cross-
Heidebrink section, 1985(1995) National parks 1,200 82 countries, cross-
section, 19858 Asafu-Adjaye Reforestation 5,000 83 countries, cross-
(1998) section, 19859 Wackernagel Ecological 21,587 52 countries, 1985
et al. (1997) footprints10 Asafu-Adjaye Energy use 22,218 4 Asian countries,
(1999) pooled crosssection-time series,1971–95
Source: Asafu-Adjaye (1999)Note: aSO2 = sulphur dioxide
SPM = suspended particulate matterNOx = nitrous oxideCO2 = carbon dioxideCFC = chlorofluorocarbons

growth at middle-income levels was associated with improved environmentalquality, growth at higher income would be detrimental.
An EKC study conducted by Shafik and Bandyopadhyay (1992) was usedas a background study for the 1992 World Development Report (World Bank1992). They estimated EKCs for ten different indicators of environmentalquality: SPM, ambient SO2, deforestation, lack of clean water, lack of urbansanitation, dissolved oxygen in rivers, faecal coliforms in rivers, municipalwaste per capita, CO2 emissions per capita and change in forest area between1961 and 1986. They carried out panel and cross-section regressions usingdata from 149 countries for the period 1960–90. The two air pollutants, SO2
and SPM, were found to conform to the EKC hypothesis with turning pointsat $3,700 and $3,300 respectively (Table 10.3). Deforestation was notsignificantly related to income, while river quality worsened as incomeincreased. Finally, both CO2 emissions per capita and municipal wasteincreased significantly with increase in income.
Panayotou (1993, 1995) conducted cross-sectional EKC regressions usingdata for 1987/88 for fifty-five developing countries. All the indicators,including emissions per capita for SO2, SPM, NOX and deforestation, werefound to conform to the inverted U shape. The turning points were $3,000,$4,500, $5,500, and $823 respectively (Table 10.3). Panayotou updated hisstudy in 1997 by explicitly accounting for the underlying determinants ofenvironmental quality. In order to gain a more comprehensive understandingof the income–environment relationship, he incorporated a variety of policyinstruments into the analysis. This involved ‘decomposing’ the structuraleconomic factors influencing the emissions of SO2 into its pure income, scaleand sectoral composition effects, as well as testing independently for theimpacts of the rate of growth and a policy variable. The results indicatedthat both the growth rate and the policy variables were highly significant,with ambient SO2 concentrations turning upwards at just below $5,000.
Grossman (1993) undertook a comprehensive EKC study using data fromup to 488 monitoring stations from sixty-four countries for the period1977–90. U-shape relationships were observed for SPM, NO2, CO, faecalcoliform, biological oxygen demand (BOD)6 and chemical oxygen demand(COD)7 with turning points of $16,000, $18,500, $22,800, $8,500, $10,000and $10,000 respectively.
In a departure from the aforementioned studies, Cropper and Griffiths(1994) estimated EKCs for deforestation for African, Latin American andAsian countries using time series data for a thirty-year period. Deforestationin African and Latin American countries displayed inverted U shapes withturning points of $4,760 and $5,420 respectively. However, there were nosignificant relationships for Asian countries.
More recently, de Bruyn (1997) used decomposition analysis8 to deter-mine whether structural change or technological innovation was a majorfactor in the decline in SO2 emissions in the Netherlands and West Germanyduring the 1980s. Although he failed to find evidence supporting the sig-
198 John Asafu-Adjaye

Economic development and environment 199
nificance of structural change, he found that environmental policy fosteredby international agreements provides a better explanation of why pollutiontends to decline as income levels increase. It is significant to note that deBruyn (1997) found income to be only a minor determinant of environ-mental policy.
Cole et al. (1997) used more recent data encompassing a wider set ofenvironmental indicators including CFCs, halons, methane, nitrates, muni-cipal waste, carbon monoxide, energy consumption and traffic volumes.They found the turning points for per capita emissions of total NOX, SPMand carbon monoxide to be comparable to earlier studies, implying that percapita emissions of these pollutants are beginning to decline in manyadvanced economies (Table 10.3). However, both CO2 and energy use werefound to increase monotonically with income. CFCs and halons, althoughpredicted to follow a similar path as CO2 in 1990, were found to haveflattened out and decreased slightly.
Other environmental indicators for which turning points were reported(Table 10.3) were afforestation/reforestation (Antle and Heidebrink 1995;Asafu-Adjaye 1998 (see Box 1)), and ecological footprint (Wackernagel et al.1997). Wackernagel et al. estimated the EKC for a sample of fifty-two coun-tries using ‘ecological footprints’ as an indicator. The ecological footprintestimates the land and water required to sustainably provide for the averageper capita consumption in each country, including the following: food,wood, energy and built area. Using a quadratic specification, the estimatedturning point of $21,587 was outside the data range and the log-quadraticspecification did not indicate a turning point.
Some studies have attempted to investigate the effect of political factorson pollution. However, the evidence so far has been inconclusive orcontradictory. For example, Shafik and Bandyopadhyay (1992) tested forthe influence of political and civil rights9 on concentrations of various airpollutants (including SO2) and found evidence that air quality is worse inmore democratic countries. On the other hand, Torras and Boyce (1998)found evidence to support the view that less ‘power-equal’ countries (bothwith respect to democracy and income equality) have higher SO2 emissions.
To conclude this review of EKC studies, it must be emphasised that theempirical evidence in support of the EKC hypothesis is mixed. The EKChypothesis seems to hold across studies for air pollution indicators, with thepossible exception of CO2. The most consistent results are for SO2 andSPM. However, even where the EKC appears to be valid, there are doubtsabout the stability and hence the reliability of the turning points. Forexample, in Cole et al. (1997) most of the turning points were outside theincome range of the countries analysed. In Cropper and Griffith (1994) theper capita income levels of most of the African and Latin Americancountries were below the EKC turning points. The main implication ofthese observations is that environmental quality could worsen even in caseswhere EKC relationships exist.

200 John Asafu-Adjaye
Box 1 An empirical test of the environmental transition hypothesis
A test of the environmental transition hypothesis was carried out usingaverage annual reforestation (REFOR) in the 1980s and annual percapita CO2 emissions (CO2) as indicators of environmental quality.These two variables were regressed against the following variablesusing cross-section data for 83 countries: total land area (AREA); totalforested area and woodland (FOR); real gross domestic product percapita (GDP) for 1985; population (POP); and the number of riots peryear (RIOTS).
The results of the estimations were as follows (t-ratios are in paren-thesis):
REFOR=15.72–32.84GDP+4.482GDP2+0.45AREA+0.60FOR(0.54) (–2.08) (3.19) (2.57) (1.53)
+0.28POP–16.23RIOTS(1.67) (–1.65)
R2=0.69; R̄2=0.67; F=28.32
CO2=0.480+0.16GDP–0.01GDP2–0.005AREA+0.006FOR(2.51) (1.50) (–1.08) (–0.42) (2.28)
–0.001POP–0.03RIOTS(–1.03) (–0.54)
R2=0.28; R̄2=0.18; F=3.91
The results for REFOR indicate a convex function of GDP (i.e. U-shaped). On the other hand, the results for CO2 suggest that GDPincreases with income. The R2 statistics suggest that the quadraticform fits the data better for REFOR than for CO2. In both equations,the coefficient of RIOTS has the expected sign but is significant at the10 per cent level for the REFOR equation only.
The major policy implication of these results is that economicgrowth may not necessarily lead to increasing damage to theenvironment over time. Some environmental indicators may initiallydeteriorate as growth occurs due to pressure on natural resources.However, the evidence suggests that as income increases there is animprovement in some indicators.
Source: Asafu-Adjaye (1998).
A critique of the EKCThe EKC hypothesis has come under heavy attack from both economistsand non-economists alike. The EKC seems to suggest that countries cansimply ‘grow out’ of any limitations brought about by the depletion ofnatural resources and increased environmental degradation. This view wasput even more forcefully by Beckerman (1992) who said, inter alia, that ‘thebest and probably the only way to attain a decent environment in mostcountries is to become rich’.
Eminent scholars such as Arrow et al. (1995), Rothman (1998), and Sternet al. (1996) have critiqued the EKC. Special issues of the following journalshave been devoted entirely to the subject: Ecological Economics (1995),Ecological Applications (1996) and Environment and Development Economics(1996). A panel of economists, led by Kenneth Arrow, met in Sweden toconsider the relationships between economic growth and environmentalquality. They concluded, inter alia, that an inverted U curve does notconstitute evidence that environmental quality will improve in all cases orthat it will improve in time to avert the adverse impacts of economic growth(Arrow et al. 1995). They argued that in most cases where emissions havedeclined with increasing income, the reductions have been due to localinstitutional reforms such as environmental legislation and market-basedincentives, although such reforms have tended to overlook international andintergenerational consequences.
From the current empirical evidence, it is unclear whether the EKC is theresult of economic growth and therefore best tied to income increases, orwhether it is merely a symptom of other underlying exogenous changes.Consequently, some of the more recent studies have attempted to findalternative approaches for analysing EKC relationships. For example, Unruhand Moomaw (1997) and Moomaw and Unruh (1997) have disputed theEKC conclusion that increase in income results in emissions reduction.Instead, they argue that reductions in emissions are triggered by specifichistoric events such as the 1973 oil crisis. They find that the transition tolower per capita CO2 emissions can occur at different income levels and canoccur rather abruptly. They demonstrate that, in the case of countries asdifferent as Spain and the United States, the transitions occurred soon afterthe oil price shocks of the 1970s.
McConnell (1997) has suggested that although income is an importantfactor in explaining the EKC-type relationship, other factors such as abate-ment costs, or the impact of pollution on production may override theeffects of income. He therefore investigates the relationship between thedemand for environmental quality and income by considering the combinedeffect of preferences, increasing costs of pollution abatement and themarginal utility of consumption in a growing economy in order to decom-pose the reduced form effect of income on pollution. He concludes that ahigh-income elasticity of demand for environmental quality is neithernecessary nor sufficient to yield an EKC-type relationship.
Economic development and environment 201

Some studies (e.g. Liddle 1996; Asafu-Adjaye 1999) have found no evi-dence of trade playing a major role in determining the EKC. On the otherhand, others (e.g. Suri and Chapman 1998) find the opposite result.
Policy implications
In the last few years, progress has been made in understanding the relation-ship between the environment and development. A number of clear trendshave emerged from the research conducted to date:
1 There is a U-curve relationship between environmental quality andincome. However, this does not apply to all environmental indicators.The foregoing review has demonstrated that the indicator whichconsistently displays such a relationship, based on the number of studiesconfirming it, is SO2. A few studies have found the EKC hypothesis tohold for SPM, deforestation, afforestation and energy use. However,these results cannot be generalised.
2 Even where a U-curve relationship is found, the turning points tend tobe much higher than the per capita incomes of the countries involved.For example, in Asafu-Adjaye (1999) the turning point for energy wasUS$22,218 for a sample of four countries comprising, India, Indonesia,South Korea and Japan. However, real per capita income for India, theleast well off in the sample based on GDP, is US$439. These results implythat, for many developing countries, environmental problems may worsenin the foreseeable future.
3 It has been suggested that trade openness could help in reducing environ-mental pollution. However, there is no overwhelming evidence in theliterature to support this proposition.
4 Many of the studies that have found a U-shaped relationship betweeneconomic growth and the environment do not convincingly explain howgrowth affects the environment. The empirical evidence supporting theexistence of an EKC relationship is not clear-cut. This implies that therelationship between the environment and development is too complexto be adequately represented by simple economic models.
A general conclusion that can be reached is that developing countries willnot automatically grow out of their environmental problems. However,economic growth is necessary for developing countries to make a dent intheir environmental problems. The fact that many countries’ per capitaincomes are below potential turning points supports the view that restrictingeconomic growth to save the environment may not be a socially optimaldecision. Progress towards the turning point can be boosted by a combin-ation of prudent economic policies and environmental regulations.
202 John Asafu-Adjaye
Some of the studies reviewed above indicate that institutional factors doexert a significant influence on the relationship between income and environ-mental degradation. Barbier (1997) argues that policies that aim to improvethe operation of markets are more likely to reduce the ‘environmental price’ ofeconomic growth, thereby flattening out the income–environment relationshipand possibly achieving a lower turning point. Such policies include the re-moval of distortionary subsidies, introduction of more secure property rightsover resources and implementation of economic instruments to internalise ex-ternalities. Some of these policies are briefly discussed in the following section.
Furthermore, a poorly developed institutional framework may affect theability of authorities to monitor environmental degradation and/or pollutionand, in turn, retard the development of effective environmental policies. Inhis EKC study of SO2 emissions, Panayotou (1997) found that improvedpolicies and institutions in the form of more secure property rights, betterenforcement of contracts and effective environmental regulation could assistin making the EKC flatter. For example, reductions in SO2 emissions in theNetherlands and West Germany have been brought about by tougherenvironmental regulations requiring better end-of-pipe technology. Komenand others’ research indicates that increased public spending on environ-mental research and development, while possibly leading to environmentalimprovements, may also act as a catalyst for private investment in cleanertechnologies (Komen et al. 1997).
In the following sections, we examine policy responses to the environ-mental degradation problem at the local/national and global levels.
National and local level policy response
At the local and national levels, there are a variety of options for dealingwith the problem of environmental degradation. In Chapter 4, we discusseda number of market-based instruments including standards, taxes, subsidiesand marketable permits in relation to solving problems based on genderdisparities. In this section, we will take a brief look at a different set ofoptions for tackling the pollution problem – voluntary incentives.
Most pollution policy instruments rely on coercion (e.g. fees or penalties)or some form of financial incentives. As the name suggests, voluntaryincentives rely on voluntarism and self-regulation. There are two majorcategories of voluntary incentive mechanisms – voluntary agreements andvoluntary, incentive and community-assistance programs.
Voluntary agreements
A voluntary agreement (VA) is basically a ‘contract’ between a governmentagency and industry in which environmental goals and deadlines have beennegotiated and subsequently agreed upon by both parties (Barde 1995;
Economic development and environment 203

Carraro and Sinisalco 1996). In a VA, the industry is self-committed totaking appropriate measures to meet these goals. In the event of non-compliance there are no real sanctions, except that regulations and coercivemeasures may be imposed at the end of the contract period. One importantfeature of a VA is that although pollution levels may be fixed within ageographical area, the industry is free to pursue the most cost-effectivemeasures to achieve the agreed objective. One advantage of VAs is that theycan be combined with regulatory requirements in two different ways: (1) theycan be implemented before any subsequent regulations; and (2) they canreinforce existing regulations that may be poorly enforced.
Like most other policy instruments there are arguments for and againstVAs. For example, it has been argued that voluntary agreements reducegovernment control over industry, or that it could encourage ‘collusion’between government and industry. In practical terms, voluntary agreementsmay become difficult to manage when there are many sources requiringregulations, and when pollution spillovers affect communities who are notparty to the voluntary agreement. However, on the positive side, voluntaryagreements are flexible, transparent and could provide incentives fortechnological innovation.
Voluntary, incentive and community-assistance programs
Voluntary, incentive and community-assistance programs depend on thecommitment, enthusiasm and goodwill of local community groups toundertake conservation projects. As the name suggests, this approach ispurely voluntary, although, in some cases, grants may be advanced tofacilitate the initiatives. This approach has been recommended as amechanism for conserving biodiversity on private property (OECD 1996).The main attraction of such programs is that they are non-interventionist innature and require minimal administrative costs. A disadvantage is that theycan be difficult to target and monitor without incurring high administrativecosts. Schemes like these work best in cases where the participants have agenuine interest in the goal of the project.
Global policy response
If the EKC relationship is true, then countries in early stages of developmentwill, as a result of lack of access to technology and capital, adopt industrialprocesses that are polluting, or will mine their natural resources. In thisrespect, it is self-serving for the rich nations to demand that the poorernations cut back on pollution or natural resource use. Therefore, it has beenproposed that the rich nations could compensate the poorer ones forforegoing income from natural resource exploitation. Various forms oftransfer mechanisms have been proposed. including international financingof conservation projects and debt-for-nature swaps.
204 John Asafu-Adjaye

International financing of conservation projects
A number of initiatives by which advanced countries can assist developingcountries to reduce environmental degradation have been proposed. Theseinclude using savings from military expenditure made since the Cold War toretire debt in developing countries and to fund conservation projects, andflexible interest repayment terms on debt for sustainable developmentprojects. Another initiative already underway is the Global EnvironmentalFacility (GEF). The GEF was established by the World Bank and the UnitedNations Environment Program. The GEF aims to provide concessionalloans to developing countries for projects associated with protection of theozone layer, reduction of greenhouse emissions, protection of internationalwater resources, and protection of biodiversity.
Specific projects that are eligible for assistance under the scheme includedevelopment of alternative energy sources, afforestation, conservation oftropical forests, and investments to prevent oil spills and ocean pollution.Although the scheme is a worthwhile one, some countries have complainedabout inadequate funds. It would appear that the issue of financing therecurrent expenditure for the fund has not been properly worked out.
Debt-for-nature swaps
The concept of debt-for-nature swaps has been proposed as a way of assist-ing developing countries to protect their environment and at the same timereduce their foreign debt. The idea originated from the concept of debtconversion. After Mexico’s 1982 financial crisis, it threatened to default onits foreign debt. This threat forced international banks to accept the fact thatsome debt-ridden countries were incapable of fully repaying their debts.Consequently, banks began to minimise their risk by selling high-risk debtsto other banks at discounted values. Such debts became known as secondarydebts or loans, and soon a market for these loans began to develop. A typicaldebt conversion consists of swapping secondary debt for equity in the debtorcountry and offers a low-cost way of investing in a developing country. Forexample, in 1986, Chrysler Motor Company bought off Mexico’s foreigndebt with a face value of about US$108 million for US$65 million. In return,the Mexican government provided about US$100 million in pesos for themanufacture of a car manufacturing plant.
Debt-for-nature swaps10 operate along the same lines as debt-for-equityswaps, except that, as the name suggests, the investments are targeted atpreserving the environment. For example, the US environmental lobby groupNature Conservancy bought about US$2.2 million of Brazil’s foreign debtfor US$850,000. Most of the money has been paid into a fund to be used toconserve a tropical rain forest in the country. The World Wildlife Fund forNature has been involved in debt-for-nature swaps in a number ofdeveloping countries. By 1991, about nineteen debt-for-nature swaps worth
Economic development and environment 205

over US$100 million had taken place. However, this amount is miniscule incomparison to total developing country debt of over US$1.3 trillion in thesame period.
Although well intentioned, debt-for-nature swaps have been criticised on anumber of grounds. Some people are of the view that a good proportion offoreign debt has been incurred by totalitarian or corrupt governments andthat using debt-for-nature swaps to retire such debt is tantamount tolegitimising illegal or immoral transactions. For example, it has been allegedthat the former president of the Philippines, the late Ferdinand Marcos,incurred millions of dollars of national debt which were improperly usedand as such the people of the Philippines should not be held accountable forsuch debts. Another argument against debt-for-nature swaps is that theyinterfere with national sovereignty in the sense that they allow foreigners todictate how governments in developing countries should allocate theirexpenditures. It has been alleged that some of the debt-for-nature swapprojects are designed more for research and exploitation of natural resourcesthan for conservation (Mahony 1992).
The number and size of debt-for-nature swaps, to date, have been suchthat none of these criticisms have been proven beyond doubt. Realistically, itis unlikely that this approach will make any significant dent in Third Worlddebt. It would appear that the major benefit of these schemes is in raisingawareness of sustainable development issues and making some contributiontowards the achievement of that goal.
Conclusions
This chapter has tackled the complex subject of the relationship betweeneconomic development and the environment. After describing some generaltrends in economic and environmental indicators in the last few years, thediscussion focused on various dimensions of the trade–environment relation-ship, resulting in a set of policy recommendations on trade and the environ-ment. The discussion of the trends suggested that increase in population willincrease the demand for food, clothing and shelter. The consumption ofresources such as energy will continue to escalate because energy is a majorinput in industrial production. Energy use was found to be highly correlatedwith economic growth and social indicators such as infant mortality and lifeexpectancy, implying that energy is vital for development. However, toachieve sustainable development, there is a need to develop alternativesforms of energy (e.g. renewable energy).
A considerable part of the discussion centered on the relationshipbetween trade and the environment at different stages of development orincome. At issue was the environmental Kuznets U-curve hypothesis whichstipulates that, as the per capita income of a country increases, environ-mental degradation will initially increase, but then will eventually declineonce a maximum level has been reached. The maximum level of pollution at
206 John Asafu-Adjaye

which degradation begins to decline is referred to as the turning point. Areview of empirical studies revealed that there is mixed support for the EKChypothesis. The EKC relationship appears to hold consistently for SO2. Inthe case of CO2, all the studies indicate that it increases with income, andhas no turning point. Other environmental indicators for which the EKChypothesis appears to hold include carbon monoxide, CFCs and halogen,energy use, and deforestation/reforestation. Another important observationabout the EKC is that in some cases where turning points have beenobserved, the turning point is much higher than per capita incomes of thecountries involved.
In conclusion, much still remains to be accomplished in explaining whyEKCs arise. In the meantime, it is clear that countries will not automatically‘grow’ out of their environmental problems. The role of institutions incountries that have obtained low levels of environmental pollution wasfound to be significant. Policy responses to environmental degradation werediscussed, with emphasis on voluntary incentive mechanisms. In general,these approaches could offer a cost-effective and flexible means of reducinglocal and global pollution.
Notes
1 The model follows the basic premises of the Malthusian Theory. Several re-sources are fixed in supply and growth increases exponentially. These assump-tions and the absence of technology ensure the exhaustion of resources.
2 According to Herman Daly ‘a more accurate name than the persuasive label“free trade” is “deregulated international commerce”’ (Daly 1993).
3 We make a distinction here between economic growth and economic develop-ment. The former strictly refers to increase in economic indicators such as GDPand GNP, while the latter is a broader concept involving improvement in qualityof life indicators, poverty and income distribution.
4 Of course, with improved technology more food could be produced withoutnecessarily expanding agricultural land. However, the fact of the matter is thatmost developing countries do not utilise high technology in agriculture.
5 The GEMS is a joint project of the World Health Organisation and the UnitedNations Environment Program.
6 BOD is the amount of natural oxidation that occurs in a sample of water in agiven time period.
7 COD is the amount of oxygen consumed when a chemical oxidant is added to asample of water.
8 De Bruyn (1997) and Panayotou (1997) both advocate decomposition analysis asa preferred alternative to the reduced-form approach. This is because anexpansion of the reduced-form model to include further explanatory variablesincreases the possibility of serious multicollinearity problems.
9 The political liberties index measures rights such as free elections, the existenceof multiple parties, and decentralisation of power. The civil liberties indexmeasures freedom to express opinions without fear of reprisal.
10 See Hansen (1989) for an overview.
Economic development and environment 207

References
Antle, J.M. and G. Heidebrink (1995) ‘Environment and development: theory andinternational evidence’, Economic Development and Cultural Change, vol. 43,pp. 603–25.
Arrow, K., B. Bolin, R. Costanza, P. Dasgupta, C. Folke, C.S. Holling, J. Bengt-Owe,S. Levin, K.G. Maler, C. Perrings and D. Pimentel (1995) ‘Economic growth,carrying capacity, and the environment’, Science, vol. 268, pp. 520–1.
Asafu-Adjaye, J. (1998) ‘An empirical test of the environmental transition hypo-thesis’, Indian Journal of Quantitative Economics, vol. XII, pp. 67–91.
—— (1999) ‘The environment and development: theory and empirical evidence’,International Journal of Development Planning Literature, vol. 14, pp. 117–34.
—— (2000) Environmental Economics for Non-Economists, New York, London,Singapore: World Scientific Publishing Ltd.
Barbier, E.B. (1997) ‘Environmental Kuznets curve’, Special Issue, Environment andDevelopment Economics, 2, pp. 369–81.
Barde, J.P. (1995) ‘Environmental policy and policy instruments’, in H. Folmer, J.L.Gabel and H. Opschoor (eds) Principles of Environmental and Resource Economics:A Guide for Students and Decision Makers, Aldershot, UK: Edward Elgar.
Beckerman, W. (1980) ‘Economic growth and the environment: whose growth?’,World Development, vol. 20, pp. 481–96.
Carraro, C. and D. Sinisalco (1996) ‘Voluntary agreements in environmental policy: atheoretical appraisal’, in A. Xepapadeas (ed.) Economic Policy for the Environmentand Natural Resources: Techniques for the Management and Control of Pollution,Cheltenham, UK: Edward Elgar.
Cole, M.A., A.J. Rayner and J.M. Bates (1997) ‘The environmental Kuznets curve: anempirical analysis’, Environment and Development Economics, vol. 2, pp. 401–16.
Cropper, M. and C. Griffiths (1994) ‘The interaction of population growth andenvironmental quality’, American Economic Review, vol. 84, pp. 250–4.
Daly, H and J.B. Cobb (1989) For the Common Good: Redirecting the Economy TowardCommunity, the Environment and a Sustainable Future, Boston: Beacon Press.
Daly, H.E. (1980) Economics, Ecology, Ethics, San Francisco: Freeman.—— (1993) ‘The perils of free trade’, Scientific American, November.De Bruyn, S.M. (1997) ‘Explaining the environmental Kuznets curve: structual
change and international agreements in reducing sulphur emissions’, Environmentand Development Economics, 2, pp. 485–503.
Diamond, P. (1965) ‘National debt in a neoclassical growth model’, AmericanEconomic Review, vol. 55, pp. 1126–50.
Grossman, G. (1993) ‘Pollution and growth: what do we know?’, CEPR DP-848,London: Centre for Economic Policy Research.
Grossman, G.M. and A.G. Krueger (1991) Environmental Impacts of a NorthAmerican Free Trade Agreement, National Bureau of Economic ResearchWorking Paper 3914, Cambridge MA: NBER.
Hair, J.D. (1993) ‘GATT and the Environment’, Journal of Commerce, December.Hansen, S. (1989) ‘Debt-for-nature swaps: overview and discussion of key issues’,
Ecological Economics, vol. 1, pp. 77–93.John, A. and R. Pecchenino (1994) ‘An overlapping generations model of growth and
the environment’, Economic Journal, vol. 104, pp. 1393–410.Komen, M.H.C., S. Gerking, and H. Folmer (1997) ‘Income and environmental
208 Author name

R&D: empirical evidence from OECD countries’, Environment and DevelopmentEconomics, vol. 2, pp. 505–15.
Kuznets, S. (1955) ‘Economic growth and income inequality’, American EconomicReview, vol. 49, pp. 1–28.
Liddle, B.T. (1996) ‘Environmental Kuznets curves and regional pollution’, Paperpresented to the 4th Biennial Conference of the International Society for Eco-logical Economics, Boston University, Boston, MA.
Lopez, R. (1994) ‘The environment as a factor of production: the effects of economicgrowth and trade liberalization’, Journal of Environmental Economics and Manage-ment, vol. 27, pp. 163–84.
McConnell, K.E. (1997) ‘Income and the demand for environmental quality’,Environment and Development Economics, vol. 2, pp. 383–99.
Mahony, R. (1992) ‘Debt-for-nature swaps: who really benefits?’, Ecologist, vol. 22,pp. 97–103.
Malthus, T.R. (1872) An Essay on the Principle of Population, 7th Edition, London:Reeves and Turner.
Meadows, D.H., D.L. Meadows, and W. Behrens (1972) The Limits of Growth: AReport to the Club of Rome’s Project on the Predicament of Mankind, New York:Universe Books.
Moomaw, W.R. and G.C. Unruh (1997) ‘Are environmental kuznets curves mis-leading us? the case of CO2 emissions’. Environment and Development Economics,vol. 29, pp. 451–63.
Organisation for Economic Co-operation and Development, OECD (1996) MakingMarkets Work for Biological Diversity: The Role of Economic Incentive Measures,Paris: OECD.
Panayotou, T. (1993) ‘Empirical tests and policy analysis of environmental degrad-ation at different stages of economic development’, Working Paper, WP238,Technology and Employment Programme, ILO, Geneva.
—— (1995) ‘Environmental degradation at different stages of economic develop-ment’, In I. Ahmed and J.A. Doeleman (eds), Beyond Rio: The EnvironmentalCrisis and Sustainable Livelihoods in the Third World, London: Macmillan.
—— (1997) ‘Demystifying the environmental kuznets curve: turning a black box intoa policy tool’, Environment and Development Economics, vol. 2, pp. 465–84.
Rothman, D.S. (1998) ‘Environmental Kuznets curves – real progress or passing thebuck? A case for assumption-based approaches’, Ecological Economics, vol. 25,pp. 177–194.
Samuelson, P. (1958) ‘An exact consumption-loan model of interest with or withoutthe social contrivance of money’, Journal of Political Economy, vol. 66, pp. 467–82.
Shafik, N. and. S. Bandyopadhyay (1992) ‘Economic growth and environmentalquality: time series and cross country evidence’, Background Paper for WorldDevelopment Report, WPS, The World Bank, Washington DC.
Stern, D.I., M.S. Common, and E.B. Barbier (1996) ‘Economic growth and environ-mental degradation: the environmental kuznets curve and sustainable develop-ment’, World Development, vol. 24, pp. 1151–60.
Suri, V. and D. Chapman (1998) ‘Economic growth, trade and energy: implicationsfor the environmental Kuznets curve’, Ecological Economics, May, 195–208.
Torras, M. and J.K. Boyce (1996) ‘Income inequality and pollution: a reassessment ofthe environment Kuznets curve’, Ecological Economics, special issue on EKC.
Globalization as Westernization 209

United Nations (UN) (1997) ‘Kyoto Protocol to the United Nations FrameworkConvention on Climate Change’, Article 3, Annex B, UN, New York.
United Nations Development Program (UNDP) (1996) Human Development Report,New York and Oxford: Oxford University Press.
—— (1997) Human Development Report, New York and Oxford: Oxford UniversityPress.
—— (1998) Human Development Report, Oxford University Press, New York andOxford.
Unruh, G.C. and W.R. Moomaw (1997) ‘An alternative analysis of apparent EKC-type transitions’, Ecological Economics, special issue on EKC.
Wackernagel, M., L. Onisto, A.C. Linares, I.S.F. Lopez, J.M. Garcia, A.I.S. Guerreroand M.G.S. Guerrero (1997) ‘Ecological footprints of nations: how much naturedo they use? How much nature do they have?’, The Earth Council, San Jose,Costa Rica, 10 March.
World Bank (1992) World Development Report 1992: Development and the Environ-ment, New York: Oxford University Press.
—— (1998) World Development Indicators 1998, CD-ROM Version, Washington,DC.
—— (1999) World Development Indicators 1998, CD-ROM Version, Washington,DC.
210 John Asafu-Adjaye

11 Globalization as Westernization
A post-colonial theory of globalexploitation
Ozay Mehmet
Introduction
Globalization, defined here as Westernization (i.e. the spread of Westerneconomic techniques, political institutions and norms), is a system thatenriches the West while impoverishing the Rest (Huntington 1993;Mahbubani 1992). The Western economic ideology is capitalism, a market-centred system of resource allocation dominated by owners of capital. In itslatest manifestation, capitalist ideology has joined neo-liberal and neo-conservative camps on the basis of a common belief in the universalsupremacy of market forces (Fukuyama 1992; Huntington 1996). While themarket has been enthroned, the power of the state has declined. This putsthe wellbeing of the vast majority of people around the globe at risk. Thechief villain is a globalizing capitalist ideology. What is this ideology?
The capitalist ideology has evolved in the West as a cumulative process,but it had its roots in the era of imperialism based on colonial exploitationof the Rest for the material benefit of the West. As such, it is not a newphenomenon. What is new, however, is the emergence in the post-1945period of a new sub-ideology of international development, engineered inthe West, ostensibly for narrowing the gap between the rich and developingworlds, but, in reality, to globalize Western capitalism.
The core of the international development ideology was a Eurocentricworldview (Mehmet 1995, 1999), based on the idealization of Westerneconomics and politics matched by a presumed inferiority of non-Westernnorms and institutions. This post-Westphalia worldview is a hierarchicalordering of inter-state relations. At the bottom of the system was the ThirdWorld, invented around 1950 (Harris 1987: 18). The Third World wasconceived as primitive and under-developed. But the idea of development,closely linked to progress, reflected capitalism’s ‘great ascent’ (Heilbronner1963). National development was led by a generation of Western-educatedleaders such as Nehru of India (Mehmet 1995: 61), willing to bank onWestern know-how and technology transferred from the First World. Reject-ing endogenous development options (e.g. Gandhian economics), these post-colonial leaders believed that they could copy and learn from the West and,
Globalization as Westernization 211

in time, catch up to the rich countries, in line with the ‘trickle-down’ theory(Todaro 1981: 68, 131). Naively they accepted Western aid and technicalassistance inflows intended to reconstruct the Third World just as MarshallPlan had reconstructed Europe.
From the Western donors’ perspective, the key motivation behind theideology of international development was a deliberate aim of winning ‘thehearts and minds’ of the non-Western people for capitalism in a globalstrategy of containment of Communism threatening it from the SecondWorld. Thus, Walter Rostow, the author of the influential ‘stages of growth’theory (Rostow 1960), expressed the dominant ideology of internationaldevelopment as a ‘non-Communist Manifesto’ and massive Western aid andtechnical assistance flowing into the Third World were justified as strategicinstruments of the Cold War. With these hidden agendas and conflictingexpectations between donors and recipients, it is no wonder that bothWestern aid programs and development theories have failed.
This chapter is an attempt to seek the deeper causal factors behind thisfailure. It is organized in five parts. Following this introduction, the secondpart will sketch out the ideology of international development in the post-war period when Westernizing donors and technocrats promoted the idea ofmass prosperity for all in previously colonial territories, now renamed theThird World. However, as explained in the third part, globalization ofcapitalism has worked as a tool of global inequality since it is a system ofmonopoly-monopsony exploitation on a global scale. Therefore, the fourthpart argues that Western capitalism is inherently unfit for the Global Village.The final part will highlight some of the main conclusions of the paper.
The ideology of international development
The West pursued the ideology of international development at two diametric-ally opposed, indeed contradictory, planes, one theoretical/analytical, and theother practical/policy. At the theoretical/analytical plane, a brand newdiscipline called ‘Development Economics’ was introduced and promoted inWestern universities in order to legitimize Third World development as ascientific field. The scientific basis of this new discipline was a ‘PerfectCompetition Model’, derived from mainstream economics. It was a deductiveconstruction, resting on highly individualistic behavioural assumptions, entire-ly reflecting European experience, in particular the Weberian Protestant Ethic.
What are these behavioural assumptions? How are they manifested? Theyare derived from market forces of supply and demand on the basis ofrevealed preferences that are supposed to be ‘rational.’ Consumers aresupposed to be utility-maximizers constrained by their tastes and incomes,while producers are profit-maximizers influenced only by production costsand technology. Social values such as cooperation, sharing and solidarity areirrelevant in market relations. These assumptions, however, even if valid inthe West, can hardly be claimed to be universal.
212 Ozay Mehmet

Yet market ideology has been vigorously globalized in the post-colonialperiod since 1950 in a process dominated by economists. Western economics,its inherent flaws and all, was utilized in this period by developmentpractitioners and technocrats churning out blueprints, to put forward waveupon wave of theories of international development. These includedcapitalist growth models assuming perfect capital–labour substitution(Harrod 1939; Domar 1946); two-sector theories of migration built onincome-maximizing rational behaviour (Lewis 1954; Harris and Todaro1970); balanced versus imbalanced theories of industrialization designed tocreate new industries and markets all based on the universality of the profitmotive. The chief underlying premise in all these theories and models ofinternational development was the imperative of transfer of Westerntechnology, know-how and aid in a top-down replication of the Westerncapitalist achievement in an imagined ‘Third World’ stylized into an abstractand uniform category for textbook analysis. Little heed was given to the factthat these imported abstractions hardly fitted the actual cultures, capabilitiesor requirements of the developing countries.
Worse still, at the practical/policy plane, trade and aid policies wereutilized to globalize Western production on a global assembly line. Initially,local industries were built under the protectionist ‘import-substitutionindustrialization’ (ISI) strategy favouring capital-intensive consumer goodsfor the local market. American-style marketing and advertising slowly butsurely began to erode local cultures in a new brand of consumerismconnecting the global assembly line with the global ‘supermarket’ (Barnetand Cavanagh 1994).
Arguably, the most Eurocentric industrialization theory was the famed‘two-sector’ model by Arthur Lewis, the author of Theory of EconomicGrowth (1955), who subsequently was honoured with a Nobel Prize inEconomics. The highly influential Lewis model aspired to industrialize alow-income, labour-surplus economy by massive transfers of the ‘disguisedunemployed’ into urban sectors. This would have two simultaneouspositive effects, both reinforcing each other to generate higher GNP. First,it would reduce excess surplus in agriculture, thereby automaticallyresulting in higher productivity. Second, it would create industrial employ-ment. In fact, neither of the predictions materialized. The assumption of‘disguised unemployment’ in agriculture was counter-factual since it wasbased on abstract theorizing, not hard empirical evidence. Neither was thepredicted industrial job creation realized owing to the pro-capital bias ofindustrialization.
The Lewis model, however, was adopted and popularized by Westerndonors and experts as the new gospel of development. Its main effect was ahuge rural–urban exodus of poor migrants looking for jobs and bettereconomic opportunities in urban sectors. The slums and urban poverty,which are now the dismal realities of many Third World cities, are the directconsequence of this kind of faulty theorizing.
Globalization as Westernization 213

In retrospect, it would have been far more effective to invest in rural andagrarian development, but that would have gone against the grain of pro-urban growthmanship of the period. Western extension workers, pushinginappropriate farm technologies more suitable for temperate climates thantropics, declared that Third World peasants and farmers were ‘irrational’merely because they resisted high-risk experiments.
While Third World agriculture and food sectors were neglected andsacrificed for the sake of pro-urban industrialization, world trade wasliberalized and entered a period of unprecedented expansion. Trade expan-sion benefited the West, enabling its major corporations to go international.The ISI strategy, then in vogue in the Third World, contributed to thisglobalization. Subsequently ‘export-oriented’ industrialization replaced ISIunder global sourcing and product standardization. Under both scenarios,however, the big winners have been the profit-seeking corporations whichhave ‘gone international’ to become global companies, transformingthemselves into multinational corporations (MNCs), sometimes referred toas multinational enterprises. Why and how these companies from the West,and subsequently from Japan and to a lesser degree from other countries,have emerged as MNCs has been extensively studied, from Vernon (1971) toDunning (1992). Whatever their motives, MNCs are global monopolies andoligopolies, dominating capital and technology markets. As a result, theyexercise market power and, thanks to this power, routinely exploit develop-ing countries by a systemic under-pricing of human and natural resources.This global exploitation enriches the First World while impoverishing theThird, an outcome imbedded in the way capitalism works.
This unequal outcome is not the result of some conspiracy, but rather theconsequence of the natural tendency of capitalist market forces. The forceswork, in a huge, largely decentralized, system of production andconsumption relations, toward the goal of capitalization on a global scale.Under capitalism, all production and consumption decisions have aninherent pro-capital bias. The end-result of these decisions is slowly butsurely to convert every productive resource, whether physical or natural orwhether in nature or imbedded in humans or families, into a new form ofcapital, ultimately to be owned and controlled by capitalists. We shall explainhow this global capitalization works in the next part of this chapter.
Capitalization: how monopolistic exploitation works globally
Monopolies, oligopolies and cartels driven by monopoly profit dominate thereal market system. This is especially true for international trade dominatedby MNCs, the chief instruments of capitalization. Although internationaltrade is subject to rules such as those managed by the World TradeOrganization (WTO), negotiated multilaterally, these rules reflect the interestof dominant trading powers, principally the USA, European countries andJapan. Unlike anti-trust, anti-monopolies and unfair trade laws, as for
214 Ozay Mehmet

example found in the USA, international trade regulation is silent onmonopolistic practices and monopoly profits in the global marketplace.
Monopoly profit rests on exploitation of labour and natural resourcesand it is a positive function of the rate of exploitation. The higher the rate ofexploitation, the greater the monopoly profits. There are two kinds ofmonopoly profit, direct and indirect, although both are, essentially, a returnon market control.
Direct monopoly profit is extracted by monopolists’ market control offactor or product markets and it reflects the ability to fix prices for inputs orproducts. A good example is the wage of a worker hired in the labour marketin which the employer is a monopsonist (i.e. single employer in the locallabour market), whereby the value of the worker’s output far exceeds thewage paid to the worker. The difference is exploitation accruing to themonopolist as a return on market power, the ratio of the exploitation marginto the value of worker’s output being the rate of exploitation of the workerby the monopolist. A different kind of monopoly exploitation occurs inproduct markets (e.g. manufacture of sport shoes) whereby a monopolistderives large monopoly exploitation by maximizing the difference betweenprices paid to workers (e.g. in Vietnam or Indonesia) and prices for which itsells to consumers in rich countries in North America.
Indirect monopoly profit occurs as a result of accounting manipulation.Transfer pricing is an important example of such manipulation. Intra-corporate sales and purchases are not real, but artificial accounting pricesused for bookkeeping purposes. It is used extensively by MNCs with branch-plants or subsidiaries in different countries to escape tax liability in foreignjurisdictions and help shift income from periphery to the home country.Thus, a subsidiary in Guyana, producing bauxite, may intentionally under-price its sales to the parent company in the USA, thereby declaring ‘loss’ inGuyana while simultaneously maximizing corporate earnings in the USA.Loss-making operations in Guyana then may be used to justify exploitationof Guyanese workers and resources by means of under-payment ofGuyanese labour and resources in addition to tax evasion and avoidance.
Besides transfer pricing, market control to extract monopoly profitsincludes forcing prices to rock-bottom in long-term contracts for thepurchase of raw materials such as petroleum in pre-OPEC days, or cheapelectricity or logs from countries rich in rain-forest. In plantation economies,an important tool of exploitation by Western plantation companies isstrategic stockpiling to buy cheap and sell dear, the basis of global profit-seeking.
The inner logic of the global profit-seeking behaviour of MNCs is globalexploitation based on capitalization, i.e. to enlarge the capital stock, heavilyconcentrated in the West, through conversion of non-capital resources intonew forms of capital along the global assembly line. Thus, labour in oneperiod becomes human capital in the next as a result of investment ineducation and training. New knowledge becomes intellectual property
Globalization as Westernization 215

transformed by modern technology. Environment becomes ecological assetsby monetizing natural resources. All these are privatized and controlled bycapitalists constantly enriched by capitalization.
All these forms of market power exploitation by MNCs work to enrichthe West by impoverishing the Third World. This global inequality is not theresult of some corporate conspiracy theory. Rather it is the natural outcomeof capitalist market forces, although, of course, the effects are no lessdisturbing.
The converse of Third World impoverishment by exploitation is incomeand wealth concentration in the West. Again, due to the operation ofcapitalist market forces, economic concentration in the North is always pro-rich. Capitalism is a non-national, non-egalitarian ideology: it is a systembased, not on nationalism, but on market inequality. It thrives in the West,as in the rest of the world, on inequality or polarization between the rich andthe rest.
Western capitalism is risky and speculative, sharing many commonsimilarities with gambling: a few win, but most lose. At a global level, theWest wins under capitalism, because market forces are Western-biased.Fundamentally, this stems from the fact that economics, as a body ofscientific knowledge, is pro-capital and anti-labour. While capital andtechnology are priced in the West at high levels, Third World resources areunder-priced, either by treating environment as a free good, labour asplentiful and cheap, or by such indirect means as intra-corporate transferpricing as observed above. Unions and social safety nets ensure workers inthe West decent wages, but few Third World workers enjoy such protection.
Under-pricing Third World labour and environment overstates the rate ofreturn on capital, over-values capital assets. It encourages speculation ratherthan steady growth, finally leading to the collapse of financial markets ashappened in the case of the Asian currency meltdown in 1997/8. Instabilityof markets is the very essence of capitalism. Cyclical as well as short-termswings in commodity markets, in foreign exchange markets and in othermarkets create opportunities for windfall gains and supernormal profits forspeculators and capitalists. If markets remained always in stable equilibrium,there would be merely normal returns for capitalists who drive the market.
In the nineteenth century the search for profit converted England from aclosed, agrarian economy into the ‘workshop of the world’, a worlddominated by aggressive ‘captains of industry’. Despite the initial success ofindustrialization, classical economists were pessimistic about the long-termsustainability of capitalism. John Stuart Mill predicted the ultimate collapseof the system due to vanishing profits in a stationary state. Malthus, theprophet of doom, was even more pessimistic, predicting a populationexplosion owing to ever-worsening population–food balance (Mehmet 1999:Chapter 2).
Going international with free trade and colonial expansion has postponedthe collapse predicted by nineteenth-century economists; it has not eliminated
216 Ozay Mehmet

the inherent danger. England, a small island, could ship its excess populationto the colonies. But mankind has nowhere to go to escape the law ofdiminishing returns on a global scale. Imagine how sustainable it wouldbecome if all the Indians and Chinese were to emulate the Western ideal ofconsumerism by becoming two-car owning families, living in 3,000 sq. ft.homes, complete with microwaves, dishwashers, etc.
To date, globalization, or a universalized market economy, has meant tradeliberalization and free capital mobility in financial flows and diffusion ofmodern technology. Who has benefited from this unprecedented growth?MNCs, since they control much of these capital and technology flows,especially in modern computer, information and communication sectors. In1992, there were some 37,000 MNCs compared to only 7,000 just twentyyears ago, with annual sales of US$5,500 billion, a figure considerably greaterthan the value of total world trade of US$4,000 billion (ILO 1994: 13).
While trade liberalization, actively pursued by the WTO, has promotedcapital mobility, there is no parallel freedom for labour. The InternationalLabour Organization (ILO), the oldest UN specialized agency responsiblefor worker rights, has been comparatively weak, and its labour standardshave had virtually no impact on international trade. Ironically, in the periodof rapid trade expansion and liberalization, there have been increasingbarriers for migrants in high-income countries, with extensive visa andcitizenship regulations and restrictive occupational licensing.
This asymmetry in the way capital and labour are treated in marketeconomies is a major bias of Western capitalism. While financial markets arebeing globalized, and the rights of capital protected under internationalrules (such the OECD-sponsored but ill-fated Multilateral Agreement onInvestment), there is no parallel concern about worker rights and the rightsof migrants. At best only lip service is being paid to international labourstandards while often ‘social clause’ debates in the USA or EU disclosestrong domestic protectionist interests. Meanwhile, labour-abundant regimesin the Third World notable by the absence of labour and environmentalstandards are becoming magnets for Western capital in search of profits in a‘race to the bottom’ whereby there is global downward pressure on wagesand an onslaught against social safety nets.
The capital–labour asymmetry is creating blockages in labour markets inthe Third World, and preventing the evolution of an orderly global labourmarket. The labour market imbalances are, in turn, pushing excess numbersof job seekers into the arms of unscrupulous labour contractors operatingan expanding trade in the trafficking of human beings (Mehmet et al. 1998:Chapter 2). Illegal networks of crime–prostitution–drugs now operateglobally, sometimes linked to international terrorism. Insufficient jobprospects and capital-biased macroeconomic policy management (largelybased on imported Western advice), are also generating social conflict(Thurow 1996; Rodrik 1998), riots and wars, always resulting in new wavesof refugees and displaced persons.
Globalization as Westernization 217

To illustrate these negative consequences of Western capitalist develop-ment, we shall now construct a simple model of export-oriented industrialestates (IEs). Sometimes called export-processing zones (EPZs), these arespecial-purpose development schemes, created by host countries in the hopethat they will operate as regional growth poles. A notable example is theBatam Island scheme between Indonesia, Singapore and Malaysia (Lee1991). Host countries actively seek to attract MNCs or their branch-plantswith a wide range of tax and tariff incentives along with such anti-labourguarantees as prohibition of unions or strikes on IEs and EPZ (Hadiz 1997).The IEs and EPZs facilitate the MNCs, global production and sourcingactivities. There is now a global assembly line along which parts andcomponents are produced, and final products assembled, in a multiplicity ofnational jurisdictions that effectively subordinate national interest to globalprofit-seeking by MNCs. This is because MNCs are typically ‘foot-loose’ andgenerate relatively low levels of retained value-added locally. In such labour-intensive sectors as electronics or garment industries, female workers workunder exploitative conditions and live in poverty (Buvinic 1997; Aslanbeiguiet al. 1994). In sweat-shops, out-sourcing for the global marketplace, oftenchildren are similarly exploited (Mehmet et al. 1998: 50–3).
Yet, production on IEs and EPZs is high value-added activity. How arethese value-added benefits distributed, specifically between resident and non-resident parties? This is the question which our simple model seeks toanswer.
In Figure 11.1 the IE/EPZ represents a meeting-place of two resourceflows: foreign capital and technology, denoted by Kf, and domestic resources
218 Ozay Mehmet
Figure 11.1 A model of exploitation on the IEs/EPZs.Source: Mehmet 1986: 84.

consisting of labour, L, land, N, and capital, Kd. These resources createvalue-added, VA, which is distributed amongst owners of resources. Ifperfect competition prevailed, VA would be distributed in direct relationshipto their contribution to the VA produced. However, since non-residentowners of resources (i.e. MNCs or their affilitiates) enjoy monopoly–monopsony powers, they extract the lion’s share of VA. Thus domesticworkers, without any rights or protection under social security laws, aresubject to exploitation. This implies that wages paid to these workers areonly a fraction of their marginal product, the difference being rents collectedby MNCs and their affiliates as monopoly profit. By contrast, payments forimports of technology typically entail over-payment to non-residentinvestors at the expense of domestic parties. Consequently, retained income,RY, is a relatively small percentage of total VA, in contrast to X, thepercentage share realized by non-residents in the form of payments forroyalties, management fees as well as profits.
Overall, the IE/EPZ model demonstrates the unequal distribution of thegains of economic growth between resident and non-resident actors. MNCsor their branch-plants are the principal gainers, at least in the early stages ofindustrial development, thanks to their monopoly–monopsony powers inlabour, capital and technology markets. In time, there may be long-termbenefits in the form of ‘learning by doing’. But these benefits may be erodedby new concession agreements between host governments and MNCs.Typically, these agreements favour the latter thanks to their mono-poly–monopsony powers, e.g. their ability to threaten host governments with‘foot-loose’ investment strategies of relocating to alternative regimes unlessthey get their way.
Is capitalism fit for the Global Village?
An economic system is founded upon the twin principles of efficiency andequity. The efficiency rules govern the transformation of inputs into outputsof goods and services, subject to cost and technology constraints. Equityrules relate to the distribution of rewards.
Capitalism is an efficiency-oriented system, which fails badly on equity. Infact, Kuznets (1955) has articulated in a classic contribution a hypothesisthat economic growth worsens income distribution. This stems from the factthat inequality is embedded in capitalism, more specifically in market forcesof supply and demand centred exclusively on ability to pay or ‘effectivedemand’. Ability to pay favours the rich, while ignoring basic human needs.How the rich acquire their income and wealth is immaterial for marketforces. Fruits of exploitation and other unfair practices are treated at parwith the productivity of honest work and fair means. These same marketforces dismiss totally human need, even when occasioned by hunger causedby famine, or by prevailing norms of justice and fairness, and biologicalfactors of human existence. The Kuznets inequality hypothesis, at first
Globalization as Westernization 219

thought to be temporary and expected to vanish under a ‘trickle-down’process (Mehmet 1999: 13–14), underscores the inappropriateness of Westerncapitalism for the developing world.
The capitalist system is unfit for the Global Village, which requires notonly efficiency, but equity and sustainability as well. It is no accident that theWest holds the largest stock of capital assets in the world. This outcome isthe by-product of the unequal operation of market forces. These forcesconcentrate wealth and productive assets in the West at the expense of theRest. According to the latest Human Development Report (UNDP 1999), therichest 20 per cent of the world population living in high-income countrieshad 86 per cent of the world GDP compared to just 1 per cent share of thebottom 20 per cent (UNDP 1999: 3). In fact, these global inequalities havesteadily worsened in recent decades.
There is a huge chasm between Third World realities and idealized marketforces as they are presented in textbooks on economics. The textbookversion is built on a utopian concept of ‘perfect competition’, based onperfect foresight and information, absence of government and many buyersand sellers. The economic ideal of perfect competition is an impossibleabstraction far removed from how real markets work. As shown in thepreceding part, the real market is a system of monopoly exploitationimpoverishing the majority of humankind for the benefit of the few rich incapitalist economies in great affluence. Thus, again citing from the UNDPHuman Development Report 1999:
The world’s 200 richest people more than doubled their net worth infour years to 1998, to more than $1 trillion. The assets of the top threebillionaires are more than the combined GNP of all least developedcountries and their 600 million people.
The Global Village must be built on social justice. As such, the GlobalVillage would require not only efficiency rules, but also equity and sustain-ability rules as well to ensure the welfare of all members of the GlobalFamily. In an inherently unequal and unjust world, it is futile to advocate andprescribe ‘civil society’ reforms for the Rest. Civil society reforms must be tiedto global governance effective reforms in the global trading and financialsystem to ensure sustainable and equitable world development. In this spirit itis time to phase out conventional aid programs by international taxation togenerate autonomous resource flows for investment in sustainable develop-ment in the South. Logically these taxes should be levied on MNCs as acounter for their monopoly/monopsony powers (Mehmet 1980).
Conclusion
Free trade cannot be free for all. Otherwise new rounds of crises will followthe Asian currency collapse. Unregulated capital movements may be good
220 Ozay Mehmet

Globalization as Westernization 221
for speculators, but they undermine sustained economic development. Theremust be agreed international regulation of international trade and capitalemanating from the principle of equality of all stakeholders in the Northand South, with global equity emerging as much a cornerstone of WTO astrade liberalization.
Western capitalism is too pro-capital and too exploitative to fit the GlobalVillage. Equitable distribution of global wealth and sustainable developmentmust be the foundations of the Global Village. The efficiency gains of eco-nomic growth must be equitably distributed for the benefit of the GlobalFamily. A.K. Sen’s theory of entitlement based on expansion of humancapabilities (Sen 1998) is a good ethical system for guiding transition to amore just and egalitarian global governance (UN Commission on GlobalGovernance 1995). A good starting point in this direction would be majorreform of international financial institutions and development agencies nowsome 50 years old and outmoded. In the global marketplace, capitalizationand monopoly/monopsony exploitation by MNCs and other forms of unfairtrade practices must be brought within the WTO regime, and tradeliberalization must be linked to core ILO labour standards and other ‘bestpractice’ guidelines collectively agreed for sustainable development to benefitpresent as well as future generations.
In the twenty-first century, Western economics, and in particular the sub-discipline of economic development, will need to transform itself in threeparticular respects. In the first place, it must become more inter-disciplinaryand more normative by linking itself to international ethics representing ablend of Western and non-Western ethical values (Goulet 1997). This is howeconomics can begin to cast off its Eurocentric (or neo-mercantilist) bias. Inparticular, aid programs based on donor interest must be replaced byautonomous resource flows financed from taxes levied on MNCs and suchinnovative mechanisms as the Tobin Tax on speculative currency movements.
Second, globalization of trade and finance must be accompanied byinternational social policy (Mishra 1997) to ensure a level playing field inlabour markets by protecting vulnerable groups such as children and women,now subject to exploitation along the global assembly line. Similarly, it isvital to universalize basic worker rights everywhere in an integrating worldeconomy. The ILO Declaration on Fundamental Principles and Rights ofWork, adopted at the June 1998 International Labour Conference, is apromising start in this direction (ILO 1998).
Thirdly, global development needs to evolve from multicultural consent.Rules of international trade, aid and investment must be determined on thebasis of global dialogue, not imposed by Western powers alone. It is time todemocratize such agencies as the WTO, WB and the IMF which are nowunder the domination of Western powers. Economic development must giveway to human development so that people become ends, not means. Thisshould also apply to measurement of economic performance, in particularpoverty reduction.
222 Ozay Mehmet
References
Aslanbeigui, N. (1994) Women in the Age of Economic Transformation,London andNew York: Routledge.
Barnet, R.J. and J. Cavanagh (1994) Global Dreams: Imperial Corporations and theNew World Order, New York: Simon & Shuster.
Buvinic, M. (1997) ‘Women in poverty: a new global underclass’, Foreign Policy,no. 108, Fall.
Domar, E. (1946) ‘Capital expansion, rate of growth and employment’,Econometrica, April.
Drydyk, J and P. Penz (eds) (1997) Global Justice, Global Democracy, Society forSocialist Studies, vol. 12, Winnipeg/Halifax, Canada: Fernwood Publishing.
Dunning, J. (1992) Multinational Enterprises and the Global Economy, Don Mills,Ontario: Addison-Wesley.
Fukuyama, F (1992) The End of History and the Last Man, London: H. Hamilton.Goulet, D. (1997) ‘Development ethics: a new discipline’, International Journal of
Social Economics, vol. 24, no. 11.Hadiz, V.R. (1997) Workers and the State in New Order Indonesia, London and New
York: Routledge.Harris, J.R. and M. Todaro (1970) ‘Migration, unemployment and development: a
two-sector model’, American Economic Review, March.Harris, N. (1987) The End of the Third World: New Industrializing Countries and the
Decline of an Ideology, Harmondsworth: Penguin.Harrod, R.F. (1939) ‘An essay in dynamic theory’, Economic Journal, vol. 49.Heilbronner, R. (1963) The Great Ascent: The Struggle for Economic Development in
our Time, New York: Harper & Row.Huntington, S. (1993) ‘The Clash of Civilizations?’, Foreign Affairs, Summer.—— (1996) The Clash of Civilizations and the Remaking of World Order, New York:
Simon & Shuster.ILO (1994) Defending Values, Promoting Change: Social Justice in a Global Economy,
An ILO Agenda, Geneva.—— (1998) ILO Declaration on Fundamental Principles and Rights at Work and Its
Follow-Up, Geneva, 18 June.Kuznets, S. (1955) ‘Economic growth and income inequality’ American Economic
Review, March.Lee, T.Y. (ed.) (1991) Growth Triangle: The Johor-Singapore-Riau Experience,
Singapore: ISEAS.Lewis, A. (1954) ‘Economic development with unlimited supplies of labour’,
Manchester School, May.—— (1955) The Theory of Economic Growth, London: Unwin.Mahbubani, K. (1992) ‘The West and the Rest’ The National Interest, Summer.Mehmet, O. (1980) ‘An interntional levy on multinational corporations’ International
Interactions, vol. 7, no. 2.—— (1986) Development in Malaysia, Poverty, Wealth and Trusteeship, London:
Croom Helm.—— (1995) Westernizing the Third World, the Eurocentricity of Economic Develop-
ment Theories, London and New York: Routledge.—— (1999) Westernizing the Third World, the Eurocentricity of Economic
Development Theories, 2nd Edition, London and New York: Routledge.

Globalization as Westernization 223
Mehmet, O., E. Mendes, R. Sinding (1998) Towards a Fair Global Labour Market,Avoiding a New Slave Trade, London and New York: Routledge.
Mishra, R. (1997) ‘Globalization and social policy: defending social standards’, inDrydyk and Penz, op. cit.
Rodrik, D. (1998) ‘Globalisation, social conflict and economic growth’ The WorldEconomy, vol. 21, no..2, March.
Rostow, W. (1960) The Stages of Economic Growth, A Non-Communist Manifesto,Cambridge: Cambridge University Press.
Sen, A.K. (1998) ‘Human development and financial conservatism’ World Develop-ment, vol. 26, no.4
Thurow, L. (1996) The Future of Capitalism: How Today’s Forces Shape Tomorrow’sWorld, New York: Marrow.
Todaro, M. (1981) Economic Development in the Third World, 2nd edition, New York:Longman.
UN Commission on Global Governance (1995) Our Global Neighbourhood, NewYork: Oxford University Press.
UNDP (1999) Human Development Report, New York: Oxford University Press.Vernon, R. (1971) Sovereignty At Bay, New York: Basic Book.

224 Index
Index
Adams, W. 46Agcaoili, M. and Rosegrant, M. 78Agarwal, B. 64Aggarwal, M.R. xixAghevli, B.B. 166Alexandratos, N. 74, 75, 78Anderson, K. 73,74, 90Antle, S.M. and Heidebrink, G. 194, 199APEC 128, 139Arrow, K. 22, 122, 201Asafu-Adjaye, J. xx, 199, 202Asian economic crisis 1997–1998 162Aslanbeigui, N. 62Aslanbeigui, N. and Medema, S. 63Aslanbeigui, N. and Summerfield, G. 66
backwash effect 3, 44Badiane, O. and Delgado, O.L. 75Baker Plan 115balanced and unbalanced growth 5Balassa, B. 121, 131Baldwin, G. 41Barbier, E.B. 92, 202Bardhan, P. 7, 11, 81Barnes, D.F. and Olivares, J. 91Barnet, R.J. and Cavanagh, J. 213basic human needs 8Basu, A. 57Basu, K. xixBaud, I. and Smyth, I. 66Bautista, R. and Valdes, A. 88Becker, G.S. 61Bellman, R. 22Berry, R.A. and Soligo, R. 50, 59Bhagwati, J. 2, 6
Bhagwati, J. and Hamada, K. 50Bhardwaj, R. 122Bhatia, R. and Falkenmark, M. 92Bidani, B. and Ravallion, M. 87Binswanger, H.P. and Deininger, K. 87Blumberg, R.L. 62Boris, E. and Prugl, E. 59Boserup, E. 67Brady Plan 115Brain drain or brain overflow 41brain drain xv, xvii, 4, 41, 44, 45, 46, 47,
48, 49, 51brain migration 40, 42Bretton Woods Conference 156, 180Bromley, D.D. 91Brundtland Report 131
Cagatay, N. 67Cairnes, J.E. 120Camdessus, M. 159capabilities and entitlements concepts
66capital labor asymmetry 217capital markets 27capitalization 215, 216CATT 125, 133Choudhury, M.A. 21, 24,Christiaensen, L. 81chronic malnutrition 81civil society 220Club of Rome, The 187Cole, M.A. 199Committee on Trade and Environment
(CTE) 132conditionality 158

Index 225
Contreras-Hermosilla, A. 92Cropper, M. and Griffiths, C. 198
Daly, H. and Cobb, J.B. 188Dasgupta, P. 81Dasgupta, P. and Maler, I. 91, 93David, P.A. 138DeBruyn, S.M. 198debt to GNP ratio 109debt burden 16debt crisis xviii, 66, 115 debt indicators 106debt servicing 106debt to GNP ratio 117, 118debt trap xv, xviiidecade of reappraisal 8Del Rosso, J. 80Delgado, C.M. 89Denison, E.F. 6development economics (DE) 1, 212Devereux, S. 72Diamond, P. 192differentia specifica of DE 1direct monopoly profit 215dirigisme 11Domar, E. 5, 213domination and dependency 4Dos Santos 4Dreze, J. and Sen, A.K. 72, 96Drucker, P. 21Dunning, J. 214
Eckaus, R.S. 3economic development 221economic growth and distributive equity
19Ellsworth, P.T. 122Elson, D. 59Emmanuel, A. 4endogenous credit expansion 163enhanced Toronto terms 115Enos, J.S. 141environment policy 58, 64 199environmental Kuznets curve 192environmental problem xxenvironmental quality 201environmental trends 190environmentalism 187equity and justice 90
era of free trade 15era of imperialism 211era of managed trade 125Escobar, A. 63, 66Esteva, G. 8Ethiopian famine 72Evans, A. 72evolutionary model of development 35external debt 105external debt: dimension and
distribution 105
factor price equalisation 121FAO 78, 80, 91, 93, 94finance capital xixfixed factor proportions 3food security xv, xviii, 70, 92foreign technology 6future of DE 10free trade xixFriedman, M. 125FTA 128Fukuyama, F. 211
GATT 132, 139Gaidar, Y. 168Gandhian economics 211gender and development xvii, 9, 66gender and food security 94gender disparities 66Gender Empowerment Index 19Gender Empowerment Measure 20gender inequality xviiGender-related Index 19Ghosh, B.N. xvii, 4, 7, 41, 43Ghosh, B.N. and Ghosh, R. 48, 54Ghosh, R. vii, 41Gil-Diaz, F. 161Gittinger, J. 94 Gleick, P. 92, 93global capitalization 214global central bank 181global crisis 181global exploitation 214, 215 global family 220global pollution 207Gupta, G.S. xvii, 59global supermarket 213global village 212, 220, 221

226 Index
globalisation 10, 31, 58, 132, 145, 146,147, 150, 190, 217, 221
globalisation and the transfer oftechnology 144
globalization as westernization xxglobalisation of capitalism xxglobalisation xix, 64, 211Goetx, A.M. and Sengupta, R. 59Goldman, D.P. 161government failure xvGreat Depression 105, 155greenhouse effect 132Grossman, G. 198Grossman, G. and Helpman, E. 148Grossman, G. and Krueger, A.G. 196Grown, C. 67Grubel, H.B. and Lloyd, P. 123Grubel, H.B. and Scott, A.D. 49, 59Guitian, M. 175Gunder, F. 4Gunnar, M. l 6
Haberler, G. 120Haddad, L. 61Hair, J.D. 187Hans, S. 5 Harcourt, W. 9Harris, J.R. 211Harris, J.R. and Todaro, M. 213Harrod, R.M. 5, 213Harrod and Domar’s growth model 128HDI 23, 27, 36Heckscher, F. 120Heckscher–Ohlin model 120Heilbronner, R. 211Higgins, B. 3high quality manpower (HQM) xvii, 40,
41, 44, 45, 49, 50, 51Hill, A. 144Hill, A. and King, E. 61Hirschman, A. 10, 57Hirschman, R. 5Homer-Dixon, T. 90, 92Hoskins, W.L. and Coons, J.W. 159Houston terms 115Huang, J. and Bouis, H. 89Huang, Y. and Kalirajan, K.P. 88Hufbauer, G. 122Hulme, D. 60
human capital 148human development (HD) xv, 10, 12,
16, 26, 27, 30, 221Human Development Index 19human development indices xviiHuman Development Report 17, 25,
190human environment 21Human Poverty Index 19, 20Huntington, R. 211Hymer, S. 138
IBRD 16, 217, 221ideology of international development
212indirect monopoly profit 215Inglott, P.S. 4international dualism 4International Monetary Fund (IMF)
xv, xvii, xix, xx, 4, 9, 17, 31, 33, 34,36, 63, 115, 154, 157, 164, 165, 167,169, 170, 171, 172, 173, 174, 175,176, 177, 179, 180, 181
international political disorder xvinternational political market xvinternational structuralist model 4Ireson, C. 65Islam, M. 74
Jackson, C. and Pearson, R. 57, 66Jaquette, J.S. and Wolchik, S.L. 63John, A. and Pecchenino, R. 192, 193Johnson, H. 50, 74, 121Jolly, R. and Seers, D. 47
Kadmos, G. xixKennedy, E. and Bouis, H. 73Kennedy, E. and Peters, P. 73Keynes, J.M. 156Keynesian economic theory 8Keynesian theory 105KLSE 18Knight, J.B. 11Kobrin, S.J. 139Komen, M.H.C. 202Konandreas, P. 71Kravis, I.B. 121, 122Krueger, A. 7, 88Kuznets inequality hypothesis 219

Index 227
Kuznets, S. 192, 219Kynch, J. and Sen, A.K. 65
labour theory of value 120Lal, D. 12Lall, S. 148Lane, T. 164, 173Leach, M. and Mearns, R. 91Learner, A.P. 120learning by doing 219Leibenstein, H. 5lending arrangements of the IMF 157Leontief paradox 121Leontief, W. 120Lewis, A.W. 2, 12, 203, 213Lewis model 213Liddle, B.T. 202limits to growth 8, 187Lin, J. and Shen, M. 88Linder, S. 122linear stage model 4linear stage theories 2Linhert, P.H. 92Lipton, M. and Ravallion, M. 87London club/terms 115lost decade 8low-level equilibrium trap 3Lucas, R.E. 136, 148
McConnell, K.E. 194, 201MacDougall, G.D.A. 121McGrew, A. 145Mahbubani, K. 211Mahoney, R. 206Mansfield, E. 141Marini, R.M. 4market failure xv, 188Marx, K. and Engels, F. 136Mathew, T.J. 52 Mathur, A. 5Maxwell, D. 72Maxwell, D. and Wieb, K. 73Maxwell, S. 73Mayer, M. 163, 174Meade, J. 120 measuring progress in food security
74Mehmet, O. xx, 27, 216, 217, 218, 211,
220
Mellor, J.W. 3Mexican crisis 1994–1995 159Meyer, L.H. 176Mill, J.S. 120Minhas, B.S. 122Mink, S. 90, 91Mishra, R. 221MNCs xix, 132, 137, 138, 139, 142, 144,
145, 146, 147, 148, 150, 214, 218,219
MNCs and the transfer of technology138
Muhavi, D.K. and Preston, S.H. 81multinational capitalism 6multinationals 43Murphy, J. 58Murray, R. 139Myint, H. 3Myrdal, G. 3, 48
NAFTA 128, 132, 160, 196Nambiar, S. 137, 143 Naples terms 115Narayanan, S. 141neo-classical factor proportion theory
123neo-imperialist policy xviinew financial architecture xvnew international economic disorder
xvnewly industralised countries (NIC)
124, 137Niskanen, W. A. 171North, D. 144North South debate 9North–South relation 11Nurkse, R. 3, 5Nussbaum, M. and Glover, J. 66
Obstfeld, M. 18O’Connell, H. 9OECD 17, 191, 24 O’Hara, P.A. xixOhlin, B. 120Ohlin’s partial equalization hypothesis
121OPEC 105, 114optimal resource allocation 22overlapping generations models 192

228 Index
Panayotou, T. 92, 198, 202 Papanek, H. 63paradigm shifts in DE x, 7Pardy, P.G. 80Pareto optimal situation 51Pareto optimality 119Paris club 115Paul, D. 137Payne, A. and Lipton, M. 73Peach, J. and Adkisson, R. 159Pearce, D. and Warford, J. 92Penning de Vries, F. 79perfect competition model 212physical quality of life (PQLI) 131Pinstrup Anderson, P. 74, 80political economy models 196Porter, M. 139Posner, M.V. 122post-Bretton Woods 114Postel, S. 93post-Wesphalia 211poverty 91poverty alleviation 27Prebrazhensky-type of model 6price fluctuations in world markets 73price instability 7price stablisation 74privatisation 18, 31product cycle model 122productional consumption models
194purpose and role of the IMF 154
R&D 41, 47, 51, 137, 139, 144, 145,146, 147, 149
Rasiah, R. 144Ravallion, M. 72Rawls, J. 31regionalism 128relevance of the IMF 170Repetto, R. 92–3,Report of UNDP 16Reutlinger, S. 71–2reverse flow of technology 45reverse transfer of technology 9Ricardian model of trade 121Ricardo, D. 119Ricardo’s ‘Constant Cost’ model 119
risk-takers 6Rodan, R. 5Rodrik, D. 217Romans, T.J. 49, 148Romer, G. 136, 137Romer’s formulation of growth 136Rosegrant, M. and Ringler, C. 74, 90Rostow, W.W. 5, 212Rostowian take-off 6Rothman, D.S. 201Russian crisis 1997–1998 167
Sahn, D.E. 72Saito, K.A. 94Salih, K. and Young, M.L. 144Samir, A. 4Samuelson, P. 120, 121, 192SAPTA 128Saunders, B. 167Schumpeter, J. 136Schumpeterian 6seed corn technology 41, 43Sen, A.K. 2, 6, 10, 21, 31, 46, 52, 57,
58, 62, 66, 72, 221Sen, A.K. and Sengupta, S. 65, 72Shackle, G.L.S. 22Shafik, N. and Bandyopadhyay, S.
199Shankaran, N. xixSimon, D. 140Simon’s models of man 22simplest linear model (SLIM) 137Singer, H.W. 8, 10Smith, A. 119Snyder, M. 95social wellbeing and military
expenditure 30social wellbeing criterion function 21social wellbeing function 22, 24, 35Soros, G. 177 spread effect 3Srinivasan, T.N. 132stages of growth 212Stamoulis, K. 73, 87Stern, N. 1, 121, 201Stolper, F. and Samuelson, P.A. 121Strauss, J. and Thomas, D. 73Streeton, P. 5

Index 229
Stringer, R. xviii, 90, 92, 93structural adjustment 30, 58 Structural Adjustment Programme
(SAP) 124structural adjustment under the IMF
26structural-cultural theories 2structured knowledge 138Summerfield, G. xvii, 62, 66surplus extraction 9surplus extraction approach 4sustainable development xix, 131
Tarabrin, E.A. 47tariffs to non-tariff barriers 125Tatemoto, M. and Ichimura, S. 122technology 142technology gap theory 122technology transfer xv, 136, 144, 147,
148, 150technology transfer and information
loss 14theorising on underdevelopment and
development 2theory of optimisation 123theory of social formation 4Thomas, B. 50Thomas, D. 72Thomas, M. 187threshold theory 5Thurow, L. 31, 217Timmer, P. 87Timofeyev, A. 45Tinker, J. 59, 60,Tinker, J. and Summerfield, G. 63, 64,
65Tobin Tax 36, 221Todaro, M.P. 4, 212Tokyo and Uruguay Rounds 125Tomkins, A. and Watson, F. 73Toronto terms 115Torrens, R. 119Toye, J. 11Trade Intensity Index 131Trade Related Intellectual Property
Rights (TRIPS) 132
transfer of technology 141transnational/multinational
corporations 63trickle-down theory 212
UN 88, 191UNCED 89, 92UNCTAD 45, 48, 50UNDP 35, 36, 54, 58, 190, 220uneconomic growth 188UNEP 132unequal distribution 219unequal exchange approach 4UNESCO 49UNIFEM 59Uzawa, H. 121
Valdes, A. and Lopez, R. 87Valdes, A. and Siamwalla, A. 71Vernon, R. 122, 214Vosti, S.A. 91
Wackernagel, M. 199Wahl, D.F. 122Wee, V. and Heyzer, N. 64Weisbrod, B.A. 50western capitalism 216westernisation 211White, Harry Dexter 156Whittaker, J.K. 22WHO 80Wiebe, K. 73Wignaraja, P. 8Williamson, J. 157, 158women in development 9World Bank xx, 6, 7, 9, 17, 30, 58, 61,
63, 73, 74, 78, 87, 92, 93, 94, 154,156, 167, 175, 176, 198
World Development Report 109World Food Conference 71World Intellectual Property Organisation
(WIPO) 132WTO xx, 117, 125, 128, 132, 133, 139,
214, 217, 221
Zysman, J. and Cohn, S.S. 136