100% Renewables in Australia - Home | Centre for...
44
100% Renewables in Australia: A Research Summary by Dr Jenny Riesz*, Dr Ben Elliston, Dr Peerapat Vithayasrichareon, Assoc. Prof. Iain MacGill Centre for Energy and Environmental Markets University of NSW CEEM Working Paper March 2016 *Corresponding author: Centre for Energy and Environmental Markets, The University of New South Wales, Sydney, NSW2052, Australia. Tel.: +61 411 042 502, Fax: +61 2 9385 5993. E-mail: [email protected]
Transcript of 100% Renewables in Australia - Home | Centre for...

100% Renewables in Australia:
A Research Summary
by
Dr Jenny Riesz*, Dr Ben Elliston, Dr Peerapat Vithayasrichareon, Assoc. Prof. Iain
MacGill
Centre for Energy and Environmental Markets
University of NSW
CEEM Working Paper
March 2016
*Corresponding author: Centre for Energy and Environmental Markets,
The University of New South Wales, Sydney, NSW2052, Australia.
Tel.: +61 411 042 502, Fax: +61 2 9385 5993.
E-mail: [email protected]

About CEEM
The UNSW Centre for Energy and Environmental Markets (CEEM) undertakes
interdisciplinary research in the design, analysis and performance monitoring of
energy and environmental markets and their associated policy frameworks. CEEM
brings together UNSW researchers from the Australian School of Business, the Faculty
of Engineering, the Institute of Environmental Studies, and the Faculty of Arts and Social
Sciences and the Faculty of Law, working alongside a growing number of international
partners. Its research areas include the design of spot, ancillary and forward electricity
markets, market-based environmental regulation, the integration of variable
renewable energy technologies into the electricity network, and the broader policy
context in which all these markets operate.
This working paper aims to summarise CEEM’s research on high renewable scenarios
for the NEM, with reference to other relevant work, in a form that is concise and
accessible for a general audience. We welcome comments and feedback, as a
valuable contribution to the refinement of our ongoing work program in this field.
The corresponding author for this working paper is Dr Jenny Riesz ([email protected]).
www.ceem.unsw.edu.au

i
Executive Summary
About this paper
This paper summarises the latest research on the challenges and opportunities of a
future 100% renewable Australian National Electricity Market (NEM). It focuses on work
undertaken at the Centre for Energy and Environmental Markets (CEEM) at UNSW
Australia, but also discusses other relevant Australian studies undertaken by groups
including Beyond Zero Emissions (BZE), the University of Sydney, and the Australian
Energy Market Operator (AEMO).
Background
Australia has one of the most emissions-intensive electricity systems in the world, relying
heavily on coal-fired generation. This means that a transition to a 100% renewable
power system represents a near fundamental transition from the present system. Given
the challenges experienced over the past decade by alternative low carbon options
including Carbon Capture and Storage (CCS) and nuclear, and the rapid progress of
key renewable technologies, a clean energy future for Australia may well hinge on
whether 100% renewables is whether this is possible and, if yes, how might it best be
achieved.
Is 100% renewables technically feasible?
Australia has extraordinary renewable energy potential, particularly in wind and solar.
Wind and solar photovoltaics (PV) technologies are commercially available and well
proven, and provide some of the most cost competitive generation options in
Australia. However, wind and solar PV bring new challenges to power systems.
Notably, they are:
1. Variable – The availability of wind and PV is highly variable and only somewhat
predictable (particularly for PV).
2. Non-synchronous – Wind and PV are non-synchronous, meaning that they
interact very differently with the power system, and do not inherently provide
many of the types of grid services that we have come to rely upon from large
coal and gas-fired generators.
However, wind and PV are not the only renewable technology types available for
potential deployment in Australia. As shown in Table 1, there are a range of other
renewable options, all of which are ‘firm’ (non-variable and fully dispatchable), and
synchronous (they integrate with the grid in a very similar way to conventional coal
and gas-fired technologies, and provide the same kinds of grid services). Indeed,
globally, there are already a number of nations with near 100% renewable electricity,
including Brazil, New Zealand and Iceland. All of these systems rely heavily upon the
firm, synchronous renewables, such as hydro, geothermal and biomass.
Table 1 – Renewable technology options for deployment in Australia
Variable, non-synchronous Firm, synchronous
Wind
Photovoltaics (PV)
Hydro
Concentrating solar thermal (CST) with storage
Biogas turbines (and other bioenergy)
Geothermal

ii
These technologies have different challenges; for example the potential to expand
hydro generation in Australia is likely to be limited, bioenergy can compete with other
land and resources uses, geothermal is at an early pilot stage in Australia, and
concentrating solar thermal (CST) remains very expensive compared to wind and PV.
However, by creating a generating portfolio including some mix of all of these types
of renewables, the research suggests that these challenges can be managed to
create a technically viable 100% renewable power system for Australia that is reliable
and secure. The challenge for Australia will be that in order to create a cost effective
100% renewable grid, we will likely need to integrate much larger quantities of wind
and PV, at levels beyond the experience of any grid in the world to date. Much
international research is focused in this area.
Research on 100% renewables in Australia
The research into 100% renewable electricity systems in Australia has focused to date
on exploring the temporal and geographical variability of renewable resources over
hourly time periods, investigated under a range of assumptions regarding available
renewable energy options, their costs, and future electricity demand. The non-
synchronous nature of wind and PV has been minimally explored to date, but is
typically managed in the models by requiring a minimum amount of synchronous
generation (such as hydro, CST, biogas turbines or geothermal) to be operating at any
time. There is reasonable confidence that this would address the issue, although the
level of synchronous generation required is unknown at present.
Work to date by UNSW and others including the Australian Energy Market Operator
(AEMO) suggests that a 100% renewable NEM can deliver the same level of reliability
as the present electricity system, provided that there is sufficient:
1. Firm, synchronous generation – The modelling indicates a need for at least
some firm, synchronous capacity included in the portfolio (potentially including
hydro, CST with storage, biogas turbines, or geothermal). These technologies
provide ‘dispatchable’ power at times of insufficient solar and wind, as well as
other grid services.
2. Transmission – A large increase in transmission capacity is likely to be required,
linking spatially diverse renewable generation and loads across the NEM. This
allows wind and solar generation to be geographically dispersed and hence
less variable; there are few periods when there is no sun or wind across the
whole NEM.
Whilst there are a range of technical challenges for electricity industry operation that
require further investigation, no insurmountable technical barriers to a 100% renewable
NEM have been identified.
How much will 100% renewables cost?
There are many limitations in the modelling of future power systems, most particularly
applying to estimates of cost. Given the many years that will be required to transition
from Australia’s present, fossil-fuel dominated system, we require forward looking
estimates for the costs of renewable energy technologies. Although it is reasonable to
predict that ongoing learning and innovation will mean that the costs of many of these
technologies will reduce over time (based upon past experience, such as the

iii
reductions in the cost of PV over the past decade), the degree to which costs might
fall for each technology is highly uncertain.
We use formal Australian government cost projections provided by the Australian
Energy Technology Assessment (AETA) for 2030 and 2050 and current NEM demand in
our work. Our findings highlight that the future costs of a 100% renewable NEM will
depend upon many factors, including the technologies available and possible
constraints on their widespread deployment, their realised future costs, and the costs
of necessary additional network investment. Our lowest cost scenarios include large
amounts of wind and PV (for cheap bulk energy), combined with around 40 GW of
firm, synchronous renewable technologies, including hydro, concentrating solar
thermal with storage, and biogas turbines. These firm renewables provide
dispatchable power on demand, sufficient to reliably meet the system peak demand
of 35 GW, with an additional margin, even if there are some periods with absolutely
no wind and photovoltaic power available. Work by others with different assumptions
has come up with broadly similar generation mixes depending on assumptions around
particular technologies such as CST (BZE) and geothermal (AEMO).
Future wholesale electricity costs for 100% renewables portfolios have been estimated
by UNSW and others (BZE, AEMO and the University of Sydney) to be between
$71/MWh and $200/MWh (including transmission), weighted in the middle of this range
at around $100-$140/MWh. The various cost estimates are illustrated in Figure 1,
including the components attributed to transmission.
Figure 1 – Projected costs of 100% renewables for the NEM1. Sources: [1, 2, 3, 4, 5]2
1 DR refers to the discount rate applied.
2 [3] and [4] remain under peer review, and are not yet formally published.
iv
To provide a basis for comparison, average annual wholesale NEM generation prices
have varied in the range $30-60/MWh (or 3-6c/kWh) over the past fifteen years. This
does not include transmission and distribution network costs or retail margins. The
average household cost, including all these components, is currently around 29c/kWh
or $290/MWh. Projections by AEMO based upon their modelling indicate that retail
customer bills would need to increase by around 6-8c/kWh, an increase of 20-30%, to
an electricity rate of around 35 - 37c/kWh, to achieve 100% renewables.
Based upon a total annual electricity cost of $1,499 for an average household [6], a
20-30% increase would equate to around $300 to $400 per year.
Importantly, a cost increase in this range is very similar to that forecast by organisations
such as the CSIRO for other possible future NEM scenarios, including those involving
continued significant reliance on fossil-fuels, depending on future fuel and potential
carbon emission costs. This means that a transition to a 100% renewable NEM may
represent a very modest cost compared to likely alternatives.
How can we achieve lower cost 100% renewable systems?
UNSW’s modelling suggests that achieving 100% renewable portfolios at the lower end
of the projected cost range will likely require the following measures:
- Enable significant wind generation – The lowest cost portfolios consistently
include significant quantities of wind generation (supplying up to 80% of
energy). Portfolios with lower proportions of wind are feasible, but generally
more expensive. Enabling wind deployment in this range may require measures
to establish and maintain a broader societal consensus around the benefits
associated with this technology.
- Address wind and PV integration challenges – Achieving such high proportions
of wind and PV generation brings many technical integration challenges which
will need to be addressed, including in adjustments to the NEM Rules, and in
AEMO’s operational procedures. UNSW’s modelling suggests particular
importance in maximising the amount of energy that can come from non-
synchronous sources, by minimising the application of unnecessarily
conservative constraints3.
- Some bioenergy – The availability of at least a small amount of flexible
bioenergy (or other peaking capacity, such as demand side participation) is
important to assist with periods of low wind and solar generation, at a
reasonable cost. Portfolios without any bioenergy are feasible (as long as other
firm synchronous technologies such as CST can be deployed), but are generally
more expensive.
- Minimise uncertainty – The cost of capital is very important for renewables,
and financiers will adjust this rate depending upon their judgement of the risks
3 In the Irish system, they have implemented an “NSP” limit, which defines the maximum amount of “non-
synchronous penetration” that can be managed by the system in any dispatch interval. If the NSP is
limited to 50%, for example, then half of the energy generated in any period must come from synchronous
sources, such as CST, geothermal or (bio)gas turbines. If the NSP is increased to 90%, then only 10% of
energy in any period needs to come from synchronous sources (and up to 90% can come from wind and
PV). Relaxing the NSP limit is found to reduce system costs considerably. Research is required to
determine the appropriate level for this limit, and how to minimise it.

v
associated with investing in a project. Policy frameworks and stable market
environments that minimise uncertainty over project returns will minimise the
cost of capital, and can reduce the costs of renewable generation
considerably.
It is also clear that new policies, market rules and regulatory frameworks will be
required to facilitate the major renewable investment involved, with suitable regard
to appropriate patterns of technology, location and timing. More generally, Australia
will need to establish and maintain a broader societal consensus around this profound
electricity industry transformation.
Transmission requirements and costs
Many of the best solar and wind sites in Australia are in remote locations that will
require significant transmission investment. Furthermore, balancing wind and PV
generation around the NEM requires strong interconnections to take advantage of
geographical diversity.
Some preliminary and high level estimates suggest transmission costs in the range of
$6 – 20/MWh (from studies by UNSW and AEMO), to enable 100% renewable scenarios.
This equates to around 10% of the total cost of a 100% renewable system, suggesting
that transmission expenditure is important, but not a dominating contributor to costs.
These costings only include a high level representation of the major interconnections;
further investment is likely to be required intra-regionally. For comparison, current
transmission expenditure in the NEM is around $2.7b/year or around $14/MWh. Much
of this investment is “sunk”, so a proportion of the transmission investment required to
enable 100% renewable scenarios is likely to be additional to these costs. For this
analysis, all new transmission investment has been considered as additional to present
(included in the total system costs quoted).
The impact of a 100% renewable NEM on distribution network costs will depend on
many factors including, critically, the role that distributed renewables such as
residential, commercial and industrial PV plays. There has been very little Australian
work to date on the overall costs of distributed scenarios of this nature.
Is 90% renewables likely to be significantly less expensive?
UNSW’s analysis suggests that there is not a significant escalation in costs to go from
80-90% renewables to 100% renewables. This is largely due to the availability of a range
of firm, synchronous renewable technologies (such as biogas turbines and
concentrating solar thermal with storage) that can cost effectively and reliably meet
the last 10-20% of energy that would otherwise be supplied by fossil fuels. Biogas
turbines, in particular, have a low capital cost, and therefore are cost effective for
operating rarely but providing the required level of reliability.
Mitigation of cost risk
UNSW’s modelling also highlights explicit co-benefits in moving to high renewable
scenarios, through the mitigation of cost risk associated with uncertain gas and carbon
prices in future. Renewables are shown to be very effective at mitigating this cost risk,
which consumers are exposed to in high fossil fuel scenarios (particularly high gas
scenarios). For this reason, a “gas transition” to renewables has been shown to be high
cost, and high risk, compared with a direct transition to renewables.
vi
Nuclear and Carbon Capture and Storage
UNSW’s modelling highlights that nuclear energy and carbon capture and storage are
both likely to be higher cost than renewables (in some cases, significantly higher cost).
These technologies also carry a significantly higher cost risk profile than renewables.
What next?
The technical feasibility and quite likely relatively attractive economics for a 100%
renewable NEM, naturally gives rise to possible next steps.
Given Australia’s pressing clean energy challenges, there are excellent reasons to set
higher and more ambitious renewable generation targets than those established at
present. While there are significant opportunities to reduce the costs of renewable
options through judicious R&D and demonstration, major deployment has proven a
key driver of reducing cost and improved expertise.
As renewable penetrations climb, we should not underestimate the challenges in
effectively and efficiently integrating these technologies into the NEM. Current NEM
arrangements have proven remarkably resilient to regionally significant wind and PV
penetrations to date (by comparison with some other electricity industries around the
world). However, a 100% renewable NEM will inevitably operate very differently to the
present, and significant resources will be required for all electricity industry
stakeholders to understand, drive and adapt to these changes.
Such profound electricity industry transition will also require societal consensus on the
importance of addressing our clean energy challenges and renewable energy’s role
in addressing them. Beyond these challenges lie the opportunity for Australian
leadership and innovation in creating a clean energy future for Australia and others
around the world.

vii
Contents
1 INTRODUCTION ........................................................................................................................... 1
1.1 ELECTRICITY IN AUSTRALIA.................................................................................................... 1
1.2 TERMINOLOGY .......................................................................................................................... 2
2 IS 100% RENEWABLES TECHNICALLY FEASIBLE? ......................................................... 4
3 HOW MUCH WOULD 100% RENEWABLES COST? ............................................................ 9
3.1 WHOLESALE COSTS ................................................................................................................ 10
3.2 TRANSMISSION REQUIREMENTS ............................................................................................ 13
3.3 COSTS SUMMARY .................................................................................................................... 15
3.4 PUTTING THE COSTS IN CONTEXT .......................................................................................... 16
3.5 WOULD 90% RENEWABLES BE SIGNIFICANTLY CHEAPER? ................................................. 20
3.6 MITIGATING COST RISK .......................................................................................................... 21
3.7 WHAT ABOUT A “GAS TRANSITION”? .................................................................................... 23
3.8 WHAT ABOUT NUCLEAR? ....................................................................................................... 24
3.9 WHAT ABOUT CCS?................................................................................................................ 25
4 CHALLENGES ON THE PATH TO 100% RENEWABLES .................................................. 26
5 CONCLUSIONS AND NEXT STEPS......................................................................................... 29
6 ACKNOWLEDGEMENTS .......................................................................................................... 29
7 ACRONYMS ................................................................................................................................. 29
8 REFERENCES .............................................................................................................................. 30

1
1 Introduction
This paper discusses the potential for a 100% renewable Australian National Electricity
Market (NEM), reviewing the latest research on the technical feasibility and potential
costs. It summarises the work conducted by the Centre for Energy and Environmental
Markets (CEEM) and associated researchers at UNSW Australia, but also discusses
other significant NEM related studies where they provide additional insights.
1.1 Electricity in Australia
As illustrated in Figure 2, Australia’s present electricity mix is dominated by fossil fuels,
with more than 60% of electricity generated from coal, and more than 20% from
natural gas. By contrast, renewables provided only 15% of Australian electricity in 2013-
14. Of this renewable generation in Australia, almost half is hydro-electricity, with only
6% of electricity being sourced from wind and photovoltaics at present. A transition
to 100% renewable electricity will require a very significant change.
Figure 2 – Australian electricity generation by fuel type (2013-14). Source: [7]
There are a number of distinct electric power systems in Australia. The two largest are
the National Electricity Market (NEM), and the South-West Interconnected System
(SWIS), as illustrated in Figure 3 [8]. There are other smaller grids in the Northern Territory,
Mt Isa, the Pilbara and small rural communities. Due to the relatively low loads served
by these smaller grids and the high costs of transmission lines over long distances, these
systems are not all physically connected at present.

2
Figure 3 – Australia’s electricity infrastructure. Source: [8]
The National Electricity Market (NEM)
The NEM is the largest power system in Australia, supplying approximately 200 TWh of
energy per year, with a peak demand of around 35 GW, and a minimum demand of
around 15 GW [9]. In 2012–13, the states and territories in the NEM (QLD, NSW, VIC, SA
and TAS) accounted for 85% of Australian electricity consumption [8].
Most published analysis on Australia’s electricity supply looks at the NEM only, since this
greatly simplifies the modelling, and captures a large majority of the electrical load in
Australia. A transition to 100% renewables would also require a transition of the other
electricity systems in Australia. The technical feasibility of renewable mini-grids has
been demonstrated in pilot studies, and in many cases, these remote locations can
be economically suitable for significant photovoltaics installations to offset costly
diesel imports [10]. However, this document doesn’t directly discuss the transition of
these other systems to renewable energy.
1.2 Terminology
Wind and photovoltaics aren’t “intermittent”, they’re “variable”
The term “intermittent” is commonly used to describe renewable technologies with
variable availability, such as wind and photovoltaics (PV). In normal usage,
“intermittent” is usually used to refer to things that suddenly switch on and off, with a
‘flickering’ characteristic.
NEM
SWIS

3
This is not a good description of how wind and PV generation varies over time [11].
Each wind turbine has some degree of physical inertia, meaning that in usual
operation it doesn’t suddenly cut in and out4. This is then aggregated over the whole
wind farm with many turbines, such that the total wind farm output will show a much
more gentle variability over time. Similarly, cloud cover moving over a PV installation
will take time to progress over the land area covered by the panels; the larger the
farm, the longer it will take, smoothing the generation produced by that installation.
When this is then aggregated over the whole power system, summing the output of
many wind and solar farms, geographical diversity means that the total wind and solar
output supplied to the system shows something that varies gradually hour to hour,
rather than cutting in and out in seconds.
The pervasive use of the term “intermittent” to describe wind and solar generation is
perhaps a part of the reason why the general public is so susceptible to the idea that
wind and solar generation can’t provide reliable power. Therefore, we use the term
‘variable generation’5. This more accurately describes the changing nature of wind
and solar generation over time, but avoids the association with rapid flickering.
The difference between local and whole-system renewable targets
It’s important to note that there is a significant difference between a 100% renewable
target for a local jurisdiction (such as a city or state), and a 100% renewable target for
a whole electricity grid (such as the NEM or the SWIS). For example, South Australia
could implement a 100% renewable target, and achieve this by importing and
exporting to the rest of the NEM. The NEM offers significant grid support and
“balancing” of renewable variability. Therefore, it is technically much easier to
achieve a renewables target in a local area (such as the ACT or South Australia) than
it is to transition the whole NEM to that target.
If desired, a city or state could also ‘achieve’ 100% renewables simply through the
purchase of Greenpower certificates for all electricity consumed. Many city councils
already do this for their own electricity purchases. The renewable generation would
not necessarily occur locally, and could be produced anywhere in Australia. This is
environmentally sound, and does support real growth in renewable generation in
locations with good renewable resources. However, it is technically different to
constructing sufficient renewable generation (and storage) to directly supply that city
or state, and it is extremely different to aiming for complete self-sufficiency on
renewables, disconnecting from the local grid, and self-supplying with a mini-grid and
storage. These options are illustrated in Figure 4.
4 With the exception of high speed cut outs in some older designs. Modern wind turbines typically ramp
down gradually at extreme wind speeds to avoid sudden cut out effects.
5 This term was proposed by, and is generally used by the US National Renewable Energy Laboratory
(NREL) in Golden, Colorado.

4
Figure 4 – Spectrum of options for Australian states and local government areas to
implement renewable energy targets
From a technical perspective, it is important to clarify what is meant by a local target.
Note that none of these should be considered universally superior; different
approaches will suit different communities. Some may be satisfied with the ease and
low cost of Greenpower. Others may prefer to invest in local renewables for the co-
benefits in local economic stimulation. Still other communities may find complete
disconnection preferable or necessary, especially where there is no pre-existing grid
(such as in remote rural communities), or in fringe-of-grid locations where the main grid
connection is expensive or unreliable.
The rest of this document discusses the prospects for transitioning the whole NEM to
100% renewables. By definition, this system must be managed with complete self-
sufficiency, since the NEM (and Australia) does not have any physical grid connections
to other nations at present.
2 Is 100% renewables technically feasible?
When discussing a 100% renewable power system, most people immediately think of
a system operating on wind and photovoltaics (PV). These technologies are very
different to those operating in Australia’s power system today. In particular, they have
variable and uncertain availability, and they are non-synchronous (meaning that they
interact with the power system in a very different way, and don’t inherently provide
many of the types of grid services supplied by conventional coal and gas-fired
generators)6.
However, there are a suite of other renewable technologies available, many of which
would likely be a part of the mix in a 100% renewable power system in Australia. Hydro,
6 Non-synchronous generation includes wind and photovoltaics, which connect to the system via an
inverter. Synchronous generation includes coal, gas, concentrating solar thermal, geothermal, biogas,
and hydro generation. Synchronous generators provide a range of important system services such as
inertia (to assist with managing system frequency), and fault level for riding through power system
disturbances [54]. Non-synchronous generators do not naturally provide these services, which must then
be sourced elsewhere (or managed in a different way).
Purchase Greenpower
Disconnect from
main grid, complete self-sufficiency
Install renewables
locally, continue to use main grid for balancing
Cheapest & easiest
Most expensive & complex

5
concentrating solar thermal (CST) with thermal storage, geothermal and biomass
technologies are all firm (non-variable), and synchronous (meaning that they interact
with the grid in a very similar way to existing coal and gas-fired units, and provide the
required types of grid services)7.
Table 2 shows that the overall potential for renewable generation in Australia is around
500 times greater than forecast NEM demand, in terms of both energy and capacity.
Moreover, around half of that potential is in firm, synchronous technologies. In
particular, there is vast potential for CST, which is a proven, commercially available
technology that could be installed in Australia immediately, if desired. Therefore, if we
wanted to, Australia could meet its entire electricity demand (many times over)
entirely with CST with storage, and the system could potentially operate very similarly
to today. This would be very expensive (CST is a more expensive technology
compared with wind and PV), but there is little doubt that it is technically feasible.
Since a system based entirely on CST would be a very expensive option, it would be
more sensible to use a mix of technologies, including some proportion of the variable
and much less expensive wind and PV. The exact proportion of wind and PV that is
lowest cost remains an active area of research, and will continue to evolve as
technology costs change over time.
Table 2 – Renewable potential in Australia. Source: [1]
Maximum installable
generation capacity
(GW)
Maximum
recoverable
electricity (TWh/yr)
Variable and
non-synchronous
Wind – onshore (capacity factor greater
than 35%) 880 3,100
Wind – offshore (capacity factor greater
than 35%)
660
3,100
Photovoltaics (PV) 24,100 71,700
Wave 133 275
Total variable
potential: 25,773 GW 78,175 TWh
Firm and
synchronous
Concentrating Solar
Thermal (CST) 18,500 41,600
Geothermal (EGS) 5,140 36,040
Geothermal (HSA) 360 2,530
Biomass 16 108
Hydro 8 12
Total firm potential: 24,024 GW 80,290 TWh
Current NEM 50 GW 200 TWh
7 International research is underway focused on enabling wind and PV plants to eventually provide some
of these services (for example, frequency control, fault ride-through capabilities, and synthetic inertia).

6
Figure 5 shows the lowest cost generation mix (by energy) for the NEM calculated by
CEEM, based upon recent technology cost assumptions. In this system, the lowest cost
wind and PV provide more than three quarters of the energy. A significant capacity
of biogas turbines are also installed; these operate only rarely (when wind and PV
output are insufficient to meet demand), but their low capital cost and firm
dispatchability means they provide cost effective reliability. These turbines play a role
very similar to gas peaking plant in the present NEM, which are installed to operate
only rarely when demand hits the highest peaks.
Figure 5 – Lowest cost generation mix for 100% renewables in the NEM. Source: UNSW’s
modelling8
Energy (TWh) Capacity Installed (GW)
Figure 6 provides a comparison of the firm capacity installed in a 100% renewable
system, with the capacity installed in the present NEM. In the present system, there is
around 50 GW of capacity, mostly composed of coal-fired and gas-fired generation.
This capacity meets a demand that varies from a minimum of 15 GW to a maximum
of 35 GW. A low cost, reliable 100% renewable system has far more capacity installed
(almost 200 GW), with most of that being in wind and PV. However, the 100%
renewable system maintains almost 40 GW in firm technologies (CST, biogas turbines
and hydro). This amount of firm capacity is sufficient to meet peak demand, even if
there is absolutely no wind and PV available when that peak in demand occurs. In
this way, the high reliability standard of the present system can be maintained, even
8 Modelling using the NEMO model, by Dr Ben Elliston. NEMO uses an evolutionary algorithm to search for
a least-cost technology mix, based upon hourly generation profiles for each technology, to meet an
hourly demand profile for 2010 [20]. Technology costs for 2030 were sourced from a comprehensive
Bureau of Resources and Energy Economics 2013 study [25], with PV costs updated based upon 2015
analysis by the CO2CRC, for utility scale single-axis tracking technology [5]. This analysis assumes
continuation of centralised electricity supply, and does not include consideration of transmission costs.
No batteries or demand side participation are included.

7
though wind and PV have variable availability. Wind and PV provide low cost bulk
energy most of the time, but the lights don’t go out just because the wind isn’t blowing,
and the sun isn’t shining.
Figure 6 - Comparing installed firm capacity9 [12, 13]
The concept of “back-up” generation
It’s tempting to think of the biogas turbines (and other types of firm renewables) as
“backing up” the variable renewables. When the variable renewables aren’t
available, the biogas turbines start up to supply power, and maintain reliability.
However, this conceptually leads to the idea that the variable renewables “lack”
something that they should be supplying, and even (in some international jurisdictions)
to the idea that the variable renewables should be paying an “integration cost” which
includes the cost of “back-up” generation.
A more appropriate conceptual framework notes that it is customers that require a
reliable electricity supply, and therefore should pay for the various aspects required to
provide it. Providing cost effective reliable electricity requires low cost bulk energy
(supplied by variable renewables), and firm capacity on-demand (supplied by biogas
turbines and other firm renewables). These are both “services” required by customers,
and therefore should be paid for by customers (not by other renewable generators)
[14].
A new power system paradigm
Figure 7 illustrates the new power system paradigm for a 100% renewable system. The
present system includes a large capacity of “baseload” generation that operates
most of the time, with peaking and intermediate plant ramping up and down to meet
variations in demand. In a renewable system, the variable renewables will provide the
9 CCGT refers to “Combined Cycle Gas Turbine”, a type of natural gas generator.

8
bulk of the energy, and firm, flexible renewables will ramp as required to fill the gap
and meet the demand. CEEM’s modelling has demonstrated that variable
renewables act primarily to displace baseload generation in the system, and partner
ideally with larger amounts of intermediate and peaking plant (such as biogas
turbines) [14]. Conceptually, the operational practice is similar: the generators with
the lowest operating cost are dispatched first.
Figure 7 – A new power system paradigm [15]
Beyond Zero Emissions (with the University of Melbourne’s Energy Research Institute)
were the first to publish modelling illustrating how a 100% renewable power system
could operate reliably in Australia [5]. This has since been supported by modelling at
UNSW, which further optimised the technology mix, and demonstrated that costs
could be lower if more wind and PV were integrated [16, 2, 17]. The University of
Sydney also recently released a study (still under review) demonstrating that Australian
electricity demand can be met with renewable technologies, “without using fossil
fuels, and at current stringent loss-of-load and reserve requirements, provided a
contribution is made by a flexible renewable technology featuring high capacity
credit, such as biofuels” [3].
In 2013, the Australian Energy Market Operator (AEMO) published a detailed report on
modelling of a 100% renewable electricity system in Australia [1]. AEMO is the
organisation responsible for operating the NEM, ensuring it operates reliably and
securely day to day, and over longer term horizons. As the operator of the NEM, they
are a very important electricity industry organisation, which makes their report
particularly important as a reference on the feasibility and cost of 100% renewables.
AEMO’s report concluded that the present reliability standard could be maintained,
and that the operational issues associated with a 100% renewable system “appear
manageable”. They state [1]:
“High penetrations of semi-scheduled and non-synchronous generation
would constitute a system that may be at or beyond the limits of known
capability and experience anywhere in the world to date…”
But:
“There are no fundamental technical limitations to operating the given 100
per cent renewable NEM power system generation portfolios that have
been identified.”

9
And:
“Many issues remain to be determined without doubt, but it is valuable to
note that this operational review has uncovered no fundamental limits to
100% renewables that can definitely be foreseen at this time.”
They also note that the transition to renewables will occur dynamically over time,
allowing proper scope for learning and evolution, with the additional experience
gained.
Therefore, even though the sun doesn’t always shine, and the wind doesn’t always
blow, the research is now clear that it is technically possible to build a 100% renewable
power system in the NEM, providing the same levels of reliability that we enjoy today.
Do we need novel energy storage systems such as batteries?
Modelling to date consistently suggests that novel battery energy storage are not
required to reliably operate a 100% renewable electricity system. There is sufficient
geographical diversity in the wind and PV generation in Australia, sufficient firm
renewable capacity available, and a host of other lower cost means for achieving
system flexibility, that an affordable, reliable electricity system can be constructed
without any need for electrochemical batteries at all.
However, if battery costs continue to fall, it may become cost effective to install some
battery storage, particularly in cases where this can defer investment in distribution
networks.
Batteries are likely to be important for facilitating larger quantities of PV generation
(beyond those illustrated in Figure 5), since PV only generates during a relatively
narrow window of time during the middle of the day [18]. This means that PV
generation can tend to “saturate” at a level of 8-15 GW in the NEM, if batteries are
not present [19, 20, 21, 22].
3 How much would 100% renewables cost?
If it is technically feasible to operate the NEM on 100% renewables, it comes down to
a question of cost. How much will it cost to build and operate this system?
There are many limitations in the modelling of future power systems, most particularly
applying to estimates of cost. Given the many years that will be required to transition
from Australia’s present, fossil-fuel dominated system, we require forward looking
estimates for the costs of renewable energy technologies. Although it is reasonable to
predict that ongoing learning and innovation will mean that the costs of many of these
technologies will reduce over time (based upon past experience, such as the
reductions in the cost of PV over the past decade), the degree to which costs might
fall for each technology is highly uncertain.

10
3.1 Wholesale costs
The wholesale cost of electricity is the cost of electricity purchased in bulk through the
NEM “pool”10. Residential customers typically purchase electricity through a retailer,
and pay a range of other costs in their electricity bill, as discussed in section 3.4. This
section outlines the modelling outcomes for wholesale costs, which are then put into
the context of average customer electricity bills in section 3.4.
The modelling presented here assumes that the centralised supply of electricity will
continue into the future. This assumes that most customers will continue to purchase
electricity from the main grid, and will not choose to self-supply the majority of their
electricity from rooftop photovoltaics, or other forms of distributed energy. A more
distributed (or even disconnected) scenario will lead to very different outcomes, and
has been minimally studied in Australia to date [23, 24].
Each of the relevant studies that projects costs for a 100% renewable electricity system
in the NEM are discussed below.
Beyond Zero Emissions
Beyond Zero Emissions (BZE) modelled a 100% renewable electricity system in 2020 in
the NEM, based upon a somewhat arbitrarily selected portfolio of 42.5 GW of CST with
up to 17 hours of molten salt thermal storage capacity (providing 60% of energy), and
48 GW of wind (providing the remaining 40% of energy). Their intention was to
demonstrate the potential reliability of such a system, rather than to optimise the
technology mix.
This system was costed at $120/MWh, including transmission augmentation [5].
Although this system relies heavily upon the relatively expensive CST technology, BZE
used a relatively low estimate for the cost of CST, and applied a very low discount rate
of 1.4%. The discount rate indicates the value placed on future costs or benefits, and
is of critical importance when evaluating the costs of capital intensive infrastructure,
such as renewable generation. This low discount rate was selected by BZE as a
representative measure for long term societal costs. However, a discount rate of 5-
10% is more standard for industry analysis.
UNSW (2013)
UNSW’s modelling of 100% renewables applied an evolutionary algorithm (in the
NEMO model) to optimise the mix of technologies in the generating portfolio, based
upon hourly generating profiles, to minimise total system costs. Widely accepted
technology cost estimates published by the Australian Government Bureau of
Resources and Energy Economics (BREE) in 2012 [25] were applied. Only technologies
that are commercially available today were included in the mix (for example,
geothermal and wave technologies were excluded), to demonstrate that 100%
10 There is a difference between “costs” and “prices”. In most studies on 100% renewables to date,
wholesale costs have been projected based upon the average total cost of the system (to install and
operate). This is similar to assuming that the electricity spot market will be competitive, such that spot
market prices will trend towards long run marginal costs. In reality, there are many influences on spot
market prices, and market participants often exercise market power. These effects are not taken into
account in these long term projections, but can be important, particularly where the market isn’t
operating competitively, or when investigating short term effects.

11
renewables is feasible and affordable, even if these emerging technologies never
become commercially available.
Based upon this analysis, the resulting 100% renewable portfolios modelled in 2030
sourced 30-40% of energy from wind, and 15-30% of energy from PV. Firm capacity
was provided by existing hydro, 8-13 GW of CST and 23 GW of biogas turbines. Costs
for 2030 were found to be in the range $96 - $108/MWh, not including transmission
augmentation, with a 5% discount rate11 [2], or $104-$119/MWh including long
distance transmission.
Australian Energy Market Operator (AEMO)
As discussed above, AEMO is a conservative organisation, highly trusted and
respected in the electricity industry, which makes their analysis particularly important.
Unlike UNSW’s modelling, AEMO’s portfolio did include emerging technologies (such
as geothermal and wave) in some scenarios. AEMO’s 2013 report projected total
system costs of $111 - $128/MWh for 2030, not including transmission (or $121 -
$139/MWh, including transmission) [1].
University of Sydney
The University of Sydney’s analysis (published as a working paper, still under review)
found costs of around $200/MWh, for 100% renewables in Australia12 [3]. Unlike the
other studies described here, this study included the SWIS and the Northern Territory
markets, as well as the NEM. The study explores a wide range of possible portfolios,
calculated by varying the costs of the technologies in the range ±25%.
There appear to be a range of conservative assumptions implemented in this
modelling, which lead to costs being higher than previous studies.
Firstly, the model includes a requirement that wind generation supplies no more than
30% of total generation, due to “integration issues”. As a result, almost half of energy
is supplied by the much more expensive CST technology. A wind integration limit of
30% could be considered conservative, given that other nations have already
achieved wind levels approaching this; for example, Ireland (a small, island power
system with all the associated integration challenges) is already operating at a wind
penetration level of 23%, and aiming to increase that level [26].
Secondly, wind generation in the study is limited to a capacity factor of only 20%. This
appears very low, compared with widely accepted datasets, and the operational
behaviour of existing wind farms. For example, the sixteen wind farms operating in
South Australia achieved average capacity factors between 27% and 42% over the
past five years [27]. Similarly, the Australian Government “Australian Energy
Technology Assessment” projected average on-shore wind capacity factors of 38%
[28]. The capacity factor has a strong influence over the levelised cost of electricity
sourced from this technology, and therefore this assumption could escalate costs
considerably.
11 UNSW’s analysis also included calculations applying a 10% discount rate, which led to wholesale costs
of $135 - $154/MWh (not including transmission augmentation), or $153-$173/MWh including long distance
transmission costs [13].
12 The discount rate used for this calculation was not provided, but could be a significant reason why this
cost is higher than other estimates.
12
Thirdly, the model limits “spilled” generation to no more than 20% of the total. Although
spilling could be considered “wasted” energy, it is not directly problematic in of itself,
so it is difficult to see why a more expensive power system should be selected, simply
on the basis of minimising spilling.
For these reasons, the University of Sydney estimate could be considered a
conservative estimate of costs.
UNSW (2016)
UNSW has recently conducted further modelling (still under review) with a number of
important model improvements which have reduced total system cost estimates to
$71/MWh13 (not including transmission) [4]. These updates include:
1. Updated cost data – using a more recent technology cost dataset, released
by BREE in 2013 [28]. This dataset reduced the variable operations and
maintenance cost of wind from $12/MWh to $10/MWh; when applied to the
very large proportion of wind generation in these portfolios, this makes a
significant difference in total system cost. The levelised cost of PV was also
reduced from a NEM average of around $143/MWh (in 2030), to around
$129/MWh, on the basis of observed rapid cost reductions for that
technology.
2. Better representation of wind diversity – This more recent modelling also
improved the representation of wind diversity. In UNSW’s earlier study [2],
wind diversity and variability was based upon observed historical operation of
existing wind farms. Due to the very limited number of operating wind farms
in Australia at the time, this limited the diversity in the wind profiles. For this
reason, the least cost portfolios included only 30-40% of energy from wind
generation. In contrast, UNSW’s more recent modelling utilised extensive
datasets produced by ROAM Consulting as an input to the AEMO 100%
Renewables Study [1]. These datasets provided hourly estimates of wind and
solar generation over six historical years, from 43 “polygon” areas across the
NEM. This dramatically increased the diversity of wind generation available
to the model. In response, the model includes far more wind generation
(supplying up to 70% of energy) in the latest portfolio calculations. This was
found to reduce the costs of 100% renewable scenarios considerably.
A wide range of different renewable portfolios were explored, illustrating the
robustness of reliable 100% renewable portfolios, even with various technologies
excluded from the mix. This modelling highlighted number of factors which are found
to be important for maintaining relatively low system costs:
1. Include significant quantities of wind – Including significant quantities of wind
generation brings costs down considerably. This suggests the importance of
policy mechanisms and research to enable significant wind deployment in
the NEM, to enable low cost 100% renewable scenarios. Although wind
generation is commercially relatively mature, there remain a range of barriers
to widespread deployment of this technology, such as community
acceptance and integration challenges. Addressing these barriers is
important for enabling low cost renewable portfolios.
13 With a 5% discount rate.

13
2. Include at least a small amount of bioenergy – Proponents of renewable
energy are often cautious about bioenergy, because some types can
compete with other uses of land and water resources (such as food
production). However, the inclusion of at least a small amount of energy from
peaking biogas turbines reduces system costs considerably. The amount of
bioenergy required is far less than the amount estimated conservatively to be
feasible under drought conditions (20 TWh pa) [2]. This means that enabling
biofuels and other technologies that can provide peaking capacity (such as
demand side participation) provides significant value. Alternatively, allowing
a small proportion of natural gas generation (in a peaking capacity only)
would bring down power system costs considerably, without adding
significant greenhouse emissions.
3. Minimise the “Non-Synchronous Penetration” limit – The “NSP” limit is the
maximum amount of “non-synchronous penetration” that can be managed
by the system in any dispatch interval. If the NSP is limited to 50%, for example,
then half of the energy generated in any period must come from synchronous
sources, such as CST, geothermal or (bio)gas turbines. If the NSP is increased
to 90%, then only 10% of energy in any period needs to come from
synchronous sources (and up to 90% can come from wind and PV). This is
found to reduce system costs considerably [4, 22, 29]. Research is required to
determine the appropriate level for this limit, and how to minimise it. This is a
specific aspect of wind and PV integration that needs to be explored.
4. Minimise uncertainty – Most renewable technologies (and transmission) are
very capital intensive, meaning they have high upfront costs to install, but low
operating costs. This means that the cost of capital (the rate at which they
can secure financing) is extremely important to overall costs. Financiers will
carefully consider the risk associated with a project, and provide lower
financing rates to those that are judged to have a more certain return. The
policy environment, and the nature of the policies implemented to support
renewable technologies play a significant role in this risk assessment. The
importance of this factor is illustrated in Figure 10, in the significantly higher
costs associated with a 10% discount rate, compared with a 5% discount
rate14. This might be associated with policies that create a riskier investment
environment for renewables.
Despite a wide range of alternative assumptions, wholesale costs for 100% renewable
portfolios from this study were found to be in the range of $65/MWh to $106/MWh (not
including transmission costs), maintaining a minimum of 15% synchronous generation
operating at all times.
3.2 Transmission requirements
UNSW’s modelling costed transmission augmentation in a relatively simplistic manner,
based upon average $/MW/km costs for transmission, and the distances and
maximum flows calculated between the five NEM regions, as illustrated in Figure 8 [2].
This provides a high level estimate of the cost of transmission, but is clearly limited by
the simplicity of the network modelled; further investment is likely to be required intra-
14 The discount rate is analogous to the Weighted Average Cost of Capital (WACC).

14
regionally. Transmission costs were calculated via this method to be in the range $8 -
$11/MWh (with a 5% discount rate)15.
Figure 8 – Transmission options in UNSW’s 2013 study. Source: [2]
AEMO’s 2013 study [1] included a more bespoke analysis of transmission requirements
to support their 100% renewable portfolios, as illustrated in Figure 9. This study includes
transmission upgrades within regions (as well as between regions), although it does
remain high level. As with the UNSW analysis, further investment is likely to be required
intra-regionally. AEMO’s analysis calculated transmission costs of $6 - $10/MWh.
15 Transmission costs were calculated to be $18-$19/MWh with a 10% discount rate [13], highlighting again
the importance of the cost of capital for high renewable scenarios requiring a significant capital
investment.

15
Figure 9 – Transmission options in AEMO’s 2013 study. Source: [1]
Both studies found that transmission costs are around 10% of the cost of the electricity
generation technologies themselves, as illustrated in Figure 10. This suggests that
transmission costs are important, but they are not the dominant contributor to total
costs for a 100% renewable electricity system.
These costings only include a high level representation of the major interconnections;
further investment is likely to be required intra-regionally. For comparison, current
transmission expenditure in the NEM is around $2.7b/year or around $14/MWh. Much
of this investment is “sunk”, so a proportion of the transmission investment required to
enable 100% renewable scenarios is likely to be additional to these costs. The total
system costs quoted above included all new transmission investment as additional to
sunk transmission investment.
3.3 Costs summary
Estimates from studies by BZE [5], UNSW [2, 4], University of Sydney [3] and AEMO [1] for
the cost of a 100% renewable power system in the NEM are calculated to be in the
range of $81 to around $200/MWh (including transmission costs)16. The various cost
estimates, with proportions attributed to transmission, are illustrated in Figure 10.
Achieving the costs at the low end of this range will require:
16 Costs may be slightly lower (around $75/MWh) if geothermal technologies advance significantly and
can be included in the portfolio, as projected by BREE [25].

16
- Installing very significant quantities of wind generation (supplying around 80%
of energy);
- Addressing wind integration technical challenges, such that the system can
operate with up to 85% of energy at any time coming from non-synchronous
sources;
- Production of around 6TWh of biogas fuel per annum;
- Cost reductions over time for the relevant technologies, as projected by BREE
(particularly for technologies such as CST).
If these conditions are not met, or other system limitations apply, then costs may be
more similar to estimates at the top of this range.
AEMO’s estimate of $121 - $139/MWh, including transmission, could be considered a
reasonable estimate in the middle of this range, suitable for most purposes.
Figure 10 – Projected costs of 100% renewables for the NEM. Sources: [1, 2, 3, 4, 5]
Note that an important limitations of these studies is that they all assume the entire
system is constructed at the technology costs applying in the relevant year of analysis
(2030). In reality, much of the generating capacity will be installed prior to 2030 (or the
relevant year), and will therefore be installed at a higher cost [1]. UNSW has estimated
that these additional “trajectory costs” are around 10-20% [30].
3.4 Putting the costs in context
Present costs
Historical average wholesale prices in the NEM have varied significantly from year to
year, and also from state to state. Since the commencement of the NEM, prices have

17
averaged around $44/MWh [31]. In the most recent three year period, average prices
have been somewhat higher due to the carbon price.
AEMO projects an increase in retail prices of 6-8c/kWh to support a 100% renewable
power system, based upon their modelled wholesale costs, transmission costs, and
compared with recent historical prices [1]. This provides a reasonable central
estimate. However, based upon the other modelling studies discussed, retail price
increases from long term average NEM prices could be as low as 4c/kWh, or as high
as 16c/kWh.
What does this mean for an average household?
Retail electricity prices vary state by state, but average around 29c/kWh in Australia
at present [6], or a total annual cost of $1,499 for an average household17 [6].
As outlined above, AEMO estimates that a move to 100% renewables would involve
an increase in the range of 6- 8c/kWh (including transmission). This is an increase of
between 20% and 30%, to an electricity rate of 35 - 37c/kWh. The impact on household
bills would be an increase of around $300 to $400 per year (20% to 30%).
Given that this is associated with moving to a 100% renewable power system, these
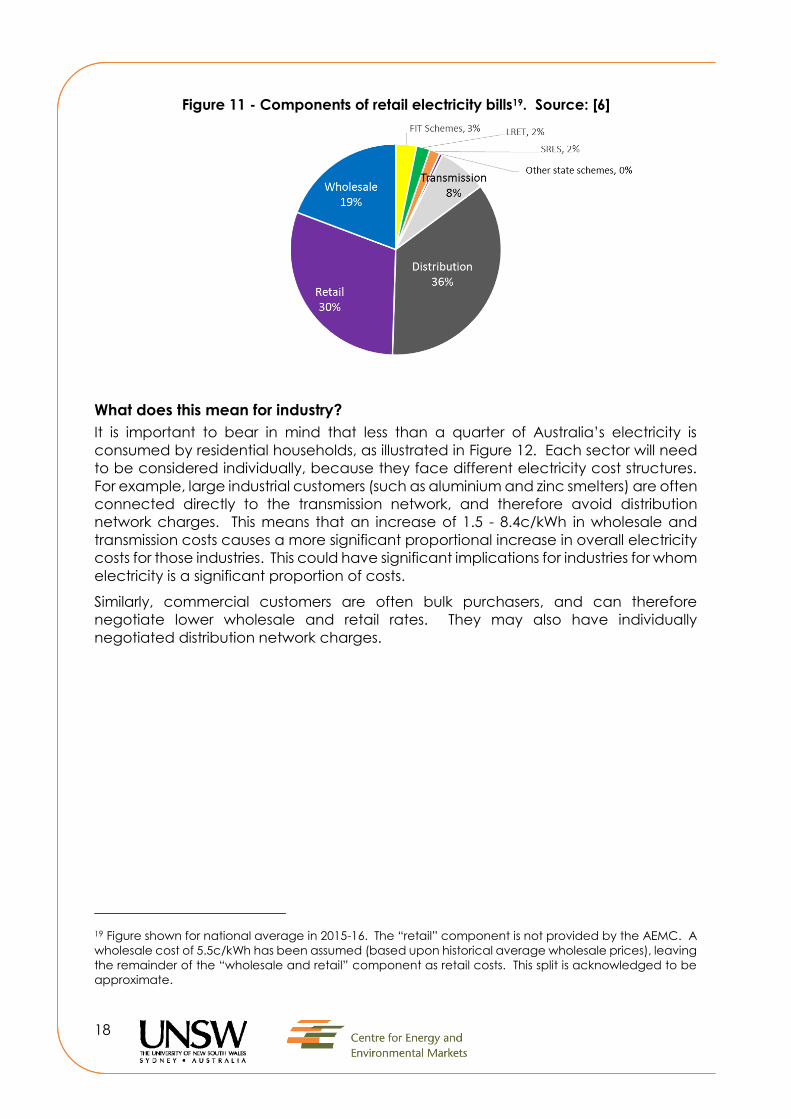
costs could be considered moderate. The moderate increase in cost is because only
around 20-30% of household electricity bills are related to the wholesale cost of
electricity, as illustrated in Figure 11. Around a third of the bill is related to the cost of
electricity distribution (the low voltage “poles and wires” that distribute electricity to
individual households). A further 10-30% of the bill is related to retailer’s costs and
margins. These components could be reasonably assumed to remain relatively
unchanged in a transition to 100% renewables18. Thus, it is only the wholesale cost
component (20-30% of the bill) that increases, along with a small increase in the
transmission component (included in the c/kWh increase estimates above). This is the
same reason that 100% Greenpower typically only costs 20-30% more than “black”
(non-renewable) electricity at present.
17 For 2015-16, based upon a national weighted average consumption level of 5,248 kWh per year.
18 This assumes that the 100% renewable power system remains relatively centralised, with no transition to
distributed energy. The costs for the distribution network in such a transition have not been analysed.
18
Figure 11 - Components of retail electricity bills19. Source: [6]
What does this mean for industry?
It is important to bear in mind that less than a quarter of Australia’s electricity is
consumed by residential households, as illustrated in Figure 12. Each sector will need
to be considered individually, because they face different electricity cost structures.
For example, large industrial customers (such as aluminium and zinc smelters) are often
connected directly to the transmission network, and therefore avoid distribution
network charges. This means that an increase of 1.5 - 8.4c/kWh in wholesale and
transmission costs causes a more significant proportional increase in overall electricity
costs for those industries. This could have significant implications for industries for whom
electricity is a significant proportion of costs.
Similarly, commercial customers are often bulk purchasers, and can therefore
negotiate lower wholesale and retail rates. They may also have individually
negotiated distribution network charges.
19 Figure shown for national average in 2015-16. The “retail” component is not provided by the AEMC. A
wholesale cost of 5.5c/kWh has been assumed (based upon historical average wholesale prices), leaving
the remainder of the “wholesale and retail” component as retail costs. This split is acknowledged to be
approximate.

19
Figure 12 - Australia's electricity consumption by sector (2012-13). Source: [8]
For these reasons, mechanisms such as the Renewable Energy Target have previously
included exemptions for certain types of industrial customers. This reduces the risk of
placing overly onerous costs on these industries (particularly where they are trade
exposed), potentially harming their international competitiveness. However, it is
important to realise that this increases the cost burden on residential customers, who
must make up the difference in order to achieve a total renewable percentage for
Australia. As the renewable target grows, it is likely to become increasingly difficult for
the residential sector to bear these costs alone; alternative mechanisms will be
required.
“Reference” scenarios
Even in the absence of policies to promote renewable energy, it is unlikely that the
electricity system in Australia will remain static. Therefore, a perhaps more appropriate
frame of reference is to compare the cost of a 100% renewable power system to the
costs for alternative “reference” scenarios in 2030, representing the other options for
how the power system might evolve. The choice of an appropriate reference scenario
is challenging. For example, “business as usual” might be interpreted as continuing
investment in coal and gas-fired plant. However, there is general consensus that new
investment in coal-fired plant in Australia is very unlikely, making this an unrealistic
reference case [32]. Ultimately, the choice of reference will depend upon the nature
of the insights sought.
However, there is general consensus that under most future scenarios, wholesale costs
are going to increase. For example, Figure 13 shows the projected wholesale costs in
a range of scenarios, modelled by the CSIRO. The range of costs for 100% renewable
portfolios is superimposed, showing that from 2030, these costs are very similar to those
of other forecast scenarios.

20
Figure 13 – Projected average wholesale electricity costs from the CSIRO. Source: [33]
3.5 Would 90% renewables be significantly cheaper?
It has been suggested that a 90% renewable system might be significantly less
expensive than a 100% renewable system, and therefore would make a more suitable
long-term target. As discussed above, UNSW’s modelled 100% renewable portfolios
include a significant capacity of biogas turbines that operate as peaking capacity.
UNSW’s model limits the use of biogas to 20TWh pa, which is 10% of the total annual
generation in the NEM. Therefore, a 90% renewable target would allow those biogas
turbines to operate on natural gas (instead of renewable sources).
To explore the implications of a lower renewable target level, CEEM modelled the
incremental increase in the renewable energy target, as illustrated in Figure 14. This
figure demonstrates that total system costs escalate approximately linearly as the
proportion of renewable energy increases, until renewables generate around 80% of
annual energy. At renewable energy levels below 80%, the model prefers to use only
wind and PV to meet the renewable energy target, and doesn’t find it necessary to
include any of the firm and synchronous renewable generation types.
To move beyond 80% renewables, the model finds it is lower cost to include some of
the more expensive firm renewables (biogas turbines and CST). This means that costs
escalate non-linearly beyond 80% renewables. However, the escalation remains
minimal; CST and biogas turbines provide cost effective firm and synchronous
Range of costs for
100% renewables

21
capacity, allowing the model to achieve 100% renewables with only minor cost
escalation to the average cost per megawatt hour.
This modelling suggests that if the aim is to get the greatest “bang for buck”, the most
appropriate renewable target might be around 80% renewables (or around the level
when synchronous renewables start to become required). However, this modelling
suggests that a 100% renewable power system is possible at only a moderate cost
escalation beyond that level, and is technically and economically achievable.
Figure 14 – Generation mix and escalation in power system cost as the renewable
proportion grows20. Source: [34]
3.6 Mitigating cost risk
Moving to a 100% renewable system also has advantages in mitigating the cost risk or
uncertainty in cost associated with fossil fuel systems. Fossil fuel generation is exposed
to a number of factors that create uncertainty over future generation costs, such as
uncertainty around future gas prices, and uncertainty over future carbon prices (or
equivalent incentives to rapidly reduce greenhouse emissions). The uncertainty over
future costs needs to be taken into account when considering future generation
portfolio options, in addition to the central estimate of cost.
CEEM modelled a range of portfolios, from 15% renewables to 85% renewables,
looking at the uncertainty in future generation costs. The results are shown in Figure
15, illustrating the probability distributions of cost for each portfolio. The higher
renewable proportions have significantly narrower distributions, meaning that
renewables can effectively mitigate the cost risk associated with gas and carbon
price uncertainty in Australia. This result was found to be robust to a wide range of
assumptions around carbon pricing [35].
20 Modelling for 2030, with $9/GJ gas price, and no carbon price. Transmission costs are not included.

22
Figure 15 – Probability distributions for wholesale generation costs. Source: [35]
When these cost risks are explicitly taken into account, UNSW’s modelling suggests that
the lowest cost trajectory involves a target of around 60% renewables by 2030, and
80-100% renewables by 205021, as illustrated in Figure 16 [36, 35]. Increasing the 2030
renewable proportion to 75% only very slightly increases the expected cost (by
$0.2/MWh), but significantly decreases the standard deviation of cost (representing
the cost risk) [35].
Figure 16 – Least cost portfolios for the NEM, accounting for cost risk22. Source: [36]
21 The model used for this analysis wasn’t capable of exploring scenarios with higher than 80% renewables,
to calculate their cost and cost risk.
22 Figure shows GHG emissions trajectories for the Australian NEM in the proportions of national targets
recommended for Australia by the Climate Change Authority, with lowest cost portfolios that meet the
targets in 2030 and 2050. Percentages indicate the % of energy supplied by each technology.
23
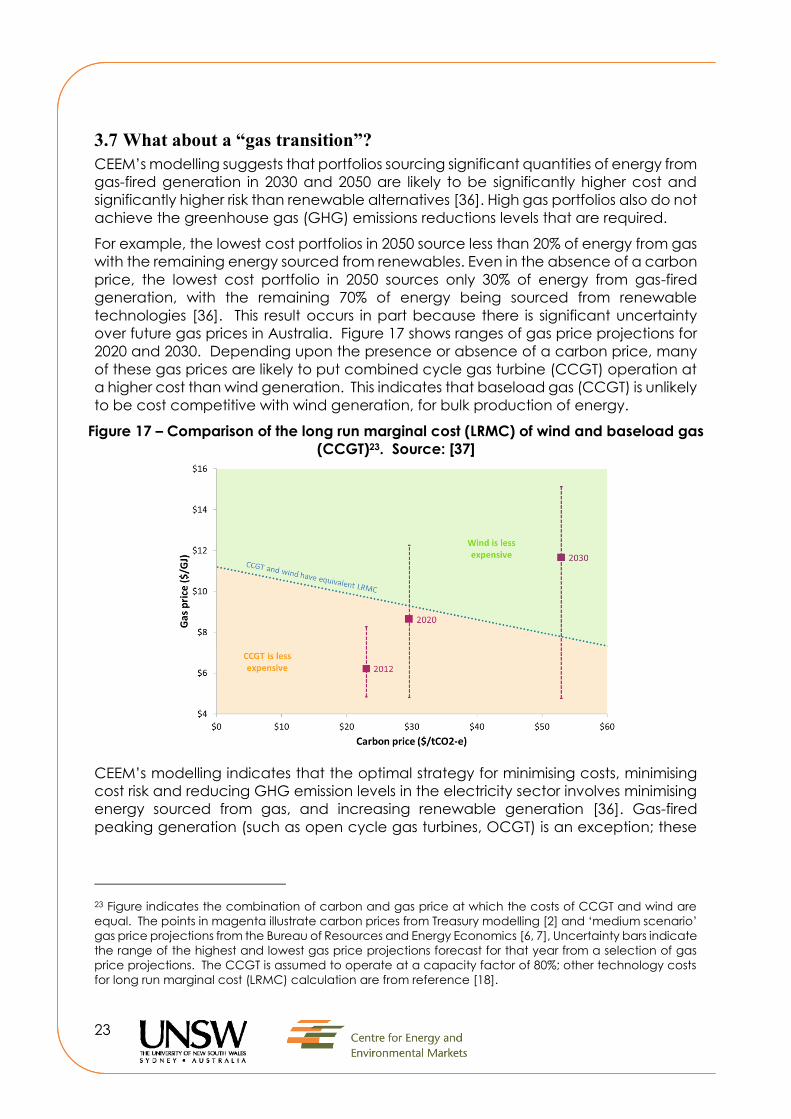
3.7 What about a “gas transition”?
CEEM’s modelling suggests that portfolios sourcing significant quantities of energy from
gas-fired generation in 2030 and 2050 are likely to be significantly higher cost and
significantly higher risk than renewable alternatives [36]. High gas portfolios also do not
achieve the greenhouse gas (GHG) emissions reductions levels that are required.
For example, the lowest cost portfolios in 2050 source less than 20% of energy from gas
with the remaining energy sourced from renewables. Even in the absence of a carbon
price, the lowest cost portfolio in 2050 sources only 30% of energy from gas-fired
generation, with the remaining 70% of energy being sourced from renewable
technologies [36]. This result occurs in part because there is significant uncertainty
over future gas prices in Australia. Figure 17 shows ranges of gas price projections for
2020 and 2030. Depending upon the presence or absence of a carbon price, many
of these gas prices are likely to put combined cycle gas turbine (CCGT) operation at
a higher cost than wind generation. This indicates that baseload gas (CCGT) is unlikely
to be cost competitive with wind generation, for bulk production of energy.
Figure 17 – Comparison of the long run marginal cost (LRMC) of wind and baseload gas
(CCGT)23. Source: [37]
CEEM’s modelling indicates that the optimal strategy for minimising costs, minimising
cost risk and reducing GHG emission levels in the electricity sector involves minimising
energy sourced from gas, and increasing renewable generation [36]. Gas-fired
peaking generation (such as open cycle gas turbines, OCGT) is an exception; these
23 Figure indicates the combination of carbon and gas price at which the costs of CCGT and wind are
equal. The points in magenta illustrate carbon prices from Treasury modelling [2] and ‘medium scenario’
gas price projections from the Bureau of Resources and Energy Economics [6, 7], Uncertainty bars indicate
the range of the highest and lowest gas price projections forecast for that year from a selection of gas
price projections. The CCGT is assumed to operate at a capacity factor of 80%; other technology costs
for long run marginal cost (LRMC) calculation are from reference [18].

24
technologies provide valuable peaking capacity at minimal cost, and due to their
rare operation do not contribute significant greenhouse gases.
3.8 What about nuclear?
Nuclear generation is an important low carbon technology. Asia, in particular, has
significant nuclear build programs under way at present, and is achieving competitive
nuclear plant costs. CEEM conducted a comprehensive international literature review
to determine the likely costs of establishing nuclear power in Australia, as an
alternative approach to reduce greenhouse gas emissions.
Cost estimates for nuclear generation were found to be in the range $122 to
$138/MWh, which is competitive with some forms of renewable generation. However,
these estimates fail to take into account the very long construction durations for
nuclear generation, and the cost escalation that is consistently observed over that
duration. As illustrated in Figure 18, historical cost escalation observed in both France
and the USA during their nuclear build programs was significant, averaging 3.6% pa in
France, and 8.1% pa in the USA. CEEM’s review revealed that if these levels of cost
escalation are properly taken into account, nuclear generation becomes prohibitively
expensive [38]. Projected capital cost values including escalation are illustrated in
Figure 18, and the corresponding levelised cost values in Figure 19. If historically
observed levels of pre-construction and construction cost escalation are included,
nuclear technology has average costs in the realm of $345 to $428/MWh, far more
expensive than many renewable technologies [38].
Figure 18 – Nuclear plant overnight capital costs (OCC)24, comparing historical values
with projections for Australia. Source: [38]
24 Projected values in 2015 are central estimates without escalation, values in 2020 are with pre-
construction escalation only, and values in 2029 and 2030 are with pre-construction and construction

25
Figure 19 – Nuclear levelised cost projections25. Source: [38]
3.9 What about CCS?
Carbon Capture and Storage (CCS) is also likely to be prohibitively expensive, when
compared to renewable alternatives. There remains significant uncertainty over the
capital cost of coal-fired plant with CCS, and around the storage costs ($/tonne of
CO2 stored). Figure 20 shows the total electricity system cost calculated for a range
of possible CCS costs, compared with the cost of a 100% renewable power system
(RE100). This modelling shows that only under a few, and seemingly unlikely,
combinations of costs can any of the fossil fuel scenarios compete economically with
100% renewable electricity in a carbon constrained world.
escalation, or with construction escalation only as indicated. Values are shown based upon inclusion of
(lower cost) Asian plant in the cost assessment, or excluding Asian plant, as indicated.
25 Percentages illustrate the proportion of the levelised cost related to capital expenditure. Labels above
columns indicate the total Levelised Cost of Energy (LCOE).

26
Figure 20 – NEM annual cost, depending upon CCS capital costs and storage costs.
Source: [17]
4 Challenges on the path to 100% renewables
It is important to acknowledge that a 100% renewable electricity system will operate
very differently to the present system, so there are a wide range of changes that will
need to be implemented.
Technical challenges
As a part of their 2013 study on 100% renewables, AEMO conducted a high level
review of the “operational considerations” that will need to be addressed to operate
a 100% renewable system. They noted a number of technical challenges, including
[1]:
- Frequency control (managing variability and uncertainty) – Large wind and
PV ramps over periods of hours may require additional types of frequency
control “reserves” to ensure sufficient system flexibility over those timescales.
Also, increased regulation reserves are likely to be required to manage
increasing variability and uncertainty over timescales of minutes.
- Frequency control (inertia) – Synchronous generators (such as coal and gas-
fired plant) automatically provide inertial response to the power system, which
helps to keep the frequency stable on timescales of seconds. Wind and PV
are non-synchronous, and therefore don’t naturally provide inertia. This
means that frequency control on these very short timescales will need to be
managed differently, either by maintaining a minimum amount of
27
synchronous generation operating (such as biogas turbines, CST, or hydro), by
installing synchronous condensers, or via other innovative methods.
- Grid code performance standards – The grid code performance standards
define the behaviour of generators, particularly with regards to their ability to
“ride through” faults. Generators must meet these standards in order to
connect to the system. These standards are likely to need to be revised to
better suit the properties of renewable generators in order to operate a
secure 100% renewable system.
- Fault level in-feed – In the present system, when a fault occurs there is a much
higher current flow than usual, allowing protection systems to detect and
isolate the fault. This current flow doesn’t occur with a system predominantly
composed of non-synchronous generators (such as wind and PV). To address
this, it may be necessary to keep a certain minimum quantity of synchronous
generation operating in each region, or there may be other innovative
solutions (such as the re-design of protection systems).
- Reliability assessments – AEMO conducts ongoing assessments of the ability of
the system to meet anticipated demand over short, medium and long
timeframes. The appropriate valuation of variable resources in these
assessments will need to be determined, and it may be necessary to entirely
re-design the assessment methodology over some timeframes.
Note that many of these technical challenges relate to the fact that wind and PV are
non-synchronous, and are not related at all to their variable and uncertain availability.
Market design
In many ways, the NEM has an excellent market design for integration of renewable
technologies [39, 40]. For example:
- The NEM is large – The NEM is fully integrated with generator dispatch co-
optimised across the whole grid. This allows the variability in wind and PV to
be smoothed across a vast land area very efficiently, minimising the need for
expensive reserves for “balancing” in each region.
- The NEM is fast – The NEM dispatch is fully re-calculated every five minutes.
This allows the uncertainties in wind and PV forecasts to be corrected often,
ensuring they remain small and inexpensive to manage.
- Sophisticated frequency control markets – The NEM has very sophisticated
frequency control markets, which manage variability, and are therefore going
to become increasingly important as levels of wind and PV grow [41]. This
makes frequency control very inexpensive in the NEM compared to other
jurisdictions.
- Strong price signals – The NEM has very strong spot market price signals,
allowing prices to range from -$1,000/MWh to $13,800/MWh [42]. This creates
strong incentives for all generators to react quickly to changes in the market,
including incentives to stop generating (if possible) when there is oversupply.
- Renewables treated (mostly) like any other generator – Renewables in the
NEM are dispatched and managed very similarly to other generation types,
meaning that the transition from a fringe technology to a fully participating

28
and important contributor doesn’t require dramatic market changes.
Renewables are already expected to respond to price signals, network
constraints and market directions, pay for market services, and allowed to
participate in ancillary services markets (providing grid services) as long as
they can demonstrate the appropriate technical capability.
- Energy-only market – The NEM has an “energy-only” market design, which
means that market participants are financially rewarded only for the energy
(MWh) they provide. Many other jurisdictions have implemented a “capacity
market” or some other form of Capacity Remuneration Mechanism [43, 44,
45], which provides additional compensation for the provision of firm capacity
(MW) to the market. Debate continues as to the merits and disadvantages of
each market framework. However, CEEM’s research suggests that energy-
only market models avoid many renewable integration challenges (such as
questions on how to value the “firm capacity” contribution of variable
renewables), and may be able to function effectively in a 100% renewable
system [46, 47, 22].
The sophisticated design of the NEM gives Australia a significant head start on other
jurisdictions, which will require much more substantial market changes to allow
efficient integration of renewables. Many challenges do, of course, remain. Changes
will be required to many market design aspects, including:
- Transmission investment frameworks – The regulatory frameworks utilised at
present to determine where and when new transmission network is installed
are likely to be inadequate, particularly for facilitating the construction of
large new scale-efficient links to connect new renewable generation centres.
Entirely new frameworks are likely to be required. The significant “Transmission
Frameworks Review” conducted from 2010 to 2013 recommended an
“Optional Firm Access” model, which would have helped to address some of
the issues, but also proposed grandfathering of the existing network during the
transition [48, 49]. This model was explored further over the period 2013 to
2015, and was eventually rejected. This is a challenging problem, with few to
no good solutions identified internationally thus far [50].
- Demand-side participation – The present NEM design has many barriers to
demand side participation. Addressing these barriers will enable more
efficient and cost effective high renewable scenarios [46].
- Distribution network investment frameworks – Distribution networks are the
most expensive part of residential consumer electricity bills, and the present
investment frameworks are not well suited to a rapidly changing energy
market landscape. Significant changes to these investment frameworks are
likely to be required to efficiently integrate distributed resources, such as
electric vehicles, home battery storage, and distributed energy such as
photovoltaics.
These aspects can be addressed progressively as we move towards a higher
renewable system.
Closing coal-fired generation
One of the biggest economic challenges could be the orderly closure of coal-fired
generation. These plants have very low operating costs, and could be kept in service
well past their original design lifetime. It appears likely that some form of mechanism

29
to facilitate efficient and timely plant closures is an important part of a policy
framework for transitioning to a 100% renewable system. An auction-based market
mechanism has been proposed by researchers at ANU, and appears to have some
promising characteristics [51]. Whatever mechanism is implemented, it will be
important to avoid exacerbating barriers to exit by creating the perception that
attractive payments for closure could await those who remain in the market [52].
5 Conclusions and next steps
The available research, by UNSW and others (including the Australian Energy Market
Operator) now shows that 100% renewable electricity portfolios are likely to be feasible
for Australia. The technical challenges can be managed, and the costs are likely to
be competitive with other kinds of portfolios that may be operating in 2030.
A 100% renewable power system will be very different to the one we operate at
present in Australia, and the transition will be significant. However, no convincing
reason why 100% renewables is not feasible for Australia has been identified.
Given the technical feasibility and attractive economics for a 100% renewable NEM,
questions around next steps arise. Given Australia’s pressing clean energy challenges,
there are excellent reasons to set higher and more ambitious renewable generation
targets than those established at present. While there are significant opportunities to
reduce the costs of renewable options through judicious R&D and demonstration,
major deployment has proven a key driver of reducing cost and improved expertise.
As renewable penetrations climb, we should not underestimate the challenges in
effectively and efficiently integrating them into the NEM. Current NEM arrangements
have proven remarkably resilient to regionally significant wind and PV penetrations to
date (by comparison with some other electricity industries around the world).
However, a 100% renewable NEM will inevitably operate very differently to the present,
and significant resources will be required for all electricity industry stakeholders to
understand, drive and adapt to these changes. Such profound electricity industry
transition will also require societal consensus on the importance of addressing our
clean energy challenges and renewable energy’s role in addressing them. Beyond
these challenges lie the opportunity for Australian leadership and innovation in
creating a clean energy future for Australia and others around the world.
6 Acknowledgements
This work is supported in part by funding from the CSIRO Future Grid project, and
ARENA.
7 Acronyms
AEMC Australian Energy Market Commission
AEMO Australian Energy Market Operator

30
BREE Bureau of Resources and Energy Economics (Australian Government)
BZE Beyond Zero Emissions
CCGT Combined Cycle Gas Turbine
CCS Carbon Capture and Storage
CEEM Centre for Energy and Environmental Markets
CO2 Carbon Dioxide
CST Concentrating Solar Thermal
EGS Enhanced Geothermal System (a type of geothermal technology)
GHG Greenhouse Gas
GT Gas Turbine
GW Gigawatt (a measure of capacity)
HSA Hot Sedimentary Aquifer (a type of geothermal technology)
LCOE Levelised Cost of Energy (a measure of the cost of producing energy from
a particular technology, taking into account the proportion of time over
which it operates).
MWh Megawatt hour (a measure of energy)
NEM National Electricity Market
NSP Non-synchronous Penetration (a limit on the amount of non-synchronous
generation, such as wind and PV, that can be operating at any time)
O&M Operations and Maintenance
OCC Overnight Cost of Capital (the capital cost of building a plant, if it could
be entirely constructed overnight, without any need for financing over the
construction duration).
OCGT Open Cycle Gas Turbine
PSH Pumped Storage Hydro
PV Photovoltaics
RE Renewable Energy
SWIS South-West Interconnected System
TWh Terrawatt hour (a measure of energy)
UNSW University of New South Wales
WACC Weighted Average Cost of Capital
8 References
[1] AEMO, “100 per cent renewables study - modelling outcomes,” Australian Energy
Market Operator, Melbourne, 2013.

31
[2] B. Elliston, I. MacGill and M. Diesendorf, “Least cost 100% renewable electricity
scenarios in the Australian National Electricity Market,” Energy Policy, vol. 59, pp.
270-282, 2013.
[3] M. Lenzen, B. McBain, T. Trainer, S. Jutte, O. Rey-Lescure and J. Huang, “Simulating
low-carbon electricity supply for Australia,” University of Sydney, Sydney, 2016.
[4] J. Riesz and B. Elliston, “Research priorities for renewable technologies -
Quantifying the importance of various renewable technologies for low cost
renewable electricity systems,” Centre for Energy and Environmental Markets,
University of New South Wales, Sydney, 2016.
[5] M. Wright and P. Hearps, “Australian Sustainable Energy - Zero Carbon Australia
Stationary Energy Plan,” Beyond Zero Emissions, Melbourne, 2010.
[6] AEMC, “Final Report: 2015 Residential Electricity Price Trends,” Australian Energy
Market Commission, Sydney, 2015.
[7] Department of Industry, Innovation and Science, “Australian Energy Statistics
Update,” Office of the Chief Economist, Australian Government, Canberra, 2015.
[8] BREE, “Energy in Australia,” Bureau of Resources and Energy Economics,
Australian Government, Canberra, 2014.
[9] AEMO, “National Electricity Forecasting Report (NEFR) 2015,” Australian Energy
Market Operator, December 2015. [Online]. Available:
http://www.aemo.com.au/Electricity/Planning/Forecasting/National-Electricity-
Forecasting-Report.
[10] J. Riesz, E. Tourneboeuf, A. Rozali and C. Chambers, “Off-grid solar in the mining
sector - Can renewable energy reduce your operating costs?,” AECOM, Sydney,
2012.
[11] J. Riesz, “Wind isn't intermittent,” Climate Spectator, 1st May 2013. [Online].
Available: http://www.businessspectator.com.au/article/2013/5/1/wind-
power/wind-isn%E2%80%99t-intermittent.
[12] J. Riesz, “100% Renewables for Australia? Challenges and Opportunities,” in Solar
Supercharge, Brisbane, 2016.
[13] AEMO, “Current Registration and Exemption lists,” Australian Energy Market
Operator, 10 February 2016. [Online]. Available:
http://www.aemo.com.au/About-the-Industry/Registration/Current-
Registration-and-Exemption-lists.
[14] J. Riesz and J. Gilmore, “Does wind need "back-up" capacity - Modelling the
system integration costs of "back-up" capacity for variable generation,” in
International Energy Workshop, Beijing, China, 2014.
[15] J. Riesz, “Junking the garbage baseload argument,” 8th April 2013. [Online].
Available: http://www.businessspectator.com.au/article/2013/4/8/renewable-
energy/junking-garbage-baseload-argument.

32
[16] B. Elliston, M. Diesendorf and I. MacGill, “Simulations of scenarios with 100%
renewable electricity in the Australian National Electricity Market,” Energy Policy,
vol. 45, pp. 606-613, 2012.
[17] B. Elliston, I. MacGill and M. Diesendorf, “Comparing least cost scenarios for 100%
renewable electricity with low emission fossil fuel scenarios in the Australian
National Electricity Market,” Renewable Energy, vol. 66, pp. 196-204, 2014.
[18] J. Gilmore, B. Vanderwaal, I. Rose and J. Riesz, “Integration of solar generation
into electricity markets: An Australian National Electricity Market case study,” IET
Renewable Power Generation, vol. 9, no. 1, pp. 46-56, 2015.
[19] P. Vithayasrichareon, J. Riesz and I. MacGill, “Impact of variable renewable
generation on future market prices and generator revenues,” in IEEE Power and
Energy Society (PES) Asia-Pacific Power and Energy Engineering Conference
(APEEC), Brisbane, 2015.
[20] P. Vithayasrichareon, J. Riesz and I. MacGill, “Market pricing and revenue
outcomes in an electricity market with high renewables - An Australian case
study,” in IAEE International Conference, Antalya, Turkey, 2015.
[21] B. Elliston and J. Riesz, “Future high renewable electricity scenarios - Insights from
mapping the diversity of near least cost portfolios,” in IEEE Power and Energy
Society (PES) Asia-Pacific Power and Energy Conference (APPEEC), Brisbane,
2015.
[22] P. Vithayasrichareon, J. Riesz and I. MacGill, “Electricity Market Operation with
High Levels of Variable Renewable Generation,” To be submitted, 2016.
[23] J. Riesz and J. Gilmore, “Rethinking business models for network service providers
- Shadow pricing against storage,” in IEEE Power and Energy Society (PES) Asia-
Pacific Power and Energy Engineering Conference (APPEEC), Brisbane, 2015.
[24] J. Riesz, M. Hindsberger, J. Gilmore and C. Riedy, “Perfect storm or perfect
opportunity? Future scenarios of the electricity sector and their implications for
utilities,” in The Rise of Decentralized Energy - What is at stake for the electricity
supply industry?, Edited by Fereidoon P. Sioshansi, 2014.
[25] BREE, “Australian Energy Technology Assessment,” Australian Government,
Bureau of Resources and Energy Economics, 2012a. [Online]. Available:
http://bree.gov.au/documents/publications/Australian_Energy_Technology_Ass
essment.pdf.
[26] E. Burke-Kennedy, “Over 23% of electricity demand now supplied through wind,”
The Irish Times, 29 December 2015. [Online]. Available:
http://www.irishtimes.com/business/energy-and-resources/over-23-of-
electricity-demand-now-supplied-through-wind-1.2479486.
[27] AEMO, “South Australian Wind Study Report - South Australian Advisory
Functions,” Australian Energy Market Operator, Melbourne, 2015.
[28] BREE, “Australian Energy Technology Assessment 2013 Model Update,” Australian
Government, Bureau of Resources and Energy Economics, Canberra, 2013.

33
[29] P. Vithayasrichareon, T. Lozanov, J. Riesz and I. MacGill, “Impact of operational
constraints on generation portfolio planning with renewables,” in IEEE Power and
Energy Society General Meeting, Denver, CO, 2015.
[30] J. Riesz, B. Elliston, I. MacGill and M. Diesendorf, “Submission on 100 percent
Renewables Study - Draft Modelling Outcomes Report - Submission to AEMO and
Department of Industry, Innovation, Climate Change, Science, Research and
Tertiary Education (DIISRTE),” Centre for Energy and Environmental Markets,
University of New South Wales, Sydney, 2013.
[31] AER, “Wholesale Statistics,” Australian Energy Regulator, 26 February 2016.
[Online]. Available: https://www.aer.gov.au/wholesale-markets/wholesale-
statistics.
[32] Bloomberg New Energy Finance, “Renewable energy now cheaper than new
fossil fuels in Australia,” 7 February 2013. [Online]. Available:
http://about.bnef.com/press-releases/renewable-energy-now-cheaper-than-
new-fossil-fuels-in-australia/.
[33] CSIRO, “Change and Choice - The Future Grid Forum's analysis of Australia's
potential electricity pathways to 2050,” CSIRO, Newcastle, 2013.
[34] B. Elliston, J. Riesz and I. MacGill, “What cost for more renewables? The
incremental cost of renewable generation - An Australian National Electricity
Market case study,” Submitted to Renewable Energy, 2016.
[35] P. Vithayasrichareon, J. Riesz and I. MacGill, “Using renewables to hedge against
future electricity industry uncertainties - An Australian case study,” Energy Policy,
vol. 76, pp. 43-56, 2015.
[36] J. Riesz, P. Vithayasrichareon and I. MacGill, “Assessing "Gas Transition" pathways
to low carbon electricity - An Australian case study,” Applied Energy, vol. 154,
pp. 794-804, 2015.
[37] J. Riesz and E. Tourneboeuf, “Delivering energy price security in an age of
uncertainty,” AECOM, Sydney, 2012.
[38] J. Riesz, C. Sotiriadis, P. Vithayasrichareon and J. Gilmore, “Quantifying key
uncertainties in the costs of nuclear power,” Energy Policy (submitted), 2016.
[39] J. Riesz and M. Milligan, “Designing electricity markets for a high penetration of
variable renewables,” Wiley Interdisciplinary Reviews: Energy and Environment,
vol. 4, no. 3, pp. 279-289, 2014.
[40] A. Henriot, O. Lavoine, F. Regairaz, C. Hiroux-Marcy, J. Gilmore, J. Riesz, C. Yuen,
D. O. d. Brasil, M. P. B. Salvador, H. Ziegler, L. Imaz, J. Fernández, J. Revuelta and
M. Li, “Market design for large-scale integration of intermittent renewable energy
sources,” CIGRE Technical Brochure WG C5-11, Paris, 2013.
[41] J. Riesz, J. Gilmore and I. MacGill, “Frequency control Ancillary Service Market
Design - Insights from the Australian National Electricity Market,” The Electricity
Journal, vol. 28, no. 3, pp. 86-99, 2015.

34
[42] AEMC, “Schedule of reliability settings,” Australian Energy Market Commission,
Sydney, 2015.
[43] J. Riesz, G. Thorpe, R. Betz and J. Cludius, “A framework for designing and
categorising Capacity Markets - Insights from an Application to Europe,” in 38th
IAEE International Conference, Antalya, Turkey, 2015.
[44] H. Hoeschle, G. Doorman, J. Barquin, L. Barroso, C. Batlle, A. Cruickshank, C.
Dervieux, J. Gilmore, J. Greenhalg, P. Mastropietro, A. Keech, M.Krupa, J. Riesz,
B. LaRose, S. Schwenen, G. Thorpe, L. d. Vries and J. Wright, “Capacity
Remuneration Mechanisms: Results from a world wide survey,” in CIGRE Paris
Session, Paris, 2016.
[45] R. Betz, J. Cludius and J. Riesz, “Capacity Remuneration Mechanisms: Overview,
Implementation in Selected European Jurisdictions and Implications for
Switzerland,” SCCER CREST Working Papers, Zurich, 2015.
[46] J. Riesz, J. Gilmore and I. MacGill, “Assessing the viability of Energy-Only Markets
with 100% Renewables - An Australian National Electricity Market Case Study,”
Economics of Energy and Environmental Policy, vol. 5, no. 1, pp. 105-130, 2016.
[47] J. Riesz, I. MacGill and J. Gilmore, “Examining the viability of energy-only markets
with high renewable penetrations,” in IEEE Power and Energy Society Meeting,
Washington DC, 2014.
[48] J. Riesz, J. Gilmore and I. MacGill, “Working paper on the proposed Optional Firm
Access model for the Australian National Electricity Market,” Centre for Energy
and Environmental Markets, Sydney, 2014.
[49] J. Riesz, J. Gilmore and I. MacGill, “Second Working Paper on the proposed
Optional Firm Access model for the Australian National Electricity Market,” Centre
for Energy and Environmental Markets, Sydney, 2014.
[50] F. Regairaz, M. Hesamzadeh, A. D. Caprio, A. Balkwill, F.-P. Hansen and J. Riesz,
“Market price signals and regulated frameworks for coordination of transmission
investments,” in CIGRE Symposium, Lund, Sweden, 2015.
[51] F. Jotzo and S. Mazouz, “Brown coal exit: a market mechanism for regulated
closure of highly emissions intensive power stations,” Centre for Climate
Economics and Policy, Crawford School of Public Policy, ANU College of Asia and
the Pacific, Canberra, 2015.
[52] J. Riesz, B. Noone and I. MacGill, “Payments for closure - Should Direct Action
include payments for closure of high emission coal-fired power plants?,” Centre
for Energy and Environmental Markets, University of New South Wales, Sydney,
2013.
[53] CO2CRC, “Australian Power Generation Technology Report,” Electric Power
Research Institute (EPRI), 2015.
[54] Australian Government, Treasury, “Strong Growth, Low Pollution - Modelling a
Carbon Price,” September 2011.

35
[55] ACIL Tasman, “Fuel price assessment for Bureau of Resources and Energy
Economics (BREE) Australian Energy Technology Assessment,” to be released 31
July 2012.
[56] Australian Government, Bureau of Resources and Energy Economics, “Gas
Market Report,” July 2012.
[57] Australian Energy Market Operator (AEMO), “National Transmission Network
Development Plan, Input Assumption Tables,” 2010.
[58] AEMO, “Renewable Energy Integration in South Australia - Joint AEMO and
ElectraNet study,” AEMO and ElectraNet, Melbourne, 2014.