1 Team Beta Project Advisor: Dr. James D. Lang, Project Sponsor: Dr. Leland M. Nicolai Laura Brandt...
88
1 Team Beta Team Beta Project Advisor: Dr. James D. Lang, Project Sponsor: Dr. Leland M. Nicolai Laura Brandt ~ Team Lead Melissa Doyle ~ Propulsion Luis Jimenez ~ Aerodynamics Nic Seid ~ Structures L O C K H E E D M A R T I N
-
date post
19-Dec-2015 -
Category
Documents
-
view
215 -
download
0
Transcript of 1 Team Beta Project Advisor: Dr. James D. Lang, Project Sponsor: Dr. Leland M. Nicolai Laura Brandt...

11
Team BetaTeam Beta
Project Advisor: Dr. James D. Lang,
Project Sponsor: Dr. Leland M. Nicolai
Laura Brandt ~ Team LeadMelissa Doyle ~ Propulsion
Luis Jimenez ~ AerodynamicsNic Seid ~ Structures
L O C K H E E D M A R T I N

22
OutlineOutline
Design ProcessDesign Process
RequirementsRequirements
Mission ProfileMission Profile
Initial ConceptsInitial Concepts
Aircraft ConfigurationAircraft Configuration
WeightWeight
AerodynamicsAerodynamics
PropulsionPropulsion
Stability Stability
Materials and StructuresMaterials and Structures
Cost AnalysisCost Analysis
Final CommentsFinal Comments

33
ScheduleScheduleMarch April May June
1 2 3 4 1 2 3 4 5 6 7 8 9 10 11
Requirements Defined
Schedule and Cost
Historical Research
Initial Weight Estimates
Aircraft Concepts
Initial Sizing
Initial Stability/ Control
Trade Studies
Graphical Modeling
Initial Layout (Location of Internal
Components)
Final Layout (CG Calculations)
Presentation
Initial ScheduleReal Schedule

44
Design ProcessDesign ProcessOutlined Requirements
Assumed Take off Weight
Initial Concepts Selected Concept
Assumed 2 planes for minimum LCC
Sized Fuselage around payload
Airfoil Design and Selection
Assumed W/S, AR, b, engine
Mission Profile
Calculated Component Weights and built up Empty Weight (Wempty),Sized Tail, Performance Calculations, and Aerodynamic Analysis
Fuel Fractions Calculate Empty Weight and compare to Wempty
Trade Studies
Number and Type of Engines
BCM and BCA
Best Patrol Altitude and Mach
Wing Span and Aspect Ratio
Calculate Fuel Required
Evaluate Design

55
RequirementsRequirementsMissionMission
• High Altitude, Long Endurance, Standoff ISR
• Unmanned/autonomous With Man-in-the-loop
• Continuous Coverage (24/7)
• Loiter/ISR Altitude: 50,000 – 65,000 Feet
• Operate From B-52/B-2 Bases
• Mission Radius = 3000 nm
• Low signature side sector
• 50 nm standoff racetrack flight path

66
RequirementsRequirementsSystemsSystems
• 360° Continuous Coverage With GMTI, AMTI and FOPEN
4 X Band Radar Antenna (4.5’x4.5’)
2 UHF Radar Antenna (4’x46’)
• Defensive Payload• On-board jammer (ULQ-21)
• Towed decoy (12 ALE-50 decoys)
• Flares (ALE-40 with 360 flares)
• Threat warning system (RF/EO/IR) part of sensor suite

77
ITEM WEIGHT POWER COOLING (lb) (watts) (watts)
EW/ULQ-21 117 3000 2525
Towed decoy/ ALE-50 193 470 -• 12 decoy unit plus installation • Deploy 2 per RF missile
Flares/ ALE-40 828 80 -
• 12 flare buckets with 360 flares plus installation
• Deploy 60 per IR missile
Total 1138 3550 2525(all air cooled)
Missile Warning System (MWS) and DIRCM part of EO/IR sensor suiteRadar Warning system (RWR) part of ELINT sensor system
RequirementsRequirementsDefensive Payload SystemsDefensive Payload Systems

88
ITEM WEIGHT POWER COOLING (lb) (watts) (watts)
X Band Radar 2227 63200• 4 antennas @ 4.5’x4.5’ 9500 (L)/
located in fuselage, broadside 44000 (A)/
UHF Radar 1900 67500• 2 antennas @ 4’x46’ 25300 (L)
located in fuselage, broadside
(includes FOPEN)
EO/IR 30 600 0
SIGINT 918 1200 1200 (L)
Shared Processor 150 770 770 (L)
Installation (10%) 523 - -
Total (All systems on) 5748 133270 80770
RequirementsRequirementsSensorSensor

99
ITEM WEIGHT POWER COOLING (lb) (watts) (watts)
Vehicle Management System 700 538• Autopilot 203 • Air Data System 45• Radar altimeter 14• Flight Termination System 38• IFF 78
Communications 3100 2125• VHF/UHF (Link 16 & SATCOM) 44• HF/Link 22 130• CDL/Ka SATCOM 18
Installation (15%) 86
Total 655 3800 2663(all air cooled)
RequirementsRequirementsFlight AvionicsFlight Avionics

1010
ITEM WEIGHT POWER COOLING
(lb) (watts) (watts)
Surface Control TBD 500 0
Instruments 137 50 0
Landing Gear TBD 550 0
ECS 414 140 140
Engine TBD• GCCU (engine generator) 2300 2300• Digital Fuel Control 450 0
Fuel System 865 400 0
Electrical System & Control 874 2000 2000• Secondary Power (battery controller) 350 350
Hydraulic 138 50 0
APU TBD TBD TBD
RequirementsRequirementsAirframe SystemAirframe System

1111
ITEM WEIGHT POWER COOLING (lb) (kW) (kW)
Defensive Payload Systems 1138 3.6 2.5
Sensors 5748 133.3 80.8
Flight Avionics 655 3.82.7
Miscellaneous Airframe Systems 2428* 6.8** 4.8**
Total 9969 147.4 90.7
*Control Surfaces, Engine, Landing Gear, and APU not included**APU not included
RequirementsRequirementsWeight/Power/Cooling TotalsWeight/Power/Cooling Totals

1212
Radar antennas:Radar antennas:
Radar electronics:Radar electronics:
EO/IR:EO/IR:
SIGINT:SIGINT:
Central HPPS processor for radar, EO/IR and SIGINT: 4 cubic feetCentral HPPS processor for radar, EO/IR and SIGINT: 4 cubic feet
Communications:Communications:
ALE-50 Towed RF decoy:ALE-50 Towed RF decoy:
ALE-40 chaff/flare dispenser: ALE-40 chaff/flare dispenser: 10.6”x8.5”x6.7” each dispenser carries 30 flares10.6”x8.5”x6.7” each dispenser carries 30 flares
ECM/ULQ-21: ECM/ULQ-21: 1671 cubic inches1671 cubic inches
RequirementsRequirementsSensor, Communications and ECM/Decoy Sensor, Communications and ECM/Decoy
Dimensions/VolumesDimensions/Volumes• X Band: 4 @ 4.5’x4.5’x1’X Band: 4 @ 4.5’x4.5’x1’• UHF: 2 @ 4’x46’x1’UHF: 2 @ 4’x46’x1’
• X Band: REX and front end processor 1240 cubic inchesX Band: REX and front end processor 1240 cubic inches• UHF: REX and front end processor 1720 cubic inchesUHF: REX and front end processor 1720 cubic inches
• Sensor apertures: 5 @ 3” diameter x 8” depthSensor apertures: 5 @ 3” diameter x 8” depth• Electronics: 420 cubic inchesElectronics: 420 cubic inches
• Antennas: 8 blade antennas 4’x1’x1.25” (retract when not in use)Antennas: 8 blade antennas 4’x1’x1.25” (retract when not in use)• Receivers: 808 cubic inchesReceivers: 808 cubic inches
• VHF/UHF (Link 16, voice, SATCOM): 12.5”x10”x7.5”VHF/UHF (Link 16, voice, SATCOM): 12.5”x10”x7.5”• Microwave (CDL/SATCOM): 15”x6”x5”Microwave (CDL/SATCOM): 15”x6”x5”• HF: RX/EX: 25”x25”x10”, PA: 20”x10”x10”, Coupler: 20”x6”x6”HF: RX/EX: 25”x25”x10”, PA: 20”x10”x10”, Coupler: 20”x6”x6”
• Electronics: one box @ 7.5”x5.7”x14”Electronics: one box @ 7.5”x5.7”x14”• Each decoy canister: 2.74”x2.74”x20.25”Each decoy canister: 2.74”x2.74”x20.25”

1313
Mission EnduranceMission EnduranceTime on Station (TOS)
2*(Transit Time) + Turnaround Time = 20 hours
Minimum Endurance Time
2*(Transit Time) + Time on Station = 36 hours
Turnaround Time = 4 hours Total Transit Time = 16 hours (Assumed based on U-2) (Calculated based on Mach .65 at 50,000 ft)
Transit TOS Turnaround
1st AircraftTOSEndurance
2nd Aircraft

1414
Patrick
Lakenheath
UAE
KadenaCyprus
Mission Theater Mission Theater
Minimum time on station = 20 hoursMinimum number of planes per station = 2 planesRequire 4 planes in reserve at Patrick, Lakenheath, UAE, and KadenaTotal number of planes = 14 planes

1515
Mission ProfileMission Profile
Takeoff
Climb to Altitude
Loiter 20 hr
Cruise Out
8 hrDescend to Sea Level
Sea Level Loiter for 30 min
3,000 NM
3,000 NM
Altitude
50,000 ft
Cruise Back8 hr
Distance

1616
Radar GeometryRadar Geometry
X Band Radar (4) : 4.5’ x 4.5’
UHF Radar (2) : 4’ x 46’
Field of Regard is +/- 70 degrees in the vertical and horizontal

1717
Radar GeometryRadar Geometry
Angle Antennas are to be placed: 1.85 degrees
Altitude
LOS
5 degrees
GA
Standoff Distance
Horizon
Altitude 50,000 ft (9.052Nm) LOS = 250 NmGrazing Angle = 5.2 degrees Standoff Distance = 100 Nm

1818
Initial ConceptsInitial ConceptsDesign ADesign A
UHF Antenna
UHF Antenna
MGMG
NGX-Band Antenna
Engine
Inlet

1919
Initial ConceptsInitial ConceptsDesign BDesign B
UHF Antenna
MG
Inlet
X-Band Antenna
Engine
InletX-Band Antenna
X-Band Antenn
a
UHF Antenn
a
X-Band Antenn
a
Engine

2020
Initial ConceptsInitial ConceptsDesign CDesign C
UHF Antenna
UHF Antenna
Avionics
Nozzle Engine Inlet
X-Band Antenna
LGLG

2121
Initial ConceptsInitial Concepts
Concept AConcept A Concept BConcept B Concept CConcept C
DragDrag
Mission Mission DurationDuration
Payload Payload PlacementPlacement
ControlControl
A modified version of Concept B was Selected
Exceed Compliance Satisfactory Compliance Short of Compliance

2222
Aircraft ConfigurationAircraft Configuration
TOGW = 50,900 lb
W/S = 60
Span = 184 ft
MAC = 4.89 ft
Wing Area = 850 ft^2
Aspect Ratio = 40
Wing Sweep = 0 deg
Airfoil: Custom Airfoil (Modified CAST 10-2/DOA 2 Transonic Airfoil)60% Laminar Flow
Engine: Two AE3007 Turbofan
Fuselage Length = 60 ft
Fuselage Height = 6 ft
Fuselage Mean Cross Section Area = 32.5 ft2
T/W = .32

2323
Aircraft ConfigurationAircraft Configuration

2424
Aircraft ConfigurationAircraft Configuration3-View Drawing3-View Drawing
184 ft.
60 ft.
6 ft.
6.6 ft.
2.83 ft.
14.7 ft.
5.9 ft.
3.5 ft.

2525
Aircraft ConfigurationAircraft ConfigurationInternal ComponentsInternal Components
APU
Avionics
X-Band
Rear Landing Gear
UHFAntenna
Front Landing Gear
X-Band Antenna
Inlet
AE-3007’s
FuselageFuel Cell
V-Tail
Bicycle Landing Gear
C.G.
Aerodynamic Center

2626
WeightWeight
Take-Off Weight
Empty Weight
Fuel Weight
Fuel Fraction
Fuel Volume
50,900 lb*
26,800 lb
24,100 lb
0.47
3,500 gal
*Takeoff weight is estimated to be within 500 lb of Actual Gross weight

2727
Weight FractionsWeight Fractions
1. Start up/Take-Off
2. Climb to Cruise Alt
3. Cruise Out
4. On Station
5. Cruise Back
6. Descend to Sea Level
7. Loiter 30 min
0.970
0.994
0.890
0.752
0.883
0.993
0.993
Best Cruise Altitude = 50,000 ftBest Cruise Mach = .65Best Loiter Altitude = 50,000 ft Best Loiter Mach = .62

2828
AerodynamicsAerodynamics
Aspect Ratio = 40
Span = 184 ft
Reference Area = 850 ft2
Taper Ratio = .4
MAC = 4.89 ft
Croot = 6.6 ft
Ctip = 2.83 ft
Wing Sweep = 0 deg
Airfoil: Custom Airfoil (Modified CAST 10-2/DOA 2 Transonic Airfoil)
60% Laminar Flow
t/c = .15
e = .63 *
K = 0.013
CLmax = 1.2
* Estimated ‘e’ using Wing Efficiency vs Aspect Ratio Graph provided by Lockheed Martin

2929
AerodynamicsAerodynamicsAt 50,000 ft and M=.62At 50,000 ft and M=.62
L/Dmax = 50.58 @ CL=.8
CLmax = 1.2
Zero Lift Drag = 0.008
Clalpha = 10.4 rad-1 = .18 deg-1 at Mach .62
Vstall = 479 ft/s (at half fuel weight)

3030
CLalpha v Mach
0.11
0.13
0.15
0.17
0.19
0.21
0.23
0.25
0.27
0.29
0.1 0.2 0.3 0.4 0.5 0.6 0.7 0.8
Mach
CL
alp
ha
(deg
^-1
)AerodynamicsAerodynamics

3131
Sears HaackSears Haack

3232
AerodynamicsAerodynamics50,000 ft at Mach .6250,000 ft at Mach .62
L/D versus CL
0
10
20
30
40
50
60
0 0.4 0.8 1.2 1.6 2 2.4
CL
L/D
Begin Loiter at CL = .8

3333
AerodynamicsAerodynamics50,000 ft at Mach .6550,000 ft at Mach .65
Drag PolarMach 0.55
0
0.2
0.4
0.6
0.8
1
1.2
1.4
1.6
1.8
0.000 0.010 0.020 0.030 0.040 0.050
CD
CL
L/Dmax = 50.58at CL of .8

3434
AerodynamicsAerodynamicsDrag Divergent Mach NumberDrag Divergent Mach Number
Mdd = Mdd(L=0)*LFdd – 0.05*ClMdd = Mdd(L=0)*LFdd – 0.05*ClMdd is higher than loiter and range mach numbers.Mdd is higher than loiter and range mach numbers.Mdd(L=0) was taken from Boeing chart for uncambered airfoils, which Mdd(L=0) was taken from Boeing chart for uncambered airfoils, which typically resulted in Mdd of about 0.08 mach above critical mach number.typically resulted in Mdd of about 0.08 mach above critical mach number.LFdd taken from plot intended to adjust Mdd to actual lift coefficient.LFdd taken from plot intended to adjust Mdd to actual lift coefficient.
Drag Divergent Mach
0.640.650.660.670.680.690.7
0.710.72
-4 -2 0 2 4 6 8 10
AOA
Md
d
(deg)

3535
AerodynamicsAerodynamics
60% laminar flow airfoil was desired 60% laminar flow airfoil was desired
Computer programs such as Profili and Computer programs such as Profili and XFOIL were used in order to simulate XFOIL were used in order to simulate fluid flow across different airfoils.fluid flow across different airfoils.
Laminar separation points and Pressure Laminar separation points and Pressure coefficients were obtained using coefficients were obtained using various lift coefficients.various lift coefficients.

3636
XFOIL was used to determine the Separation BubbleXFOIL was used to determine the Separation Bubble
Profili and Excel were used to modify different Profili and Excel were used to modify different characteristics of airfoils such as camber, leading characteristics of airfoils such as camber, leading edge radius, and percent thickness.edge radius, and percent thickness.
A trade study involving how thickness affects the range A trade study involving how thickness affects the range of laminar flow along the airfoil, was done through of laminar flow along the airfoil, was done through viscous operations on XFOILviscous operations on XFOIL
AerodynamicsAerodynamics

3737
Final AirfoilFinal AirfoilModified CAST 10-2/DOA transonic airfoil Modified CAST 10-2/DOA transonic airfoil
SpecificationsSpecificationsMax. Thickness 14.98%Max. Thickness 14.98%
Max. Thickness at 45.6% of ChordMax. Thickness at 45.6% of ChordMax. Camber 1.90%Max. Camber 1.90%
Max. Camber at 69.5% of ChordMax. Camber at 69.5% of ChordLaminar Separation at 60.34% of chordLaminar Separation at 60.34% of chord
AerodynamicsAerodynamics

3838Graph using a Lift Coefficient of 0.8Graph using a Lift Coefficient of 0.8
Velocity Profile for modified CAST 10-2/DOA 2 transonic airfoil
0
0.2
0.4
0.6
0.8
1
1.2
1.4
1.6
0 0.2 0.4 0.6 0.8 1 1.2
X (%)
U/U
inf.
AerodynamicsAerodynamics

3939
AerodynamicsAerodynamicsKarman-Millikan MethodKarman-Millikan Method
Alternate method of determining laminar separation.Alternate method of determining laminar separation.
Relates pressure coefficients from XFOIL to velocity Relates pressure coefficients from XFOIL to velocity profiles.profiles.
CCpp = 1 – (U/U = 1 – (U/Uoo))22
Iteration of velocity gradient with pressure Iteration of velocity gradient with pressure coefficients resulted in separation point using plot coefficients resulted in separation point using plot of Uof Uss/U/Uoo versus F. versus F.

4040
Used to verify laminar separation through velocity Used to verify laminar separation through velocity profile.profile.
U/UU/Uo o = 1 for 0 < x/x= 1 for 0 < x/xe e < 1< 1
U/UU/Uo o = 1 + F * ((x-x = 1 + F * ((x-xee)/x)/xee) for 1< x/x) for 1< x/xee
x = distance along surface from leading edge.x = distance along surface from leading edge.
xxee = length from leading edge to center of pressure. = length from leading edge to center of pressure.
U = velocity outside boundary layer.U = velocity outside boundary layer.
UUoo = maximum velocity. = maximum velocity.
F = velocity gradient.F = velocity gradient.
AerodynamicsAerodynamicsKarman-Millikan MethodKarman-Millikan Method

4141
UUss = velocity at laminar separation point. = velocity at laminar separation point.
Laminar Separation
y = -6.2868x3 - 4.2885x2 - 1.0802x + 0.8998
0.88
0.9
0.92
0.94
0.96
0.98
1
-0.3-0.25-0.2-0.15-0.1-0.050
Velocity Gradient F
Ve
loc
ity
Ra
tio
Us
/Uo
AerodynamicsAerodynamicsKarman-Millikan MethodKarman-Millikan Method

4242
Trade study involving same airfoil and camber as a Trade study involving same airfoil and camber as a control basis, then thickness as a variation.control basis, then thickness as a variation.
Percent thickness versus laminar flow was plotted Percent thickness versus laminar flow was plotted to depict a trend or tendency.to depict a trend or tendency.
Plot shows ideal thickness of about 15% in order to Plot shows ideal thickness of about 15% in order to achieve a relative maximum laminar flow of achieve a relative maximum laminar flow of about 60% (for CAST 10-2/DOA 2 transonic about 60% (for CAST 10-2/DOA 2 transonic airfoil).airfoil).
AerodynamicsAerodynamicsThickness to Chord VariationThickness to Chord Variation

4343
AerodynamicsAerodynamics
Airfoil thickness trade studyAirfoil thickness trade study
t/c selected was .15t/c selected was .15
CAST 10-2/DOA 2 transonic airfoil (cl 0.80)
0
10
20
30
40
50
60
70
13 14 15 16 17 18 19
% Thickness
% C
ho
rd L
eng
th o
f L
amin
ar F
low

4444
AerodynamicsAerodynamicsCp DistributionCp Distribution

4545
AerodynamicsAerodynamicsCdo at half fuel weightCdo at half fuel weight
Cdo v Mach
0.0090
0.0095
0.0100
0.0105
0.0110
0.0115
0.0120
0.0125
0.4 0.45 0.5 0.55 0.6 0.65 0.7 0.75 0.8
Mach
Cd
o
50,000 ft 55,000 ft 60,000 ft 65,000 ft

4646
AerodynamicsAerodynamicsfor Sfor Srefref = 850 ft = 850 ft22
Aircrafts wing span is 184 ft with an aspect ratio of 40

4747
Cruise for different Altitudes and Mach
Two AE
One F118
5.50E+07
7.50E+07
9.50E+07
1.15E+08
1.35E+08
1.55E+08
1.75E+08
0.55 0.575 0.6 0.625 0.65
Mach
(L/D
)*(V
/tsf
c)
AE 50,000 ft AE 55,000 ft AE 60,000 ft AE 65,000 ftF118 55,000 ft F118 60,000 ft F118 65,000 ft
AerodynamicsAerodynamics
BCA 50,000 ft at BCM 0.65
i
i
W
W
D
L
tsfc
VR 1ln

4848
Loiter for different Altitudes and Mach
TwoAE
30
35
40
45
50
55
60
65
70
0.55 0.575 0.6 0.625 0.65Mach
(L/D
)/ts
fc
AE 50,000 ft AE 55,000 ft AE 60,000 ft AE 65,000 ft
F118 55,000 ft F118 60,000 ft F118 65,000 ft
OneF118
AerodynamicsAerodynamics
Best Loiter Altitude 50,000 ft at Best Loiter Mach 0.62
i
i
W
W
D
L
tsfcE 1ln
1

4949
PerformancePerformance
Stall Velocity at Sea Level 205 ft/s
Take-Off Velocity 225 ft/s
Take-Off Distance 3995 ft
Landing Distance 3770 ft

5050
Limit Load FactorLimit Load Factor 3.53.5
Ultimate Negative Load FactorUltimate Negative Load Factor 3.853.85
Ultimate Positive Load FactorUltimate Positive Load Factor5.255.25
Sustained Turn Load Factor Sustained Turn Load Factor 3.523.52
Sustained Turn Rate Sustained Turn Rate 9.84 deg/s9.84 deg/s
Dynamic Pressure Limit Dynamic Pressure Limit 99.6 99.6 lb/ftlb/ft22
PerformancePerformanceRobust Structural Design - Taking Into Account Gust Robust Structural Design - Taking Into Account Gust
LoadingLoading

5151
PerformancePerformanceRobust Structural Design Robust Structural Design
Taking Into Account Gust LoadingTaking Into Account Gust Loading
V-n Diagram
High Limit Load Factor
Lower Limit Load Factor
Ultimate Load Factor
Ultimate Load Factor
Vcruise
Positive High AOA
-5
-3
-1
1
3
5
7
0 100 200 300 400 500 600 700 800
Velocity (ft/s)
Lo
ad
Fa
cto
r "n
"
Structural Failure
Structural Failure
Structural Damage
Structural Damage
Negative High AOA
Positive Low AOA
Negative Low AOA

5252
PerformancePerformanceFerryFerry
Takeoff Climb to Altitude
Cruise Out Descend to Sea Level
Sea Level Loiter for 30 min
16,000 NM
Altitude
50,000 ft
Distance
Best Cruise Altitude = 50,000 ftBest Cruise Mach = .65
Ferry Distance = 16,000 NM Endurance = 43 hr

5353
PerformancePerformance Two Allison AE3007 Turbofan EngineTwo Allison AE3007 Turbofan Engine
Climbing from Sea Level to BCA for BCM Fuel to Climb = 960 lb
Climb TrajectoryFuel Specific Energy
fs = 0
fs = 25
fs = 50
fs = 60fs = 70
he 60,000
he 50,000
he 40,000
he 30,000
he 20,000
he 10,000he 5,000
0
10000
20000
30000
40000
50000
60000
70000
0.000 0.100 0.200 0.300 0.400 0.500 0.600 0.700
Mach
Alt
itu
de
(ft)

5454
PropulsionPropulsionAllison AE3007 Turbofan EngineAllison AE3007 Turbofan Engine
Bypass Ratio 5.3
Overall Pressure Ratio 23
Thrust (Static Sea Level) 8813 lb
Thrust (at 50,000 feet) 1062 lb
Dimensions:
Length 9.59 ft
Fan Diameter 3.21 ft
Max Diameter 3.43 ft
Engine Weight 1588 lb
System Weight 3084 lb (One engine)
5458 lb (Two engines)
Max. Power Extraction 26 kW (52 kW for two engines)
* assuming an 87% efficiency extraction *

5555
PropulsionPropulsionF118-GE-101 EngineF118-GE-101 Engine
Bypass Ratio 0.72
Overall Pressure Ratio 32.8
Thrust (Static Sea Level) 15940 lb
Thrust (at 50,000 feet) 2576 lb
Dimensions:
Length 8.38 ft
Fan Diameter 3.17 ft
Max Diameter 3.92 ft
Engine Weight 3150 lb
System Weight 5671 lb (One engine)
10038 lb (Two engines)
Max. Power Extraction 45 kW (90 kW for two engines)
* assuming an 87% efficiency extraction *

5656
AE3007 (per an engine)AE3007 (per an engine)
Pitot Inlet Size: 10.64 ftPitot Inlet Size: 10.64 ft2 2
Fixed Convergent Nozzle: 4.01 ftFixed Convergent Nozzle: 4.01 ft22
F118-GE-101 (per an engine)F118-GE-101 (per an engine)
Pitot Inlet Size: 10.36 ftPitot Inlet Size: 10.36 ft2 2
Fixed Convergent Nozzle: 3.91 ftFixed Convergent Nozzle: 3.91 ft22
PropulsionPropulsionInlet and Nozzle Size*Inlet and Nozzle Size*
*Based on Historical Data
5757
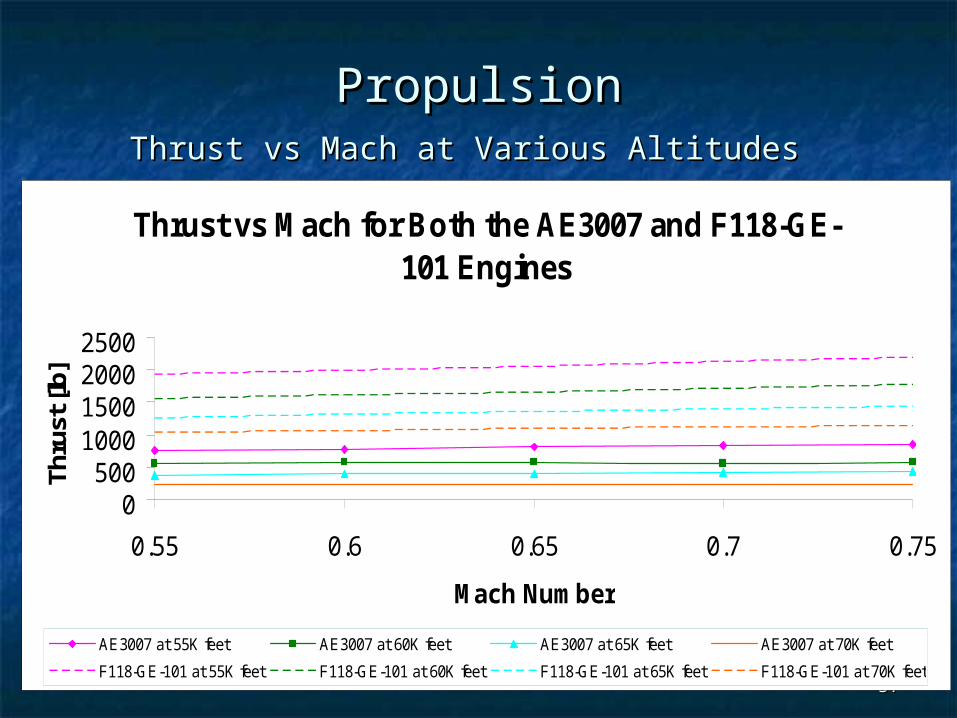
PropulsionPropulsionThrust vs Mach at Various AltitudesThrust vs Mach at Various Altitudes
Thrust vs Mach for Both the AE3007 and F118-GE-101 Engines
0500
1000150020002500
0.55 0.6 0.65 0.7 0.75
Mach Number
Thru
st [l
b]
AE3007 at 55K feet AE3007 at 60K feet AE3007 at 65K feet AE3007 at 70K feet
F118-GE-101 at 55K feet F118-GE-101 at 60K feet F118-GE-101 at 65K feet F118-GE-101 at 70K feet

5858
PropulsionPropulsionSFC vs Mach at Various AltitudesSFC vs Mach at Various Altitudes
SFC vs Mach for Both the AE3007 and F118-GE-101 Engines
0.6
0.7
0.8
0.9
1
1.1
1.2
0.55 0.6 0.65 0.7 0.75Mach Number
SF
C [
1/h
r]
AE3007 at 55K feet AE3007 at 60K feet AE3007 at 65K feet AE3007 at 70K feet
F118-GE-101 at 55K feet F118-GE-101 at 60K feet F118-GE-101 at 65K feet F118-GE-101 at 70K feet
F118-GE-101 at 50K feet AE3007 at 50K feet

5959
PropulsionPropulsionThrust vs. Altitude at Mach 0.6
for (2) AE3007H Engines and (1) F118-GE-101 Engine
50,000
52,000
54,000
56,000
58,000
60,000
62,000
64,000
66,000
68,000
70,000
500 700 900 1100 1300 1500 1700 1900 2100
Thrust [lbf]
Alt
itu
de
[ft]
(2) AE3007H engines (1) F118-GE-101 engine

6060
PropulsionPropulsionThrust vs. SFC at Mach 0.6
for (2) AE3007 and (1) F118-G-101 Engines
0.6
0.8
1
1.2
1.4
1.6
0 200 400 600 800 1000 1200 1400 1600 1800 2000Thrust [lbf]
SF
C [
1/h
r]
(2) AE3007 at 55K feet (1) F118-GE-101 at 55K feet (2) AE3007 at 60K feet(2) AE3007 at 65K feet (2) AE3007 at 70K feet (1) F118-GE-101 at 60K feet(1) F118-GE-101 at 65K feet (1) F118-GE-101 at 70K feet

6161
ITEM POWER COOLING (kW) (kW)
Defensive Payload Systems 3.6 2.5
Sensors 133.3 80.8
Flight Avionics 3.8 2.7
Miscellaneous Airframe Systems 6.8** 4.8**
Total 147.4 90.7
Total Wattage = 238 kW
**APU not included
PropulsionPropulsionRequired Power and CoolingRequired Power and Cooling

6262
PropulsionPropulsionPower and CoolingPower and Cooling
Max Power ExtractionMax Power Extraction
No. of enginesNo. of engines 11 22 33
AE3007AE3007 2626 5252 7878 kWattskWatts
F118-GE-101F118-GE-101 4545 9090 135135 kWattskWatts
Power Required From APU for Powering an Power Required From APU for Powering an Cooling SubsystemsCooling Subsystems
No. of enginesNo. of engines 11 22 33
AE3007AE3007 212212 186186 160160 kWattskWatts
F118-GE-101F118-GE-101 193193 148148 103103 kWattskWatts

6363
Auxiliary Power Unit (APU)Auxiliary Power Unit (APU)Turbocharged 310 hp Continental TSIO 520-LTurbocharged 310 hp Continental TSIO 520-L
Total Weight535 lbAPU Fuel Weight 450 lbTotal Weight985 lb
Height 1.67 ftWidth 2.8 ftLength 4.22 ft

6464
Auxiliary Power Unit (APU)Auxiliary Power Unit (APU)Turbocharged 310 hp Continental TSIO 520-LTurbocharged 310 hp Continental TSIO 520-L
Using Two AE3007sUsing Two AE3007s
Required Total Power of Subsystems 147.4 kW
Required Total Cooling Power of Subsystems 90.7 kW
Assuming 87 % Efficiency 102.5 kW
Total Power and Cooling for Subsystems 249.9 kW
Power Extracted from Engines 52 kW
Additional Power Required from APU 197.9 kW
APU Provides 231.2 kW
Available Excess Power 33.3 kW

6565
Air Intake
(Bleed Air From Inlet)
Coolant SupplyCoolant Return
Air Exhaust to Engine Compartment
Heat Exchanger
X-Band 2.4 kW Each
(9.5 kW Total)
Pump Cooled w/
Internal Coolant
(Assume 87% efficiency)
Heat Exchanger
47 kW Total Cooling
Assuming 87% EfficiencyAPU and
Turbochargers Cooling
From APU and Turbochargers
Cooling
Cooling SystemLoiter (Liquid Cooling of System)Loiter (Liquid Cooling of System)
UHF 12.7 kW Each (25.3 kW Total)
ECS(0.14 kW)
GCCU(2.3 kW)
SIGINT & Shared
Processor 2 kW Total
Electrical System & Control(2 kW)
Battery Controller(0.35 kW)

6666
Cooling SystemCooling SystemLoiter (Liquid Cooling of APU and Turbochargers)Loiter (Liquid Cooling of APU and Turbochargers)
APU Air Intake
(Bleed Air from Inlet)
APU
Turbocharger (Boost Pressure to 3.75 psi)
Turbocharger (Boost Pressure to 14.7 psi)
Exhaust
Heat Exchanger
Heat Exchanger
Coolant Supply
Coolant Return
Power from
Engine
Power from
Engine

6767
Cooling SystemLoiter (Air Cooling)Loiter (Air Cooling)
Air Intake(Bleed Air From Inlets)
Air Cooling System
55.5 kW Total Cooling
X-Band
(44 kW Total)Defensive Payload
(EW/ULQ-21)(2.5 kW)
Vehicle ManagementSystem
(0.54 kW Total)
CommunicationSystems
(2.1 kW Total)
Air Exhaust to Engine Compartment
Pump (Assume an 87% efficiency)

6868
Cooling SystemLoiter (Using Two AE3007s)Loiter (Using Two AE3007s)
Total Liquid Cooling 47 kWTotal Air Cooling 55.5 kWTotal Overall Cooling 102.5 kW
Available Cooling APU Provides83.8 kWPower Extracted from Engines52 kWTotal Power Available for Cooling 135.8 kW
Excess Cooling Power 33.3 kW

6969
Power and Cooling Cruise (Using Two AE3007s)Cruise (Using Two AE3007s)
Total Power 14.14 kWTotal Cooling9.98 kW
Defensive PayloadFlight AvionicsAirframe System
Total Overall Power and Cooling24.1 kW
Available Extracted Power from Engine52 kWExcess Power27.9 kW
**APU not required during Cruise

7070
Fuselage 1,170 lb
Wing 7,316 lb
Surface Controls 432 lb
Tail 384 lb
Landing Gear 1,535 lb
Propulsion System 5,458 lb
Flight Avionics 655 lb
Fuel System/Tanks 865 lb
ECS 414 lb
Hydraulic System 138 lb
Electrical System 874 lb
Defensive Payload 1,138 lb
Take-Off Weight 50,800 lb
Empty Weight 26,800 lb
Fuel Weight 24,000 lb
Fuel Fraction 0.47
Fuel Volume 3,500 gal
Stability and Control Stability and Control Component WeightsComponent Weights
Sensor Payload (installed) 5,748 lb
APU 535 lb
Paint 121 lb

7171
Stability and ControlStability and ControlCenter of Gravity Location at TakeoffCenter of Gravity Location at Takeoff
Aircraft Weight Distance from Moment about
Component (lb) Nose (ft) Nose (ft-lb)
Fuselage 1170 25 35100
Payload/Subsystems/Engine 17930 32.64 585275
Wing 7316 33.1 242159.6
Tail 384 52 19968
Fuel Tanks in Wings 14861 32.8 491905
Fuel Tanks in Fuselage 7431 32.6 242237
Gross Weight Moment
50873 lb 1616644 ft-lb
CG LocationFrom Nose of Aircraft Static Margin
32.93 ft 0.014
Aerodynamic Center
33.1

7272
Fuel Tanks
Main Spars
Stability and Control Stability and Control Fuel TanksFuel Tanks

7373
Stability and ControlStability and ControlCenter of GravityCenter of Gravity
Center of Gravity Travel
Xac
0%
20%
40%
60%
80%
100%
32.80 32.90 33.00 33.10
CG Location (ft)
% F
ue
l
100% 80% 60% 40% 20% 5%
% Fuel in Wings 100% 70% 70% 35% 40% 10%
% Fuel Fuselage 100% 90% 50% 45% 0% 0%
100% 80% 60% 40% 20% 5%
CG Location 32.931 32.920 32.943 32.923 32.960 32.938
SM 0.014 0.016 0.012 0.016 0.008 0.013

7474
Stability and ControlStability and Control
Ailerons
Span = 50 ft
Area = 42.5 ft2
MAC = .85 ft
Aileron Chord: 16 % of Wing MAC
Aileron Span: 25 % of Wing Span
Flaps – not required The runway distance requirements are met without the assistance of flaps

7575
Stability and ControlStability and ControlV-Tail at 45 degreesV-Tail at 45 degrees
with .6 taper ratiowith .6 taper ratio
Vertical Projection
Svt = 71 ft2
Cvt = 0.0145**
Height = 14.7 ft
Mean Cord = 5.9
Horizontal Projection
Sht = 142 ft2
Cht = 0.34**
Length = 29.4 ft
Mean Cord = 5.9
Rudder/Elevator*
Area = 22.69 ft2
MAC = 1.72 ft
Span = 13.23 ft
*Values for rudder/elevator are for one half of the V-tail only.
**Historical Data

7676
Materials and StructureMaterials and StructureMaterial SelectionMaterial Selection
Carbon Fiber
Primary and Secondary Structures
Wings
Control Surfaces
Fiberglass
Fuselage
Steel
Landing Gear

7777
Materials and StructureMaterials and StructureInternal Fuselage StructuresInternal Fuselage Structures

7878
Materials and StructureMaterials and StructureWing Load Distribution (G airload of 4)Wing Load Distribution (G airload of 4)
Wing Loading (Schrenk's Approximation)
050
100150200
250300350400
0 10 20 30 40 50 60 70 80 90
Chord (ft)
Lo
ad (
lb/f
t^2)
Root Tip

7979
Materials and StructureMaterials and StructureShear Distribution Shear Distribution (G airload of 4)(G airload of 4)
Shear Load Distribution
0.0E+00
5.0E+04
1.0E+05
1.5E+05
2.0E+05
0 10 20 30 40 50 60 70 80 90
Chord (ft)
Sh
ea
r (l
b)
Root Tip

8080
Materials and StructureMaterials and StructureMoment Distribution Moment Distribution (G airload of 4)(G airload of 4)
Moment Distribution
-2.E+07
-2.E+07
-1.E+07
-5.E+06
0.E+00
0 10 20 30 40 50 60 70 80 90
Chord (ft)
Mo
men
t (f
t-lb
)
Root Tip

8181
Materials and StructureMaterials and Structure Moments of Inertia**Moments of Inertia**
Ixx = 25.0E6 slug*ft2
Iyy = 5.95E6 slug*ft2
Izz = 36.9E6 slug*ft2
** Values Based on Geometrical and Historical Data
Ixx Izz
x z
Iyyy

8282
Future WorkFuture WorkAerodynamics: Research ways to make the fuselage more aerodynamically efficient Perform Trade Studies that look into W/S and Wing Sweep
Propulsion: Perform Trade Study cruising at lower altitudes Refine inlet and nozzle designs
Cooling System: Design actual heat exchanger, pumps, and piping for cooling system
Materials and Structures: Calculate the weights of the aircraft components based on weights of material and actual sizes
Stability and Control Analyze high lift devises (Mission Adaptive Wing)
Signature Research further ways to reduce signature
Cost Compare the benefit light weight materials will have on overall weight and cost of aircraft

8383
Cost AnalysisCost AnalysisModified DAPCA IV Cost Model (in constant United Modified DAPCA IV Cost Model (in constant United
States 2004 dollars)States 2004 dollars)Engineering, Tooling, and Manufacturing hours and Manufacturing Material Costs:
•Empty weight
•Velocity •Quantity produced in 5 years
Flight Test Costs: •Empty weight •Velocity •Number of flight test aircraft
Quality Control hours: •Historical data•Manufacturing hours
Development Support Cost: •Empty weight •Velocity
Engine and Avionics Cost Provided By:
•Lockheed Martin

8484
Cost AnalysisCost Analysisper 100 Aircraft & 4 Flight Test Aircraftper 100 Aircraft & 4 Flight Test Aircraft
Hours
Engineering 10,550,000
Tooling 6,376,700
Manufacturing 19,750,000
Quality Control 1,951,300
Total Costs
Development Support $115,310,000
Flight Test $44,690,000
Manufacturing Materials $383,980,000
Engine $206,700,000
Avionics $1,590,000,000
2004 Adjusted Labor Rates
Engineering $96
Tooling $98
Manufacturing $81
Quality Control $90

8585
RDTE cost per aircraft = $35,731,000
Flyaway cost per aircraft = $23,986,000Flyaway plus RDTE cost per aircraft = $59,717,000
Acquisition cost per aircraft = $67,913,000
Estimated RDTE + Flyaway Cost: per 100 aircraft = $5,970,000,000per aircraft = $59,700,000
Total Life Cycle cost:per 100 aircraft = $8,293,600,000per aircraft = $82,936,000
Cost AnalysisCost Analysisper 100 Aircraft & 4 Flight Test Aircraftper 100 Aircraft & 4 Flight Test Aircraft

8686
Cost AnalysisCost Analysis
Engineering Labor Hours
0
5
10
15
20
25
30
1 2 3 4 5 6 7 8 9 10
Week Number
Co
st
(hr)
Laura Melissa Luis Nic Average

8787
AcknowledgementsAcknowledgements and References and References
Acknowledgements
Dr. James D. Lang, UC San Diego, Project Advisor
Dr Leland M. Nicolai, Lockheed Martin, Project Sponsor
References
Aircraft Design: A Conceptual Approach, Raymer, D.P., 3rd Edition
Fundamentals of Aircraft Design, Nicolai, L.M., Revised 1984

8888
Thank YouThank You