1-s2.0-S002216940700594X-main
13
A multi-model approach to the simulation of large scale karst flows C. Makropoulos a, * , D. Koutsoyiannis b , M. Stanic ´ c , S. Djordjevic ´ a , D. Prodanovic ´ c , T. Das ˇic ´ c , S. Prohaska d ,C ˇ . Maksimovic ´ e , H. Wheater e a Centre for Water Systems, School of Engineering, Computer Science and Mathematics, University of Exeter, EX4 4QF, UK b Department of Civil Engineering, National Technical University of Athens, Greece c Faculty of Civil Engineering, University of Belgrade, Serbia d Jaroslav C ˇ erni Institute, Belgrade, Serbia e Department of Civil and Environmental Engineering, Imperial College London, UK Received 20 February 2007; received in revised form 25 September 2007; accepted 8 October 2007 KEYWORDS Black-box models; Conceptual models; Impact assessment; Karstic hydrology; Multi-modelling; Physically based models Summary The possible effects of water transfer through a tunnel from Fatnic ˇko Polje to Bilec ´a Reservoir on the hydrologic regime of the Bregava River located in Eastern Herzego- vina, in an area characterised by a predominantly karstic terrain, are studied. Three different simulation models of the area were developed and their predictions compared under a range of current and future hydrological and operational management conditions. These are based on a range of modelling approaches from a simplified conceptual approach to a quasi-physically based one. Despite the large complexity of the natural system, the models gave good fits to existing flow data with the most simplified model providing the closest agreement to historical flows. Calibrated models were used to study the possible effects of the intervention under a range of operational scenarios and identify the sources of the associated uncertainties. The results of the work suggest that the system of tunnels in question has a favourable effect in reducing flood hazard in the area, thus liberating scarce land resources for agriculture, and in reducing flows in the Bregava River (especially high flows). It is also suggested that a significant reduction in the uncertainty of modelling the karstic environment can be achieved by an appropriate, complementary combination of modelling approaches viewed as a multi-model ensemble. ª 2007 Elsevier B.V. All rights reserved. 0022-1694/$ - see front matter ª 2007 Elsevier B.V. All rights reserved. doi:10.1016/j.jhydrol.2007.10.011 * Corresponding author. Tel.: +44 1392 264049. E-mail address: [email protected] (C. Makropoulos). Journal of Hydrology (2008) 348, 412– 424 available at www.sciencedirect.com journal homepage: www.elsevier.com/locate/jhydrol
-
Upload
alibaba011 -
Category
Documents
-
view
8 -
download
1
description
Journal
Transcript of 1-s2.0-S002216940700594X-main
Journal of Hydrology (2008) 348, 412–424
ava i lab le at www.sc iencedi rec t . com
journal homepage: www.elsevier .com/ locate / jhydro l
A multi-model approach to the simulation of largescale karst flows
C. Makropoulos a,*, D. Koutsoyiannis b, M. Stanic c, S. Djordjevic a,D. Prodanovic c, T. Dasic c, S. Prohaska d, C. Maksimovic e, H. Wheater e
a Centre for Water Systems, School of Engineering, Computer Science and Mathematics, University of Exeter, EX4 4QF, UKb Department of Civil Engineering, National Technical University of Athens, Greecec Faculty of Civil Engineering, University of Belgrade, Serbiad Jaroslav Cerni Institute, Belgrade, Serbiae Department of Civil and Environmental Engineering, Imperial College London, UK
Received 20 February 2007; received in revised form 25 September 2007; accepted 8 October 2007
00do
KEYWORDSBlack-box models;Conceptual models;Impact assessment;Karstic hydrology;Multi-modelling;Physically based models
22-1694/$ - see front mattei:10.1016/j.jhydrol.2007.10
* Corresponding author. Tel.E-mail address: c.makropo
r ª 200.011
: +44 13ulos@ex
Summary The possible effects of water transfer through a tunnel from Fatnicko Polje toBileca Reservoir on the hydrologic regime of the Bregava River located in Eastern Herzego-vina, in an area characterised by a predominantly karstic terrain, are studied. Threedifferent simulation models of the area were developed and their predictions comparedunder a range of current and future hydrological and operational management conditions.These are based on a range of modelling approaches from a simplified conceptualapproach to a quasi-physically based one. Despite the large complexity of the naturalsystem, the models gave good fits to existing flow data with the most simplified modelproviding the closest agreement to historical flows. Calibrated models were used to studythe possible effects of the intervention under a range of operational scenarios and identifythe sources of the associated uncertainties. The results of the work suggest that thesystem of tunnels in question has a favourable effect in reducing flood hazard in the area,thus liberating scarce land resources for agriculture, and in reducing flows in the BregavaRiver (especially high flows). It is also suggested that a significant reduction in theuncertainty of modelling the karstic environment can be achieved by an appropriate,complementary combination of modelling approaches viewed as a multi-model ensemble.ª 2007 Elsevier B.V. All rights reserved.
7 Elsevier B.V. All rights reserved.
92 264049.eter.ac.uk (C. Makropoulos).
A multi-model approach to the simulation of large scale karst flows 413
Introduction
General
This study investigates the possible effects of a water trans-fer scheme on the hydrologic regime of the Bregava River inEastern Herzegovina, in an area characterised by a predom-inantly karstic terrain (complete details, including an exten-sive presentation of data, models and results is included inICCI (2004), available online). The system is complex, anddata are limited, hence the study uses different modellingapproaches to assess the robustness of management deci-sions in the face of system uncertainty. Since the primaryobjective was to assess the impact of the water transferscheme on the hydrologic regime, given limited systeminformation, the intercomparison of methods, focussed oncriteria for the overall behaviour of the models, rather thanon their performance with respect to the detail of the sys-tem representation.
Flow in the karstic zone represents one of the most com-plex hydrologic phenomena. The area studied is character-ised by karstic depressions or valleys (poljes) connectedby a system of karstic conduits. Poljes are flat and fertile,usually a few hundred meters wide and one or two kilome-ters long or more. Water enters the poljes through karsticsprings and leaves them through swallow holes (ponors)which represent the exit and entrance of karstic conduits,respectively. The function of karstic conduits (includingquantity and direction of flow) is complex and subject to ex-treme seasonal variations, including flow reversals (forexample Alberic, 2004). The relevant literature, on bothconceptualising karstic conduits, particularly when aquiferhydraulic parameters are limited, as well as comparingnumerical versus statistical approaches in modelling theirresponses is growing (see for example Eisenlohr et al.,1997a,b) and recent work has concentrated, inter alia, onthe possibility of extracting quantitative information aboutthe geometric and hydraulic aquifer parameters in karsticsystems from spring hydrograph analysis (Kovacs et al.,2005). In any case, it is suggested that the complexity anduncertainty inherent in the representation of the karsticenvironment, particularly where data are scarce and maybe unreliable, have significant implications in managing kar-stic aquifers and their water resources, particularly in termsof their vulnerability (Andreo et al., 2006; Vias et al., 2006).
Background to the study
The case study area is characterised by the existence of sur-face and underground karst phenomena, with little arableland. This study focused on two major catchments of thearea, which are hydraulically connected through karsticconduits (Fig. 1): (a) the Trebisnjica River which is the big-gest sinking river in Europe and regularly floods its poljes,rendering some of them unsuitable for human settlementsand limiting possible agricultural exploitation and (b) theBregava River, which in addition to its direct (topographic)catchment, is mainly fed through springs which originatefrom a karstic field (the Dabarsko polje – DP). Althoughthe Fatnicko polje (FP) belongs to the Trebisnjica catch-ment, seasonal water transfers take place between the FP
and the Bregava catchment, regulated by a ‘‘bottleneck’’in the karst downstream of the Dabarsko polje which limitsthe peak flows to the capacity of an underground system offissures and larger karstic conduits (Fig. 1). The study dealtwith the upstream part of the Bregava catchment (near thehydrometric station Do, near Stolac, see Fig. 1). Down-stream of Do, the river flows mostly underground in periodsof low discharge.
In the late 1950s a water management plan for the areawas conceived, with the original objectives of hydropowergeneration and flood alleviation. This has evolved in a num-ber of stages, involving the construction of tunnels, dams,and the installation of turbines. While part of the systemdownstream of the Bileca Reservoir (BR) is currently in anadvanced stage of development, in the upstream region, atunnel DP–FP has been constructed while a tunnel FP–BRis about to be constructed.
The two tunnels, at different development stages, formthe hydrosystem, the impacts of which this paper attemptsto study. Some basic characteristics of those two tunnelsare:
• Tunnel Dabarsko Polje to Fatnicko Polje (DP–FP): Thetunnel is approximately 3.2 km long and was constructedin 1986. The flow is regulated at the downstream end ofthe tunnel by a vertical sluice gate, which is operational.At present (2004 – before the construction of the tunnelbetween Fatnicko Polje and Bileca Reservoir) the opera-tional rule requires that the gate should be closed onlywhen the water level in Fatnicko Polje is higher than inDabarsko Polje.
• Tunnel Fatnicko Polje to Beleca Reservoir (FP–BR): Thetunnel is much longer than DP–FP (approximately15 km) and also has a flow regulation gate at its down-stream end. Under the present operational managementframework it is to be kept open at all times.
The problem
Due to the existence of karstic conduits, linking DP and FPwith both catchments, the operation of the two tunnelseffectively links the two catchments and thus an assessmentof the impact of their operation was needed. In particular aconcern was that the operation of the tunnels would haveadverse effects on the Bregava River, by lowering the lowflows, and thus contributing to increased water scarcity inthe Bregava catchment.
The approach
Evaluating the system’s response was a particularly challeng-ing process, in terms of data availability, data and systemuncertainty, understanding of system operation, systemmodelling, results comparison and interpretation. The over-all system is highly complex and poorly understood. Interven-tions in one part can have hard-to-quantify and widelyvariable effects on remote locations linked through under-ground karstic conduits. Furthermore, data were scarce andto a large extent unreliable, particularly since the regularmonitoring programme was disrupted by the 1991–1995 civilwar. The approach adopted was to employ a range ofmodels,

Figure 1 General outline of the area and current level of development. Thick lines are catchment boundaries and arrows indicatesmain karstic flow routes. Dashed lines represent tunnels, full dots represent springs while half-full dots represent ponors.Hydroelectric stations are marked as a square. The Do station is located upstream from Stolac, close to the catchment boundary.
414 C. Makropoulos et al.
of varying complexity, developed by independent modellingteams and then critically evaluate and interpret the resultsto quantify the overall uncertainty of the study. The mainthesis behind this approach was that multiple descriptionsof real-world phenomena, each expressed using a differentmodelling approach, can provide a more thorough under-standing than if a single representation were used (Stanger,2000) and comparisons between them can yield results thatcan be instructive, both in terms of the (complex) systemat hand and of the models themselves. In terms of hydrologicmodelling in particular, Smith et al. (2004),Reed et al.(2004), for example, used 12 different distributed andlumped hydrologic models to explore issues of optimal levelsof spatial disaggregation, calibration effect onmodel perfor-mance and level ofmodel complexity required. The approachadopted is relevant not only to the particular problem athand, but to karstic systemsmodelling in general, due to theirinherent uncertainty, and constitutes an example of thedeveloping domain of multi-modelling applied to a problemof considerable geographic and political importance.
Catchment characteristics
Geologically, the case study area is a typical example ofholokarst, comprised entirely of soluble carbonate rocks.There are numerous poljes of varying size in this region.These are elongated in shape, with their longer axes follow-
ing geological structures, particularly the main overthrustdirection from NW to SE (see e.g. Fig. 2). Almost all poljesof the region are flooded during the winter, when the inflowcapacity of the ponors is lower than the quantities of waterdischarged into the poljes (through karstic springs and sur-face water courses). There are two major rivers in thebroader area, Neretva and Trebisnjica, and a number ofsmaller surface water courses, most of them having flowsonly in the winter period of high precipitation. Water flowspredominantly underground: it infiltrates in the upper partsof the catchment and discharges as springs which occur atthe base of karst system. The ponors are situated at thesouthern edge of the poljes, while the springs are situatedat the northern edge (Avdagic, 1976).
To analyse the Bregava River regime, the area of interestis extended beyond its topographic catchment area, toinclude the catchment area of the Trebisnjica springs, sincepart of the water from Fatnicko Polje also discharges intothe Bregava springs (Fig. 3). The zones of the greatestunderground flow are mainly just above the base of karstif-ication and converge towards the Trebisnjica spring zone(Fig. 2). The existence of flow paths below the base levelof karstification cannot be excluded, but they would be rareand of limited capacity. Below the lowest water table levelthe porosity decreases abruptly. The base of karstificationand the lowest water table level approximately coincide(Milanovic, 1986).

Figure 2 Simplified hydrogeological map of the Bregavasource spring catchment area. 1. Catchment area, 2. ponor,3. underground communication detected by a dye test, 4.permanent or intermittent source springs, 5. general directionof underground water circulation, 6. dry valley, 7. synclinalaxis, 8. reverse fault, 9. zone of bifurcation, and 10. impervioustertiary sediments. Source: Milanovic (1986).
Figure 3 System decomposition in space
A multi-model approach to the simulation of large scale karst flows 415
The Trebisnjica River catchment
The spring zone of the Trebisnjica River is one of the biggestin terms of discharge potential in the entire region. A broadkarst aquifer, fed by a catchment area of 1100 km2, dis-charges through this spring zone. The annual average flowof the Trebisnjica River, in the region of the GrancarevoDam, is 80 m3/s, and the largest recorded flow is 864m3/s. The entire catchment area is characterised by highinfiltration capacities. In addition, focussed infiltration ofthe karst groundwater system occurs at the Gatacko andFatnicko poljes, with intake capacities of approximately160 and 120 m3/s respectively. The result of this infiltrationis the rapid response of groundwater levels and pressurisedflow in the karst conduits.
Bregava River catchment
The catchment area of the Bregava spring zone (Fig. 2) isabout 396 km2. The average measured discharge of thespring zone is 17.5 m3/s, 71 m3/s at maximum. The catch-ment area is divided by a deep hydrogeological barrier(impervious Tertiary sediments) beneath the Dabarsko Pol-je, into two hydrogeological units. One is the direct topo-graphic catchment area, which covers about 60% of thetotal catchment area. The other part, known as the indirectcatchment area, contributes some flow to the Bregava sys-tem part of the time and consists of the catchment areaof the Dabarsko Polje.
Data
Meteorology and climatology
All available historical climate data have been compiledfor the period 1925–2003, for 51 meteorological stations
for the quasi-physically based model.

416 C. Makropoulos et al.
located in the Trebisnjica and Bregava River catchments.Data include monthly temperature, precipitation and otherclimatological variables. Time series were compiled for ele-ven meteorological stations from 1961 to 2003. A longerperiod (from 1925) was available only for one station. Theperiod from 1951–1986 was considered the best datasource, particularly for daily precipitation data. Daily evap-oration has been computed using the FAO Penman method(Allen et al., 1998).
Topography and geographical information system(GIS) datasets
A Digital Elevation Model (DEM) was developed to enable thechecking of the stage-volume curves of Dabarsko and Fat-nicko poljes. Due to the nature of this objective, the pri-mary concern was the map’s vertical resolution. For thedevelopment of the DEM, the most detailed maps available(1:25000) were digitised and auxiliary data were includedfrom paper maps of scale 1:50000. The 1:25000 maps in-cluded 10 m contour lines, with 5 m contour lines in the low-er parts of the karstic fields, and with few spot heights. Theschematic map of the Trebisnjica system, which was usedfor modelling, was re-sampled, geo-referenced, and loadedinto a database and the catchment area was digitised onscreen. Horizontal positional error was assessed to be lessthan 5 m. Vertical resolution was assessed to be better than5 m in flat areas. The whole catchment area was definedusing a grid size of 30 m, while two detailed DEMs of Dabar-sko and Fatnicko poljes were created with 20 m grid size.The DEM was corrected for small errors in slope along thevertices of triangles on the break lines, using the ‘‘burn-in’’ procedure, so natural terrain features were preserved.The stage-volume curves produced from the DEM allowedfor a close match with measured data and were thus usedby the modelling teams.
Surface and groundwater flows
Flow and groundwater level data were collected for twoperiods: Period A: 1/1/1961–31/10/1986 which corre-sponds to natural conditions of the hydrosystem and PeriodB: 1/11/1986–31/12/2003 which corresponds to partlymanaged conditions as the DP–FP tunnel was operated dur-ing that period. Details of the data and their use are pro-vided in following sections.
Modelling
Strategy and objectives
The modelling strategy employed was the use of three dif-ferent modelling approaches, each of which may containmore than one model configuration or implementation.These included different system conceptualisations andtemporal and spatial discretisation as well as different solu-tion algorithms so that the ensemble of modelling resultsimplicitly represents a measure of the uncertainty of themodelling problem at hand. The modelling approaches weredeveloped, calibrated and run independently and can becharacterised as quasi-physically based, black-box and con-
ceptual, respectively, following the definitions of Wheateret al. (1993). Physically based models seek to representthe actual hydrologic component processes based on contin-uum mechanics, with the equations of motion of the con-stituent processes solved numerically; black-box modelsare based primarily on observations and seek to characterisethe catchment response from observed data, which deter-mine the model structure; conceptual models on the otherhand are developed based on a structure specified a priori,based on the developer’s perception of the important pro-cess components. Although this is the basis for theoreticalcharacterisation, clearly, the actual boundaries are muchfuzzier: in the cases presented here, for example, the qua-si-physically based model employs a non-physical conceptu-alisation of the groundwater system (as links and reservoirs)before proceeding to solve the resulting physical problem.The black-box model developed, assumes an a priorischematisation of the system, to allow for the modellingof new engineering structures and the conceptual model isbased on physically identifiable parameters which are opti-mised against observed data. A further discussion of themodels and a comparison of the approaches in view of themodelling target are included in the following paragraphs.
The modelling target was the unbiased assessment of theeffect of water transfer from Dabarsko to Fatnicko Poljeand from Fatnicko Polje to the Bileca Reservoir on thehydrologic regime of the Bregava River (Fig. 2). In thisassessment, the intercomparison of the different modellingapproaches from an operational standpoint is crucial. Whilethe assessment of a single model is typically based on bothvisual comparisons of observed and simulated time seriesand on statistical metrics such as the bias and the coeffi-cients of determination and efficiency, intercomparison ofmodels is typically based on statistical metrics. Visual com-parisons are indispensable when dealing with a single mod-el, both in exploration and calibration phases, particularlybecause they improve understanding of the model behav-iour and its deficiencies. On the other hand, the informationthey provide is too detailed and subjective to help in com-parisons of models. In contrast, the single statistical metricsare more objective but the information they provide is, per-haps, too concise. For the purposes of the present modellingexercise, we decided to adopt an intermediate strategy tocomparatively present the different models results for thedifferent approaches followed. This was achieved by theuse of probability distributions or duration curves of flows,which combine both statistical synopsis and ability for visualinspection. Duration curves enable a concise visual compar-ison of model performances and behaviours with respect tothe high, low and intermediate flows and thus they reflectthe behaviour also seen in plots of continuous time series,but without overloading the information with unnecessarydetails. In addition to the comparison between the models,they facilitate the comparison of the impact of the watertransfer to the hydrological regime. For all these reasons,duration curves were deemed as the ideal basis for thisstudy and were agreed among all groups as the common pro-tocol for communication. For the same reasons and giventhat this paper focuses on the overall exercise rather thanon the particulars of each model, the same type of compar-ison is kept in the paper. Obviously, however, each workinggroup used additional visual comparisons (e.g. simulated
A multi-model approach to the simulation of large scale karst flows 417
and observed hydrographs and groundwater levels) perti-nent to the particular approach, as well as particular perfor-mance indices to improve understanding of behaviours andfitting of model parameters. These will be reported in thefuture independently for each of the groups.
The hydrometric station Do in the upstream part ofBregava (just upstream of Stolac in Fig. 1) was used as thereference point for measuring predicted impact to theBregava spring zone. The fact that the quality of data wasmodest (several monitoring stations that used to be opera-tional in the area are currently abandoned and measure-ments discontinued) has to be taken into account whenassessing the accuracy and uncertainty of the developedmodels.
Modelling approaches
Quasi-physically based modellingIn this approach the system is conceptualised as a series oflinks and reservoirs, represented by two alternative models:a simple model, based on quasi-steady state hydraulic sim-ulation treating the problem as a system of reservoirs, and adetailed model, based on full-dynamic simulation of flow inthe assumed network of tunnels and reservoirs. Flow in theunsaturated zone is assumed to be primarily vertical and ismodelled based on Richards’ equation. Results of the unsat-urated zone simulation were used as input hydrograph toboth models mentioned above. A brief description of theunsaturated zone model (UNSAT) and the two network mod-els follows:
(a) UNSAT: The model (Pokrajac et al., 2006) simulatesvertical water movement and leakage from the unsat-urated zone based on Richards’ equation, under theassumption that recharge to the karst can be repre-sented as an equivalent porous medium. This is clearlyan approximation which does not take into accountthe difference between slow and rapid recharge.Richards’ equation is solved for a set of vertical soilcolumns. Boundary conditions are defined in the formof an upper boundary flux (at the soil surface) andfree drainage for the bottom boundary condition.Actual evaporation is determined as a function ofpotential evaporation and soil moisture, and evapora-tion losses are limited by the ability of the soil totransport water from deeper soil layers. In the casewhere rainfall minus potential evaporation exceedsinfiltration capacity only a part of the precipitationinfiltrates and surface runoff is generated. Within thisapproach, the latter is regarded as insignificant andcan be safely ignored.
(b) Simple routing model: This model is based on quasi-steady state hydraulic simulation, treating theproblem as a system of reservoirs. The simplifiedphysically based model is conceptualised as a set ofnodes (reservoirs and channel junctions) and links(pipes, channels, weirs or orifices). Flow can occurin both directions (positive and negative). Each nodecan have its own catchment area, and therefore itsown inflow as a result of leakage from the unsaturatedzone. A set of ordinary differential equations is solved
simultaneously for the whole network. The results ofthe simulation are water levels for each node and dis-charges for each connection.
(c) Detailed routing model (SIPSON): This detailed modelis based on full-dynamic simulation of free-surfaceand pressurised flow in the assumed network of tun-nels and reservoirs. The topology of the undergroundnetwork was defined such that the tunnels coincidewith the identified flow paths. Characteristics of net-work elements were first assumed, and then varied ina number of numerical experiments. The geometry ofman-made tunnels and of surface reservoirs (i.e. pol-jes) was taken as known.
The SIPSON simulation model is an integral part of the3DNet software (Djordjevic et al., 2003). Simultaneouslyfor all network elements, SIPSON solves four groups of equa-tions: the continuity equations for nodes (reservoirs orpoint-type junctions), the St. Venant equations of flow intunnels, the energy conservation equations for nodes andtunnel ends and equations of flow through structures suchas weirs. The solution algorithm is based on the Euler mod-ified method (node continuity equation), the Preissmannfour-point implicit finite difference method (tunnel flowequations), the Friazinov algorithm (temporary reductionof the system of tunnel flow equations) and the conjugategradient method (system of node continuity equations). De-tails of these procedures are given by Djordjevic et al.(2004).
The detailed model typically had two reservoirs con-nected by one or two tunnels. The network was looped (be-cause water from Dabarsko polje could reach the outlet toBregava either directly or via the tunnel to Fatnicko poljewhich is also connected to Bregava under specific condi-tions, as discussed in ‘‘Background to the study’’ section),with three outlets. For a given inflow to the system, calibra-tion of the detailed model was more sensitive to tunneldiameters (that directly influence dynamics of surchargingof these links) than to parameters such as roughness or weirdischarge coefficients. In addition to the two surface nodes(Dabarsko polje and Fatnicko polje) that were described inthe model with their known volumes/areas, significant stor-age was also assigned to some internal (underground) sys-tem nodes.
For both the simple and detailed model the hydrosystemwas decomposed into three (geologically and physically dif-ferent) subsystems. The system’s decomposition in spacecan be seen in Fig. 3.
The black-box/transfer function modelThe black-box/transfer function model used in this study isa part of the overall model currently in use within the Tre-bisnjica Hydro Information System (the Trebisnjica HIS;Institut za vodoprivredu Jaroslav Cerni, 2002). The simula-tion model is designed to account for the changes of specificparameters (hydrologic input; different scenarios of varioususers’ demand) and assessment of the system behaviour andperformance in real operational conditions. The case studyarea was represented as a system with various components,which simulate the natural flow pattern and artificiallycreated water flows. The natural water flow relevant tothe modelling process includes: precipitation and its

418 C. Makropoulos et al.
transformation into the karst inflow; surface water flow;flow through the porous media; flow transformation in karstplains (poljes) and evaporation from the water surface.Transfer functions were used to model transformation ofprecipitation into the karstic inflow, surface water flowand flow through the porous medium (similar, for exampleto Denic-Jukic and Jukic, 2003).
Water flows, modified by the man-made (existing orplanned) project structures covered by the modelling pro-cess, include: routing by reservoirs; dam overflow; flowthrough dam bottom outlets; seepage through the dam; flowthrough water tunnels and open canals; flow through tur-bines and generated power in hydroelectric power plants;flow through pumps and power consumption in pumpingstations; water abstraction by users. A schematic represen-tation of the main components concerning the transforma-tion of the precipitation into the various types of flows inthe Bregava River system is given in Fig. 4.
Essentially the Bregava River system comprises two typesof entities, nodes and links. The modelling consists of gen-
Figure 4 System decomposition in space for the black-box/transfeschematic not to scale).
eration of the results according to a functional schemebased on predefined rules of water distribution betweenthe various entities. The nodes represent the model compo-nents to which the continuity equation applies. They aremerging points of one or more incoming or outgoing links.The following types of nodes are distinguished: karst drain-age area; karst plain; reservoir; overflow; bottom outlet;junction; hydroelectric power plant; discharge gully; irriga-tion intake; water supply; thermal power plant; pumpingstation and other kinds of outflow. A particular group ofnodes is comprised of those from which water invariablyleaves the system, while other nodes may be sub-dividedinto those that have a water demand and those that meetand/or transmit the demand.
The links are model components to which the transferfunction applies that transform the inflow hydrograph intothe outflow hydrograph of the considered link. Links arealso used to transmit user demand. Water flows from theinflow node to the outflow node through a link. The systembreakdown into entities distinguishes between the
r function model (numbers representing system component ids;

A multi-model approach to the simulation of large scale karst flows 419
following types of the links: karst inflow; surface waterflow; groundwater flow; tunnel; direct link (flow withouttransformation); seepage; evaporation; abstraction for irri-gation, water supply and thermal power plant. There arespecific parameters that describe the behaviour of each linktype, with exception of the simple ones that are by naturedirect.
The conceptual modelThis model was built with the intent to be as simple aspossible: The system was simplified by grouping togetherseveral of its components and simultaneously using simpli-fied conceptual dynamics of the system. The mainobjectives of this modelling approach are: (a) to investi-gate whether simple mechanisms can describe in a satis-factory manner the system behaviour; (b) to identifyessentials and discard details in the system dynamics,and (c) to identify sets of parameters for which the systembehaviour is described well. As the model, after its calibra-tion, turned out to give sufficient approximation of thesystem behaviour, it was used for an assessment of theimpacts of certain future management conditions. Thiswas done by incorporating the management rules intothe model operation, in addition to the natural systemdynamics.
The K Sim2 model, which stands for Karst Simulation Sim-plified Model, was built especially for the particular casestudy based on the specific structure and peculiarities ofthe hydrosystem studied. It was based on a general experi-ence of the behaviour of karstic systems in Greece (Koutsoy-iannis et al., 2001; Rozos et al., 2004).
The schematisation of the hydrosystem, shown in Fig. 5,includes the following water storage components:
• A soil moisture reservoir that represents all soil–waterprocesses in the Trebisnjica and Bregava Rivercatchments.
• A single hypothetical polje that merges the Dabarsko andFatnicko polje system, which are connected directly toeach other and to the Trebisnjica and Bregava rivers.All other poljes of the wider area (Gatacko, Bilecko, Luk-ovacko), which are not directly linked to the BregavaRiver, are not modelled explicitly.
• A groundwater reservoir near the springs discharging tothe Bregava River.
2b
11 1
12a
3
9
8
4a4b
4 4
56
711
12Polje system
Groundwaterreservoir
Soil moisturereservoir
1. Rainfall2. Direct flow3. Evapotranspiration4. Quick flow5-8.Groundwater fluxes
10
9. Lake evaporation10. Spring discharge 11. River flow12. Diversion tunnel flow
Bregavariver
Figure 5 Schematic of the conceptual model.
Based on the above described storage components thefollowing transformations of water quantities are assumed,which are also depicted in Fig. 5 with the numbering shownin the following points:
1. Rainfall: With respect to runoff from rainfall, threetypes of surface are assumed: Impervious areas, per-vious areas with soil cover and water areas (poljes);the first two are assumed constant in time whereasthe third is assumed to vary depending on the waterelevation in the polje.
2. Direct flow: Rainfall falling on impervious areas isdirected towards either the polje system (2a) or theBregava River (2b). The amount of this flow is deter-mined by the relevant surface areas F2a and F2b,which are assumed constant but unknown (modelparameters to be calibrated).
3. Evapotranspiration: Rain falling onto pervious areas(covered by soil) is evaporated or transpired at a ratethat does not exceed the rate of potentialevapotranspiration.
4. Quick flow: If rainfall is higher than potential evapo-transpiration, then the excess water is stored in thesoil moisture reservoir, until this reservoir reachesits capacity K, which is assumed constant andunknown (model parameter to be calibrated). Rainfallhigher than the amount that can be stored is trans-formed to quick flow. This is directed towards eitherthe polje system (4a) or the Bregava River (4b). Theamount of this flow is determined by the relevantareas F4a and F4b, which are assumed constant butunknown (model parameters to be calibrated).
5. Slow flow to polje system: When the soil moisture res-ervoir is not empty, an amount proportional to thestored water S is leaked from it and directed to thepolje system following groundwater paths. Theamount of leakage, if expressed as volume per unitarea, is kSDt, where Dt is the time step (chosen tobe one day for all simulations) and k a constantparameter. Thus, the total volume directed to thepolje system is determined by the relevant area F5which does not necessarily coincide with F4a; F5 isassumed constant and unknown (additional parame-ters to be calibrated).
6. Slow flow to Bregava River: As in the previous case,an additional amount of leaked water is directed toBregava. The volume per unit area equals that in point5 and thus the total volume is determined by the rel-evant area F6 which does not necessarily coincidewith F4b. In addition, the sum of areas F5 + F6 doesnot necessarily equal the sum F4a + F4b as some ofthe leaked water may be directed to other neighbour-ing catchments. F6 is assumed constant and unknown(additional parameter to be calibrated).
7. Leakage of polje system to Bregava: From both theDabarsko and Fatnicko poljes, water can leak and isdirected towards the Bregava River (e.g. through aseries of sinkholes in both Dabarsko and Fatnicko).All these paths are modelled as a single ‘‘conduit’’which conveys water from the polje system toBregava. The water leaked from the polje to this

Model feature Characterisation 3DNet CERNI K Sim2
Hydrosystem structure
representation
Detailed
Rough
System dynamics
representation
Detailed
Rough
Consistency in representation
of physics
Physics-based
Conceptual
Complexity of mathematical
model
Complex
Simple
Number of parameters used More
Fewer
Model calibration procedure Sophisticated
Simple statistical
Figure 6 Qualitative comparison of structural features of thethree models.
420 C. Makropoulos et al.
conduit is assumed to depend on the storage in thepolje system. Specifically, the amount of this wateris assumed to be f7(V)Dt, where V is the volume ofwater stored in the polje system and f7(V) is a func-tion whose mathematical form is assumed to be athree-parameter logistic curve, reaching a saturationvalue for high V.
8. Leakage of polje system to Trebisnjica: Anotheramount of water stored in the polje system leakstowards the Trebisnjica River via sinkholes mainly inFatnicko Polje. These sinkholes are modelled as a sin-gle hole. Again, the water leaked from the polje tothis hole is assumed to depend on the storage in thepolje system, f8(V)Dt, where f8(V) is a function withmathematical form similar to that of f7(V).
9. Evaporation from polje: The total volume of evapora-tion is determined directly in each simulation step,given the potential evapotranspiration and the stor-age V, which also determines the area A, throughthe elevation-area-volume curves.
10. Spring discharge: The karstic springs discharging tothe Bregava River are modelled as an outlet fromthe groundwater storage. The outflow water volumedepends on the groundwater reservoir storage G andis given as f10(G)Dt.
11. River flow: The Bregava River flow is the sum of thespring discharge (10) and the direct flow (2b).
12. Diversion tunnel flow: When the model is run for thefuture managed conditions, a regulated discharge isassumed through the FP–BR tunnel. The discharge inthis reservoir is determined by the tunnel dischargecapacity and the regulation rules followed. Both thesedepend on the water level at the polje system (assum-ing this corresponds to the Dabarsko Polje waterlevel).
Both direct flow and quick flow are assumed to arriveeither to the polje system (2a, 4a) or to Bregava River(2b,4b) without any time lag. In contrast, for each of thegroundwater fluxes (5,6,7), in addition to the lag timedue to the residence in the relevant reservoir, which is indi-rectly determined in simulation, another constant lag of oneday is assumed to account for the time it takes water tomove along the relevant groundwater path. The one daylag was determined by inspecting flow data series duringflood events, rather than by the optimisation procedure.The system dynamics are described by the continuity equa-tions at all nodes of the hydrosystem schematisation, shownin Fig. 5, and all functions and rules described analytically inthe above points.
Model comparison
A qualitative comparison of model structural features isshown in Fig. 6. The quasi-physically based model (3DNet)is the one attempting to more consistently represent phys-ical processes, in that it makes use of physical structures(pipes and reservoirs) as building blocks of the modelstructure, but this results in an increase in complexity,whereas the conceptual (K Sim2) model is the simplestand loosest, in terms of description of the naturalprocesses (only 17 parameters in total), but is also the
one where the most sophisticated calibration procedure(automatic nonlinear optimisation) was possible (owing toits simplicity and exceptionally short computation time)and was finally used. The features of the black-box, trans-fer function model (CERNI), place it in between the twoother models. It attempts a much more detailed represen-tation of the physical system components than the concep-tual model relying, however, on data driven transferfunctions to capture the relationships between thesecomponents.
Model calibration
All models were run using data sets from two distinctperiods:
• Period A: 1/1/1961–31/10/1986 which corresponds tonatural conditions of the hydrosystem and
• Period B: 1/11/1986–31/12/2003 which corresponds topartly managed conditions as the DP–FP tunnel was oper-ated during that period.
The following two scenarios were selected to assess theimpact of the transfer of water from Dabarsko Polje to Fat-nicko Polje, and from there to the Bileca Reservoir, on theflow regime of the Bregava River at the Do station in allmodelling approaches: Natural Conditions (NC; no watertransfer), and Managed Conditions (MC; water is transferredfrom Dabarsko Polje to Fatnicko Polje and to the BilecaReservoir).

60.00
70.00
80.00
m3 /s
)
Cerni (Natural)
A multi-model approach to the simulation of large scale karst flows 421
Quasi-physically based model
The simple quasi-physically based model was calibratedusing data from 1976 to 1986 without a separate validationperiod. The calibration process involved the following steps:
(a) First the indirect catchment area calibration was per-formed on the basis of input flow hydrographs(obtained by the UNSAT model) and measured waterlevels in Dabarsko Polje. Results of the calibrationwere the dimensions of an equivalent tunnel (the tun-nel that simulates all outflows from Dabarsko Polje).In this phase of calibration, measured and simulatedwater levels in Dabarsko polje were fitted.
(b) The second step was calibration of the direct catch-ment area of Bregava, whose aquifer was conceptua-lised as an underground reservoir. The leakage outputfrom the UNSAT model constitutes the input to thereservoir and its capacity was identified through a cal-ibration process, performed by comparing modelledto measured flows at the Do gauge station.
(c) Inflow in the Fatnicko Polje was not calibrated,because it was obtained from field data linking mea-sured flows at the gauge station Srdjevici and inflowin the Fatnicko Polje. The only parameters that werecalibrated are the dimensions of the swallow holes inFatnicko Polje. Two swallow holes exist in the model:one at the bottom of Fatnicko Polje, and the other ispositioned 10 m above the bottom (based on thehydrogeological report (ICCI, 2004)). Calibration wasperformed by comparing simulation results and mea-sured water levels in the Fatnicko Polje.
The detailed quasi-physically based model was calibratedusing data from 1976 to 1982, without having a separatetime series for validation. The model’s time step was oneminute. Such a small step (compared to the one day timestep in other models applied in this study) was dictated bythe stability criteria of the numerical methods applied forsolving the full-dynamic model equations. Furthermore,the spatial discretisation was fairly detailed, with a totalof more than one thousand computational cross-sectionsacross the network of tunnels. Consequently, continuoussimulation of several year series required significant compu-tational effort (approximately 3 · 106 computational timesteps), which made the application of any automatic cali-bration procedure impossible. Therefore, model parameterswere adjusted in a trial-and-error process, comparing avail-able discharge and level hydrographs with the calculatedones.
-
10.00
20.00
30.00
40.00
50.00
- 20.00 40.00 60.00 80.00 100.00Time (%)
Dis
char
ge a
t Do
( 3DNet (Natural)K-Sim (Natural)Historical
Figure 7 Comparison of simulated natural conditions in thethree models.
The black-box hydrologic model
The monitoring and measurement data relating to hydro-meteorological occurrences and other information aboutthe system configuration status during Period A were usedto calibrate model parameters while Period B was used forvalidation. The total outflow from the Trebisnjica is consid-ered known within the model parameter calibration processbased on existing records. Calibration was performed start-ing from the topologically most upstream profiles, artificial
reservoirs, natural karst fields up to the outlet profiles(water gauging station on the Bregava River) and structures(Bileca Reservoir on the Trebisnjica). The adopted parame-ter values calibrated along the upstream reach were consid-ered constant when determining the downstream reachesrunoff. The criterion for river flow simulation quality assess-ment in the calibration phase was the achievement of min-imal deviation of computed outputs from the valuesrecorded by key data stations of the system in a leastsquares sense.
For the considered period of model parameter identifica-tion the measured and simulated multi-annual average dis-charges are respectively 18.4 and 19.2 m3/s. Thedifference of 0.8 m3/s is 5% of the multi-annual average dis-charge of Bregava at the Do gauging station, which is belowthe accuracy tolerance for hydro-meteorological (measuredand processed) data inputs. The discharge duration curvesfor the Bregava River at the Do gauging station indicate asignificant difference between computed and measured dis-charges in the discharge duration zones of 5–30% and 35–80% (see Fig. 7).
The conceptual model
As described above, automatic nonlinear optimisation wasused for the calibration of this model. The objective func-tion in this optimisation problem was a combined measureof discrepancies (in a least squares sense) between ob-served and modelled water levels at polje and dischargesat Do. In order for the model parameters to have some phys-ical meaning, their values are generally assumed to lie with-in certain limits. However, in this case no limits wereimposed a priori, and the parameter values were tested aposteriori and found to be physically consistent. The toolsused for optimisation are a collection of algorithms thathave been developed and become commercially availableby Frontline Systems (http://www.solver.com). These in-clude components of classical optimisation techniques, evo-lutionary techniques and combinations thereof. Theclassical techniques implement the so called GeneralizedReduced Gradient Method (GRG) (Lasdon et al., 1978; Las-don and Smith, 1992), which has been proven in use overmany years as one of the most robust and reliable ap-proaches to solving difficult nonlinear programmingproblems.
422 C. Makropoulos et al.
The model was calibrated and verified for period A, inwhich the system operates in natural conditions. The periodwas split into two sub-periods, the calibration sub-period(1961–1980) and the verification sub-period (1981–1986).The results show a satisfactory behaviour of the model inreproducing flow duration curves for both periods (seeFig. 7 and ICCI, 2004).
The K Sim2 model can break down the total water bal-ance of each hydrosystem component into separate portionsrelated to the origin of water. As far as the discharge ofBregava is concerned, the most important indicator of theimpact of the future polje regulation is the percent of totalwater discharged at Bregava that originates from polje un-der natural conditions (Flux from poljes, denoted by (7) inFig. 5). The higher this percentage is, the higher the im-pacts. This however has significant uncertainty, related tothe uncertainty of parameters. The sensitivity of the modelto varying parameters was assessed through different sce-narios constructed by performing alternative model fits onthe basis of local minima of the objective function.
-
10.00
20.00
30.00
40.00
50.00
60.00
70.00
80.00
- 20.00 40.00 60.00 80.00 100.00Time (%)
Dis
char
ge a
t Do
(m3 /s
)
Cerni (Natural)3DNet (Natural)K-Sim (Natural)Historical
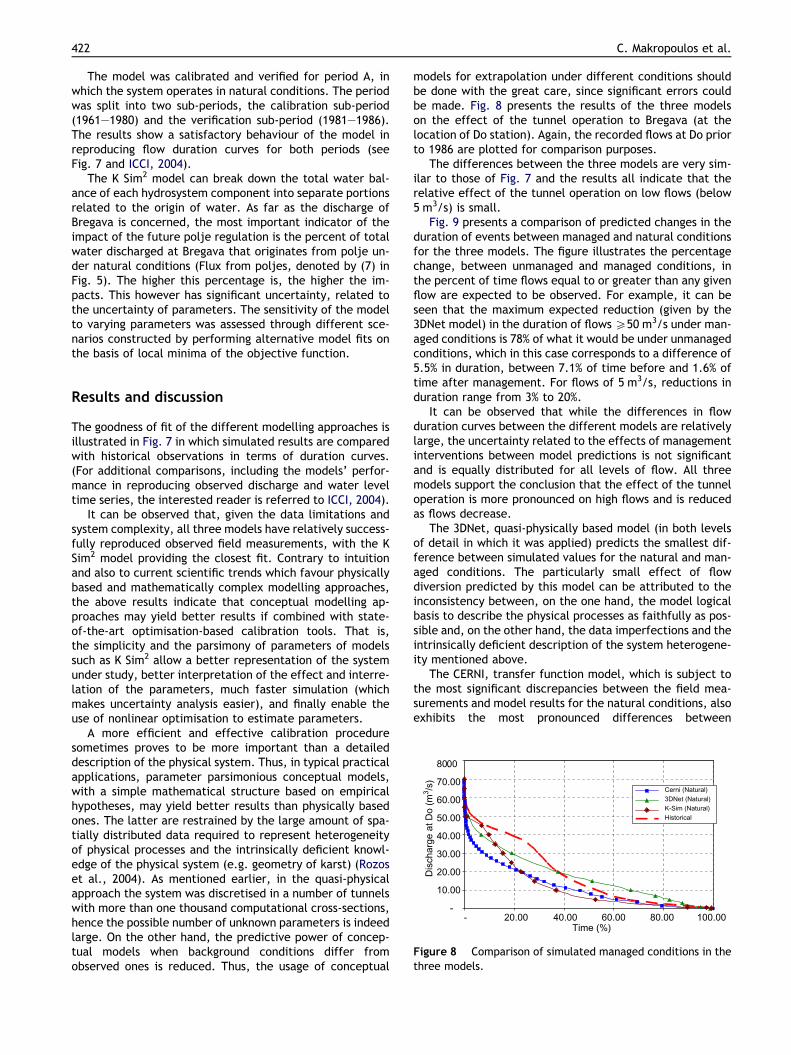
Figure 8 Comparison of simulated managed conditions in thethree models.
Results and discussion
The goodness of fit of the different modelling approaches isillustrated in Fig. 7 in which simulated results are comparedwith historical observations in terms of duration curves.(For additional comparisons, including the models’ perfor-mance in reproducing observed discharge and water leveltime series, the interested reader is referred to ICCI, 2004).
It can be observed that, given the data limitations andsystem complexity, all three models have relatively success-fully reproduced observed field measurements, with the KSim2 model providing the closest fit. Contrary to intuitionand also to current scientific trends which favour physicallybased and mathematically complex modelling approaches,the above results indicate that conceptual modelling ap-proaches may yield better results if combined with state-of-the-art optimisation-based calibration tools. That is,the simplicity and the parsimony of parameters of modelssuch as K Sim2 allow a better representation of the systemunder study, better interpretation of the effect and interre-lation of the parameters, much faster simulation (whichmakes uncertainty analysis easier), and finally enable theuse of nonlinear optimisation to estimate parameters.
A more efficient and effective calibration proceduresometimes proves to be more important than a detaileddescription of the physical system. Thus, in typical practicalapplications, parameter parsimonious conceptual models,with a simple mathematical structure based on empiricalhypotheses, may yield better results than physically basedones. The latter are restrained by the large amount of spa-tially distributed data required to represent heterogeneityof physical processes and the intrinsically deficient knowl-edge of the physical system (e.g. geometry of karst) (Rozoset al., 2004). As mentioned earlier, in the quasi-physicalapproach the system was discretised in a number of tunnelswith more than one thousand computational cross-sections,hence the possible number of unknown parameters is indeedlarge. On the other hand, the predictive power of concep-tual models when background conditions differ fromobserved ones is reduced. Thus, the usage of conceptual
models for extrapolation under different conditions shouldbe done with the great care, since significant errors couldbe made. Fig. 8 presents the results of the three modelson the effect of the tunnel operation to Bregava (at thelocation of Do station). Again, the recorded flows at Do priorto 1986 are plotted for comparison purposes.
The differences between the three models are very sim-ilar to those of Fig. 7 and the results all indicate that therelative effect of the tunnel operation on low flows (below5 m3/s) is small.
Fig. 9 presents a comparison of predicted changes in theduration of events between managed and natural conditionsfor the three models. The figure illustrates the percentagechange, between unmanaged and managed conditions, inthe percent of time flows equal to or greater than any givenflow are expected to be observed. For example, it can beseen that the maximum expected reduction (given by the3DNet model) in the duration of flows P50 m3/s under man-aged conditions is 78% of what it would be under unmanagedconditions, which in this case corresponds to a difference of5.5% in duration, between 7.1% of time before and 1.6% oftime after management. For flows of 5 m3/s, reductions induration range from 3% to 20%.
It can be observed that while the differences in flowduration curves between the different models are relativelylarge, the uncertainty related to the effects of managementinterventions between model predictions is not significantand is equally distributed for all levels of flow. All threemodels support the conclusion that the effect of the tunneloperation is more pronounced on high flows and is reducedas flows decrease.
The 3DNet, quasi-physically based model (in both levelsof detail in which it was applied) predicts the smallest dif-ference between simulated values for the natural and man-aged conditions. The particularly small effect of flowdiversion predicted by this model can be attributed to theinconsistency between, on the one hand, the model logicalbasis to describe the physical processes as faithfully as pos-sible and, on the other hand, the data imperfections and theintrinsically deficient description of the system heterogene-ity mentioned above.
The CERNI, transfer function model, which is subject tothe most significant discrepancies between the field mea-surements and model results for the natural conditions, alsoexhibits the most pronounced differences between

0
10
20
30
40
50
60
0 20 40 60 80 100Reduction in Duration (%)
Dis
char
ge a
t Do
(m3 /s
)
3DnetK-SimCerniMAXMIN
Figure 9 A comparison of predicted changes in the reductionof duration of flows between the different models.
A multi-model approach to the simulation of large scale karst flows 423
modelled natural conditions and managed conditions formean-to-low flows. Even in this case however, the differ-ences between modelled results in natural and managedconditions for low flows, which are of primary interest ofthis particular study, are relatively small.
Finally, the K Sim2 conceptual model, which achievedthe best fit between observations and model results,suggests some effects from tunnel operation for meanflows (a reduction of the order of 10% and 15% of timein the duration of events) and little effect for low flows.The slight decrease of low flows that is observed mustbe attributed to the general loss of water from the ground-water storage component after the completion of the pro-ject and implementation of regulation. It can also beobserved (Fig. 8) that the magnitude of the highest flowsdoes not change, but the highest flows become lessfrequent.
Specifically, the models agree that:
• The effect of the tunnel operation on very high flows(above 50 m3/s) will be significant (greater than 60%reduction in frequency). This reduction should have apositive impact on flood prevention in Bregava. However,due to the short duration of such events, this should haveno significant effect on the water balance of the receiv-ing Neretva River.
• The effect of the tunnel operation on low flows (around5 m3/s) is not significant (mean reduction of approxi-mately 10% in frequency). Therefore, the assumptionthat the tunnel operation will contribute to the dryingup of the Bregava River basin, or to the’desertification’of the area, cannot be supported by this study.
• The effect of the tunnel operation on medium flows(between 10–35 m3/s) is between the other two (meanreduction of approximately 40% in frequency).
Conclusions
The present study focused on the Bregava River catchmentwhich, due to the complex karstic natural system, shares re-sources with the Trebisnjica catchment depending onhydrological and meteorological conditions. The studyaimed at assessing the impact of the planned diversion sys-tem under the assumption that the whole system will be
completed and that the provisions of the design conditionsand permits will be strictly implemented.
The results of the study indicate that the system of tun-nels from Dabarsko Polje to Fatnicko Polje and from Fat-nicko Polje to Bile�a Reservoir has a favourable effect inreducing flood hazard (especially depth and duration) inthese two poljes and thus liberating scarce land resourcesfor agriculture. The study cannot therefore support theclaim that the tunnel Fatnicko Polje – Bileca Reservoir willcontribute to the drying up of the Bregava River basin, or tothe’desertification’ of the area, under assumptions of prop-er operation.
In terms of modelling it is concluded that in typical prac-tical applications, parameter parsimonious conceptual mod-els, with a simple mathematical structure, may yield betterresults than physically based ones, which are restrained bythe large amount of spatially distributed data required torepresent heterogeneity of physical processes and theintrinsically deficient knowledge of the physical system,particularly if they are combined with state-of-the-art opti-misation-based calibration tools. This is not to say howeverthat model formulation, parameterization, and the skill ofthe modeller do not have a significant impact on simulationaccuracy. Both these observations are in line with observa-tions made by Reed et al. (2004).
In all, it is suggested that a quantification of the uncer-tainty of modelling the karstic environment can be achievedby an appropriate, complimentary combination of modellingapproaches, a suggestion which supports the growing inter-est of the scientific community in multi-model ensembles asa tool to tackle issues of uncertainty within complexenvironments.
Acknowledgements
We wish to acknowledge the financial support of the EnergyFinancing Team GmbH in developing this work. We wouldalso like to thank two anonymous reviewers for their de-tailed and constructive comments.
References
Alberic, P., 2004. River backflooding into a karst resurgence (Loiret,France). Journal of Hydrology 286 (1–4), 194–202.
Allen, R., Pereira, L., Raes, D., Smith, M., 1998. Crop evapotrans-piration – Guidelines for computing crop water requirements.FAO Irrigation and drainage paper 56, FAO – Food and Agricul-ture Organization of the United Nations, Rome.
Andreo, B., Goldscheider, N., Vadillo, I., Vias, J.M., Neukum, C.,Sinreich,M., Jimenez,P., Brechenmacher, J., Carrasco, F.,Hotzl,H., Perles, M.J., Zwahlen, F., 2006. Karst groundwater protec-tion: first application of a Pan-European approach to vulnerabil-ity, hazard and risk mapping in the Sierra de Lıbar (SouthernSpain). Science of the Total Environment 357 (1–3), 54–73.
Avdagic, I., 1976. Determing flows in flooded karst poljes bymeasuring the water level in piezometers and reservoir. In: KarstHydrology and Water Resources: Proceedings of the US-Yugosla-vian Symposium, Dubrovnik, 1975. Water Resources Publication,Fort Collins, Colorado.
Denic-Jukic, V., Jukic, D., 2003. Composite transfer functions forkarst aquifers. Journal of Hydrology 274, 80–94.

424 C. Makropoulos et al.
Djordjevic, S., Prodanovic, D., Stanic, M., 2003. Urban Hydrologyand Drainage – Part 2. Introduction to 3DNet, 34th InternationalPost-Graduate Course on Hydrology, VITUKI, Budapest.
Djordjevic, S., Prodanovic, D., Walters, G.A., 2004. Simulation oftranscritical flow in pipe/channel networks. ASCE Journal ofHydraulic Engineering 130 (12), 1167–1178.
Eisenlohr, L., Kiraly, L., Bouzelboudjen, M.Y., Rossier, Y., 1997a.Numerical simulation as a tool for checking the interpretation ofkarst spring hydrographs. Journal of Hydrology 193 (1–4), 306–315.
Eisenlohr, L., Bouzelboudjen, M., Kiraly, L., Rossier, Y., 1997b.Numerical versus statistical modelling of natural response of akarst hydrogeological system. Journal of Hydrology 202 (1),244–262.
ICCI, 2004. Analysis of the effects of water transfer through thetunnel Fatnicko Polje – Bileca Reservoir on the hydrologicregime of Bregava River in Bosnia and Herzegovina. In: Maksi-movic, C., Makropoulos, C. (Eds.), Report for Energy FinancingTeam, London. Available online: <http://www.itia.ntua.gr/e/docinfo/627/>.
Institut za vodoprivredu ‘‘Jaroslav Cerni’’, 2002. Hidro-informaci-oni sistem ‘‘Trebisnjica’’, Verzija 1.0, Zavod za brane, hid-roenergetiku, rudnike I saobracajnice, Beograd.
Koutsoyiannis, D., Efstratiadis, A., Mamassis, N., Nalbantis, I.,Lazaridis, L., 2001. Hydrological study of reservoir operation,Engineering consultant for the project ‘‘Water supply of Hera-cleio and Agios Nicolaos from the Aposelemis dam’’, Commis-sioner: Ministry of Environment, Planning and Public Works,Contractor: Aposelemis Joint Venture, Athens, October (inGreek).
Kovacs, A., Perrochet, P., Kiraly, L., Jeannin, P.-Y., 2005. Aquantitative method for the characterization of karst aquifersbased on spring hydrograph analysis. Journal of Hydrology 303,152–164.
Lasdon, L.S., Smith, S., 1992. Solving sparse nonlinear programsusing GRG. ORSA Journal on Computing 4 (1), 2–15.
Lasdon, L.S., Waren, A., Jain, A., Ratner, M., 1978. Design andtesting of a generalized reduced gradient code for nonlinearprogramming. ACM Transactions on Mathematical Software 4(1), 34–50.
Milanovic, P., 1986. Influence of the karst spring submergence onthe karst aquifer regime. Journal of Hydrology 84 (1–2), 141–156.
Pokrajac, D., Stanic, M., Lazic, R., 2006. UGROW – a software toolfor integrated urban water management. In: 7th Int. Conf. onUrban Drainage Modelling and 4th Int. Conf. on Water SensitiveUrban Design, Melbourne, pp. V1.485–V1.492.
Reed, S., Koren, V., Smith, M., Zhang, Z., Moreda, F., Seo, D.DMIPParticipants, 2004. Overall distributed model intercomparisonproject results. Journal of Hydrology (1–4), 27–60.
Rozos, E., Efstratiadis, A., Nalbantis, I., Koutsoyiannis, D., 2004.Calibration of a semi-distributed model for conjunctive simula-tion of surface and groundwater flows. Hydrological SciencesJournal 49 (5), 819–842.
Smith, M., Georgakakos, K., Liang, X., 2004. The distributed modelintercomparison project (DMIP). Journal of Hydrology 298 (1–4),1–3.
Stanger, N., 2000. A viewpoint-based framework for discussing theuse of multiple modelling representations. Lecture Notes inComputer Science 1920, 154–167.
Vias, J.M., Andreo, B., Perles, M.J., Carrasco, F., Vadillo, I.,Jimenez, P., 2006. Proposed method for groundwater vulnera-bility mapping in carbonate (karstic) aquifers: the COP method.Hydrogeology Journal 14 (6), 912–925.
Wheater, H.S., Jakeman, A.J., Beven, K.J., 1993. Progress anddirections in rainfall-runoff modelling. In: Jakeman, A.J., Beck,M.B., McAleer, M.J. (Eds.), Modelling Change in EnvironmentalSystems. Wiley, pp. 101–132.