1 Outline of the Study - JICA
85
1.1. Background 1 1 Outline of the Study 1.1 Background The Santo Domingo National District of the Dominican Republic had a population of around 950,000 in 2002. The Santo Domingo Metropolitan Area, which includes Santo Domingo National District, receives around 2,500,000 tourists per year, whereby solid waste generation was estimated at approximately 1.26 kg per capita per day, which was comparable to the generation of developed countries. At the time, the main issues in solid waste management in Santo Domingo National District were the following. • Rules were not established for the residents on how to discharge and store solid waste. As a result, residents discharged solid waste outside the house every day. However, since solid waste collection plan was not well established, uncollected refuse was left scattered around for several days, thereby not only degrading the scenery but also aggravating the urban sanitation problem. • Solid waste collection was conducted partly by private companies and partly as direct service provided by the Municipal Government of Santo Domingo National District (ADN), but a clear delimitation did not exist between the two types of services. • Most of the poverty groups lived along rivers or on steep slopes where solid waste collection service was not provided due to difficulties in the access of refuse collection trucks. Solid waste generated in such inaccessible places can be easily disposed of over cliffs or along riverbeds, and can easily end up in rivers when swept by rain water. Also, there are cases where solid waste is directly disposed of into river courses. • Infectious hospital waste is not separated before collection and transport, and is mixed together with general municipal waste and disposed of in the final disposal site. Consequently, there are increased risks of infection to the solid waste management crew, as well as an adverse influence on the surrounding environment. • Santo Domingo Metropolitan Area, composed of Santo Domingo National District, Santo Domingo North, Santo Domingo East, Santo Domingo West and Boca Chica, has only one final disposal site, Duquesa, which is privately managed and operated through a concession contract. As Duquesa is not a sanitary landfill, environmental contamination has occurred due to leachate, smoke from spontaneous combustion and bad odor. The interrelated influence of the issues described above caused urban sanitation problems. ADN had been making efforts to improve the existing situation by undertaking such activities as city beautification through enhancing street sweeping, by providing a direct solid waste collection service, and by establishing a school for cleansing crew. However, as these activities had been implemented without understanding and analyzing the waste flow, it could not be said that they had been effective. In order to improve solid waste management in Santo Domingo National District, it became urgent to formulate a long-term plan, reflecting the actual situation and serving as a road map for the improvement of solid waste management in the National District. For this purpose, in November 2003, the Government of the Dominican Republic requested Japan to implement a development study. In response to this request, JICA dispatched a Preparatory Study Mission in March 2005, and the Scope of Works was signed on April 26, 2005. Finally, for the implementation of this Study on an Integrated Solid Waste Management Plan in Santo Domingo de Guzman, National District, JICA selected Kokusai Kogyo Co. Ltd.
Transcript of 1 Outline of the Study - JICA

1.1. Background
1
1 Outline of the Study 1.1 Background
The Santo Domingo National District of the Dominican Republic had a population of around 950,000 in 2002. The Santo Domingo Metropolitan Area, which includes Santo Domingo National District, receives around 2,500,000 tourists per year, whereby solid waste generation was estimated at approximately 1.26 kg per capita per day, which was comparable to the generation of developed countries. At the time, the main issues in solid waste management in Santo Domingo National District were the following.
• Rules were not established for the residents on how to discharge and store solid waste. As a result, residents discharged solid waste outside the house every day. However, since solid waste collection plan was not well established, uncollected refuse was left scattered around for several days, thereby not only degrading the scenery but also aggravating the urban sanitation problem.
• Solid waste collection was conducted partly by private companies and partly as direct service provided by the Municipal Government of Santo Domingo National District (ADN), but a clear delimitation did not exist between the two types of services.
• Most of the poverty groups lived along rivers or on steep slopes where solid waste collection service was not provided due to difficulties in the access of refuse collection trucks. Solid waste generated in such inaccessible places can be easily disposed of over cliffs or along riverbeds, and can easily end up in rivers when swept by rain water. Also, there are cases where solid waste is directly disposed of into river courses.
• Infectious hospital waste is not separated before collection and transport, and is mixed together with general municipal waste and disposed of in the final disposal site. Consequently, there are increased risks of infection to the solid waste management crew, as well as an adverse influence on the surrounding environment.
• Santo Domingo Metropolitan Area, composed of Santo Domingo National District, Santo Domingo North, Santo Domingo East, Santo Domingo West and Boca Chica, has only one final disposal site, Duquesa, which is privately managed and operated through a concession contract. As Duquesa is not a sanitary landfill, environmental contamination has occurred due to leachate, smoke from spontaneous combustion and bad odor.
The interrelated influence of the issues described above caused urban sanitation problems.
ADN had been making efforts to improve the existing situation by undertaking such activities as city beautification through enhancing street sweeping, by providing a direct solid waste collection service, and by establishing a school for cleansing crew. However, as these activities had been implemented without understanding and analyzing the waste flow, it could not be said that they had been effective.
In order to improve solid waste management in Santo Domingo National District, it became urgent to formulate a long-term plan, reflecting the actual situation and serving as a road map for the improvement of solid waste management in the National District. For this purpose, in November 2003, the Government of the Dominican Republic requested Japan to implement a development study. In response to this request, JICA dispatched a Preparatory Study Mission in March 2005, and the Scope of Works was signed on April 26, 2005. Finally, for the implementation of this Study on an Integrated Solid Waste Management Plan in Santo Domingo de Guzman, National District, JICA selected Kokusai Kogyo Co. Ltd.

1. Outline of the Study
2
1.2 Objectives
1) To formulate an Integrated Solid Waste Management Plan setting 2015 as the target year, to understand, through the plan formulation process, the actual status of solid waste management conducted by ADN, Dominican Republic, and to clarify the long-term measures for improvement of solid waste management
2) To transfer technology and know-how on solid waste management to the counterpart personnel through joint work in the Master Plan formulation, so as to support the improvement of the ADN solid waste management capacity
1.3 Targets
1.3.1 Study Area
Target area: Santo Domingo National District, 93.48 km2, and related facilities in surrounding areas
Target population: around 980,000 in 2005
1.3.2 The Solid Waste to be covered in the Study
The types of solid waste to be included in this Master Plan Study are municipal waste and medical waste. Hazardous waste and construction debris will not be included in the Master Plan Study, but general recommendations will be made on the basis of existing information that can be collected. Radioactive waste is also excluded from this Study. The types of solid waste are defined in “Norma para la Gestión Ambiental de Residuos Sólidos No Peligrosos” of the Dominican Republic.
1.4 Scope of the Study
This Study will be conducted on the basis of the Scope of Work (S/W) signed and exchanged on April 26, 2005, and the Minutes of Meeting (M/M). The consultant and the counterpart jointly conducted the studies indicated in the S/W, and, prepared the reports indicated in point “1.7 Reports” to submit them to the Dominican side. Meetings were held for necessary explanation and discussions of the Reports.
1.5 Organization of the Study
1.5.1 Study Organization
The Dominican Side established a Steering Committee to make strategic decisions, a Technical Working Group to discuss technical and managerial matters related to Solid Waste Management, and a Counterpart Team consisting of officials of ADN responsible for Solid Waste Management, in order to jointly conduct this Study with the Study Team.
The Study organization had the following relationship.

1.5. Organization of the Study
3
Figure 1-1: Organization Chart of the Study
1.5.2 Steering Committee
The Dominican side set up the Steering Committee (St/C) composed of the members below.
• Mr. Esmérito Salcedo Gavilán, Mayor of the National District, (President of the Committee)
• Mr. Max Puig, Secretary of the State for the Environment and Natural Resources • Mr. Freddy Pérez, Secretary of the State for Public Works and Communications • Mr. Sabino Báez, Secretary of the State for Public Health and Social Assistance • Ms. Alejandrina Germán, Secretary of the State for Education
1.5.3 Technical Working Group
The Dominican side set up the Technical Working Group (TWG) composed of the members below.
• Mr. José Miguel Martínez, Director EMUCD (Coordinator) • Mr. Luis Omar Polanco, Financial Director, ADN • Mr. Víctor Gómez, Planning and Institutional Director, ADN • Mr. William Espinosa, Human Development Director, ADN • Ms. Mónica Sánchez, Master Plan Director, ADN • Mr. Ramón Galván, Director of Transportation and Equipments, ADN • Mr. Jaime Lockward, Secretariat of the State for Environment and Natural Resources • Ms. Mary Grullón, Secretariat of the State for Public Works and Communications • Mr. Sergio Castillo, Secretariat of the State for Public Health and Social Assistance • Ms. Ángela Martínez, Adviser for the Secretariat of the State for Education
1.5.4 Counterpart Team
The Dominican side set up the Counterpart Team (C/P) composed of the members below.
• Mr. José Miguel Martínez, Director EMUCD • Mr. Hugo Pérez, Manager of Programming and Control EMUCD
Technical Working Group
(TWG)
Counterpart (C/P)
Advisory Committee
Dominican Side Japanese Side
JICA
Study Team
Steering Committee (St/C)

1. Outline of the Study
4
• Mr. Miguel Germosén, Technical Director of Urban Cleansing EMUCD • Mr. Oscar Guillermo García, Chief of Operations EMUCD • Mr. Ángelo Rodríguez, Chief of Biomedical Waste Management, EMUCD • Mr. Heisor Arias, Chief of Industrial Waste Management, EMUCD • Ms. Anyelina Aquino, Chief of Environmental Evaluation, EMUCD • Mr. Teodoro Lara, Chief of Environmental Education, EMUCD • Mr. Guillermo Pérez C., Chief of Risk Management, EMUCD
1.5.5 Advisory Committee
In order to provide the necessary advice to the Study Team, JICA set up an Advisory Committee composed as follows.
Responsibility Name Position Chairman Hidetoshi KITAWAKI Professor, Department of Regional Development
Studies, Toyo University
Member Masumi FURUSAWA Deputy director-general, International Cooperation Office & Public Relation Office, Department of Planning, Japan Environmental Sanitation Center
Member Masashi IWAKI Chief, Waste Plant Operation Division, Komaoka Incineration Plant, Public Waste Management Department, Environmental Affairs Bureau, Municipality of Sapporo
1.5.6 Study Team
The members of the JICA Study Team are shown below.
Team members Responsibility Name
Leader / Solid Waste Management / Final Disposal Ikuo Mori Financial Management / Public Private Partnership Masaru Obara Collection and Transport / Waste Flow Analysis Ximena Alegria Environmental Considerations / Medical Waste Management Akira Doi Citizen Participation / Social Considerations Masaharu Kina Organization / Legal Structure / Human Resource Development Victor Ojeda Medical Waste Management Yuko Aoki Administrative Coordinator Noriko Otsuki Local staffs
Responsibility
Name Data Management Kunito Ishibashi Translator / Administrative Coordinator Mario Valle Secretary Ayesha Soto

1.6. Study Schedule
5
1.6 Study Schedule
This Study is divided into 2 phases. A summary of the overall schedule is shown below. Phase 1: Understanding of current situation, formulation of Draft Master Plan Phase 2: Implementation of Pilot Projects, formulation of Master Plan
Fiscal Year
Month 7 8 9 10 11 12 1 2 3 4 5 6 7 8 9 10 11 12 1 2 3
Work in
Domiinican Rep.
Japan
Report
Seminar ▲Workshop △
Note: IC/R: Inception Report P/R: Progress Report IT/R: Interim ReportDF/R: Draft Final Report F/R: Final Report
FY2005 FY2006
Preparatory work 2nd work in Japan
1st work in Dominican Rep. 2nd work in Dominican Rep.
1st work in Japan
▲IC/R
▲IT/R
▲DF/R
▲ F/R
Phase 1 Phase 2
▲ ▲
△ △ △
▲P/R
1.7 Reports
The reports indicated below were submitted to the Dominican side and meetings were held for necessary explanation and discussions.
Report English Spanish Inception Report 5 25 Progress Report 5 25 Interim Report 5 25 Draft Final Report Summary Main Report (Municipal solid
waste) Annex (Municipal solid waste) Main Report (Healthcare waste)
5 5 5 5
25 25 25 25
Final Report Summary Main Report (Municipal solid
waste) Annex (Municipal solid waste) Main Report (Healthcare waste)
5 5 5 5
45 30 30 30

1. Outline of the Study
6
1.8 Technology Transfer
The concept of technology transfer in this Study was that the Dominican side and the Japanese side go through the problem solving cycle, “Check – Plan – Do – See” together. The figure below illustrates the concept.
調査団のインプット
Capacity
Study PeriodCapacity Development
after the Study
Capacity Development
during the Study
Base Capacity
Joint Preparation of a Draft M/P
Implementation and evaluation of P/P
Formulation of the M/P
Check
Plan
Do
See
Implementation of the M/P
Time
Understanding of current situation
Check
Plan
Do
See
Check
Plan
Do
See
Check
Plan
Do
See Check
Plan
Do
See
Check
Plan
Do
See
Check
Plan
Do
See
During the Study, the following opportunities for technology transfer were given.
Opportunities Target Contents Frequency On the Job Training
C/P • Survey method • Analysis and evaluation method of survey results • Extraction of problems • Countermeasures • Planning of a master plan • Planning, implementation and evaluation of pilot project(s)
Throughout the study.
Report explanation meeting
C/P TWG St/C
• Analysis of survey results • Planning of countermeasures
At IC/R, P/R, IT/R, DF/R
Technology transfer seminar
C/P TWG, St/C Others
• Draft Master Plan • Master Plan
During the explanation of IT/R and DF/R
Pilot Projects C/P Residents Private sector
• Planning, monitoring and evaluation of collection service work • Discharge manner • Healthcare waste management
During the pilot projects
Counterpart training
Counterpart • Visit to institutions and facilities concerned with SWM in Japan, One person from ADN • Visit to institutions and facilities concerned with SWM in Chile, Three persons from ADN
Once Once

1.9. Previous JICA Cooperation with Ayuntamiento de Distrito Nacional (ADN)
7
1.9 Previous JICA Cooperation with Ayuntamiento de Distrito Nacional (ADN)
There was JICA’s cooperation before the study, senior volunteers and training courses etc. They are expected to support implementation of the Master Plan.
1.9.1 Chronology
2001 - Request from ADN for Senior Volunteer in Solid Waste area.
2002 - Creation of a new division of the City of Santo Domingo in 5 new Municipalities where the National District is the Municipality belonging to our request.
2002 - Arrival of the Senior Volunteer Mr. Haruyoshi Odo after election of the new Mayor (Roberto Salcedo).
2003 - Preparation of the request by ADN for the implementation of a Development Study for Solid Waste Management in the National District.
2003 - Signing of Cooperation Act between JICA and ADN with the cooperation of the Senior Volunteer Mr. Haruyoshi Odo, on the occasion of the arrival of new seniors.
(2003-2005) Mr. Masahiro KAKUAGE, Group Coordinator Mr. Kenji YASUDA, Environment Mr. Kunio UESUGI, Urban Planning (2005-2007) Mr. Akio KASHIWAGI, Solid Waste (2006-2008) Mr. Takeshi SHIMOKAWA, Environment Mr. Toshiro HARA, Group Coordinator
1.9.2 Objective and Goal
Senior volunteers were dispatched to ADN, in consideration that ADN is the institution responsible for planning, management and execution of maintenance works and conservation of natural resources and environmental quality, and more than 1 million inhabitants and 500 thousand daily visitors stay in DN. Therefore, JICA dispatched the above mentioned volunteers with the aim of assisting the identification and solving of major problems in the District such as solid waste, environmental problems and deficiency in urban planning of new sectors.
1.9.3 Conducted activities
a. Identification of priority problems in each of the areas.
Solid Waste
• To design a solid waste collection and disposal system • Analysis of the current situation of the solid waste • Methodology for distribution of the solid waste • Collection and distribution of healthcare waste Environmental Management
• Formulation of an environmental management system

1. Outline of the Study
8
• Design and environmental diagnosis • Preparation of proposals for Environmental Management Pilot Project Urban Planning
• To prepare standards for buildings • Study of current situation and problems • Formulation of a municipal system of urban planning • Formulation of project proposals Coordinator
• To plan, arrange and coordinate group activities • To organize periodic meetings • To facilitate logistic support for the volunteers group • Follow-up and monitoring of the group activities b. Conducted Activities
• Signing of Cooperation Act between ADN and JICA • Reconnaissance visit to several National District sectors • Study on situation of the solid waste management and Duquesa disposal site • Analysis of Strategic Plan of Santo Domingo 2015 • Proposals for Clean Coast Project • Launching of the document “Ideas” for Santo Domingo • Establishment of Environmental Information Center, Parque Mirador Sur • Approval and implementation of the Development Study on Integrated Solid Waste
Management in the National District
1.9.4 Cooperation from JICA
a. Donation of Equipment
• 1 vehicle • 4 computers, audiovisual equipment (projector, screen, video, TV, digital camera • 2 copy machines • 1 cabinet, 1 filing cabinet b. Environmental Information Center
This center is in charge of education and information about topics related to conservation and environmental education. It is the only center established in the District with the intention of creating an Environmental Information System for the District and is focused on the formation and awareness of citizen solidarity, responsibility and protection of the environment.
The Center will formulate and implement education and environmental information policies as well as plans and programs that may arise.
From the inauguration in October, 2005.
At present they implement workshops for schools in the Pilot Project area, record and request books for institutions, visitors' record and workshops of soap and recycled paper makings.

1.9. Previous JICA Cooperation with Ayuntamiento de Distrito Nacional (ADN)
9
c. Offer of scholarships in Japan and third countries
Name Course Period Aridio Santos Solid Waste Management 2003 SAL Hildemaro Castro Urban Development 2004 JP Anyelina Aquino Household Residual Water Management 2004 JP Leandro Márquez Solid Waste Management 2004 JP Oscar García Solid Waste Management 2005 JP Hugo Pérez Urban Solid Waste 2005 JP Sina del Rosario Urban Development 2005 JP Enrique García Urban Greenery 2005 JP Monika Sánchez Comprehensive City Planning 2005 JP Miguel Germosén Solid Waste in Latin America 2006 MX José Miguel Martínez Public-Private Company 2006 CL Hugo Pérez Public-Private Company 2006 CL Joaquín López Legal Aspects 2006 CL Luís Omar Polanco Administration 2006 CL José Miguel Martínez Supervision in the Management 2006 CL José Rafael Almonte Environmental Education 2006 CL José Miguel Martínez Solid Waste Management 2006 CL Miguel Germosén Reduction, Recycling and Reuse 2006 CL
* SAL (Salvador), JP (Japan), MX (Mexico), CL (Chile) * A total of 18 counterparts of ADN were sent to courses and scholarships in Japan and third countries

2. Profile of the Study Area
10
2 Profile of the Study Area 2.1 The Study Area
The ADN territory of 93.48km2 (Junta Central Electoral, 2006) is divided in three electoral Circumscriptions: Circumscription 1, had an estimated population in 2005 of 340,024 with an area of 43.62 km²; Circumscription 2, has an estimated population in 2005 of 256,254 with an area of 38.28 km²; and Circumscription 3, had an estimated population in 2005 of 384,375 with an area of 11.58 km².
Figure 2-1: Administrative Circumscriptions
2.2 Population
The population projected for the National District by 2005 was 980,653 people. This population lives in an area of 93.48 km2 (Junta Central Electoral, 2006). Therefore, the population density was calculated as 10,491 persons/km2 in 20051.
Table 2-1: Projection Used for this Study
2005b 2006c 2007 2008 2009 2010 2011 2012 2013 2014 2015NATIONAL DISTRICTa 980,653 994,627 1,008,800 1,023,176 1,037,756 1,052,544 1,067,543 1,082,755 1,098,185 1,113,834 1,129,706
PROV. SANTO DOMINGO 1,951,295 1,979,101 2,007,303 2,035,907 2,064,919 2,094,344 2,124,188 2,154,458 2,185,159 2,216,298 2,247,880SANTO DOMINGO OESTE 566,491 574,564 582,752 591,056 599,478 608,021 616,685 625,473 634,386 643,426 652,595SANTO DOMINGO NORTE 395,939 401,581 407,304 413,108 418,994 424,965 431,021 437,163 443,392 449,711 456,119SANTO DOMINGO ESTE 882,047 894,616 907,364 920,294 933,408 946,709 960,200 973,883 987,761 1,001,836 1,016,113SANTO DOMINGO BOCA CHICA 106,818 108,340 109,884 111,450 113,038 114,649 116,282 117,939 119,620 121,325 123,054a For the National District and Santo Domingo Province, it is estimated a growth rate of 1.425% and a geometrical projection was usedb CONAPOFA Datac CONAPOFA Data
1 VIII Censo Población y Vivienda, 2002, Secretariado Técnico de la Presidencia, Oficina Nacional de Estadística
Circumscripcion(District) 1
Circumscripcion(District) 2 Circumscripcion
(District) 3

2.3. Natural Environment
11
2.3 Natural Environment
2.3.1 Location
Dominican Republic shares with Haiti the island called La Hispaniola, which form jointly with Cuba, Jamaica, and Puerto Rico the so called Great Antilles. La Hispaniola has an area of approximately 77,914 km2, out of this area 48,442 km2 corresponds to the Dominican Republic.
The Dominican Republic is located at 68º 30´ longitude west and 18º 20´ latitude north.2 The National District is located between the coordinates 70º 00’ and 69º 52’ West and 18º 33’ and 18º 25’ North.
2.3.2 Climate
Temperature and rainfall records at the Santo Domingo Station, National District (1900-1998)3 show that the months with higher rainfall are from May to November. Meanwhile, the months with lower rainfall are from December to April. Annual average rainfall was 1,416 mm/year and annual average temperature was 25.8º C.
Furthermore, it can be observed that the months with higher temperature are from May to November. Meanwhile, the months with lower temperature are from December to April.
In 100 years of cyclonic events in the Dominican Republic, approximately 20 hurricanes have landed on the coasts of the country; the five most important hurricanes in view of their effects and intensity were Lilis (1894), San Zenón (1930), Inés (1966), David (1979) and George (1998).4
2.4 Social Environment
The little availability of adequate payment and unemployment defines the life of most urban Dominicans. According to the information of the Central Bank of the Dominican Republic (2002), the unemployment rate was between 16 and 20 percent of the economically active population. In Santo Domingo, many workers receive minimum payment and are temporal workers.
The Dominican Republic inhabitants present an ethnological variety. A great diversity of skin colors can be observed. The Dominican society is a result of the combination of races and cultures. Most of the population (approximately 73 percent) is mulatto, a legacy of black slavery during the colonial period.
Such variety of ethnics produced the mixture of an immense variety of different cultures. The predominant language in the Dominican Republic is Spanish. The predominant religion is Catholicism, to which approximately 90% of the population professes, although there is complete freedom of cults.
The National District was confined to the current area after the territorial division generated by the Law 163-01. The “Ayuntamiento del Distrito Nacional” of Santo Domingo is in charge of its administration.
Santo Domingo province and the municipalities, legally separated from the National District,
2 VIII Censo Población y Vivienda, 2002, Secretariado Técnico de la Presidencia, Oficina Nacional de Estadística 3 Environmental Impact Assessment for Aeropuerto Internacional La Isabela, en Higuero, Santo Domingo, December, 1999 4 Meterological National Office of Dominican Republic

2. Profile of the Study Area
12
in economic terms, are indissolubly linked to the capital city. The floating population who moves daily into the District requires services.
The marginal barrios are destinations for migrants who arrive from the inland. These barrios are not prepared to receive the migrants as they are deficient in infrastructure (sanitation, waters supply, treatment, etc.). These barrios attract migrants to the capital.
Radio is one of the most effective mass medias to reach the masses in the Dominican Republic, followed by the television and the print medias, e.g., newspapers and magazines. There are 400 radio stations in the country and eleven newspapers nationwide.
In the District, there are 400 neighbor associations (juntas de vecinos) and other associations, including non-government organizations. These organizations focus their activities on property claims, improvement of the electricity service, discussion of neighbor’s problems among residents and authorities, and respect their rights in general.
The educational system in the Dominican Republic includes 8 years of Basic education, 4 years of middle and high education in several post-secondary schools. The Basic Level is the stage of the educational process considered as the minimum education that all inhabitants of the country have the right to receive. This education is compulsory and the state offers it for free. The Basic level has a duration of eight years. The Middle Level is the period following the basic level. It has a duration of 4 years divided into two phases, of two years each. The Secretary of State of Education (SEE) supervises the Basic and Middle levels (primary and secondary education). In 2005, it was estimated that there were 164,500 students in primary schools and 61,300 in secondary schools who were studying in the National District. The Superior Education, which follows Middle level, is the final stage in the educational system.
Nationwide, there is a high illiteracy level with 21.8% in the population older than 3 years. The average educational level is 4.5 grades. In the National District, the illiteracy rate decreases to 14.1%.
Table 2-2: Literacy rate in Dominica Republic and National District
Population Able to read and write Unable to read and writeArea Total Population % Population %
Country 7,977,328 6,235,154 78.2 1,742,174 21.8 National District Region 2,541,188 2,119,920 83.4 420,268 16.6 National District 859,720 738,207 85.9 121,513 14.1
Source: VIII National Census of Population and Housing 2002, Statistic National Office (ONE)
2.5 Economic Situation
2.5.1 National Economy
A World Bank document entitled “World Bank List of Economies” (April 2005), based on data prior to 2003, classified the Dominican Republic as a developing, lower middle-income and less indebted country (lower middle income: US$766-3,035).
The structure of the economy in 2003 was approximately 11% in the primary sector, 30% in the secondary sector, and 59% in the tertiary sector.
The following Table shows that the overall GDP growth rate during 1996-2003 was 5.8% in real terms, and 3.9% when measured as per capita real domestic production. The growth rate was especially impressive in 1999, when it grew 8.2% in real terms, and 6.2% when measured in per capita real domestic production. After another excellent growth period in 2000, the economy began to decline, induced by the global slowdown, especially in the US

2.5. Economic Situation
13
economy, which accounts for the bulk of Dominican exports. The new administration has been making efforts to reverse this adverse situation, and certain macroeconomic aspects appear to be improving.
Table 2-3: Gross Domestic Product 1995-2003
Gross Domestic Product Year
Population
(1000) Current (Million RD$)
Current (per cap.
RD$)
Real (Million RD$)
Real (per cap.
RD$)
1995 7,558.1 162,282.6 21,471.4 4,579.3 605.9 1996 7,694.0 183,361.2 23,831.6 4,907.4 637.8 1997 7,832.4 214,863.7 27,432.6 5,307.6 677.6 1998 7,973.3 241,977.1 30,348.5 5,702.0 715.1 1999 8,116.7 278,629.6 34,328.0 6,166.7 759.8 2000 8,262.7 323,430.3 39,143.6 6,644.9 804.2 2001* 8,411.3 366,205.4 43,537.5 6,910.0 821.5 2002* 8,562.5 401,883.2 46,935.0 7,206.7 841.7 2003* 8,716.5 509,965.4 58,505.5 7,175.3 823.2 Year Rates of Growth (%) 1996 1.80 12.99 10.99 7.17 5.27 1997 1.80 17.18 15.11 8.15 6.24 1998 1.80 12.62 10.63 7.43 5.53 1999 1.80 15.15 13.11 8.15 6.24 2000 1.80 16.08 14.03 7.76 5.85 2001* 1.80 13.23 11.23 3.99 2.15 2002* 1.80 9.74 7.80 4.29 2.45 2003* 1.80 26.89 24.65 -0.44 -2.20
Source: Central Bank of the Dominican Republic
Out of a total population of 8,562,541 in 2002, the working age population (10 years or older) was 6,723,578, the economically active population (EAP) was 3,701,798 and the employed population was 3,105,458. Unemployed workers numbered 596,341, equivalent to 16.1% of the EAP. The employed population, was distributed by economic sector and activity, by 16% in the primary sector, 20% in the secondary sector and 64% in the tertiary sector. Details on EAP and employment are shown in the following Table.
Table 2-4: Distribution of the Employed EAP in the Dominican Republic in 2002
Economic Sector & Activities Percentage Primary Sector 15.92 Secondary Sector 20.33 Tertiary Sector 63.75
Source: Central Bank of the Dominican Republic
Table 2-5: Composition of GDP and employed population in 2002
Economic Sector GDP (%) Employed Population (%) Primary Sector 11 16 Secondary Sector 30 20 Tertiary Sector 59 64 The export value of the Dominican Republic increased from US$4,614 Million in 1997 to US$5,447 Million in 2003, although the peak was reached in 2000 with US$5,737 Million.

2. Profile of the Study Area
14
Around 80% of exports came from free trade zones, among which textile products comprised of around half, although with a slightly declining trend during the period.
Total Imports of the Dominican Republic also increased from US$4,192 Million in 1997 to US$5,266 Million in 2003, although the peak was reached in 2000 with US$6,416 Million.
Remittance from Dominican residents abroad increased steadily from US$1,326 Million in 1998 to US$2,060 Million in 2003. The remittance in 2003 amounted to nearly as much as the exports of textile products from the free trade zones, and equivalent to 38% of total exports.
Since the second half of the 1990s, the inflation rate moved in the same direction as the exchange rate between the Dominican currency RD$ and the US Dollar.
The exchange rate between the Dominican currency RD$ and the US$ has changed gradually from 12.9 RD$ per US$1.00 in 1996 to around 17.5 RD$ per US$1.00 in 2002, when divergent rates began to be reported for the sellers and buyers of foreign currency. In 2003, the exchange rate of the RD$ worsened drastically to around 29 RD$ per US$, and to about 41 RD$ per US$ in 2004. The exchange rate strengthened in 2005, and appears to have achieved a relative stability at around 30 RD$ per US$, as shown in the following Table.
Table 2-6: Exchange Rate between RD$ and US$ 1996-2004
Year Buy & Sell Buy Sell 1996 12.90 - - 1997 14.01 - - 1998 14.70 - - 1999 15.83 - - 2000 16.18 - - 2001 16.69 - - 2002 - 17.45 17.59 2003 - 29.06 29.37 2004 - 41.25 41.93
Jan-Aug 2005 - 28.84 29.11 Source: Central Bank of the Dominican Republic The interest rates increased by around 6 percentage points between 1998 and 2004, from around 21% yearly rate in 1998 to around 27% in 2004 in the case of active interest rates. Likewise, passive interest rates increased from around 16% in 1998 to around 22% in 2004, as shown in the following Table.
Table 2-7: Interest Rates 1998-2004
Year Active Interest Rate (%) Passive Interest Rate (%) 1998 20.82 16.09 1999 20.60 16.21 2000 20.88 17.41 2001 21.21 16.00 2002 20.26 16.96 2003 24.54 20.98 2004 27.43 22.82
Source: Central Bank of the Dominican Republic

2.5. Economic Situation
15
2.5.2 Regional Economy
The estimated gross regional product (GRP) corresponding to the National District in 2003 was estimated at 3,931.6 Million RD$ at 1970 prices, which was equivalent to 55% of the gross domestic product (GDP) of 7,175.3 Million RD$. The equivalent current value of per capita GRP in the National District was around US$9,800 as compared to the US$2,130 per capita GDP in 2003.
The estimated structure of the economy in the National District would be composed of around 31% secondary sector and 69% tertiary sector.

3. Current Situation of the Municipal Solid Waste Management
16
3 Current Situation of the Municipal Solid Waste Management 3.1 Current Waste Stream
a. Waste Generation Rate
The Waste Amount and Composition Survey obtained waste generation rates by source as shown in the table below.
Table 3-1: Waste Generation Rate
Generation Source Generation Rate Households 780 g/person/day Commerce Restaurant 1,270 g/seat/day Others 1,060 g/employee/day Institutions 200 g/employee/day Market 15,080 g/stall/day Street sweeping 220 g/m/day
Note: The waste generation rates were obtained by rounding the results of WACS off to the nearest ten.
b. Waste Amount
The current waste amount was estimated analyzing the data obtained by WACS and the weighbridge at Duquesa. The results are shown below. What ICI means here is Institution, Commerce and Industry, i.e., waste generated from business activity.
Table 3-2: Estimated Waste Amount in 2005
Source Waste amount (ton/day) Households 765 ICI 686 Sweeping 78
c. Waste Stream
The table and the figure below present the current waste stream in the National District in 2005.
Table 3-3: Current Waste Stream Unit: ton/day
Flow Total 1 Generation 1,529 2 Discharge 1,489 3 Self-disposal 7 4 Recycling at source 33 5 Collection 1,412 6 Direct haul 1 7 Clandestine dumping 76 8 Transfer 274 9 Haulage into Duquesa 1,413
10 Recycling at Duquesa 69 11 Final Disposal 1,344 12 Recycling 109

3.1. Current Waste Stream
17
2. Discharge 5. Collection 8. Transfer1,489 1,412 274
9. Haulage 1. Generation 3. Self- into Duquesa
1,529 disposal 6. Direct haul 1,4137 1
10. Recycling 4. Recycling 7. Clandestine at Duquesa at source dumping 69
33 7611. Final
12. Recycling Disposal102 1,344
Unit: ton/day
Figure 3-1: Current Waste Stream
The table below shows the important indicators for evaluating and preparing the plan for SWM.
Table 3-4: Waste Amount Indicators
Indicators Waste Amount per Person 1 Generation Discharge Disposal Collection rate by amount 2 Collection rate by population 3 Recycling rate 4 Waste minimization rate
1.56 kg/person 1.44 kg/person 1.37 kg/person
95 % 90 % 7 % 7 %
1: divided by the population of 980,653 2: collection / (discharge – direct haul) 3: This data obtained from the Census 2002. 4: (recycling + recycling at Duquesa) / generation 5: (self-disposal + recycling+ recycling at Duquesa) / generation

3. Current Situation of the Municipal Solid Waste Management
18
3.2 The Current Situation
a. The Current Situation
The Table below describes an overall evaluation of the current solid waste management in the National District.
Table 3-5: The Current Solid Waste Management
SWM Component Description
1 Collection Waste collection service is supposed to be provided in whole area of the city by the private contractor companies. However, the municipality also operates its own service where the service seems to be insufficient. According to the Census 2002, 90% of the citizens have some kind of waste collection service. However, POS’s result shows that 24% of the citizens do not have the service. The reason why such a large population answers so seems to be that the collection trucks do not pass in front of their houses (31% has to take their waste to a collection point; POS) and irregular collection frequency. Although most of the city is covered by the collection service, it is not kept clean (68% feels that the city is dirty; POS). The citizens suffer from an unsanitary environment. Contrary to the citizens’ perception about the esthetic of the city. Most of the citizens appreciate the current collection works (73% of the interviewees answered they are satisfied with the service). This may imply appreciation of the citizens to the ADN efforts in this field. Anyway, improvement of the collection system should be given the first priority among the SWM in the National District.
2 Disposal All waste collected in the National District is brought to the Duquesa landfill. A private company, Duquesa Consortium, operates the landfill from June 2004 under the contract with the municipality of Santo Domingo Norte for 20 years. The disposed waste amount is recorded by the weighbridge installed at the entrance of the landfill. The access road for collection vehicles to waste dumping area is kept in fairly good condition. Although the landfill does not have an impermeable liner and appropriate leachate treatment facility, the waste is covered with soil and gas extraction pipes are equipped. A new airport has been constructed and is ready to operate. This airport may influence the existence or the operation of the landfill due to its proximity (Less than 2 km). The contracted private company has a future operation plan. However, the indecisive situation regarding the airport and low tipping fee (2.5US$/ton) make the company hesitate to invest it. Final disposal is indispensable for SWM. A consensus on the use or non-use of the Duquesa landfill should be established among the institutions concerned in order to secure stable SWM in the future not only for the National District but also for other concerned municipalities.
3 Minimization Official waste minimization activities have not been seen in the National District. However, informal recycling activities are seen in the city and in the landfill. Waste picking in the city causes waste scattering on the streets and that in the landfill causes the waste-pickers to face health risks. Environmental education regarding waste minimization is not widespread among the citizens so far. It is recommendable to establish an official manner of environmental education in schools and communities to encourage waste minimization.
4 Efficiency The financial information of ADN does not allow accurate estimation of the cost of SWM. Preliminary estimation made based on information available resulted in 40 – 50 US$ per ton of waste. Actually, the collection works carried out by the private companies and the municipality are overlapping. This implies inefficiency of the collection work. In addition, a large number of sweepers are working on the streets. Although observations and technical data imply inefficient use of resources, the present data keeping system does not allow detailed diagnosis of efficiency of SWM. Therefore, it is recommendable to establish a manner of technical and financial data management together with improvement of the operation.


3.2. The Current Situation
21
Consequently, the final disposal is in an unstable situation not only for the National District but also for other municipalities disposing of waste in the Duquesa landfill (Problem 4).
In the 1990’s the city as well as the country experienced rapid economic growth, it is thought, which boosted the amount of waste generated in the city. In addition, a large number of people visit the city and generate a considerable amount of waste, as commercial facilities, government agencies, educational institutions, etc. are concentrated in the city. A culture of waste minimization has not been instilled in the citizens, the fluid population or the business entities. Consequently, the city generates a huge amount of waste (Problem 5).
Most hospitals in the National District do not have appropriate treatment facilities and do not conduct appropriate in-house separation of medical waste. In the event that in-house separation is conducted, no collection system for medical waste has been established. Consequently, medical waste is collected and disposed of mixed with municipal waste (Problem 6).
Abundant trees planted along avenues and public spaces make the city environment favorable. However, instances of hurricanes in the past indicate that those trees are vulnerable to strong winds. Thus, the city has a high potential to generate a huge amount of waste due to hurricanes (Problem 7). This issue is under further investigation at this moment.
c. Issues to Challenge
The next five points are issues to be challenged to solve the problems.
c.1 Strengthening of the governance of the SWM (for Problem 1, 2 and 3)
The fundamental causes of “the city is not kept clean” are judged as weak administration and insufficient investment in collection and transport equipment. These causes can be resolved through strengthening of the governance of SWM in the National District, which shall include the following.
• Strengthening of the relation with the citizens • Improvement of the control of the private sector • Improvement of the cost accounting system • Improvement of the fee payment • Strengthening of the current administration body and/or establishment of a new one • Establishment of a new legal framework To appropriately deliver information on waste discharge manners (when, where and how to discharge waste) to the citizens it is crucial to obtain their trust in the solid waste service. Furthermore, incorporation of the citizens in monitoring and administration will make the SWM efficient and transparent.
Establishment of service quality and incorporation of it in the contracts with the private collection companies are important measures to strengthen the control of them. In order to ensure sound participation of the private sector in the collection service, the municipality should develop their capability. By directly providing a sound collection service to part of the city will give the municipality opportunities to develop their capability as well as be a good practice to the private sector.
To accurately ascertain the costs of SWM it is indispensable to improve its efficiency and sustainability. The current accounting system of the municipality should be reformed so that the costs of SWM can be identified. Meanwhile, the tariff for the solid waste service shall be reviewed considering waste amount by generation source. Furthermore, the service fee payment shall be increased together with improvement of the service quality.

3. Current Situation of the Municipal Solid Waste Management
22
Knowledge and experience of SWM shall be accumulated in an administrative body. The current municipal administration structure does not allow such knowledge management due to periodical political power shifts. Creation of an individual administrative body for the SWM, like a municipal company, will realize the accumulation of knowledge and experience and will enhance sustainability of the SWM.
To guarantee the realization of the above issues, establishment of a new legal framework will be effective, which will clarify quality of service, roles and responsibilities of persons/institutions concerned, and support creation and operation of the new administrative body.
c.2 Consensus building about the final disposal (for Problem 4)
Continuity of the operation of the Duquesa landfill is uncertain due to the proximity of the new airport. The private company that operates the landfill is reluctant to invest in necessities for future operation and environmental mitigation measures due to such an indecisive situation. Consensus building among institutions concerned is crucial to ensure sound SWM for the municipalities that dispose their waste in the Duquesa landfill.
The Secretariat of State for Public Works and Communications and the Secretariat of State for Environment and Natural Resources will be the authorities taking initiative for this issue. ADN, as the most important user of the landfill, is expected to contribute to the consensus building.
c.3 Enhancement of waste minimization (for Problem 5)
The waste amount generated in the city is huge as well as the waste amount per capita. Environmental education regarding waste minimization will give the citizens benefits such as decreased SWM costs, a reduction of environmental adverse impacts and conservation of natural materials. In addition to environmental education, encouragement of recycling is recommendable. However, recycling should be planned taking into account financial feasibility. Participation of the private sector will make the recycling financially sustainable. Glass bottles, papers, plastics and PET are principal recyclable materials in the National District at this moment.
c.4 Establishment of a system of medical waste management (for Problem 6)
Mixture of medical waste and municipal waste shall be avoided in order to protect the health of hospital employees, collection workers, workers at landfill, waste-pickers and the citizens. Separation of medical (hazardous) waste in hospitals is indispensable for sound medical waste management. Only the Secretariat of State for Public Health and Social Assistance is the authority that has the power to solve this problem.
c.5 Disaster waste (for Problem 7)
The city has a high possibility of being hit by a strong hurricane, which will cause tons of waste. Principal waste will be trees and branches that are planted along avenues and public spaces. Routine maintenance of trees and/or planting native species instead of planting imported plants will be an effective preventive measure to such hurricanes.

4.1. Integrated Improvement of the Collection Service
23
4 Pilot Projects This chapter presents pilot projects conducted during the Study, in order to verify the applicability of measures recommended in the Master Plan, taking into account the problems and challenges analyzed in the previous chapter.
4.1 Integrated Improvement of the Collection Service
4.1.1 Outline
The waste collection service in the National District is carried out by private companies, micro-companies and directly by the Municipality.
The contracts maintained between the Municipality and the private companies establish exclusively assigned territories to each of them. However, it is not fulfilled and the companies operate in areas different to those territories. On the other hand, the collection carried out by ADN with small trucks that was scheduled to collect waste in inaccessible areas and to support the collection works of sweeping waste does not fulfill its purpose. They generally carry out the service in the same areas assisted by the private companies.
Two pilot projects were designed taking into account the current situation where the operation of the collection service has been chiefly contracted out to the private sector and the Municipality should act as an inspector.
Pre Pilot Project (P.P.P.): The objective was to establish a collection service that fulfills the quality set by the Municipality. It was conducted directly by ADN with the purpose of training the C/P regarding the design and inspection of the service. It was also expected that the project will serve as a reference for the private sector. The target area corresponded to the sector 6 according to AAA categorization. It was carried out from September to November of 2005.
Pilot Project (P.P.): The objective was to establish a collection service of identical quality to the one achieved in sector 6 (P.P.P.) by the private operator with inspection by the ADN who also made the design of the service. The target area corresponded to the sector 5 according to AAA categorization for service charge collection routes. It was conducted from May to July 2006.
a. Overall Goal
A good quality of collection service for the urban area is defined and carried out.
b. Project Goals
Pre Pilot Project (P.P.P.)
• The collection service is established and conducted directly by ADN in the target area of the Project, Area 6.
Pilot Project (P.P.)
• A supervision method is established and implemented for the private firm operating in the Project target area (Area 5). In the Project area, even the private firm offers the same service level as that attained by PPP.
c. Expected Results
Pre Pilot Project (P.P.P.)

4. Pilot Projects
24
1. The ND has an area where a good quality collection service is carried out, which serves as a reference for the personnel of the Municipality and for the private operators.
2. The Collection Improvement Manual is prepared based on analysis and evaluation. 3. The Manual of Supervision of the Service is prepared based on the analysis and
evaluation. 4. A method for data management for the collection service is established. Pilot Project (P.P.) 1. The private operators understand that the results of the P.P.P. can be implemented so
that their administration and operation are more efficient so as to improve the level of service.
2. Collection routes are designed using of the Collection Improvement Manual. 3. The inspection is carried out according to the Manual of Supervision of the Service. 4. The street sweeping is improved. 5. Strengthens the coordination between the ADN and the private operator. 6. Similar results achieved in area 6 are attained. d. Activities
Pre Pilot Project (P.P.P.) 1. Diagnostic of the service in the sector 6 2. Service Design 3. Trainings to the C/P 4. Improvement of operation 5. Monitoring of the service 6. Preparation of the Improvement Collection Manual 7. Preparation of the Manual for the Supervision of the Service. 8. P.P.P. Evaluation Pilot Project (P.P.) 1. Diagnostic of the service in sector 5. 2. Design of the Collection Service 3. Training of the C/P and private operators 4. Improvements Implementation 5. Implementation of the service supervision 6. Sweeping design 7. Trainings to the C/P as for sweeping 8. Improving the sweeping project 9. Monitoring of the sweeping 10. Projects evaluation e. Organization
e.1 Pre Pilot Project, Area 6
The pilot project in sector 6 was developed with the participation of the Municipality and the S/T, under the following organization.
4.1. Integrated Improvement of the Collection Service
25
Figure 4-1: Organization of the Pre Pilot Project
e.2 Pilot Project, Area 5
The following figure shows the organization for the pilot project
Figure 4-2: Organization for the Pilot Project
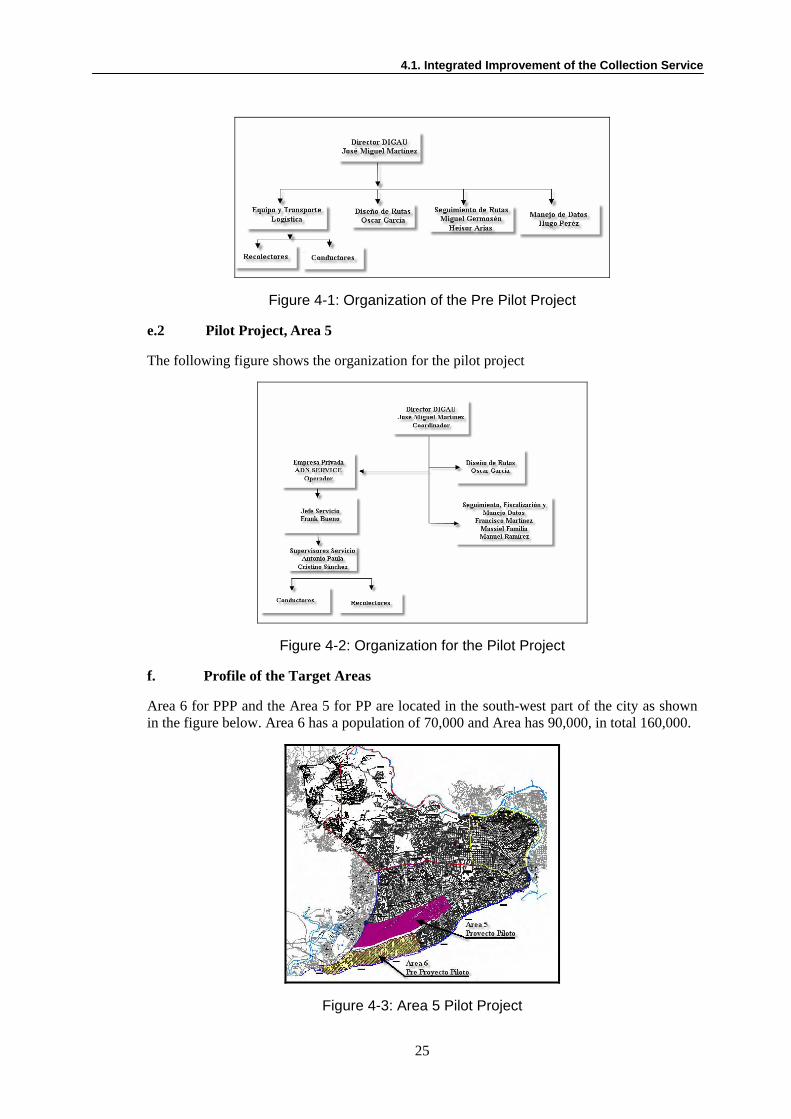
f. Profile of the Target Areas
Area 6 for PPP and the Area 5 for PP are located in the south-west part of the city as shown in the figure below. Area 6 has a population of 70,000 and Area has 90,000, in total 160,000.
Figure 4-3: Area 5 Pilot Project

4. Pilot Projects
26
4.1.2 Results
The following table shows the results of the pre pilot project.
Table 4-1: Results of the Pilots Projects
Objective Results Global Goal A collection service of good quality is settled in the urban area of the ND (excluding marginal areas), and the collection service is executed according to the quality patterns.
With the implementation of the pre pilot project and the collection and sweeping, the pilot project has been able to develop in two areas a collection service that fulfills the quality settled by the Municipality and that responds to the international standards, approximately assisting 160.000 inhabitants. The new service has achieved coverage of 100% of the areas with a total execution of the frequency, days and schedules of attention, being constituted in a model to be replied for both the Municipality and the private company.
Purpose of the Project: Pre Pilot Project (P.P.P.) The collection service is settled and is executed directly by ADN in the target area of the Project, Area 6.
With the implementation of the pre pilot project the planning and optimized design of routes was achieved, improving the collection efficiency when increasing the general yield of the service, increase the yield of the workers and the quantity of tons transported by trip, reaching the values for the quality indicators within those recommended internationally. The entrance in operation of the monitoring system and pursuit of routes has given the necessary information, through which the EMUCD can evaluate the service and make the corrections that are necessary. The results of the pre pilot project, will enable the Municipality to show directly to the private operator the conditions under which the Municipality expects that the service is developed.
Purpose of the Project: Pilot Project (P.P.P.) The supervision method of the private firm that operates in the target area of the Project Area 5 is settled and executed. In the Project area, the private firms offer the same level of service that the one obtained in the Area 6
Through the implementation of the pilot project the operation of the collection service under the same quality parameters established in the pre pilot project was achieved, and the Municipality also passes to exercise its main function that is of inspector and the private company as exclusive operator in the area. Both projects allowed to demonstrate to the private operator and to the personnel of the EMUCD that the execution of quality service is not only associated to the purchase of new trucks, but mainly to the rational use of the resources, to the continuous control of the service and the opportune and appropriate communication among operator, inspector and generator.
Improvement of the service quality
Pre Pilot Project Improvement of the collection achieved the following: - The covering of 100% of the area - Execution of the frequency, days and schedules of attention by
100% - Execution of the legal day of work, 100% of the routes was
developed in the day of 8 hours - Increase in the quantity of waste transported by trip, achieving an
average of 93% of use of the load capacity. - Increase of the yield of tons collected by collection time, achieving
an increase of 15% with regard to the yields measured in time and movement.
Pilot Project Improvement of the collection achieved the following: - The covering of 100% of the area - Execution of the frequency, days and schedules of attention in
98%, of the total of routes, with 70% of the routes with execution of 100%
- Reduction of the work day by 17% - Increase of the yield of tons collected by collection time, achieving
an increase of 11% with regard to the yields measured in time and movement.

4.1. Integrated Improvement of the Collection Service
27
Objective Results Preparation of Manuals Manual for the Improvement of the Collection and Manual for the
Supervision of the Service were prepared. The personnel was trained in the use of both documents
Improvement of the Sweeping service
Improvement of the sweeping service, achieved the following: - The covering of 100% of the considered area - Execution of the frequency, days and schedules of attention
100%
4.1.3 Conclusion and Recommendations
The rational design of the collection and sweeping service attained a good quality of service.
Provision of a good quality service and an inspection program has enabled the guarantee of maintaining the frequency, days and schedules established. Dispersed waste was not seen in the streets after the service. These achievements are the results of the application of the knowledge acquired by the personnel from the EMUCD and the private operator during the training programs.
The adequate planning and daily control of the parameters enabled calibration of the routes. Additionally, the continuous inspection of the routes assured the execution of the trips covering the assigned area. Lastly, the correct execution of the routes increased amount of waste collected. Adjustment and improvement by the private operator largely increased the productivity and effectiveness of the service.
A series of problems that affect the quality and efficiency of the service have been found during the project. Those are not related to the design, but with the discharge manner of the residents. Such manner should be controlled through communication programs with the community that includes aspects as characteristic of the service, obligations and the users' rights according to the Regulation.
The EMUCD has understood the importance of optimizing and inspecting the service, organizing the market and communicating with the community. This results in an improvement in the discharge manner. In the same way, they understood the necessity of strengthening their organization in order to have enough qualified personnel to make the design and inspection of the service in the rest of the District.
4. Pilot Projects
28
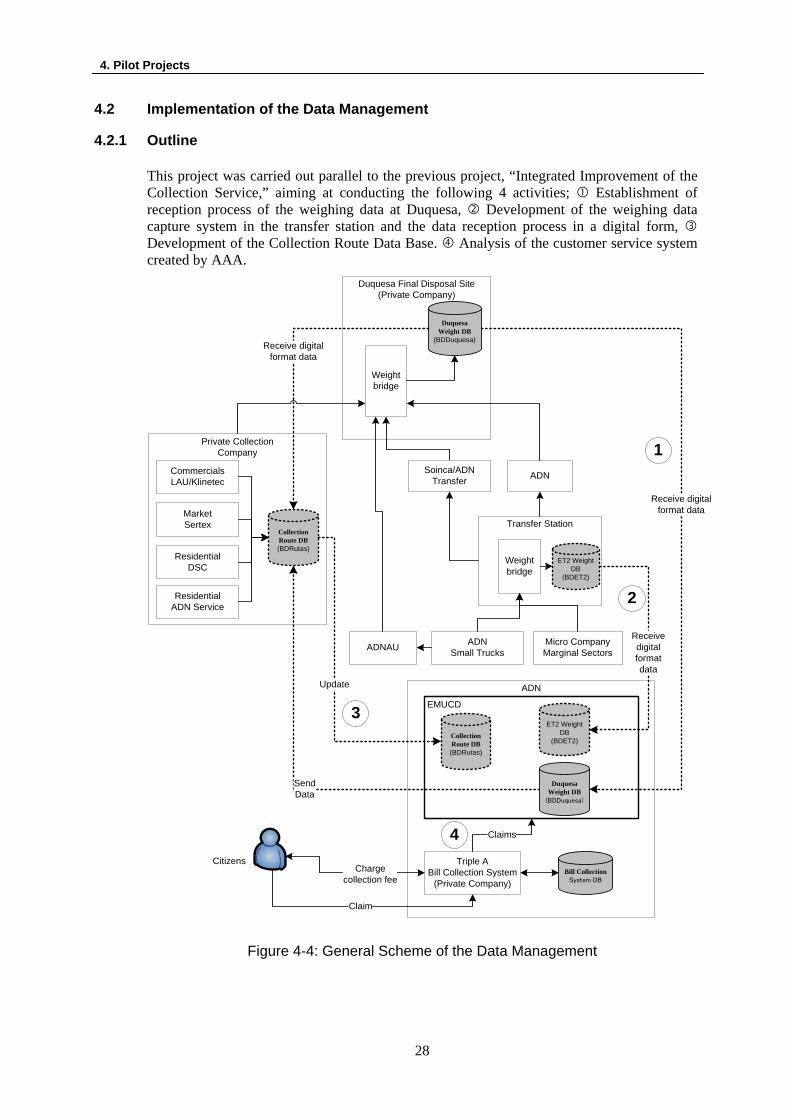
4.2 Implementation of the Data Management
4.2.1 Outline
This project was carried out parallel to the previous project, “Integrated Improvement of the Collection Service,” aiming at conducting the following 4 activities; Establishment of reception process of the weighing data at Duquesa, Development of the weighing data capture system in the transfer station and the data reception process in a digital form, Development of the Collection Route Data Base. Analysis of the customer service system created by AAA.
Duquesa Final Disposal Site(Private Company)
ADNSmall Trucks
ResidentialDSC
Transfer Station
Weightbridge
DuquesaWeight DB
(BDDuquesa)
CommercialsLAU/Klinetec
DuquesaWeight DB
(BDDuquesa)
MarketSertex
ADNAU
Soinca/ADN Transfer ADN
Micro CompanyMarginal Sectors
ResidentialADN Service
Private Collection Company
Citizens
EMUCD
Triple ABill Collection System
(Private Company)
ADN
Bill CollectionSystem DB
Chargecollection fee
Weightbridge
ET2 Weight DB
(BDET2)
CollectionRoute DB(BDRutas)
Receive digitalformat data
CollectionRoute DB(BDRutas)
Update
ET2 Weight DB
(BDET2)
Receive digitalformat data
SendData
Claim
1
2
3
4
Receive digitalformat data
Claims
Figure 4-4: General Scheme of the Data Management

4.2. Implementation of the Data Management
29
4.2.2 Results
a. Established Systems
The project established the following systems.
Reception process of the data from Duquesa
With this system, EMUCD can easily update the weighing data at Duquesa. The collection company of the National District and of the other municipalities was able to receive the weighing data in digital form. This facilitates their administration process.
DBTS2 System With this system, it became possible to record all weighing data of vehicles entering the transfer station and issue tickets for the registered data. Also it became possible to instantly export the data to the EMUCD.
Route DB System This system makes it possible to record and analyze the data of collection works. Also it helps to dispatch trucks.
Analysis of the customer service system generated by AAA
This system was established aiming at responding to complaints from service users. This made it possible to identify the complaints with collection routes.
b. Training
Training for use of the established systems was conducted as follows.
Counterpart Hugo Perez worked in the whole process, and he is in charge of continuously maintaining and improving the systems. Heisor Arias was trained in processing data at Duquesa and in managing weighing data.
Duquesa The system administrator was trained to export the weighing data to the EMUCD.
Transfer Station 2 3 operators were trained to use the weighing system at DBTS2.
ADN Services The RouteDB was installed, and the system administrator was trained to use it.
ADNAU The RouteDB was installed, and the Administrative Manager and the operator were trained to use it.
4.2.3 Recommendations
• Regarding the reception of data from Duquesa, at this moment the information is received by magnetic media which are brought by the supervisor manager of Duquesa. Consider the possibility of accessing the Internet from Duquesa and data transmission through the internet.
• Regarding the Transfer Station, once the construction is finished, consider the possibility of transmitting data to the EMUCD through the Internet.
• Regarding the RouteDB, continue to process the data from ADN Service and ADNAU, also commence the same work with the other collection companies.
• Regarding the complaints, once the collection routes have been established, upgrade the client file with corresponding route codes.

4. Pilot Projects
30
4.3 Promotion of the Citizen Participation
4.3.1 Outline
The main purpose of the Pilot Project was to build a model to provide SWM through providing information to residents, such as information about the waste collection service and discharge methods, and to reinforce the communication of ADN with the residents through this model's construction.
Also, the Pilot Project supported the previously mentioned Collection Improvement Pilot Project. In synthesis, one of the objectives in the development of the new collection service was to clearly transmit the information to the residents, to encourage residents to discharge waste in an appropriate way on the established days.
The Pilot Project was carried out in sectors 5 and 6. For descriptive purposes the first project (in Sector 6) was called the Pre- Pilot Project and the second (in Sector 5) was called the Pilot Project. The Pre- Pilot Project (PPP) started on October 30, 2005, and the Pilot Project (PP) began on June 19, 2006.
a. Overall Goal
• Formulation of an information transmission model to the citizens in relation to the collection service, discharge methods and aspects related to SWM.
b. Project Purpose
• The residents of sectors 5 and 6 can access information about the SW collection service, discharge methods and other aspects of SW management, and they can understand the information.
c. Expected Outputs 1. Understanding of the situation through communication between ADN and residents. 2. ADN's capacity as information and service provider to the residents is strengthened. 21. ADN acquires the capacity to inform the residents of the waste collection frequency,
schedule and discharge methods. 22. The citizens obtain information regarding the collection days and hours, and discharge
methods (only in the PPP area) from loudspeaker vehicles. 23. The citizens can understand the concept of the basic rules of the SWM (PP area)
through posters. 24. Through advertising signboards the citizens are aware of the concept of "Clean City
Project” (PP area). 25. Through the Neighbors Committee, the citizens receive information about the
collection days and hours, discharge methods, and they can understand the concept of the basic rules of SWM.
26. Complaints about the collection service are decreased. d. Activities 1. Survey and analysis of communication between the mass media and the citizens
regarding SWM (Neighbors Committee and others). 2. Strengthening of ADN as a provider of information and service to the citizens. 21. Preparation and distribution of flyers. 22. Preparation and distribution of posters. 23. Preparation and distribution of advertising signboards. 24. Organization for information meetings with the Neighbors Committee and similar
groups.


4. Pilot Projects
32
f. Information Flow The information tools presented previously were distributed to the citizens by each organization. The figure shows the flow of information to the resident.
Figure 4-6: Flow of the Resident Information
Flyers, posters
Banners/ signboards
Meeting with NC
RE
SID
EN
T Personal call
Automatic System
Message / invoice
Delivery of letters
Flyers, posters,
Opinion survey
Urban Animation
Volunteers of Youth
Department
EMUCD
AAA Dominicana
Reception of claims

4.3. Promotion of the Citizen Participation
33
4.3.2 Results
a. Information tools
Several information tools were used to communicate with the residents. The designed information tools below were presented and produced to promote the citizen participation.
Flyer (front) Flyer (back) Poster
Signboard installed Design 1 Design 2
Design 3 Design 4 Design 5
4. Pilot Projects
34
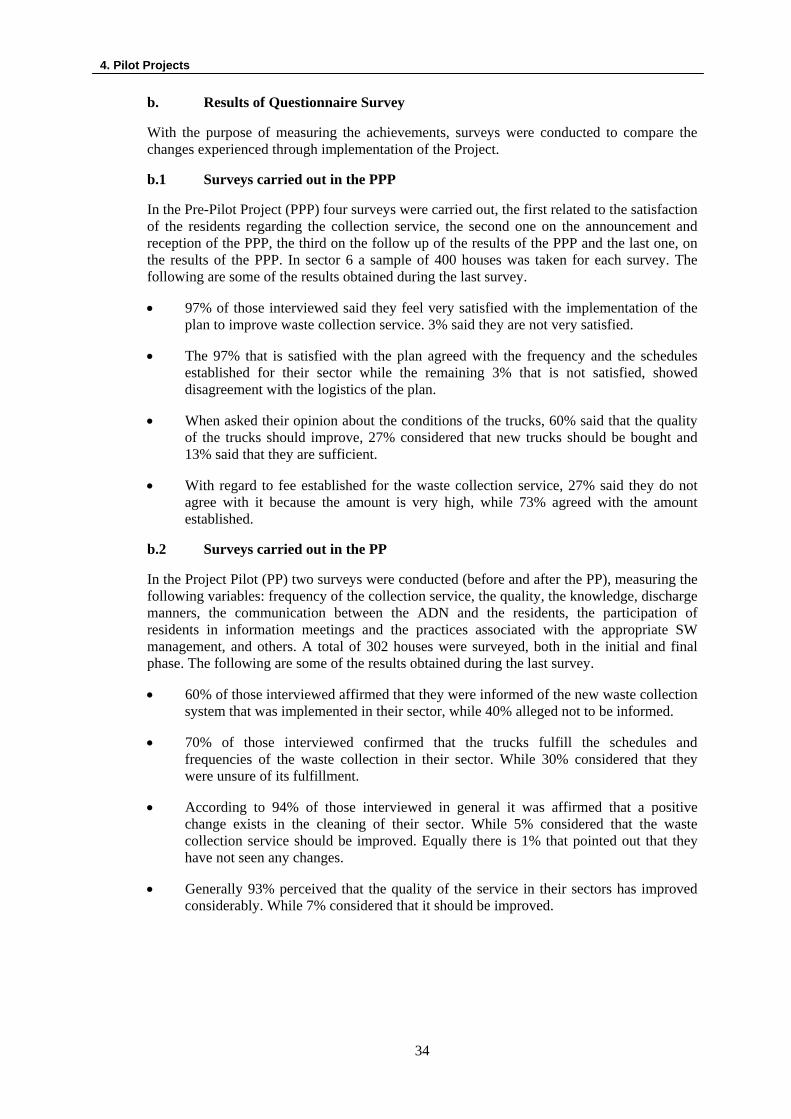
b. Results of Questionnaire Survey
With the purpose of measuring the achievements, surveys were conducted to compare the changes experienced through implementation of the Project.
b.1 Surveys carried out in the PPP
In the Pre-Pilot Project (PPP) four surveys were carried out, the first related to the satisfaction of the residents regarding the collection service, the second one on the announcement and reception of the PPP, the third on the follow up of the results of the PPP and the last one, on the results of the PPP. In sector 6 a sample of 400 houses was taken for each survey. The following are some of the results obtained during the last survey.
• 97% of those interviewed said they feel very satisfied with the implementation of the plan to improve waste collection service. 3% said they are not very satisfied.
• The 97% that is satisfied with the plan agreed with the frequency and the schedules established for their sector while the remaining 3% that is not satisfied, showed disagreement with the logistics of the plan.
• When asked their opinion about the conditions of the trucks, 60% said that the quality of the trucks should improve, 27% considered that new trucks should be bought and 13% said that they are sufficient.
• With regard to fee established for the waste collection service, 27% said they do not agree with it because the amount is very high, while 73% agreed with the amount established.
b.2 Surveys carried out in the PP
In the Project Pilot (PP) two surveys were conducted (before and after the PP), measuring the following variables: frequency of the collection service, the quality, the knowledge, discharge manners, the communication between the ADN and the residents, the participation of residents in information meetings and the practices associated with the appropriate SW management, and others. A total of 302 houses were surveyed, both in the initial and final phase. The following are some of the results obtained during the last survey.
• 60% of those interviewed affirmed that they were informed of the new waste collection system that was implemented in their sector, while 40% alleged not to be informed.
• 70% of those interviewed confirmed that the trucks fulfill the schedules and frequencies of the waste collection in their sector. While 30% considered that they were unsure of its fulfillment.
• According to 94% of those interviewed in general it was affirmed that a positive change exists in the cleaning of their sector. While 5% considered that the waste collection service should be improved. Equally there is 1% that pointed out that they have not seen any changes.
• Generally 93% perceived that the quality of the service in their sectors has improved considerably. While 7% considered that it should be improved.

4.3. Promotion of the Citizen Participation
35
4.3.3 Conclusions and Recommendations
a. Conclusions
a.1 Achievements of Results Expected
Before the pilot project, communication between the EMUCD and the residents consisted only of receiving residents' complaints through Triple A. For the implementation of the project, 2 people from the C/P were assigned for Customer Service. They acquired several abilities such as coordinating with departments related to communication with the residents, and also how to design and distribute information tools and how to carry out meetings with the neighbors committee.
The Environmental Information Center has facilities available where residents can meet and is equipped with a projector and a computer donated through the cooperation of JICA. In the pilot project the facilities worked in a satisfactory way to carry out the meetings with the Neighbors Committee.
The results of the survey carried out for the residents showed that the flyers have been very effective for communicating information to the residents. A great number of the flyers were distributed directly by volunteers from the Youth's Department. This direct distribution, person to person, revealed the importance and the effectiveness of the communication of information.
The Urban Animation and Citizen Education Directorate controls the private companies that operate the means of advertising that are placed in public roads and the bus stops. It was verified that these means turned out to be very effective for publicizing SWM.
The Communication and Press Directorate is in charge of the communication and press of the Municipality. They can inform the media about Customer Service activities, as well as diffuse the achievements, actions and projects to the community in general through the massive means of communication.
AAA DOMINICANA S.A. carried out important work in the Pilot Project carrying out several activities like sending flyers to the residents jointly with the invoices, sending notes in invoices with information of the new service and distributing posters in places where the quota of the service is paid (pharmacies and other places) and carrying out a survey of residents through telephone calls. The work carried out was reliable and of high quality.
a.2 Achievements of the Goal and Purpose of the Project
From the results of the resident survey, it was possible to detect that the majority of the residents have had access to the information about the new service. Besides, the information was well communicated, and the residents had knowledge of the collection day and also the appropriate behavior for discharging waste and other related aspects. Therefore, the different information tools such as flyers, posters and the contents used to communicate the information were very suitable for the purpose of the project.
However, approximately 40% of the residents of the PP area do not have knowledge of the implementation of the new service and this suggests the necessity of the communication of additional information.
On the other hand, the objective of the project was to build a model to communicate the information about SWM to residents, and through the implementation of the Pilot Project, reinforce the capacity of the ADN to communicate with residents. Thus in that sense, it has carried out the communication of the ADN to the residents. There are several departments related, and through appropriate coordination they can work well.

4. Pilot Projects
36
First to mention that, through the implementation of the Pilot Project it has become evident that Triple A has the facilities in their organization for communication with the residents, for example receiving and assisting complaints and through these daily activities, they accumulate many knowledge and related techniques.
b. Recommendations
• To improve coordination among the related departments in the ADN, including to Triple A, the Customer Service of the EMUCD should reinforce these facilities continually. It is recommended that the activities carried out in the Pilot Project are transformed from special events to routine activities through the preparation of an activities manual and begin the classification of the details of the activities and functions of the office.
• There is the problem in the departments in the municipal offices of not having with opportunely funds that are essential to carry out the activities. Therefore, it is suggested that a Mixed Fund is created with the Triple A to subsidize the costs of information materials such as flyers and posters.
• The production of the information materials does not require big costs, except some design aspects. The JICA Study Team has given all the negatives, original sheets and CD for the reproduction of the information materials. Therefore, the Environmental Management and Urban Cleansing Directorate within their financial possibilities or through the Mixed Fund can follow-up the production of the information materials for other sectors of the National District.

4.4. Environmental Education
37
4.4 Environmental Education
4.4.1 Outline
Environmental education activities focusing on minimization were implemented in two periods: from October to November 2005 and from January to February 2006. Members of the C/P, teachers, and primary school students participated in these activities. The following table shows environmental education activities.
Table 4-2: Environmental Education Activities in the PPP Area Date Activity Content Organized by: Participants
(2005) November 23
Training Workshop (17 C/P persons)
Training Workshop for C/P personnel Waste minimization for a Clean City
JICA Study Team Personnel from ADN SEE SEMARN ONG
(2005) December 8
Training Workshop (practice)
Training Workshop for high school students. Waste minimization for a Clean City
C/P Team (ADN, SEE, SEMARN)
Students from Victor Garrido School
(2006) January 27
1st. Training Workshop (17 teachers)
1st. Training Workshop for primary school teacher in PPP Area. Waste minimization for a Clean City
ADN, SEE, SEMARN
Teachers from the following Schools:
San Jose Rosa Duarte Domingo Savio F.X.Billini Victor Garrido Movearte Rafaela
Santaella (2006) February 7 February 10 February 15 February 17 February 21 February 23 February 28
School Workshops
Experimental Workshops about waste management by teachers for primary school students
Schools: San Jose Rosa Duarte Domingo
Savio F.X.Billini Victor Garrido Movearte Rafaela
Santaella
Studens Special Guests, Parents association, teachers from other schools
(2006) March 1st
2nd. Training Workshop (25 teachers)
2nd. Training workshop for primary school teachers in PPP Area Waste minimization for a Clean City
ADN, SEE, SEMARN
Teachers from Private Schools in PPP Area.
After March 2006
School Workshops
Experimental Workshops about waste management by teachers for students in primary schools
Private Schools Students Special Guests

4. Pilot Projects
38
4.4.2 Conclusions and Recommendations
One of the main achievements from the environmental education pilot project was the integration and participation of different government entities such as ADN, Ministry of Education, Ministry of Environment and Natural Resources, and NGO’s among others.
Another achievement obtained through environmental education, in addition to having a better knowledge on adequate waste management, was the participation and exchange of knowledge and ideas among the different schools in the PPP area.
Through the integration of the different entities a series of workshops were conducted for environmental education; the first training was focused on the entities themselves and, subsequently, teachers of seven primary schools in the PPP area were trained by C/P personnel. Finally, teachers who received training conducted experimental classes in their respective schools.
The Center for Environmental Information (CEI) of ADN has been assigned to continue environmental education activities. After the first workshop for teacher, C/P personnel from ADN, SEE, and SEMARN conducted by themselves a second workshop for teachers at the beginning of March 2006; for this workshop, seven (7) private primary schools participated.
It is expected that in the near future, ADN through CEI continues environmental education activities jointly with other related entities.

5.1. Population
39
5 Preconditions for Planning This chapter shows the fundamental conditions and issues for preparation of the Master Plan.
5.1 Population
The following table is the population forecast employed for planning the Master Plan.
Table 5-1: Population Forecast
Circumscription Year 1 2 3 Total
2005 340,024 256,254 384,375 980,653 2006 344,869 259,906 389,852 994,627 2007 349,784 263,609 395,408 1,008,801 2008 354,768 267,366 401,042 1,023,176 2009 359,824 271,176 406,757 1,037,756 2010 364,951 275,040 412,553 1,052,544 2011 370,152 278,959 418,432 1,067,543 2012 375,426 282,934 424,395 1,082,756 2013 380,776 286,966 430,443 1,098,185 2014 386,202 291,055 436,576 1,113,834 2015 391,706 295,203 442,798 1,129,706
5.2 Economics and Finance
a. Economic Growth
The growth rates of the gross regional product (GRP) in the National District during the Master Plan period were assumed to be as follows.
Table 5-2: Projection of GRP Growth Rates
Year Growth Rate (%) 2005 5.5 2006 5.5 2007 4.8 2008 4.7 2009 4.5 2010 4.4 2011 4.2 2012 4.0 2013 3.9 2014 3.7 2015 3.5

5. Preconditions for Planning
40
b. Ability to Pay (ATP) and Willingness to Pay (WTP)
The ATP and the WTP shown in the table below were used for the financial evaluation of the Master Plan. The analysis of ATP and WTP resulted in the same values.
Table 5-3: Summary of ATP and WTP by Household Income Group
Household Income Categories Household Distribution (%) ATP (RD$/month) No ATP 20 0 Poor 30 50 Low 20 100 Medium low 10 125 Medium high 10 175 High 10 200
Source: POS, Central Bank
c. Grants to Local Governments
Law 166 of October 6, 2003 established in Article 1 the participation of municipalities and municipal districts in the income of the Central Government. This participation was set at 8% of the income of the Central Government in 2004, and 10% starting in 2005 (Article 3). Article 4 states that the participation amount would be distributed monthly, as one-twelfth of the yearly amount, calculated in terms of the population size in each municipality relative to the total population of the country, according to the latest Population Census carried out by the National Statistics Office (ONE).
Of the 2005 ADN budget amounting to 1,701 Million RD$, Law 166-03 contributed 1,338 Million RD$ or 78% of the total income.
Article 10 establishes the way in which municipalities can use the funds received through Law 166-03, setting the following limits:
(a) 25% for personnel expenses, permanent or temporary (b) 35% for operating expenses and municipal services like solid waste management (c) 40% for investment and capital expenses, including 2% to be set aside for the
preparation of plans and projects for municipal development Applying the above percentages to the 2005 ADN budgeted income of 1,338 Million RD$ provided by Law 166-03, the fund could be used as follows.
(a) Personnel expenses: 335 Million RD$ (US$ 9.6 Million) (b) Municipal services: 468 Million RD$ (US$13.4 Million) (c) Investment: 535 Million RD$ (US$15.3 Million)

5.3. Final Disposal Site
41
5.3 Final Disposal Site
The Duquesa disposal site is located in the Municipality of Santo Domingo Norte at approximately 18 km to the northwest of the National District. It currently receives waste from the Municipalities of Santo Domingo Norte, Santo Domingo Oeste, Santo Domingo Este and National District.
Figure 5-1: Location of Duquesa Disposal Site It is technically estimated that Duquesa would operate until 2016 or 2017. However, there is the concern that it may not be possible to heap up the waste as planned and the ground may slip due to cumulated waste. In addition, there is a fear that safety hazards might occur for the new airport nearby due to fires and birds. Then, there is the risk that Duquesa might be closed earlier than its life period. Consequently, this Master Plan considers two options as follows.
Master Plan 1 (MP1): Duquesa operates until 2015
Master Plan 2 (MP2): Duquesa is closed by the end of 2011 and a new landfill that locates at 40 km away from the center of the city operates from 2012*
* The assumption of a new landfill location, i.e., at 40 km away from the center of the city, was established on a mutual agreement between the Dominican side and the Japanese side during the discussion on the Inception Report as described in the Minutes of Meetings signed on 12 August 2005.

6. Selection of an Optimum Scenario
42
6 Selection of an Optimum Scenario 6.1 Selection of an Optimum Scenario
The SWM principally has three roles, i.e., (1) to collect waste to maintain a healthy living environment, (2) to dispose of waste in an environmentally-sound manner, (3) to minimize the waste amount to reduce burden on the SWM system and to contribute to
the conservation of resources. The above roles shall be efficiently fulfilled.
Taking into account the SWM roles, some scenarios have been set up as shown in the table below. Scenario 0 is “Baseline,” Scenario 1 is “Conservative,” Scenario 2 is “Progressive,” and Scenario 3 is “Radical.” Also, the Master Plan period between 2007 and 2015 is divided as shown in the table.
Table 6-1: Scenario Setting
Scenario Short term
by 2008 Medium term
by 2011 Long term by 2015
0 (Baseline)
• 90% with irregular collection service • no waste minimization
• 90% with irregular collection service • no waste minimization
• 90% with irregular collection service • no waste minimization
1 (Conservative)
• 90% with regular collection service • no waste minimization
• 95% with regular collection service • no waste minimization
• 100% with regular collection service • no waste minimization
2 (Progressive)
• 95% with regular collection service • Minimization rate at 7%
• 100% with regular collection service • Minimization rate at 10%
• 100% with regular collection service • Minimization rate at 15%
3 (Radical)
• 95% with regular collection service • Minimization rate at 7%
• 100% with regular collection service • Minimization rate at 13%
• 100% with regular collection service • Minimization rate at 24%
Scenario 3 is best performing the SWM roles, i.e., to collect waste to maintain a healthy living environment, and to minimize the waste amount to reduce the burden on the SWM system and to contribute to resource conservation. In addition, it is the second least costly.
Scenario 3 requires appropriate participation of waste dischargers in separate collection. Otherwise the MRF does not perform successfully. Furthermore, this scenario requires intensive investment for construction of the MRF and a certain level of technical capability to operate it.
Scenario 2 is the least costly. Although it requires investment in the composting facility, the cost is low due to its size of the facility. There are some methods of composting. It has a high adaptability to various conditions.
Scenario 1 is not recommended due to its high cost without any minimization. As for Scenario 0, there is no room for consideration. The current situation must be improved.
Consequently, Scenario 2 is recommendable as the optimum scenario taking into account the above discussions.

7.1. Outline
43
7 Description of the Master Plan 7.1 Outline
a. Basic Concept
a.1 Guiding Principle
The Master Plan assumes a part of ADN’s “Mission” and contributes to the realization of its “Vision.”
Vision: The National District is an environmentally sustainable space where its residents progressively improve their quality of life in a cultural, healthy, rich and diverse environment, and where the public and collective interests are the fundamental references for participatory municipal management.
In particular, ADN has a vision in the field of Municipal Solid Waste Management, i.e., “Clean City (Ciudad Limpia).”
Mission: To make the National District a clean, orderly and socially educated territory, with the lowest environmental contamination level to increase the city of Santo Domingo de Guzman’s residents and the visitors’ quality of life.
a.2 Basic Approach
The basic approach of the Master Plan is the “collaboration between the municipal government, the citizens and the private sector” in order to establish a sustainable solid waste service with satisfactory quality.
Collaboration means that each party plays their respective role. ADN has to provide a proper solid waste service to the citizens and to supervise the private sector, the citizens have to discharge waste appropriately and pay for the service, and the private sector has to operate the solid waste service in accordance with the contracts.
Figure 7-1: Collaboration between the Municipal Government, the Citizens and the Private Sector
Municipal Government: To provide proper solid
waste service to the citizens and to supervise the private
Citizens: To discharge waste
appropriately and to pay for the service
Private Sector: To operate the solid waste
service according to the contracts
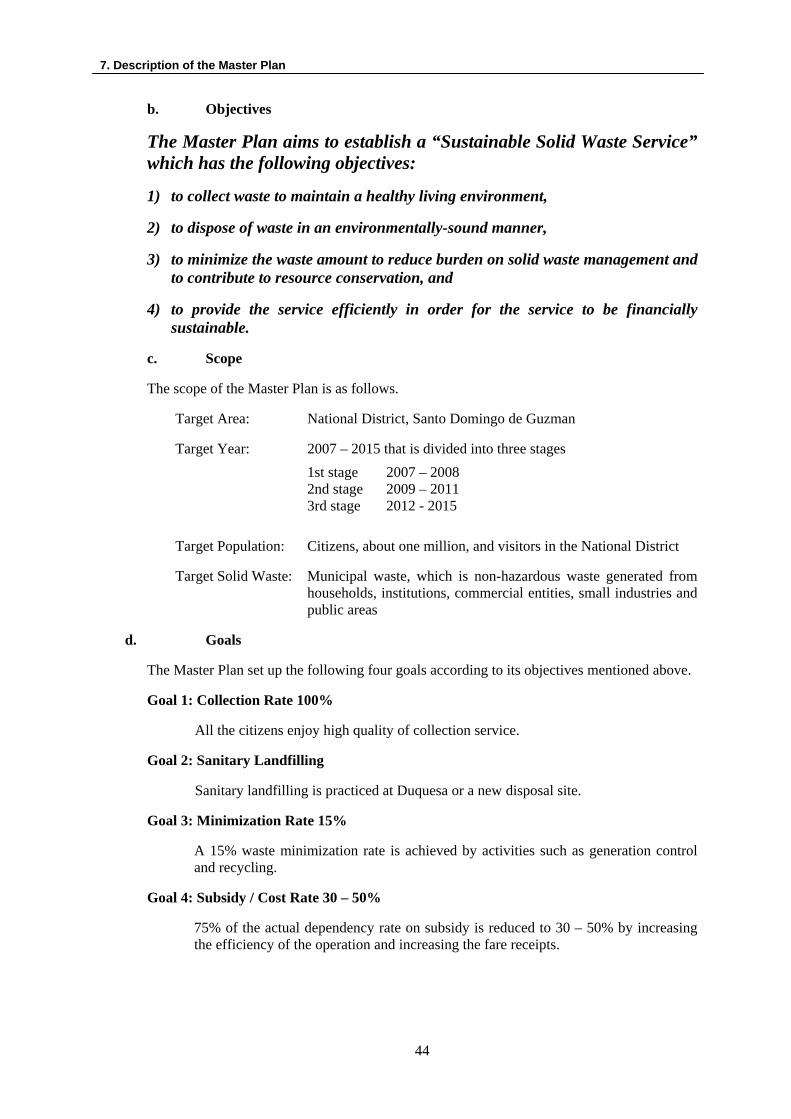
7. Description of the Master Plan
44
b. Objectives
The Master Plan aims to establish a “Sustainable Solid Waste Service” which has the following objectives:
1) to collect waste to maintain a healthy living environment,
2) to dispose of waste in an environmentally-sound manner,
3) to minimize the waste amount to reduce burden on solid waste management and to contribute to resource conservation, and
4) to provide the service efficiently in order for the service to be financially sustainable.
c. Scope
The scope of the Master Plan is as follows.
Target Area: National District, Santo Domingo de Guzman
Target Year: 2007 – 2015 that is divided into three stages 1st stage 2007 – 2008 2nd stage 2009 – 2011 3rd stage 2012 - 2015 Target Population: Citizens, about one million, and visitors in the National District
Target Solid Waste: Municipal waste, which is non-hazardous waste generated from households, institutions, commercial entities, small industries and public areas
d. Goals
The Master Plan set up the following four goals according to its objectives mentioned above.
Goal 1: Collection Rate 100%
All the citizens enjoy high quality of collection service.
Goal 2: Sanitary Landfilling
Sanitary landfilling is practiced at Duquesa or a new disposal site.
Goal 3: Minimization Rate 15%
A 15% waste minimization rate is achieved by activities such as generation control and recycling.
Goal 4: Subsidy / Cost Rate 30 – 50%
75% of the actual dependency rate on subsidy is reduced to 30 – 50% by increasing the efficiency of the operation and increasing the fare receipts.

7.1. Outline
45
These four goals are challenging taking into account the current MSWM in the National District.
Goal 1, a collection rate of 100%, is considerably challenging taking into account the current situation where waste is accumulated and scattered everywhere. In particular, it will be difficult to establish a proper collection system in the marginal area in which it is difficult for collection vehicles to pass. This issue will be the key for attaining the goal.
As for Goal 2, it is uncertain if Duquesa could receive waste and operate until 2015. Therefore, The M/P prepares two scenarios. MP1 assumes to use Duquesa until 2015. The other, MP2, supposes to use Duquesa until 2011 and to operate a new landfill from 2012.
Goal 3, 15 % minimization rate, is also a considerably challenging goal, taking into account the current situation where almost no official recycling activities are practiced. However, there is a need for waste minimization from the viewpoints of reducing burdens on the MSWM and of resource conservation, as waste generation rate per person in the Study Area exceeds 1.5 kg per day which is at the level of industrialized countries.
The rate of dependence to the subsidy is set to 30 – 50% by Goal 4. The reason why there is such a range is due to disagreement among the basic data of the Census, Triple A and others such as number of families. It is recommendable to continue data collection and analysis and to review the goal during the implementation of the M/P.
The Master Plan sets its goals as shown in the table below.
Table 7-1: Goals of the Master Plan
Item 1st stage 2008
2nd stage 2011
3rd stage 2015
Collection rate 95% 100% 100% Final Disposal Improved operation at
Duquesa Improved operation at Duquesa
Improved operation, at Duquesa or a new sanitary landfill
Waste Minimization 8% 10% 15% Financial soundness 30-50% 30-50% 30-50%
Collection
Existing T/S (Villa Agricola)
Duquesa
Direct Transport (large vehicles)
MP1
Collection
Existing T/S (Villa Agricola)
New landfill
MP2
Transfer Transport (small vehicles)
New T/S
*T/S: Transfer Station

7. Description of the Master Plan
46
Selection of MP1 or MP2
As described in the “Minutes of Meetings on the Draft Final Report” the Dominican side will establish evaluation items by the end of January 2007, then choose one of them by the end of June 2007, although the Dominican side considers the MP2 as a priority scenario.
It is recommendable to take into account the followings for establishing the evaluation items.
1. Environmental Impact Declaration
The Consortium Duquesa presented an Environmental Impact Declaration to the Secretariat of State for the Environment and Natural Resources in June 2006 with the purpose of regularizing the situation of the final disposal site and expanding its useful life. However, the operation was transferred from the Consortium to the Municipality of Santo Domingo Norte in September 2006 while the Secretariat was evaluating the EID. ADN should clarify if the EID was approved by the Secretariat.
2. Topographic Survey
There not exists a reliable topographic map so as accurately to estimate a remaining capacity of the landfill. A topographic survey should be carried out to obtain a map having a measuring scale between 1/1,000 and 1/2,500.
3. Landfilling Plan
A detailed landfilling plan should be prepared on the map mentioned above and taking into account characteristics of foundation, stability of waste mass, required capacity for leachate storage, etc. as mentioned in the Action Program 401. Then, a remaining capacity should be calculated and a useful life should be established on the basis of the map and the plan.
4. Isabera Airport
The distance between the Duquesa and the Isabera Airport is too short to comply with the requirement established in the law, “Norma para la Gestion Ambiental de Residuos Solidos (NA-RS-001-03).” It should be clarified if this point may influence the useful life of the Duquesa. It always takes a long time to construct a new landfill for establishing a consensus among stakeholders, funding, planning, designing, etc. Therefore, it is recommendable to seek for a site for a future landfill as early as possible, even if the MP1 would be chosen. The Action Program 402, “Landfill Site Selection”, can be of assistance to find an adequate site for a new landfill.

7.1. Outline
47
e. The Master Plan
The Master Plan is summarized in the table below.
Table 7-2: The Master Plan Phase Present Phase 1 Phase 2 Phase 3
Components (2005) (2008) (2011) (2015) 0. Population 980,653 1,023,176 1,067,543 1,129,706 I Principal Indicators Collection rate in weight 95% 98% 100% 100% Collection rate in population 90% 95% 100% 100% Collection service quality Low High High High Final disposal Duquesa Duquesa Duquesa Duquesa (New) Minimization 7% 8% 10% 15% II Waste Stream (ton/day) 1 Generation potential 1,529 1,595 1,664 1,761 2 Generation control 0 16 33 53 3 Generation 1,529 1,579 1,631 1,709 4 Discharge 1,489 1,538 1,547 1,527 5 Self-disposal 7 7 7 8 6 Recycling at source 33 34 77 174 7 Collection 1,412 1,499 1,546 1,526 81 Transport - direct 996 1,057 1,094 1,053 (0) 82 Transport - transfer 416 442 452 440 (1,492) 9 Direct haul 1 1 1 1 10 Clandestine dumping 76 38 0 0 111 Compost in 0 0 20 51 112 Compost residue 0 0 7 18 113 Compost product 0 0 2 5 114 Compost reduced 0 0 13 33 12 Haulage into disposal site 1,413 1,500 1,534 1,494 13 Recycling at disposal site 69 72 33 0 14 Final disposal 1,344 1,428 1,501 1,494 15 Minimization 109 129 164 268III Discharge, Collection and Transport a. Nos. of containers Urban area - 2,969 3,043 2,962 Marginal area - 1,906 1,953 1,901b. Nos. of collection vehicles (compactor) Ordinary Area 20yd3 - 63 65 63 (53) Marginal Area 6yd3 - 40 41 40 (40)c. Transfer station 1 (existing) 1 (2) VI Public area cleansing a. Sweeping Manual Manual b. Street trees pruning - Prevention of hurricanes V Final Disposal a. Operation quality Low Middle Middle High VI Minimization
a. Generation control - - Environmental education, application of weight/volume based tariff
b. Recycling at source - - In operation In operation c. Composting - - In operation In operation VII Cost a. Cost per year (1,000US$) - 24,943 25,829 25,603 (29,693)
Numbers in parenthesis are MP2.


7. Description of the Master Plan
50
7.2 Strategies
The following six strategies are recommended to attain the M/P Goals. Strategy 1: To establish legal infrastructure Strategy 2: To strengthen organization Strategy 3: To establish order in the collection service market Strategy 4: To built a consensus among the municipalities in the Metropolitan Area Strategy 5: To begin the 3Rs and to apply the principle of Extended Producer Responsibility Strategy 6: To apply the Polluter Pay Principle, but to consider the poor
Strategy 1: To establish legal infrastructure
To establish an infrastructure that legally supports the M/P.
Strategy 2: To strengthen the management organization
To strengthen the functions of ADN so as to properly manage the MSWM system, in which various actors, such as the citizens as waste dischargers and the private companies as SW service operators, are elaborately related each other.
Strategy 3: To establish order in the collection service market
To establish order in the collection service market, where various SW service operators including ADN are currently working in a disorderly manner.
Strategy 4: To built a consensus among the municipalities in the Metropolitan Area
To built a consensus among the municipalities about final disposal such as improvement of Duquesa and construction of a new landfill which are issues for the whole Metropolitan Area.
Strategy 5: To begin the 3Rs and to apply the principle of Extended Producer Responsibility
In order to encourage waste minimization, to conduct environmental education for the 3Rs and to practice waste minimization, such as pet-bottle recycling with the initiative of manufactures.
Strategy 6: To apply the Polluter Pay Principle, but to consider the poor
To ask for payment corresponding to the cost of the MSWM to business entities and the citizens who have the ability to pay applying the Polluter Pay Principle, but use the subsidy for citizens who do not have the ability to pay for the cost.


7. Description of the Master Plan
52
7.3 Institutional System
This section presents recommendations concerning legal system, organization, public-private partnership, financial management, and communication with the community residents.
7.3.1 Legal System
a. Municipal Regulation for Cleansing
A new municipal regulation, Municipal Regulation for Cleansing was established under the jurisdiction of ADN with the cooperation of JICA in August 2006. This Regulation will regulate relations among the Municipality, their citizens, clients and lenders of the private sector hired or authorized, in the public service of the integral solid waste management and in the cleaning maintenance of the National District.
The Regulation will facilitate the achievement of the following:
• Establish norms regarding the service, costs and tariff, which are “rules of the game” that will be useful as guide for the interaction of all the actors
• Formulate an administrative structure that facilitates the performance of the actors to gain efficiency
• Fulfill the existing legislation in the country related to the Political Constitution, General Law of Environment and Natural Resources, General Law of Health, Law No. 120-99, Non Hazardous Solid Waste Management Norm, Municipal Resolutions
• Provide and encourage high levels of health protection and environmental preservation • Assure that administrative procedures will be available to cover or sanction the
infractions • Prevent waste generation, find value in waste • Promote harmonized participation of the organizations, which compose the social capital
of ADN and structure the Special Commission of the Integral Solid Waste Management • Encourage the big generators of solid waste to appreciate their responsibility, “Polluter
Pays Principle” • Regulate the participation of the private sector to achieve adequate service quality and
reasonable price through contests that assure a total transparency • Structure a communication system with the clients of the service to meet their demands
and receive their suggestions • Encourage the creation of Ornate and Cleansing Commissions in each Neighbors
Committee • Subsidize the families identified as being under the poverty line in the payment of their
invoices for the service provided • Protect the personal security and health of the public servants that attends the service. Full text of the Municipal Regulation for Cleansing is found in the Supporting Report, Volume III.

7.3. Institutional System
53
7.3.2 Organization
a. Organizational Strengthening of ADN
The enforcement of the newly established Municipal Cleansing Regulation requires ADN to strengthen its organization. This applies to two levels. One level refers to the cooperation among Directorates within ADN, while the other refers to the strengthening of EMUCD, the office in charge of implementing the MSWM. Further, the Regulation recommends the creation of a Advisory Committee in order to improve the transparency of SWM.
a.1 Directorate Level
The Table below indicates the main roles of the different Municipal Directorate offices with regards to MSWM.
Table 7-3: General Functions of ADN Directorates
Directorate General Functions regarding MSWM Institutional Commission of the Strategic Plan
Incorporate the “Integrated Solid Waste Management Plan in Santo Domingo de Guzman, National District, Dominican Republic” prepared with the cooperation of JICA as part of the strategic axis of the Environmental Quality Management in the Strategic Plan of Santo Domingo City.
Juridical Advisory Directorate Advisory, elaboration and/or revision of the aspect and juridical process in the institutional strengthening of the ADN associated with the integral solid waste management.
Human Development Directorate
Facilitate and achieve the citizen participation in the provision of the service of the integral solid waste management.
Planning and Institutional Development Directorate
Guide the strengthening process of the administrative capacity of ADN in the integral solid waste management.
Quality Management Directorate
Establish and keep the evaluation and quality control system of the integral solid waste management service.
Audit Directorate Inspect the financial and administrative operations associated to the lenders of the solid waste management services, considering what is stipulated in the Non hazardous Solid Waste Management Regulation, in other regulation applicable, in the contract subscribed by the private sector, the internal norms of the government audit and the specialized provisions of the General Controllership of the Republic.
Technology and Information Directorate
Give technical support to the different administrative units that participate in the solid waste management.
Financial Directorate Assure the correct registration of the financial movements, establish the real cost of the service and the allocation of the financial resources for the provision of the solid waste management service.
Urban Planning Directorate Incorporate in the urban planning process the requirement of the integral solid waste management.
Human Resources Directorate
Strengthen the personnel aptitude for the solid waste management through the application of the measures guided to improve the performance, protect the health and keep the best labor climate.
Equipment and Transport Directorate
Achieve the higher level of use of the vehicles assigned to the solid waste management service.
Environmental Management and Urban Cleansing Directorate and its Dependencies
The EMUCD will manage the integral solid waste management generated in the National District. This Directorate shall take initiative in communication among Directorates regarding MSWM.
a.2 EMUCD
EMUCD organization is composed of the following five Departments: Urban Cleansing, Ornament and Public Embellishment, Prevention and Reduction of Vulnerability, Environmental Quality and Contamination Prevention, and Environmental Information

7. Description of the Master Plan
54
Center.
The Urban Cleansing Department is responsible for MSWM. The Master Plan makes the following recommendations concerning the organization structure and functions of the said Department.
a.2.1 Urban Cleansing Department
The Urban Cleansing Department is to be organized into the following four Units: Administration and Development Unit, Operation and Inspection Unit, Customer Service Unit – Triple A, and Health Care Waste Unit. Staff requirement for each Unit is indicated below.
Table 7-4: Staff Requirement for EMUCD
Unit Section Number Contract Administration 1 Accounting 2 Planning 1
Administration & Development
Human Resources 2 Main Office 4 Audit 25 Urban Area Collection 3 Marginal Area Collection 2 Special Service 2 Large Generators 2 Street Sweeping 3 Machinery & Equipment Maintenance 2
Operation & Inspection
Transfer Transport 2 Customer Service 2 Health Care Waste 2
Administration and Development Unit
The Administration and Development Unit is to provide the administrative and control support to the operating units through the administrative sections functioning under this Unit but staffed by personnel belonging to other Directorates. This Unit is to be structured by the following four Sections: Quality Control and Contracts Administration; Accounting, Costs and Systems; Planning and Engineering; and Human Resources. The main functions of each Section are indicated in the Table below.
Table 7-5: General Functions of Administration and Development Unit
Section General Function Quality Control and Contracts Administration
Control and evaluate if the service is provided according to the quality levels established in the regulation and in the contracts with third parties.
Accounting, Costs and Systems
Assure the correct registration of the financial movements, establish the real cost of the service and provide financial resources for solid waste management service.
Planning and Engineering Program the activities to make the service fulfill development necessities such as urban planning of the city and generation and features of the solid waste.
Human Resources Ensure the occupational safety and the health of the worker, through the permanent training and by supplying the personal protection equipment.

7.3. Institutional System
55
Operation and Inspection Unit
This Unit is to be in charge of operation and inspection of various kinds of collection service conducted by the municipality or the private firms. The Unit is to consist of the following eight (8) Sections: Inspection, Urban Area, Marginal Area, Special Service, Institutions-Commerce-Industries Service (ICIs), Public Area Cleansing, Equipment and Maintenance, and Transport Service.
Customer Service Unit - Triple A
This Unit promotes active participation and collaboration of clients and fulfills their satisfaction for the quality of the service chiefly through Triple A, which is a private company having a contract with ADN for billing and collection of SWM service fee.
Health Care Waste Unit
This Unit is to contribute to the health and environment improvements of the National District citizens through the reduction of risks by hazardous waste generated in the health care centers.
a.2.2 Other Departments
Of the other Departments within EMUCD, close coordination with the Urban Cleansing Department will be required of the Environmental Information Center on matters relating to restraining the generation of solid waste, and the Vulnerability Prevention Department on matters relating to the management of disaster waste.
a.3 Advisory Committee
The Municipal Regulation for Cleansing stipulates creation of the Advisory Committee for the Integral Solid Waste Management that will initially consist of 16 (sixteen) organizations, of which the majority are participating in the elaboration of the Strategic Plan of Santo Domingo City.
These organizations are: Secretariat of State for Public Works and Communications; Secretariat of State for Tourism; Secretariat of State for Public Health and Social Assistance; Secretariat of State for Environment and Natural Resources; National Commission of Emergencies; Union of the Neighbors Committee of District 1; Union of the Neighbors Committee of District 2; Union of the Neighbors Committee of District 3; Union of the Neighbors Committee of the Historical Zone; Autonomous University of Santo Domingo; Dominican School of Engineers, Architects and Surveyor, National Council of the Private Company; Hotels Association of Santo Domingo; Commerce and Production Chamber of Santo Domingo; Dominican Chamber of the Construction; National Organization of the Commercial Companies ONEC.
The general function of the Committee is to encourage harmonized and structured participation of the citizenship and of their social organizations to cooperate with the Municipality in the achievement of economic and social profitability in the integral solid waste management.
a.4 Organization Structure and Relation
The coordination among Directorates within ADN, the structure of EMUCD, and the relationship with the Advisory Committee are indicated in the Figure below.
A detailed description of the responsibilities and functions of each office are presented in the Annex.

7. Description of the Master Plan
56
Environmental Management
and Urban Cleansing Directorate
Ornat and Public Embellishment
Department
Environmental Information Center
Prevention and Reduction of the
Vulnerability Department
Environmental Quality and Prevention of the
Contamination Department
Urban Cleansing Department
Customer Service Unit
(Triple A)
Administration and Development Unit
Human Development
Quality Management
Audit
Finance
Human Resources
Quality Control and Contract Administration
Accounting, Costs and Systems
Planning and Engineering
Operation and Inspection Unit
Institutions, Commercials and Industrial Services
Residential Special Service
Residential Ordinary Service
Equipment and Maintenance
Inspection
Neighborhood Committee
Cleansing and Ornat Committee
Management in Marginal Areas
Human Resources
Cleaning in Public Areas
Information, attention to the complaints and achieve the support of the clients
Quality control of the service
Fulfillment of the contracts
Internal control, dataregistration , real cost of the service
Preserve of the health, the security, continuous training
Advisory Committe for the Integral Management of the Solid
Waste
Legal consultantship, contracts, infractions and sanctions
Transference Service
Urban Planning Foresee and facilitate the service that demands the city
Estrategic Plan Establishment of the policyPerformance,
tariff and subsidies budget
Juridical Advisory
Equipment and Transport
Planning and Institutional Development
Technology and Information
Achieve the highest level in use of the vehicles
Technical support
Hospital Waste
Facilitate and achieve the citizen participation
Strengthen the administrative capacity of the ADN
Revenue
Figure 7-7: Organization Structure and Relation of ADN regarding MSWM
b. Establishment of Municipal Company
Participation of the civil society in the MSWM is vital. The Municipal Regulation for Cleansing stipulates creation of an Advisory Committee. This is the first step for the incorporation of the civil society.
The formation of a stock corporation is proposed, whose main shareholder will be the National District Municipality, of indefinite duration, of private rights, own patrimony, administrative and financial autonomy. Its Administrative Council and General Assembly is to represent the civil society of the National District.
The purpose of the company is to efficiently carry out the integral solid waste management service targeting non hazardous waste generated in the National District territory. The Urban Cleansing Department of EMUCD will be transformed to the Municipal Company.
c. Communication with other Institutions
ADN must maintain permanent coordination with several public and private, national and foreign, academic, financial, professionals, community entities of diverse nature, since the solid waste management service intervenes in almost all human activities.
However, it is necessary to prioritize the relation with the municipalities of the metropolitan region with the purpose of ordering the use of the territory. Site selection for a future landfill and establishment of a common policy on the prevention of waste generation will be topics in coordination with those municipalities.

7.3. Institutional System
57
SEMARN SESPAS
ADN Other Municipalities of Santo Domingo county
Environmental Management and Urban
Cleansing Directorate
Municipal Taxes Directorate
ADN
Commercial Administration
Triple A
Final Disposal Ayuntamiento of SDN
Generators of Hazardous Medical
Waste
Common Waste Generators
Generators of Hazardous Waste
Generators of Costruction’s Waste
Social Capital
CollectionADN Services
DSCCommunity Companies
Containers Generators and Recycle Industries
Formulate politicsFormulate Norms
Qualify the personnelPromote the PSPAssign Resources
Practice the Control
Information
Formulate politicsFormulate Norms
Qualify the personnelPromote teh PSPAssign Resources
Practice the Control
Fulfill the Responsabilities
Inform about the activities
Formulate politicsPrepare norms
Practice the Control
Fullfill with thenormatives
Inform about the acting
Implement politicsPrepare the regulations of the
cleanliness service Assign the budget
Negotiate the benefits of the SWM service
Inform about the negotiation results
Coordination and cooperation
Coordination
Coordination and cooperation
Execution of the Contract Conditions
Supervise the benefitsOf the service
Pay for the servicesCoordination and Complementation
Move the clients complaints so it can be attend
Solves the reason of the complaints
and communicates it
Achieve the citizen integration and of their organizations
on the Integrated SWM
Prepare the culture prevention of generation and
the waste valorization
The responsibility of preventing the generation is shared
between makers and consumers
Fulfil the obligations of giving the waste
on it form, place and agreed time
Give service according to the quality established
and the agreed price.Pays for the service received
Presents the complaints for deficiencies in the service
Bill and receive payment for the service given
according to the rate agreed.Assists quickly the clients complaints
Figure 7-8: Relationships among the different actors of the MSWM

7. Description of the Master Plan
58
7.3.3 Public-Private Partnership
Most of the solid waste collection service in Santo Domingo, National District, is done by private service providers. However, it has to be admitted that the service quality is low. This low service quality is caused by diverse factors, such as the absence of clear rules, insufficient capacity of private service providers to formulate collection plans as well as their insufficient administrative capacity, and insufficient capacity on the side of ADN to control and guide the private service providers. The existing collection service market is characterized by disorder. The Master Plan aims to establish order in this disorderly market of SW collection service.
For the purpose of setting order in the collection service market, the differing characteristics of collection area and solid waste dischargers will be categorized and defined. Then, the contract type most appropriate to each collection service category will be selected, and the corresponding contract prices will be indicated as reference for contract negotiations. Also, the contract administration system will be recommended.
a. Categorization and Definition of Collection Services
The categories and definitions of solid waste collection service are indicated in the Table below. In this classification, hazardous waste does not fall under the jurisdiction of ADN. The practical application implies the need for appropriate adjustments.
Table 7-6: Categorization and Definition of the Collection Service
Type of Waste
Categorization of the Services Definition of the Services
Non Hazardous
Urban Area This service targets waste generated in the urban area, with constructions of one or more floors, with wide avenues and secondary streets that in most cases allow the traffic of large size compactor trucks without inconvenience. This service is found in the three Circumscriptions.
Marginal Area This service targets waste generated in the marginal area, with a high population density, constructions of not more than three floors that are located in the adjacent area to the rivers Ozama and Isabela, they present narrow streets that in most cases don't allow the traffic of compactor vehicles, except the avenues that surround it. The houses are located around narrow canyons which hinders collection of the waste.
Big Generators This service targets big generators such as the big commercial centers, supermarkets, hotels, institutions, and industries. Construction waste and non hazardous waste generated from hospitals are included in this category. The waste of condominiums or high rise buildings is assumed as residential waste. Such waste is not included in this category.
Municipal Markets
This service targets municipal markets located in the National District (5 at the present time), where trade of such products as meat, vegetables, fruits, etc. is carried out.
Sweeping waste This service targets waste generated in the activities of streets, avenues, parks and other public areas.
Special Service This service targets waste generated by the pruning activities, garden remains, construction debris, appliances and other devices, furniture generated from houses.
Hazardous Hospital Waste This service targets infectious waste generated from the practice of the health centers. The transport, treatment and final disposal should be guided by the existent laws, on which SEMARN and/or other authorities have jurisdiction.
Hazardous waste
This service targets waste that SERMAN defines as explosive and toxic. The transport, treatment and final disposal should be guided by the existent laws, on which SEMARN and/or the authorities have jurisdiction.
Disaster waste It corresponds to the waste generated in big quantities by the hurricanes, earthquakes and/or tsunamis. Their management requires urgent measures.

7.3. Institutional System
59
b. Selection of Contract Types
The Table below presents the contract types that are recommended for each category of collection service, which were described above.
Table 7-7: Selection of Contract Types
Service Category Contract Type Residential Urban Area Lump sum contract (monthly fixed), contract duration 5 years. Residential Marginal Area Unit price based per ton of waste, contract duration 5 years. Big Generators Direct contract between private operators and clients with operation license
granted by the municipality, being able to be of lump sum or of unit price, depending on the negotiation among them. The operation license as well as the user's classification as big generator is granted by the Municipality who also verifies that the private operator has the technical and financial capabilities to carry out the service.
Municipal Markets Lump sum contract (month value fixed), contract duration 5 years. Sweeping waste Lump sum contract (monthly fixed), contract duration 5 years. Special Waste Collection Contract based on unit price with a minimum value per month, contract
duration 5 years. c. Basic Contract Prices
The contract price will be decided upon between the interested parties, as the result of public bidding or negotiations. The following are the proposed basic contract prices, taking into account the cost items needed for the stable provision of high quality service, including reasonable profits for the service providers.
c.1 Assumptions for the Calculation of Basic Contract Prices
The main assumptions for the calculation of basic contract prices are indicated in the Table below.
Table 7-8: Assumptions for the Calculation of Basic Contract Prices
Item Assumption 0. Basic assumptions 1) Useful life Collection vehicles 5 years、containers 3 years、transport vehicles 7
years, transfer station 30 years 2) Loan conditions for equipment acquisition
Repayment period is the equipment useful life, interest rate 20% per year, zero residual value
3) Tax 16% 4) Operation & maintenance 20% of direct cost 5) Profit 15% of direct cost + O&M cost 6) Exchange rate US$1.00 = RD$33.00 1. Urban area 20yd3 compactor trucks, containers for 20% of collection quantity 2. Marginal area 6yd3 compactor trucks, containers for 33% of collection quantity 3. Large generators 20yd3 compactor trucks, containers 4. Market 20yd3 compactor trucks, containers 5. Special service 2ton dump trucks 6. Street sweeping Manual system, collection with 6yd3 compactor trucks

7. Description of the Master Plan
60
c.2 Collection & Transport Systems
The collection and transport systems for both MP1 and MP2 (2012-2015) are indicated below. MP1 assumes the use of Duquesa final disposal site until the year 2015. On the other hand, MP2 assumes the same collection and transport system as MP1 until the year 2012, but thereafter assumes the use of a different final disposal site 40km away. Detailed explanations are presented in the Section on technical systems.
Table 7-9: Collection & Transport System for MP1
Service Collection Transfer Station Transport 1. Urban area 20yd3 compactors - Direct transport 2. Marginal area 6yd3 compactors Existing Trailers(85yd3) 3. Large generators 20yd3 compactors - Direct transport 4. Markets 20yd3 compactors - Direct transport 5. Special service 2ton dump trucks Existing Trailers(85yd3) 6. Street sweeping* 6yd3 compactors Existing Trailers(85yd3)
* Manual sweeping under ADN direct administration
Table 7-10: Collection & Transport System for MP2 (2012-2015)
Service Collection Transfer Station Transport 1.Urban area 20yd3 compactors New Trailers(85yd3) 2.Marginal area 6yd3 compactors Existing Trailers(85yd3) 3.Large generators 20yd3 compactors New Trailers(85yd3) 4.Markets 20yd3 compactors New Trailers(85yd3) 5.Special service 2ton dump trucks Existing Trailers(85yd3) 6.Street sweeping* 6yd3 compactors Existing Trailers(85yd3)
* Manual sweeping under ADN direct administration
c.3 Basic Contract Prices
The Tables below present the basic contract prices that were calculated by applying the above assumptions.
Table 7-11: Basic Contract Prices for MP1 Unit: US$/ton
Service Collection Transfer Station Transport 1. Urban area 33.80 (Transport included) - - 2. Marginal area 22.08 (ADN direct administration) 4.86 3. Large generators 30.42 (Transport included) - - 4. Markets 33.80 (Transport included) - - 5. Special service 19.05 (ADN direct administration) 4.86 6. Street sweeping 19.05 (ADN direct administration) 4.86
Table 7-12: Basic Contract Prices for MP2 (2012-2015) Unit: US$/ton
Service Collection Transfer Station Transport 1. Urban area 24.26 623,662(year) 8.79 2. Marginal area 22.08 (ADN direct administration) 8.79 3. Large generators 21.84 623,662(year) 8.79 4. Markets 24.26 623,662(year) 8.79 5. Special service 19.05 (ADN direct administration) 8.79 6. Street sweeping 19.05 (ADN direct administration) 8.79

7.3. Institutional System
61
d. Contract Management System
d.1 Bidding
The bids can be open or specified competitive. In the case of open bids the Municipality, by means of public call, invites bidders, while in the case of specified competitive bid the Municipality invites companies that are generally inscribed in the contractor registrations of the Municipality.
d.1.1 Bidding Process
In most cases, the contracts for collection and transport service are the result of a bidding process. Administrative and technical conditions are fixed through the bidding process. The following points show the most outstanding aspects to consider in a bidding process. The whole bidding process should be monitored by the Juridical Consultancy Legal Counsel of ADN in order to verify the legal validity of the process.
• Diagnostic • Decision Making • Estimate the Service Costs • Elaboration of the administrative and technical documents • Establishment of the Inspection System • Bidding of the Service
d.1.2 Bidding Documents
The following are minimum required documents for the bidding.
Administrative Document
• General Aspects • Form of Proposal • Award Process • Execution of the Contract • Ending of the Contract Technical Bases
• General Aspects • Technical Aspects • Documents of the Technical Proposal • Annexes d.2 Contract Coverage
The contract should contain provisions on the service quality, the contract audit, penalties in the case of failures, and other relevant aspects as the followings:
Administrative Aspects
• Identification • Definitions • Service Type • Duration of the contract • Description of the applicable juridical normative

7. Description of the Master Plan
62
• Obligations of the Contractor and of the Municipality • Performance bond • Sanction and Penalty • Payments for Services • Readjustment and increase of the service: • Insurance and Indemnity • Taxes, rates and contributions • Provisional Obligations • Contract terms Technical Aspects
• Type of waste • Service Modalities • Service Area • Service Characteristics • Service quality • Characteristics of the vehicles and equipments • Personnel • Operating Aspects • Inspection of the Service d.3 Contract Auditing
Once the contract is signed, the Municipality should pursue the execution of the contract. The Environmental Management and Urban Cleansing Directorate through the Administrative and Development Unit, specifically the Quality Control and Administration of Contracts section will coordinate with all the Directorates concerned with the Municipality to look after the execution of the contract. The Operations and Inspection Unit will be in charge of monitoring and evaluating the execution of the service, establishing evidence of infractions for non fulfillment of the contract, and elaborating the monthly report in relation to the service so that the Municipality proceeds with the payment and apply penalties if they exist. The aspects that should be monitored and controlled are the following.
Monitoring of the Administrative Aspects of the Contract
• Performance bond • Sanctions and Penalties • Service Payment • Readjustment and Increase of the Service • Insurance and Indemnifications • Provisional Obligations • Ending of the Contract • Information Activity Plan Monitoring the Technical Aspects of the Contract
• Characteristic of the Waste • Service Area • Characteristics of the Service • Characteristics of the vehicles and equipments • Personnel

7.3. Institutional System
63
• Service Evaluation Inspection of the Service of Big Generators
• Identification of Big Generators • Operation License • Service Inspection • Registration System
7.3.4 Financial Management
a. Financial Policy
The goal in the ADN solid waste management service over the Master Plan period is to approach efficiency and effectiveness comparable to that of a well run private sector business. However, given the existing lopsided deficit situation (income equals about one-fourth of expenditures), financial equilibrium or surplus will not be the overriding concern during the Master Plan period. Rather, the concern will be on setting up a reliable SWM service that can earn the trust of the service users and may lead to increased willingness to pay for the service.
a.1 Expansion of Customer Base without Tariff Increase
The ADN position is to earn the trust of the users of the SWM service by providing a reliable service. Hence, the first priority is to provide a reliable service of good quality, while simultaneously trying to expand the number of SW service users who actually pay for the service.
a.2 Subsidy to Households without the ATP and to cover the Financial Imbalance
The lack of significant financial sources under direct control of ADN, such as land tax and commercial patents, is somewhat compensated for by the provisions of Law 166-03 which is regarded as a safe source of financial resources for many years to come. Hence, the subsidy for households without the capacity to pay would come from Law 166-03 on the basis of the bottom 20% of households and the lowest tariff of 50 RD$ per month. Likewise, the income differential required to balance the financial disequilibrium of the SWM service would come also from Law 166-03. In 2005, this income differential was estimated at around 400 Million RD$, or about US$12 Million.
The uses of the fund provided by Law 166-03 are to be duly identified, so as to comply with the provisions of the law concerning the allocation of the fund use: investment 40%, service operation 35%, and personnel payroll 25%.
b. Income and Expenditures
b.1 Income
As explained above, income is to be improved by expanding the base of paying service users, by improving the bill collection rate, and by controlling leakages that may occur throughout the different stages of cash flow within the solid waste service.
Billing and bill collection on behalf of ADN has been done by AAA Dominicana since June 2004, on the basis of a four year contract. The fee paid by ADN to AAA Dominicana for this commercial service has two components: a fixed fee based on the number of invoices, and variable fee based on the surplus of collected income in excess of the fixed fee. The cost of this commercial service was estimated at around US$3 per ton. These fees should be the subject of negotiation at the time of the extension of the contract, taking into account the

7. Description of the Master Plan
64
improvements in service quality and the resulting improvements in the willingness to pay of the service users.
The sources of income in ADN solid waste management are the following.
b.1.1 Households
In March 2006, households accounted for 77% of the number of paying service users, and 64% of the payment amount. However, bill collection efficiency based on the number of households was 20%, since households billed (excluding SABAMAR) were 86,653, while paying households were 17,363. On the other hand, bill collection efficiency based on the monetary amount was 45%, since billing amounted to 21.5 Million RD$, while payments amounted to 9.7 Million RD$. There is room for improvement.
b.1.2 Industry, Commerce, Institution (ICI)
In March 2006, ICI accounted for 23 % of the number of paying service users, and 36% of the payment amount. However, bill collection efficiency based on the number of commercial, industrial and official entities was 41%, since the entities billed (excluding SABAMAR) were 12,305, while paying entities were 5,083. On the other hand, bill collection efficiency based on monetary amount was 88%, since billing amounted to 6.3 Million RD$, while payments amounted to 5.5 Million RD$. This is better than households, but there is still room for improvement.
b.1.3 Private Service Providers to Big Generators
Authorized private companies provide a customized service, based on private contracts signed between the service users and the service provider. The private company is also in charge of billing and bill collection, and has the obligation to pay 20% of their income to ADN, but this amounted to only 621,048 RD$ in 2005, a meager 0.44% of the income from the solid waste service. Obviously, there is an urgent need to improve the oversight and control of these companies in order to stop the leakage of potential income. Application of a combination of measures may be necessary, such as a hefty license fee, performance bonds, and quantitative control of tonnage and accounting records, if access to such records is permitted.
b.1.4 Subsidy as Income
The largest source of ADN income, around 80%, has been the funds from Law 166-03 by which the Central Government allocates a percentage of their income to the municipal governments as a function of the population in each municipality. The fund is channeled through the Dominican Municipal League. If the income as payments from the users does not suffice to cover the cost of solid waste management, part of the funds from Law 166-03 should be earmarked for such a purpose. The same thing can be said about the need to cover the payments corresponding to the solid waste service users who do not have the financial capacity to pay.
b.2 Expenditure
On the expenditure side, the steps required would start with the precise calculation of the cost of the service, followed by the control, through constant monitoring, of significant cost items that were identified.
b.2.1 Clarification of Cost Structure and Amount
At present, the budget control system does not permit a precise calculation of the cost incurred in the solid waste service. Clarification of cost structure of solid waste service will require a systematic identification and record keeping of all cost items incurred in the service.

7.3. Institutional System
65
ADN took the initiative in 2006 to improve the identification of cost items in the solid waste service that were obviously misplaced in other municipal offices, such as the case of plastic bags in the budget of the Administrative Directorate. The same identification procedure may be applicable to all cost items in the SWM service. Such effort should be continued and completed in the 2007 budget period, and perhaps complemented with a special cost accounting system for the solid waste service, as an addition to the existing budget control system.
b.2.2 Monitoring and Control of Specific Cost Items
Once the solid waste cost structure is clarified and the major cost items are identified, decisions can be made on the actions that can be taken on major cost items in order to reduce these costs in the most effective way. Naturally, actions should start with the cost items that weigh heaviest in the total cost of solid waste management.
b.2.3 Subsidy as Expenditure
As already mentioned above, the need may arise for an additional expense item as the subsidy that should be granted to the solid waste service users who do not have the financial capacity to pay the service tariff. The fund for this subsidy will have to come from Law 166-03, and probably should be earmarked before the fund is transferred from the Dominican Municipal League to ADN.
c. Accounting
ADN has already taken steps in 2006 to achieve a more precise identification of the cost items of the SWM service. This effort is commended and encouraged to be continued during preparation and execution of the 2007 municipal budget.
If the method of identification of SWM cost items initiated by ADN turns out to be insufficient, a very useful complement may be the introduction of a special solid waste cost accounting system. The accounting method is to be applied only to the solid waste service, in order to keep a systematic track and control of the costs of the service. Examples of software include “Costos de Servicios Prestados” (COSEPRE) of CEPIS/PAHO/WHO, which is also made available in the English language by the World Bank as “Costs of Urban Cleaning Services”, and “Full Cost Accounting” of the US Environmental Protection Agency (EPA).
7.3.5 Citizens’ Participation
Citizens’ participation in the MSWM is indispensable. The Master Plan proposes manners of communicating with citizens regarding collection service and minimization.
a. Communication regarding Collection Service
The following actions are necessary to get the citizens’ participation in the efficient waste collection.
1. Establishment of waste discharge rules and collection days 2. Informing the public of waste discharge rules and collection days 3. Monitoring whether the rules are observed 4. Receiving complains from citizens and surely responding to them
A series of these activities improve the work efficiency, make the effects appear and cultivate the reliance between citizens and ADN.
a.1 Establishment of waste discharge rules and collection days
The duties of ADN and citizens have to firstly be established regarding the collection service.

7. Description of the Master Plan
66
The Municipal Regulation for Cleansing has been formulated in the process of this Study for this purpose. Based on the Regulation, detailed rules such as manner of waste discharge, collection times, collection days, etc, have to be established.
a.2 Informing the public of waste discharge rules and collection days
The table below summarizes dissemination measures for the rules regarding the collection service. Their effectiveness has been proved through implementation of the Pre-Pilot Project and the Pilot Project.
Table 7-13: List of Effective Dissemination Measures
Activity Description Distribution of leaflets, information through verbal communication
Distribution of leaflets to all households is an effective information measure because all citizens can read it and keep it at home.
Announcing the rule with speakers
Some people may not read leaflets distributed. To supplement this problem, announcing information using speakers is effective.
Poster Putting posters that give information about waste discharge rules at pharmacies and colmados is effective. In addition, installation of posters along roads gives messages to many people.
Meetings with Junta de Vecinos leaders and residents
Junta de Vecinos are traditional community organizations, which exist in many places in the study area, although their capacities vary. This social capital is effective not only for dissemination of the information to residents but also to promote residents. Before and during the implementation of new services, a series of meetings with Junta de Vecinos’ members of the target area should be carried out.
a.3 Monitoring if the rules are observed
ADN has to monitor the waste collection contractor’s performance in order to enforce them to comply with their duties. As for citizens, ADN has to supervise all citizens to comply with their duties to minimize the violation cases. Urban Cleansing Department is in charge of this matter.
a.4 Receiving complains from citizens and surely responding them
As it is too difficult for ADN to completely watch the contractors’ performance, the citizens’ complain of informing the contractor’s defaults are very understandable. ADN must force the contractor to take rectifying actions immediately.
b. Communication regarding Waste Minimization
b.1 Fostering people’s ecological mentality
The following points show measures for fostering the ecological mentality.
• Environmental Information Center • Visiting SWM facilities • School recycle • Ecological campaign • Catchphrase, environmental logo, symbol marks • Voluntary clean up activity • Leaflets, TV, Radio
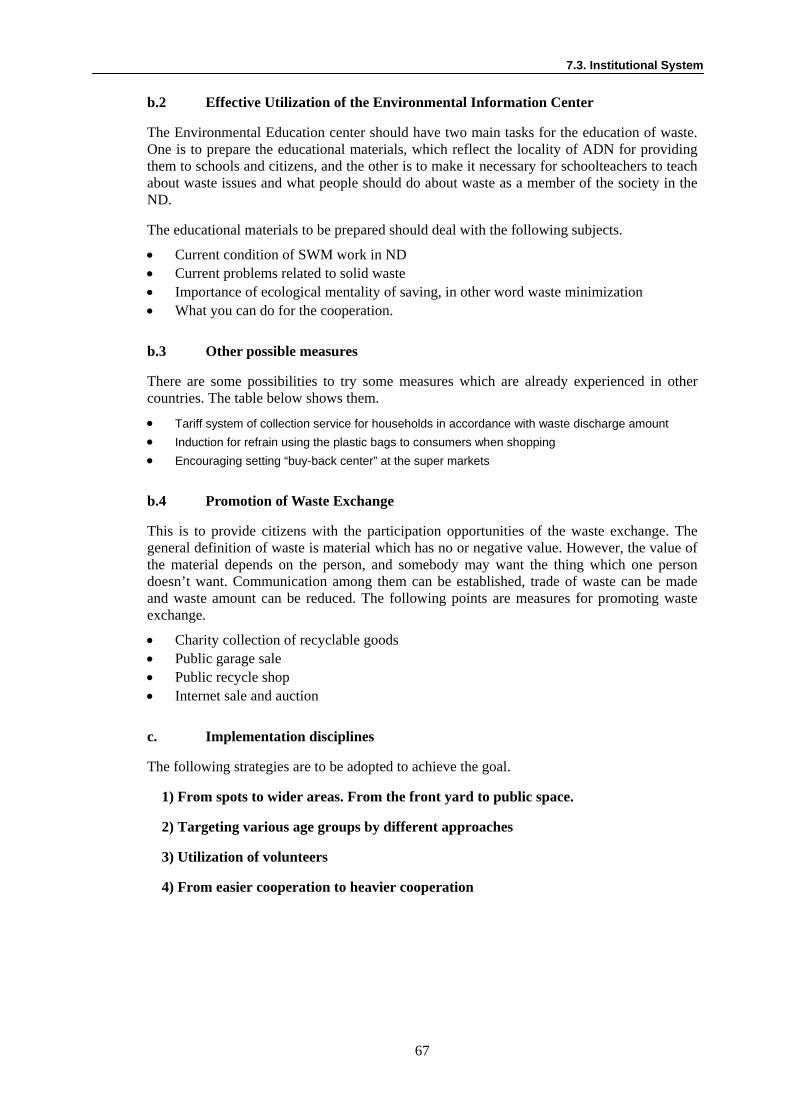
7.3. Institutional System
67
b.2 Effective Utilization of the Environmental Information Center
The Environmental Education center should have two main tasks for the education of waste. One is to prepare the educational materials, which reflect the locality of ADN for providing them to schools and citizens, and the other is to make it necessary for schoolteachers to teach about waste issues and what people should do about waste as a member of the society in the ND.
The educational materials to be prepared should deal with the following subjects.
• Current condition of SWM work in ND • Current problems related to solid waste • Importance of ecological mentality of saving, in other word waste minimization • What you can do for the cooperation. b.3 Other possible measures
There are some possibilities to try some measures which are already experienced in other countries. The table below shows them.
• Tariff system of collection service for households in accordance with waste discharge amount • Induction for refrain using the plastic bags to consumers when shopping • Encouraging setting “buy-back center” at the super markets b.4 Promotion of Waste Exchange
This is to provide citizens with the participation opportunities of the waste exchange. The general definition of waste is material which has no or negative value. However, the value of the material depends on the person, and somebody may want the thing which one person doesn’t want. Communication among them can be established, trade of waste can be made and waste amount can be reduced. The following points are measures for promoting waste exchange.
• Charity collection of recyclable goods • Public garage sale • Public recycle shop • Internet sale and auction c. Implementation disciplines
The following strategies are to be adopted to achieve the goal.
1) From spots to wider areas. From the front yard to public space.
2) Targeting various age groups by different approaches
3) Utilization of volunteers
4) From easier cooperation to heavier cooperation

7. Description of the Master Plan
68
d. Implementation Schedule
The measures mentioned above are to be conducted according to the schedule below.
Figure 7-9: Conceptual Implementation Schedule
20092006
Communication regarding collection service
Communication regarding waste minimization
2011 2015

7.4. Technical System
69
7.4 Technical System
The proposed technical systems are summarized in the Tables below. MP1 assumes the use of the Duquesa final disposal site until the year 2015, whereby there is no need for transfer stations even in the case of using large size compactor trucks, implying that direct transport will be used. MP2, on the other hand, assumes the use of a new final disposal site located 40km away. This means that even using large size compactor trucks, the transfer and transport system will be economically more favorable. Street sweeping is to be done with the manual system. Composting will be introduced as a waste minimization measure, using pruning waste from roadside trees, and market waste.
Table 7-14: MP1 Technical System
Service Type Urban/Big Generator/Market Marginal/Special/Sweeping Storage/discharge Storage/discharge according to characteristics of each discharger Collection/transport Collection Large compactor trucks(20yd3)
Collection using containers (560L)targeting 20% urban area waste
Small compactor trucks(6yd3) Small dump trucks(2ton) Collection using containers (560L)targeting 33% of marginal area waste
Transfer station - Existing transfer station(500ton/day) Transport - Trailers(85yd3、20ton) Final disposal Duquesa final disposal site(18km away) Street sweeping Manual system Waste minimization
Composting with pruning waste of roadside trees and market waste
Table 7-15: MP2 Technical System (2012-2015)
Service Type Urban/Big Generator/Market Marginal/Special/Sweeping
Storage/discharge Storage/discharge according to characteristics of each discharger Collection/transport Collection Large compactor trucks(20yd3)
Collection using containers(560L)targeting 20% of urban area waste
Small compactor trucks(6yd3) Collection using containers ( 560L)targeting 33% of marginal area waste
Transfer station New transfer station(1300ton/day) Existing transfer station(500ton/day) Transport Trailers(85yd3、20ton) Trailers(85yd3、20ton) Final disposal New final disposal site(40km away) Street sweeping Manual system Waste minimization
Composting with pruning waste of roadside trees and market waste
7.4.1 Storage and Discharge
The Master Plan proposes to regulate the storage and discharge as shown in the table below.

7. Description of the Master Plan
70
Table 7-16: Storage & Discharge
One family residence (1 or 2 stories buildings) Storage Plastic bags of 120 liter
Plastic receptacles of 120 l to 240 liter For the storage of solid waste bagged in plastic bags
Discharge In front of the residence, only on the established day and time for SW collection
Multi-family residence (high-rise) Storage Plastic containers of 120 to 500 liter capacity, in which SW bagged
in plastic bags is stored. Discharge Containers should be kept on the premises, taking them out onto
the street only on collection days within the established time frame. In the case of insufficient space in the property, these containers can be placed in the public area if they do not obstruct the traffic. The stored solid waste should never exceed the capacity of the container. These containers should be kept covered at all times. It is the responsibility of owners to keep the surrounding areas of containers free of solid waste, either in bags or in bulk.
Colmados or Shops in the Household Storage Plastic containers of 120 to 360 liter capacity, in which SW bagged
in plastic bags is stored. Discharge Containers should be kept at the exit of “colmados” so that clients of
these shops can discharge the waste generated by the goods purchased or consumed. When the plastic bags are full, they should be taken away and stored on the premises, before discharging them at collection time. Containers should be kept covered at all times. It is the responsibility of owners to keep the surrounding areas of containers free of solid waste, either in bags or in bulk.
Large Generators Storage Plastic containers of variable capacity depending on the volume
generated, or containers with in situ compaction Discharge The facilities should set aside spaces for the exclusive location of
containers, from where private collection service providers will take away.
Hospitals and Health Care Centers Storage Plastic containers of 120 liter capacity, in which SW bagged in
plastic bags is stored. Only non-hazardous waste can be stored. Infection or contagious waste should be handled independently.
Discharge The facilities should set aside spaces for the exclusive location of containers, which will be taken out into the public area only on collection day and time.
Municipal Markets Storage Plastic containers of 120 to 360 liter
Plastic containers of 120 to 360 liter Solid waste is to be stored in bulk, directly in the containers.
Discharge The tenants will haul the plastic containers or containers, as they get full, to the storage points (boxes or containers of larger capacity) that are to be defined for the market collection service. Under no circumstances, the tenants will be allowed to discharge solid waste directly onto the floor.

7.4. Technical System
71
7.4.2 Collection & Transport
a. Collection
Approximately 28% of solid waste comes from sectors where the poverty index indicates that 40% to 70% of households under the poverty line. This situation is particularly grave along the rivers Ozama and Isabela, which lack an adequate road infrastructure, thereby preventing implementation of the traditional collection system. Therefore, and in order to achieve 100% service coverage, the Master Plan considers implementation of the collection system under two schemes, namely, Urban Sector Collection and Marginal Sector Collection. The following Figure shows the distribution of areas under each service modality.
In addition to Urban Sector Collection and Marginal Sector Collection, recommendations are made for collection systems for Large Generators, Markets, Special Service, and Street Sweeping. The corresponding future solid waste generation was estimated as presented in the Table below.
Figure 7-10: Distribution of Areas by Modality of Collection Service
Table 7-17: Future SW Generation by Collection Service Modality Unit: ton/day
Service type 2007 2008 2009 2010 2011 2012 2013 2014 2015Residential 1,201 1,237 1,234 1,250 1,265 1,263 1,250 1,243 1,231 Urban 865 890 889 900 911 909 900 895 886 Marginal 336 346 346 350 354 354 350 348 345Big generators 72 74 74 75 76 76 75 75 74Markets 90 92 92 93 94 94 93 93 92Special service 10 11 11 11 11 11 11 11 11Sweeping 82 85 85 86 87 87 86 85 85Direct haulage 1 1 1 1 1 1 1 1 1
Total 1,457 1,500 1,497 1,515 1,534 1,532 1,516 1,508 1,493

7. Description of the Master Plan
72
a.1 Necessary Equipment
The numbers of vehicles and containers needed in each service are indicated in the Tables below. The number of vehicles differs for MP1 and MP2, but the number of containers does not change.
Table 7-18: Number of Vehicles Necessary for MP1 MP1 nos.
Service type Truck 2007 2008 2009 2010 2011 2012 2013 2014 2015Residential Urban 20yd3 compactor 61 63 63 64 65 65 64 64 63Marginal 6yd3 compactor 39 40 40 41 41 41 41 41 40Big generators 20yd3 compactor 6 6 6 6 6 6 6 6 6Markets 20yd3 compactor 7 7 7 7 7 7 7 7 7Special service 2ton flat truck 3 3 3 4 4 4 4 3 3Sweeping 6yd3 compactor 10 10 10 10 11 10 10 10 10* inc. 10% of reserve
Table 7-19: Number of Vehicles Necessary for MP2 MP2 nos.
Service type Truck 2007 2008 2009 2010 2011 2012 2013 2014 2015Urban 20yd3 compactor 61 63 63 64 65 54 53 53 53Marginal 6yd3 compactor 39 40 40 41 41 41 41 41 40Big generators 20yd3 compactor 6 6 6 6 6 5 5 5 5Markets 20yd3 compactor 7 7 7 7 7 6 6 6 6Special service 2ton flat truck 3 3 3 4 4 4 4 3 3Sweeping 6yd3 compactor 10 10 10 10 11 10 10 10 10* inc. 10% of reserve
Table 7-20: Number of Necessary Containers (MP1, MP2)
Required number of containers nos. Service Spec. 2007 2008 2009 2010 2011 2012 2013 2014 2015Urban 560L 2,889 2,975 2,969 3,006 3,043 3,038 3,007 2,990 2,962Marginal 560L 1,854 1,909 1,906 1,929 1,953 1,950 1,930 1,919 1,901Total 4,743 4,884 4,875 4,935 4,996 4,988 4,937 4,909 4,863
b. Transfer Station
At present, large compactor trucks transport the collected solid waste directly to the Duquesa final disposal site, which is located 18km away. On the other hand, small trucks use the existing transfer station in Villa Agricola, located on the northeastern side of the city.
MP1 will basically continue using the existing transportation system. On the other hand, MP2 assumes the use of a new final disposal site located 40km away starting in the year 2012. MP2 also assumes the construction of a new transfer station because transfer and transport would be more economical even using large compactor trucks.
Transfer and transport for MP1 and MP2 are shown in the Tables below.

7.4. Technical System
73
Table 7-21: Tonnage of Transfer & Transport (MP1)
ton/dayTransfer station 2007 2008 2009 2010 2011 2012 2013 2014 2015 Existing (365 days ) 429 442 441 446 452 451 447 444 440Existing (299 days) 524 539 538 545 552 551 545 542 537
Table 7-22: Tonnage of Transfer & Transport (MP2) ton/dayTransfer station 2007 2008 2009 2010 2011 2012 2013 2014 2015Existing (365 days) 429 442 441 446 452 451 447 444 440New (365 days) 1,079 1,068 1,062 1,052Existing (299 days) 524 539 538 545 552 551 545 542 537New (299 days) 1,318 1,304 1,297 1,285
b.1 Existing transfer station
The existing transfer station is located in Villa Agricola, on the northeastern side of the city. The transfer station completed vast improvement works in August 2006, thanks to assistance from the EU. The capacity of the transfer station is 500 tons per day, operating under a direct dump and mostly handling solid waste generated in the nearby marginal area.
The Master Plan calls for the same use of the transfer station, handling solid waste from the marginal area, the special service, and street sweeping. The capacity of the transfer station, 500 tons per day, is slightly lower than the planned transfer and transport of 550 tons per day, but the difference can be offset with improved efficiency or longer operation hours of the transfer station.
b.2 New Transfer Station
b.2.1 Location
The optimum location of the transfer station would be the center of gravity of the total amount of wastes collected in the coverage area. The area, where the center of gravity is found, is in a high income area where land cost is high. Consequently, it has been decided that the Transfer Station site will be relocated to the west. The area proposed for the location of the transfer station is shown in the following figure.
Figure 7-11: Proposed Area for Location of Transfer Station

7. Description of the Master Plan
74
b.2.2 Conceptual design of the transfer station
The new transfer station is to have a capacity of 1,300 tons/day, the solid waste coming in on 20yd3 compactor trucks and going out on 85yd3 trailer trucks.
The transfer station is to have two truck scales, and nine hoppers where solid waste will be dumped. The conceptual layout and design are indicated below.
Table 7-23: New Transfer & Transport System
Component Characteristics Transfer Station Capacity 1,300 ton/day
Direct discharge Transfer transport Tractor-truck and trailer of 85yd3 Collection Service Compactor truck of 20yd3
Figure 7-12: Lay Out for the Transfer Station

7.4. Technical System
75
c. Transport
The proposed transport system consists of a combination of 300-350hp tractors and 85yd3 trailers. The number of transport vehicles required for MP1 refers to the use of the existing transfer station. On the other hand, MP2 foresees a new transfer station, whereby the number of required transport vehicles is indicated for both the existing and the new transfer stations.
Table 7-24: Required Number of Transport Trucks for the Existing Transfer Station (MP1)
nos. Item 2007 2008 2009 2010 2011 2012 2013 2014 2015 Tractor 300-350 hp transport 5 5 5 5 5 5 5 5 5 reserve 1 1 1 1 1 1 1 1 1 total 6 6 6 6 6 6 6 6 6 Trailer 85yd3 transport 5 5 5 5 6 6 5 5 5 for waiting 3 3 3 3 3 3 3 3 3 reserve 1 1 1 1 1 1 1 1 1 total 9 9 9 9 10 10 9 9 9
Table 7-25: Required Number of Transport Trucks for the Existing Transfer Station
(MP2) nos. Item 2007 2008 2009 2010 2011 2012 2013 2014 2015 Tractor 300-350 hp transport 5 5 5 5 5 8 8 8 8 reserve 1 1 1 1 1 1 1 1 1 total 6 6 6 6 6 9 9 9 9 Trailer 85yd3 transport 5 5 5 5 5 8 8 8 8 for waiting 3 3 3 3 3 3 3 3 3 reserve 1 1 1 1 1 1 1 1 1 total 9 9 9 9 9 12 12 12 12
Table 7-26: Required Number of Transport Trucks for the New Transfer Station
(MP2) For the new transfer station nos. Item 2007 2008 2009 2010 2011 2012 2013 2014 2015 Tractor 300-350 hp transport - - - - - 19 19 19 19 reserve - - - - - 1 1 1 1 total - - - - - 20 20 20 20 Trailer 85yd3 transport - - - - - 19 19 19 19 for waiting - - - - - 9 9 9 9 reserve - - - - - 2 2 2 2 total - - - - - 30 30 30 30

7. Description of the Master Plan
76
7.4.3 Street Sweeping
a. Design of the service
In order to re-design the service, the conditions for the service were considered to be the following.
• ADN will directly provide the service. • The street sweeping service will be conducted manually. • Street sweeping will at least meet the performance indicators recommended by CEPIS.
This means that the expected productivity will be as indicated in the following Table. • The service will be provided in two daily shifts, Monday through Saturday. • The solid waste resulting from street sweeping will be collected using 6yd3 compactor
trucks exclusive for this activity.
Table 7-27: Standards considered for the Design of Street Sweeping Service
Variable Productivity Expected Value
Consumption of plastic bags per km swept per day Number of plastic bags/sweeper/day
7 to 9 plastic bags/sweeper/day (black colored bags, of low density polyethylene, 120 liter capacity, 0.002” thickness, service on paved streets, 2 shifts/day, frequency: 60% daily and 40% every other day)
9
Consumption of brooms per sweeper per km swept Number of brooms/sweeper/km
0.02 to 0.04 brooms/km swept (service on paved streets, brooms made of fiber and wooden base of 45cm long, 6cm wide and 11cm of fiber visibility) 0.03
Km swept per sweeper per day Km/sweeper/day
1.3 to 1.5 linear km/sweeper/day (sidewalk + gutter, paved streets, sweeper aged 35 years, average height 1.63 for men and 1.53 for women, weight: 5 additional kilogram over the height for men, and 7 kg for women)
1.4
b. Personnel requirement in street sweeping service
The number of personnel for the service was determined using the above considerations.
Table 7-28: Number of Personnel for Street Sweeping
Year Unit 2007 2008 2009 2010 2011 2012 2013 2014 2015Sweeping Ton/day 82 85 85 86 88 88 87 87 86Sweeping (299 working days) Ton/day 101 104 104 105 107 107 106 106 106Sweeping 1000/ton/year 31 32 32 32 32 32 32 32 32Km swept Km/day 787 810 810 818 833 833 825 825 825Personnel Number of sweepers Nº 562 578 578 584 595 595 589 589 589Reserve sweeper Nº 29 29 29 30 30 30 30 30 30Total of sweepers Nº 591 607 607 614 625 625 619 619 619Crew leader Nº 29 29 29 30 30 30 30 30 30Substitute crew leader Nº 2 2 2 2 2 2 2 2 2 Total of crew leaders Nº 31 31 31 32 32 32 32 32 32Supervisor Nº 6 6 6 6 6 6 6 6 6 Substitute Supervisor Nº 1 1 1 1 1 1 1 1 1 Total of Supervisors Nº 7 7 7 7 7 7 7 7 7

7.4. Technical System
77
c. Requirements of materials and inspection vehicles for street sweeping
The following requirements of materials for the service were determined.
Table 7-29: Requirements of Materials & Inspection Vehicles for Street Sweeping Service
Year Unit 2007 2008 2009 2010 2011 2012 2013 2014 2015Materials & Vehicles Plastic bags 1000 Nº 1,510 1,555 1,555 1,570 1,600 1,600 1,585 1,585 1,5855% reserve 1000 Nº 76 78 78 79 80 80 79 79 79Total 1000 Nº 1,586 1,633 1,633 1,649 1,680 1,680 1,664 1,664 1,664Brooms 1000 Nº 7 7 7 7 7 7 7 7 7 5% reserve 1000 Nº 1 1 1 1 1 1 1 1 1 Total 1000 Nº 8 8 8 8 8 8 8 8 8 Inspection vehicles Plant Nº 3 3 3 3 3 3 3 3 3 10% reserve Nº 1 1 1 1 1 1 1 1 1 Total Nº 4 4 4 4 4 4 4 4 4 Purchase of initial needs Nº 4 - - - - - - - - Annual increase Nº - - - - - - - - - Total investment Nº 4 - - - - - - - - Replacement useful life 1 Nº - - - - 4 - - - - Purchase program Nº 4 - - - 4 - - - - Operating vehicles Nº 3 3 3 3 3 3 3 3 3

7. Description of the Master Plan
78
7.4.4 Waste Minimization
Waste minimization is currently the central problem of Solid Waste Management. Developed countries have taken the lead in waste minimization so far. However, other countries are also expected to tackle it, as waste minimization is one of the most effective measures to preserve natural resources, to prevent the global warming, to reduce hazardous substances and to lower SWM cost.
a. Concept of Waste Minimization
Waste minimization has a broad sense, which includes Generation Control, Discharge Control and Resource Recovery as shown in the figure below.
Figure 7-13: Concept of Waste Minimization It is common knowledge around the world that the priority order of SWM policy is 1) to “Reduce,” 2) to “Reuse” and 3) to “Recycle.”
“Generation Control” is the same as “Reducing.” It should be given first priority. “Discharge Control” practices “Reusing” and/or “Recycling” at waste generation sources. As both measures aim to reduce the amount of waste discharged from the generation source, they are called “Source Reduction.”
“Resource Recovery” indicates activities which aim to recover resources from discharged waste. It is generally called “Recycling.” It is often divided into “Material Recovery” and “Energy Recovery.”
b. Generation Control
The waste generation amount is scheduled to be reduced by 3% in 2015 as shown in the table below.
Potential Waste Generation Amount
Waste Generation Amount Generation Control
Waste Discharge Amount Discharge Control
Waste Disposal Amount
Resource Recovery
from Waste
Waste Minimization
- Reduction of material use in manufacturing- Increase of durability of products- Decrease toxicity- Use of recycled material- Design of products that are easily to be recycled- Avoidance of single-use goods (shopping bag, container, etc.)
- Backyard Composting- Waste exchange- Recycling at supermarkets, colmados- Recycling at communities, schools
- Composting of market waste and pruning waste- Material recovery from discharged waste

7.4. Technical System
79
Table 7-30: Generation Control
Year Generation
control %
Generation potential ton/day
Generation control ton/day
Generation ton/day
2007 1 1,573 16 1,557 2008 1 1,595 16 1,579 2009 2 1,618 32 1,586 2010 2 1,641 33 1,608 2011 2 1,664 33 1,631 2012 3 1,688 51 1,638 2013 3 1,712 51 1,661 2014 3 1,737 52 1,685 2015 3 1,761 53 1,709
Measure 1: Environmental Education
Environmental education is to be conducted in schools and communities, with the aim of disseminating the importance of generation control as well as appropriate waste discharge manners. The Environmental Information Center will be in charge of this measure.
Measure 2: Tariff by Volume for ICIs
The tariff for ICIs is to be set by volume which gives them an incentive to reduce the waste amount. The fee collection company, AAA, will take this measure.
c. Discharge Control
20% of households and 40% of ICIs other than municipal markets are scheduled to participate in waste exchange, recycling at supermarkets, colmados, communities and schools. This discharge control is encouraged in line with market principles and environmental education. The target materials are shown in the table below.
Table 7-31: Target Materials for Discharge Control
Generation Source Target Materials Households paper, textile, plastic, metal, bottles/glass Restaurants plastic, bottles/glass Other commerce paper, textile, plastic, metal, bottles/glass Institutions paper, plastic
Measure 1: Environmental Education
Environmental education is to be conducted to disseminate the importance of discharge control and to instruct on how to cooperate with recycling activities at supermarkets, colmados, communities and schools. The Environmental Information Center is to be in charge of this measure.
Measure 2: Waste Exchange
Waste exchange at sources, especially in ICIs, is to be encouraged by provision of appropriate information. Entities that want to sell and ones that want to buy or receive certain materials can register with the Environmental Information Center. Then, the center will provide such information to relevant entities.

7. Description of the Master Plan
80
Measure 3: Recycling at Supermarkets and Colmados
Containers of merchandise such as glass bottles and PET shall be recycled under the principle of Extended Producer Responsibility. The Secretariat of State for Environment and Natural Resources (SEMARN) shall take the initiative in this field. Under the initiative by the SEMARN, the ADN will communicate with companies concerned to encourage this measure.
Measure 4: Recycling at Schools and Communities
Along with the environmental education at schools and communities, recycling activities such as paper recycling are to be conducted. The ADN will act as a catalyst among schools, communities and recycling organizations.
Note: Most of the activities are expected to be conducted in line with market principles. Then, costs and benefits are supposed to be balanced. Costs that the ADN incurs are assumed to be covered by the administration cost.
d. Resource Recovery
Composting is planned as a measure of resource recovery.
Measure 1: Composting
Market waste and sweeping waste include a large portion of biodegradable materials that are suitable for composting. 70% of the municipal markets are to participate in a composting program. In addition, 30% of sweeping waste, i.e., pruning waste, will be brought to the program in 2015.
Table 7-32: Composting Program
Year Market SweepingCompost
in ton/day
Compost residue ton/day
Compost product ton/day
Waste reduced ton/day
2007 0% 0% 0 0 0 02008 0% 0% 0 0 0 02009 10% 2% 6.2 2.2 0.6 4.12010 20% 5% 12.9 4.5 1.3 8.42011 30% 10% 20.2 7.1 2.0 13.22012 40% 15% 27.5 9.6 2.8 17.92013 50% 20% 35.2 12.3 3.5 22.92014 60% 25% 43.1 15.1 4.3 28.02015 70% 30% 51.2 17.9 5.1 33.3
Procedure
The following is the procedure to begin composting.
• to conduct a feasibility study along with site selection
• to introduce separate waste storage in the municipal markets
• to begin the composting program targeting biodegradable waste (biodegradable and grass/woods) generated from the municipal markets and pruning waste, and to expand the program

7.4. Technical System
81
Required equipment and manpower
Required equipment and manpower for the composting are summarized in the tables below.
Table 7-33: Required Number of Equipment for Composting Amount (299days-basis)
Item 2007 2008 2009 2010 2011 2012 2013 2014 2015Waste Amount compost in ton/day 0 0 7.6 15.8 24.7 33.6 43.0 52.6 62.5 compost residue ton/day 0 0 2.7 5.5 8.7 11.8 15.0 18.4 21.9 compost product ton/day 0 0 0.8 1.6 2.5 3.4 4.3 5.3 6.3 waste reduced ton/day 0 0 5.0 10.2 16.1 21.8 27.9 34.2 40.6 required number of equipment
wheel loader unit 0 0 1 1 2 2 3 4 4shredder unit 0 0 1 1 2 2 3 4 4
screen unit 0 0 1 1 2 2 3 4 4operative vehicle
wheel loader unit 0 0 0 1 1 2 2 3 4shredder unit 0 0 0 1 1 2 2 3 4
screen unit 0 0 0 1 1 2 2 3 4purchase of equipment
wheel loader unit 0 0 1 0 1 0 1 1 0shredder unit 0 0 1 0 1 0 1 1 0
screen unit 0 0 1 0 1 0 1 1 0
Table 7-34: Required Manpower for Composting
Equipment Capacity Manpower Wheel loader 1.5 m3 of bucket 1 driver for each Shredder 20 m3/hour 1 operator and 3 workers for each Screen 20 m3/hour 1 operator and 3 workers for each
Type of composting
Windrow is recommendable for this composting program.
7.4.5 Final Disposal
The Master Plan 1 resupposes the continued use of the Duquesa final disposal site, whereby no plan was included for final disposal. However, improvements are needed in the existing final disposal site, for which the necessary measures were detailed in the corresponding action plan. On the other hand, MP2 assumes the operation of a new final disposal site starting in the year 2012. The measures needed to be taken for the construction of a new final disposal site were also detailed in the corresponding action plan.
Master Plan 1 (MP1): Use of Duquesa up to the year 2015
Master Plan 2 (MP2): Use of Duquesa up to the year 2011, and a new final disposal site located 40km away starting in the year 2012

7. Description of the Master Plan
82
7.5 Preliminary Cost Estimate
This section presents estimated costs of MP1 and MP2.
a. Key Data for Cost Estimate
The following are key data for cost estimating.
Table 7-35: Key Data for Cost Estimate
Key data value Exchange rage RD$33.00/US$1.00 Working days 299 days/year Useful life collection vehicles 5 years containers 3 years transport vehicles 7 years transfer station 30 years Borrowing rate 20% Borrowing period the same as the useful life Administrative cost for the private sector 20% Interest for the private sector 15% Administrative cost for ADN 10%
b. Summary
The total costs and unit costs corresponding to MP1 and MP2 are presented below. In addition to the collection and transportation costs detailed above, the SWM total cost includes the composting cost, the final disposal cost, and the administrative cost. In regard to the final disposal cost, if operations in Duquesa were improved, the cost was assumed to be US$5.00/ton, while the unit cost of a new final disposal site was assumed to be US$10.00/ton. As ADN will require funds for the plan implementation, 10% of direct costs were added as the administrative cost.
The total cost of MP1 between 2007 and 2015 was estimated at UD$228 Million, or about US$25 Million per year. Likewise, the total cost of MP2 was estimated at US$245 Million, and the yearly cost was estimated at US$25 Million while using Duquesa up to the year 2011, and at around US$30 Million when using a new final disposal site starting in the year 2012. The unit costs were estimated at US$46/ton for MP1, and US$50/ton for MP2.
It should be pointed out that these costs were based on the contract prices with private service providers, and these contract prices included a 20% interest rate on loans for the acquisition of vehicles and equipment, 16% tax, 20% administrative cost of private companies, and 15% profit. If these figures were to change during re-negotiation of the terms and conditions of the contracts, or before signing new contracts, then it may turn out to cause changes in the total costs as well as the unit costs.
Table 7-36: Total Cost Estimated of MP1 (1,000 US$)
Year 2007 2008 2009 2010 2011 2012 2013 2014 2015 Total Collection and Transport 19,498 20,069 20,030 20,273 20,516 20,484 20,280 20,169 19,980 181,299Composting 0 0 70 143 226 305 390 479 570 2,184Final Disposal 2,529 2,606 2,621 2,679 2,739 2,795 2,767 2,751 2,725 24,212Administration 10% 2,203 2,268 2,272 2,310 2,348 2,358 2,344 2,340 2,328 20,771
Total 24,230 24,943 24,993 25,405 25,829 25,942 25,781 25,739 25,603 228,466

7.5. Preliminary Cost Estimate
83
Table 7-37: Total Cost Estimated of MP2 (1,000US$)
Year 2007 2008 2009 2010 2011 2012 2013 2014 2015 Total Collection and Transport 19,498 20,069 20,030 20,273 20,516 21,488 21,281 21,166 20,974 185,295Composting 0 0 70 143 226 305 390 479 570 2,184Final Disposal 2,529 2,606 2,621 2,679 2,739 5,591 5,533 5,503 5,450 35,251Administration 10% 2,203 2,268 2,272 2,310 2,348 2,738 2,720 2,715 2,699 22,273
Total 24,230 24,943 24,993 25,405 25,829 30,122 29,924 29,863 29,693 245,003
Table 7-38: Unit Cost Estimated of MP1 and MP2 Unit: US$/ton
Item MP1 MP2 Collection and Transport 36.65 37.46 Composting 0.44 0.44 Final Disposal 4.89 7.13 Administration 10% 4.20 4.50
Total 46.19 49.53

7. Description of the Master Plan
84
7.6 MSWM Technical System Development Schedule
In order to achieve a 100% collection rate, procurement of 20yd3 compactor trucks for the urban area will commence in 2007 for both MP1 and MP2. In the case of MP2, a 1300 ton/day transfer station is to operate from 2012. Meanwhile, 6yd3 compactor trucks will be procured from 2007 for the marginal area and operation of the existing transfer station will continue.
This Master Plan does not include a plan for final disposal. However, it recommends improving the current operation of Duquesa and supposes that a new landfill would operate from 2012 for MP2.
As for waste minimization, the environmental education on waste will commence on 2007. Recycling at supermarkets, colmados and schools will be implemented in 2009 as well as the composting targeting market and pruning waste.
The table below shows the MSWM Technical System Development Schedule of both the MP 1 and MP2.
Table 7-39: MSWM Technical System Development Schedule (MP1)
Improvement 2006 2007 2008 2009 2010 2011 2012 2013 2014 2015
I Collection and Transport
1 Urban area
11 Collection
12 Transport
3 Marginal area
31 Collection
32 Transport
II Final Disposal
1 Duquesa
III Waste Minimization
1 Generation control
2 Discharge control
3 Composting
Note: Preparation work for a composting plant would require a feasibility study, detailed design, construction and supervision. In addition, initial environment examination (IEE) and/or environmental impact assessment (EIA) would be included, if necessary.
Procurement of 20yd3 compactor trucks
Procurement of 6yd3 compactor trucks
Continuous operation of the existing 500 ton/day transfer station
Improvement of the current operation
Environmental education and collection service charge by weight/volume
Recycling at supermarkets, colmados and schools
Operation Preparation
Direct transport

7.6. MSWM Technical System Development Schedule
85
Table 7-40: MSWM Technical System Development Schedule (MP2)
Improvement 2006 2007 2008 2009 2010 2011 2012 2013 2014 2015
I Collection and Transport
1 Urban area
11 Collection
12 Transport
3 Marginal area
31 Collection
32 Transport
II Final Disposal
1 Duquesa
2. New Landfill
III Waste Minimization
1 Generation control
2 Discharge control
3 Composting
Note: Preparation works for a 1,300 ton/day transfer station; a new landfill and a composting plant would require feasibility studies, detailed designs, construction and supervision. In addition, initial environment examination (IEE) and/or environmental impact assessment (EIA) would be included, if necessary.
Procurement of 20yd3 compactor trucks
Operation of 1300 ton/day transfer station, 85 m3 trailer
Preparation
Procurement of 6yd3 compactor trucks
Continuous operation of the existing 500 ton/day transfer station
Improvement of the current operation Closure and post-closure care
Preparation Operation
Environmental education and collection service charge by weight/volume
Recycling at supermarkets, colmados and schools
Operation Preparation