
JICA DEVELOPMENT STUDY SUPPORTING THE REHABILITATION ...
71
JAPAN INTERNATIONAL COOPERATION AGENCY (JICA) MONGOLIA MINISTRY OF INFRASTRUCTURE (MOI) THE 4 TH THERMAL POWER PLANT (TES4) PROJECT IMPLEMENTING UNIT (PIU) JICA DEVELOPMENT STUDY SUPPORTING THE REHABILITATION PROJECT OF THE 4 TH THERMAL POWER PLANT IN ULAANBAATAR MONGOLIA FINAL REPORT SEPTEMBER 2002 ELECTRIC POWER DEVELOPMENT CO., LTD. No. M P N JR 02-133
Transcript of JICA DEVELOPMENT STUDY SUPPORTING THE REHABILITATION ...

JAPAN INTERNATIONAL COOPERATION AGENCY (JICA) MONGOLIA MINISTRY OF INFRASTRUCTURE (MOI) THE 4TH THERMAL POWER PLANT (TES4) PROJECT IMPLEMENTING UNIT (PIU)
JICA DEVELOPMENT STUDY SUPPORTING THE REHABILITATION PROJECT
OF THE 4TH THERMAL POWER PLANT
IN ULAANBAATAR
MONGOLIA
FINAL REPORT
SEPTEMBER 2002
E L E C T R I C P O W E R D E V E L O P M E N T C O . , LT D .
No.
M P N
JR
02-133

PREFACE
In response to a request from the Government of the Mongolia, the Government of Japan decided to
conduct the Development Study the Rehabilitation Project of the 4th Thermal Power Plant in
Ulaanbaatar, Mongolia and entrusted the study to Japan International Cooperation Agency (JICA).
JICA sent a study team, led by Mr. Yasuhiro Kato of Electric Power Development Co., Ltd. (EPDC) to
Mongolia five times from June 2001 to July 2002.
The team held discussion with the officials concerned of the Government of the Mongolia, and
conducted related field surveys. After returning to Japan, the team conducted further studies and
compiled the final results in this report.
I hope this report will contribute to the promotion of the plan and to the enhancement of friendly
relations between our two countries.
I wish to express my sincere appreciation to the officials concerned of the Government of the
Mongolia for their close cooperation throughout the study.
September 2002
Takao KAWAKAMI
President
Japan International Cooperation Agency
Tokyo, Japan

Mr. Takao KAWAKAMI President Japan International Cooperation Agency Tokyo, Japan
Dear Mr. T.KAWAKAMI,
Letter of Transmittal
We are pleased to submit you with the final report of JICA Development Study for the Rehabilitation Project of the 4th Thermal Power Plant in Ulaanbaataar, Mongolia, of which study has been finished recently.
This study was conducted on the purpose of submission of the Bidding Documents for the Rehabilitation Project of the 4th Thermal Power Plant (Phase-II) as a part of the JBIC Loan Aid Project, submission of Maintenance and Rehabilitation Plans for the existing whole plant which was planed, and the Technology Transfer to the counterpart through the study.
In addition to the above, the Bidding Document of the Phase-II Project, which was taken into account of such contents for the project as the amount of the loan, and the observance of the project schedule based on the agreement between Mongolia and JBIC, was officially submitted to Mongolia by the end of September 2001 which was instructed by JICA.
As for the maintenance and rehabilitation plans for the said power plant, the final report (main report) was composed on basis of the information and the data which were collected until September 2001, and examined the maintenance and rehabilitation plan and the plant operation and management plan (including organization, administration of the plant equipment, environmental protection, personnel training, and financial management).
By implementing strictly the recommendations mentioned in this report, the said power plant will be able to keep its financial base and administration of the plant management, and to contribute for the long-term supply of stable power and heat to withstand the increment of the power and heat demand forecasted.
We wish taking this opportunity to express our sincere gratitude to JICA, the Ministry of Foreign Affairs, and the Ministry of Economy Trade and Industry. We also wish to express our deep gratitude to the Ministry of Infrastructure of Mongolia, and other authorities concerned of the Government of Mongolia, Embassy of Japan in Mongolia and JICA Ulaanbaatar office for the intimate cooperation and assistance extended to us during our investigation period.
Very truly yours,
September 2002
Yasuhiro KATO
Team Leader JICA Development Study of the Rehabilitation Project of the 4th Thermal Power Plant in Ulaanbaatar Mongolia

MONGOLIA ●
Ulaanbaatar
LOCATION MAP
Ⅰ

II
Power Plant General View
Power Plant Model

III
Plane View
Section View

IV
Coal Carrier
Coal Storage Yard

V
Boiler Building
Electro Static Precipitator (ESP)

VI
Transformer
Switch Yard

VII
Boiler Control Panel (Rehabilitated)
Boiler Control Panel (Existing)

VIII
Mill (Rehabilitated)
Generator & Exciter (Existing)

IX
No.3 Ash Pond (Existing)
No.4 Ash Pond (Under Construction)

- i -
CONTENTS OVERALL EVALUATION AND RECOMMENDATIONS........................................................ 1 CHAPTER 1 INTRODUCTION ............................................................................................... 1.1- 1
1.1 Background of Study............................................................................................... 1.1- 1 1.2 Purpose of Study ..................................................................................................... 1.2- 1 1.3 Area of Study .......................................................................................................... 1.3- 1 1.4 Scope of Study ........................................................................................................ 1.4 -1
CHAPTER 2 ECONOMIC SITUATION OF MONGOLIA...................................................... 2.1- 1
2.1 Political and Economic Background ....................................................................... 2.1- 1 2.2 Economic Situation ................................................................................................. 2.2- 1
2.2.1 Economic Structure ..................................................................................... 2.2- 1 2.2.2 Transition of Economic Situation................................................................ 2.2- 4
CHAPTER 3 SITUATION OF POWER AND HEAT SECTOR OF MONGOLIA .................. 3.1- 1
3.1 Sector Structure and Reform................................................................................... 3.1- 1 3.1.1 Sector Structure ........................................................................................... 3.1- 1 3.1.2 Sector Reform ............................................................................................. 3.1- 3
3.2 Power Supply and Demand ..................................................................................... 3.2- 1 3.3 Heat Supply and Demand........................................................................................ 3.3- 1 3.4 Power and Heat Tariff ............................................................................................. 3.4- 1
3.4.1 Tariff Level Movement................................................................................ 3.4- 1 3.4.2 Tariff Setting Mechanism............................................................................ 3.4- 3 3.4.3 Sales Collection Mechanism ....................................................................... 3.4- 4
CHAPTER 4 SITUATION AND ISSUES OF ULAANBAATAR THERMAL POWER
PLANT NO.4 (TES4) ......................................................................................... 4.1- 1 4.1 Business Performance ............................................................................................. 4.1- 1
4.1.1 Sales and Production ................................................................................... 4.1- 1 4.1.2 Sales Price and Production Cost.................................................................. 4.1- 3 4.1.3 Financial Statements and Financial Performance........................................ 4.1- 7 4.1.4 Fund Analysis.............................................................................................. 4.1-11 4.1.5 Financial Issues ........................................................................................... 4.1-12
4.2 Facility Management Situation ............................................................................... 4.2- 1 4.2.1 General ........................................................................................................ 4.2- 1

- ii -
4.2.2 Boiler Facilities ........................................................................................... 4.2- 4 4.2.3 Turbine-Generator Facilities ....................................................................... 4.2- 6 4.2.4 Electric Facilities......................................................................................... 4.2- 7 4.2.5 C&I Facilities .............................................................................................. 4.2- 9 4.2.6 Fuel Handling Facilities .............................................................................. 4.2- 9 4.2.7 Others .......................................................................................................... 4.2-10 4.2.8 Evaluation of the Current Situation in TES4 Facilities ............................... 4.2-10
4.3 The Situation of the 3rd Thermal Power Plant in Ulaanbaatar ............................... 4.3- 1 CHAPTER 5 MAINTENANCE AND REHABILITATION PLAN.......................................... 5.1- 1
5.1 Selection of Rehabilitation Equipment ................................................................... 5.1- 1 5.2 The Rehabilitation Improvement Effect.................................................................. 5.2- 1
5.2.1 Reduction of Auxiliary Power Ratio ........................................................... 5.2- 1 5.2.2 Recovery of Condenser Vacuum ................................................................. 5.2- 3 5.2.3 Saving Heavy Oil Fuel Consumption.......................................................... 5.2- 6 5.2.4 Increase of the Plant Availability................................................................. 5.2- 8 5.2.5 The Rehabilitation Improvement Effect of Others ...................................... 5.2-13
5.3 Future Maintenance and Rehabilitation Plan .......................................................... 5.3- 1 5.3.1 Implementing Schedule............................................................................... 5.3- 2 5.3.2 Cost Estimation for Rehabilitation Work .................................................... 5.3- 5 5.3.3 Funding Plan by Year .................................................................................. 5.3- 6
5.4 Economic and Financial Evaluation........................................................................ 5.4- 1 5.4.1 Economic Evaluation .................................................................................. 5.4- 1 5.4.2 Financial Evaluation.................................................................................... 5.4- 5 5.4.3 Funding Plan ............................................................................................... 5.4-10
CHAPTER 6 POWER PLANT OPERATION AND MANAGEMENT PLAN ........................ 6.1- 1
6.1. Organization ............................................................................................................ 6.1- 5 6.1.1 Review of the Organization......................................................................... 6.1- 5 6.1.2 Job Assignment and Responsibility............................................................. 6.1-11 6.1.3 Communication ........................................................................................... 6.1-13
6.2 Administration of the Plant Equipment................................................................... 6.2- 1 6.2.1 Administration of the Operation.................................................................. 6.2- 1 6.2.2 Administration of the Maintenance............................................................. 6.2-14 6.2.3 Administration of the Engineering .............................................................. 6.2-20 6.2.4 Administration of the Fuel .......................................................................... 6.2-25 6.2.5 Administration of the Inventory .................................................................. 6.2-26 6.2.6 Administration of Safety and Health........................................................... 6.2-28

- iii -
6.3 Environmental Protection........................................................................................ 6.3- 1 6.3.1 Environmental Situation.............................................................................. 6.3- 1 6.3.2 Environmental Conservation by TES4........................................................ 6.3-25 6.3.3 Environmental Monitoring.......................................................................... 6.3-61 6.3.4 Effective Utilization .................................................................................... 6.3-64 6.3.5 Recommendation for Environmental Conservation of TES4...................... 6.3-66
6.4 Personnel Training .................................................................................................. 6.4- 1 6.4.1 Implementation of Personnel Training in Mongolia ................................... 6.4- 1 6.4.2 Personnel Training Activities in TES4 ........................................................ 6.4- 4 6.4.3 Recommendation for Personnel Training.................................................... 6.4-11 6.4.4 Change of Mind-Set into the Work Place.................................................... 6.4-14
6.5 Financial Management ............................................................................................ 6.5- 1 6.5.1 Financial Management Situation................................................................. 6.5- 1 6.5.2 Assessment and Recommendations............................................................. 6.5- 6

- i -
ABBREVIATION
ACGHI : American Conference of Governmental Industrial Hygienists
ADB : the Asian Development Bank
B/C : Benefit par cost
CCR : Center control room
CES : Central Energy System
COMECON : Council for Mutual Economic Assistance
CRT : Character display
D/D : Detail Design
EA : Energy Authority
ECCR : Electric center control room
EDO : Electric Distribution Office
EES : East Energy System
EIA : Environmental impact assessment
EIRR : Economic Internal Rate of Return
ERA : Energy Regulatory Authority
ESP : Electrostatic Precipitator
ETC : Energy Training Center
FBC : Fluidized-Bed Combustion
FC : Foreign Currency
FDF : Forced Draft Fan
FIRR : Financial Internal Rate of Return
FL : Floor Level
FRP : Fiber Reinforced Plastic
GCB : Gas circuit breaker
GDP : Gross Domestic Product
GNP : Gross National Product
GTZ : German Technical Cooperation
HDO : Heat Distribution Office
HOB : Heat only boiler
IARC : International Agency for Research on Cancer
IAS : International Accounting Standards
IDF : Induced Draft Fan
IEE : Initial Environmental Impact Evaluation
IMF : International Monetary Fund
IRR : Internal Rate of Return

- ii -
JBIC : Japan Bank for International Cooperation
JICA : Japan International Cooperation Agency
JISHA : Japan Institution of Safety and Health Association
J-Power : Electric Power Development Co., Ltd.
LAN : Local Area Network
LC : Local Currency
MBB : Make before break
MEGM : Ministry of Energy Geology and Minerals
M/M : Minutes of meeting
MOID : Ministry of infrastructure Development
NDF : Nordic Development Fund
NEDO : New Energy and Industrial Technology Development Organization
NOx : Nitrogen Oxides
PGF : Primary Gas Fan
O&M : Operation and maintenance
OCB : Oil circuit breaker
OCR : Over-current relay
OECF : Overseas Economic Cooperation Fund
PDCA : Plan-Do-Check-Action
PIU : Project Implementing Unit
QC : Quality Control
ROE : Return on equity
ROA : Return on assets
SAPROF : Special Assistance for Project Formation
SATU : Name of Environmental Assessment & consulting company
SIDA : Swedish International Development Cooperation Agency
SOE : State Owned Enterprise
SOx : Sulfur Oxides
SPM : Suspended Particulate Matter
S/W : Scope of Works
TES2 : Ulaanbaatar Thermal Power Plant No.2
TES3 : Ulaanbaatar Thermal Power Plant No.3
TES4 : Ulaanbaatar Thermal Power Plant No.4
TV : Television
VCB : Vacuum circuit breaker
WES : West Energy System
ZD : Zero Defect

- i -
UNITS
Prefixes
µ : Micro- = 10-6
m : Milli- = 10-3
c : Centi- = 10-2
d : Deci- = 10-1
da : Deca- = 10
h : Hecto- = 102
k : Kilo- = 103
M : Mega- = 106
G : Giga- = 109
T : Tera- = 1012
Unit of Length
mm : Millimeter
cm : Centimeter
m : Meter
Units of Area
cm2 : Square centimeter
m2 : Square meter
km2 : Square kilometer
Units of Volume
m3 : Cubic meter
l : Liter
kl : Kiloliter
Units of Mass
g : Gram
kg : Kilogram
t : Ton (metric)
Units of Density
kg/m3 : Kilogram per cubic meter
mg/kg : Milligram per kilogram
ppm : Parts per million
mg/m3N : Milligram per normal cubic meter
µg/m3N : Microgram per normal cubic meter
µg/m3 : Microgram per cubic meter
mg/l : Milligram per liter

- ii -
Units of Pressure
t/m2 : Ton per square meter
kg/cm2 : Kilogram per square centimeter (gauge)
mmHg : Millimeter of mercury
mmAq : Millimeter of aqueous
hPa : Hecto Pascal
Units of Energy
kcal : Kilocalories
kWh : Kilowatt-hour
MWh : Megawatt-hour
GWh : Gigawatt-hour
kW/ m2 : Kilowatt per square meter
Units of Heating Value
cal/kg : Calories per kilogram
kcal/kg : Kilocalorie per kilogram
kJ/kg : Kilojule per kilogram
Units of Temperature
°C : Degree Celsius or Centigrade
°K : Degree Kelvin
Units of Electricity
W : Watt
MW : Megawatt
A : Ampere
kA : Kiloampere
V : Volt
kV : Kilovolt
kVA : Kilovolt ampere
MVA : Megavolt ampere
MVar : Megavar (mega volt-ampere-reactive)
kHz : Kilohertz
Units of Time
s : Second
min : Minute
h : Hour
d : Day
w : Week
y : Year
- iii -
Units of Flow Rate
t/h : Ton per hour
t/d : Ton per day
t/y : Ton per year
m3/s : Cubic meter per second
m3/min : Cubic meter per minute
m3/h : Cubic meter per hour
m3/d : Cubic meter per day
m3N/s : Cubic meter per second at normal condition
m3N/h : Cubic meter per hour at normal condition
Units of Conductivity
µS/cm : MiscroSiemens per centimeter
Units of Sound Power Level
dB(A) : Deci-bell (A-weighted)
Units of Currency
US$ : US Dollar
Yen : Japanese Yen
Tug : Mongolian tugrug (9.07Tug=1Yen:2001/10)
MTug : Million tugrug
GTug : Billion tugrug

- i -
List of Tables
Table 3.2-1 Historical Change of Supply and Demand of Central Grid Table 3.2-2 (1) Power Supply and Demand Forecast (Case-1) Table 3.2-2 (2) Power Supply and Demand Forecast (Case-2) Table 3.3-1 (1) Heat Supply and Demand Forecast (Case-1) Table 3.3-1 (2) Heat Supply and Demand Forecast (Case-2) Table 3.4-1 Energy Price Movement(nominal term) Table 3.4-2 Energy Price Movement(real term at 1991 level) Table 3.4-3 Energy Price Movement(nominal dollar term) Table 3.4-4 Wholesale Price and Production Cost of Power Plants Table 4.1-1 TES4 Sales and Production Table 4.1-2 Movement of Wholesale Prices and Fuel Prices of TES4 (nominal term) Table 4.1-3 Movement of Wholesale Prices and Fuel Prices for TES4 (real term) Table 4.1-4 Movement of Wholesale Prices and Fuel Prices for TES4 (nominal dollar term) Table 4.1-5 Balance Sheet Table 4.1-6 Income Statement Table 4.1-7 Cash flow Statement Table 4.1-8 Financial Analysis Table 4.1-9 Statement of Sources and Uses of Funds Table 4.1-10 TES4 Outstanding Receivables of TES4 by Debtor Table 4.1-11 Outstanding Payables of TES4 Table 4.2-1 The Outline of TES4 Main Equipment Table 4.3-1 The Outline of TES3 Main Equipment Table 4.3-2 TES3 Actual Production And Thermal Efficiency in 2000 Table 5.1-1 Equipment to be Rehabilitated Table 5.1-2 The Cause of Motor Burning in the Year 2000 and Improvement Plan Table 5.1-3 A Specific Properties of Hydrazine and Substitutive Chemicals Table 5.2-1 The Rehabilitation Improvement Effect for the Equipment (Rank A) Table 5.2-2 The Reduction of the Auxiliary Power Ratio (Based on the Year 2000 Boiler
Operation Record) Table 5.2-3 The Amount of Annual Fuel Losses by the Degree of Decline of the Condenser
Vacuum Table 5.2-4 The Number of Start-Ups and Heavy Oil Consumption of Each Boiler in the Year
2000 Table 5.2-5 Start-Ups of Each Boiler in the Year 2000 and Predicted Amount of Heavy Oil
Consumption Table 5.2-6 The Number of Boiler Shutdowns according to Failure Cause in the Year 2000 Table 5.2-7 The Actual Result of Turbine/Generator Operation in the Year 2000 Table 5.2-8 Predicted Availability of the Turbine/Generator in 2011 Table 5.2-9 The Actual Result of Boiler Operation in the Year 2000 Table 5.2-10 Predicted Availability of the Boiler in 2011 Table 5.2-11 Relation between the Amount of Blows, and the Cost Losses Table 5.2-12 Relation Between Bore Diameter and the Cost Losses Table 5.2-13 Exhaust Gas Measurement Result Table 5.2-14 Coal Consumption and Emitted CO2 at TES4 Table 5.3-1 Cost Estimation of Rehabilitation Work (Rank A)

- ii -
Table 5.3-2 Cost Estimation of Rehabilitation Work (Rank B) Table 5.3-3 Funding Plan by Year (Rank A) Table 5.3-4 Funding Plan by Year (Rank B) Table 5.4-1 Annual Effects of Rehabilitations Table 5.4-2 Economic Evaluation Table 5.4-3 Financial Evaluation Table 5.4-4 Fund Requirement and Debt Service Required up to 2025 Table 5.4-5 Funding Plan Case 1 Table 5.4-6 Funding Plan Case 2 Table 5.4.7 Funding Plan Case 3 Table 5.4-8 Funding Plan Case 4 Table 5.4-9 Funding Plan Case 5 Table 5.4-10 Funding Plan Case 6 Table 5.4-11 Funding Plan Case 7 Table 6.1-1 Number of Industrial Accidents and Return to Work in 2000 Table 6.1-2 Incidence of Plant Stoppages by Causal Factors in 2000 Table 6.1-3 Employee Composition of TES4 in the Year 2000 Table 6.1-4 TES4 Regular Meeting List Table 6.2-1 List of Patrol Tools Table 6.2-2 Operation Support Manuals Table 6.2-3 The Example of Proceeding for Alarm Table 6.2-4 The Example of a Setting Value Explanatory Document Table 6.2-5 Example of Operation log Table 6.2-6 Managing Items by the Operation Department Table 6.2-7 Work Procedure Ledger Table 6.2-8 The Approach to Repair Cost Curtailment Table 6.2-9 The Example of the PDCA Cycle in Preventive Maintenance Optimization Table 6.2-10 The Cause and Countermeasures for Decline of Condenser Vacuum Table.6.2-11 Illumination around the Boiler and Turbine Equipment Table 6.2-12 Measurement Results on the Concentration of Coarse Particulate Table.6.2-13 Measurement Results of Work Environment (noise) Table 6.2-14 Accident Occurrence: 1995~2000 Table 6.2-15 Occupational Disease: 1995~2000 Table 6.2-16 Example of a Hazard Identification Activity Board Table6.2-17 The Classification of Environmental Conditions for Industrial Computer Control
System Table 6.2-18 The Measures Against Magnetic Field Table 6.3-1 Temperature, Precipitation and Humidity in Ulaanbaatar City Table 6.3-2 Meteorological Data in 2000 (Tahilt Meteorological Observatory) Table 6.3-3 Appearance Frequency of Wind Direction in 2000 Table 6.3-4 Wind Velocity for Each Wind Direction in 2000 Table 6.3-5(1) Appearance Frequency of Wind Velocity Class in 2000 Table 6.3-5(2) Appearance Frequency of Wind Velocity Class in 2000 Winter (Jan.-Feb. Dec) Table 6.3-6 Meteorological Data at Appearance of Inversion Layer in 2000 (Monthly
Average) Table 6.3-7 Appearance Frequency of Inversion Layer in Ulaanbaatar (year 2000)

- iii -
Table 6.3-8 Comparison of the Environmental Standards for Air Quality Table 6.3-9 Annual Average Concentration of the Air Pollutant in Ulaanbaatar (1985-2000) Table 6.3-10 Air Quality Monitoring Data in 2000 Table 6.3-11(1) Exhaust Gas Measurement Result of SO2, NO2 Outlet ESP (1998) Table 6.3-11(2) Exhaust Gas Measurement Result of Dust Outlet ESP (1998-2000) Table 6.3-12 Calculation Formula of Exhaust Gas Dispersion Table 6.3-13 Impact on the Air Quality by Exhaust Gas Contamination in Winter (Case of
Average Wind Velocity 1.9m) Table 6.3-14 Impact on the Air Quality by Exhaust Gas Contamination in Winter (Case of Max
Wind Velocity 9m) Table 6.3-15 Noise Measurement Result (Inside of TES4) Table 3.6-16 Noise Measurement Result (Periphery of TES4) Table 6.3-17 Environmental Quality Standard of Noise Table 6.3-18 Noise Measurement Result during a Safety Valve Release Steam (Periphery of
TES4) Table 6.3-19 Water Quality Analysis Table 6.3-20 Embankment Stability of Ash Pond Table 6.3-21 Outline of the EIA Survey on TES4 Table 6.4-1 Participant List of the Personnel Training for Power Plant Engineers
(1999-2001 Total) Table 6.4-2 Education/Training System for Thermal Power Plant Under EA Direct Control
(Basic Concept for Electric) Table 6.4-3 The Training Budget Items in 2001 at TES4 Table 6.4-4 The Outline of the Training Curriculum Classified by Qualification Table 6.4-5 Thermal Power Plant Operator Training Pattern Table 6.4-6 Summary of the Number of Penalty Cases in the Operation Department in 2000

- i -
List of Figures
Fig. 2.2-1 Employment Structure
Fig. 2.2-2 Industrial Composition of GDP
Fig. 2.2-3 Mining and Manufacturing Output
Fig. 2.2-4 Export Structure
Fig. 2.2-5 Import Structure
Fig. 2.2-6 Real GDP Growth Rate
Fig. 2.2-7 Balance of International Payments
Fig. 2.2-8 External Debt Burden
Fig. 2.2-9 Inflation and Exchange Rate
Fig. 2.2-10 Fiscal Situation
Fig. 3.1-1 Power Grid in Mongolia
Fig. 3.2-1 Power Supply Composition of CES(as of 2000)
Fig. 3.2-2 Power Demand Composition(as of 2000)
Fig. 3.3-1 Heat Supply Composition in Ulaanbaatar
Fig. 3.4-1 Energy Price Movement(nominal term)
Fig. 3.4-2 Energy Price Movement(real term)
Fig. 3.4-3 Energy Price Movement(nominal dollar term)
Fig. 4.1-1 Outstanding Payables of TES4
Fig. 4.1-2 Movement of Revenues and Production Cost
Fig. 4.1-3 Movement of Wholesale Prices and Fuel Prices for TES4 (real term)
Fig. 4.1-4 Movement of Wholesale Prices and Fuel Prices for TES4 (nominal dollar term)
Fig. 4.1-5 Movement of Average Wholesale Prices and Production Cost(per unit)
Fig. 4.1-6 Movement of Production Cost Rate
Fig. 4.1-7 Production Cost Structure
Fig. 4.1-8 Composition of Debtors for Receivables of TES4(at the end of 2000)
Fig. 4.1-9 Composition of Creditors for Payables of TES4(at the end of 2000)
Fig. 4.2-1 Production of Electricity and Transition of Utilization Factor
Fig. 4.2-2 The Amount of Boiler Evaporation and Transition of Utilization Factor
Fig. 4.2-3 Transition of Availability Factor, Ratio of Failure, Ratio of Reserve
Fig. 4.2-4 The Comparison of Failure Factor of Boiler and Repair Time in 2000
Fig. 4.2-5 The Transition of Boiler Shutdown Time by Individual Root Cause
Fig. 4.2-6 Utilization Factor & Transition of Shutdown Time at Turbine & Generator

- ii -
Fig. 4.2-7 The Transition of the Shutdown Factor by Individual Root Cause
Fig. 4.2-8 Turbine and Generator Repair Time Ratio by Individual Root Cause in 2000
Fig. 4.2-9 Number of Electric Failure Equipment-by-Equipment in 2000
Fig. 5.1-1 ESP
Fig. 5.1-2 Sootblowers
Fig. 5.1-3 Auxiliary Steam Temp and Press Reducing Control Valves for Plant Start-up
Fig. 5.1-4 Auxiliary Steam Temp and Press Reducing Control Valves for Normal Conditions
Fig. 5.1-5 Feed Water Pumps
Fig. 5.1-6 Condenser Pumps
Fig. 5.1-7 Expansion Joint for Condenser and Extraction Pipes
Fig. 5.1-8 Valves for Vacuum System
Fig. 5.1-9 Ejectors
Fig. 5.1-10 HP/LP Feed Water Heaters
Fig. 5.1-11 Mechanical Filters at Cooling Tower Outlet
Fig. 5.1-12 Cooling Tower
Fig. 5.1-13 Condenser Tube Cleaning Devices
Fig. 5.1-14 Transmitter for Turbine and Auxiliary Equipment
Fig. 5.1-15 Condenser Hotwell Level Control Equipment
Fig. 5.1-16 Supervisory Instruments for No.1-No.6 Turbine and Generator
Fig. 5.1-17 No.1-No.6 LP Feed Water Heater Level Transmitters and Controllers
Fig. 5.1-18 Turbine Control and Instrumentation
Fig. 5.1-19 No. 1B to No.8B Motors for FDF and IDF with Associated Interlock System
Fig. 5.1-20 H.V. Switchgears (6.6kV)
Fig. 5.1-21 L.V. (0.4kV) Switchgears
Fig. 5.1-22 Generator Protection System
Fig. 5.1-23 10.5kV Switchgears for Generators
Fig. 5.1-24 220kV/110kV Switchgears for Generator Transformer
Fig. 5.1-25 Rehabilitation of Various Motors
Fig. 5.1-26 Cause Analysis of Burned Motors and Increase of Reliability
Fig. 5.1-27 Coal Amount Measurement for Coal Conveyers
Fig. 5.1-28 Coal Analyzer
Fig. 5.1-29 TV Monitoring System for Conveyer No.3 and No.4 Lines
Fig. 5.1-30 Firefighting System
Fig. 5.1-31 Wet Dust Collector

- iii -
Fig. 5.1-32 Bulldozer
Fig. 5.1-33 Dissolved Oxygen Monitoring System for Condenser
Fig. 5.1-34 Automatic Control and Supervisory Instruments for Water Treatment Equipment
Fig. 5.1-35 Spot Cooler at Water Sampling Room
Fig. 5.1-36 Substitute Chemicals for Ammonia and Hydrazine
Fig. 5.1-37 Chemical Lining and Coating of Tubes and Tanks
Fig. 5.2-1 The Changes in the Auxiliary Power Ratio
Fig. 5.2-2 The Changes of the Condenser Vacuum
Fig. 5.2-3 The Amount of Annual Fuel Losses by the Decline of the Condenser Vacuum
Fig. 5.2-4 The Changes in the Amount of Heavy Oil Consumption and Purchase Cost
Fig. 5.2-5 The Changes of Availability of Each Turbine/Generator
Fig. 5.2-6 The Changes of Availability of Each Boiler
Fig. 5.2-7 Steam/Water Loss
Fig. 5.2-8 The Cost Losses to the Amount of Boiler Water
Fig. 5.2-9 The Leakage Situation of the Feed Water Valve
Fig. 5.2-10 Relation Between Bore Diameter and the Cost Losses
Fig. 5.2-11 Coal Consumption and emitted CO2 at TES4
Fig. 5.3-1 Future Maintenance and Rehabilitation Plan
Fig. 5.3-2 Implementing Schedule (Rank A)
Fig. 5.3-3 Implementing Schedule (Rank B)
Fig. 5.4-1 Economic Sensibility Analysis
Fig. 5.4-2 Financial Sensibility Analysis
Fig. 6.1-1 The Management Points of Power Plant
Fig. 6.1-2 Existing Organization Chart of TES4
Fig. 6.1-3 Proposal Organization Chart of TES4
Fig. 6.1-4 Organization Chart of Boiler Operation Section of TES4
Fig. 6.2-1 Marking on a Scale of the Indicator in CCR
Fig. 6.2-2 Marking on a Local Gauge
Fig. 6.2-3 The Picture of Operation Support Manuals in CCR
Fig. 6.2-4 Switchgear Procedure Slip
Fig. 6.2-5 Valves and Dampers Procedure Slip
Fig. 6.2-6 Arrangement of Spare Parts in the Plant Warehouse
Fig. 6.2-7 Transition in the Number of Accidents in the Power Plant
Fig. 6.2-8 Transition in Numbers of Occupational Disease

- iv -
Fig. 6.2-9 Photographs of Hazardous Places and Measures
Fig. 6.2-10 Example of Hazard Identification Training Using the Illustration
Fig. 6.2-11 Cable Processing Room Under CCR
Fig. 6.3-1 Monthly Wind Rose in 2000
Fig. 6.3-2 Seasonal Wind Rose in 2000
Fig. 6.3-3 Power Plant and Ambient Air Quality Monitoring Station in Ulaanbaatar
Fig. 6.3-4(1) Air Quality Monitoring Station in Ulaanbaatar
Fig. 6.3-4(2) Air Quality Monitoring Station in Ulaanbaatar
Fig. 6.3-5 Trend of Air Pollutant Concentration in Ulaanbaatar (Annual Average)
Fig. 6.3-6 Air Pollutant Concentration in Ulaanbaatar (2000)
Fig. 6.3-7 Dispersion Calculation Result under 5 Boilers Operation in Winter (Case of Ground Wind Velocity 1.9m/s)
Fig. 6.3-8 Dispersion Calculation Result under 5 Boilers Operation in Winter (Case of Ground Wind Velocity 9m/s)
Fig. 6.3-9 Flow Diagram of Waste Water
Fig. 6.3-10(1) Ash Accumulation Status of the 3rd Ash Pond
Fig. 6.3-10(2) Ash Accumulation Status of the 3rd Ash Pond
Fig. 6.3-11 Structure of the 3rd Ash Pond
Fig. 6.3-12 Embankment Structure of the 3rd Ash Pond
Fig. 6.3-13 Southern Embankment Outside Status of the 3rd Ash Pond
Fig. 6.3-14 Construction Status of the 4th Ash Pond
Fig. 6.3-15 Storage Status of Waste Material from TES4
Fig. 6.3-16 Silencer Structure of Safety Valve (Reference Example)
Fig. 6.4-1 TES4 Composition Statistics Classified by Job Class

OVERALL EVALUATION AND
RECOMMENDATIONS

- 1 -
OVERALL EVALUATION AND RECOMMENDATIONS
I. General
This study was conducted based on site surveys and data collected on Ulaanbaatar Thermal Power Plant No.4 (TES4), and a maintenance and rehabilitation plan was prepared from an overall perspective of power plant management considering not only rehabilitation plans for equipment and facilities, but also plans for personnel training and financial management to assure financial discipline.
By implementing the recommendations in this plan, TES4 will be able to strengthen its financial base and administration of plant management, thus contributing to the long-term stable supply of good quality power and heat to combat the forecasted increase in power and heat demand.
From the above perspective, it will be necessary to consider the following during the implementation of the recommendations:
It will be indispensable to obtain the understanding of the Mongolian government and to promote the reform of the energy sector, as well as to obtain the understanding of the heads and staff of each section of TES4, and to properly implement the recommendations in order for TES4 to positively materialize the recommendations mentioned in this report.
Once corporatized, TES4 must procure funds on its own; however, the provision of financial aid from Japan and other foreign countries will be necessary to secure the foreign currency needed for equipment and other procurement considering the current severe situation of the international balance of payments of Mongolia, while TES4 retains funds of local currency adequately.
With respect to organizational reform and personnel training, the provision of software support such as technical and intellectual support will be indispensable because the improvement of operation and management skills will contribute to raising the efficiency not only for TES4, but also for all plants in Mongolia.
Based on the above considerations, an overall evaluation and recommendations are described in the following.

- 2 -
II. Evaluation and Recommendations
(1) Maintenance and Rehabilitation Plans
Selection of the equipment requiring rehabilitation was made and an execution plan was prepared together with cost estimate and annual fund requirements. The effects of the rehabilitation were determined and an economic and financial evaluation was made. As a result, it was concluded that the rehabilitation plan was worthy of implementation. The result of the evaluation and the recommendations are shown below:
1) Selection of Rehabilitation Equipment
The selection of equipment to be rehabilitated was made by the importance and degree of degradation of the equipment and was ranked in 3 categories (A: Rehabilitation from which a large effect is expected, B: Rehabilitation for decrepit equipment, C: Repair works considered by TES4). Particular attention was paid to the point that, on account of the 40-year service life of TES4 up to 2025, ash ponds No. 5 and 6 with a capacity of 10 years each will be necessary, and that it will be necessary to rehabilitate 80 MW turbines, which fail frequently, in order to respond to the future increase in demand. It will also be necessary to conduct environmental measures to meet the environmental regulations and other life extension measures.
2) The Rehabilitation Improvement Effect
The expected effects of the above rehabilitations are shown in the table below. This table reveals that positive implementation of each item will have significant effects, leading to a strengthened financial base of TES4.
The Rehabilitation Improvement Effect for the Equipment (Rank A)
Rehabilitation Improvement Item Rehabilitation Improvement Effect(MTug/year)
(1) Reduction of Auxiliary Power Ratio 693.6 (2) Recovery of Condenser Vacuum 170.3 (3) Saving Heavy Oil Consumption 164.3 (4) Increase in Power Availability 10,749.4
Total 11,777.6
- 3 -
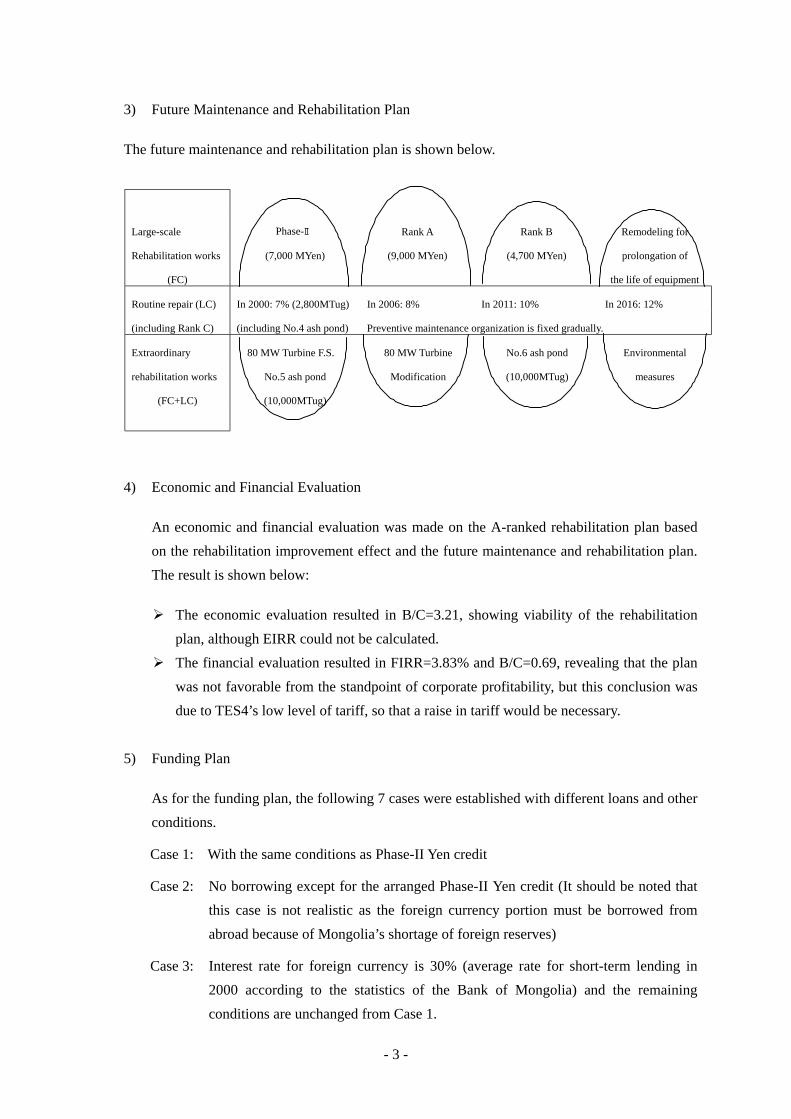
3) Future Maintenance and Rehabilitation Plan
The future maintenance and rehabilitation plan is shown below.
Large-scale Phase-Ⅱ Rank A Rank B Remodeling for
Rehabilitation works (7,000 MYen) (9,000 MYen) (4,700 MYen) prolongation of
(FC) the life of equipment
Routine repair (LC) In 2000: 7% (2,800MTug) In 2006: 8% In 2011: 10% In 2016: 12%
(including Rank C) (including No.4 ash pond) Preventive maintenance organization is fixed gradually.
Extraordinary 80 MW Turbine F.S. 80 MW Turbine No.6 ash pond Environmental
rehabilitation works No.5 ash pond Modification (10,000MTug) measures
(FC+LC) (10,000MTug)
4) Economic and Financial Evaluation
An economic and financial evaluation was made on the A-ranked rehabilitation plan based on the rehabilitation improvement effect and the future maintenance and rehabilitation plan. The result is shown below:
The economic evaluation resulted in B/C=3.21, showing viability of the rehabilitation plan, although EIRR could not be calculated. The financial evaluation resulted in FIRR=3.83% and B/C=0.69, revealing that the plan
was not favorable from the standpoint of corporate profitability, but this conclusion was due to TES4’s low level of tariff, so that a raise in tariff would be necessary.
5) Funding Plan
As for the funding plan, the following 7 cases were established with different loans and other conditions.
Case 1: With the same conditions as Phase-II Yen credit
Case 2: No borrowing except for the arranged Phase-II Yen credit (It should be noted that this case is not realistic as the foreign currency portion must be borrowed from abroad because of Mongolia’s shortage of foreign reserves)
Case 3: Interest rate for foreign currency is 30% (average rate for short-term lending in 2000 according to the statistics of the Bank of Mongolia) and the remaining conditions are unchanged from Case 1.
- 4 -
Case 4: Modifying Case 3 by changing the foreign interest rate to 10%, an allowable rate to make the cash flow for each year positive.
Case 5: More realistic loan conditions for foreign currency with a 5-year repayment period and (grace for construction time) and 30% interest rate.
Case 6: Modifying Case 5 by changing the foreign interest rate to 5.5%, an allowable rate to make the cash flow for each year positive.
Case 7: Modifying Case 5 by changing the sales prices to: power 33.35/kWh and heat 6,900/Gcal, the minimum level to make the cash flow for each year positive and to avoid capital deficiency.
Cases 1, 3 and 4 assume a 20-year repayment period, but are not possible without soft
conditions such as those provided by yen credit with an interest rate as low as 1%. Case 2 is a case where all the funding requirements can be met by its own fund, but in reality, foreign currency is necessary, so that this case is not possible either.
Of the above 7 cases, Case 5 is the case the most likely to be faced by a corporation that may possibly be privatized in future. As seen in Case 6, even if an unrealistically low interest rate is applied, capital deficiency occurs and the case becomes impossible, which leads to the belief that a price hike is necessary as in Case 7.
To that effect, the first thing to do is to make accounting treatment appropriate, implement asset revaluation and normalize the depreciation period in order to prepare financial statements more properly reflecting the actual financial situation. The next thing concerns loan conditions; as there has been no long-term lending in the financial market in Mongolia and loan conditions are unclear, improvement of the financial market is essential, while TES4 must make borrowing conditions clear through negotiations for each loan and prepare funding plans considering the size and timing of the price hike and whether to procure local fund requirements by its own fund.
(2) Organizational Reform
TES4 was corporatized in September 2001, and managing the plant as an independent profit-making enterprise and strengthening management bases and vitality are required, so TES4 should reconsider its organization with particular attention paid to its autonomy. It will be necessary to streamline the organization and to delegate the powers to lower levels, discontinuing the system of decision-making only by the top level so as to create a change of mind-set in the lower organizations. Moreover, it will be necessary to create new departments for safety and

- 5 -
health and for quality control to strengthen the awareness of accident prevention and the stable supply of power and heat.
With regards to plant maintenance, it will be necessary to concentrate repair functions in the Repair Department by transferring repair functions scattered in different sections of the operation to that department, thus making clear the Repair Department’s responsibility for equipment failure and promoting quality improvement of maintenance work. The main recommendations are shown below:
Streamline and make clear the line and staff organization and the chain of command Delegate powers to lower levels and share the information within each section (make different
departments and sections thoroughly relate to each other) Create a Safety and Health Department and Quality Control Department
(3) Administration of the Plant Equipment
1) Administration of the Operation
Trips and failure of equipment due to wrong operation by the operators in TES4 have occurred frequently – out of 202 shutdowns in 2000, some 24% of the shutdowns was due to wrong operation by the operators. Hence, countermeasures will be essential and the points to be improved are shown below:
Understanding of plant observation items, alarm values and limiting values, and preparation of the relevant measuring instruments
Strict implementation of inspection patrol and understanding of check points of equipment
Preparation of operation manual and schematic diagrams of the plant Improvement of the method for taking over the next shift and means of in-house
communication Improvement in keeping the operation logs: log sheet, chart, long-term deterioration
record and monthly efficiency report Supervising states of switchgear strictly for maintenance and improvement of coping
with accidents; utilization of training simulator and preparation of operation procedure in case of accidents.
2) Administration of the Maintenance
Given that the repair groups have been repeating similar failures, which leads to a decrease in confiability and an increase in maintenance cost, it will be necessary to take the following countermeasures as shown below:
- 6 -
Improvement in maintenance administration organization: daily repair work, major overhaul and middle overhaul
Understanding of plant conditions: history record of maintenance, inspection results and analysis of causes of failure
Preparation of a maintenance plan based on permanent countermeasures and remaining life assessment
Preparation of repair manual and improvement in repair skills: preparation of a manual and feedback on repair works
Preparation of replacement parts and materials and maintenance of repair and testing tools
Improvement of workplace environment
3) Administration of the Engineering
Management items closely related to the power plant operation, as shown below, are scattered in different sections, which does not allow for efficient management. The administration of the engineering improves the plant efficiency, protects the environment and maintains the plant. Therefore, it will be necessary to review the current organization. Specifically, administration management should be concentrated in a department, absorbing the Engineering Department and Research Department, and particular emphasis should be placed on efficiency management. The relevant departments should cooperate to detect the causes for efficiency decreases and to conduct countermeasures. The items of centralized management are shown below:
Plant efficiency control Coal quality control Plant water quality control Boiler combustion control Plant performance test
4) Administration of the Fuel
It is important to positively make purchase plans, inventory control and administration of receiving and dispatching facilities.
5) Administration of the Inventory
Inventory control is to quantitatively control purchases and stocks such as spare parts in order to assure the procurement of spare parts as planned in terms of quantity and quality, and to store them in such as way as not to deteriorate their functions. It is necessary to

- 7 -
conduct control as planned and without waste in close coordination with the maintenance plans.
6) Administration of Safety and Health
A poor working environment will not only cause industrial accident and occupational disease but also adversely affect of repair work result. The table below shows that there were over 112 industrial accidents in 2000. It is necessary to improve the current working environment. To that effect, it will be necessary to create a department of safety and health control under direct control of the president and to implement the following items in order to improve occupational safety and health.
Number of Industrial Accidents and Return to Work in 2000
(Unit: Case) Return to work Situation of recipients of compensation Number of Industrial
Accidents (number of medical certificates)
Change of job
Return to the original job
Continuing to work Retired Dismissed
112 17 35 10 12 38
Improvement of work place environmental administration organization Thorough instruction for improvement of the work place environment (illumination,
dust and noise) Accident occurrence and measures for reducing industrial accidents to zero Patrol for safety and fire prevention and display of points of danger (hazard display) Safety instructions for repair work, display of work place, and proper arrangement and
order of work place Safety education (participation in an external seminar and practice of safety education
in-house) Workers’ health check
(4) Environmental Conservation
The required items of environmental conservation for TES4 are, firstly, the addition of ash disposal ponds and, secondly, the installation of sirens for safety valves. Moreover, utilizing ash and reducing SOX in flue gas is expected to be required in future, so it will be necessary to prepare for the necessary funds as planned. Shown below are the evaluations and recommendations regarding environmental conservation:

- 8 -
1) TES4 Flue Gas
Measurements made in 1998 show that the density of soot discharged from each unit (converted in 6% O2) varies widely, ranging between 463 - 735 ppm for SO2 and 142 - 475 ppm for NO2.
The dust density (converted in 6% O2) ranges from 190 to 942 mg/m3N in 1998 - 2000.
2) Calculated diffusion of soot
Soot diffusion was calculated by a simple method, revealing that the landing point of maximum density reached a distance of more than 30 km both at an average wind speed of 1.9 m/s and at a maximum wind speed 9.0 m/s in the winter of 2000 (stability of atmosphere: more than 90%), which leads to the supposition that air pollutants had little influence on the city.
3) Noise
Under normal operation of the plant, the noise levels measured in the premises of the plant and the vicinity were below the standard value of 85 dB (A) with little influence on the surrounding environment. However, sometimes when the safety valves discharged steam, the level of acoustic pressure of the safety valves reached about 150 dB (A), exceeding the standard and also beyond the standard level of 85 dB (A) in the vicinity of the power plant. Therefore, it will be necessary to equip noise-eliminating measures such as a silencer.
4) Waste water treatment
All of the waste water of the power plant except domestic waste water is collected in a slurry pit to be utilized for the transport of ash to the ash disposal pond. The current system has no wastewater treatment but wastewater is not discharged out of the system, so it can be considered to have no influence on the surrounding environment.
5) Problems regarding operation of the ash pond
No.3 Ash Pond, which has been used since 1995, is almost full and it will be difficult to meet the demand from 2002. No.4 Ash Pond, which is now under construction, is of an emergent nature (at some 2 year’s of capacity), so that it will be necessary to construct another ash disposal pond with a larger capacity for a stable power supply at the earliest time possible.
Relatively strong winds in spring may affect the surrounding environment with flying ash from No.3 Ash Pond. It will be necessary to conduct partial soil cover, periodic water spray and other measures.

- 9 -
(5) Personnel Training
Even if an excellent organization and management system is established, no growth of an enterprise can be expected without the right human resources. Personnel training within a company is to provide the necessary expertise and personnel training based on the corporate philosophy, business goals and business strategy. It will be necessary to make clear the purpose of a particular personnel training, how the personnel training will be reflected in daily work and to establish a training curriculum with understanding and awareness at organizational and individual levels.
A performance appraisal system including management by objective and a suggestion encouragement system should be periodically reviewed to avoid the mannerism and demerit system. It is vital for each member of staff to conduct a circle of plan, do, check and action consciously. Shown below are the items to be improved:
Promotion of on-the-job training Personnel training of operation and maintenance as well as efficiency management Establishment of corporate philosophy Elicitation of common problems Thorough implementation of management by objective and review of the performance
appraisal system Promotion of the suggestion encouragement system
(6) Financial Management
It will be necessary to change management policy from production-first to profit attaining principles as planned with more profit awareness. The responsibilities for budget making and execution should be made clear in each department and it will be necessary to establish such a system so as to be able to respond flexibly to factors of budgetary change and review cost, the distinction between direct and indirect sections and the production cost calculation for power and heat in order to determine a more accurate production cost.
Fund management will be one of the most important issues of management. Although it is not clear how the issue of receivables and payables will be solved, it will be necessary to prepare funding plans for working funds and capital funds for the future self-management of funds and to establish a system of fund management as a corporation able to conduct fund monitoring and timely measures in order not to fall short of funds.

CHAPTER 1
INTRODUCTION

CHAPTER 1 INTRODUCTION
1.1 Background of Study
Mongolia, with an area of approximately 1.56 million km2 (about 4 times the area of Japan) is located in the eastern part of Central Asia. The country is a landlocked country surrounded by the Russian border in the north and Chinese border in the south. It has a continental climate, with an annual average temperature of 1°C below zero. During the coldest season (from December to January), the outdoor temperature often drops down to 40°C below zero. The annual rainfall is about 300 mm and the rainy season is from June to September.
The population of Mongolia is about 2.4 million. And 0.8 million people live in Ulaanbaatar (about 30% of all population), which is the capital city of Mongolia.
The total capacity of all the power generating facilities in Mongolia is about 830 MW. The electric power supply in this country is fed by three major electrical power systems, namely the Central Energy System (CES), the Eastern Energy System (EES) and the Western Energy System (WES).The power generation capacity of the CES, which has the largest consumption area (Ulaanbaatar City), is currently about 790 MW. TES4 in this study belongs to CES and supplies about 63% of the electrical power demand in CES and about 64% of the total thermal energy demand in Ulaanbaatar City.
However, this power plant was made in former Soviet Union and designed to operate by the indirect combustion system. Because of the frequent occurrence of accidents, the availability of this power plant has been very inferior and this has resulted in frequent electrical power failures as well as the low temperature of hot water for room heating purposes.
In addition to the above project, the counter measure for ashes processing system blockage, the countermeasure for wear-proof coal pulverizer system, and rehabilitation of the hot water supply system has been implemented through two grant aid programs started from 1992.
To cope with this situation and upon the request of the Government of Mongolia, the Japanese Government has started the Phase-I project (for a combustion system conversion of boiler No.1 in 4 out of a total of 8 boilers, improvement-renewal of the control equipment and the supply of boiler tubes) in TES4 under a loan assistance program, which began in 1996.
In May 1998, the Mongolian Government requested loans from the former OECF (the current Japan Bank for International Cooperation, or JBIC) for the conversion of the combustion method of the boilers (No.5 to No.8 boiler), rehabilitation of the control units (No.5 to No.8 boiler), replacement of
1.1-1

the generator excitation systems (No.1 to No.4 Generator), replacement of boiler tubes, etc. as Phase-II of the Rehabilitation Project of the power plant.
This study based on above-mentioned request was implemented, and the M/M signed on July 2 1999, and the S/W signed on September 6 1999.
1.1-2

1.2 Purpose of Study
This study aimed at the implementation of the following works for Phase-II of the Rehabilitation Project of the 4th Thermal Power Plant in Ulaanbaatar, Mongolia. By the study implemented from last year, the purpose of the study has been completed as scheduled.
- Collection, sorting and review of the available material information, and literature - Plant survey of the existing facilities - Determination and verification of the specifications of the equipment to be rehabilitated in Phase-II
and cost estimation to be incurred on the project - Preparation of the bidding documents - Preparation of maintenance and rehabilitation plans for the existing whole plant In accordance with the Agreement confirmed between Mongolia and JBIC, technical specification of the equipment to be rehabilitated in Phase-II and cost estimation were studied. The bidding documents and cost estimation report were duly completed and submitted to Mongolia in September 2001. Accordingly, this report has been made with the focus on maintenance and rehabilitation plans for the whole power plant.
To achieve successful implementation of the rehabilitation project of the existing thermal power plant and to promote the superior results of the Project, establishment of the maintenance and rehabilitation system is necessary not only for the equipment referred to in the loan assistance, but also for the equipment not referred to in the loan assistance. For this reason, the plan for maintenance and rehabilitation referred to all equipment of the existing thermal power plant.
For the management of the electrical thermal power plant including the promotion plan for employees and the economic and financial evaluation, this maintenance and rehabilitation plan was studied from the global perspective. In addition to this, the plan was studied to take into account environmental protection.
1.2-1

1.3 Area of Study
The area to be studied was the 4th Thermal Power Plant and its surroundings (within the city of Ulaanbaatar) in Mongolia.
1.3-1

1.4 Scope of Study
This study was implemented in accordance with the Scope of Work (S/W), which was signed on September 6, 1999 and the scope of the study was as follows. Please note that the data used in this report are those collected until October 2001.
(1) Preparation of maintenance and rehabilitation plan
For the preparation of the plan, not only existing data, information, literatures and documents, but also outline of the design, drawings, supervision planning, construction schedule and executing organization etc. for all facilities and equipment to be rehabilitated were reviewed, examined and investigated.
The plan consisted of the planning of personnel education, training and also financial aspects, in addition to the planning of the facilities to be rehabilitated.
In addition to the above, the plan was designed to cover environmental protection such as air pollution, waste water penetration, ash disposal ponds and so forth.
(2) Cost estimation
The cost estimation for the plan including foreign and local currencies was studied and the annual planning of funds for the plan was examined.
(3) Economic and financial analysis
In relation to the maintenance and rehabilitation plan, the economic internal rate of return (EIRR), financial internal rate of return (FIRR) and sensible analysis were conducted. Based on the above analysis, future financial aspects (profit and loss, asset and balance sheet) were proceeded by consideration of the operation and maintenance.
(4) Assessment for the plan and recommendation
By assessing the plan and extracting problems, recommendations need to be made for the issues to be improved in the future such as the pollution caused by dust (especially), protection against pollution and utilizing waste water etc.
(5) Seminar of technology transfer
A seminar based on the plan needs to be held in Mongolia and the technology transfer to the counterpart should be strictly executed.
1.4-1

CHAPER 2
ECONOMIC SITUATION OF MONGOLIA
CHAPTER 2 ECONOMIC SITUATION OF MONGOLIA
2.1 Political and Economic Background
After the collapse of the Soviet Union and COMECON in 1990, Mongolia transformed from single-party dominance to multi-party democratic government and is on its way to a market economy from a centrally-planned economy. To that effect, liberalization policies have been pushed forward such as the liberalization of prices, international trade and foreign exchange rates, and the privatization and reform of economic sectors.
The disruption of economic infrastructure due to the withdrawal of the Soviet Union has inflicted a serious blow on Mongolia, which has depended mainly on the Soviet Union politically and economically.
Since 1921, The country had been assigned the role of raw material supplier to COMECON, so that monocultural economic development was conducted with copper mines as the main point of development and traditional stock farm products such as wool, leather and cashmere were exported to the Soviet Union. Most industrial products were imported from the Soviet Union on a barter basis. This basic structure of the economy has remained unchanged to date, although trading partners have changed.
Mongolia depended on the Soviet Union not only for international trade but also for technology, management, education and military back-up, which hampered the development of self-reliance and is currently forcing the change to a market economy.
Moreover, since the collapse of the Soviet Union, the country has not received support from the Soviet Union and Soviet technical staff and military troops have withdrawn. This situation has led to a drop in GDP of over 20% and economic dislocation due to a serious shortage of supply and foreign exchange.
Western countries, in response to the democratization of Mongolia in 1992, and as if to fill the void left by Soviet withdrawal, have been extending assistance to the country through aid organizations such as IMF, the World Bank, the Asian Development Bank and bilateral channels.
That assistance helped bail the country out of the economic crisis at the beginning of the 1990s and the country is now attaining a certain level of macroeconomic stability; however, the country is still faced with a pile of problems as it tackles self-sustainable economic development through a market economy.
2.1-1

2.2 Economic Situation
2.2.1 Economic Structure
The area of Mongolia is 1,564,000 km2 and the population is 2,408,000, as of the end of 2000 with a density of slightly over 1.5 person/ km2. About 57% of the population, 1,377,000 people, live in urban areas and rural villages, and the remaining live a nomadic life. In Ulaanbaatar, the capital of the country, there are 787,000 people, more than 30% of the total population, which shows over-concentration in a particular city.
This situation has led to considerable economic problems in maintaining its function as the country’s capital, building the infrastructure and sustaining modern life consumption. It is said that over 35% of the population are below the poverty line, which is another important problem.
The economically active population is 848,000 people as of the end of 2000, of which 809,000 are employed with an unemployment rate of 4.6%, improved from 6.3% as of 1992. The employment structure is shown in Fig. 2.2-1 and nearly 50% are engaged in agriculture and stock farming
Commerce10%
Transp/telecom4%
Education7%
Others9%
Utilities2%
Construction3%
Manufacture7%
Mining2%
Agro/stock-farming49%
Adm/military4%
Finance1%
Hotel/restaurant2%
Agro/stock-farming
Mining
Manufacture
Utilities
Construction
Commerce
Hotel/restaurant
Transp/telecom
Finance
Adm/military
Education
Others
Fig. 2.2-1 Employment Structure
(Source:Mongolian Statistical Yearbook 2000)
Fig. 2.2-2 shows the industrial structure viewed from the GDP with 34% in agriculture and stock farming and 23% in commerce, which represent, combined together, nearly 60% compared to 14% in mining and manufacturing. In terms of mining and manufacturing output including power, heat and water, metal mining accounts for 45%, of which copper occupies the most. Coal accounts for 6%, supplying chiefly the power and heat sector and playing an important role. In manufacturing, textiles
2.2-1

account for 11% and food processing for 12%, which represent, combined together, 23%, mainly processing produce from agriculture and stock farming. Electricity and heat account for 16%, showing its importance to the life and industrial infrastructure of the Mongolian economy.
Agro/stock- farming 34%
Mining 8%
Utilities 3%
Construction 2%
Commerce 23%
Hotel/restaurant 1%
Transp/telecom. 10%
Education 4%
Manufacture 6%
Others 2%
Adm/military 4%
Finance 3%
Agro/stock-farming Mining Manufacture Utilities Construction Commerce Hotel/restaurant Transp/telecom. Finance Adm/military
Others Education
Fig. 2.2-2 Industrial Composition of GDP
(Source:Mongolian Statistical Yearbook 2000)
Metal mining
45%
Other mining
4%
Food processing
12%
Textiles
11%
Other manufacture
5%
Electricity/heat
16%
Water sup
1% Coal
6%
Coal mining
Metal mining
Other mining
Food processing
Textiles
Other manufacture
Electricity/heat
Water sup
Fig. 2.2-3 Mining and Manufacturing Output
(Source:Mongolian Statistical Yearbook 2000)
2.2-2

In international trade, as seen in Fig. 2.2-4 and Fig. 2.2-5, mineral produce, mainly copper, and textile and leather goods are exported, while oil products and other minerals, clothing and manufactured products are imported.
Fluctuation in international prices of the country’s main export items such as copper and cashmere and its main import items such as oil tends to exert a considerable influence not only on the balance of international payments but also on the whole economy, which means vulnerability inherent in the Mongolian economy to price fluctuations in the international market of the above items.
Fig. 2.2-4 Export Structure
(Source:Mongolian Statistical Yearbook 2000)
Food
17%
Mineral
20%
Ch
5%Textile
13%
Equipment
21%
Precision mach.
3%
Others
10%
Vehicles
11%
Food
Mineral
Ch
Textile
Equipment
Veh
Precision mach.
Others
Food
5%
Mineral
41%
Leather
9%
Textile
41%
Others
4%
Food
Mineral
Leather
Textile
Others
Fig. 2.2-5 Import Structure
(Source:Mongolian Statistical Yearbook 2000)
2.2-3

2.2.2 Transition of Economic Situation
The economic size of Mongolia is 1,045 billion Tug in terms of GDP as of the end of 2000 (preliminary estimate), equivalent to some 100 billion Yen. The magnitude of international trade is US$ 502 million in exports and US$ 632 million in imports, evidencing the country’s heavy dependence on international trade.
Economic movement of Mongolia from 1990 through 2000 as shown in Fig. 2.2-6 by key economic indices reveals that GDP decreased considerably from 1990 through 1993, the period for the beginning of democratization.
From 1994 saw a recovery, which has continued since then in both the sectors of industry, and agriculture and stock farming. It should be noted that the large decrease in agriculture and stock farming in 2000 was due to snow damage causing the death of as much as 3.5 million heads of livestock.
-25 -20 -15 -10 -5 0 5
10 15 20
Year
(%)
GDP growth (%) -2.5 -9.2 -9.5 2.3 6.3 2.4 4.0 3.2 1.1 Industry 0.3 -12.5 -9.7 1.7 17.4 -2.0 4.4 1.7 7.3 Agro/stock-farming -1.3 -4.4 -2.1 2.7 4.7 4.8 4.2 -21.4
1990 1991 1992 1994 1995 1996 1997 1999 2000
Fig. 2.2-6 Real GDP Growth Rate
(Source:Ministry of Finance and Economy)
Fig. 2.2-7 shows the balance of international payments, illustrating a chronic deficit in trade and current balances (excluding the official transfer balance). Equilibrium on the balance of payments is attained by influx from financial assistance and overseas borrowing through international aid organizations and donor countries. That situation has increased the external debt burden year by year as shown in Fig. 2.2-8.
2.2-4

-700
-500
-300
-100
100
300
500
700
Ex/Import (million US$)
-200
-150
-100
-50
0
50
100
150
200
International Balance (million US$)
Export 355.8 365.8 367.0 537.4 475.8 568.5 462.4 454.1 502.0
Import -418.4 -374.5 -374.9 -488.9 -510.8 -503.4 -584.5 -567.0 -631.6
Trade balance -62.6 -8.7 -7.9 48.5 -35.0 65.1 -122.1 -112.9 -129.6
Current balance -90.7 -39.9 -40.3 -11.0 -48.1 55.2 -131.3 -127.9 -156.0
1992 1993 1994 1995 1996 1997 1998 1999 2000
Fig. 2.2-7 Balance of International Payments (excl. official transfer balance)
(Source:Ministry of Finance and Economy)
300
400
500
600
700
800
900
Year
million US$
External debt 423.5 493.7 525.4 622.5 717.7 809.3 871.1 1994 1995 1996 1997 1998 1999 2000
Fig. 2.2-8 External Debt Burden
(Source:Ministry of Finance and Economy)
Regarding inflation as seen in Fig. 2.2-9 with the consumers’ price index, the first half of the 1990s saw three-digit hyperinflation and inflation calmed down to below 10% from 1998 onward. Meanwhile, the Tug was devalued by over 60% in 2000 with respect to 1993.
2.2-5

0
50
100
150
200
250
300
350
Year
Inflation (%)
0
200
400
600
800
1000
1200
Tug/US$
Consumer price index change(%) 52.7 325.5 183.0 66.2 53.3 44.6 20.5 6.0 10.0 8.1 Exchange rate (against dollar) 25.9 40.0 396.5 414.1 473.6 693.5 813.2 902.0 1,072.0 1,097.0
1991 1992 1993 1994 1995 1996 1997 1998 1999 2000
Fig. 2.2-9 Inflation and Exchange Rate
(Source:Ministry of Finance and Economy)
The economic overview from 1990 as shown above has revealed that the country’s economy has stabilized in terms of GDP and inflation, while the country’s trade structure with chronic deficit and vulnerability to international prices of prime trade items remain large destabilizing factors. Recent macroeconomic stability has been attained mainly by support from the international community and a pile of problems still remains on the road to self-supporting development.
Fiscal conditions of the Mongolian government, as shown in Fig. 2.2-10, reveal that government spending accounts for about 40% of GDP as of the end of 2000, having a considerable weight with the country’s economy. Government spending has been curbed but tax revenues have not been able to cover the spending so the fiscal deficit has been made up mainly with government borrowing from abroad.
One of key targets in economic management by the government has been to curb inflation and stabilize the exchange rate of the Tug, so that a policy of money and fiscal restraint has been adopted. This tightening policy took effect by holding down inflation but caused the issue of arrears in government organizations with business enterprises, which has led to a debt cycle among business enterprises.
2.2-6

0
10
20
30
40
50
60
Year
Fiscal rev./ex
(%)
-20
-15
-10
-5
0
5
10
15
20
Balance/borrowing
(%)
(as compared toGDP)
Fiscal revenue 26.6 34.7 31.0 26.3 25.2 26.7 29.4 28.8 32.9
Tax revenue 24.3 31.7 24.4 19.2 18.7 19.7 18.8 19.6 25.2
Fiscal expenditure 40.1 52.5 44.2 31.5 32.7 34.5 41.9 39.4 39.3
Fiscal balance -13.4 -17.7 -13.3 -5.2 -7.5 -7.8 -12.5 -10.6 -6.4
Official borrowing (external) 8.7 13.4 8.5 4.3 5.5 11.1 7.7 10.1 6.4
1992 1993 1994 1995 1996 1997 1998 1999 2000
Fig. 2.2-10 Fiscal Situation
(Source:Ministry of Finance and Economy)
The government of Mongolia has set targets such as GDP growth at 6%, inflation at 5% and deficit of the balance of international payments at 13% of the GDP (at the current balance excluding the official transfer balance) in its mid-term targets for the next 3 years announced in 2001’s, “The Government’s Medium Term Strategy and Policies to Deepen Economic Reform and Restructuring.” The government also intends to hold its fiscal deficit below 6.5% by curbing its spending to 37% of GDP against its expected revenues of 31% of GDP.
2.2-7

CHAPTER 3
SITUATION OF POWER AND HEAT SECTOR
OF MONGOLIA

3.1 - 1
CHAPTER 3 SITUATION OF POWER AND HEAT SECTOR OF MONGOLIA
3.1 Sector Structure and Reform
3.1.1 Sector Structure
The power and heat sector of Mongolia is currently (at the time of survey, October 2000) operated by state-owned enterprises under the supervision of the Ministry of Infrastructure. There are three main power grids: the CES linking Ulaanbaatar, the capital of Mongolia, Darkhan, an iron-making city, Erdenet, a copper-mining city and Baganuur, a coal-mining city; the EES centered in Choibalsan; and the WES with constant supply from Russia. In all of these systems, state-owned enterprises are engaged in the power and heat supply business.
Rural areas, which are not connected to these systems, have publicly-operated diesel power stations in Aimags and Soums. The three power grids mentioned above are not interconnected.
Power Grid in Mongolia
Power Plant
Hydro Power Plant
Diesel Power Station ofProvince Center
220 kV Transmission line
220 kV Substation
110 kV Substation
110 kV Transmission line
Fig. 3.1-1 Power Grid in Mongolia

3.1 - 3
In the CES, the largest power grid, there are Thermal Power Plant No.2 (21.5 MW), Thermal Power Plant No.3 (148 MW) and Thermal Power Plant No.4 (540 MW) in Ulaanbaatar, supplying power and heat. There is the Darkhan Power Plant (48 MW) in Darkhan, and the Erdenet Power Plant (28.8 MW) in Erdenet. The total installed capacity of the CES is 786.3 MW.
The EES has the Choibalsan Power Plant (36 MW), while the WES is supplied with electricity from Russia, keeping diesel power on standby for emergency. The total installed capacity of Mongolia is 828.3 MW including the Dalandzadgad Power Plant (6 MW) commissioned in 2000 in the southern Gobi region.
All of the power plants in the three main power grids are coal-fired using domestic coal. Heavy oil used for the startup of power plants and diesel oil used for diesel power plants come entirely from Russia. As coal-fired power plants have a limited ability to follow load, the CES imports electricity from Russia to meet peak demand.
Power produced by the above plants is supplied to each Energy Distribution Office (EDO) through a Transmission Company and heat to Heat Distribution Office (HDO). The Energy Regulatory Authority (ERA), in line with policies established by its supervisor, the Ministry of Infrastructure (renamed the Ministry of Infrastructure Development) supervises and regulates the sector by granting business licenses and approving tariffs.
Dispatching
Ene
rgy
Reg
ulat
ory
Aut
horit
y
Min
istr
y of
Inf
rast
ruct
ure
Dispatching Center
Ope
ratin
g co
mpa
nies
Power Co.
Transmission Co.
Distribution Co.
Heat Co. Con
sum
ers Licence・tariff setting
Regulation
Policy
Supervision
3.1.2 Sector Reform
The government of Mongolia has been engaged in power sector reform for many years as part of market-oriented economic reform. Some structural reforms have so far been made and the New Energy Law enacted in April 2001 makes clear the unbundling of generation, transmission, distribution, dispatch and supply, and makes the acquisition of a license compulsory for each specified business.

3.1 - 4
The Law also created the Energy Regulatory Authority (ERA), actually established in June of the same year, replacing the Energy Authority (EA) to take charge of the supervision and regulation of the power and heat sector. In addition, the Law has made independent state-owned enterprises of generation and distribution, which had been administered by the EA, and established dispatch and transmission business concerns as the National Dispatching Center and the Transmission Company.
In August 2001, a decree was issued to corporatize 18 state-owned enterprises in the energy sector. Thus, it can be said that prima facie, legal and structural grounds have been established with a view to market-oriented reform. At the same time, the government owns all the shares of those corporations so a major issue remains concerning how much management independence the new corporations can acquire on account of their being government-owned joint stock companies.
The power sector reform movement to date will be described below.
Until 1996, state enterprises for each power grid such as the CES operated vertically integrated power business from generation to distribution under the supervision of the then Ministry of Energy, Geology and Minerals (MEGM).
Policy/supervision Power/heat MEGM CES Consumers
The Energy Law enacted in 1996 created the EA to replace CES and other state enterprises. The EA successfully acquired the power and heat supply facilities of those state enterprises to manage all three power grids. In terms of organization, the EA became the parent company of each operating company, the latter of which became its subsidiary, to set out financially independent state-owned enterprises covering the supply cost.
This reform gave the EA 6 major thermal power plants, 4 power distribution offices and 2 heat distribution offices under its ownership and supervision. At the same time, power grids and dispatching were directly operated by the EA. The MEGM was also reorganized to become the Ministry of Infrastructure Development (MOID) to supervise the EA.

3.1 - 5
MOID
EADispatching/grids
TES2
TES3
TES4
Darkhan PS
Erdenet PS
Baganuur HOB
Ulaanbaatar EDO
Baganuur EDO
Darkhan/Selenge EDO
Erdenet/Bulgan EDO
Ulaanbaatar HDO
Darkhan HDO
West Grid East Grid
Con
sum
ers
Along with that reform, in order to enable market-oriented business operation, EA opted to introduce an accounting system to conform to the International Accounting Standards (IAS) instead of the Soviet accounting system.
At the same time, in order to make the tariff level sufficiently reflect the practical production cost, asset revaluation was conducted based on the factors approved by the Ministry of Finance. Tariff was revised several times to improve the financial situation of the EA: a 60% raise for power and heat in September 1996, 28% for power and 13% for heat in January 1997 and 15% for power and 80% for heat between May and July of the same year, striving for sufficient revenue recovery to cover the supply cost and rational profit.
Furthermore, in order to maintain a practical level of tariff, the automatic tariff adjustment mechanism was introduced from September 1997 and the tariff was raised by over 20% in 1998 reflecting devaluation of the Tug. Since then, no raise had been made on account of political considerations until the tariff was raised by 14% for power and by 35% for heat in December 2000. Nevertheless, the heat sector remained in deficit against the power sector in surplus and such a situation could not improve the EA’s chronic deficit as a whole.
In spite of the supposedly financial independence of each state-owned enterprise, they were forced to follow the intentions of the EA and the government with respect to the production plan, tariff, budget, sales recovery, personnel assignment and other important issues of management and could not have autonomy.

3.1 - 6
In April 2001, the government of Mongolia enacted the New Energy Law in order to realize a radical reform based on market-economy principles. Thus, the EA was disbanded and the foundation for energy sector reform was laid based on a market economy. Nevertheless, the EA would remain in existence with a limited function and would take charge of the recovery of accumulated receivables and payables of energy sales according to the “Privatization Guidelines for 2001-2004.”
The above Privatization Guidelines are intended to conduct the sector reform in two stages: the first stage will reform the sector in such a fashion as to commercialize the current system of management and production in line with market principles. To that effect, the following measures are to be taken:
1) Separate the regulatory function from the EA and delegate it to an independent regulatory organization according to the New Energy Law;
2) Reform the business units of energy production and distribution into commercial corporations;
3) Separate and privatize the repair and maintenance sections from the generation and transmission corporations; and,
4) Reorganize the EA into an organization in charge of the recovery of receivables and payables.
In August 2001, the following state-owned enterprises were corporatized by a decree according to the above guidelines. As of the time of survey, however, those corporations remained wholly owned by the government.
- Generation: TES2, TES3, TES4, Erdenet Power Plant, Darkhan Power Plant, Dalandzadgad Power Plant
- Heat Production: Baganuur HOB (heat only boiler) Nalaikha HOB - Transmission: Central Transmission Co., Eastern Transmission Co. and Western Transmission
Co. - Distribution: Ulaanbaatar EDO, Erdenet/Bulgan EDO, Darkhan/Selenge EDO, Baganuur/
Southeastern EDO - Heat supply: Ulaanbaatar HDO and Darkhan HDO - Dispatch: National Dispatching Center
The above first stage has almost been completed to date in legal and organizational terms. In the meantime, the management of each corporation and business relations between them are a major issue with a view to reform based on a market economy and commercialization. At the same time, a huge pile of accumulated receivables and payables between the corporations, government organizations and coal companies remains a serious issue for their management.

3.1 - 7
The second stage of the sector reform is going to implement phased privatization of the above corporatized power and distribution entities owned by the state, and is going to sell them to strategic investors by tender. The transmission companies and dispatching center are supposed to remain state-owned.
At the time of survey, the following corporations had been listed for privatization:
- TES2 - TES3 - Darkhan Power Plant - Erdenet Power Plant - Baganuur HOB - Darkhan EDO - Erdenet/Bulgan EDO
In future, foreign capital is expected to participate in the energy sector, while there are plans for the transit of pipelines for oil and gas as well as electricity between Russia and China. Development of those plans may considerably affect the country’s energy sector. At the same time, oil exploitation, now at the exploratory stage, is expected to bring about a considerable influence if its output is found to be large.

3.2 - 1
3.2 Power Supply and Demand
Table 3.2-1 shows the historical change of power supply and demand of the Central Grid which TES4 supplies.
Table 3.2-1 Historical Change of Supply and Demand of Central Grid (Unit:GWh)
1990 1991 1992 1993 1994 1995 1996 1997 1998 1999 2000
Power production (generation end)
3,348 2,722 2,612 2,481 2,523 2,628 2,614 2,720 2,574 2,740 2,871
Auxiliary power 534 626 525 552 562 598 579 608 532 628 640 Auxiliary power ratio (%)
16% 23% 20% 22% 22% 23% 22% 22% 21% 23% 22%
Power production (sending end)
2,841 2,096 2,087 1,929 1,961 2,030 2,035 2,112 2,042 2,112 2,231
Power import 228 84 99 198 215 381 383 376 356 195 184
Power export 76 33 68 53 60 28 69 42 60 59 25 Power supply (sending end)
2,966 2,147 2,118 2,074 2,116 2,383 2,349 2,446 2,337 2,248 2,390
Transmission loss 323 340 287 289 262 598 413 507 823 549
Transmission loss (%) 11% 16% 14% 14% 12% 25% 18% 21% 35% 24%
Power sales 2,643 1,807 1,831 1,785 1,854 1,785 1,936 1,939 1,514 1,699 Power sales (growth rate)
-31.6% 1.3% -2.5% 3.9% -3.7% 8.5% 0.2% -21.9% 12.2%
Maximum demand 530 524 481 468 464 477 488 506 512 499 526 Maximum demand (growth rate)
-10.2% -1.1% -8.2% -2.7% -0.9% 2.8% 2.3% 3.7% 1.2% -2.5% 5.4%
(Source:MOI ‘Capacity Building in Energy Planning’)
In 2000, power generation (at the sending end) amounted to 2,231 GWh against 2.841 GWh in 1990, when market-oriented economic reform began, showing a recovery of only 80%. This well illustrates that the economic collapse due to the loss of Soviet support and the withdrawal of Soviet troops, who used to be large consumers of energy in socialist times, had a huge impact on the energy sector.
Station loss and transmission/distribution loss continued to be large, which is considered to be due to aging of the facilities and other technical causes, and partly due to insufficient billing and theft, particularly with respect to transmission/distribution loss.
Fig. 3.2-1 shows the power supply composition on a kWh basis. TES4 meets 63% of the total demand as of 2000, evidencing its importance. Import from Russia accounts for 8%.
Fig. 3.2-2 shows the power demand composition on a kWh basis. Erdenet copper mines account for more than 30%. This leads us to believe that the operating situation of Erdenet copper mines and their payment of electricity bills affect the management of power utilities.

3.2 - 2
TES23% TES3
16%
TES463%
Darhan7%
Erdenet3%
Import8%
Fig. 3.2-1 Power Supply Composition of CES(as of 2000)
(Source: TES4)
Fig. 3.2-2 Power Demand Composition(as of 2000)
(Source: MOI ‘Capacity Building in Energy Planning’)
A power dispatcher operates the power system in such a way that part of the base load is allocated to other power plants rather than TES4, and the remaining part of the base load not covered by those power plants and the peak load are met by TES4. And the part of the peak load, which cannot be met by TES4, is covered by import from Russia.
Table 3.2-2 shows the power supply and demand forecast. This table is a forecast mainly based on a power system master plan prepared under technical assistance by ADB, showing a growth rate as high as 2.3% (average).
This forecast, which incorporates the effects of the rehabilitation of TES4 (expected maximum supply of 2,270 GWh), reveals that it will be necessary to continue power import from Russia and to plan new power plants in order to make up for the retirement of TES2 and TES3.
Other than
29%
Mines 32% 39%
Erdenet
Ulaanbaatar

3.2 - 3
Table 3.2-2 (1) Power Supply and Demand Forecast
F O R E C A S T O N P O W E R D E M A N D (P O W E R & E N E R G Y ) A N D S U P P L Y U P T O T H E Y E A R 2 0 2 0c a s e -1 : w ith o u t p h a s e -II, III p ro je c t
1 9 9 5 1 9 9 6 1 9 9 7 1 9 9 8 1 9 9 9 2 0 0 0 2 0 0 1 2 0 0 2 2 0 0 3 2 0 0 4 2 0 0 5 2 0 0 6 2 0 0 7M W 1 8 1 5 1 8 1 8 1 8 1 8 1 8 1 8 1 8 1 0 5 0G W h 7 8 6 3 7 8 7 8 7 6 7 6 7 6 7 6 7 6 4 2 2 1 0M W 3 5 5 8 4 1 6 7 6 7 6 7 7 0 7 0 7 0 6 0 5 5 4 0G W h 2 0 0 3 3 1 2 3 4 3 7 1 3 8 2 3 8 2 3 9 9 3 9 9 3 9 9 3 4 2 3 1 4 2 2 8M W 2 7 0 3 1 5 3 1 5 3 2 0 3 3 0 3 4 0 3 5 0 3 6 0 3 8 0 3 8 0 3 9 0 4 0 0G W h 1 ,3 1 5 1 ,4 1 1 1 ,3 8 5 1 ,3 8 7 1 ,4 7 0 1 ,5 2 6 1 ,5 7 2 1 ,5 9 2 1 ,6 4 0 1 ,6 8 9 1 ,6 4 3 1 ,6 9 2 1 ,6 9 2M W 2 9 2 2 3 2 3 2 3 2 3 2 3 2 3 2 3 0 2 8 2 5 2 4G W h 1 4 7 1 1 1 1 6 2 1 6 2 1 6 2 1 6 2 1 6 2 1 6 2 1 5 2 1 4 2 1 2 6 1 2 1M W 1 6 1 6 2 2 2 2 2 2 2 2 2 2 2 2 2 2 2 2 2 2 2 2G W h 6 0 6 0 8 3 8 3 8 3 8 3 8 3 8 3 8 3 8 3 8 3 8 3M W 3 0G W h 1 5 0M W 3 6 8 4 2 6 4 2 8 4 5 9 4 6 9 4 7 9 4 9 2 5 0 2 5 2 0 5 0 0 4 9 7 5 1 6G W h 1 ,8 9 5 1 ,9 5 0 1 ,9 4 4 2 ,1 6 3 2 ,2 2 8 2 ,2 7 5 2 ,3 1 2 2 ,3 6 0 2 ,3 9 9 2 ,2 5 2 2 ,2 3 6 2 ,2 7 4
M a x im u m p o w e r d e m a n d M W 4 8 8 5 0 6 5 1 2 5 2 1 5 3 1 5 4 0 5 5 0 5 6 0 5 7 0 5 8 0 5 9 3 6 0 1E n e rg y d e m a n d G W h 2 ,2 7 1 2 ,2 9 1 2 ,2 8 4 2 ,3 5 8 2 ,4 1 2 2 ,4 6 7 2 ,5 2 4 2 ,5 8 2 2 ,6 4 1 2 ,7 0 2 2 ,7 6 4 2 ,8 2 8
M W 1 2 0 8 0 8 4 6 2 6 2 6 1 5 8 5 8 5 0 8 0 9 6 8 5G W h 3 7 6 3 4 1 3 4 0 1 9 5 1 8 4 1 9 2 2 1 2 2 2 2 2 4 3 4 5 0 5 2 8 5 5 3
2 0 0 8 2 ,0 0 9 2 ,0 1 0 2 ,0 1 1 2 ,0 1 2 2 ,0 1 3 2 ,0 1 4 2 ,0 1 5 2 ,0 1 6 2 ,0 1 7 2 ,0 1 8 2 ,0 1 9 2 ,0 2 0M W 0 0 0 0 0 0 0 0 0 0 0 0 0G W h 0 0 0 0 0 0 0 0 0 0 0 0 0M W 4 0 3 5 3 5 3 5 3 5 3 5 3 5 3 5 3 2 2 0 1 8 0 0G W h 2 2 8 2 0 0 2 0 0 2 0 0 2 0 0 2 0 0 2 0 0 2 0 0 1 8 3 1 1 4 1 0 3 0 0M W 4 0 0 4 0 0 4 0 0 4 0 0 4 0 0 4 0 0 4 0 0 4 0 0 3 0 0 3 2 0 3 4 0 3 6 0 3 8 0G W h 1 ,6 9 2 1 ,6 9 2 1 ,6 9 2 1 ,6 9 2 1 ,6 9 2 1 ,6 9 2 1 ,6 9 2 1 ,6 9 2 1 ,6 9 2 1 ,6 9 2 1 ,6 9 2 1 ,6 9 2 1 ,6 9 2M W 2 0 1 5 5 0 0 0 0 0 0 0 0 0 0G W h 1 0 1 7 6 2 5 0 0 0 0 0 0 0 0 0 0M W 2 2 2 2 2 2 2 2 2 2 2 2 2 2 2 2 2 2 2 2 2 2 2 2 2 2G W h 8 3 8 3 8 3 8 3 8 3 8 3 8 3 8 3 8 3 8 3 8 3 8 3 8 3M W 4 0 5 0 6 0 7 0 9 0 1 1 0 1 3 0 1 5 0 1 7 0 1 9 0 2 1 0 2 3 0 2 5 0G W h 2 0 0 2 5 0 3 0 0 3 5 0 4 5 0 5 5 0 6 5 0 7 5 0 8 5 0 9 5 0 1 ,0 5 0 1 ,1 5 0 1 ,2 5 0M W 5 2 2 5 2 2 5 2 2 5 2 7 5 4 7 5 6 7 5 8 7 6 0 7 5 2 4 5 5 2 5 9 0 6 1 2 6 5 2G W h 2 ,3 0 4 2 ,3 0 1 2 ,3 0 0 2 ,3 2 5 2 ,4 2 5 2 ,5 2 5 2 ,6 2 5 2 ,7 2 5 2 ,8 0 8 2 ,8 3 9 2 ,9 2 8 2 ,9 2 5 3 ,0 2 5
M a x im u m p o w e r d e m a n d M W 6 1 2 6 2 3 6 3 4 6 4 6 6 5 7 6 6 9 6 8 1 6 9 3 7 0 6 7 1 9 7 3 2 7 4 5 7 5 8E n e rg y d e m a n dA v e . a n n u a l in c re a s e 2 0 0 0 -2 0 2 0 2 .3 % /y e a r
G W h 2 ,8 9 3 2 ,9 5 9 3 ,0 2 7 3 ,0 9 7 3 ,1 6 8 3 ,2 4 1 3 ,3 1 6 3 ,3 9 2 3 ,4 7 0 3 ,5 5 0 3 ,6 3 1 3 ,7 1 5 3 ,8 0 0
M W 9 0 1 0 1 1 1 2 1 1 9 1 1 0 1 0 2 9 4 8 6 1 8 2 1 6 7 1 4 2 1 3 3 1 0 6G W h 5 8 9 6 5 9 7 2 7 7 7 2 7 4 3 7 1 6 6 9 1 6 6 7 6 6 2 7 1 1 7 0 4 7 9 0 7 7 5
T o ta l
D e m a n d
S u p p ly
T o ta l
T h e 2 n d T h e rm a l P o w e r P la n t
T h e 3 rd T h e rm a l P o w e r P la n t
T h e 4 th T h e rm a l P o w e r P la n t
D a rk h a n T h e rm a l P o w e r P la n t
E rd e n e t T h e rm a l P o w e r P la n t
N e w P o w e r P la n t
N e w P o w e r P la n t
D e m a n d
Im p o rt E le c tr ic P o w e r
Im p o rt E le c tr ic P o w e r
S u p p ly
T h e 2 n d T h e rm a l P o w e r P la n t
T h e 3 rd T h e rm a l P o w e r P la n t
T h e 4 th T h e rm a l P o w e r P la n t
D a rk h a n T h e rm a l P o w e r P la n t
E rd e n e t T h e rm a l P o w e r P la n t
Note) Phase III is the rehabilitation plant which ranked A, B and C to Chapter 5

3.2 - 4
Table 3.2-2 (2) Power Supply and Demand Forecast
F O R E C A S T O N P O W E R D E M A N D (P O W E R & E N E R G Y ) A N D S U P P L Y U P T O T H E Y E A R 2 0 2 0c a s e -2 : w ith p h a s e -II, III p ro je c t
1 9 9 5 1 9 9 6 1 9 9 7 1 9 9 8 1 9 9 9 2 0 0 0 2 0 0 1 2 0 0 2 2 0 0 3 2 0 0 4 2 0 0 5 2 0 0 6 2 0 0 7M W 1 8 1 5 1 8 1 8 1 8 1 8 1 8 1 8 1 8 1 0 5 0G W h 7 8 6 3 7 8 7 8 7 6 7 6 7 6 7 6 7 6 4 2 2 1 0M W 3 5 5 8 4 1 6 7 6 7 6 7 7 0 7 0 7 0 6 0 5 5 4 0G W h 2 0 0 3 3 1 2 3 4 3 7 1 3 8 2 3 8 2 3 9 9 3 9 9 3 9 9 3 4 2 3 1 4 2 2 8M W 2 7 0 3 1 5 3 1 5 3 2 0 3 3 0 3 4 0 3 5 0 3 6 0 3 8 0 3 8 0 3 9 0 4 0 0G W h 1 ,3 1 5 1 ,4 1 1 1 ,3 8 5 1 ,3 8 7 1 ,4 7 0 1 ,5 2 6 1 ,5 7 2 1 ,5 9 2 1 ,6 7 3 1 ,7 2 3 1 ,6 7 6 1 ,7 2 6 1 ,7 2 6M W 2 9 2 2 3 2 3 2 3 2 3 2 3 2 3 2 3 0 2 8 2 5 2 4G W h 1 4 7 1 1 1 1 6 2 1 6 2 1 6 2 1 6 2 1 6 2 1 6 2 1 5 2 1 4 2 1 2 6 1 2 1M W 1 6 1 6 2 2 2 2 2 2 2 2 2 2 2 2 2 2 2 2 2 2 2 2G W h 6 0 6 0 8 3 8 3 8 3 8 3 8 3 8 3 8 3 8 3 8 3 8 3M W 3 0G W h 1 5 0M W 3 6 8 4 2 6 4 2 8 4 5 9 4 6 9 4 7 9 4 9 2 5 0 2 5 2 0 5 0 0 4 9 7 5 1 6G W h 1 ,8 9 5 1 ,9 5 0 1 ,9 4 4 2 ,1 6 3 2 ,2 2 8 2 ,2 7 5 2 ,3 1 2 2 ,3 9 3 2 ,4 3 3 2 ,2 8 5 2 ,2 7 1 2 ,3 0 9
M a x im u m p o w e r d e m a n d M W 4 8 8 5 0 6 5 1 2 5 2 1 5 3 1 5 4 0 5 5 0 5 6 0 5 7 0 5 8 0 5 9 3 6 0 1E n e rg y d e m a n dA v e . a n n u a l in c re a s e 2 0 0 0 -2 0 2 0 2 .3 % /y e a r
G W h 2 ,2 7 1 2 ,2 9 1 2 ,2 8 4 2 ,3 5 8 2 ,4 1 2 2 ,4 6 7 2 ,5 2 4 2 ,5 8 2 2 ,6 4 1 2 ,7 0 2 2 ,7 6 4 2 ,8 2 8
M W 1 2 0 8 0 8 4 6 2 6 2 6 1 5 8 5 8 5 0 8 0 9 6 8 5G W h 3 7 6 3 4 1 3 4 0 1 9 5 1 8 4 1 9 2 2 1 2 1 8 9 2 0 8 4 1 7 4 9 4 5 1 9
2 0 0 8 2 ,0 0 9 2 ,0 1 0 2 ,0 1 1 2 ,0 1 2 2 ,0 1 3 2 ,0 1 4 2 ,0 1 5 2 ,0 1 6 2 ,0 1 7 2 ,0 1 8 2 ,0 1 9 2 ,0 2 0M W 0 0 0 0 0 0 0 0 0 0 0 0 0G W h 0 0 0 0 0 0 0 0 0 0 0 0 0M W 4 0 3 5 3 5 3 5 3 5 3 5 3 5 3 5 3 2 2 0 1 8 0 0G W h 2 2 8 2 0 0 2 0 0 2 0 0 2 0 0 2 0 0 2 0 0 2 0 0 1 8 3 1 1 4 1 0 3 0 0M W 4 0 0 4 0 0 4 0 0 4 0 0 4 0 0 4 0 0 4 0 0 4 0 0 3 0 0 3 2 0 3 4 0 3 6 0 3 8 0G W h 1 ,8 6 2 1 ,9 9 8 2 ,1 3 4 2 ,2 7 0 2 ,2 7 0 2 ,2 7 0 2 ,2 7 0 2 ,2 7 0 2 ,2 7 0 2 ,2 7 0 2 ,2 7 0 2 ,2 7 0 2 ,2 7 0M W 2 0 1 5 5 0 0 0 0 0 0 0 0 0 0G W h 1 0 1 7 6 2 5 0 0 0 0 0 0 0 0 0 0M W 2 2 2 2 2 2 2 2 2 2 2 2 2 2 2 2 2 2 2 2 2 2 2 2 2 2G W h 8 3 8 3 8 3 8 3 8 3 8 3 8 3 8 3 8 3 8 3 8 3 8 3 8 3M W 4 0 5 0 6 0 7 0 9 0 1 1 0 1 3 0 1 5 0 1 7 0 1 9 0 2 1 0 2 3 0 2 5 0G W h 2 0 0 2 5 0 3 0 0 3 5 0 4 5 0 5 5 0 6 5 0 7 5 0 8 5 0 9 5 0 1 ,0 5 0 1 ,1 5 0 1 ,2 5 0M W 5 2 2 5 2 2 5 2 2 5 2 7 5 4 7 5 6 7 5 8 7 6 0 7 5 2 4 5 5 2 5 9 0 6 1 2 6 5 2G W h 2 ,4 7 4 2 ,6 0 7 2 ,7 4 2 2 ,9 0 3 3 ,0 0 3 3 ,1 0 3 3 ,2 0 3 3 ,3 0 3 3 ,3 8 6 3 ,4 1 7 3 ,5 0 6 3 ,5 0 3 3 ,6 0 3
M a x im u m p o w e r d e m a n d M W 6 1 2 6 2 3 6 3 4 6 4 6 6 5 7 6 6 9 6 8 1 6 9 3 7 0 6 7 1 9 7 3 2 7 4 5 7 5 8E n e rg y d e m a n dA v e . a n n u a l in c re a s e 2 0 0 0 -2 0 2 0 2 .3 % /y e a r
G W h 2 ,8 9 3 2 ,9 5 9 3 ,0 2 7 3 ,0 9 7 3 ,1 6 8 3 ,2 4 1 3 ,3 1 6 3 ,3 9 2 3 ,4 7 0 3 ,5 5 0 3 ,6 3 1 3 ,7 1 5 3 ,8 0 0
M W 9 0 1 0 1 1 1 2 1 1 9 1 1 0 1 0 2 9 4 8 6 1 8 2 1 6 7 1 4 2 1 3 3 1 0 6G W h 4 1 9 3 5 3 2 8 5 1 9 4 1 6 5 1 3 8 1 1 3 8 9 8 4 1 3 3 1 2 6 2 1 2 1 9 7
T o ta l
D e m a n d
S u p p ly
T o ta l
T h e 2 n d T h e rm a l P o w e r P la n t
T h e 3 rd T h e rm a l P o w e r P la n t
T h e 4 th T h e rm a l P o w e r P la n t
D a rk h a n T h e rm a l P o w e r P la n t
E rd e n e t T h e rm a l P o w e r P la n t
N e w P o w e r P la n t
N e w P o w e r P la n t
D e m a n d
Im p o rt E le c tr ic P o w e r
Im p o rt E le c tr ic P o w e r
S u p p ly
T h e 2 n d T h e rm a l P o w e r P la n t
T h e 3 rd T h e rm a l P o w e r P la n t
T h e 4 th T h e rm a l P o w e r P la n t
D a rk h a n T h e rm a l P o w e r P la n t
E rd e n e t T h e rm a l P o w e r P la n t
Note) Phase III is the rehabilitation plant which ranked A, B and C to Chapter 5

3.3 - 1
3.3 Heat Supply and Demand
In major cities, heat is supplied by power and heat cogeneration facilities, and heat only boilers. Ulaanbaatar is supplied by TES2, TES3 and TES4.
Fig. 3.3-1 shows the heat supply composition as of 2000 (hot water and heat combined); TES4 accounts for 64%, playing an important role in the heat sector as well.
Table 3.3-2 shows the heat supply and demand forecast. This table shows a growth rate as high as 2.3% (average), similar to the power demand forecast and reveals that it is possible to meet the demand growth with the effects of the rehabilitation of TES4 (expected maximum supply of 7,600T-cal) in terms of demand volume.
TES24%
TES332%
TES464%
Fig. 3.3-1 Heat Supply Composition in Ulaanbaatar
(Source:TES4)

3.3 - 2
Table 3.3-1 (1) Heat Supply and Demand Forecast
FORECAST ON HEATING DEMAND AND SUPPLY UP TO THE YEAR 2020case-1: without phase-II, III project
1995 1996 1997 1998 1999 2000 2001 2002 2003 2004 2005 2006 2007district heating T-cal 120 120 120 120 120 120 120 120industrial steam T-cal 25 25 25 25 25 25 25 25district heating T-cal 1,096 1,096 1,096 1,096 1,096 1,096 1,096 1,096industrial steam T-cal 144 144 144 144 144 144 144 144district heating T-cal 2,074 2,119 2,023 2,121 2,233 2,449 2,526 2,606 2,688 2,771 2,855 2,985 3,118industrial steam T-cal 74 74 74 74 74 74 74 74 74 74 74 74 74district heating T-cal 3,612 3,755 3,070 3,211 3,664 3,742 3,822 3,904 3,987 4,071 4,201 4,334industrial steam T-cal 244 243 156 114 243 243 243 243 243 243 243 243
Demand
Energy demand2000-2005 2.0%/year2005- 2010 3.0%/year2010-2015 2.4%/year2015-2020 1.9%/year
grossdistributedheat
T-cal 3,856 3,998 3,226 3,325 3,907 3,986 4,065 4,147 4,230 4,314 4,444 4,577
0 0 0 0 0 0 0
2008 2,009 2,010 2,011 2,012 2,013 2,014 2,015 2,016 2,017 2,018 2,019 2,020district heating T-cal 0 0 0 0 0 0 0 0 0 0 0 0 0industrial steam T-cal 0 0 0 0 0 0 0 0 0 0 0 0 0district heating T-cal 1,096 1,096 1,096 1,096 1,096 1,096 1,096 1,096 1,096 1,096 1,096 0 0industrial steam T-cal 144 144 144 144 144 144 144 144 144 144 144 0 0district heating T-cal 3,263 3,400 4,076 4,205 4,338 4,473 4,612 4,754 4,869 4,987 5,106 5,111 5,111industrial steam T-cal 74 74 74 74 74 74 74 74 74 74 74 74 74district heating T-cal 4,359 4,496 5,172 5,301 5,434 5,569 5,708 5,850 5,965 6,083 6,202 5,111 5,111industrial steam T-cal 218 218 218 218 218 218 218 218 218 218 218 74 74
Demand
Energy demand2000-2005 2.0%/year2005- 2010 3.0%/year2010-2015 2.4%/year2015-2020 1.9%/year
grossdistributedheat
T-cal 4,577 4,714 5,390 5,519 5,652 5,787 5,926 6,068 6,183 6,301 6,420 6,542 6,657
Supply
The 2nd Thermal Power Plant
The 3rd Thermal Power Plant
The 4th Thermal Power Plant
ULAANBAATAR (Total)
Supply
The 2nd Thermal Power Plant
The 3rd Thermal Power Plant
The 4th Thermal Power Plant
ULAANBAATAR (Total)
Note) Phase III is the rehabilitation plant which ranked A, B and C to Chapter 5

3.3 - 3
Table 3.3-1 (2) Heat Supply and Demand Forecast
FORECAST ON HEATING DEMAND AND SUPPLY UP TO THE YEAR 2020case-2: with phase-II, III project
1995 1996 1997 1998 1999 2000 2001 2002 2003 2004 2005 2006 2007district heating T-cal 120 120 120 120 120 120 120 120industrial steam T-cal 25 25 25 25 25 25 25 25district heating T-cal 1,096 1,096 1,096 1,096 1,096 1,096 1,096 1,096industrial steam T-cal 144 144 144 144 144 144 144 144district heating T-cal 2,074 2,119 2,023 2,121 2,233 2,449 2,526 2,606 2,688 2,771 2,855 2,985 3,118industrial steam T-cal 74 74 74 74 74 74 74 74 74 74 74 74 74district heating T-cal 3,612 3,755 3,070 3,211 3,664 3,742 3,822 3,904 3,987 4,071 4,201 4,334industrial steam T-cal 244 243 156 114 243 243 243 243 243 243 243 243
Demand
Energy demand2000-2005 2.0%/year2005- 2010 3.0%/year2010-2015 2.4%/year2015-2020 1.9%/year
grossdistributedheat
T-cal 3,856 3,998 3,226 3,325 3,907 3,986 4,065 4,147 4,230 4,314 4,444 4,577
0 0 0 0 0 0 0
2008 2,009 2,010 2,011 2,012 2,013 2,014 2,015 2,016 2,017 2,018 2,019 2,020district heating T-cal 0 0 0 0 0 0 0 0 0 0 0 0 0industrial steam T-cal 0 0 0 0 0 0 0 0 0 0 0 0 0district heating T-cal 1,096 1,096 1,096 1,096 1,096 1,096 1,096 1,096 1,096 1,096 1,096 0 0industrial steam T-cal 144 144 144 144 144 144 144 144 144 144 144 0 0district heating T-cal 3,263 3,400 4,076 4,205 4,338 4,473 4,612 4,754 4,869 4,987 5,106 6,468 6,583industrial steam T-cal 74 74 74 74 74 74 74 74 74 74 74 74 74district heating T-cal 4,359 4,496 5,172 5,301 5,434 5,569 5,708 5,850 5,965 6,083 6,202 6,468 6,583industrial steam T-cal 218 218 218 218 218 218 218 218 218 218 218 74 74
Demand
Energy demand2000-2005 2.0%/year2005- 2010 3.0%/year2010-2015 2.4%/year2015-2020 1.9%/year
grossdistributedheat
T-cal 4,577 4,714 5,390 5,519 5,652 5,787 5,926 6,068 6,183 6,301 6,420 6,542 6,657
Supply
The 2nd Thermal Power Plant
The 3rd Thermal Power Plant
The 4th Thermal Power Plant
ULAANBAATAR (Total)
Supply
The 2nd Thermal Power Plant
The 3rd Thermal Power Plant
The 4th Thermal Power Plant
ULAANBAATAR (Total)
Note) Phase III is the rehabilitation plant which ranked A, B and C to Chapter 5

3.4 - 1
3.4 Power and Heat Tariff
3.4.1 Tariff Level Movement
For about 30 years, between 1960 and 1990, energy prices including heat were charged at nominal levels such as 0.35 Tug/kWh for residential use and 0.18 Tug/kWh for industrial use. Table 3.4-1 and Fig. 3.4-1 show the movement of energy prices from 1991 onward.
Table 3.4-1 Energy Price Movement(nominal term)
unit 1991 1992 1993 1994 1995 1996 1997 1998 1999 2000 Coal Tug/ton 88 208 1,925 2,688 2,688 3,346 5,991 7,220 7,191 8,338 Oil Tug/ton 1,260 6,560 47,240 58,459 67,500 77,876 94,796 98,000 111,575 123,000 Elec. Tug/MWh 382 983 8,466 15,000 15,000 16,520 33.480 38,000 38,000 45,000 Heat Tug/Gcal 87 175 577 1,232 1,232 1,475 2,739 2,880 2,880 5,000
(Source: ADB and ERA)
0
5,000
10,000
15,000
20,000
25,000
30,000
35,000
40,000
45,000
50,000
1991 1992 1993 1994 1995 1996 1997 1998 1999 2000
Other Prices
0
20,000
40,000
60,000
80,000
100,000
120,000
140,000
Fuel Oil
Electricity
Heat
Coal
Fuel oil
Fig. 3.4-1 Energy Price Movement(nominal term)
The above Fig.3.4-1 plots the prices in Table 3.4-1, while Table 3.4-2 translates the movement of nominal energy prices in Table 3.4-1 into real terms with 1991 as the base year, taking into account the inflation rate and the ratio of change of the energy prices. Fig. 3.4-2 indexes the price movement based on Table 3.4-2.
(Tug) (Tug)

3.4 - 2
Table 3.4-2 Energy Price Movement(real term at 1991 level)
unit 1991 1992 1993 1994 1995 1996 1997 1998 1999 2000 Coal Tug/ton 88 49 160 134 88 75 112 127 115 124 Oil Tug/ton 1,260 1,542 3,923 2,921 2,200 1,755 1,773 1,729 1,790 1,825
Elec. Tug/MWh 382 231 703 750 489 372 626 671 610 668 Heat Tug/Gcal 87 41 48 62 40 33 51 51 46 74
0
0.5
1
1.5
2
2.5
3
3.5
1991 1992 1993 1994 1995 1996 1997 1998 1999 2000
Electricity
Heat
Coal
Fuel oil
Fig. 3.4-2 Energy Price Movement(real term)
The movement of energy prices in real terms reveals that the prices of coal, heavy oil and power increased 2 to 3 times in 1993 with respect to 1991 levels, and those prices got close to 1991 levels and then remained stable from 1997 onward to reach nearly 1.5 times that of the 1991 levels as of 2000.
In the meantime, the heat price decreased by half of the 1991 level and then remained almost at the same level, and went up to a level slightly below the 1991 level in 2000. It has been revealed that the heat price was suppressed more than the other energy prices.
The same movement as translated into nominal dollar terms with respect to 1991, shown in Table 3.4-3 and Fig.3.4-3, shows that the coal price increased nearly 2 times in 1994 and then decreased to 1.4 times that of the 1991 level in 1996. In 1997 and thereafter, the coal price remained at over 2 times that of the 1991 level to become 2.2 times that in 2000. Heavy oil prices increased drastically by 3.4 times that of the 1991 level in 1992, and from 1996 onward ranged from 2.1 to 2.4 times.
Power prices increased to become 2.5 times that of the 1991 level in 1994 and then decreased to 1.6 times and increased again to become nearly 3 times that of the 1991 level in 1997 and 1998, and in 2000 reached 2.8 times that of the 1991 level. For the same period, the heat price decreased to 0.4 times that of the 1991 level in 1993 and returned close to the 1991 level in the succeeding two years, decreasing to 0.6 times that of the 1991 level in 1996 before later returning to the 1991 level and then increasing again to 1.4 times that of the 1991 level in 2000.

3.4 - 3
The movement translated into a dollar basis has also revealed that heat was cheaper than the other kinds of energy in that the prices of coal, heavy oil and power were more than two times that of the 1991 levels as of 2000, against a heat price at a level of 1.4 times. The power import price from Russia decreased year by year to reach some 60% of the 1996 level in 2000.
Table 3.4-3 Energy Price Movement(nominal dollar term)
unit 1991 1992 1993 1994 1995 1996 1997 1998 1999 2000 Coal US $/ton 3.4 5.2 4.9 6.5 5.7 4.8 7.4 8.0 6.7 7.6 Oil US $/ton 48.6 164.0 119.1 141.2 142.5 112.3 116.6 108.6 104.1 112.1 Elec. US $/MWh 14.7 24.6 21.4 36.2 31.7 23.8 41.2 42.1 35.4 41.0 Import Russia
US $/MWh 41.0 36.0 36.0 33.0 25.0
Heat US $/Gcal 3.4 4.4 1.5 3.0 2.6 2.1 3.4 3.2 2.7 4.6
0
5
10
15
20
25
30
35
40
45
1991 1992 1993 1994 1995 1996 1997 1998 1999 2000
Other Prices (UA$)
0
20
40
60
80
100
120
140
160
180
Fuel Oil (US$)
Electricity Electricity from Russia Heat Coal Fuel oil
Fig. 3.4-3 Energy Price Movement(nominal dollar term)
3.4.2 Tariff Setting Mechanism
The power plants have so far been places of operation of the EA or its production units, so that the tariff for those power plants were prices for internal transaction rather than wholesale price and were determined as such taking into account consumer prices (retail prices), the production cost of the power plants and other expenses such as those for rural electrification.
That situation has not encouraged management efficiency of the power plants and did not allow the accumulation of retained earnings necessary for future maintenance and expansion of their facilities.
Table 3.4-4 shows the wholesale price and production cost of each power plant. The average retail

3.4 - 4
price was 45 Tug/kWh for power and 5,000 Tug/Gcal.
Table 3.4-4 Wholesale Price and Production Cost of Power Plants
Power(Tug/kWh) Heat (Tug/Gcal) Wholesale price Production cost Wholesale price Production cost
TES2 28.40 22.98 2603.6 5936.7 TES3 31.76 25.36 3058.6 5065.0 TES4 19.76 16.02 2603.6 5041.6 Darkhan 28.05 20.01 1393.8 4073.3 Erdenet 38.62 31.80 3253.9 4461.2
(Source: TES4)
In September, 1997, an automatic tariff adjustment mechanism was introduced, in which the power plants were supposed to apply for tariff revision to the EA (currently the ERA) quarterly according to a decree issued by the Ministry of Infrastructure; however, tariff revision has seldom been made based on that mechanism. The price-setting formula of the adjustment mechanism considers factors such as increases in prices of coal and heavy oil, and changes of consumer prices and exchange rates of the Tug.
The ERA is currently studying a new tariff-setting method to apply from 2002 instead of the automatic tariff adjustment mechanism. This new method is named the “Interim Method” and is considered to be a step toward market mechanism with a view to a change from policy price to cost recovery.
By this method, cost recovery and fair return are expected to be achieved. The new method determines the production cost based on the past three-year records and adopts the rate-basis method for return, which determines the return by multiplying the value of employed assets by the average rate of interest (profit) according to the capital structure.
3.4.3 Sales Collection Mechanism
Until 1999, sales collection had been made in such a way that cash collected from consumers by each EDO/HDO was transferred to the EA, who then distributed cash to the power plants at the discretion of the EA. The distributed cash was, however, less than the amount of the actual sales, causing the problem of receivables. The EA was then responsible for the entire sector of power and heat in Mongolia so that the difference between the collected cash and the distributed cash was used to subsidize rural areas.
In 2000, such through-EA practice was abolished and a new settlement method was adopted in that each EDO/HDO would make direct payment of collected cash to the power plants. In reality, however,

3.4 - 5
the whole amount of the sales was not paid and part of it was used for each EDO/HDO to manage their funds, which led to the further accumulation of receivables.
In October 2000, the above settlement method was modified, keeping the direct payment from EDO/HDO to the power plants, in such a way that the whole amount of the cash collected by EDO/HDO would go first to the power plants, which would then return to EDO/HDO their portion including expenses.
As for the Erdenet area, the through-EA method remained and, in addition to arrears by the Erdenet copper mines, the fact that the EA was paying sales tax on the energy sector from the collected amount left only a small amount being paid to TES4. No fundamental solution has so far been provided for the problems of receivables.
Another issue, that of debt cycle, as seen in the Baganuur area, was caused by nonpayment by the coal mines because of the nonpayment for coal purchases by TES4, which was being solved by set-off between coal sales and power sales. There were also arrears of power and heat sales in the government-related organizations including schools and hospitals and this problem was being dealt with by set-off with payable tax based on quarterly consultations between the sector’s companies, the Ministry of Finance and Economy and the tax authorities considering the government lack of funds.
The accumulated amount of receivables and payables is enormous and this debt cycle issue involves not only power and heat companies, but also the EA, government-related organizations, coal mines and copper mines and other nonpayment companies, prevailing in the economy of Mongolia. For this reason, it is not possible for the debt cycle issue to be solved by individual companies and it will take more time to solve. To address the debt cycle issue, in September 2001, discussions were made between the Ministries of Finance and Economy and of Infrastructure, the State Property Committee and 18 energy-related companies, but no conclusion was reached.
The frequently modified method of the collection of the sales amount is also deeply rooted in the debt cycle issue and it is necessary to establish a transparent method based on a market economy. Although no new collection method was made clear at the time of survey, a study was being conducted on a collection method in line with the sales transaction between the newly corporatized entities of the energy sector, where each power plant sells power to a transmission company, which in turn sells power to each EDO.


