THE STUDY ON THE MASTER …
130
<JICA DEVELOPMENT STUDY> THE STUDY ON THE MASTER PLAN FOR QUALITY/PRODUCTIVITY IMPROVEMENT IN THE REPUBLIC OF TUNISIA FINAL REPORT (QUALITY/PRODUCTIVITY IMPROVEMENT MANUALS - ELECTRIC INDUSTRIAL SECTOR -) JULY 2008 JAPAN INTERNATIONAL COOPERATION AGENCY (JICA) JAPAN DEVELOPMENT SERVICE CO., LTD. No. IL JR 08-010 Ministry of Industry, Energy and Small and Medium Enterprises Management Unit of National program of Quality Improvement (UGPQ)
Transcript of THE STUDY ON THE MASTER …

<JICA DEVELOPMENT STUDY>
THE STUDY ON
THE MASTER PLAN FOR QUALITY/PRODUCTIVITY IMPROVEMENT
IN THE REPUBLIC OF TUNISIA
FINAL REPORT
(QUALITY/PRODUCTIVITY IMPROVEMENT MANUALS
- ELECTRIC INDUSTRIAL SECTOR -)
JULY 2008
JAPAN INTERNATIONAL COOPERATION AGENCY (JICA)
JAPAN DEVELOPMENT SERVICE CO., LTD.
No.
ILJR
08-010
Ministry of Industry, Energy and Small and Medium Enterprises Management Unit of National program of Quality Improvement (UGPQ)

CONTENTS
Foreword ......................................................................................................................................... E-1 PART I: Theory............................................................................................................................... E-1 Chapter 1. Quality ........................................................................................................................ E-1
1.1 What is Quality?.......................................................................................................... E-1 1.2 Quality Control Procedures ......................................................................................... E-4 1.3 Quality Improvement Activities .................................................................................. E-17
Chapter 2. Productivity................................................................................................................. E-28 2.1 What is Productivity? .................................................................................................. E-28 2.2 Methods of Productivity Management ........................................................................ E-29 2.3 Activities of Productivity Improvement ...................................................................... E-32
Chapter 3. Diagnosis of Company and Actions of Improvement................................................. E-37 3.1 Objectives and Effects of the Company Diagnosis ..................................................... E-37 3.2 Methods and Objects of the Diagnosis of Company ................................................... E-37 3.3 Carrying Out a Company Diagnosis............................................................................ E-39 3.4 Analysis and Appreciation of the Results of the Diagnosis of Company.................... E-40 3.5 From the Economic Planning to the Stake in Work of Actions of Improvement........ E-41
PART II: Factory Diagnosis............................................................................................................ E-42 Chapter 4. Factory Diagnosis ....................................................................................................... E-42
4.1 Improvement /Quality Diagnosis/ Productivity Activities Progress ........................... E-43 4.2 Improvement / Quality Diagnosis / Productivity Activities Method........................... E-44
Chapter 5. Quality/Productivity Diagnosis Checking-Points and Improvement Points............... E-48 5.1 Production Site Management ...................................................................................... E-48
5.1.1 State of 5S...................................................................................................... E-48 5.1.2 Visual Control................................................................................................ E-49 5.1.3 Workspace Safety and Environment.............................................................. E-50
5.2 Improvement of the Quality ........................................................................................ E-52 5.2.1 Initial Quality Control.................................................................................... E-52 5.2.2 Quality Control Process Chart and Standard Operation Procedure ............... E-54 5.2.3 7 Tools of the Quality .................................................................................... E-55
5.3 Production Management.............................................................................................. E-56 5.3.1 Production Management System ................................................................... E-56 5.3.2 Inventory Control (FIFO) .............................................................................. E-57 5.3.3 Tools and Equipment Maintenance Management.......................................... E-59
5.4 Productivity Management ........................................................................................... E-61 5.4.1 Waste Reduction (7 MUDA) ......................................................................... E-61

5.4.2 Yield Control ................................................................................................. E-62 5.4.3 Equipments Structure..................................................................................... E-63
PART III: Improvement Case by Case............................................................................................ E-65 Chapter 1. 5S Application Manual ............................................................................................... E-65
1.1 Introduction ................................................................................................................. E-65 1.2 Definition .................................................................................................................... E-66 1.3 Objective ..................................................................................................................... E-67 1.4 Approach of Implementation....................................................................................... E-68 1.5 Conditions of Success ................................................................................................. E-73 1.6 Conclusion................................................................................................................... E-75 Appendix: 5S Activities’ Evaluation Check-list..................................................................... E-76
Chapter 2. Improvement of the Layout ........................................................................................ E-77 2.1 Introduction ................................................................................................................. E-77 2.2 Definition .................................................................................................................... E-77 2.3 Objectives.................................................................................................................... E-78 2.4 Approach and Implementation .................................................................................... E-78
2.4.1 Define the Conception Base of the Layout .................................................... E-78 2.4.2 Analysis of the Product/Quantity’s Flow....................................................... E-80 2.4.3 Identify the Interrelations of Tasks to Accomplish........................................ E-81 2.4.4 Decide the Wished Levels of Proximity ........................................................ E-82 2.4.5 Setup the Layout Propositions ....................................................................... E-83 2.4.6 Evaluate the Propositions............................................................................... E-83 2.4.7 Implement the Held Layout ........................................................................... E-83
2.5 Success’ Conditions .................................................................................................... E-84 2.6 Conclusion................................................................................................................... E-84 Appendix : Example of Improvement .................................................................................... E-85
Chapter 3. Load Balancing on Workstation ................................................................................. E-91 3.1 Introduction ................................................................................................................. E-91 3.2 Definition .................................................................................................................... E-91 3.3 Methodology of Load Balancing on Workstation ....................................................... E-91
3.3.1 Production Cycle of a Workstation................................................................ E-91 3.3.2 Hourly Pace of a Workstation........................................................................ E-92 3.3.3 Pace of a Process............................................................................................ E-92 3.3.4 Rate of a Workstation Occupation ................................................................. E-93 3.3.5 Timing of Workstations ................................................................................. E-94 3.3.6 Factors of Success.......................................................................................... E-95 3.3.7 Conclusion ..................................................................................................... E-95

Chapter 4. SMED Method............................................................................................................ E-99 4.1 Introduction ................................................................................................................. E-99 4.2 Definition .................................................................................................................... E-99 4.3 Objective ..................................................................................................................... E-100 4.4 Approach of the Implementation................................................................................. E-100
4.4.1 The SMED’s Dynamic................................................................................... E-101 4.4.2 Phases or Steps............................................................................................... E-102
4.4.2.1 Sequential Progress of the Method .............................................. E-102 4.2.2.2 Phase 0. Choice of the Construction Site ..................................... E-102 4.4.2.3 Phase 1. Observations and Measures ........................................... E-103 4.4.2.4 Phase 2. Improvement of the Presentation................................... E-104 4.4.2.5 Phase 3. Modification of the Low-cost Means............................. E-104 4.4.2.6 Phase 4. Heavy Modification of Means ....................................... E-105
4.4.3 Duration and Planning ................................................................................... E-105 4.4.4 The Tasks ....................................................................................................... E-106
4.4.4.1 Task Observation and Identification ............................................ E-106 4.4.4.2 Task Reduction ............................................................................ E-106
4.4.5 Data ................................................................................................................ E-107 4.4.5.1 Preliminary Preparation ............................................................... E-107 4.4.5.2 Data Gathering ............................................................................. E-108
4.4.6 Operations’ Conversion ................................................................................. E-109 4.4.7 Simplify, Minimize ........................................................................................ E-109
4.4.7.1 Brigades and Fixings.................................................................... E-109 4.4.7.2 Standardization ............................................................................ E-110
4.4.8 Optimize, Standardize.................................................................................... E-111 4.4.8.1 Classic Functions ......................................................................... E-111 4.4.8.2 The Adjustments .......................................................................... E-112 4.4.8.3 Determine the Technical Values of Clocking .............................. E-113
4.4.9 Traps to Avoid ............................................................................................... E-114 4.4.9.1 All out SMED .............................................................................. E-114 4.4.9.2 Analyzing Critical Resources....................................................... E-114
4.5 Conditions for Success ................................................................................................ E-115 4.6 Conclusion................................................................................................................... E-115 Appendix : The Tools ............................................................................................................. E-117
Chapter 5. The group dynamics (QC) .......................................................................................... E-119 5.1 Introduction ................................................................................................................. E-119 5.2 Definition .................................................................................................................... E-119 5.3 Objectives.................................................................................................................... E-120

5.4 Approach of the Implementation................................................................................. E-120 5.4.1 Characteristics of a Group Dynamic:............................................................. E-120 5.4.2 Organization and Functioning of Group Dynamics: ...................................... E-122 5.4.3 The Tools of Group Dynamics....................................................................... E-123 5.4.4 Process of Resolution of Problems by a Group Dynamic:............................. E-123
5.5 Condition of Success ................................................................................................... E-124 5.6 Conclusion................................................................................................................... E-124 Appendix : Diagram Cause and Effect ................................................................................... E-125

E-1
Foreword
This textbook, drafted within the framework of the “Study on the Main plan of Quality Improvement / Productivity in Tunisian Republic” realized by the Japan International Cooperation Agency (mentioned “JICA” below), is intended to be used by the staff of the UGPQ, counterpart of the present study, during the application of the Pilot-project in the target companies. It was nevertheless conceived, based on the hypothesis that the actions of improvement would be pursued within these companies after the end of the Project-pilot and that he could be used within the framework of these actions for auto-diagnosis.
PART I: Theory
Chapter 1. Quality
1.1 What is Quality?
(1) DEFINITION OF QUALITY
The standard ISO 8402 (1994) defines Quality as follows:
All the characteristics of an entity which confer its aptitude to satisfy to the expressed and implicit needs.
Remarks:
1) It is recommended to define in a clear way the implicit needs. 2) Needs evolve through time. 3) These needs are usually presented as standardized characteristics. 4) We mean by “entities” products, actions, processes, organizations, systems, staff and
combination of these elements.
The definition above supplies in the form of remark various examples to show that the “entities” are not only made up of goods as we imagine it, but it is a bit difficult to understand{*include*}. Philip B. Crosby, who invented Zero Defaults (ZD), and proposed Quality Management (QM), of which he systematized the fundamental concept and method of application, defines Quality as follows:
The Definition of Quality is conformance to requirements.

E-2
This definition is extremely simple and moreover easy to understand. In that case, we mean by “requirements” the needs of customers in products and services, which can include implicit expectations. What we call here “customers” not only indicates the consumers or the companies’ customers. Within the framework of the activities of the company, the input processes constitute the “customers” of the output processes. It is possible to say that a “quality” work was made if the input process passed on its requirements in a clear way to the output process, and if the requirements of the input process were completely performed by the output process. The pursuit of the work demands that the Five Ws (and one H) presented below is clarified in a clear way.
1. Why (Why → goal) 2. What (What, in which quantity → INPUT, OUTPUT) 3. When (When ·till when, deadline, timetable) 4. Who (Who → staff, organization, partners) 5. Where (Where → process of manufacture, line of production, factory, associated
companies) 6. How (How → methods, competence, tools, machines)
Quality questioned in the manufacturing industry concerns manufactured products (OUTPUT), but Quality Improvement of the means of production (5M below) which furnish the INPUT led in a direct way to the Quality Improvement of manufactured products in OUTPUT. It is thereby necessary to define the requirements exposed by the 5Ms below and to make the production according to these requirements.
1. Man (Workforce → staff) 2. Material (Materials → including spare parts) 3. Machine (Machines → material, equipment, tools, etc.) 4. Method (Methods → manufacturing process, shaping conditions, etc.) 5. Measurement (Measure → control system)
(2) QM (Quality Management) and QC (Quality Control)
What is the difference between the Management and the Quality control? Quality Control (QC) is an activity which consists in maintaining the defaults at a level lower than the objectives by collecting various data. We also speak about SQC (Statistical Quality Control) when statistical methods are used. Quality Management (QM) is a much wider notion which refers to the whole management process linked to the Quality considered in its global nature, including QC, QA (Quality Assurance) and QI (Quality Improvement).

E-3
For example, to set up a Quality system in the company management by taking into account learning and technical training, the equipments and the reporting tools needed, production techniques, the organization and the operation, Quality Management shifts. In other words, Quality Control amounts to the tactics and Quality Management to the strategy. Without knowledge nor methods in Quality Control, it is impossible to improve Quality in an effective way. But it is also impossible to improve organization's Quality level by simply implementing Quality Control without Quality Management, because the improvements are then only made case by case.
(3) The ISO-9000 standard
The ISO-9000 standard is a set of international standards about Quality which, when established in 1987, regulated the requirements in Quality Assurance (QA) from suppliers concerning customers. A system of certification by third parties, not limited to the operations between companies, was later set up, which gave these third parties the attribute to evaluate Quality System and to give their “guarantee”. After the first 1994 revision, the certification by third parties became the standard. At first these standards had been created for the manufacturing industry, but the text of the 2000 version was widely modified so that these standards can apply to any sector, as computer industry or services. These standards' field of application was also widened from QA to a Quality Management (QM) system.
The ISO-9000 standard does not require from organizations or companies to improve Quality with Quality Control, for example by reducing the rate of defective products or the quality defaults. It requires from them « to improve in a continuous way the efficiency of the system of Quality Management by means of Quality objectives and orientations, of inspections' and data's results analysis, of corrective and preventive measures and through Management evaluation ». In other words, they enable the improvement of Management Quality system, notably by changes in the training system as well as by improving methods of documents' and internal control management, to lead to a work Quality Improvement and consequently to a products Quality Improvement.
Quality Control
Quality Improvement
Quality Assurance Quality Management

E-4
As it was indicated above, the ISO-9000 standard demands a Quality increase by a long-term improvement of the organization's structure. In the “Useful” part of this Manuel, we indicate efficient short-dated techniques, from diagnosis until improvement, taking this long-term structural improvement as a recurrent matter.
1.2 Quality Control Procedures
(1) 7 Quality tools
7 Quality tools establish a representative method of Quality Control. The principle of Quality Control consists in using data based on facts. 7 Quality tools are a simple method of Quality Control allowing to extract the information contained in these data in a correct way. Knowing how to handle this tool it makes easier to analyze and to resolve the problems related to the manufacturing process and to the workplace. We briefly present in the following lines these 7 tools of Quality, as well as their elaboration method and applications.
1) Stratification
- What is stratification?
Stratification consists of dividing a group into several parts (called strata) on the basis of certain characteristics. By examining every part and by comparing them, we obtain keys for the resolution of the problems. An example follows below:
Quality system improvement
Work quality Improvement
Goods quality Improvement
Mixture of A and B

E-5
- Elaboration method
Divide the accumulated graphs chosen as characteristics of the group in several strata which we wish to analyze, and to establish graphs for every stratus.
Here are some examples of possible strata: workplace, name of profession / group / line / operator / competence, qualification / experience / age / produce, article/ spare parts /sets / hour, day or night schedule / shift / day of the week / machine, serial number / cavity number.
- Applications
▪ Cause default analysis ▪ Machine breakdown analysis ▪ Turnover analysis ▪ Operational expenses analysis
2) Causes and Effects Diagram
- What is Cause- and-Effects Diagram?
Cause- and-Effects Diagram systematizes the relations between a problem that appeared in the workplace, considered in one of its characteristics (products quality, cost, etc.), and its causes. We consider this characteristic as the head of the fish, and we formalize the causes in big, average, small, dorsal fish bones and thorns, what explains that this diagram is also called « fish bones » diagram. An example follows below.
- Elaboration method
1 Determine the characteristics and build the dorsal fish bones. 2 Discover the causes by brainstorming. 3 Classify the causes in 4 or 5 categories, and build the big fish bones. 4 Decompose in a even more precise way the causes, and build the average and
small fish bones. 5 Pursue the brainstorming to complete the causes. 6 Choose the cause of most important impact on the results and surround it with a
.
Medium bone
Characteristics
Small bone
Cause
Dorsal bone
Big bone

E-6
- Applications
▪ Cause default analysis ▪ Cause manufacturing delay analysis ▪ Cause disaster analysis ▪ Improvement actions
3) Pareto Chart
- What is the Pareto Chart?
Pareto Chart is a bar chart, obtained by classifying the various problems of the workplace according to their causes and to their characteristics and by presenting these problems according to their order in terms of frequency and amount, and a curve of accumulation. This diagram is mostly used to identify problems that have an important effect on improvement among numerous phenomena of quality defaults. An example follows below.
- Elaboration method
1 Collect the data and calculate the total of every category. 2 The right vertical axis is the cumulative percentage of the total number of
occurrences, total cost, or total of the particular unit of measure. 3 Build the graph in bars. 4 Indicate the line of accumulation. 5 Analyze by classes ABC.
- Applications
▪ Cause defaults analysis ▪ Turnover analysis ▪ Number of spare parts analysis ▪ Determination of the improvement objectives
Tota
l nu
mbe
r
Cum
ulat
ive
perc
enta
ge
Other

E-7
4) Histogram
- What is the Histogram?
Histogram indicates in the form of bar chart the frequency of each of the classes defined by segmentation of the area separating the maximal data of the minimal data, in the case of a big number of data. It helps understand more easily, and in a visual way, the disparity of the data and the distances compared to average results. An example follows below.
- Elaboration method
1 Collect the data (superior to n=100). 2 Calculate the amplitude (L-S) included between the maximal value (L) and the
minimal value (S). 3 Determine the interval of the classes (L-S / √ n) by rounding off the value. 4 Determine the limit (lower Limit =S - 1/2 of the measure unit) 5 Build a frequency table which will help elaborate the Histogram.
- Applications
▪ Quality characteristics analysis ▪ Delays analysis ▪ Abilities / How-to studies analysis1 ▪ Results checking
1 Value limits capacities which can be reached in a reasonable way with regard to the results obtained during a
stable process. It applies generally to the Quality, and when the distribution of the values of characteristics Quality obtained during the process is regular, we often express it by the mean value ± 3 σ
Inferior limitation
Superior limitation
Deg
ree
E-8
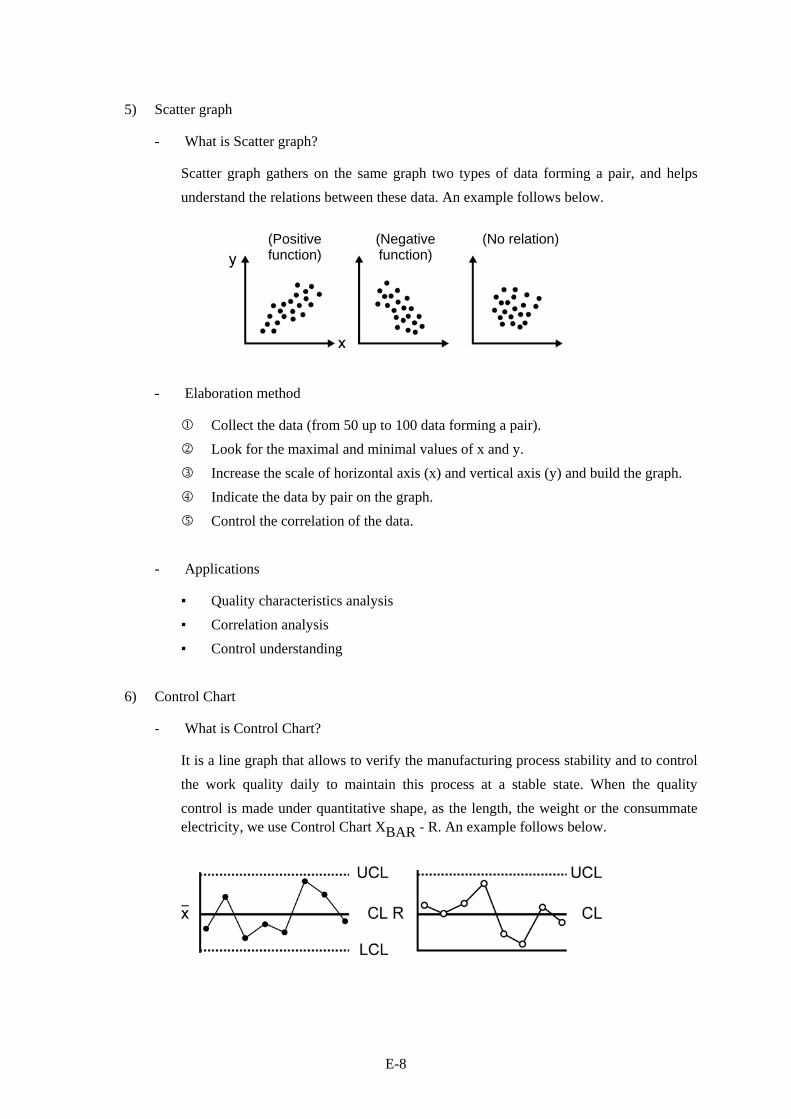
5) Scatter graph
- What is Scatter graph?
Scatter graph gathers on the same graph two types of data forming a pair, and helps understand the relations between these data. An example follows below.
- Elaboration method
1 Collect the data (from 50 up to 100 data forming a pair). 2 Look for the maximal and minimal values of x and y. 3 Increase the scale of horizontal axis (x) and vertical axis (y) and build the graph. 4 Indicate the data by pair on the graph. 5 Control the correlation of the data.
- Applications
▪ Quality characteristics analysis ▪ Correlation analysis ▪ Control understanding
6) Control Chart
- What is Control Chart?
It is a line graph that allows to verify the manufacturing process stability and to control the work quality daily to maintain this process at a stable state. When the quality control is made under quantitative shape, as the length, the weight or the consummate electricity, we use Control Chart XBAR - R. An example follows below.
(Positive function)
(Negative function)
(No relation)

E-9
- Elaboration method
1 Divide the data into groups (n = 3 - 6). 2 Look for the average (XBAR) and for the amplitude (R) for every group. 3 Look for the average general (Xm) and for the average amplitude (Rm). 4 Calculate the curve of control:
· Control Chart XBAR: CL = Xm Control Chart R: CL = Rm
· Limit of control of Control Chart XBAR: UCL = Xm + A2 Rm / LCL = Xm - A2 Rm (A2 is a coefficient which depends of n, it is determined by means of a value table)
· Limit of control of Control Chart R: UCL = D4Rm / LCL = D3Rm (D3 and D4 is coefficients which depend of n, we calculate them by means of a values table)
5 Indicate XBAR and R on the leaf of graph.
- Applications
▪ Defaults control ▪ Production control ▪ Processes management ▪ Processes analysis
7) Check list
- What is check-list ?
The check-list is a table that allows making checks and obtaining data by confronting the work results and the products with the standards, and by indicating these results by means of simple symbols. An example follows below.
(Example of an check sheet to record the place and number of defectives)
Date
E-10
- Elaboration method
We establish the check-list by preparing the following columns:
1 Control purpose 2 Control's target and points 3 Checking procedure 4 Daytime and planning of the control 5 Person in charge 6 Control results 7 Goods itinerary
- Applications
▪ Daily inspection of equipments ▪ Control of 5s in the workplace ▪ Work safety Controlling ▪ Inspection points
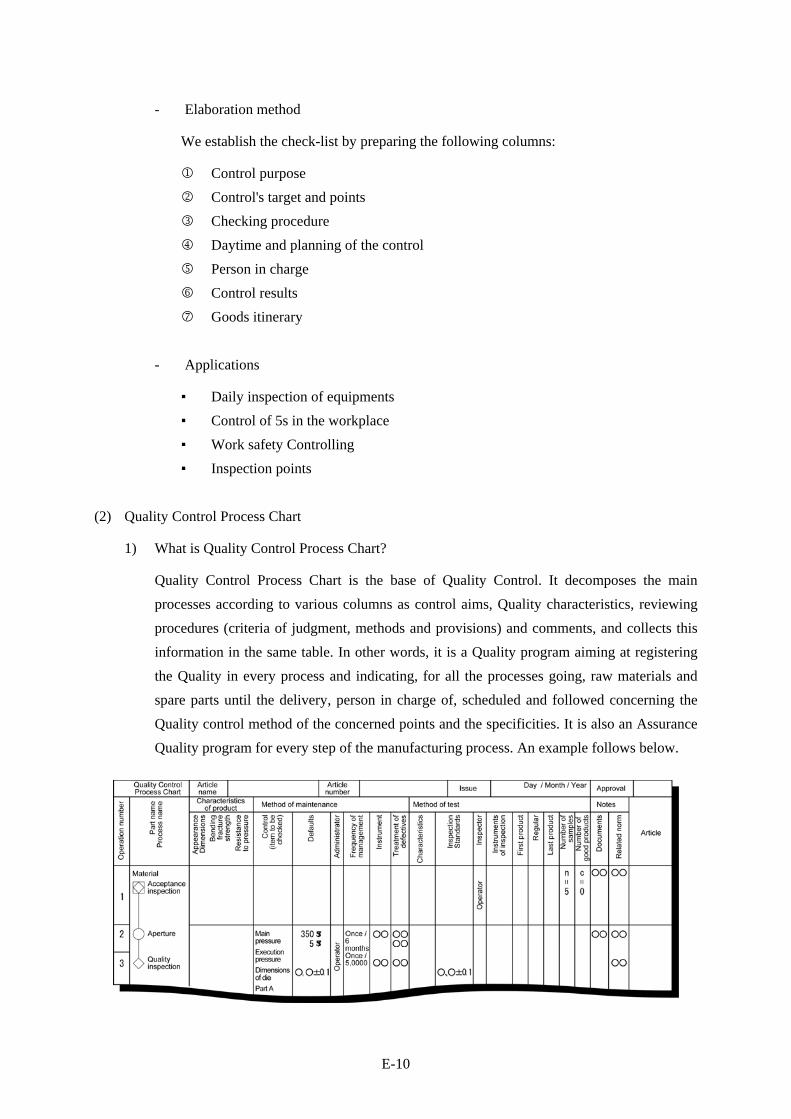
(2) Quality Control Process Chart
1) What is Quality Control Process Chart?
Quality Control Process Chart is the base of Quality Control. It decomposes the main processes according to various columns as control aims, Quality characteristics, reviewing procedures (criteria of judgment, methods and provisions) and comments, and collects this information in the same table. In other words, it is a Quality program aiming at registering the Quality in every process and indicating, for all the processes going, raw materials and spare parts until the delivery, person in charge of, scheduled and followed concerning the Quality control method of the concerned points and the specificities. It is also an Assurance Quality program for every step of the manufacturing process. An example follows below.

E-11
2) Procedure of elaboration of Quality Control Process Chart
1 Choose products and target processes.
▪ Columns to be filled out: name of products and process
2 Draft the flow chart of the production process.
▪ Columns to be filled out: progress of the operations / number of the processes / symbols of the plan of production
Name of symbols
Symbols Meanings
Basic symbols Finishing A process changing the form and characteristic of things.
Transfer A process of moving things.
Storage A process of storing things by planning.
Accumulation A process of holding things against planning.
Number
inspection Measuring the quantity, number of things and comparing standards.
Quality
inspection Checking the characteristic of things and comparing standards.
Compound symbol
Compound inspection
Mainly control number, but also quality inspection.
Finishing inspection
Mainly the shaping, but also the inspection of number.
(Symbols of process and their meanings)
3 Initial Completion of Quality Control Process Chart
▪ Columns to be filled out: name of articles / number of the articles / date of editorial staff
4 Check of the characteristics Quality of the processes
▪ Columns to be filled out: name of the processes / characteristics Quality
5 Elaboration of a Cause- and-Effects Diagram by characteristic Quality
▪ Columns to be filled out: materials / machines / manpower / methods
6 Indication of control points
▪ Columns to be filled out: objects of the control (Causes) / Specificities Quality (Effects)

E-12
7 Indication of checking procedures
▪ Columns to be filled out: standard values / machines / equipment / periodicity of the control / responsible for control
3) When to use Quality Control Process Chart ?
1 Control to know if the Assurance Quality is realized
Once the methods of shaping and treatment of products are defined, it is possible to check if we can obtain the expected Quality, by using Quality Control Process Chart. Once the points of malfunction are detected, changes can be made or the necessary additions on the process and contents of the manufacturing process.
2 Role of inventory when writing the Standard Operation Procedure
Quality Control Process Chart plays an inventory role when making the Standard Operation Procedure. It so allows to elaborate at once a Standard Operating Procedure when needed, and to verify that it does not contain flaws.
3 Use for management and factory work control
The supervisors use this document, which they always keep in an in-reach area, to supervise the operators so that they make correct job. We mean by “ correct job “ the fact « not to accept, not to make and not to send any defective goods ».
4 Use as a tool of process analysis in case of abnormality
In case of abnormality, all the processes are verified on the basis of Quality Control Process Chart, and the causes are detected. This exam is made starting from checking procedures leading up to the controlled objects.
5 Use as a tool of processes analysis in Quality circles
Quality Control Process Chart can be used to reveal problems and to analyze causes in the method of processes analysis.
6 Use in the production, Quality and cost price Management
Quality Control Process Chart, which clarifies the objects of the control for every process, allows to underline these control points by determining their links with the production, the Quality and the cost price.

E-13
7 Deposit and conservation of techniques
Quality Control Process Chart is an essential way to keep a record and leave a trace of the company’s very own techniques. It is important to modify the contents regularly, and to always update to the latest version available.
(3) Standard Operation Procedure (SOP)
1) What is SOP?
The Standard Operation Procedure determines the correct work method which allows to make quality products at a cheap price, quickly and easily. It is generally defined as all the standards fixed in conditions of employment, in methods of work, procedures of control, raw materials and used equipments and the other points deserving attention.
The Standard Operation Procedure is essentially used for the work (supervisors and workers) as a means of Quality preservation and improvement of products, cost management, delays and quantity management, safety control and the working environment. But it can also be used as a way to cumulate techniques, as training or as an inspection tool. It is preferable that the Standard Operation Procedure is presented in an easy to understand way, integrating not only texts and graphs but also pictures and samples based on the originals. An example follows below.
Article number
Article name
Process name
Standard Operating Procedure Sheet Decision Approval Proposition
(1) Standard Operating Procedure of
exchange of die (2) Standard Operating Procedure (3) Standard of volontary control
・ Condition of work
・ Inspection
of first product
(4) Standard of equipment inspection (5) Standard of inspection of die and tools (6) Security standard ・ Article of inspection, frequency
Standard, method inspector, treatment of defectives
・ Feeding place, standard Method of feeding, tools Frequency of feeding, feeding source Person in charge
・ Place of inspection, article, standard Frequency, person in charge, standard Treatment of defectives
・ Article of inspection, standard ・ Equipment of protection ・ Certified person
(7) Remarks for operator (8) Record of modification ・ Treatment of defectives
No. Article Normal value
Method of control
No.Characteristi
cs Normal value
Method of inspection
Number of rotations
Transfer
Characteristics Normal value

E-14
2) Writing procedure of Standard Operating Procedure
Following principles have to be followed during the elaboration of the Standard Operation Procedure:
1. Be feasible 2. Have a purpose and accessible objectives 3. Focus on actual problems and easily understandable 4. Define methods in case of abnormalities 5. Not be contradictory with the other connected standards 6. Be permanently revised and preserved
3) Standard Operation Procedure contains
The Standard Operation Procedure has to mention points indicated below:
1. Raw materials, spare parts 2. Equipment, machines, mould, tools 3. Methods of work, stages and important points 4. Objects and checking procedures 5. Characteristics Quality, methods of inspection 6. Criteria of abnormality and methods in case of abnormality 7. Skill of the operators and the production staff
4) Standard Operation Procedure writing's steps
1 Writing's preparation
One should mind understanding the purpose and objectives of SOP's writing, collect relevant information and the standards from the first phases of product conception → tests → preparatory phase to the production.
2 Study on the effective working conditions
Proceed with a study of the real production and work conditions notably by analyzing Industrial Engineering techniques, and simultaneously judge in a precise way the state of realization thanks to control indicators adapted to the purposes and to the objectives, as the default rate or work rate.

E-15
3 Analyze results of the study → determination of problems
Analyze the results of the inquiry, and in case the objectives should not be reached, think of solutions by cooperating with the staff, operators and the concerned superiors.
4 Definition of the correct work → normalization
Define the correct way of working, which generates neither error nor default whomsoever carries out the operation, and formalize it in the Standard Operation Procedure. We shall see to it that this document is easy to understand and to use, by means of figures, tables, pictures and samples.
5 Trial of the initial proposition
The writer of the SOP, with the cooperation of the people effectively carrying out the work, will execute the operations according to the initial proposition. Think about improvements according to the conditions of realization of the objectives.
6 Definitive writing
On the basis of the attempts of the initial proposition, make new attempts on the improved proposition, and if the objectives are reached, proceed to the final editorial staff of the Standard Operation Procedure on the basis of these propositions. The main part is that this Standard Operation Procedure is really applied.
7 Approval, conservation, exploitation
Following approval and decision the heads of department, a responsible person will be appointed to keep the document. The essential point is to find out if the operators and the supervisors working on the scene of production can use it at any time.
(4) Poka Yoke
1) What is Poka Yoke?
Poka Yoke, is a way to avoid any error of inattention (Pokamiss). It can prevent the faults provoked by a light relaxation of the attention. It also permits to reduce malfunction caused by these errors. Concretely, it indicates the simple devices and the tools, also called fool proof, preventing the operators from accomplishing their task in an erroneous way.
In a system of production dependent on the capacity of attention of the operators, it is inevitable that errors of inattention occur, because of unstable factors as the mental or

E-16
physical state of the operator. We indicate below representative examples of errors of inattention in Quality:
1. Shaping - Blending of different materials - Blending of defective products - Unimplemented Shaping - Over-shaping - Inverted Shaping
2. Assembly - Spare part error - Neglect of spare part - Mix of defective products - Mix of different spare parts
It is consequently essential to set up a production system integrating Poka Yoke, starting from the following basic ideas: from the beginning of the cycle, the conception must be conceived in order to prevent default of shaping or assembling; during the production preparatory phase, no defective parts should be received from the input; during the production phase itself, no defective product should be built nor supplied to the output. But overall Poka Yoke has to be easy. He must be envisaged according to the principles mentioned below:
1. No specialized knowledge is required. 2. No particular talent nor experience is required. 3. Poka Yoke must be possible without any use of instinct or tips. 4. Poka Yoke has to make the work easier and safer
However, even by integrating Poka Yoke in the product conception and the production preparatory phase as it was indicated above, it is difficult to completely avoid errors of inattention during the planning, and such errors may occur during the production phase. Thus, techniques and tools presented below are effective if you consider Poka Yoke at the production stage.
2) Poka Yoke techniques
1 Check list
It is an effective tool to verify that relatively complex operations, such as regulation operations linked to production series’ changes, have been made without neglect.

E-17
2 Instant write-downs
When an error was about to be committed, even if it was not due to a lack of attention, notes should be taken to think about establishing Poka Yokes for this operation.
3 Examples compilation
Taking into account past examples which occurred in the company, or even in other companies, either by writing, taking pictures or shooting videos.
3) Poka Yoke tools
1 Alarms and light signals
These are tools essentially destined to indicate to operators and supervisors the advancement of the operations, like starting or ending signals or signals indicating if the operation is made in a proper or improper way.
2 Signboards
Like alarms and light signals, they are used for information about operations, but with letters or symbols.
3 Detection Switches
Detection switches, like photoelectric switches, micro-switches or limit switches, can be used as simple devices of Poka Yoke.
4 Regulation Tools
They regulate the circulation of products and prevent defective products from being released: regulation boards, wedges, Poka Yoke Pin and Shot.
1.3 Quality Improvement Activities
(1) Quality circles
1) What are Quality circles?
Quality circles refer to Quality Control activities made by small teams and in an autonomous way in the same workplace. They implicate the entire staff in management and in continuous workplace improvements thanks to Quality Control, by actions of self and mutual training within the framework of Quality Control activities. In Japan, they were introduced in 1962, and strongly contributed to the spreading of QC's statistical methods, as

E-18
well as 7 tools of the Quality, and to the increase of interest for Quality, at the operational and company's level.
However, due to the changes in the management milieus and due to the growing importance of sales in the 80s, the satisfaction of customer' needs eventually overwhelmed Quality and Productivity Improvement, which led to a decrease of the validity of Quality circles. Besides, problems of independence appeared as a lot of companies which used to consider Quality circles as autonomous activities of improvement, started considering them as a part of the TQC, giving to them objectives of cost reduction.
But it is possible, on the basis of the experience of Quality circles which we have just described above, to restore the utility of these activities for the Quality Improvement by reconstituting the actions by small teams such as they existed at the origin of the Control Quality activity. These actions consist in training with enthusiasm the staff concerning quality. Basic ideas of Quality circles can be summed-up in the following points:
1. Give value to human capacities and foreground its infinite possibilities 2. Respect the human qualities and set up a motivating workplace 3. Contribute to the structural improvement and to the company development
The managers and the executives have to acknowledge the importance of staff training and of emulation for the structural improvement and development of the company. They should set-up a frame and support participation of the entire staff in full respect of human qualities.
2) QC Mind
We call “QC mind” the way of perceiving things and think of things necessary to the resolution of problems. Concerning the resolution of quality problems, when this “QC mind” is lacking, the activities of Quality circles do not work well. We explain below what this spirit is.
- The “QC mind” in Management
1 Reinforcement of the company structure
· Transform the company structure in order to allow continuous improvement thanks to the activities of Quality Control.

E-19
2 Management by the participation of all
· Mobilize the capacities of the employees at the level of the whole company and proceed to improvements by reunification of all available forces.
3 Training and popularization
· Work on the development of the competence of the staff and on training by educational actions.
4 Quality Control Diagnosis
· Check with management about Quality Control activities communication.
5 Respect for human qualities
· Respect human qualities and give value to each and everyone’s skills.
- The “QC mind” in Quality Control
▪ Exploitation of Quality Control procedures
· Assimilate the statistical methods of Quality Control and apply these methods to the resolution of current problems.
▪ Difference Control
· Pay attention to disparity and the reasons which cause it.
- The “QC mind” in Assurance Quality
1 The Quality above all
· Improve competitiveness by favoring Quality and aim at increasing turnover and at consolidating profits.
2 Customer orientation
· Discern the real needs of customers and make products to satisfy these needs.
3 The output production: about customers
· Make products that comply with the requirements of the output production and help not to supply defective products.

E-20
- The “QC mind” in Management Production
1 The PDCA cycle
· Strict application of the PDCA cycle (Plan → Do → Check → Act).
2 Fact-based Control
· start from facts and data to manage, and not from experience or instinct.
3 Processes control
· Control work progress. Do not exclusively pursue results.
4 Standardization
· Standardize the correct processes and check if they are respected and applied.
5 Source Control
· Manage correctly the input and the source, and not only the production output.
6 An oriented management
· Choose clear orientations and develop the activities of the company in a coherent way for the whole company.
- The “QC mind” in Quality Improvement
1 Time for defining priorities
· Determine the fundamental problems and first improve these points.
2 Problems resolution procedure
· The improvements must be made according to the following stages: exam of the situation → analyze → proposition of measures → implementation.
3 Problem and repetition prevention
· do not repeat the same error. Neglect nothing to avoid repetition of the problems and prevent the problems a priori.
3) Procedure of application of the Quality Control activities
The implementation of Quality Control activities, aiming at solving quality problems at the production site, has to be made as follows:

E-21
1 Definition of the object
After understanding the problems, one must define points to be improved. In a general way, it is a question of defining « the processes, products, sectors, etc. of which characteristics have to be improved ».
2 Observation of the situation and definition of objectives
Determine the characteristics which will be targeted and to which extent. We mean by “characteristics” everything that influences Quality. For example, the quality of a fluorescent lamp includes characteristics such as energy consumption, diameter, length, shape and dimension of the cartridge, life expectancy, the temperature of color, aspect, etc. We shall clarify the following 3 points:
· Control characteristics (it is preferable that these characteristics are computable)
· Quantitative objective (current characteristics and numbered objective after improvement)
· Deadline
3 Elaboration of an action plan
The calendar and the task distribution will be fixed for the data collection, the analysis of the causes and the application of the measures. The action plan will be formalized as a synthetic chart by means of diagrams of Gantt and PERT graphs2.
4 Causes Analysis
Highlight the causes influencing the characteristics (problems). It is the most important point in the resolution of the problems, and it generally obeys the following procedure:
Arrangement of the relations between characteristics and causes in the form of Cause- and-Effects Diagram
↓ (Collection of numerous opinions by Brainstorming, KJ method3, etc.)
Analyze causes by means of the various Quality Control procedures
↓ (Analysis of the relations between characteristics and causes by stratification and Scatter diagram)
Synthesis of the results of the analysis
2 Industrial Planning process. Stands for Program Evaluation and Review Technique, 3 Invented by Jirô KAWAKITA

E-22
5 Exam of the measures and the application
Think about the possible measures with regard to the causes and implement these measures.
6 Check the efficiency
Collect data before and after the application of the measures relative to the characteristics previously fixed and we shall verify the efficiency of these measures. Compare the results with the numbered objectives and we shall estimate the degree of realization of the objectives, to envisage new measures in case the results would be insufficient.
7 Standardization and anchoring of the control
The measures which will have proven themselves efficient will be put as standards to avoid reoccurrence of the same problems.
(2) TQM
1) What is TQM?
The TQM (Total Quality Management) was born in connection with the TQC ( Total Quality Control). The origin of the term TQC is the work (1961) of the Dr. A.V.Feigenbaum but it evolved specifically in Japan in the 60s, within the framework of the activities which generalized the Quality Control to the whole company, notably thanks to Quality circles. The American Quality leaders (for example Philip B. Crosby), stimulated by the application of the TQC in Quality Improvement, studied very well TQC and elaborated the TQM, a wider notion which includes the activities of structural improvement on the scale of the company.
The TQC is an activity of Quality Improvement on the scale of the company, but the main activity remains autonomous circles of operators on the production workplace. By opposition, the TQM is a team activity by corporate bodies grouping executives, supervisors and employees. Besides, the TQC function is to systematize the control and to manage the quality defaults, while that of the TQM is to clarify the role and the responsibility of each and to control that each correctly filled his function.

E-23
Category TQC TQM
Purpose of the control Controls quality gaps (3σ / CPK)
Control the people’s work (Correct fulfillment of the tasks from the beginning)
Means of control Systematization of control ( Systematization / standardization)
Everyone’s role and responsibility (Decision / education / execution)
Training Quality Control procedures for operators(Statistical methods / 7 tools of the Quality)
Quality training from executives up to employees (4 absolutes / 14 steps)
Way of participation Autonomous activities of circles Team activities by craft Objective Quality PPM / AQL Level Zero Defaults (ZD)
2) 3 Actions of Management (Decision / Education / Execution)
- Decision
The starting point in Quality Improvement is the manager’s decision. It is up to him to decide to implement actions to change the situation, with the conviction that his company can prosper only if delivering to the customers the promised goods and the promised services is an established principle and that all the employees participates in the same state of mind : « Quality above all ». But it is necessary that this decision of the manager is shared by all the employees.
- Education
Even if the manager takes a “decision” concerning Quality Improvement, this one would go unheeded if the executives, the supervisors and the employees did not share the same point of view. The orientations of the company in Quality, the role and the responsibility of each and the stages of the teamwork must be “taught” first by the managers to the executives, then from the executives on to the supervisors and from the supervisors on to the employees. All the employees must share the same understanding of the Quality and must be conscious of each one’s role in the permanent realization of a high degree of quality.
- Execution
In Quality, the “execution” means making the actions necessary for the structural change of the company and for the evolution of the managerial style. The structural reform can be made only by pursuing the efforts step by step in Quality Improvement. In TQM, we call it « QIP: Quality Improvement Process » and we divide this process into 14 steps. This process is endless; however, every cleared step improves indubitably the company’s organization.

E-24
3) “4 absolutes”
The TQM considers 4 absolute principles presented below as fundamental notions.
Principle Category TQC TQM
1 Definition of the Quality
Degree of satisfaction of the purposes of use of the goods and the services Conformation in the requirements
2 System Evaluation a posteriori
(Analysis of the situation ? improvement) Prevention (correctly from the first time)
3 Criterion of realization
Level of Acceptable Quality (AQL: Acceptable Quality Level) Zero Defect ( ZD)
4 Criterion of measure
Indicators and Capabilité Proczqq (PPM / CPK) Cost of the defects
4) Process of Quality Improvement
The 14 steps of the “Process of Quality Improvement (QIP) » were developed as an application process for the “4 absolutes”. It is not necessary to follow the order indicated below in their application.
STEP Description Content 1 Management
Commitment Announcements by the direction management of the company orientation in Quality
2 Quality Improvement Team
Training of a team responsible for the promotion of the process of Quality Improvement
3 Measurement Determination of criteria of measure on the basis of the evaluation of the work by the production output
4 Cost of Quality Definition of the standards of calculation of the “default” and “default prevention” costs
5 Quality Awareness Organization of activities allowing the distribution in the whole company of the word “Quality”
6 Corrective Action analyze fundamental causes of the problems and definitive abolition of these causes,
7 Zero Defaults Planning Plan a “ZD Day” approximately one year and a half after the beginning of the QIP
8 Education training to make everyone aware of quality questions and of the role which he has to play
9 Zero Defaults Day A day which allows everyone, once a year, to renew his resolutions in concerning Quality
10 Goal Setting Determination of a “ intermediate objective “ by discussion in groups11 Error Cause Removal Put down in writing, by the entire staff, the problems of Quality and
their causes 12 Recognition Award three persons, by vote of all the employees, with a Quality
price 13 Quality Councils Organization of studying meetings gathering the specialists of the
Quality 14 Do It All Over Again Renewal of the members of the team Quality for two years

E-25
(3) Six Sigma
1) What is Six Sigma?
Six Sigma is a management reform method aiming at increasing the Quality Management. In the 80s, the Dr. Mikel Harry, from the American company Motorola, which had studied the Japanese activities of Quality Control, systematized under the name of « Six Sigma » a method allowing to reduce quality variations by improving the processes thanks to statistical techniques. This method was developed, under the shape of « six Sigma », to improve the Quality on the production site. Afterward, Jack Welch, then CEO of General Electric, decided to introduce “six Sigma” in his company to make his staff able to resolve their problems. From 2000, six Sigma asserted themselves as a “method of management consisting in resolving the problems and in forming managers in a systematic way». Thanks to this method, it is possible to convert in costs any sort company process, and to decide of the order of priority with regard to the degree of influence on the management. We can say that it is an innovative method of Quality Management, which ended the superiority given to production and small improvement activities like Quality circles, to give the supremacy to creative Management.
The word Sigma means “distance” in statistics. The distance indicates the degree of dispersal of a value (standard deviation), and the more the number appearing to the left of the Sigma is big, «the smaller the distance». In statistics, to say that the frequency of the defects is Six Sigma (6σ) means that the probability of occurrence is 2 in a billion. But since it is impossible to completely suppress the distances due to the natural phenomena, the real probability of a distance of 6s is 3,4 in a billion. So, six Sigma began first objective was a Quality Improvement of the processes at a level of 3,4 with one billion, but General Electric transformed these actions into an innovative Management method.
2) The Six Sigma method
- A method based on distances
Let's take two companies A and B as examples, which both supply the same company C with identical products. The C company requires a delivery period under « 5 days after order ». Companies A and B both have an average deadline of « 5 days after order ». But, whilst company A delivers « permanently under 5 days », company B may have an average deadline of 5 days, but may sometimes deliver 3 days after the order, but sometimes with a delay of week or of 10 days after order. In that case, we can say that A’s Quality management is clearly better.

E-26
Six Sigma introduces into the Management and into the objectives of exploitation, which used to be only considered in their average, the notion of deviation (standard deviation) and so aims at the management Quality Improvement.
- A method of improvement of the processes
Any chore is based on a succession of process. When we prepare mint tea, we first boil the water. While the water warms, we prepare the mint leaves, the sugar, glasses for tea, the teapot and the tea leaves, and we put an adequate quantity of tea leaves in the teapot. We boil the water during approximately 2 minutes so that the limestone evaporates well, and we pour the warm water at first into glasses to warm them. We then pour the warm water into the teapot and we wait … We so make a series of “operations”. All these “operations” constitute “causes” influencing the success (quality) of the mint tea. Likewise in business, it is complex processes which determine the results of chores or provoke phenomena like manufacturing defects or acts of negligence. Six Sigma are a method to reduce these quality deviations by improving the processes.
- A method attached to the impact on the management and to the voice of customer
We cannot however dedicate unlimitedly time and money to the improvement of the processes. It is thus necessary to fix a preference order and decide where to begin. Six Sigma uses as priority criteria both impact on the management and voice of customer (VOC: Voice of Customer). By converting the effects into monetary amounts, this method allows to create the preference order in a clear way for everybody. First improving the processes increases customer satisfaction and having important financial effects is the method adopted by Six Sigma.
3) Six Sigma application
- Sharing values within the company
To introduce Six Sigma and make a successful management reform, it is first of all necessary to choose values common to all. It is also necessary to ensure that all the members share appropriate values for the company (« why do we do business? », « what is most important in our business? »), and that these values guide everybody's actions.

E-27
- Sharing methods
Six Sigma contains a process of resolution of the problems in 5 stages called “DMAIC”, whom we present below.
PHASE Method of resolution of the problems
D Define Definition of the problems to be resolved on the basis of management problems and the VOC
M Measure Data collection to seize the current state of the problems A Analyze Determination of the main causes of the problems on the basis of the data I Improve After analysis of the risks and attempts, choice of the solutions C Control Application and anchoring of the solutions on the scene of production
Sharing DMAIC between the members of the company allows to improve the ability to resolve the organization’s problems. Moreover, the application repeated by the DMAIC to the various problems, in an evolving managerial context, leads to long-term reform actions.
- A clearly defined responsibility organization
Six Sigma attribute to the participating members the following roles:
Executive Leadership Responsible for decisions in promotion and in development of Six Sigma to the whole organization
Champion Responsible for the project on its results at the level of the exploitation and for problems
Master Black Belt Expert and supervisor having competence and experience in training of the black and green belts
Black Belt Relay of the change dedicating itself completely in Six Sigma Green belt Core of the promotion of the project
Clarifying everyone’s role and organizing responsibility allows to create an encouraging climate within the company, a climate allowing every employee to think and to act by itself. Six Sigma is not a motionless method, but a method of management reform allowing to realize “its own reform” adapted to the values and to the context of the company.

E-28
Chapter 2. Productivity
The Company Diagnostic Manual drafted within the framework of « The study of development of the institutions of technical support for the industry in the Tunisian Republic » realized from 1999 till 2000, already deals about the Productivity matter. As this document indicates, the Industrial Modernization Program, launched on a national scale by the Tunisian State, defines an objective of productivity improvement, but does not determine clearly what productivity is nor its method of measure. The present manual will thus begin to define what productivity is.
2.1 What is Productivity?
Productivity is the ratio between production (OUTPUT) and the means of production (INPUT). It is expressed by the following equation:
PRODUCTIVITY = PRODUCTION (OUTPUT) / FACTORS OF PRODUCTION (INPUT)
When we control Productivity of a factory, we consider Productivity as « the volume of the monetary production per hour », by expressing the production (OUTPUT) in a monetary unit and the factors of production (INPUT) in time unit. We call this Productivity “Labor Productivity “.
LABOUR PRODUCTIVITY = MONETARY / TIME PRODUCTION
But since monetary production varies according to the situation and the industry branch, we sometimes express the production under a concrete shape of either volume or weight, and the production factors not only in the form of time factor but also of human factor. Labour Productivity, if it has the merit of being practical and easily quantifiable, is applicable only in a particular way and is not really universal, therefore it cannot serve as an indicator of Productivity for other companies or for the whole industry branch in general.
By replacing the monetary production by the turnover or the added value, we obtain what we call in a generic way the Labour Productivity, based on value added. This Productivity, which allows a comparison on a monetary basis, is endowed with universality and can thus be of use as a Productivity indicator to the whole industry. But it is impossible to measure it correctly if the company does not arrange a cost price management system.

E-29
LABOUR RODUCTIVITY, based on value added = TURNOVER or ADDED VALUE / TIME or STAFF
Among the various Value Productivities, Capital-Labor MFP based on value added, which expresses the production by value added and by the factor of production of the human which allowed to create this Added value, is particularly important. There are two manners to calculate the Added value: « by accumulation » and « by deduction ». In the manufacturing industry, it is the mode of calculation « by deduction », presented below, that is often used.
ADDED VALUE = PRODUCTION - COST OF RAW MATERIALS – OUTSOURCING EXPENSES – MACHINES EXPENSES= SHAPING VALUE ≈ LIMIT PROFIT
Thus, the Productivity of the Added value (Added value a person) is expressed as follows:
CAPITAL-LABOR MFP BASED ON VALUE ADDED= SHAPING VALUE/ NUMBER OF EMPLOYEES ≈ LIMIT PROFIT / NUMBERS OF EMPLOYEES
2.2 Methods of Productivity Management
(1) Muda Reduction
1) What is MUDA?
Generally speaking, MUDA (wasting) is what is neither useful nor profitable. On the production site, the MUDA indicates « all which does not generate Added value ». Taiichi OHNO, father of the TOYOTA Production System, so said that “It is useless to raise a hammer while to lower it products Added value”. The ideal is that everyone makes a work generating Added value.
2) 7 MUDA
On the production site, the MUDA is only considered as a factor of loss of productivity. Continually suppressing these MUDA, leads directly to a Productivity increase, and consequently to a decline of cost price. It is so essential to be able to distinguish the work generating some Value Added from the MUDA, and to be conscious of these MUDA. On the production site, there are 7 MUDA, presented below.

E-30
No. MUDA CAUSE CONTROL POINTS 1 Over Production2 Stocks
- Inadequacy between plan of production and plan of delivery
- Quantity of the stocks of products
3
Transportation - Ineffective Structure of equipments- Excessive Number of process
- Rationality of the structure of equipments
- Number of processes and content of operations
4 Inventory - Inefficient process
- Organization of the detection of defects and prevention
- 5Ms - Organization of the detection of
defects and prevention
5 Overprocessing - Inadequate shaping process - Inadequate operations control
- Shaping process - Operations control
6 Waiting - Process imbalance
- Abilities imbalance - Quantity of products in production
phase - one-piece flow waiting time4
7 Motion - Inefficient equipment shaping Inefficient moves
- Rationality of equipment shaping - Save moves5
(2) Reduction of regulation times
In many factories, the diversification of the needs of the market entails a progress of the production in small quantity of varied products, as well as a reduction of the size of prizes sets accompanied with a shortening of delays. In such a context of production, the reduction of the times of regulation during the changes of manufacturing series becomes an important factor of improvement of the productivity, these regulations, more and more frequent, producing no added value.
1) Opinion about times of regulation
It is possible to distinguish two types of regulation on the scene from production: the “ internal regulations “, which require the stop of the production, and the “ external regulations “, which are non-stop made by the production. The most important when we think about the means to reduce the times of regulation, it is to reduce « the time which separates the end of the current production since it will be possible to produce good quality goods during the following production », meaning reducing time of the “ internal regulations “. But even if the times of “ internal regulations “ are reduced, we cannot hope an increase of productivity if the “ external regulations “ require a big number of processes. In the final, it is thus necessary to reduce the total time (number of processes) of regulation.
4 Transfer of the products which consists, for an operator who ended his work, not to move the product to the
next manufacturing stage as long as the following operator did not end his operations, and not to begin his operations on the following product. Allows to identify clearly the places where the operations tend to create delays.
5 See F.B Gilbreth

E-31
2) Check list of the changes of manufacturing series
If you answer “yes” in at least one of the questions indicated in the following check list, it is necessary for you to consider, in a concrete way, a regulation time reduction.
No. Control points “Yes” “No” 1 You have to change regulations at least 3 times a day for every process 2 The standard time of the operations of regulation is not defined 3 The changes of manufacturing series ask for subtle regulations
4 After every change of series of manufacture, the stabilization of the production is long
5 Choosing and searching for the equipment takes significant time
3) Regulation time reduction Procedure
Concrete regulation time reduction must be made according to the following stages.
Step Description Content
1 Situation analysis Measure the necessary time for every operation: preparation, installation of equipments, regulation, etc.
2 Define the calculated objectives
Set the first objective halfway through the current time
3 Sorting and arranging tools Sorting and arranging tools in places allowing to avoid the MUDA
4 Decomposition of stages and reorganization
Transformation of “ internal regulations “ in “ external regulations “
5 Reduction of the time of “internal regulations”
Reduction of the time of “ internal regulations “
6 Reduction of total regulation time
Reduction of total time (number of processes) necessary for every change of manufacturing series
7 Check efficacy Check the results with regard to the initial objective (halfway through the current time)
8 Pursuit of actions Pursuit of the actions and aiming at “zero” regulation
4) Important facts in the reduction of the regulation
To reduce regulations times, it is effective to proceed by keeping the following points in mind:
No. Description Content
1 Decomposition of operations in “ internal regulations “ and “external regulations”
radical Transformation of the “internal regulations” into “external regulations”
2 Pursuit of the standardization of moulds and tools
Determination of the place of moulds and machines and standardization of the size of tightening tools
3 Tightening Simplification Reduction of tightening operations by progressing on tightening tools
4 Exploitation of the intermediate tools
Transformation into “external regulations “by means of standardized intermediate tools
5 Operations in common Participation of several employees to make operations on large moulds in one step
6 Elimination of adjustment operations (regulation)
Search for means to be able to begin the production without any adjustment (regulation)
7 Introduction of production ratio improvement devices
Introduction of production ratio improvement devices after cost/advantage comparison

E-32
2.3 Activities of Productivity Improvement
(1) 5S
1) What is 5s ?
Nowadays, the term 5s became a universal statement in the field of the management of factories, and it is used all around the world. However, factories rarely apply these 5s in a satisfactory way. We can explain this situation in two ways: either the word is known but its meaning is badly understood, or its meaning is understood but the methods of application are badly known. 5s (Seiri / Seiton / Seisou / Seiketsu / Shitsuke) constitutes the base of the management of factories in Quality / Productivity improvement. It is consequently necessary, whatever the Quality / Productivity improvement activity being installed is, to make sure at first that the meaning of 5s is correctly understood and applied by the executives down to the operators of the factory.
No. 5S Correct meaning 1 Seiri Separate what is useful of what is not, and to throw what is useless
2 Seiton Determine the place of useful objects so that they can be easily used, and to indicate their presence in an understandable way to all.
3 Seisou Clean and keep clean permanently
4 Seiketsu Apply Seiri, Seiton, Seisou in a continual way and maintain a permanent state of cleanness.
5 Shitsuke Make the 4s described above a spontaneous habit
2) Method of 5s
- Strategy of the red labels
The “strategy of the red labels” consists in distinguishing, by means of a red label, what is useful of what is not, in a way which is understandable by all. It is good to set up this strategy in the form of project, as it is indicated below:
Category Content Project duration 1 to 2 months Participants to the project Personnel of the considered departments Strategy targets - Stocks (finished products, semi-finished products, raw materials,
other materials) - Moulds, tools - Machines, equipment, transport material, devices - Ground, bookcases
Criteria of measure Objects and spaces which will not be used during the following months.
Examples of label Register on a A5 red sheet the name of the object, its quantity, its storage time as well as the motive

E-33
- House Keeping Competition
House Keeping Competition is a method allowing to promote the activities of 5s at the scale of the whole company, by creating 5s teams in every department and by organizing a competition between the various teams. 5S leaders are chosen in each of the departments. They are asked to promote the activities of 5s on their workplace and to evaluate (with grades) the state of the other departments in 5s during the monthly control inspection.
Category Contained Beginning of the action The start signal is given by the management Period Activities are daily, and have no end Frequency of evaluation - Notation by the 5s leaders of every department during the
monthly inspection tour - The 5s leaders elect the best department once a year
Method of evaluation Mutual notation of the various departments by the 5s leaders Award Annual attribution of the award to the best department
(2) TPM (Total Productive Maintenance)
1) What is TPM?
TPM is an improvement activity aiming at the elimination of defaults, breakdowns and disasters by emphasizing on the equipments’ maintenance at a company scale. In the 1950s, the various methods of Productive Maintenance below were introduced by the United States into the Japanese industrial environment.
PM : Preventive Maintenance - Periodic maintenance process prior to breakdowns BM: Breakdown Maintenance - Maintenance process af ter breakdowns CM: Corrective Maintenance - Rectified maintenances process consisting in limiting the possibility
that a breakdown arises and to facilitate repairs
Productive Maintenance:
MP: Maintenance Prevention - Process aiming at conceiving equipments falling more rarely out of
order and of more well-to-do maintenance
“American way” Productive Maintenance presented above is based on the maintenance departments. In Japan, this Productive Maintenance was modified and adapted during its introduction, giving birth to the TPM as the activity of global improvement at the company scale. The main modification consisted in transferring from the maintenance department to the production department the responsibility of the maintenance of equipments. In other words, the staff of the production department which uses equipments is responsible for making the maintenance, the maintenance as well as the engineering departments, which

E-34
plan and conceive equipments, helping to promote Productive Maintenance. So, the idea of the TPM such as it was proposed in 1971 can be summed-up as follows.
Category Content Purpose of the activities to use equipments in the most effective possible way Management process to implement a global Productive Maintenance of equipments system Means of participating autonomous activities by small teams in the departments linked with the
specific equipment
By spreading, the TPM activities haven’t only touched the production departments but the whole company (Development, Management including sales departments). We so reached in 1989 the following new definition of the TPM.
Category Content Purpose of the activities to set up an organization maximizing the return on the productive systemManagement process to implement a prevention mechanism prior to various losses for the
whole productive system life cycle Means of participating autonomous activities by small teams of the entire staff Final goal to eliminate the various losses by reaching “zero” level of disasters,
breakdowns, defaults, etc.
2) “ 6 big losses “
The TPM aims at maximizing the return on equipments and the final goal is to reduce various wastes “zero”. The main causes which hinder the increase of the efficiency of equipments are classified in 6 categories called “6 big losses “.
No. Loss Content
1 “breakdowns” loss Waste of time caused by breakdowns due to a decline or a stop of functioning of equipments
2 “regulations” loss Waste of time during the regulations of change of series, and loss by imperfection due to the attempts of restart
3 “starting up” loss Waste of time and loss by imperfection at the time of the starting up and after a change of manufacturing series
4 “micro-stops loss” Loss by stop or vacuous functioning of equipments consequently to momentary problems
5 « speed» loss Waste of time due to a difference between the speed of conception and the real speed of functioning of equipments
6 “defaults” loss Material loss by imperfection and waste of time due to regulations that have to be performed.
3) Methods of calculation of ratio
To be able to estimate in a quantifiable way the influence of the “6 big losses” on Productivity, it is necessary to define the methods of calculation of the return with regard to the wastes of time. Work time is decomposed into the following categories.

E-35
Working time
Time of opening (Time of productive functioning) unproductive time
Input Time of functioning Stop time
Output time of functioning Delays
Useful time of functioning Defaults time
(Remarks) Unproductive time : Working absence, wait, periodic maintenance, morning greetings, meetings,
inventories, etc. Stop times : Pause of functioning for breakdowns, changes of series, regulations, exchanges of
tools, etc. Delays time : Necessary time because of delay with regard to the standard time: Time defaults : Past in the production of products of defective quality
- Work time ratio (or Availability Ratio)
Work time ratio is the ratio between the input time of functioning and the Time of opening. It is expressed by the following formula. What we generally call Equipment Working time ratio indicates in most of the cases the Working time ratio. It is relatively simple, within the framework of the TPM, to obtain results in increase of the Working time ratio.
Working time ratio = (Time of opening - Pause) / time of opening
- Performance Ratio
The successful functioning ratio is the ratio between the production in a predefined speed (Time of Standard Cycle) and the time during which the equipment really functioned (raw Time of functioning). It is expressed by the following formula. It is a more complicated matter than that of the hourly functioning rate, but it can be improved within the framework of the TPM.
Rate of performance = (Time of Standard Cycle x number of produced units) / input time of functioning
- Rates of synthetic return on the equipment
The Rate of synthetic return on equipment is the product of the Rate of hourly functioning, the Rate of successful functioning and the Quality rate (number of corresponding units / number of produced units). It is an indicator that allows one to know if the equipment is used in an efficient way with regard to the production. The frame of the places of production has to increase this value by actions of improvement like TPM.
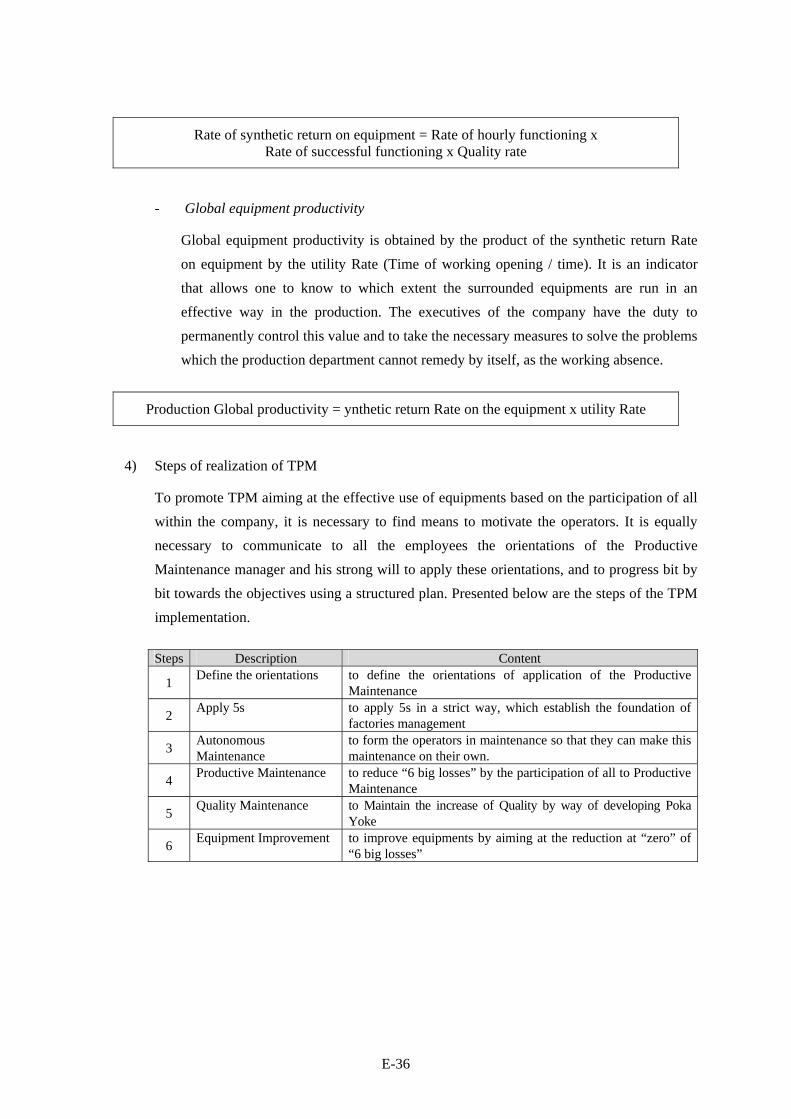
E-36
Rate of synthetic return on equipment = Rate of hourly functioning x Rate of successful functioning x Quality rate
- Global equipment productivity
Global equipment productivity is obtained by the product of the synthetic return Rate on equipment by the utility Rate (Time of working opening / time). It is an indicator that allows one to know to which extent the surrounded equipments are run in an effective way in the production. The executives of the company have the duty to permanently control this value and to take the necessary measures to solve the problems which the production department cannot remedy by itself, as the working absence.
Production Global productivity = ynthetic return Rate on the equipment x utility Rate
4) Steps of realization of TPM
To promote TPM aiming at the effective use of equipments based on the participation of all within the company, it is necessary to find means to motivate the operators. It is equally necessary to communicate to all the employees the orientations of the Productive Maintenance manager and his strong will to apply these orientations, and to progress bit by bit towards the objectives using a structured plan. Presented below are the steps of the TPM implementation.
Steps Description Content
1 Define the orientations to define the orientations of application of the Productive Maintenance
2 Apply 5s to apply 5s in a strict way, which establish the foundation of factories management
3 Autonomous Maintenance
to form the operators in maintenance so that they can make this maintenance on their own.
4 Productive Maintenance to reduce “6 big losses” by the participation of all to Productive Maintenance
5 Quality Maintenance to Maintain the increase of Quality by way of developing Poka Yoke
6 Equipment Improvement to improve equipments by aiming at the reduction at “zero” of “6 big losses”

E-37
Chapter 3. Diagnosis of Company and Actions of Improvement
The economic environment in which Tunisian companies evolve is more and more difficult for the approach of the unification of its market with the EU in 2008. To be able to improve its international competitiveness in such a context, it becomes at least necessary to estimate in an objective way and to become aware of the strong and the weak points of its companies. Even it is also important to know the capacities of its competitors, it is essential to increase its productivity to know first of all objectively the situation of its companies and to run improvement actions by strengthening its weak points and by consolidating its strong points.
3.1 Objectives and Effects of the Company Diagnosis
The objective of a company diagnosis is to verify and to evaluate, globally and in an objective way, the strong points and the weak points of the company. If this diagnosis is not done in a satisfactory way, improvement actions can only have limited results, and may even exhaust the company forces. The company diagnosis is an essential preliminary stage in the application of improvement actions, but it is important to run it in a systematic and global way. It is so necessary to control the whole company, and not only to trust the experience or the instinct of the people in charge of the diagnosis. Even if we limit ourselves to the Quality / Productivity domain, we have to diagnose all the company activities linked with this domain to propose a general view. We can summarize the effects of a diagnosis as follows:
1. It allows to know the fundamental capacities of the company → to be able to strengthen these capacities
2. It allows to estimate the degree of development of management resources → to improve the performances of these resources
3. It highlights the orientations of the company in terms of its operational activity → to be able to indicate these orientations in a precise way
3.2 Methods and Objects of the Diagnosis of Company
There are two types of diagnoses, the “third parties diagnoses” made by company diagnosis experts like consultants, and the “auto-diagnoses” carried out within the company. When we speak of company diagnosis, we generally refer to third parties diagnoses, because it is rather difficult to diagnose one’s own company from an objective perspective by “auto-diagnosis”. It does not mean that all the diagnoses by third parties are good ones. These third parties diagnoses present, however, big disparities linked to the competence of the people making the diagnosis, and can, in certain cases, miss the global character of the diagnosis because of a strong tendency to be diverted towards their

E-38
specialty. It is not true either that the “auto-diagnoses” are of lower quality in respect with third parties diagnoses. “Auto-diagnoses” allows the company to make better use of the results of the diagnosis in improvement actions, and can turn out to be superior to third parties diagnoses if it is objectively carried out. Thus, it is more efficient to use group diagnoses and write down the methods of diagnosis and evaluation in a manual. During an “auto-diagnosis” realized according to these methods, it is the staffs of different departments who make the diagnosis in teams by using for the evaluation a diagnosis evaluation table. In that case, it is particularly important to clearly define in the diagnosis manual « the big points of the diagnosis » as well as the “evaluation criteria”. Generally, the company diagnosis have to embrace a large number of points (large categories), as shown below.
1. Management of factory 2. Marketing 3. Financial Management 4. Management of the conception 5. Development of the human resources
6. Information Management 7. Safety Management 8. Supply, purchases 9. Logistic Management 10. Environment Management
During a factory diagnosis, we diagnose among these categories only that of the “factory management», but it is nevertheless necessary to correctly verify the links with the other columns. Within the framework of this manual, we focus on Quality / Productivity improvement and thus limit the points of diagnosis by restricting ourselves to 4 intermediate categories and to the following 12 subcategories.
Intermediate categories Subcategories 1.1 Situation of the 5S 1.2 Visual Control
1. Production site Management
1.3 Safety and environment of the workplace 2.1 Initial Quality Controls 2.2 Quality Control process Diagram and Standard
Operating Procedure
2. Quality Management
2.3 7 tools of Quality 3.1 Production System management 3.2 Inventory control ( FIFO)
3. Production Management
3.3 Equipment maintenance management 4.1 Waste elimination (7 MUDA) 4.2 Return Control
4. Productivity Management
4.3 Structure of equipments

E-39
3.3 Carrying Out a Company Diagnosis
(1) Criteria of evaluation
During the company diagnosis made by members of the company, it is necessary to clearly define the evaluation criteria to see to it that there are not disparities of evaluation between the various members. It is ideally preferable to fix evaluation criteria for each of the subcategories described above. If it is not possible, it is necessary to fix at least common evaluation criteria for all the categories. The definition of evaluation levels has to be neither too fine, which would make it too difficult, nor too global, which would make the evaluation not precise enough. Presented below are examples of evaluation criteria common to all categories and containing 5 levels.
Notation Evaluation Criteria 1 point Not a single diagnose has been carried out, this requires the members to be helped out 2 points Very insufficient level characterized (partial realization) 3 points Insufficient level in spite of a certain level of completion 4 points Level of relatively good realization but with margins of possible improvement 5 points Level of complete realization. Nothing to add.
(2) Methods of application
In an auto-diagnosis of company, the members of the diagnosis, supervised by the responsible for the diagnosis and by means of the table of evaluation of the diagnosis and the table of the chosen before criteria of evaluation, gather to estimate the various points of the subcategories for each of the intermediate categories. They follow the steps indicated below.
Step Description Content
1 Gathering of the members who are to carry out the diagnosis
Assembling of the diagnosis team members in a predetermined place
2 Check what is to be diagnosed
Check which intermediate categories and the subcategories are to be diagnosed
3 Checking the diagnosis table Distribution of evaluation tables of the diagnosis and the evaluation criteria table to the diagnosis team members
4 Checking of the evaluation criteria
Reading out loud and confirmation of the evaluation criteria by the people in charge
5 Diagnosis inspection Carry out the diagnosis by inspecting the following departments in this order: delivery → production → materials
6 Determining the evaluation grades
Checking the evaluation of the grades of the diagnosis team members by the person in charge + decision
7 Check the objects of the diagnosis
Check the intermediate categories and subcategories yet to be diagnosed
8 Diagnosis inspection Carry out the diagnosis by inspecting the following departments in this order: delivery → production → materials
9 Determining the evaluation grades
Checking the evaluation of the grades of the diagnosis team members by the person in charge + decision

E-40
Concretely, the team leader proceeds to the reading of the evaluation criteria then proceed with the diagnosis tour of the factory, this so that the team members base their work on the same criteria. We then inspect the factory for an intermediate category diagnosis, after this diagnosis, the person in charge asks the diagnosis team members about the grades they awarded each subcategory, synthesizes the various points of view and decides on the grade of each subcategory. We then proceed with the notation of 12 subcategories having controlled the real places, objects and situations for each intermediate category.
The focal point of the diagnosis tour is to proceed with the diagnosis by starting off with departments close to customers and gradually moving to those that are furthest away from them. Incidentally, the company tour is carried in the inverse order of the manufacturing process: delivery → production → material supply. It is based on the definition of Quality « as the correspondence to the customers’ needs (process approval) », and of a process in conformity with the JIF production conception which consists « in producing the necessary quantity at the necessary moment ». The delivery department has an essential role of transmission in the production department of the customers’ needs, and a problem at the level of the transmission of this information is an inadequacy between the delivery plan and the production plan results in wastes like the overproduction.
3.4 Analysis and Appreciation of the Results of the Diagnosis of Company
The results (grades) of the diagnosis are registered for 12 subcategories in a radar chart. The center corresponds to the grade 0, the outside in the note 5. This radar chart allows to estimate in an objective way the strong points and the weak points of the company in terms of quality / Productivity. We present below an example of this type of graph.

E-41
3.5 From the Economic Planning to the Stake in Work of Actions of Improvement
Actions of improvement are planned after having examined well, by means of the radar chart” presented above, the key points and the weak points of the company in Quality / Productivity. When the note is 1 or 2, the first objective is to reach the intermediate note of 3 or more. In other words, the actions of improvement give the priority to the intensification of the weak points onto the consolidation of the key points, and it is only after having balanced the capacities of the company that we shall proceed to actions of improvement aiming at the consolidation of these key points.

E-42
PART II: Factory Diagnosis
Chapter 4. Factory Diagnosis
To make a company diagnosis of the whole manufacturing industry, as it was evoked in part 3, it is also necessary to carry out a diagnosis on numerous categories which are not directly connected to the production. While carrying out a factory diagnosis, not only is it essential to diagnose the “factory management», but also domains such as “staff motivation”, “production indirect development”, “technical innovations”, indicated below.
Categories Intermediate categories 1.1 Quality management 1.2 Cost prices management
1. Factory management
1.3 Production management 2.1 Staff training 2.2 Environment - safety
2. Staff motivation
2.3 Workspace energization 3.1 Raw materials - Logistic 3.2 Equipment Management
3. Production indirect development
3.3 Standardization 4.1 Productivity 4.2 Network management
4. Technical innovations
4.3 Information Management
Diagnosis concerns the intermediate categories indicated above which each contain 3 subcategories and a total of 36 subcategories. Given that this Textbook aims at Quality / Productivity Improvement, we shall focus on the categories evoked in part 3 and indicated below to present the means to allow the diagnosis / improvement.
Intermediate categories Subcategories 1.1 Situation of the 5S 1.2 Visual Control
1. Production site Management
1.3 Safety and environment of the workplace 2.1 Initial Quality Controls 2.2 Quality Control process chart and Standard Operating
Procedure
2. Quality Management
2.3 7 Quality tools 3.1 Production System management 3.2 Inventory control (FIFO)
3. Production Management
3.3 Equipment maintenance management 4.1 Waste elimination (7 MUDA) 4.2 Return Control
4. Productivity Management
4.3 Structure of equipments

E-43
4.1 Improvement /Quality Diagnosis/ Productivity Activities Progress
Improvement / quality diagnosis / productivity activities progress will be run as indicated below.
(1) KICK OFF
(The managers announce the beginning of the quality / productivity improvement activities)
(2) General Plan
(Define the guidelines of the general plan from diagnosis to improvement)
(3) Choice of diagnosticians
(Choice of the participants and the leaders)
(4) Defining the diagnosis application plan
(Define the quality / productivity diagnosis application plan that will clarify 5W1H)
(5) Quality / productivity diagnosis implementation
(Carry out a factory diagnosis tour with the factory diagnosis evaluation table and the diagnosis criteria table)
(6) Diagnosis results analysis
(For the diagnosis results, collect strong and weak points on a graph)
(7) Diagnosis results presentation meeting
(Organize a Diagnosis results presentation meeting and invite the supervisors of the concerned departments)
(8) Improvement activities' application plan
(Prepare an improvement activities' application plan centred on the production department leader)
(9) Application of improvement activities
(Carry out the improvement activities by following the improvement activities' application plan)

E-44
(10) Effects checking and presentation
(Check effects of improvement activities' application plan compared to before-plan and after-plan graphs. Then make a presentation)
4.2 Improvement / Quality Diagnosis / Productivity Activities Method
(1) KICK OFF
Firstly, managers announce to all the employees the general improvement / diagnosis of quality / productivity activities policy. They also clearly indicate the current situation of quality / productivity as well as the objectives to reach.
(2) General plan
Define the general quality / productivity diagnosis as well as the activities improvement plans. Since this activity influences the production plan as well (there is a direct link with the production through the manufacture and the quality); this plan requires the approval of the production manager. Consequently, information such as the approximate timetable of improvement diagnosis application, number of required participants as well as influences on production must be provided.
(3) Choice of diagnosticians
1) Choice of the diagnosis / improvement leader
The diagnosis / quality / productivity improvement leader can be chosen within the company. He can also be chosen among consultants. If the internal solution is chosen,, managers can make this choice themselves or ask for consultants' advice. He must be a person with an adjustable mentality, ideally a department head, possessing a global knowledge of all activities and a cheerful character. It is necessary that the leader periodically carries out an “auto-diagnosis” and repeats the activities that contribute to improvements. However, when the choice is made only within the company, it is difficult to have an objective evaluation performed and thereby compare it with the average level of the concerned field or the other companies. That's why it can be useful to carry out a “third part diagnosis” every 2-3 years with a consultant for leader. It would then be possible to get advice on objective criteria of evaluation and to emphasize on problems which were not perceived by the members of the company, thus allowing to reach improvements application.

E-45
2) Choosing the Diagnosis / improvement participants
The team of participants is mainly made of people of the production department, quality and production management departments, directly linked to the production. It also includes the departments indirectly linked such as equipments conception, purchases, production techniques or marketing departments. It would be relevant to put in place a young team with good knowledge of the departments and a high capacity of adaptation. Every department should supply 1-2 participant(s) for a total of 5-10 participants and for 1 to 3 year(s); by making all the members participate, it will allow to raise the improvement's interest.
(4) Diagnosis application plan definition
The diagnosis application plan detailed definition will be made in compliance with the general plan. At the least, it is necessary that this plan clearly contains the 5W1H concerning the diagnosis. In other words, the diagnosis objective, the diagnosis categories, the diagnosticians, diagnosis dates and hours, diagnosis tour steps, diagnosis tools (diagnosis evaluation table -diagnosis criteria evaluation table) among others will have to be included into the plan. The improvement diagnosis leader will explain the diagnosis application plan to the concerned departments and will benefit from their cooperation.
(5) Application of the quality - productivity diagnosis
The quality - productivity diagnosis goes as follows, around the leader.
1) Diagnosticians (leader - participants) meet in a defined place.
2) Diagnosis leader prepares the diagnosis evaluation table and the diagnosis evaluation criteria table. He deals them out to all the participating members.
3) The leader orally reads the name of the intermediate category to diagnose (and of the linked 3 subcategories) and proceeds to checking.
4) The leader reads out the evaluation criteria table then verifies the level of evaluation.
5) Make the factory’s tour diagnosis in the following order: transport → production → raw materials reception area.
6) The leader verifies points-evaluation given out by diagnosis participants for every 3 subcategories and then determines the grade.
7) The leader will try to unify points-evaluation of every participant.
8) As detailed above, the diagnosis will so be repeated for every category and subcategory.

E-46
(6) Diagnosis results analysis
Besides registering the diagnosis’ points results on the diagnosis evaluation table, it is recommended to draw the normal lines of 12 subcategories on a radar chart to determine the strong and weak points of the company. Launch the first improvement activities with radar chart then draw other lines (but change colour) on the same chart when proceeding to second and third activities of improvement. Progressively, the activities will be led to obtain a big graph in radar chart with 12 angles.
(7) Diagnosis results presentation meeting
After the quality / productivity diagnosis and to the diagnosis results analysis, the head of production department will hold a meeting to present diagnosis results. Besides the leader and the participants of diagnosis / improvement, only the leader of the concerned department and the administrative executives will participate. It is not necessary to ask for the presence of the top managers at that time, as we are only in the first stages of the improvement activities. The presentation of the diagnosis’ results will be made by the diagnosis / improvement leader, assisted by participants. During this meeting, besides the presentation of the diagnosis’ results analysis, proposals on the important points requiring improvements will be presented and the opinion of the attending members will be written down in the improved proposition.
(8) Improvement actions plan definition
The Definition of the improvement actions plan will be made around the head of the production department based on the contents of the discussions having already taken place during the diagnosis results presentation meeting. For the planning, all the categories must not be treated in equally, but we shall focus on the central points of 1or 2 categories to be improved, mentioned during the meeting for the presentation of the results of diagnosis. It is obvious that, as well as for the diagnosis application plan, it is necessary to clearly identify the 5W1H. More specifically, the timetable will be registered on the Gannt and PERT graphs, and must be posted in a place visible to everybody.
(9) Improvement activities application
Carry out improvement activities by respecting the improvement actions plan. These activities will be led by the head of the production department, who will be in charge, with the cooperation of the concerned departments. According to the subjects of improvement, and the size of the company, carry out team actions. Create an improvement team within the production department can also be a good way to do it.

E-47
(10) Impact and presentation checking
A check of the level of advancement compared to the objectives of productivity / quality established by the managers before the actions of improvement will be made. It will be followed by a presentation in the course of a meeting around the head of production department. The people concerned during this meeting will be mainly the managers and the people attending the meeting for the presentation of the results of diagnosis. It is preferable that before the presentation, a complementary factory diagnosis is carried out and is be registered on a radar chart the situation before and after the improvement actions, thus allowing to underline them visually.

E-48
Chapter 5. Quality/Productivity Diagnosis Checking-Points and Improvement Points
5.1 Production Site Management
5.1.1 State of 5S
(1) Checking diagnosis categories
- Check if the company policy concerning 5S is clearly defined by top-managers. - Check the existence of a body promoting 5S as well as the state of their advancement. - Check that the distinction between necessary and useless goods is made. - Check that a store for the necessary objects exists. - Check that the distinction between good quality goods and poor quality goods is made. - Check that the distinction between finished and semi-finished products is made. - Check that a yellow line separates between the secure area and the working space is made. - Check that the secure area is not occupied by objects or people. - Check that tools are arranged according to the frequency of use. - Check that the factory and especially in the work area are regularly cleaned.
(2) Improvement points
1) Evaluation results equal to 1 point
Most of the time, this evaluation means that the interest given by top managers to 5S is weak. It is important that a reform of their approach of 5S is carried out. Initially, top managers have to realize that 5S are considered as the base of the improvements of quality / productivity. They also have to show off an attitude promoting the 5S activities as a company policy.
2) Evaluation results equal to 2 or 3 points
Meaning of 5S is well-known by top managers down to those in charge of control. But although 5S 'posters are displayed, the state of 5S's advancement is often insufficient because their assimilation has not reached the operators’ and the supervisors’ level because they are not acquainted enough with the means of improvement. Consequently, for these companies, it is necessary to create a 5S promotion body. And if in spite of the creation of this body, the level of 5S remains low, it will be useful to implement the red label strategy and House Keeping Competition as indicated in chapter II 2.3 ( 1 ) of this Textbook. We shall constantly implement the red label strategy in the short term and House Keeping Competition for the long term.

E-49
3) Evaluation results equal to 4 or 5 points
In these companies, the main problem is routine. Therefore, it is necessary to continue to improve the customs of Seiri, Seiton, Seisou, Seiketsu. Then, on these bases it will be useful to think about the best way to develop the improvement activities on the reduction operations regulation time as well as on the TPM.
5.1.2 Visual Control
(1) Checking diagnosis categories
- Check if the operation directives are given orally, or if a management table of program (table of the deliveries 6) or display screens are used.
- Check on the program management table or on the aforementioned display screens the functioning of the preparation of the operations, the assignment operations, directives of the operations and the management progress.
- In case an abnormality arises, check if there is a display equipment to stop the machine or the production line.
- Check that the management program is shown on Gannt graph.
- Check that the quantity of foreseen production, the actual production and the quality are reflected on a graph and registered on the bulletin board of the production site.
- Check that photos and samples are used in the Standard Operation Procedure and the Quality Standard.
- Check that the parts of defective quality are indicated on photos or that samples are kept.
- Check that photos showing the situations “before” and “after” the improvement activities are posted on the bulletin board of the production site.
(2) Improvement points
1) Evaluation results equal to 1 point
In companies evaluated at this level, the directives are orally given and their contents are not clearly defined. It is necessary to begin to change the management mode at first: use display screens and program management table ( deliveries’ table). The management program will have to be carried out according to the Gannt diagram and we shall indicate the program and the process of critical path ( high priority operation). The directives of the operations must
6 The table of the deliveries allows to assign the operations by machine and by operator by taking into account
the state of load and the program

E-50
be given in front of the management table, and in case changes are brought to the process or to the program, gather the staff quickly in front of the management table to adjust the modifications.
2) Evaluation results equal to 2 or 3 points
Operations directives are best given by using display screens and the management table, but the emergency works are not correctly handled. Consequently, it is necessary to improve the management system to make treatment of emergency and modifications works the more flexible. The integration of software and of PCs will allow to simplify operation assignment. Furthermore, concerning the quality standards and the working instructions, it is recommended to use a visual documentation using photos and samples as often as possible.
3) Evaluation results equal to 4 or 5 points
Operations assignment, their preparation or their directives are easily understandable by the operators and third parties. From now on, it is recommended to promote the “ real-time visual control “ for the forecast of the production quantities and the actual quantity, the working-state of machines and different quality indicators.
5.1.3 Workspace Safety and Environment
(1) Checking diagnosis categories
- Check that the top managers show a strong corporate policy concerning safety and environment.
- Check that there is an environment and safety management body - Check that the zero accident and the environment protection operations are launched. - Check the existence of a management indicator for safety and environment and its state of
completion. - Check the state of completion, the annual plan and the control system of safety and
environment. - Check the existence of standards concerning safety and environment and if they are
respected. - Check that uniforms, helmets, shoes of security supplied are worn. - Check that the workers are formed on safety and environment. - Check that a safety equipment and a risk prevention equipment are attached to the material - Check that noise pollution, humidity, dust and luminosity of the factory are measured. - Check that the improvements of the workspace take into account the ergonomic approach. - Check that the making of a pleasant workspace takes into account moral health.

E-51
(2) Improvement points
1) Evaluation results equal to 1 point
In most cases, this evaluation means that the interest carried by the top managers in safety and environment is weak and it is important that a reform on their approach of safety and environment is accomplished. It is necessary and important to become aware that a polluted working environment where occupational accidents arise affects workers' morale; this makes quality or productivity improvements unattainable. The top managers have to think first of all about the responsibility of the company concerning safety and environment, and then indicate the “safety above all” policy, first step towards the creation of a pleasant working environment. Besides, it is necessary to create a management body for safety and environment within the company and systematically apply it. In companies evaluated at this level, the big priority goes to the training of the staff on safety and environment. Concretely, within the framework of the training on safety, gather the information « about the deep 7 », classify them, to form then the workers in the anticipation of the risks in their workspace.
2) Evaluation results equal to 2 or 3 points
In companies rated at this level, the common policy concerning safety and environment is well indicated, but although there is a management body, its activity is not completely exploited. For that, it is necessary for the management to elaborate a detailed plan over one year on safety and environment which clarifies the common policy. This plan will aim at stimulating the activities of safety / environment of the workplace by being complying with the other work plans. An example of a safety and environment management plan is indicated below.
April : complete training in the safety / environment field (approach / behaviour code).
June : create a ceremony dedicate to safety (carry out a campaign for factory safety / awards ceremony / public relations).
August : check the protection and safety equipments and installations (complete bearing of the equipments of protection / check of the safety system).
October : create a ceremony dedicate to environment (carry out a campaign for the public improvement of the factory environment / discounts / relations).
December : strict respect of safety rules / environment (review of the operations).
February : preparation of the annual safety and environment management plan for the following year (examined by the committee).
7 The situations of dismay in the production site. Situation shortly preceding a work accident
-Also called KYT. Case Study Method to face danger

E-52
3) Evaluation results equal to 4 or 5 points
In companies evaluated at this level, they are required to continue the safety / environment activities and to make a step forward in terms of improvement, by creating for example a pleasant workspace which takes into account the ergonomics’ approach as a factor of improvement of workspace and mental health.
5.2 Improvement of the Quality
5.2.1 Initial Quality Control
(1) Checking diagnosed categories
- Check the existence of a standard Textbook concerning the initial quality control procedural.
- Check the existence of archives and samples of the initial quality.
- Check if there is a feedback of the conception and process of management concerning the archives of cleaning of the initial quality and to verify if it is exploited as technical information.
- Check that the important characteristics of quality have undergone the Process Capability. control
- Check that there is a decision system, examined by each concerned staff, concerning the cancellation or the continuation of control (conception, production, assurance quality, inspection, production techniques).
- Check that the confirmation and cancellation procedure of the outsourced and internal production is established.
- Check that the criteria of change management concerning work or inspection methods or the operators have been defined.
(2) Improvement points
1) Evaluation results equal to 1 point
In most cases, companies rated at this level do not possess archives on the initial quality. It is thus necessary to begin by registering archives on the initial quality. It is necessary to have for base the conservation of samples and the recording in writing of the visible quality which cannot be numerically described, and a rigorous filing of the dimensions and the forms of the initial product. Keep the small size objects in plastic bags and put labels on average and big size objects.

E-53
2) Case where the evaluation is of 2-3 points
In companies evaluated at this level, although the description of the initial quality is archived, in most cases, the Initial quality control is rarely made according to the order indicated on the standard Textbook. It is necessary to start by defining the order of the Initial quality control by writing it down. Then archive as initial quality, the important characteristics regarding quality which can be indicated with figures, such as the precision of the dimensions or the precision of the shape with the Process Capability (Cpk) index. So it will be possible to establish{*constitute*} source data for the improvement of the quality distances during the passage in the mass production.
Process Capability indicates the capacity to produce goods within the limits of a defined standard. The index used for the evaluation is thus the Process Capability index. Generally, it is indicated by “Cp”, the initials of Process Capability. The determination of Cp will be made according to the formula indicated below. Furthermore, “σ” is the distance-type indicating the distances.
1) Only in the case of superior limitation standard: Cpu = (value standard of superior limitation - average value)/3 σ
2) Only in the case of lower limitation standard: Cpl = (value standard of lower limitation - mean value)/3 σ
3) Case of the value limit: the weakest value of Cpu and Cpl
In every case indicated above, the indication Cpk will more often be used than Cp. The indication Cp is used when the mean value is in the center of the standards of limitation (case of the limited value) and is not very convenient. For example, Cpk = 1.0 indicates that the limit value of the standard is remote from σ of the mean value, and, in the case of the semi standard, it means that 0,14 % of products are outside the standard. For every assembled piece, the defects rate influences every piece , and an assurance “ppm “ (1/1 000 000) becomes generally necessary. It amounts in more of 1,5 times the Cpk index.
3) Evaluation results equal to 4 or 5 points
This evaluation means that the Initial quality control is integrated into production system and that the company works in an organic way. However, given the possibility that the management of the modifications is not sufficient, it is necessary to indicate clearly the procedure by appointing a person in charge of modification control who will take care of modifications of inspection technique, of work method, or operator's changes.

E-54
5.2.2 Quality Control Process Chart and Standard Operation Procedure
(1) Checking diagnosis categories
- Check the existence of a Quality Control process chart and of a Standard Operation Procedure.
- Check that the review categories registered on the diagram of Quality Control standard coincide with reality.
- Check that there is a link between the Standard Operation Procedure and every process of the Quality Control process chart.
- Check that the operations on the production site comply with the Standard Operation Procedure.
- Check that the diagram of Quality Control process is well run for work improvement and determination of the quality problems' origins.
- Check that the Standard Operation Procedure contains photos and plans which facilitate understanding.
(2) Improvement points
1) Evaluation results equal to 1 point
Companies rated at this level, most of times, are not conscious of the utility of Quality Control process chart and Standard Operation Procedure. The Quality Control process chart represents the base of quality improvement and quality assurance, and the Standard Operation Procedure normalizes the production « well done from the beginning » of good quality products. It is necessary at first that these points are understood by top managers down to the operators.
2) Evaluation results equal to 2 or 3 points
In companies rated at this level, the necessity of a Quality Control process chart and Standard Operation Procedure is assimilated but the maintenance is insufficient and these tools are not used to reach improvement of quality and productivity. Consequently, it is necessary to revise the plans of Quality Control process chart to make it simple and understandable and to facilitate the addition and the recording of the modifications. It's the same for the Standard Operation Procedure within the framework of the standards of control: it is necessary to state the conditions of revision and to periodically review them.

E-55
3) Evaluation results equal to 4 or 5 points
In companies rated at this level, most of the time, there is a Quality Control process chart and a Standard Operation Procedure for every product / detail and the maintenance is also correctly made. It is recommended to keep applying the Quality Control process chart and Standard Operation Procedure for the improvement of the quality and productivity.
5.2.3 7 Tools of the Quality
(1) Checking diagnosis categories
- Check that the Pareto chart is assimilated and applied by quality services staff. - Check that the histogram is assimilated and applied by quality services staff. - Check that Cause- and-Effects Diagram is assimilated and applied by quality services staff. - Check that the control graph is assimilated and applied by quality services staff. - Check that the scatter graph is assimilated and applied by quality services staff. - Check that the stratification is assimilated and applied by quality services staff. - Check that the executives of the production department apply completely the 7 tools of
quality. - Check that the staff of the engineering department runs completely the 7 tools of quality .
(2) Improvement points
1) Evaluation results equal to 1 point
For companies rated at this level, there is no scientific approach on the origin of the defective quality, and because the problem is handled ad hoc, repetition of defects can not be avoided. It is necessary that top managers become aware that 7 tools of quality allow an analysis of the fundamental cause of quality problems and have to speed up its spreading within the company. To do it, we shall integrate the training on 7 tools of quality for every employee into the human resources development program.
2) Evaluation results equal to 2 or 3 points
For companies rated at this level, the 7 tools of quality are assimilated by a part of the production engineers, engineering and quality departments but are only run partially. The priority is to increase the number of people capable of applying 7 tools of quality that have to be assimilated by every person in the company so that everyone can contribute to Quality / Productivity Improvement. Because the histogram and the control graph require a specialization in statistical studies, initially it will be only required of the quality department staff to know how to use it. But concerning check-list, Cause- and-Effects Diagram, Pareto

E-56
chart, scatter graph and stratification, given their relative simplicity; it is preferable that all the employees know how to apply them.
3) Evaluation results equal to 4 or 5 points
In companies rated at this level, the 7 tools of quality are assimilated and applied by most, and are used as tools to resolve problems. It is preferable that they are not only employed as tool of analysis of the origin of the defect after an incident arises, but also as tool contributing to Quality / Productivity Improvement. In that case, the use derived of the histogram of Process Capability index ( Cpk) will be an effective tool to evaluate the level of reliability.
5.3 Production Management
5.3.1 Production Management System
- Check that the production plan complies with the delivery plan. - Check the frequency of distance control between actual production and production plan. - Check that process plan and the decision of the order of the operations are systematized by
computer. - Check the way functioning conditions and expenses management controls are made. - Check with which system the management by exception and process abnormalities controls
is made. - Check the circuit from order until delivery concerning product, information and receipts. - Check details of lead time, from order until delivery. - Check the number of returns and the respect rate of delivery timing.
(2) Improvement points
1) Evaluation results equal to 1 point
In companies rated at this level, Production management is not systematized and it is handled only by operators. Consequently, it is recommended to use the management program table (deliveries table) to define the program as well as the management of the actual production on the Gannt diagram. After accumulating the results, systematization shall be integrated with the help of computers.
2) Evaluation results equal to 2 or 3 points
In companies rated at this level, although the Production management was systematized at a certain level, there are problems in managing expenses and delays in delivery due to

E-57
overdue treatment. Consequently, it is necessary to revise the Production management system so as to manage uniformly by computer the information circuit, invoices, and orders until the products’ delivery, and to improve the system so that the management of the exceptions be flexible in treating production process abnormalities.
3) Evaluation results equal to 4 or 5 points
In companies rated at this level, the information flow, invoices and products is uniformly managed by computer and management by exceptions tends to be applied in a flexible way by the system. From now on, it is recommended to aim for a system allowing real time verification of productivity indicators such as POP.
POP is a principle which allows to manage information about the production which appear from time to time within the production site: paperless, gathered from 4 sources (“machines”, “equipments”, “operators” and “produced goods”), are analyzed in real time and passed on to the person in charge for the production site; the inverse mechanism also exists, i.e. the directives of the person in charge of the production site, depending on the result of their decision, are sent to the production site. POP allows to search through signals (button or contact point) production information of 4 sources; data can be also taken in automatically and directly. 2) transmits treated information to the person in charge of the workspace in real-time, 3)is an information exploitation tool for the person in charge of the production site who not only allows the transmission and the analysis of the information, but also permits to send the directives to the person in charge of the production site.
5.3.2 Inventory Control (FIFO)
(1) Checking diagnosis categories
- Check that the First In First Out (FIFO) principle is applicable to the entry of materials, to the stocks and the delivery.
- Check that the previous history of material delivery according to the suppliers and the reception records were kept.
- Check that materials that must be managed first were defined and that an analysis by ABC 8 class is made.
- Check the connection between the categories of materials and the supply system (system of periodical re-supplying / system of re-supplying as of a certain point / method).
- Check that the distribution of the volume of every order matches the economic order quantity9.
8 Technique of priority management which consists in grouping together the categories of management in a
Pareto chart to distribute them in groups A, B, C.

E-58
- Concerning store management, verify that a stratified management matching with the deliveries frequencies is made.
- Check that the products’ names (spare parts), their quantity, their storage area are well known.
- Check the number of days of storage of products in the production chain and the production process.
- Check the number of days of storage of finished products.
(2) Improvement points
1) Evaluation results equal to 1 point
Companies rated at this level are in a situation where the daily inventory control is far from being made. Concerning reception management, scarcity and excess of stock are predictable. Concerning deliveries’ management, excess of stock and delays in delivery are also predictable. And we fall in a vicious circle: to avoid the problems of scarcity and delays, we still increase stocks. To improve such a situation, it is necessary to become aware of the importance of inventory control. For that purpose, it is good to try to rate the level reached by the cost of stock detention (financial expenses), insurance expense, storage cost, transport costs, waste expenses).
2) Evaluation results equal to 2 or 3 points
In companies rated at this level, the inventory control is made but the coordination between Production management and deliveries management is insufficient, problems of scarcity and excess of stocks occur from time to time. To improve such a situation, it is necessary to analyze by ABC class, and manage in order to decompose materials depending on whether they are managed uppermost, ordered by the system of periodic re-supplying once the threshold is reached or ordered according to the simple method. Concerning the volume by order, it is recommended to use a method to order according to the economic quantity order. The department of materials not only has to make a quantity and delivery periods management but also a quality management of the received materials. It is necessary to keep the previous history of delivery according to the suppliers and the records of the reception reports.
9 Quantity of an order corresponding to the most cheaper total cost by taking into account the cost of signing of
order and the cost of stocking.

E-59
The economic order quantity ( Q ) is determined according to the formula below.
Q=(2AY/ai)0.5
A : Cost of signing an order a : unitary cost price
Y : Quantity used annually i : storage cost rate (20-30 %)
3) Evaluation results equal to 4 or 5 points
In companies rated at this level, inventory control, Production management and deliveries management are organically connected; stock is constantly managed to be the smallest possible. Consequently, points to be improved concerning the inventory control are limited, henceforth it is necessary to make the standardization and the pooling of materials progress in coordination with the conception department to reduce the stored volume, and examine the possible improvements of the Q.C.D from the company’s global point of view.
5.3.3 Tools and Equipment Maintenance Management
(1) Checking diagnosis categories
- Check that daily inspection of equipments and autonomous maintenance are carried out by the operators.
- Check that preventive maintenance of equipments is made.
- Check that preventive maintenance of tools is made.
- Check that corrective maintenance of equipments is made.
- Check that corrective maintenance of tools is made.
- Check that names of the people in charge for equipment maintenance and the previous history of the overhauls are posted.
- Check that the control sheets of daily equipment inspection are posted.
- Check that a management of equipment breakdown length, MTBF10 and MTTR11 is made.
- Check that synthetic return rate and global productivity management on equipments is made.
10 Mean Time Between Failures 11 Mean Time To Repair

E-60
(2) Improvement points
1) Evaluation results equal to 1 point
Maintenance is not made by the operators. Maintenance is only made the maintenance department equipments, small malfunctions can thus not be discovered and can become important breakdowns, which largely upsets quality and productivity. First of all, it is necessary to be aware of the importance of daily inspections: begin by making operators carefully inspect daily operations such as cleaning and the equipment lubrication before and\or after production.
2) Evaluation results equal to 2 or 3 points
In companies rated at this level, the autonomous maintenance is made by the operators, but the length of equipment breakdowns remains relatively big. To improve this, it is necessary impose the necessary and sufficient points of inspection by the use of control sheets of daily inspection. Staff of the maintenance department, by basing itself on the overhauls’ register, will form the operators in order for them to discover small abnormalities or inspection points to carefully focus on. Put the TPM to the test(Total Productive Maintenance): it is not only to repair in case of breakdown, but also to essentially prevent the appearance of breakdowns.
3) Evaluation results equal to 4 or 5 points
In companies rated at this level, the autonomous maintenance and the preventive maintenance are made by the production department; the maintenance is thus made before important breakdowns occur. Besides, a maintenance plan is correctly implemented by the department of the maintenance and the level of TPM is high. Henceforth; it is necessary to make the level of autonomous maintenance of the production department progress thanks to the instructions of the maintenance department. The maintenance department manages the MTBF and MTTR indexes, and released from a part of the maintenance given to production department, it can focus on the corrective maintenance to improve the reliability and the “maintainability” of the equipments.
The MTBF is a specific duration defined according to the formula below: MTBF = total run time / total number of breakdowns

E-61
5.4 Productivity Management
5.4.1 Waste Reduction (7 MUDA)
(1) Checking diagnosis categories
- Check that 7 MUDA is understood.
- Check that there is no MUDA overproduction by verifying the volume of delivery, the volume of production and the number of half-finished products.
- Check that there are no MUDA stocks by verifying the quantity of the stocks of finished products and spare parts.
- Check that there is no MUDA transportation by verifying their necessity of and the duration of the handling.
- Check that there are no defective products by verifying the real state of the defects.
- Check that there are no ineffective processes by verifying the necessity of the operations.
- Check that there is no waiting time by verifying the duration of wait and the contents of the processes.
- Check that there are no useless movements as exposed by the principle of economy of gestures.
(2) Improvement points
1) Evaluation results equal to 1 point
In companies rated at this level, MUDA appears in all domains. The MUDA on the production site leads to an increase of the cost price, it is thus necessary to track down these MUDA and to repeat constantly the actions aiming at suppressing these MUDA. To do so, it is necessary to know how to distinguish the real work of the MUDA, and to be well aware of MUDA. To eliminate this 7 MUDA, we use techniques below.
No. Type of MUDA Improving methods 1 Overproduction Smoothing of production 12/autonomation 13/zéro regulation /versatility 2 Stocks Smoothing of the production/ U structure/ zero regulation 3 Transportation U structure/versatility 4 Defective products Poka Yoke/autonomation/Process Capability increase/ Standard Operation
Procedure 5 Over-processing VA- VE/Standard Operation Procedure/ processes conception 6 Waiting time Versatility/U structure/smoothing of production 7 Motion Moves economy principle /Standard Operation Procedure/Poka Yoke
12 Produce from an average planning of production, products type of products and duration. 13 Mechanism or equipment which stops if an abnormality occurs during the process.

E-62
2) Evaluation results equal to 2 or 3 points
In companies rated at this level, efforts have already begun to eliminate the MUDA, but MUDA is still visible in numerous domains. Among the 7 MUDA, it is advisable to eliminate the most essential: overproduction. The overproduction entails stocks, and stocks create not only costs of storage and transport but make all sorts of problems invisible. When there are too many stocks, the problems such as the chronic breakdowns, defects of balance of the processes are not discovered, thus the principles of improvement cannot work. It is then necessary to apply at least one of the techniques of improvement to eliminate the overproduction and the stocks.
3) Evaluation results equal to 4 or 5 points
In companies rated at this level, the production is relatively made without MUDA. However even in such a company, it can be difficult to discover the ineffective processes. It is thus necessary to verify the necessity of the processes and the operations made by using the “ 5 Why method14» to eliminate wastes of hours of labour.
5.4.2 Yield Control
(1) Checking diagnosis categories
- Check that productivity management is made. - In this case such management is made to verify the definition of productivity. - Check which indications are used for productivity management installations. - Check which indications are used for productivity management work. - Check that the definition and the composition of man-hour and of duration are defined. - Check that the standard duration is fixed by a scientific approach. - Check the difference between standard duration and real duration.
(2) Improvement points
1) Evaluation results equal to 1 point
In companies rated at this level, the Production management is left to the production itself; companies are in a situation where only the daily production volume to be reached matters and in which a yield control is not made. To improve such a situation, it is at first necessary to establish within companies the concept of standard duration (ST). Then, it is recommended to fix the standard duration according to a scientific method. The standard
14 Method of problem resolution allowing to find its cause by repeating the question "why" and by answering it
every time.

E-63
duration consists of a margin, of basic duration, and of the shortest duration necessary for the execution of an operation according to the best practicable method.
2) Evaluation results equal to 2 or 3 points
In companies rated at this level, the standard duration for every process is fixed and a part of the control of return is made, but the difference between standard duration and real duration is big and the reliability of the values of the indications of management is weak. To improve such a situation, choose an operator normally experimented to make a leveling from the duration of the operations to determine effectively the standard duration. It is also preferable to adopt the MOST15 method which allows a definition of high precision of standard duration.
3) Evaluation results equal to 4 or 5 points
Concerning companies rated at this level, many of them collect the real data with POP. However, even if they use a POP system, certain companies make only the collection and the data analysis, and the directives of operation are not generated. In case the directives of instructions are not generated in spite of a POP treatment of the real data, there is a significant reduction of the efficiency.
5.4.3 Equipments Structure
(1) Checking diagnosis categories
- Check if the structure creates numerous movements of staff or half-finished products. - Check that the structure facilitates the operations and that it reduces movement time. - Check if there are operations requiring a long length of haul. - Check that the structure does not contain obstacles for transport. - Check that the structure of equipments is a classification by product or a classification by
function. - Check that there is a balance of the equipment capacities. - Check that the structure facilitates the maintenance. - Check that there are no useless stocks of finished or half-finished products during the
process. - Check that the structure allows safety of operations. - Check that the structure takes into account the environment of the operations.
15 Maynard Operation Sequence Technique

E-64
(2) Improvement points
1) Evaluation results equal to 1 point
In companies rated at this level, there are numerous people movements and products which are useless, and a rational analysis of the structure of equipments is not made. In a majority of the cases, the state of 5S is not satisfactory. To improve such a situation, we proceed at first with a study of the structure which allows to realize that there is a possibility of improvement of the productivity by eliminating transport, useless movements and handling. It is only after that step that 5S can be implemented.
2) Evaluation results equal to 2 or 3 points
In companies rated at this level, the state of 5S is not satisfactory and the structure of equipments is not rational. To improve such a situation, we make at first a products analysis by ABC class ( P ) and of the volume of production ( Q ). In other words, we classify products according to their production volume and we build a Pareto chart. Concerning the volume of production, it's better not to define it in financial terms but by using factors linked to the volume of transport such as the number, the weight and the volume of products. For the group A in the important volume of production, we shall use the assembly line fabrication method according to a classification by product. For the group C in the weak volume of production, we shall use the shop job fabrication method according to a classification by functions. For the group B, we distribute the production between the assembly line fabrication method and the shop job fabrication method by taking into account various conditions, the main one being the assembly line fabrication method. For mass production, we shall choose the structure presenting the best efficiency for the progress of the processes and the movement of products.
3) Evaluation results equal to 4 or 5 points
In companies rated at this level, the structure is adapted to the production and there is few waste concerning the transport and the handling as well as the stocks. Henceforth, it is necessary to form the operators in several processes and to study a U structure conceived for the versatility.
APPENDIX:
ANNEX-1 Factory diagnosis diagram ANNEX-2 XBAR-R control chart ANNEX-3 Analysis by class ABC ANNEX-4 MUDA check-list ANNEX-5 man-hour composition

E-65
PART III: Improvement Case by Case
Chapter 1. 5S Application Manual
1.1 Introduction
The 5S method is an initiative which increases the productivity and optimizes the functioning and the reactivity of the company, is of awesome efficiency: tries to avoid the human error, emphasizes the fundamental principles and controls not only what is difficult but also what is easy. The utility of 5S’ approach in the industrial unit is as follows:
- The industrial unit with a weak 5S hides wasting because we cannot distinguish what is useful from what is useless (starting line of the improvement)
- 5S is the implementation of a system of waste detection.
- 5S is the mirror reflecting the industrial unit’s executives (leadership and teamwork).
The importance of 5S is so evident that many people make the mistake: they concentrate on the particular modalities as if it were a lucky charm. We should not forget that 5S is a way to achieve precise objectives.
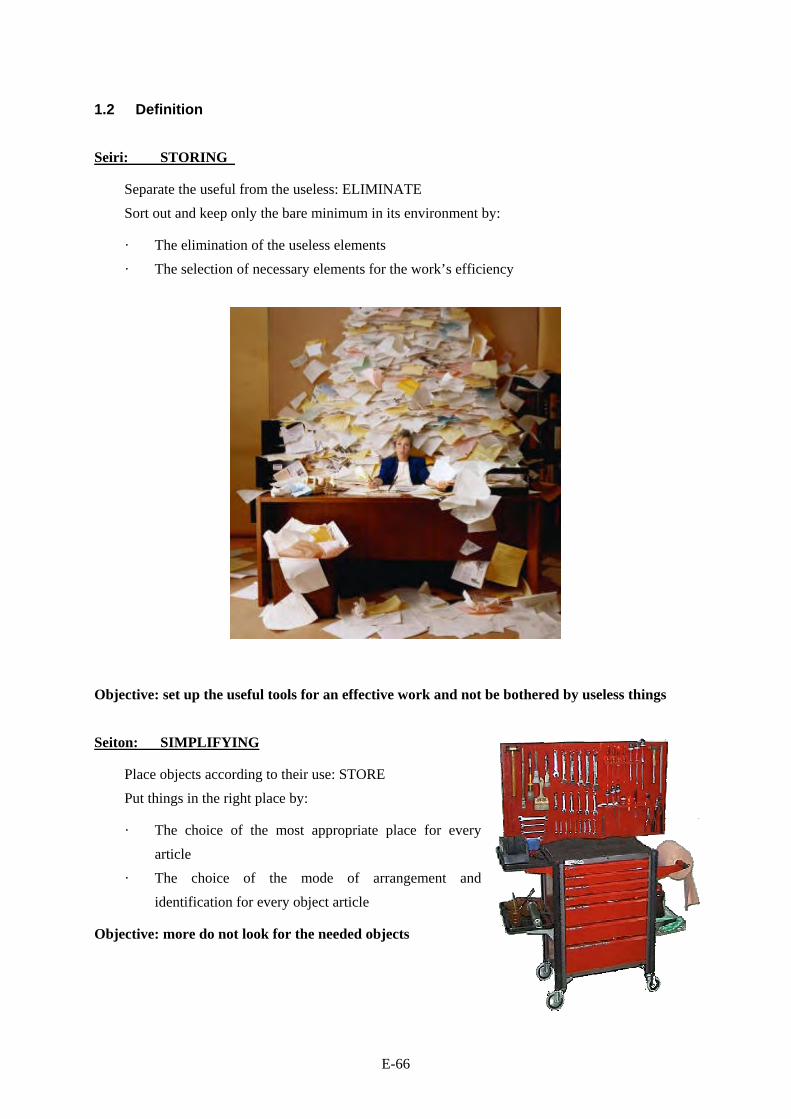
E-66
1.2 Definition
Seiri: STORING
Separate the useful from the useless: ELIMINATE Sort out and keep only the bare minimum in its environment by:
· The elimination of the useless elements · The selection of necessary elements for the work’s efficiency
Objective: set up the useful tools for an effective work and not be bothered by useless things
Seiton: SIMPLIFYING
Place objects according to their use: STORE Put things in the right place by:
· The choice of the most appropriate place for every article
· The choice of the mode of arrangement and identification for every object article
Objective: more do not look for the needed objects

E-67
Seiso: SWEEPING
Eliminate the sources of stains: SWEEPING Eliminate the dirt with efficiency by:
· identifying of the sources of stain in every cleaning · the implementation of actions to eliminate the
sources of stains in order to assure the cleanliness with a sweeping reduced at the least
Objective: do not dirty
Seiketsu: STANDARDIZING
Standardize visually the best practices: TO STANDARDIZE Set up a successful organization by:
· The identification the best practices · The simple formalization of these practices ( visual helps) · The communication and the training to its application
Objective: do not forget the best practices
Shitsuke: SUSUTAINING
Systematize the respect for the best practices: to RESPECT Assure the respect for the standard established by:
· The acquisition of new customs · The possibility of a permanent autocontrol of the respect for the established rules.
· The information and the treatment of the detected abnormalities
Objective: use the best practices and improve them permanently
1.3 Objective
(1) Apply 5S inspire confidence to your prospects and customers.
Clear paths, clean machines, identified places and packaging, clear office spaces and well stored, updated bulletin board reflect an image of quality and efficiency.
All these positive signs, during the visit of your site, will lead your prospects and customers to attribute you their next orders.
5S industrial units and offices are powerful tools for a winning marketing.

E-68
(2) Apply 5S allows to reduce the wasting.
Well-organized jobs reduce the movements, the handlings and useless gestures and thus the wastes of time.
The increase of the rigour of each, in the respect and the improvement of the procedures, leads to a drastic decrease of rubbishes and alterations and more generally all the wasting.
An environment of pleasant work increases the motivation of the collaborators and develops their will of progress, which leads to ideas of improvement.
5S industrial units and offices are powerful tools of costs’ reduction.
Apply 5S
· Improves the safety of the persons, the equipments and their environment by a better organization and respect for the simple rules, which are established and validated by those who have to apply them.
· Improve the motivation of your staff that “ feels much better” in an environment of pleasant work. In a clean and orderly workroom and where the communication is facilitated by visual standards, the stress decreases, the motivation increases, ideas of improvement are emitted.
· Improve the performance of equipments by clearly defined, attributed and realized operations of maintenance.
· Develop a rigorous spirit. From the physical objects that make the everyday life of each, The state of mind is transformed towards more opening, more respect for the other one and for the environment, more desire to progress
· Allows to open the spirits, to facilitate the change and the acquisition of other tools or approaches such as Total Productive Maintenance, the improvement of streams, self-quality, …
1.4 Approach of Implementation
Storing means “ to loosen what obstructs “. It thus means making the sorting between what is useful and what is not.
How to store - to sort out?
· Realize a schedule of the operations, · Anticipate the necessary material means,

E-69
· Take photos of the current state of the workstation and show them. · Analyze every case: defective and broken parts, rusty objects, out-of-date documents... · not to hesitate to throw away · Show the determination of the management and the supervisory staff, · Every one has to participate actively: inform and solicit the concerned staff, · Realize a schedule of the operations · Anticipate the assistance of the maintenance, · Actualize the bulletin board and use it constantly (audits, action plan) · Stay up to reach the reference state, · If some points are problematic, go back as soon as possible to the concerned information
and mobilize the skills in order to solve them,
How to store?
This step is about storing everything after elimination.
It is a question of:
· Finding easily the object which we need it and when we have the utility of it · Finding the object when we need it
Storing is:
· Observe and criticize the current process of ordering (if it exists) · Make an inventory of objects to be stored, · Study the frequencies of use, · Delimit and identify place and objects,

E-70
· Propose a place for every object, · Choose the modes of ordering, · Anticipate the cleaning of the ordering post and facilitate it (to plan “How”, the duration and
the equipment), · Take into account the weight, · Take into account the blocking. · Fit out the workstation (tools and documents used frequently should be nearby), · Mark places: stocks, handling, documentation... · Facilitate the location: make visible the abnormalities, the missing, use labels, symbols · Identify and delimit working zones: the zones of passage, the zones with risk... · Use painting, descriptive, colours...
The result of the operation must be visible:
· zones must be clearly delimited (aisles, working space, dangerous zones) · objects and zones of affectation must be identified · It must be possible to locate easily the missing objects · The system of cleaning must be visible (kit of cleaning, trash can), · Use bright and contrasted colours, symbols. · objects used frequently have to be quickly and easily reached. · The fragile objects must be protected. · The standards of ordering as well as the description of the reference state must be
formalized.

E-71
The criteria of ordering are:
· efficiency (minimize the research time) · Safety (beware of the falls and collision) · Quality (beware of the rust, blow and the mixing of parts)
How to clean?
This step is often neglected, because the persons do not see the utility and do not take the cleaning seriously.
· Make an inventory of fixtures by step: where to clean, What, Who realizes it, Define the priorities, …
· To put back the tool to the wished and negotiated state of cleanliness; it is not a question of putting back the installation as new but it is necessary to obtain the necessary state for the proper functioning of the tool, in conditions of work and safety corresponding to the legislation.
How to keep order and cleanliness?
Approach Means Identify natures and causes of stain
Approach the origin of the dirt: how did the dirt arrive there and how we can prevent it?
Eliminate and reduce the causes of stain
Make visible the abnormalities Localize and study the simplification of access to difficult places
Define the methods of cleaning
Organize time for the cleaning Name the people in charge Integrate for any new task a time for ordering, cleaning.
Operation KEEP CLEAN
· settle priorities by localizing the generative places of stain and places difficult to clean. · Start a process of permanent progress to eliminate the sources of stain: aim at the zero stain. · Set up means not to make dirty (hoods, water-channels, deletion of swipes, inhalation of
smokes). · Dedicate time for the cleaning (at least 3 minutes / day / person, define a cleaning plan,
implement cleaning range,…) · Implement standards of cleanliness and a reference state. · Improve the environment (painting, lighting,…). · Simplify the cleaning. · Attend to an effective application of the cleaning rules.
E-72
How to set in order
It is a question of implementing working rules, of trying them before validating them.
These rules have to be:
- Simple, - visual or written
· Settle priorities by locating points to be supervised in particular. · Describe and visualize the standards or the reference states for these points · Make visible the abnormalities to facilitate the control:
- cleanliness : strengthen the lighting, to paint in colours allowing an immediate location of stains
- Arrangement : make visible the absence of an object, make visible any badly placed object, over-stocked...
· So that rules are respected, it's better to make them write and visualize by the very operators.
· Visualize very clearly what you should not do.
Operation rigour
We respect to the everyday life the rules which we defined. Otherwise, there is no interest to have made and formalized it.
· Handle the problems according to their appearance. · The initiative comes from the staff. · Make all the concerned people participate · Create multifunctional teams. · Be pragmatic and angle the immediate action. · Look for the best use of what exists. · Communicate visually on the progress of the projects. · Use a methodology of problem’s common resolution. · The improvement is continual: no day without improvement. · Whatever is the reached level, it is always possible to do better. · The improvements are led by the need of the customer (internal and external). · The process is more important than the result. · Apply the PDCA. · The management dedicates time to listen to the suggestions and to observe the process of
problem’s study.

E-73
CONCERNED FIELDS
All the fields are concerned: at the production level, at the administrative level, whatever is the sector and the strength of the company.
Workstation Sort out - Clear Pas d'objets inutiles, pièce cassée, objets divers, objets rouillées
Order Tools and identified objects (according to the frequency of use), make visible what is missing
Clean Regular cleaning, control and inspection Keep order and cleanliness Respect the instructions of cleaning, ordering and safety
Involve / Formalize Implement the visual procedures, assure the visibility of the inspection points
Industrial unit Sort out - Clear No excessive “in process” Order Places defined for “in process” Clean Common parts, toilet, cloakrooms Keep order and cleanliness Respect the instructions of cleaning, arrangement and safety.
Involve / Formalize Show action plans, maximum values of stock, safety, circulation and evacuation instructions.
Bureau Sort out - Clear No out-of-date documents, obsolete documents Order Documents and files, identified, easy to find Clean No stain, pleasant environment (furniture, windows) Keep order and cleanliness Eradicate the causes of stains, origin of dusts Involve / Formalize The Respect for the instructions, the procedures, the display
Meting room Sort out - Clear No useless objects Order Furniture and equipment Clean Nobody draws on floor, walls, boards Keep order and cleanliness Visual procedures (equipments and instructions)
Involve / Formalize Show the schedule of use, the schedules, the rules of meetings, etc....
1.5 Conditions of Success
(1) Implement a 5S stimulation committee
The structure of the 5S approach has to be traced on the hierarchical structure. It has to assemble the members of the top management and work on the base through quality dynamics. The person in charge of every work unit will be responsible for the stimulation of 5S inside its unit, but will nevertheless be managed by a 5S moderator.

E-74
(2) Define the policy of 5S
Once these principles are implemented, this authority will have for mission to define the policy of 5S: Setting up working groups, defining specific objectives and periods...
For certain fields, every workstation points specific problems and it can be interesting to constitute teams of project to resolve them. These groups will include representatives of industrial units and technicians.
From then on, every team will have its own objectives and schedules, what will avoid giving the impression of a multiplication of useless efforts.
The success of this approach will depend on the efficiency of the actors to create the structures necessary for the 5S sensitization as well as all the actions of promotion. It is imperative that its members are also ready to go to the workplace in order to give instructions and advices about 5S. As it is imagined, it is essential that these persons are extremely motivated and capable to motivate.
(3) To define the 5S action plan
It is thus advisable to implement a 5S action plan and to apply it. The first rule is to define a plan by fixing periods for every action. It is necessary to use ranges and to watch permanently this schedule by striving to realize it. Furthermore, the plan has to anticipate meetings and reports to review the objectives and list those who were reached. Especially, the participation should not be limited to few persons. Contrary, make it an even. By inviting third parties to attend to the success is all the more gratifying for those who made the work.
(4) To set up an action plan
Firstly, it is necessary to know that when a decision is taken it is has to be applied (get rid everything we do not need, to begin a big cleaning, to dedicate every day 3 minutes to the cleaning).
Also, it is advised to create adapted tools and to use them (shelves and special tables for the ordering of objects, labels and instructions’ panel).
Then, it is necessary to make things that require preliminary improvements (place hoods to avoid the projections of chips and take measures to avoid the leaks).

E-75
Finally, it is necessary to start actions that require the assistance of other services (to repair machines, to change the layout of an industrial unit, to anticipate the oil leaks).
From then on, it is necessary to set up indicators to follow the evolution of the actions 5S led on the field (example: indicators of cleanliness that would be estimated by ranges of cleaning, or working groups to follow the evolution (before, during and after)).
So, it is very important that the evaluations are made with rigour so that those who realized important efforts can observe the seriousness of the approach. The evaluations have to go until the slightest details and neglect nothing. The one who estimates will have to observe as well the good points as the bad ones, because the identification of the problems is the first step towards the improvement.
(5) Follow the action plan
Although it seems logical to ask to a team of the superior level to do the evaluation, to ask the questions and to give its opinion, trusting this task to a team of the same level offers more possibilities from the point of view of the exchange of ideas and the mutual training. Numerous companies thus have teams of the same level following their respective work then afterwards trust teams of superior level for a first evaluation before proceeding to an external evaluation.
So, it is very important that the evaluations are made with rigour so that those who realized important efforts can observe the seriousness of the approach. The evaluations have to go until the slightest details and neglect nothing. The one who estimates will have to observe as well the good points as the bad ones, because the identification of the problems is the first step towards the improvement.
So photos are an excellent means to keep a tincture. It will illustrate the previous, the “in process” and the later situation. These photos constitute not only landmarks for the concerned persons, but they can also serve for making known the progress carried out during the 5S general meetings and to the outside experts.
1.6 Conclusion
The 5S approach applied with methodology and rigour, allows to draw visible and computable results on the cleanliness, the environment, the internal atmosphere, the brand image of the company, the quality but also the safety.

E-76
Appendix: 5S Activities’ Evaluation Check-list
EVALUATION CATEGORIES
Floor 1 No oily marks nor chips on the floor.
2 No parts on the floor 3 No defective parts thrown on the floor 4 Clean floor 5 No painting marks on the floor 6 No lack neither of break in demarcation lines
Trailers and manual cleaning means
7 Person in charge clearly identified 8 Everything in good condition 9 No fragment nor materials accumulated 10 Places clearly indicated
Machines 11 All numbered with indication of their capacities 12 No object on top 13 Integrated safety systems 14 No labels which are not really necessary 15 Signs indicating the risks to all the dangerous
places
Lubrication systems 16 Filters are set according to the prescriptions. 17 Manometers indicate the normal pressures
Measure tools 18 Neither dirty nor rusty 19 Nothing is used beyond its date of validity
Meter 20 Manometers and appropriate electric meters 21 Manometers and appropriate electric meters
provided with a label indicating the range of the normal values
Hydraulic circuits 22 Are pumps, valves, etc… leaking 23 Are manometers appropriated 24 Pipes and clamps are well fixed 25 The pneumatic systems are handled correctly
Electronic device 26 Meters are provided with plates indicating their limits
27 There are blown light bulbs 28 All the switches are clean
Pipes and cables 29 No leaks from pipes or hydraulic systems. 30 Rolled up cables. 31 Main pipes coded by colour and with label
indicating the direction of the stream
Control panel 32 No dirt, dusts or impurities on panels. 33 No inscriptions or useless labels
Notice 34 Appropriate signs 35 No out-of-date announcements
Others 36 5S responsibilities clearly defined at chain level 37 Every operator knows his responsibilities

E-77
Chapter 2. Improvement of the Layout
2.1 Introduction
The actual industrial undertakings are operating in an environment where the competition is increasing. In order to face the situation, to reduce the prices and to be well positioned on the market, the main preoccupation of the entrepreneurs is: how to reduce the production costs?
The first answer is: cut the waste in order to improve the productivity.
Indeed, it can be applied at all levels (materials, energy, time, effort…); and often, it does not require an important amount of investment.
Among different practices, the improvement of the layout will be the subject of this manual’s chapter.
2.2 Definition
The layout or the plan of the site is a representation of the site’s implantation scheme that visualizes:
- The implantation of different equipments and machines - The delimitation of the areas for delivery, production, stocking, transfer, lading, etc - The analysis of products’ and materials’ flow (physical flow) - The information concerning the covered distance, transferred quantity , operation time, …
Reduce the costs? ?

E-78
2.3 Objectives
The research on layout’s improvement has several objectives, among them:
- Simplify the physical flow (eliminate operations that does not create value-added, prevent from crossbreeds)
- Move the flow more freely and accelerate it - Reduce bottlenecks - Optimize efforts and moves - Reduce the waste of time and tiredness - Improve the working conditions - Improve the productivity and reduce the costs - Etc.
2.4 Approach and Implementation
It must be pointed out that there is no unique approach to complete the improvement of the layout. Indeed, it depends on the problem, the initial situation and the wished or expected results.
The approach presented below is just a possible methodology for this type of action.
The steps for this approach may be presented as follow:
1. Define the base conception of the layout (type of production) 2. Analyze product/quantity’s flow 3. Identify the interrelation of the given tasks 4. Decide the wished proximity levels 5. Draw up the propositions of the layout 6. Evaluate the propositions 7. Implement the accepted layout
2.4.1 Define the Conception Base of the Layout
This step consists of determining the type of production applied in the factory through the research of the layout improvement. On that subject, there are three types of production:
Type A : Based on one product Type B : Several products Type C : Based on the process

E-79
In order to carry it out, the production volumes per product are represented by using Pareto. According to the graphic obtained, it is possible to de decide the type of production as follows:
Type A: Based on one product
0
20
40
60
80
100
P1 P2 P3 P4 P5 P6 P7
Quantity
Type B: Several products
0
20
40
60
80
100
P1 P2 P3 P4 P5 P6 P7 P8
Q uantity
Type C: Based on the process
0
5
10
15
20
P1 P2 P3 P4 P5 P6 P7
Quantity

E-80
2.4.2 Analysis of the Product/Quantity’s Flow
Type A: Based on one product
This phase consists in representing the product manufacture range on which the layout is based, from the elementary material or component up to the assembly of the finished product.
Ci: Component/Material Ei: Step of manufacture C: Control S: Stocking
Type B: Several Products
In this case, the range of manufacture of the principal products is represented. In order to carry it out, all the manufacturing stages are schematized and all the steps each product that goes through are mentioned.
P1: Product E1: Manufacturing step
P1
E6 E2 E1 E4 E5 E3
P3
P2
E3 C3
C2
E1 C1 C SE6 E4
E2 S
E5

E-81
Type C: Based on the process
In this case, a chart representing the different existing manufacturing operations is drawn in the lines and columns. Subsequently, the boxes of the chart are filled out by writing down the process by which each product has been manufactured the following logic: a product is written down in one box once it has moved from the line step to the corresponding column step.
à de
E1 E2 E3 E4
E1 P1P2P3 P4
E2 P2P5
E3 P3 P1P5
E4
2.4.3 Identify the Interrelations of Tasks to Accomplish
This step is the most important and it consists in identifying the needed proximity levels between workplaces where different steps of manufacture are carried out, based on the following results:
E5
E4
E3
E2
E1
A
A
D
B
C
B D
A
C
B

E-82
A, B, C and D represent the levels of proximity as follows:
A
Essential
B
Important
C
Not very important
D
Not important
----------------
2.4.4 Decide the Wished Levels of Proximity
The required levels of proximity between the workplaces in the previous chapter will be represented on the chart of the manufacture process by using the representations drawn on the chart below (cf. example).
Reception of Raw Materials
Turnery
Draining
Surface Finishing
Drawing
Thermal Process
Packaging and Delivery

E-83
2.4.5 Setup the Layout Propositions
After the previous researches on the levels of required proximity between different workplaces, in other words, between equipments, machines, post manuals etc, different layout propositions are drawn up by taking account into different factors (fluidity of tasks, nature of machines, available space, weight and volume of pieces…).
Furthermore and as far as possible, plan different shapes of layout: U, O or C.
2.4.6 Evaluate the Propositions
In order to choose the layout’s propositions described above, to evaluate the different options several criteria have to taken into account such as:
- Technical feasibility - Easiness of implementation - Modification cost - Productivity savings - …..
2.4.7 Implement the Held Layout
After clarifying the different layouts’ propositions, the one that presents the best compromise between the cost due to the implementation and the gains in productivity and that suits the company the most is chosen.
Fluidity of Tasks
Layout Propositions
Available Space Kind of Machines
U ; O ; C

E-84
2.5 Success’ Conditions
- Engagement and implication of the company, and more precisely of the general management
- Flexibility of production tools concretized by the possibility of moving some equipments and machines
- Consider the investments created by the improvement of the layout - Support of the personnel about the procedure and the acceptance of changes
2.6 Conclusion
The procedure for the improvement of the layout presented in this chapter is one of the applicable procedures, but not the only one. Its application and its success is based on the implication of the company at all its levels.
The advantage of the layout improvement is that it does not necessarily need investments; however, it allows to obtain concrete results in quality and productivity improvement.
In case this action requires investments, all alternatives ought to be considered from the diagnostic phase in order to avoid important expenses and investments (moving big machines, purchase costly new machines…).
Lastly, the layout’s improvement should not stop at the level of moving the machines or the workplaces. Indeed, once the new layout is implemented complementary measures must be taken such as the 5S, tracing, work station balancing, waste reduction…
Layout improving is just one step in a relentless process to improve quality and productivity within the company.

E-85
Appendix : Example of Improvement
Initial Layout
First Improvement
Second Improvement
Third Improvement
Final Layout

E-86

E-87

E-88

E-89

E-90

E-91
Chapter 3. Load Balancing on Workstation
3.1 Introduction
The purpose of any technique of load balancing is to optimize the use of the processes. In other words, the load balancing has to minimize the execution time of a set of task given, what often means maintaining an equivalent responsibility on all the processes.
Generally, this mechanism is also used to manage the equity of execution time between the tasks.
3.2 Definition
Load balancing on workstation: it is the process of assignment of tasks in jobs in a way that the execution time is approximately equal for every post.
3.3 Methodology of Load Balancing on Workstation
Basic concept to be mastered:
3.3.1 Production Cycle of a Workstation
a. Production cycle “C” (cyclic time)
It is the interval of time between the exits of two consecutive units when the workstation works at full capacity.
Furthermore, if the chain is not balanced, the production cycle of the chain is equal to the production cycle of the step that constitutes a bottleneck.
B. Production cycle “C”
Production cycle = Standard Time / Number of workstation working in parallel
Production capacity = TP / C
TP : Time of Production C : Production cycle

E-92
Example:
If the standard time for a particular operation is 10 minutes and if there is an equivalent of 2,5 employees allocated to this task, then:
Production cycle = 10 minutes / 2,5 employees = 4 minutes There will be thus a product which will produced by this step every 4 minutes on average.
3.3.2 Hourly Pace of a Workstation
It is the number of units produced by unit of time, generally in hour.
(If it expresses the production cycle in hours, the hourly pace is equal to opposite reverse of the production cycle).
In the case of an unbalanced chain, the pace of the chain is equal to the pace of the bottleneck.
Example:
In a banking service:
- Pace= 4 customers / hour - Production cycle = 15 minutes
3.3.3 Pace of a Process
It is the number of units produced during a base period (ex: the 1 hour) by the process.
How to calculate the pace?
- Sequential process : the pace of the process is equal to the pace of the bottleneck. - Parallel process : the pace of the process is equal to the sum of the paces of every
workstation
Example:
In a private medical hospital, we make complete medical examinations, which include five steps. The patient or the customer has to pass in every step among which the order and duration are showed below:
1. eye examination .................. 15 minutes 2. hearing examination............ 12 minutes 3. cardiovascular ..................... 25 minutes 4. teeth examination................ 20 minutes 5. taking a blood sample ........... 5 minutes

E-93
Where is the bottleneck?
The bottleneck is in the workstation which requires most time to treat the patients.
What speed will the patients go out of this process?
At the speed of the longest step (every 25min)
What could we make to balance the stream of the patients through this system?
Multiply the longest workstation in time
3.3.4 Rate of a Workstation Occupation
It is the percentage of available time effectively used by a workstation for the production.
- sequential process (serial):
We often emit the hypothesis that workstations fit the pace of the bottleneck. In that case, the rate of occupation is equal to the relationship between the hourly pace of the bottleneck and that of the considered post.
Rate of occupation of workstations of one step =
Pace of the bottleneck step / Pace of this step
EYES
15
HEAR ING
12
CARDIO VASCULAR
25
TEETH
20
BLOOD
5
EYES CARDIO
VASCULAR HEAR ING
TEETH
BLOOD
15 12 25/2 = 12,5 5
CARDIO VASCULAR TEETH
20/2 = 10

E-94
- Process in parallel:
The rate of occupation of every workstation is in theory 100 % because every workstation does not depend on the others.
The capacity of a process in parallel is determined by the sum of the paces of all the posts of the process
3.3.5 Timing of Workstations
Timing methodology
Step 1: understand the objective of timing
It is generally necessary to identify the physical frame of the study (unit of place) and the concerned resources (operators, machines). It is necessary to determine the form of the expected result: percentage of activity, law of statistical distribution and its parameters, a value of time...
Step 2: explain the objective and the conditions to the operators.
Any timing must be explained to the concerned persons (objective, methodology) before beginning in order to establish a reliable climate. For example, in the case of the study of a manual workstation, the ideal is to fit out the post by arriving (parts at good height) so as to gain the trust of the operator. Generally, the pace is improved while getting less tired. Do not forget to discuss with the various actors during the break (offer a coffee!). Several operators can be observable. It is necessary to choose qualified persons. A qualified worker possesses the know-how, the knowledge and the other necessary qualities to execute the work according to satisfactory standards of safety, quantity and quality.
The timekeeper has to prepare the operator for timing. For that purpose, he has to accustom him to his presence. He does not have to “hide” to time. The ideal is to take place at the side of the operator (2m), slightly behind. In this way, the observer is not in the direct field of vision but can be seen by turning the head.
E-95
Step 3: identify sequences.
The observed work is decomposed into various sequences which take place inside the frame of study. The use of a diagram of Gantt, a Simogram * or of an analysis of progress allows to list with efficiency the decomposition of the work made on a workstation.
* The Simogram is the graphic representation of the simultaneous or successive events in the fulfilment of a work.
Stage 4: define the number of timings to be realized
It will have a direct influence on the validity of the result. A way of proceeding is to realize 3 timings and to calculate the characteristics of this sample: average and standard deviation. It is necessary to pay attention that the registered variations of time result only from the fate and not from the deliberate will of the performer.
3.3.6 Factors of Success
- Identify and communicate the common challenges - Clarify the principles of action - Introduce the success indicators - Draw up plans of training and versatility - Develop communication - Reward success
3.3.7 Conclusion
The improvements of the operating modes, the arrangements of workstation, the implementation of new techniques, reduce production time. It becomes necessary to update standard time that has sometimes strongly decreased; it requires the support of the concerned staffs. Indeed, the operators implicate themselves a lot only if the objective is at the same moment practicable and ambitious and only within a transparent and fair system. To establish the trust, the operators owe being informed about elements taken into account during the improvements and to have the possibility of disputing them. The system has to take into account unplanned chances and differentiate the fields of responsibility between the operators and the organization.

E-96
Case study 1
This case is about television’s assembly line.
The pace is 8 units / hour of work for a group composed of 9 people.
Problem to resolve
The timing of the operations shows that the post n°2 (casket assembly) presents a bottleneck (7,4 minutes).
Proposition of improvement
The grouping of the operations 3 and 4 allowed freeing a worker who is allocated to the operation 2 (7,4mn → 3,7 mn).
The pace becomes: 16 units / hour of work for the same staff.
3.4 minutes 1 employee
3.52 minutes 1 employee
1.6 minutes+1.4 minutes 1 employee
1. Panel card assembly
2. Casket assembly
3+4. White balance + Mobile test image
8. Packaging 7. Labeling 6. Fix test image
5. Isolation test
3.2 minutes 2 employees
1.5 minutes 1 employee
1.8minutes 1 employee
1.2 minutes 1 employee
2. Casket assembly
3.52 minutes 1 employee
3.4 minutes 1 employee
7.4 minutes 1 employee
1.6 minutes 1 employee
1.4 minutes 1 employee
1. Panel card assembly
2. Casket assembly
3. White balance
4. Mobile test image
8. Packaging 7. Labeling 6. Fix test image
5. Isolation test
3.2 minutes 2 employees
1.5 minutes 1 employee
1.8minutes 1 employee
1.2 minutes 1 employee

E-97
Case study 2
This case is about an assembly line of electrical switches.
Simplified plan
Problem to solve
The operating time of the electrical switches’ assembly line is not well controlled because of a bad load balancing of workstation (pace of work is very different for each assembly post).

E-98
Improvement actions
After results’ simulation of workstation’s load balancing, we notice that the waiting time and the time for transportation were reduced by 94 %.
The propositions of balancing of the process shows that time operating and of control were decreased by 20%.
The number of workstations on the assembly line passed from 9 to 8 posts with the same number of staff (15 operators).
Effects of improvement
The production of the assembly line registered an increase of 20 %.

E-99
Chapter 4. SMED Method
4.1 Introduction
For a manufacturer, the reduction of the size of lots and the will to quickly answer market demands, the control of fast series changes is indispensable.
Behind this visible evidence, though often repeated, hides the increasing requirement of the consumer, the diversification and the abundance of the offers, fast innovation awaited by the market. An unavailable product is generally a lost sale, which will benefit a more reactive competitor. The stored products are subject to obsolescence. Here we are, besides expenses inherent to the very storage, even returns make stocks expensive.
To acquire a competitive edge, it is necessary to know how to quickly satisfy the customer demand, knowing that the customers’ demands turn more and more to personalized products which is incompatible with long series.
For a manufacturer, the reduction of the size of lots and the will to quickly answer the demands of the market implicates that the control of fast changes of series is indispensable.
4.2 Definition
Single Minute Exchange of Die = Exchange tools in less than 10 minutes
A structured operations’ analysis method which aims at reducing changeover time.
Appeared more than thirty years ago, the principle of fast changeover was conceptualized by the Japanese professor Shigeo Shingo under the name of SMED (Single minute exchange of die).
Instigated by its inventor, the SMED method had numerous applications in the world (Japan, United States, France…). Today, it presents an obvious interest in a context which is completely different with the mass production of the past years, and where the reduction of changeover duration becomes a major issue for the companies which have to answer, in shorter periods, very diversified product orders and made in reduced lots.
The method applies to the total time of stopped production, that is to say the interval between the manufacturing of the last unit of a lot and the manufacturing of the first good unit of the following lot.

E-100
A change of manufacturing seems generally very dependent on the type of machine or on operation that is carried out. Nevertheless, the analysis of the various procedures of equipment’s assembly or production startup shows that they proceed according to the same successive stages and that the changeover time divides up globally as follows:
Preparation, tools, machine, environment and means: 20 to 30 % of total time;
Change of tools: 5 to 15 %; stake
Trial parts, settings, obtaining of the first good unit: 40 to 50 %.
Traditionally these operations are carried out after the machines stop. Now, according to the basic concept of the S.M.E.D., certain operations, said “internal”, require the stop of the machine, but the other one, called “external”, can be carried out at masked time, out of machine, without loss of production.
4.3 Objective
Fast exchange of tools, series
For a manufacturer, the reduction of the size of lots and the will to quickly answer market demands, the control of fast series changes is indispensable.
4.4 Approach of the Implementation
The reduction of the series’ changeover passes by four conceptual phases:
- Phase 1 : analysis of a changeover in the initial state. The purpose is to identify objectively all the operations carried out during this change. The ideal means is making video shots that give the exact chronology of the operations.
- Phase 2 : separation between “internal” and “external” operations. The objective is to carry through, at masked time, the external operations. To do this, it is necessary to act on the organization of the changeover, in particular for the phases of preparation and the disposal of means. At this level the necessary investments are small. It is not rare at the conclusion of these two phases to notice a gain of 25 to 50 % on the time of stopped production.
- Phase 3 : converting internal operations into external operations. It is during this phase that the usefulness of certain operations is examined and that the supply of

E-101
indispensable material means is determined. It results in a reduction of the number of internal operations and global time gain.
- Phase 4 : reduction of operation execution time, internal and external, by their rationalization. This step is dedicated to search for simultaneous tasks, their optimization, as well as the improvement of the settings with the aim of decreasing the number of trial units.
4.4.1 The SMED’s Dynamic
BY MAKING EVERYTHING... EVERYDAY.
“Flexibilise”, improve the ability of a machine or a position to quickly change a lot.
AND WHY NOT EVEN… INSTANTANEOUSLY!!!
The stop of a resource for a change of series is not a fatality?
IT IS NECESSARY TO REDUCE IT AS MUCH AS POSSIBLE AND MAY BE EVEN TO ELIMINATE IT.
In the sense the SMED,
The change of series = The time span which passes by between:
- the last good unit of the previous manufacturing (series); - the first good unit of the following manufacturing (series).
During which, one or several operators re-configure the machine or the position and its immediate environment by executing a set of tasks or operations.
A SMED action, thus consists in:
- identifying the operations in a orderly way
Then propose solutions to:
- move them through time (convert), reducing the duration of execution (reduce), or eliminating them! (eliminate).

E-102
Because, if the spirit of the SMED motivates, the tool should not demotivate!
- Think global (upstream and downstream), within the framework of the company’s strategy.
- Dig up the real thorough problems. - Improve a little more everyday. - Accelerate the progress’ intention streams. - Respect and value each one’s ideas.
4.4.2 Phases or Steps
4.4.2.1 Sequential Progress of the Method
4.2.2.2 Phase 0. Choice of the Construction Site
The principle of application of the S.M.E.D. method passes by the choice of an “experimental construction site”. It is the workstation held to lead the action. The underlying objective is the extension of the construction site in the other posts of the workshop.
• Define the objectives • Choose the pilot construction site • Identify the workgroup • Identify the operations: ○ internal operation (that must be
necessarily done, machine stopped) ○ external operation (can be done while
the machine is working) • Extract the external operations which are
wrongly handled, as internal operations • Track down the internal operations that
have to be externalized • Convert operations: ○ internal operations in external operations
• Reduce the duration of the operations’ execution: ○ internal and external operations
Phase 3
Result’s mesure
Phase 0
Phase 1
Phase 2
Phase 4

E-103
Some criteria of choice:
· Representative production post · Significant resource constraint · ...
The choice is thus very important and should be done carefully.
It will serve as a shop window and must be able to easily demonstrate the merits of the method in order to convince and glue the whole company to the initiative.
The greatest difficulty is maybe, to make the whole company approve this initiative. It is necessary to convince and to implicate the people.
4.4.2.3 Phase 1. Observations and Measures
The first phase concerns the balance sheet of the initial state. Then, observing the progress of a change of production and of finding all its relative information.
· chronology · duration · constraints · material means · resources · ...
The objective is to know the reality of the facts. We generally use an audio-video movie; it gives an accurate image of the progress, with no omission.
On the other hand, it is indispensable to inform the staff in order to obtain their support and overcome the psychological aspect concerning the use of the video.
Whatever the used method, it should not influence the progress of the operations and the action of the operators and\or the setters.

E-104
4.4.2.4 Phase 2. Improvement of the Presentation
The operations identified beforehand are divided into two categories:
· internal operations which in the current state stop the production · external operations which can be realized without stopping the
production, off-machine
This phase is going to consist in tracking down the internal operations to externalize them and to extract the external operations that are treated at this stage as internal operations.
The purpose is to carry out the external operation at masked time.
It is mainly about preparation operations. (Tools, accessories, means of handling,?).
At this stage, the investments are generally very weak, on the other hand the obtained gains are spectacular.
They can reach rates of 25 to 50 % simply with an optimization of the organization of manufacturing’s change.
The solutions put in place only require common sense and logic.
4.4.2.5 Phase 3. Modification of the Low-cost Means
When all the external operations are realized at masked time, it becomes indispensable to continue to progress, to convert certain internal operations into external operations.
It is a phase that generally requires technological contribution. The objective is to reduce at most the number of internal operations, which, for the record, generate the stop of the production.
Investments are to be expected, however considered as weak with in comparison with those needed in phase 4, because they only concern workstations in the narrow sense of the term, without questioning the complete manufacturing process.

E-105
4.4.2.6 Phase 4. Heavy Modification of Means
We look for time saving:
- At the level of the internal operations, for machine stop reasons. - As well as at the level of the external operations for cost reasons.
This phase leads to reducing the internal and external operations.
This phase, if it is different from the previous one, from a methodological point of view, in practice the same initiative is required.
It can cast doubt on the manufacturing process, and this fact implies a long-term action plan and heavy investments.
4.4.3 Duration and Planning
An S.M.E.D. action is spread in the time: · several months, or even one year for
significant progress.
The starting point is the strategic implication management. Then are linked together the phases of:
- constitution of the groups - sensitization and training - choice of the pilot post - analysis - definition of an action plan, associated
in the progress’ objective The notion of action plan is fundamental. It results from the teamwork and proposes treated on a hierarchical basis solutions, classified according to criteria such as:
- cost / time saving - ease / difficulties of implementation
period, possibility of generalization.
Define objectives (Chief executives)
Information Consciousness-rising of the staff
Choice of the site
Forming workgroups
Movie
Analysis
Action plan
Validation
Implement
Implementation and follow-up
Results
Extension Continue
1Month
6~12 Months

E-106
4.4.4 The Tasks
4.4.4.1 Task Observation and Identification
A Process
• Injection • Assembly • Wiring • Fabrication…
Each process is divided into macro-operations.
• Change the tools • Tune the machines • Supply the workstation • Clean the workstation • Control the parts...
Each macro-operation is decomposed into operations.
• Screw / Unscrew • Search for the tools • Look for the screws • Bring out the tuning sheet • Plug / Unplug
LET’S QUICKLY ANALYZE THE MACRO-OPERATIONS, Before analysing each operation!!
4.4.4.2 Task Reduction
3 axis on which it is possible to work on in order to make improvements and by so doing make the resource factor less restrictive:
L'ORGANISATION
- Product-resource links - Resource implementation - Task synchronization - Ergonomics and workstation security. - Stowage of consumables and tools where they are destined to be used - Ordering of technical documents at the workstation - Preventive maintenance...
Task Reduction requires :
MEN’S COMPETENCES
- Placing self-control for every operation - Train operators to tune up the production means - Establish groups to resolve problems and encourage team spirit

E-107
- Develop versatility. - Make people autonomous and responsible.
Task reduction is also considering aspects such as:
THE TECHNIQUE
- Standardizing the man / machine interface - Standardizing the machine / fabrication equipment interface - Simplifying and eliminating tunings. - Eliminating screwing and unscrewing cycles. - Defining self-control means - Adapting maintenance means - Defining and standardizing the preparation means of the upcoming production - Improving machine capability (s.p.c.).
4.4.5 Data
4.4.5.1 Preliminary Preparation
Data gathering actions
Preliminary from a human point of view
To carry out SMED action, you have to count on every participant’s implication!
Operators have good knowledge of the process, the machine and their work.
In the future, they will have to take new rules into consideration that they apply more willingly since they will have helped in their conception.
They will help collect data necessary to preliminary analysis. Knowing that this data directly concerns his activities, one should take care in communicating as much as possible and with diplomacy. If the personnel is not well informed, the project may be rejected.
The reluctance of the staff, if it isn’t involved, is obvious! Especially when they are subject to such investigations and changing working habits.

E-108
4.4.5.2 Data Gathering
Information needs to be collected:
• Count the machine documentation, • Mass Implementation, • Hourly capacity, • Maintenance Files, • List of references that pass by this machine, • Describe the used method, • List the macro-operations, • List the elementary operations, • Count the equipment, the tools, ...
Measure the following performance indicators:
• Initial series average changeover time, • Machine productivity ratio (MPR), • Synthetic yield rate (SYR), • Average number of series’ changes per week, • Queue length and volume of the throughput, • Clock the different steps, • Clock the operations, • Count the necessary steps
Clocking:
Situation : Present state 1)
Enhanced 2) Tran
spor
t
Ope
ratio
n
Dec
isio
n
Insp
ectio
n
Del
ays
Time / Activity N° Activity Description Time Cumulates Internal External
01 Stop the machine 0 :30 0 :30 -
02 Put the necessary tools close to one another 1 :30 - 1 :00
03 Check if all the pieces are there 1 :40 0 :10 - 04 Search for the air pipe 2 :10 - 0 :30 05 Clean up the inside of the matrix 3 :40 1 :30 - 06 Go get the pipe 4 :10 - 0 :30 07 Start the machine 4 :30 0 :20 - 08 Close the matrix 5 :00 0:30 -

E-109
4.4.6 Operations’ Conversion
At this stage, we want to make the distinction between what must absolutely be done when the machines are stopped (internal tuning) and what may be done when machines work. That is to say before a series’ change (external tuning).
One has to know if what is made when machines are stopped could be done when machines work, thus convert internal tuning into external tuning. Unnecessary external tuning, just as internal tuning, by habit or bad knowledge get immediately converted.
A few conversion examples:
Pre-heated moulds on and by the machine, are eventually pre-heated by other means.
Products mixed by the machine, which requires tests, are mixed and adjusted beforehand; the machine is supplied with the already mixed, ready-to-use product.
The bridle of a part on the piece carrier is no longer done by the machine, but a mobile piece carrier is set up on the machine with the already bridled part.
4.4.7 Simplify, Minimize
4.4.7.1 Brigades and Fixings
Fundamental reminder:
Whatever the length of the screw and the number of threads, it’s always the first turn that unscrews and the last one that screws! In other words, tightening with one single turn is just as efficient as tightening with 10 turns, but way quicker!
This also applies for screw nuts.
Then there exists a variety of solutions to avoid from using nuts and screws, because even if you reduce the number of turns necessary t tighten them up, they are still annoying in the sense that are easily lost, look alike but have different diameters, etc.

E-110
Some other tightening and bridling examples :
• U shaped discs; • Buttonhole shaped holes ; • Slashed thread screw (quarter turn, third of a turn tightening) ; • U shaped rabbet, dove-tailed, magnetic fixings, pivot ball clutch.. • Cam tightening ; • Range of clasps.
The use of tools can be reduced, even eliminated:
• Wing nut ; • T shaped wrench on the same screw.
4.4.7.2 Standardization
MMaattrriixx «« AA »»
MMaattrriixx «« BB »»
SSttaannddaarrddiizzaattiioonn ooff tthhee ffiixxiinnggss’’
hheeiigghhtt
UUssee tthhee ssaammee
ffiixxiinnggss
SSttaannddaarrddiizzaattiioonn OOff tthhee hheeiigghhtt ooff tthhee mmaattrriixx
AA AA

E-111
4.4.8 Optimize, Standardize
4.4.8.1 Classic Functions
Very often, tool changing is done as soon as the last piece of the series is completed:
The machine stops and the operations concatenate, the machine re-starts only once the tests are over.
Let it be also noted:
- The frequent absence of a standard method, of an operating mode, absence of use check-lists and absence of simultaneous work.
- In many companies, long changeovers may cause productivity loss.
The increase of lot sizes may be tempting to avoid applying these changes et dissolve the losses.
This reasoning, in time, has led to the notion of economic lot size.
Decomposition of a changeover
Dismantling
Assembly
Adjustments (machine stopped)
Tests

E-112
4.4.8.2 The Adjustments
The best means:
Work in groups
The best illustration of teamwork is the « formula 1 pit».
Possible answers:
▪ Each individual function is clearly defined and every equipment is pre-tuned; ▪ Operative modes are stabilized; ▪ Layouts are planned and clean; ▪ Tasks are synchronized ( 1 wheel, 1 person) ; ▪ Sufficient number of people; ▪ One person is responsible for the team; ▪ The pilot doesn’t leave before the signal (security) ; ▪ The material is well prepared; ▪ The material is adapted to the staff: formed, qualified, trained and motivated; ▪ The stops are scheduled; ▪ The team is complete; ▪ Competitiveness, be the best, be the first; ▪ Will to win together for the team.
Why isn’t it like that here?
Why are the tire changes so quick during Formula 1
competitions?

E-113
Reduction, even elimination, of tests and controls:
▪ The more rigor and formalism are introduced, the fewer flaws there are to control; ▪ There more this is done upstream, the less likely it is to weigh on the length of the changes
that has to be reduced; ▪ Resorting to mistake-proofing, the Poka-Yoke, to automatics and most of all respect of
procedures and operative modes must allow to reproduce the same “standard” situation each time ;
▪ To do well the first time helps reduce or eliminate the necessity of tests and controls; ▪ Use check-lists and confirm (sign) the key-stages to operators, give them sense of
responsibility is a good way of guaranteeing the respect of the procedure.
4.4.8.3 Determine the Technical Values of Clocking
Determine the targets to aim for in terms of potential gains quantified in:
▪ minutes ▪ money ▪ % of productivity ▪ etc...
for each SMED action put in place.
Introduce evaluation indicators on the existing situation and allow to select the actions that have to be undertaken and measure the obtained profits.
An example of ratio that can be used to measure influent gains on productivity:
The Machine productivity ratio (RPM) which takes into consideration the following parameters:
▪ Unitary Manufacturing Time (TU) ; ▪ Quantity that ha s to be manufactured(LOT) ; ▪ Preparation Temps (TP).
It must tend as much as possible towards 1.

E-114
4.4.9 Traps to Avoid
4.4.9.1 All out SMED
▪ Gains from the SMED are often spectacular. Creating quality time for a machine or a process improves its output, but may, in some cases, delay or even render capacity investments useless.
▪ Being more versatile is more and more necessary; the new economic deal imposes its law.
▪ The best way is to proceed gradually, define realistic objectives, even if there are some what humble, for a start.
▪ Following the four stages and registering the improvements for each one, and then resume the same approach with a more ambitious objective and reiterate until the efforts that have to be provided become too prohibitive compared to the expected gains.
The Kaizen spirit spreads on the SMED, just as the 5S are necessary and vital beforehand.
▪ SMED isn’t only applicable to industry, machines and automated warehouses.
▪ The concepts of rapid tool, series or lot changeovers are merged. The changeovers in manufacturing on an assembly line, where workstations have to be reorganized, replace the equipment and specific templates obey to the same musts and the method is perfectly applicable.
▪ SMED can be applied in a bakery, in plastic casting then why not in an office?
4.4.9.2 Analyzing Critical Resources
After such an enthusiastic conclusion, it’s somewhat stunning to serve a moderate paragraph, but it seems nevertheless important, before implementing the SMED approach and insuring its success, to warn about the probable “traps”.
In an industrial environment, eventual improvement points are numerous. Improvements can even be carried out indefinitely. However, time, technical, financial, human resources are always limited.
To pounce on SMED and wanting to apply it everywhere without reflection can make it “dangerous”.
You have to differentiate the processes, machines, workstations that deserve SMED.

E-115
The constraints’ theory (TOC) distinguishes between 2 types of resources: bottlenecks and non-bottlenecks.
Let’s remind that bottlenecks are limited resources and the the global capacity of the process, whereas non-bottlenecks with excess capacity. As bottlenecks are always glutted, non-bottlenecks are always back-burners.
SMED applied to non-bottlenecks is a double absurdity in the sense that these resources, being redundant, already have the possibility of making tool, series changeovers without affecting the output.
But also and most importantly because limited technical and financial means will be allocated to increase resources that are not in need instead of allotting them to bottle-necks that need to be quickly, and sometimes desperately, unclogged!
Before committing to the SMED approach, analyze the process froma a TOC point of view. Redefine, in need, the forward planning and the management of the resources according to the rules of the constraints theory, and lastly define the target-resources on which the SMED approach will be applied.
As for Kaizen, wanting to do too much makes fall into a trap. The SMED approach cannot aim for performance just for performance but has to contribute to generate more profit for the whole company.
4.5 Conditions for Success
▪ Commitment to the approach, ▪ Defining objectives, ▪ Human and material mobilization, ▪ The PDCA approach
4.6 Conclusion
Summary of the SMED method
A structured operations’ analysis method which aims at reducing changeover time.
Appeared more than thirty years ago, the principle of fast changeover was conceptualized by the Japanese professor Shigeo Shingo under the name of SMED (Single minute exchange of die).
E-116
Instigated by its inventor, the SMED method had numerous applications in the world (Japan, United States, France…). Today, it presents an obvious interest in a context which is completely different with the mass production of the past years, and where the reduction of changeover duration becomes a major issue for the companies which have to answer, in shorter periods, very diversified product orders and made in reduced lots.
S.ME.D. is a structured operations’ analysis method which aims at reducing changeover time. The method applies to the total time of stopped production, that is to say the interval between the manufacturing of the last unit of a lot and the manufacturing of the first good unit of the following lot.
A change of manufacturing seems generally very dependent on the type of machine or on operation that is carried out. Nevertheless, the analysis of the various procedures of equipment’s assembly or production start up shows that they proceed according to the same successive stages and that the changeover time divides up globally as follows:
- Preparation, tools, machine, environment and means: 20 to 30 % of total time; - Change of tools: 5 to 15 %; - Stake / tools’ adjusting: 15 to 20%; - Trial parts, settings, obtaining of the first good unit: 40 to 50 %.
Traditionally these operations are carried out after the machines stop. Now, according to the basic concept of the S.M.E.D., certain operations, said “internal”, require the stop of the machine, but the other one, called “external”, can be carried out at masked time, out of machine, without loss of production.
The reduction of the series’ changeover passes by four conceptual phases:
- Phase 1 : analysis of a changeover in the initial state. The purpose is to identify objectively all the operations carried out during this change. The ideal means is making video shots that give the exact chronology of the operations.
- Phase 2 : separation between “internal” and “external” operations. The objective is to carry through, at masked time, the external operations. To do this, it is necessary to act on the organization of the changeover, in particular for the phases of preparation and the disposal of means. At this level the necessary investments are small. It is not rare at the conclusion of these two phases to notice a gain of 25 to 50 % on the time of stopped production.

E-117
- Phase 3 : converting internal operations into external operations. It is during this phase that the usefulness of certain operations is examined and that the supply of indispensable material means is determined. It results in a reduction of the number of internal operations and global time gain.
- Phase 4 : reduction of operation execution time, internal and external, by their rationalization. This step is dedicated to search for simultaneous tasks, their optimization, as well as the improvement of the settings with the aim of decreasing the number of trial units.
Appendix : The Tools
▪ Brainstorming, ▪ Ishikawa, ▪ Decision-making Matrix, ▪ Pareto, Poka-Yoké.

E-118
----Introduction to the SMED method----
• Avoid the time lost in the search of… (tools…)
• Avoid the time lost in the transportation (tools, moulds…)
• Avoid the wasting of time of in the lack of organization
• Avoid the wasting of time of in the not functionality and the not availability of the equipment, the instruments, the necessities.
• Check the repair of the mould after every end of the production line.
It is necessary to prepare a check sheet for the various tools, moulds… which includes the instructions, directions for use, as well as the operating mode to be followed in the execution of the tasks related to the technical aspects
Before placing the mould in machine, check if everything is properly in order and that there is no abnormality in any corner of the mould to use
To make sure that the mould will be ready without abnormality before it is used during the next operations of production.
It’s difficult to get the nut in
Lack of precision
I cant find the nut t
Set of tools and parts for the production of a product
Conservation of the various parts and the set of tools in the form of a kit
Operating mode of moulds’ exchange
Tools
Oil and grease for moulds’ maintenance
Special trolley moulds and set of tools Moulds
I It is necessary to verify the functionality of all the instruments, the tools and, of course, the moulds which always have to be put in advance, applying the rules of preventive maintenance to avoid any sorts of time wasting, production …
Zone finished product
Storage zone of raw materials
Mould currently changed
Cupboard for moulds
Moulds
Reference sheet
Moulds in preparation Moulds currently
used
Thankfully I verified the mould "externally"
before putting it on the machine
Just after use of the mould, verify properly: 1. products+moulds 2. the exactitude of the
dimensions of the various angles, the cavities of the mould
3. the dirty or damaged places, and proceed with repairs and the polishing of the mould.

E-119
Chapter 5. The group dynamics (QC)
5.1 Introduction
Historical background of the group dynamics
Ishikawa is the founder of the Group dynamics, which appeared in Japan in 1960, in 1970 in the U.S. and in 1980 in France. A group dynamic is a meeting of people who study and try to solve a problem defined beforehand (machines breaks down frequently, notices). The employees that belong to the group dynamic are volunteers and not remunerated. The group dynamics remain under control of the management.
The results in economical terms were positive:
- Decrease of work’s hardness - Decrease of machine’s breakdowns - Decrease of waste rate - Better motivation - Better integration of the employees in the company: “we no longer leave our intelligence in
the locker”.
5.2 Definition
A circle of quality is a small group that practices quality control activities voluntarily inside a unit those members belongs to.
All members of the concerned group continually participate, within the framework of a total management of the quality, to control and improve the quality through the techniques of the quality control.
This activity also provides the blossoming of the personnel and the mutual enrichment of the members.
The members are selected from the lowest level of the hierarchy (worker, utility worker, desk person, secretary, nurse…)

E-120
5.3 Objectives
The group dynamics allow to:
- Improve quality - Reduce waste - Modify attitudes and behaviours - Cut cost - Improve security - Collect data - Increase productivity - Increase personnel’s satisfaction - Increase team cohesion - Improve competences and know-how - Improve communication
5.4 Approach of the Implementation
5.4.1 Characteristics of a Group Dynamic:
Size : there are no strict rules about the size. However, it is preferable that the number of members is superior to 3 and inferior to 12. Generally, a group of 6 to 8 members is a favourable environment for a collective participation and an efficient discussion. If the number of members is high, mini groups are created inside the group.
Organizer : each group should have its own organizer. It is preferable that, during the first step, the organizer becomes the immediate hierarchic leader of the group. Once the group is experienced, each member can be appointed, by rotation, as organizer.
Voluntary service : all members of the group are volunteers. The participation to the activities of a dynamic circle should not be imposed. To become a member, it is required to be aware, convinced and conscious of the principles and the philosophy of the group dynamic. Of course, during the first step, it is needed to find the means to arouse the voluntary service and start the group dynamic.
Homogeneity : in order to speak the same language, to understand each other easily and to have access to the same data so as to solve effectively the problems

E-121
treated, all members ought to belong to the same unit of work (workshop, section, service, office, agency, community clinic…).
Continuity : when we create group dynamics, we should not have to look for short-term results and be pressed by time to resolve problems. On the other hand, the creation of a state of mind: ' spirit quality ' is a fundamental objective for the company. The continuity of the functioning of group dynamics contributes enormously to the implementation by the company of a system allowing to insure the continuity and the durability of group dynamics is more than essential.
Autonomy : a fundamental part of its philosophy is that a group dynamic is an autonomous group. It is supposed to go through all the stages of resolution of the problems, from the identification until the resolution. Thus, it has a freedom of action. However, during the starting up of the circle activities, it is preferable that the supervision is behind this group dynamic to assist and direct the group in order to avoid any skid and to minimize any risk of blocking and, consequently, of dissolution. It must be clarified that the supervision should recommend what the group dynamic should do. But, little by little, when the group becomes mature and experienced, it will have all the latitude to act and the supervision intervenes punctually at the request of the circle.
Regularity : group dynamics meet regularly once a week or once every two weeks. It is preferable that the duration of a meeting does not exceed one hour. As for the schedule of the meetings, there is no strict rule to determine it. These meetings can be done during working hours, after working hours or can start on working hours to end after working hours.
Teamwork : to obtain the support of the members and their participation in the group dynamic activities, it is preferable that any taken decision is the fruit of all the members’ cooperation. Teamwork is one of the pillars of group dynamics.
Domain of activity : in a company, the met problems can be superficially divided into three categories: Social problems; Political problems Technical problems Only the 3rd category of problems concerns the group dynamic. The

E-122
social and political problems are the matter of the syndicate, the joint commission, and the other parties.
Use of tools : unlike common meetings, the meetings of group dynamics are characterized by the use of tools and a rigorous working methodology.
The group dynamic is an environment of blooming and mutual enrichment : the members of group dynamic find a pleasant environment to bloom. The participation in the activities of the group dynamic is a way to train and educate the members.
5.4.2 Organization and Functioning of Group Dynamics:
1. Regular meetings
> The group of volunteers including a member of the management meet regularly an hour or two, during the working hours to identify the problems and the risks connected to their work.
> These meetings must be statutory and the schedule is decided in advance and they must not be delayed because of overtime work or any other reason. These meetings really result of the long term strategy of the company, because, they allow to resolve and even to anticipate problems which could handicap the structure.
2. Defined and concrete problems
The latter designated problems can have diverse origins: products or services quality, safety, morale of the staff, environment... However, their scope should not exceed the limits of the group’s competence.
These questions are raised by the members of the group dynamic and result from their own observations or from their non-member colleagues’ observations with whom they are in contact with.
3. A rigorous process of problems’ resolution.
Group dynamics do not result in the change of the organization chart or in the creation of a new position for the people who are going to take charge of group dynamics.

E-123
5.4.3 The Tools of Group Dynamics
There are several tools of quality circles. The tradition is to name only seven. These are the ones which were used in the Japanese quality group dynamics. They are simple and concrete enough to be handled by the most basic operators:
- Brainstorming; - Diagram of Pareto; - Causes and effects Diagram or Ishikawa (see appendix); - Histogram; - Control map; - statement sheet - 5W1H16.
There are some others.
If they are chosen correctly, these tools are very efficient. There are 3 categories:
· - The tools of gathering (example: statement sheets, histograms, gathering of data, map of control);
· - The tools of creativity (ex: Brainstorming, mental card); · - The tools of analysis (ex: Pareto, Ishikawa, 5W1H).
5.4.4 Process of Resolution of Problems by a Group Dynamic:
The group dynamic can follow the stages and use indicated tools in the following chart to resolve problems.
Steps Tools Observations Problem’s research Brainstorming Choice of the treated problem Simple Vote
PARETO’s diagram
Gathering data Data Gathering Sheet
PROBLEM
Fixing objectives Causes’ Research Ishikawa’s diagram Choice of principal causes Simple Vote
CAUSE
Gathering data Data Gathering Sheet Solutions’ research Brainstorming SOLUTION Choice of the solution Simple vote, level-headed
ACTION Resolution and sharing out the tasks to carry out
Chart
Evaluation of achievement progress FOLLOW-UP Verification of the solutions’ efficiency
Data Gathering Sheet Pareto’s data
16 Who? What? Where? When? Why? How?

E-124
5.5 Condition of Success
Seven golden rules of group dynamics:
▪ The members of the group dynamic must be motivated to participate ▪ Bet on the voluntary service ▪ Develop an open mindedness and creativity ▪ Respect the dynamics of a workgroup ▪ Integrate group dynamics into day-to-day management of the company ▪ Bank on the training of the members ▪ Facilitate the exchanges and break the isolation to take advantage of others’ experience
5.6 Conclusion
The group dynamic is a good means to engage a dynamics within the company, and allows a considerable improvement on all the fronts.

E-125
Appendix : Diagram Cause and Effect
The disparity of a product’s characteristics is revealed by histograms. It can have numerous causes related to the operators, to the raw materials, to the machines, to the methods or to the environment. When we notice a special variation in the results of a production, it is necessary to try to identify the cause. A very simple graphic method can be useful, which is particularly adapted to the workgroup: it is the diagram of cause and effect (figure).
Here, we reproduce the procedure in four stages, recommended by Ishikawa.
Figure Example of Diagram Cause and Effect Research on the Solidity of an Overnight Bag’s Clip.
Step 1. The workgroup defines the products, the processes or the events precisely to research and the characteristics to obtain.
Step 2. The workgroup make a list of all the possible causes of the results’ variation observed on the chosen characteristic.
Step 3. Groups together the most general and the most immediate causes, then the particular and indirect causes.
Step 4. The workgroup draws the diagram on a big paper. The next days, the workgroup will complete it gradually according to the results of the research.
The diagram of cause and effect is an excellent visual support for a group work. The participants bring information and data relative to a process. If the available data do not allow finding immediately the main cause of the variations of the considered characteristic, they will bring new information and new data to the following meeting.
But it is not the diagram of cause and effect that gives solutions. It only allows formulating clearly the problem, what is important as a starting point. Then every member of the workgroup or the group dynamic has to bring data, results of observation. The hypotheses can come true only by a statistical research from which the solutions will be elaborated.
Holes’ diameter
Holes’ regularity
Solidity ofthe clip
Rivet’s pressure
Body’s diameter
Flatness of the base
Fabric’s solidity
Resistance to traction Worker’s ability Tool’s diameter
Resistance to pressure Tool’s sharpening
Machine’s setting Machine’s setting
Hardness of the metal
Machine’s cleaning