1 Macroeconomic and Industry Analysis CHAPTER 11.
30
1 Macroeconomic and Industry Analysis CHAPTER 11
-
date post
22-Dec-2015 -
Category
Documents
-
view
229 -
download
2
Transcript of 1 Macroeconomic and Industry Analysis CHAPTER 11.

1
Macroeconomic and Industry Analysis
CHAPTER 11
Fundamental Analysis Approach to Fundamental Analysis
Domestic and global economic analysis Industry analysis Company analysis
Why use the top-down approach
Framework of Analysis

Global Economic Considerations
Performance in countries and regions is highly variable
Political risk Exchange rate risk

Performance in countries CountriesGrowth in GDP(%) Countries Growth in GDPP(%)
Australia 2.6 Austria 0.7Belgium 0.7 Britain 2.0Canada 1.0 Denmark -0.8France -0.2 Germany -0.2Italy 0.5 Japan 1.8Netherlands -1.1 Spain 2.4Sweden 2.0 U.S. 3.5
Considerable variation in performance across countries expanding economies: more chance to succeed contracting economies: less chance to succeed Based on these performance, form expectation for your investment
economies growing economies slowing down

Political riskConsider 2 investors: A, an American wishing to invest in Indonesian stocks and an Indonesian wishing to invest in U.S. stocksWhich one would face a more difficult task when doing macroeconomic analysis?
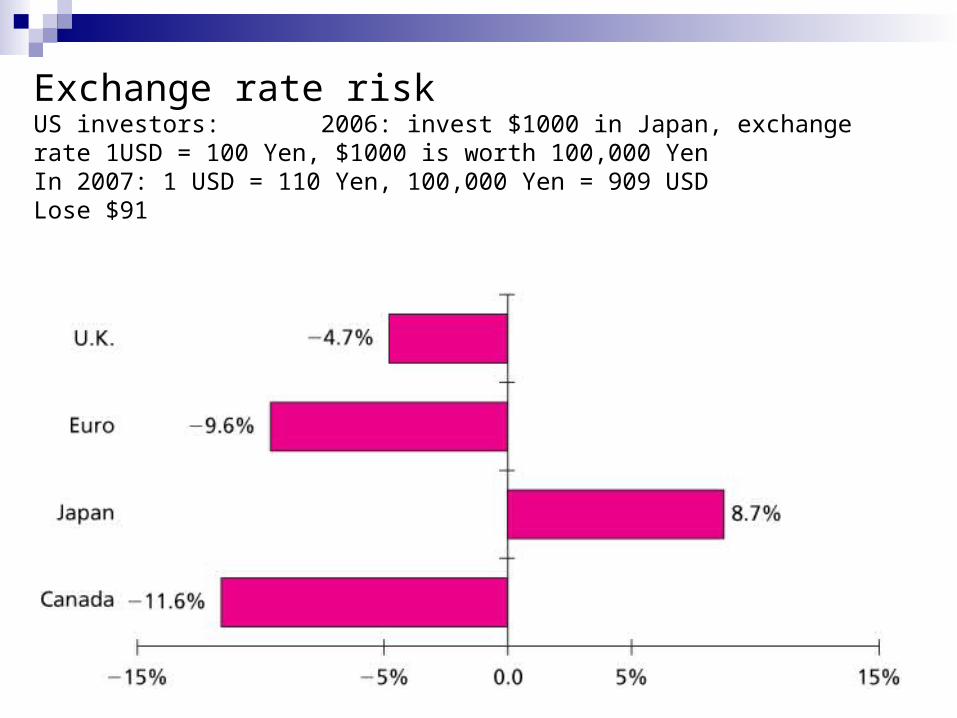
Exchange rate riskUS investors: 2006: invest $1000 in Japan, exchange rate 1USD = 100 Yen, $1000 is worth 100,000 YenIn 2007: 1 USD = 110 Yen, 100,000 Yen = 909 USDLose $91
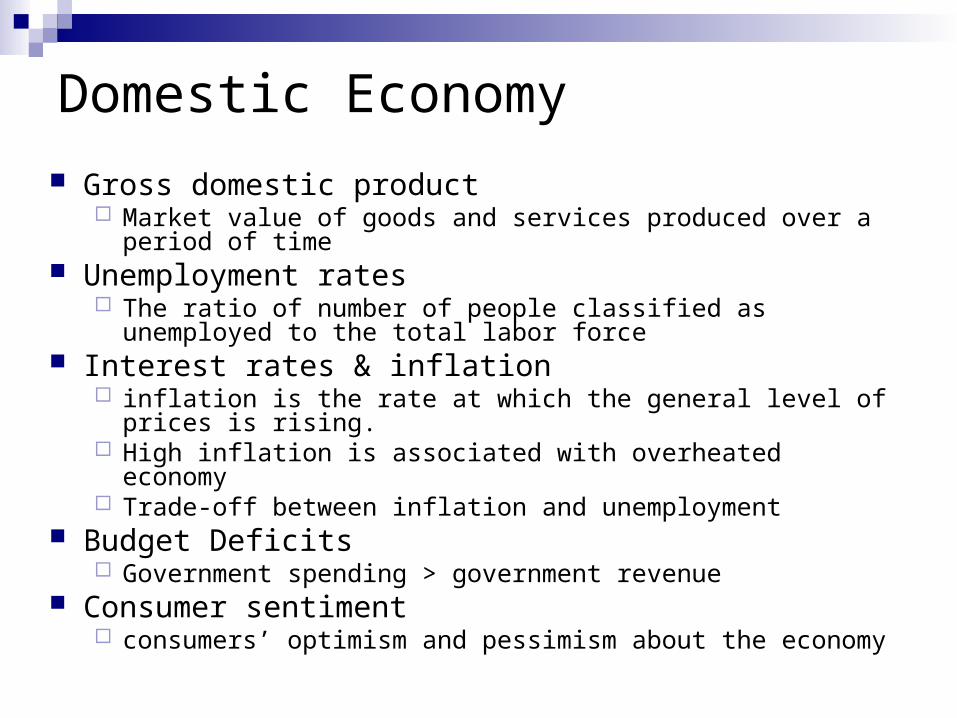
Domestic Economy
Gross domestic product Market value of goods and services produced over a period of
time Unemployment rates
The ratio of number of people classified as unemployed to the total labor force
Interest rates & inflation inflation is the rate at which the general level of prices is rising. High inflation is associated with overheated economy Trade-off between inflation and unemployment
Budget Deficits Government spending > government revenue
Consumer sentiment consumers’ optimism and pessimism about the economy
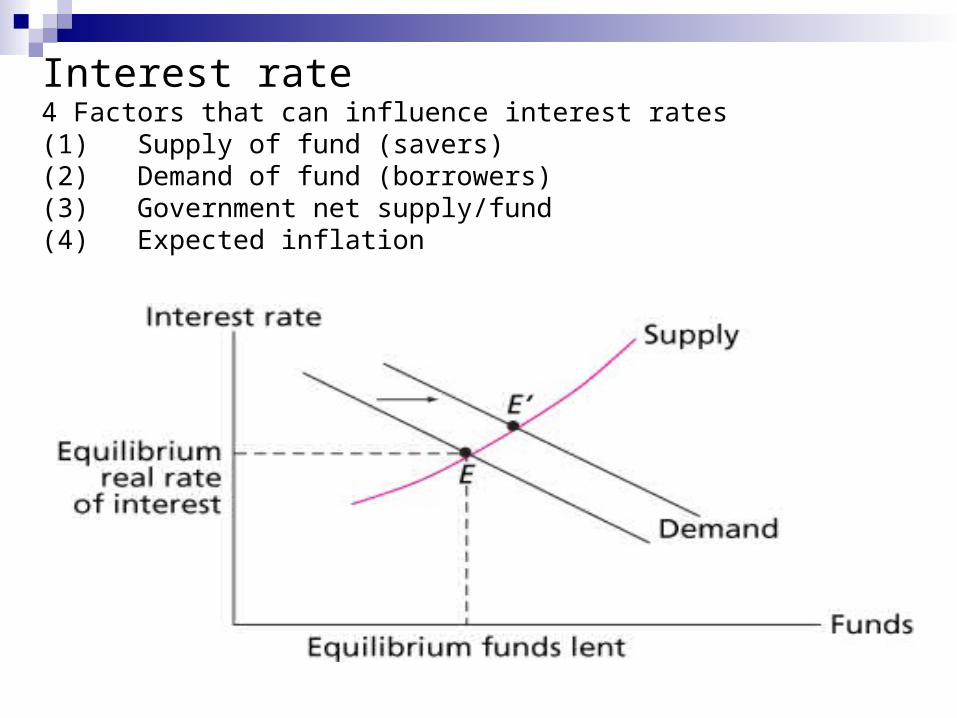
Interest rate4 Factors that can influence interest rates(1) Supply of fund (savers)(2) Demand of fund (borrowers)(3) Government net supply/fund(4) Expected inflation

Demand and Supply Shocks
Demand shock - an event that affects demand for goods and services in the economy Tax rate cut Increases in government spending
Supply shock - an event that influences production capacity or production costs Commodity price changes Educational level of economic participants
Federal Government Policy
Fiscal Policy - government spending and taxing actions Increase spending: increase demand tax increase: reduce demand Net impact:
budget deficit budget surplus
Federal Government Policy (cont.)
Monetary Policy - manipulation of the money supply to influence economic activity
Tools of monetary policyOpen market operationsDiscount rateReserve requirements
If government wants to tighten money supply, what should it do?
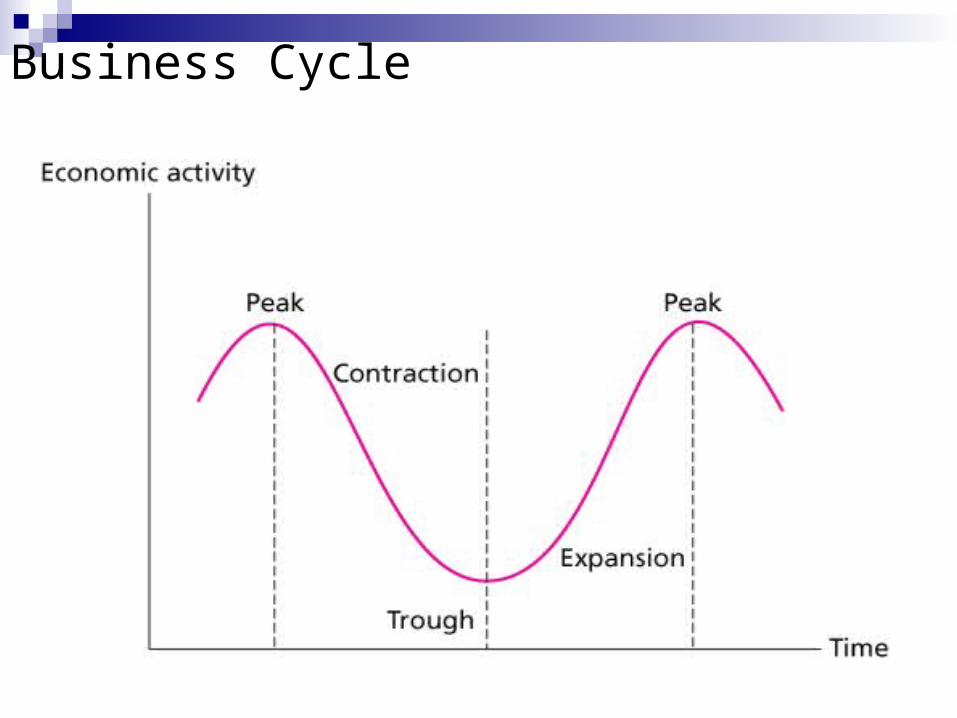
Business Cycle

Business Cycles Business Cycle
PeakTrough
Industry relationship to business cyclesCyclical
above average sensitivity to states of economy
Defensive below sensitivity to states of economy
Business Cycles (examples)
At trough, right before recovery, one would expect cyclical industries to outperform others (economy increases (decreases) by 1%, the industry increases
(decreases) by > 1%) Example: durable goods: auto, washing machine, financial industries Cyclical firms: betas > 1 or < 1, high or low betas?
Economy enters recession: cyclical or defensive example: food, public utilities, pharmaceutical Low or high betas? performance is stable, unaffected by market conditions
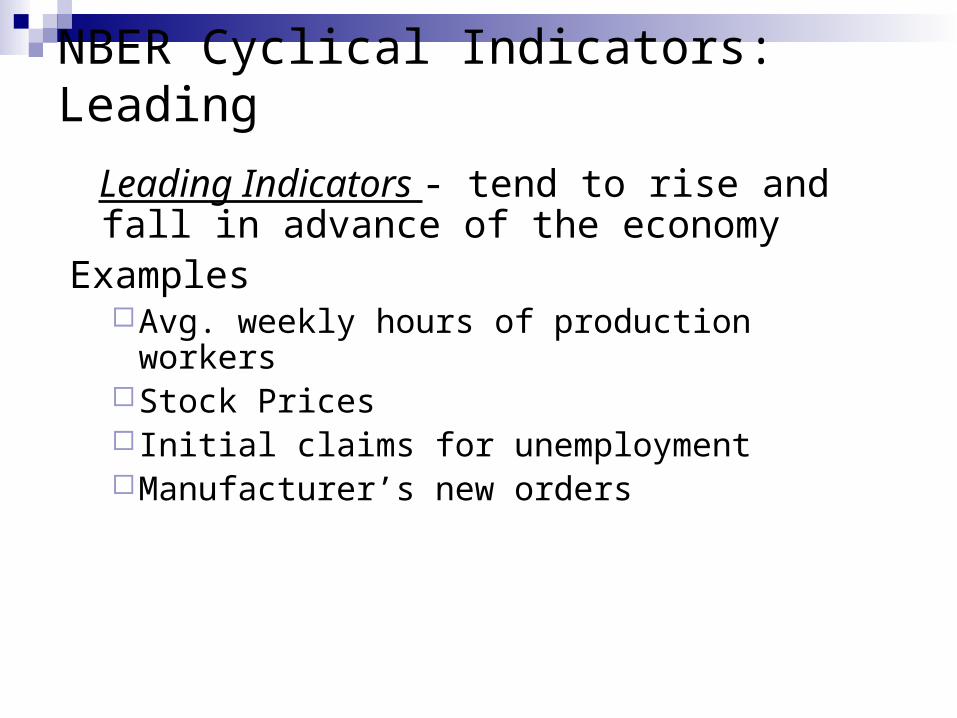
Leading Indicators - tend to rise and fall in advance of the economy
ExamplesAvg. weekly hours of production workersStock Prices Initial claims for unemploymentManufacturer’s new orders
NBER Cyclical Indicators: Leading
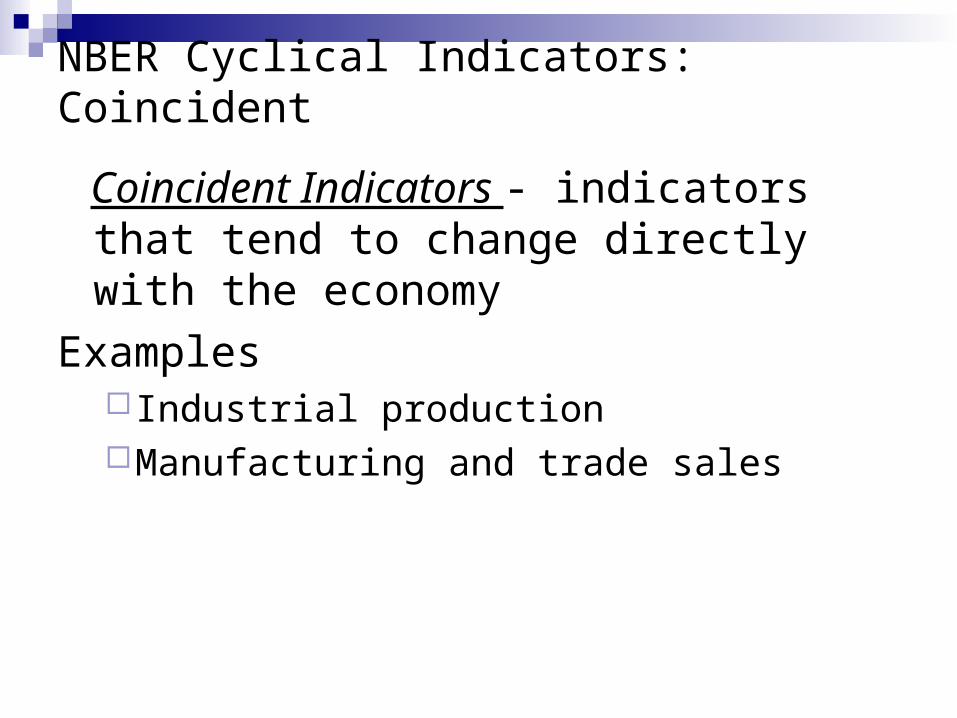
Coincident Indicators - indicators that tend to change directly with the economy
Examples Industrial productionManufacturing and trade sales
NBER Cyclical Indicators: Coincident
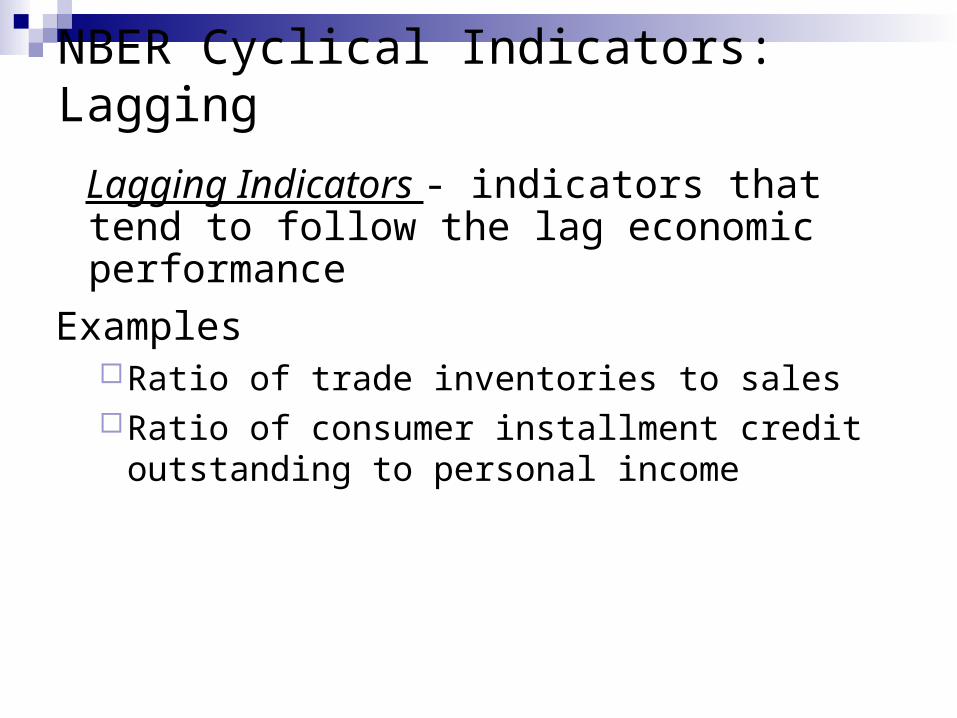
Lagging Indicators - indicators that tend to follow the lag economic performance
ExamplesRatio of trade inventories to salesRatio of consumer installment credit
outstanding to personal income
NBER Cyclical Indicators: Lagging

Industry AnalysisEstimates of Earnings Growth Rates in Several Industries, 2004
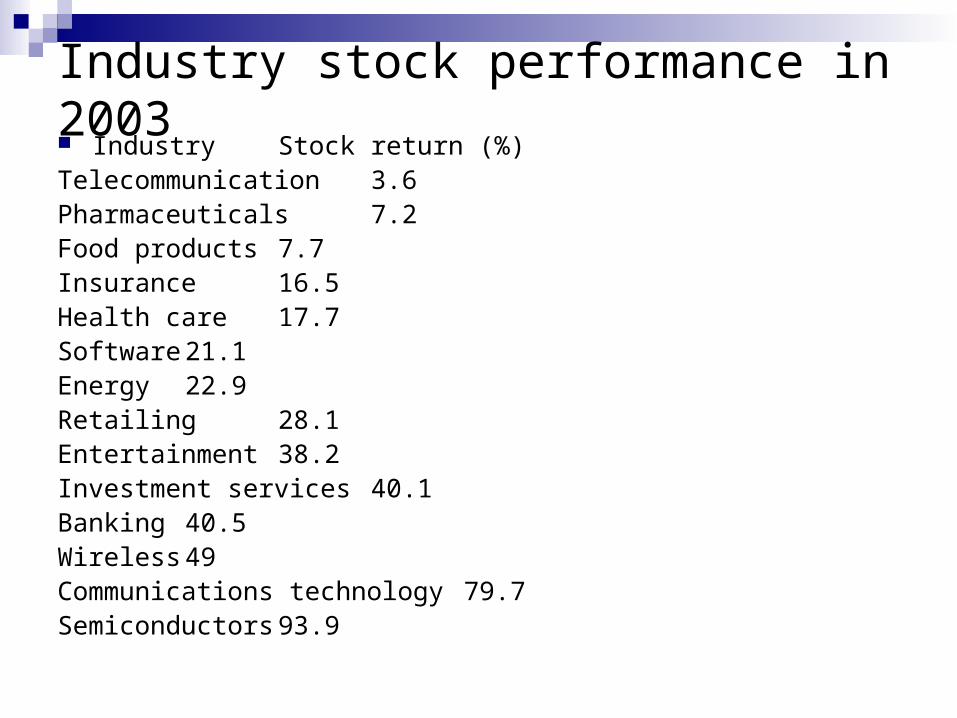
Industry stock performance in 2003 Industry Stock return (%)Telecommunication 3.6Pharmaceuticals 7.2Food products 7.7Insurance 16.5Health care 17.7Software 21.1Energy 22.9Retailing 28.1Entertainment 38.2Investment services 40.1Banking 40.5Wireless 49Communications technology 79.7Semiconductors 93.9

Industry Analysis
Sensitivity to business cycles Sector Rotation Industry life cycles

Sensitivity to Business Cycle
Factors affecting sensitivity of earnings to business cyclesSensitivity of sales of the firm’s product to the
business cyclesOperating leverageFinancial leverage
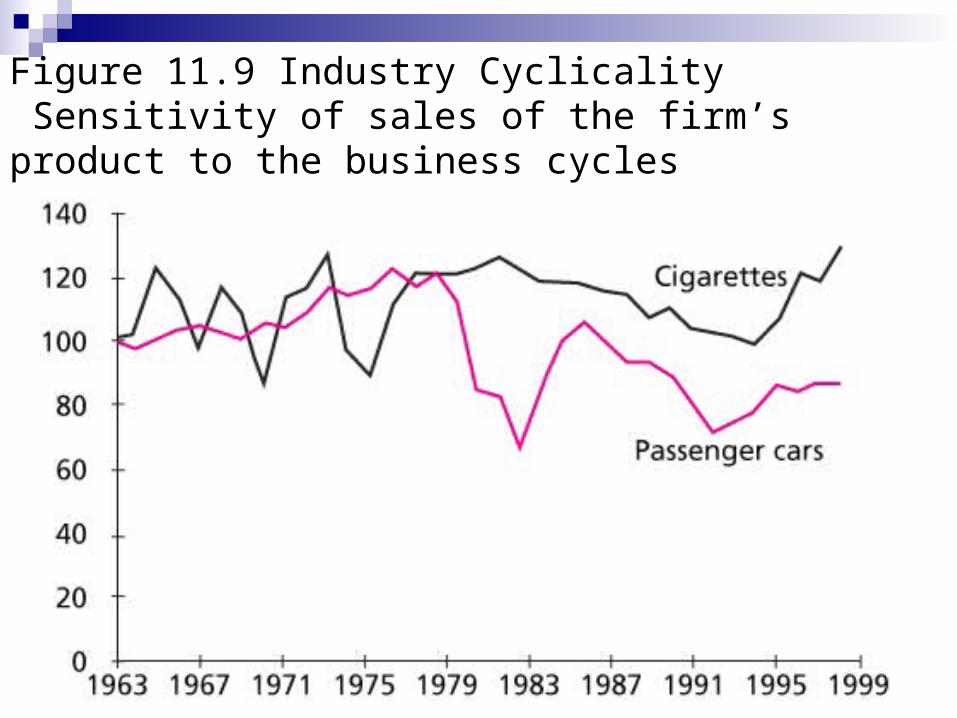
Figure 11.9 Industry Cyclicality Sensitivity of sales of the firm’s product to the business cycles
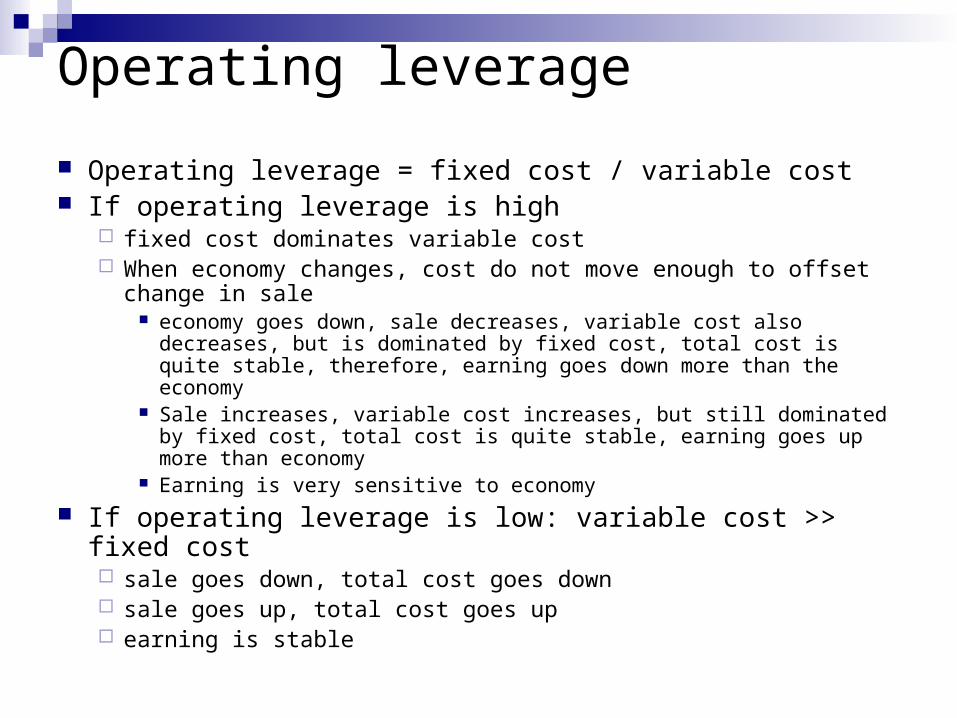
Operating leverage
Operating leverage = fixed cost / variable cost If operating leverage is high
fixed cost dominates variable cost When economy changes, cost do not move enough to offset change in
sale economy goes down, sale decreases, variable cost also decreases, but is
dominated by fixed cost, total cost is quite stable, therefore, earning goes down more than the economy
Sale increases, variable cost increases, but still dominated by fixed cost, total cost is quite stable, earning goes up more than economy
Earning is very sensitive to economy
If operating leverage is low: variable cost >> fixed cost sale goes down, total cost goes down sale goes up, total cost goes up earning is stable

Financial leverage
Use of borrowing Similar to fixed cost High financial leverage, earning is more sensitive to economy Low financial leverage, earning is more stable

Sector Rotation

Sector Rotation
Selecting Industries in line with the stage of the business cycle Near peak – natural resource firms: Minerals, Gas, etc Contraction – defensive firms: food, pharmaceutical, etc. Trough – equipment, transportation and construction firms Expanding – cyclical industries: consumer durables, luxury
items
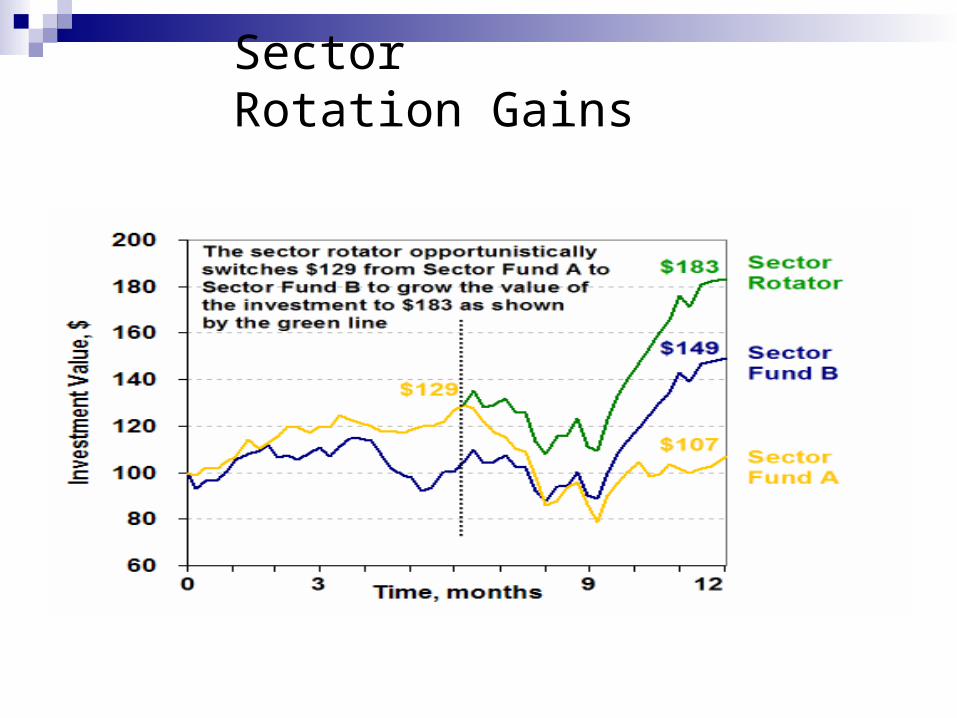
Sector Rotation Gains
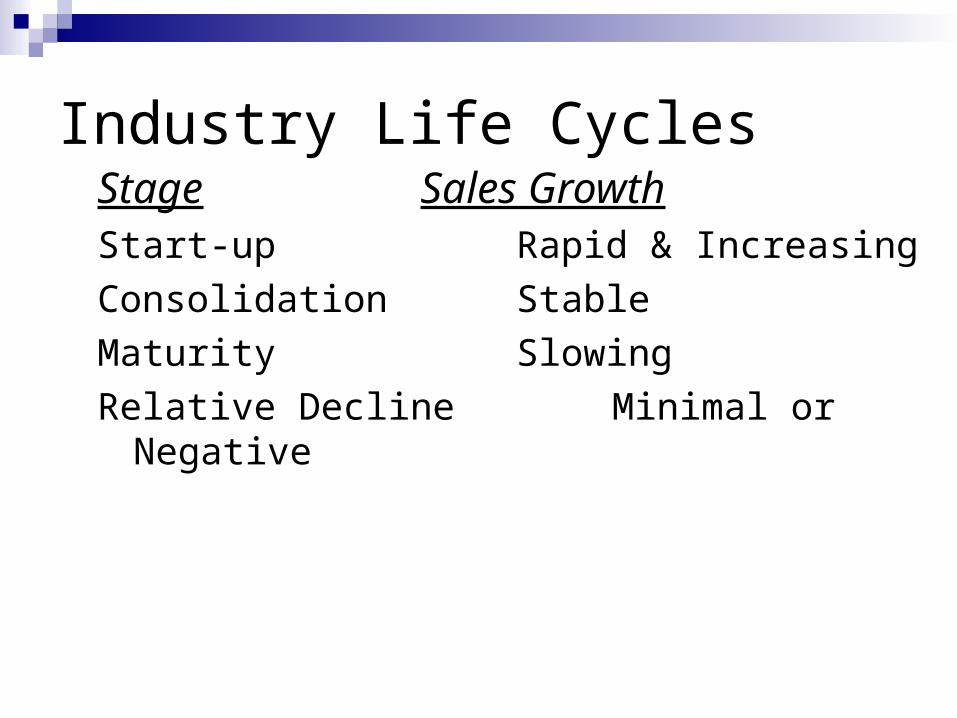
Industry Life CyclesStage Sales GrowthStart-up Rapid & Increasing
Consolidation Stable
Maturity Slowing
Relative Decline Minimal or Negative

Figure 11.11 The Industry Life Cycle
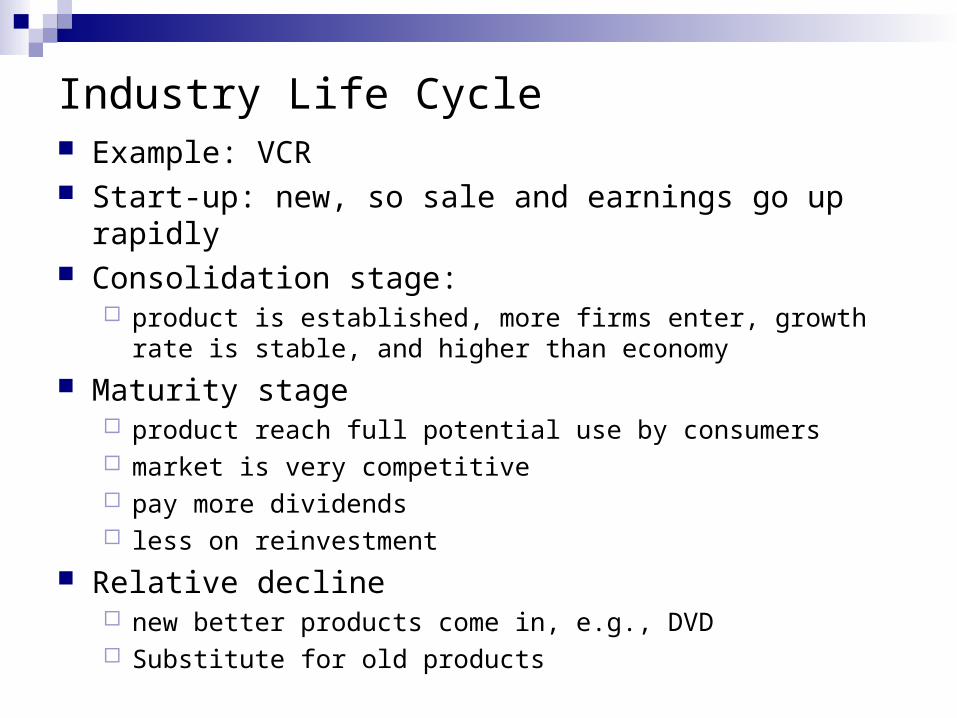
Industry Life Cycle Example: VCR Start-up: new, so sale and earnings go up rapidly Consolidation stage:
product is established, more firms enter, growth rate is stable, and higher than economy
Maturity stage product reach full potential use by consumers market is very competitive pay more dividends less on reinvestment
Relative decline new better products come in, e.g., DVD Substitute for old products