ANALYSIS OF THE IMPACT OF MACROECONOMIC · PDF fileAnalysis of The Impact of Macroeconomic...
34
ANALYSIS OF THE IMPACT OF MACROECONOMIC POLICIES ON TEXTILE INDUSTRY AND ITS PRODUCTS IN INDONESIA Iwan Hermawan, SP. MSi 1 Textile and textile»s product play an important role in the Indonesian economy. During the last five years, however, the share of these industries and commodities to gross domestic product tend to decrease. The objectives of this study are to analyze factors affecting Indonesian textile and textile»s product, and the prospect of Indonesian textile and textile»s product in the future. Results of the study show that domestic textile production was affected by world cotton price and wage rate, while the domestic garment production was affected by wage rate in the garment sector. Indonesia»s textile export to world market was influenced by domestic textile price, and Indonesia»s export garment was influenced by exchange rate (Rp/US$). Indonesian textile demand was affected by wage rate while domestic garment demand was affected by income per capita of Indonesia. In general, the prospect of Indonesian textile and textile»s product seems not too good. In fact, Indonesian textile and textile»s product had depended on high import cotton, investment, and exchange rate. JEL Classification Number: C53, E60, F43, and F4. Keyword: export, open economy, forecasting, simulation, textile and textile»s product. 1 Researcher Candidate of Economic and Public Policies, P3DE, Secretariat General of DPR-RI, email: [email protected] Abstract
-
Upload
phungtuong -
Category
Documents
-
view
220 -
download
2
Transcript of ANALYSIS OF THE IMPACT OF MACROECONOMIC · PDF fileAnalysis of The Impact of Macroeconomic...

357Analysis of The Impact of Macroeconomic Policies On Textile Industry And Its Products In Indonesia
ANALYSIS OF THE IMPACT OF MACROECONOMIC POLICIES ONTEXTILE INDUSTRY AND ITS PRODUCTS
IN INDONESIA
Iwan Hermawan, SP. MSi 1
Textile and textile»s product play an important role in the Indonesian economy. During the last five
years, however, the share of these industries and commodities to gross domestic product tend to decrease.
The objectives of this study are to analyze factors affecting Indonesian textile and textile»s product, and
the prospect of Indonesian textile and textile»s product in the future. Results of the study show that
domestic textile production was affected by world cotton price and wage rate, while the domestic garment
production was affected by wage rate in the garment sector. Indonesia»s textile export to world market
was influenced by domestic textile price, and Indonesia»s export garment was influenced by exchange
rate (Rp/US$). Indonesian textile demand was affected by wage rate while domestic garment demand
was affected by income per capita of Indonesia. In general, the prospect of Indonesian textile and textile»s
product seems not too good. In fact, Indonesian textile and textile»s product had depended on high
import cotton, investment, and exchange rate.
JEL Classification Number: C53, E60, F43, and F4.
Keyword: export, open economy, forecasting, simulation, textile and textile»s product.
1 Researcher Candidate of Economic and Public Policies, P3DE, Secretariat General of DPR-RI, email: [email protected]
Abstract

358 Bulletin of Monetary, Economics and Banking, April 2011
I. INTRODUCTION
The industry of textiles and products of textile (TPT) offers an important opportunity for
a country to start the industrialization of its economy. This industry plays an important role in
increasing export orientation in Asian countries, as in Hong Kong, Singapore, Taiwan, South
Korea, Malaysia, China, Indonesia, Thailand, and Vietnam2. In addition, the number of population
of the Association of Southeast Asian Nations (ASEAN) country has reached approximately 597
million people3nand the implementation of the ASEAN Single Window (ASW) with 0 percent
import duty (with the exception of Laos, Cambodia, and Myanmar which the implementation
starts in 2012) provide a grand opportunity for the textile market (Sunarno, 2008) 4.
Textiles and clothing sector is a key sector in Pakistan, Vietnam, Thailand, Sri Lanka, and
Indonesia. In 2010 textile export growth in Vietnam reached US$ 11.2 billion5. In Indonesia, the
performance of textile products also contributes to economic growth in Indonesia. Textile industry
has a 2.18 percent contribution to Gross Domestic Product (GDP) and 8.01 percent to
manufacturing industry in 2010 (CBS, 2008). Even the non-oil export commodities which provide
the largest contribution for more than 20 years are the textile products. This increase is not
independent from the government policy in the early development of this industry.
Textile industry6 is also the largest contributor to the foreign exchange earnings of
Indonesia. In 2009, the textile industry contributed 12.72 percent in foreign exchange earnings
on exports of industrial products, excluding oil and gas, and 9.58 percent to total non-oil
exports, although 85 percent of cotton, as the raw materials, is imported. That amount increased
sharply from only US$ 559 million in 1985 (CBS, 2010). Besides having a large contribution in
the GDP and foreign exchange, the industry also employs many workers, both who work
directly or indirectly.
The importance of textiles and clothing can be seen from its role as one of the basic
human needs, other than food and shelter. Therefore, the consumption of clothing will tend
to increase aligned with population growth rate (Figure 1). The potential market for Indonesian
textile commodities is relatively large because the needs of the urban fabric of society are not
only the dress, but also the needs of non-apparel. In 2005 the Indonesian textile consumption
2 UNCTADUNCTADUNCTADUNCTADUNCTAD. TNCs and the Removal of Textiles and Clothing Quotas. Geneva: United Nations Conference on Trade and Development,2005, page 3.
3 PRBPRBPRBPRBPRB. World Population Data Sheet 2009. Washington DC: Population Reference Bureau and USAID, 2009, page. 8.4 Susanna SunarnoSusanna SunarnoSusanna SunarnoSusanna SunarnoSusanna Sunarno. ASEAN, Basis Produksi TPT Dunia. IndonesianTextile.com. Serial Online. 2008. http://indonesia textile.com/
index.php?option=com_content&task=view&id=73&Itemid=50. Accessd on March 17, 2010.5 VBNVBNVBNVBNVBN. Vietnam Textile and Garment Export Cross $ 11.2 Biliion in 2010. Vitenam Business News. SerialOnline, 2011. http://
vietnambusiness.asia/vietnam-textile-and-garment-exports-cross-11-2b-in-2010/. Accessed on January 10, 20116 Exports of industrial products of apparel and other textiles

359Analysis of The Impact of Macroeconomic Policies On Textile Industry And Its Products In Indonesia
decreased significantly compared to 2004. This is because on January 1, 2005, the quota
system was terminated and adapted to the provisions of the General Agreement on Tariffs
and Trade (GATT). This agreement was commenced from the Uruguay Round at April 15,
1994 in Marrakesh that issued the Agreement on Textile and Clothing (ATC) to set the import
quota system.
On the other hand the changes in quota system would have positive impact for the
textile industry development through fairer trade and mark a new era of world textile trade.
The discriminative textile quota system was abolished and the textile products market share is
getting larger through international competition and opportunities for the development of
textile industry will be even greater. Indonesia is one among the biggest textile producers in the
world. In 2000 the Indonesian textile exports reached US$ 8.2 billion (Rp 74.9 trillion) and was
ranked 10th among the world textile producers. In 2003, Indonesian textile exports only scored
US$ 7.03 billion, which drops the ranking to 17th place. But in 2004, this sector could increase
foreign exchange earnings up to US$ 7.6 billion. According Thuborn (2010)8 in the year 2007
the total value of Indonesian textile exports amounted to US$ 9.73 billion, which was ranked
12nd for the textile exports and 8th for the garment exports.
The above figures indicate that the Indonesian textile industry has the potential and
good growth opportunities. This is supported by the ability of the textile industry in contributing
7 SusannaSusannaSusannaSusannaSusanna SunarnoSunarnoSunarnoSunarnoSunarno. Amankan Pasar Dalam Negeri. www.indonesiatextile.com . Serial Online, 2008. http://indonesiatextile. com/index.php?option=com_content&task=view&id=76&Itemid=50, Accessed on March 17, 2010.
8 John ThoburnJohn ThoburnJohn ThoburnJohn ThoburnJohn Thoburn. The Impact of World Recession on the Textile and Garment Industries of Asia. Working Paper No. 17. Vienna: UnitedNations Industrial Development Organization, 2010, page. 31.
Figure 1. Development of Textile ConsumptionPer Capita and Population in Indonesia,
Year 2002-2011
Kg/Capita
3.4
3.6
3.8
4.0
4.2
4.4
4.6Consumption of TPT
Number of Population
2002 2003 2004 2005 2006 2007 2008 2009 2010
Millions of People
195.0
200.0
205.0
210.0
215.0
220.0
225.0
230.0
235.0
240.0
Source: Sunarno, 20087 and IMF, 2011.Description: Demand for textile per capita in 2009 and 2010 are merely estimation.

360 Bulletin of Monetary, Economics and Banking, April 2011
to GDP, foreign exchange earnings, and at the same time to employment. Besides the textile
industry has a big opportunity, where the demand for textile products will increase along with
population growth. Nevertheless, the potential and opportunities for the development of the
textile industry is not without obstacles. Constraints faced by the textile industry might disrupt
or reduce its contribution to the Indonesian economic development.
Globalization, which is marked by the end of the quota system in 2005, has encouraged
more open world trade in textiles and clothing and changed the market map from the side of
importer management supply. These changes in world textile trade raise the opportunity and at
the same time the threat to the Indonesian textile industry. Opportunity that is brought is that
the market share of countries that had been protected by the quota system will be opened.
While the threat will be the intense competition among countries in the world textile producers,
such as China, India, United States and the European Union. The issues of non-tariff barriers,
such as transshipment and dumping influence the flow of textiles and clothing trade penetration
from developing countries to developed countries.
While competition in the world market is increasing, the conditions in the domestic textile
industry are relatively poor. One of the circumstances that aggravate the prospects of textile
industry development in Indonesia is the non-conducive investment climate, while this industry
requires large investments to revitalize their deteriorating machines and technology. This non-
conducive investment situation is caused by, among others, the lack of legal certainty, wide
spreading corruption, cumbersome bureaucratic on labor issues, and taxation.
In 1997, the monetary crisis that hit East Asian countries, including Indonesia, caused the
rupiah to depreciate. This should have made Indonesia»s textile products to be more competitive
for consumers abroad, because the price of Indonesian textile products became cheaper. But in
reality the value of textile exports decreased to US$ 1.3 billion in 1997 (CIC, 2001).
With all various problems mentioned above, would the textile industry be still able to
survive or grow? It is therefore important to analyze the factors that influence the prospect of
Indonesian textile industry in the future. The purpose of this study is to: (1) analyze the factors
that influence the development of Indonesian textile industry, and (2) analyze the prospects for
the development of Indonesian textile industry in the future. The results are expected to provide
inputs for policy formulation that is will be supportive for the development of Indonesian textile
industry.
The next section of this paper explains the theory and empirical literatures on textile
industry, while the third explain the methodology applied. The result and analysis will be explained
on fourth section and conclusion will be the last section.

361Analysis of The Impact of Macroeconomic Policies On Textile Industry And Its Products In Indonesia
II. THEORY
2.1. Trade Theory
Basically some of the factors that drive the emergence of a country»s international trade
with the others countries come from the desire to expand the marketing of export commodities,
to increase foreign exchange for development activities, differences in supply and demand
between countries, as well as the differences in the relative cost of producing certain commodities
(Gonarsyah, 1987) .
In Figure 2 it is explained how trade can occur between two countries (Indonesia and
China) and between the two commodities (garments and rice). Trade occurs because of
differences in slope that indicates the relative price ratio between rice and garments. The
assumptions that are used include, i.e. there are only two countries that conduct the trading,
the presence of constant opportunity costs, and that each country is trying to achieve the
highest level of welfare (the tangent point between the indifference curves and barter lines).
Before the trade takes place (autarky), the domestic exchange ratio is different in the two
countries. It also shows the differences in comparative advantage, where the garment is relatively
cheaper in Indonesia than in China. When the trading started between the two countries, the
ratio of international exchange (terms of trade) underlies between the two domestic ratios, for
Figure 2.Trading Equilibrium Trade
Source : Dunn and Mutti, 2004.Description : SB and SL is the barter line; point T and M is the point where price ratio is equal to the marginal rate of substitution, and i
1-i
4 is the indifference
curve.
b. Chinaa. Indonesia
1000
40 55
100
200
60
W
SD
P
T R
i1 i2i3
i4
Garment
Rice
GB
Garment Export
Rice Import
B
8040 45
N
LG
K
M
i1
i2
Garment
G
B
Rice Export
Garment Import
120
B
0
150
120
240

362 Bulletin of Monetary, Economics and Banking, April 2011
example 1 garment: 1 rice, and 3 garments: 3 rice. The international exchange rate will be
balanced depends on the willingness of each country to offer its export and import commodities
in the relative price of purchase.
At the final equilibrium position, Indonesia will produce at point S and consume at point
T, in which Indonesia produces garments of OS (100 million tons), domestic consumption of
OD (55 million tons), and exports amounted to SD (45 million tons) to be exchanged for rice
imports at DT (90 million tons). TRS triangle is a trading triangle. TR represents the export of
garments, RS represents the import of rice, and the TS slope represents the relative price of the
garment. China will also profit the trade from importing garments and exporting rice, where
the gain in total trade can be seen in Table 1. So without trade, China»s rice consumption only
amounted to 120 million tons and garment»s»amounted to 40 million tons. After making the
trade with Indonesia, China»s rice exports increased by NB (90 million tons) and Chinese garment
imports increased by NM (45 million tons).
2.2. Construction of Economic Model of Indonesian Textile and TextileProducts
Based on the corporation theory, input demand is derived from the production function
of each company with the assumption that producers maximize profits within the constraints
Table 1.Production and Consumption Before and After the Trading (million tons)
Country/Country/Country/Country/Country/RegionRegionRegionRegionRegion
R i c eR i c eR i c eR i c eR i c e G a r m e n tG a r m e n tG a r m e n tG a r m e n tG a r m e n t
Before TradingBefore TradingBefore TradingBefore TradingBefore Trading
China 120 - - 120 40 - - 40Indonesia 60 - - 60 40 - - 40Worldwide 180 - - 180 80 - - 80
China 240 90 0 150 0 0 45 45Indonesia 0 0 90 90 100 45 0 55Worldwide 240 240 100 100
China +30 +5Indonesia +30 +15Worldwide +60 +20
ProductionProductionProductionProductionProduction(1)(1)(1)(1)(1)
ConsumptionConsumptionConsumptionConsumptionConsumption(4) = (1)-(2)+(3)(4) = (1)-(2)+(3)(4) = (1)-(2)+(3)(4) = (1)-(2)+(3)(4) = (1)-(2)+(3)
ImportImportImportImportImport(3)(3)(3)(3)(3)
Export Export Export Export Export(2)(2)(2)(2)(2)
ProductionProductionProductionProductionProduction(1)(1)(1)(1)(1)
ConsumptionConsumptionConsumptionConsumptionConsumption(4) = (1)-(2)+(3)(4) = (1)-(2)+(3)(4) = (1)-(2)+(3)(4) = (1)-(2)+(3)(4) = (1)-(2)+(3)
ImportImportImportImportImport(3)(3)(3)(3)(3)
ExportExportExportExportExport(2)(2)(2)(2)(2)
Source: Dunn and Mutti, 2004.
After TradingAfter TradingAfter TradingAfter TradingAfter Trading
Gain from TradingGain from TradingGain from TradingGain from TradingGain from Trading

363Analysis of The Impact of Macroeconomic Policies On Textile Industry And Its Products In Indonesia
of technology and market (output and input price) (Varian, 1978 in Sinaga, 1989). Another
assumption is that each company faces a perfectly competitive market, both in input and
output markets, so that each company is a price taker.
The derivation of input demand and output supply will require the terms First Order
Necessary Condition (FONC) and Second Order sufficient Condition (SOSC) in maximizing the
profit (Henderson and Quandt, 1980). It is assumed that the production function can be derived
(twice differentiable), demand for the company against certain input condition requires the
input productivity (marginal product) that worth the price. Textile commodities are a derived
demand from commodity garments. Therefore variables contained in the domestic textile demand
equation look different from the usual demand for final goods.
In this study, it also assumed that there is only one type of textile and garment traded.
Therefore, textiles and garments are considered as a same commodity which is then converted
in units of the same weight (tons). This conversion factor is using the general calculation which
is applied by the API. Meanwhile, the domestic composite price variable for textile and garment
industries is based on data published by API and the foreign variable is using the proxy of
export prices of textile and garment in the world.
In addition, Indonesia is categorized as a small open economy. This classification is based
on economic behavior, in which Indonesia cannot influence the world prices or world prices
variable as exogenous variables (Krantz, 2006). According to Houck, 1986 that small importer
countries face a flat excess supply and are unable to influence the world prices. Therefore the
assumption used is that a small country behaves as a price taker, both in the input and output
markets. Additionally, transportation costs are zero and there are no trading barriers. This
condition is constructed in the model by positioning of textile and garment world prices variable
as exogenous variable in the equation of production, exports, and import of domestic textile
and garment.
Economic relations between variables in the model are formulated on the basis of
microeconomic theory, macroeconomic theory, international trade theory, and research results
related. Estimation parameters sign becomes another form of the hypothesis which is later
followed as the basis to determine the method of analysis and appropriate data processing.
The connection between Indonesia and the world»s textile industry is the reason why this model
is constructed with a dynamic model in the form of simultaneous equations. The dynamic
nature of the aspects of supply, demand, domestic as well as world prices is also accommodated
with the previous year»s variables into the model. Diagram 1 presents a simple relationship
between endogenous and exogenous variables in blocks of textile and garment market in
Indonesia and the world. The equations are divided into four blocks, namely (1) Indonesian

364 Bulletin of Monetary, Economics and Banking, April 2011
Diagram 1.Linkages between Block in Economic Model of Textiles and
Textile Products of Indonesia
textile market block, (2) Indonesian garment markets block, (3) world textile market block, and
(4) world garment market block.
Based on the relationship between variables in the block, the compiled equations consist
of endogenous and exogenous variables. Determination of these variables is based on theoretical
framework, empirical studies, and also the conditions in the field. The selected variables are
variables that are considered influential and mainly adapted to the availability of data. Textile
industry is composed of the subsectors of fibers, yarns, fabrics, apparel, and other textiles. Not
all these sub-sectors would be made explicit in economic models. Sub-sectors of fibers, yarns,
and fabrics will be included in the textile group, while apparel and other textiles products
belong to the garment group. This division is due to data availability. Operational model developed
in this study attempted to capture all economic phenomena in the textile industry, both in
Indonesia and the world market. This operational model comprises 24 behavior equations and
6 identity equations, however, only 12 behavioral equations and 6 identity equations would be
further discussed as they are related directly to the textile industry in the country. The behavior
of textile and garment exports of Germany, United States, China Italy, Turkey, and Japan would
not be explained. The equations are presented as follows:
Indonesian Textile Block1. Production2. Supply3. Demand4. Export5. Import6. Indonesian Price
Indonesian Garment Block1. Production2. Supply3. Demand4. Export5. Import6. Indonesian Price
World Textile Block1. World Price2. World Export3. World Import4. Export of German5. Export of USA6. Export of China7. Import of Italy8. Import of USA9. Import of China
World Garment Block1. World Price2. World Export3. World Import4. Export of Germany5. Export of China6. Export of Turkey7. Import of Germany8. Import of USA9. Import of Japan

365Analysis of The Impact of Macroeconomic Policies On Textile Industry And Its Products In Indonesia
1. Domestic textile production1. Domestic textile production1. Domestic textile production1. Domestic textile production1. Domestic textile production
PTDt = a
0 + a
1HTDR
t-1 + a
2HCWR
t-1 + a
3(IRR
t-IRR
t-1) +
a4UTKTR
t-1 + a
5BBMR
t-1 + a
6T + a
7PTD
t-1 + U
1 .......................... (1)
The estimation parameter sign expected in the equeation is:
a1, a
6 > 0; a
2, a
3, a
4, a
5 < 0 and 0 < a
7 < 1.
2. Indonesian textile export2. Indonesian textile export2. Indonesian textile export2. Indonesian textile export2. Indonesian textile export
XTIt = b
0 + b
1HTWR
t+ b
2(HTDR
t-HTDR
t-1) + b
3PTD
t-1 +
b4ERIR
t-1 + b
5DKG + b
6T + b
7XTI
t-1 + U
2 ................................... (2)
The estimation parameter sign expected in the equeation is:
b1, b
3, b
4 > 0; b
2 < 0 and 0 < b
5 < 1.
3. Domestic textile supply3. Domestic textile supply3. Domestic textile supply3. Domestic textile supply3. Domestic textile supply
STDt = PTD
t + MTI
t - XTI
t ........................................................................ (3)
4. Domestic textile demand4. Domestic textile demand4. Domestic textile demand4. Domestic textile demand4. Domestic textile demand
DTDt = c
0 + c
1(HTWR
t-1/HTDR
t) + c
2HGDR
t-1 + c
3UTKTR
t-1 +
c4BBM
t-1 + c5(IRR
t-IRR
t-1) + c
6T + c
7DTD
t-1 + U
3 ....................... (4)
The estimation parameter sign expected in the equeation is:
c1, c
2, c
3, c
4, c
5 < 0; c
6 > 0 and 0 < c
7 < 1.
5. Indonesian textile import5. Indonesian textile import5. Indonesian textile import5. Indonesian textile import5. Indonesian textile import
MTIt = d
0 + d
1HMTIR
t-1 + d
2(HTWR
t/HCWR
t) + d
3TFT
t-1 + d
4ERIR
t-1 +
d5(GDPIR
t/GDPIR
t-1) + d
6POPI
t-1 + d
7T + d
8MTI
t-1 + U
4 ............... (5)
The estimation parameter sign expected in the equeation is:
d1, d
2, d
3, d
4, d
7 < 0; d
5, d
6 > 0, and 0 < d
8 < 1.

366 Bulletin of Monetary, Economics and Banking, April 2011
6. Domestic textile price6. Domestic textile price6. Domestic textile price6. Domestic textile price6. Domestic textile price
HTDRt = e
0 + e
1STD
t-1 + e
2(HGDR
t-HGDR
t-1) +
e3(HTWR
t-1/HCWR
t-1) + e
4HTDR
t-1 + U
5 .................................. (6)
The estimation parameter sign expected in the equeation is:
e1 < 0; e
2, e
3 > 0 and 0 < e
4 < 1.
7. World textile price7. World textile price7. World textile price7. World textile price7. World textile price
HTWRt = f
0 + f
1XTW
t + f
2MTW
t-1 + f
3HTWR
t-1 + U
6 ..................................... (7)
The estimation parameter sign expected in the equeation is:
f1 < 0; f
2 > 0 and 0 < f
3 < 1.
8. World textile export8. World textile export8. World textile export8. World textile export8. World textile export
XTWt = XTI
t + XTG
t + XTA
t + XTC
t + XTR
t ................................................. (8)
9. World textile import9. World textile import9. World textile import9. World textile import9. World textile import
MTWt = MTI
t + MTL
t + MTA
t + MTC
t + MTR
t ............................................. (9)
10. Domestic garment production10. Domestic garment production10. Domestic garment production10. Domestic garment production10. Domestic garment production
PGDt = g
0 + g
1(HGWR
t-1/HGDR
t-1) + g
2(HTDR
t-HTDR
t-1) + g
3HCWR
t-1 +
g4(IRR
t-IRR
t-1) + g
5UTKGR
t-1 + g
6BBMR
t +
g7T + g
8PGD
t-1 + U
7 ................................................................... (10)
The estimation parameter sign expected in the equeation is:
g1, g
7 > 0; g
2, g
3, g
4, g
5, g
6 < 0 and 0 < g
8 < 1.
11. Indonesian garment export11. Indonesian garment export11. Indonesian garment export11. Indonesian garment export11. Indonesian garment export
XGIt = h
0 + h
1HGWR
t + h
2(HTWR
t/HGDR
t-1) + h
3PGD
t +
h4ERIR
t-1 + h
5DKG + h
6T + h
7XGI
t-1 + U
8 ......................................... (11)

367Analysis of The Impact of Macroeconomic Policies On Textile Industry And Its Products In Indonesia
The estimation parameter sign expected in the equeation is:
h2, h
5 < 0, h
1, h
3, h
4, h
6 > 0 and 0 < h
7 < 1.
12. Domestic garment supply12. Domestic garment supply12. Domestic garment supply12. Domestic garment supply12. Domestic garment supply
SGDt = PGD
t + MGI
t - XGI
t ........................................................................... (12)
13. Domestic garment supply13. Domestic garment supply13. Domestic garment supply13. Domestic garment supply13. Domestic garment supply
DGDt = i
0 + i
1(HGWR
t/HTWR
t-1) + i
2(HGDR
t*ERIR
t) +
i3(GDPIR
t/POPI
t) + i
4(MGI
t-MGB
t-1) + i
5DGD
t-1 + U
9 ...................... (13)
The estimation parameter sign expected in the equeation is:
i1, i
2, i
4 < 0; i
3 > 0 and 0 < i
5 < 1.
14. Indonesian garment import14. Indonesian garment import14. Indonesian garment import14. Indonesian garment import14. Indonesian garment import
MGIt = j
0 + j
1HMGIR
t + j
2(HGWR
t-HGWR
t-1) + j
3TFG
t + j
4PGD
t-1 +
j5ERIR
t + j
6(GDPIR
t/POPI
t) + j
7MGI
t-1 + U
10 ................................. (14)
The estimation parameter sign expected in the equeation is:
j1, j
2, j
3, j
4, j
5 < 0; j
6 > 0 and 0 < j
7 < 1.
15. Domestic garment price15. Domestic garment price15. Domestic garment price15. Domestic garment price15. Domestic garment price
HGDRt = k
0 + k
1(DGD
t/DGD
t-1) + k
2(HTWR
t-HTWR
t-1) +
k3(HTWR
t-HTWR
t-1) + k
4(HGWR
t-1/HTWR
t) + k
5T
k6HGDR
t-1 + U
11 ............................................................................. (15)
The estimation parameter sign expected in the equeation is:
k1, k
2, k
3, k
4 > 0; k
5 < 0 and 0 < k
6 < 1.
16. World garment price16. World garment price16. World garment price16. World garment price16. World garment price
HGWRt = l
0 + l
1XGW
t + l
2MGW
t-1 + l
3HGWR
t-1 + U
12 .º.................................. (16)

368 Bulletin of Monetary, Economics and Banking, April 2011
The estimation parameter sign expected in the equeation is:
l1 < 0; l
2 > 0 and 0 < l
3 < 1.
17. World garment export17. World garment export17. World garment export17. World garment export17. World garment export
XGWt = XGI
t + XGG
t + XGC
t + XGT
t + XGR
t ............................................ (17)
18. World garment import18. World garment import18. World garment import18. World garment import18. World garment import
MGWt = MGI
t + MGG
t + MGA
t + MGJ
t + MGR
t ......................................... (18)
2.3. Empirical Review on Textile and Textile Products
2.3.1. Empirical Review on Textile and Textile Products in Indonesia
The study by Pracoyo (1995) is related to the export of textile industries which used the
time series data of 1983-1992 and estimation methods Two Stage Least Squares (2SLS). Pracoyo
adopted the model of export supply and demand which had been carried out by Muscatelli,
Srinivasan, and Vines (1992). The result showed that Indonesian textile export supply is influenced
by the textile price, raw material costs, wages, rates, and technology. While the textile export
demand side is influenced by the textile price, world textile prices, the price of substitute goods
(the world price of wool), other countries» revenues, and consumer tastes. It is also concluded
that (1) tariff reduction will encourage a more competitive world trade. Tariff reduction by 30
percent would encourage a more competitive world trade, (2) granting wage by 1 percent
would reduce the quantity supplied by 4.5 per cent. This occurs because wages belongs to the
component cost in production, and (3) changes in technology, which is demonstrated by the
trend variable, encourage more efficient textile production.
The research using Ordinary Least Squares (OLS) estimation methods was conducted by
Wintala (1999). The conclusion that can be drawn from his analysis of the factors that influence
the Indonesian textile exports to the United States, Britain, and Japan in 1978-1997, is that the
trend of Indonesian textile exports to the United States, Britain, and Japan is positive and
statistically significant. Devaluation of the rupiah, the rising foreign exchange reserves, population
increase, and clothing price index tend to increase the export volume of Indonesian textiles.
Istojo (2002) analyzed the structure of the Indonesian textile industry on the World Trade
Organization (WTO) in 2005. The method used is the description of the industry characteristics,
the five forces model, driving forces, and key success factors. The result is that that the textile

369Analysis of The Impact of Macroeconomic Policies On Textile Industry And Its Products In Indonesia
industry is a highly dependent to suppliers and buyers as well as intense competition among
companies in the Indonesian textile industry. Implementation of the WTO in 2005 intensifies
the competition and struggle for markets at home and abroad. The implementation of the
WTO will also alter the structure of the textile industry into mass customization which tend to
the non-price factors and is fully supported by the principle of quick response and just in time
stock. It is also noticed that textile companies must be able to do a lot of manufacturing
innovation that will increase product differentiation.
Agustineu (2004) studied the factors that affect the output of textile industry in West
Java using the Cobb Douglas model, in year 1980-2001. The result is that the capital, raw
materials, and fuel give a positive influence to the increase of the output of textile industry in
West Java. Labor factor causes the opposite effect with the factors aforementioned. The textile
industry in West Java is in the Increasing returns to scale condition.
2.3.2. Study Review on World Textile and Textile Products
Mlachila and Yongzheng (2004) used the General Trade Analysis Project (GTAP) to analyze
the end of the textile quotas with a case study in Bangladesh. There are three factors that affect
the performance of textile and apparel exports of Bangladesh in the 1990s, which are low
wages, net flows of foreign direct investment (FDI), and quotas imposed in the competitor
countries. Bangladesh faced serious problems with competitiveness after quota system ended,
because of the weak infrastructure and a variety of macro-climate that was not supportive. The
simulation results showed that Bangladesh exports would decline after the abolition of quotas
and this would affect the Balance of Payment (BOP).
WTO (2004) utilized the GTAP to describe the condition of the global textile industry
after the end of the ATC. China and India are two countries that will dominate the textile
market of the European Union, United States, and Canada after the quota system ended. Even
China is expected to take up to 50% share of world textile market. In addition, vertical
specialization in the textile supply chain is very important, and the countries with a geographical
proximity will benefit much from bilateral agreements and lower rate. The important findings
for Indonesian textile industry are the change of textile market share in EU and US markets. In
the EU market Indonesia will gain an increase of market share by 1 percent (from 4 percent to
5 percent) for the garment market after quotas expire. As for the textile markets, Indonesia will
experience a stagnancy (from 3 percent to 3 percent). In contrary in the U.S. market, textile
Indonesia will be stagnant (from 3 percent to 3 percent). The decline occurred for garment
commodity in the U.S. market (from 4 percent to 2 percent).
370 Bulletin of Monetary, Economics and Banking, April 2011
The various research studies on the textile industry, in general give an overview of the
textile export growth and the factors that influence it, both at national and international levels.
Also, many studies make predictions on the development of post-quota textile industry in
2005. However, there are still parts that have not been elaborated in depth by previous
researchers. The linkage between the Indonesian market and world markets plays an important
role in reviewing the development of Indonesian textile industry. Aggregate and descriptive
research of textile industry tends to lead to a non-specific conclusion, while the micro-scale
research will also result in conclusions that cannot be generalized. Therefore, on this occasion
the development of the textile industry will analyzed holistically, both the textile and garment
industry, by linking the textile industry simultaneously through economic variables, including
monetary and fiscal policy.
III. METHODOLOGY
The main analytical tool used is the time series econometric, which is useful to analyze
the factors through sign and size of estimation parameter of each behavior equation and
prospects for the development of Indonesian textile industry through forecasting simulation.
Besides, all structural equation have undergone a model specification by trial and error so that
in the end it will generate the equations that are based on the necessity and sufficiency terms
in arranging simultaneous equations without neglecting the basic assumptions of regression
equation (multicollinearity, homoscedasticity, and autocorrelation).
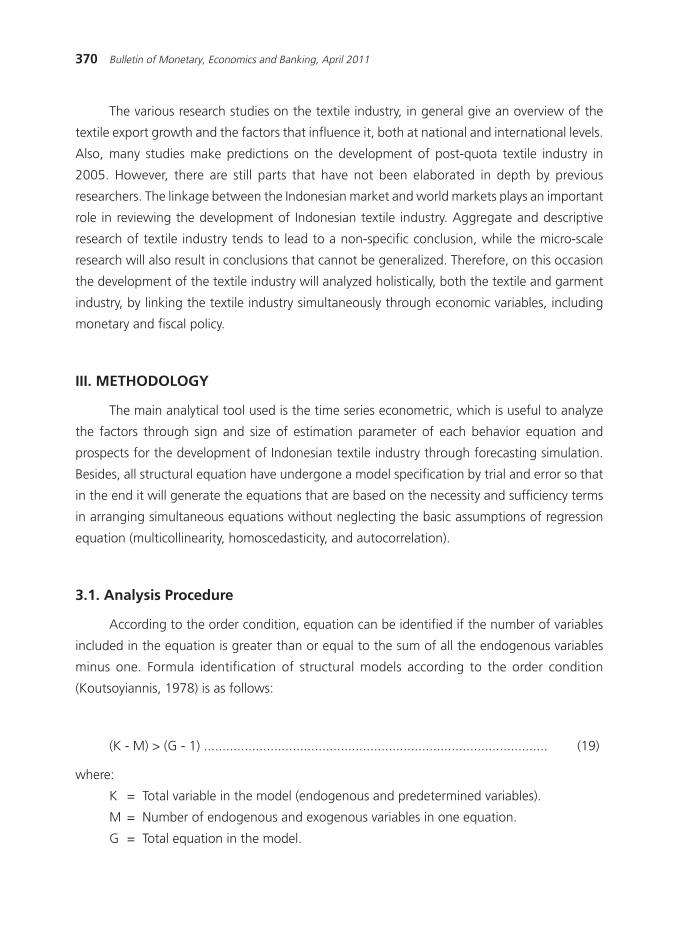
3.1. Analysis Procedure
According to the order condition, equation can be identified if the number of variables
included in the equation is greater than or equal to the sum of all the endogenous variables
minus one. Formula identification of structural models according to the order condition
(Koutsoyiannis, 1978) is as follows:
(K - M) > (G - 1) ............................................................................................. (19)
where:
K = Total variable in the model (endogenous and predetermined variables).
M = Number of endogenous and exogenous variables in one equation.
G = Total equation in the model.

371Analysis of The Impact of Macroeconomic Policies On Textile Industry And Its Products In Indonesia
If an equation in the model shows the condition (K - M) > (G - 1) then the equation is
over identified, if (K - M) = (G - 1) then the equation is exactly Identified, and if (K - M) < (G - 1)
then the equation is under identified. There are 30 equations in structural model of this study,
consisting of 24 behavioral equations and 6 identity equations. There are 24 endogenous variables
(G) and 80 predetermined variables. The total number of variables included in the model (K) is
104. According to the formula of model identification with the criteria order condition, then
each equation is over-identified.
If the equation in the structural model is all over identified then this equation can be
predicted by using the Limited Information Maximum Likelihood (LIML), Full Information
Maximum Likelihood (FIML), Two Stage Least Squares (2SLS) or Three Stage Least Squares
(3SLS). The method used in this study to predict the structural estimation parameters is 2SLS.
2SLS method is established with the assumption that (1) the requirement must meet the
assumption of zero stochastic disturbance, constant variance and covariance equal to zero, (2)
specification of the structural model is exactly precise as far as the predetermined variables, (3)
the number of observation samples is greater than the amount of predetermined variables in
the model, and (4) explanatory variables do not experience a perfect collinearity. By considering
these assumptions, the DW (Durbin Watson) statistic is not valid to predict the structural equations
of the simultaneous equations model, especially in the presence of time-different endogenous
variables.
The data processing to estimate the economic model is done by using the computer
software program SAS, version 6.12. To test the explanatory variables, the F statistical test is
simultaneously conducted, while to test the individual explanatory variables, the t statistical
test is used.
Validation of an economic model aims at analyzing on how far a model can represent the
reality. The statistical criteria used for the validation of economic model estimation are the Root
Means Square Error (RMSE), Root Means Square Error Percent (RMSPE), and Theil»s Inequality
Coefficient (U-Theil).
RMSPE statistic is used to measure how far the values of the endogenous variables
from the estimation deviate from the actual flow values in the relative size (percent); while
value-Theil U statistic is to determine the ability of the model in analyzing the forecasting
simulation. Theil U-value ranges between 1 and 0. If the U-Theil = 0 then the estimation
model is perfect, if the U-Theil = 1 then the estimation model is naive. To view the closeness
of the direction (slope) between the actual and simulated results, we observe the coefficient

372 Bulletin of Monetary, Economics and Banking, April 2011
of determination (R<). Basically, the smaller the value of RMSPE and U-Theil and the greater
the value of the coefficient of determination, the better the estimation model.
The policies that are simulated, for the forecasting (ex-ante) year 2007-2012, are
the decline in interest rates in Indonesia, the adjustment of the exchange rate of Rupiah/
US$, the increase in textile industry production cost through wages and fuel prices, the
increase of Indonesia»s GDP, the increase of Indonesia»s population, the increase of US
GDP, the increase of China»s GDP, and the elimination of textile tariffs, along with its
combinations.
3.2. Source and Type of Data
The type of data used in the econometric model is secondary time series data of 1980-
2006. The data is extracted from official publications, such as the Indonesian Textile Association
(Asosiasi Pertekstilan Indonesia/API), the Central Statistics Agency (Bapan Pusat Statistik/BPS),
United Nations Conference on Trade and Development (UNCTAD), United Nation (UN),
International Monetary Fund (IMF), WTO, Ministry of Commerce, Ministry of Industry, Jakarta
daily publications, and internet.
All the data in rupiah unit are deflated using the Consumer Price Index (CPI) of Indonesia
in 2000 (2000=100) and the variables in US$ unit are deflated using CPI proxy United States in
2000 (2000=100). This is done to eliminate the effects of inflation.
IV. RESULT AND ANALYSIS
4.1. The Economic Model Structure of Indonesian Textile and Textile Products
a. Indonesian Textile Productions
The performance of Indonesian textile production in the level of 98 can be explained by
the lag of Indonesian textile prices, the lag of world cotton prices, the interest rates, the lag of
textile workers wage, the lag of fuel prices, the time trend, and the lag Indonesian textile
production. All estimation parameters are in line with expectations and all variables statistically
give a significant effect.
The lagging estimation parameter coefficient of Indonesian textile prices is positive at the
level of 0.514. This means if there is a price lag increase of Indonesian textiles at 10 US$ per
ton, the Indonesian textile production will rise by 5140 thousand tons, ceteris paribus. The
improvement Indonesia»s textile production that is in line with the increase of textile prices in

373Analysis of The Impact of Macroeconomic Policies On Textile Industry And Its Products In Indonesia
Indonesia indicates that the price of Indonesian textiles is an economic signal for textile
manufacturers in producing textiles in Indonesian market.
The main raw materials of textiles are textile fibers which has an irreplaceable
advantage compared to the non-cotton materials, one of which is easy to absorb sweat
and its hygroscopic characteristic. Therefore, the world cotton price changes affect the
dynamic of Indonesian textiles production. According Istojo (2002) Indonesian textile
industry is very dependent on suppliers and buyers. More than 85 percent of cotton for
the Indonesian textile industry is imported from Australia, United States, China, India,
Pakistan, Tanzania, and others. This is because cotton has not been maximally cultivated
in the country. In this study, Indonesian textile production is also influenced significantly
by the lag of the world cotton price in the opposite direction. If the lagging world price
of cotton increase by 10 US. $ Per ton, it will lower the Indonesian textile production by
354.812 tons, ceteris paribus. In the short term and long term, Indonesian textile
production is very responsive to lag of world cotton prices.
Bank interest rate bank is proxied with bank interest rate for investment activities. Interest
rates contributed negatively to Indonesian textile production. If the bank raised interest rates
through monetary policy by 1 percent, ceteris paribus, then it would lower the Indonesian
textile production by 2.410 thousand tons. This condition reduces incentives for manufacturers,
thereby reducing the production of textiles in Indonesia up to 0.053 percent and 0.772 percent,
respectively in short and long term.
Textile industry employs many workers that the wage labor became one of the important
components of production costs in the sustainability of the production process. Wage labor in
the textile sector has a significant effect on Indonesian textile production in a negative direction.
If the amount of wage labor in the textile sector is increased by Rp. 1.000.000 per capita per
year, it will decrease the production of textiles to 0.110 thousand tons of Indonesia, ceteris
paribus. The response of Indonesian textile production to wage labor is inelastic in the short
term and elastic in the long term. As examined by Pracoyo (1995) that the wage labor is
statistically significant in affecting Indonesian textile production.
In addition to labor costs, fuel prices (especially diesel and fuel oil) also contribute to the
costs of production in the textile sector. A fuel price is negatively related to the production of
textiles of Indonesia and its effect is statistically significant. If the fuel price increases by Rp.10
per liter, it will lower the Indonesian textile production as much as 1.444 thousand tons, ceteris
paribus. In the short and long term, the Indonesian textile production is less responsive to fuel
prices.
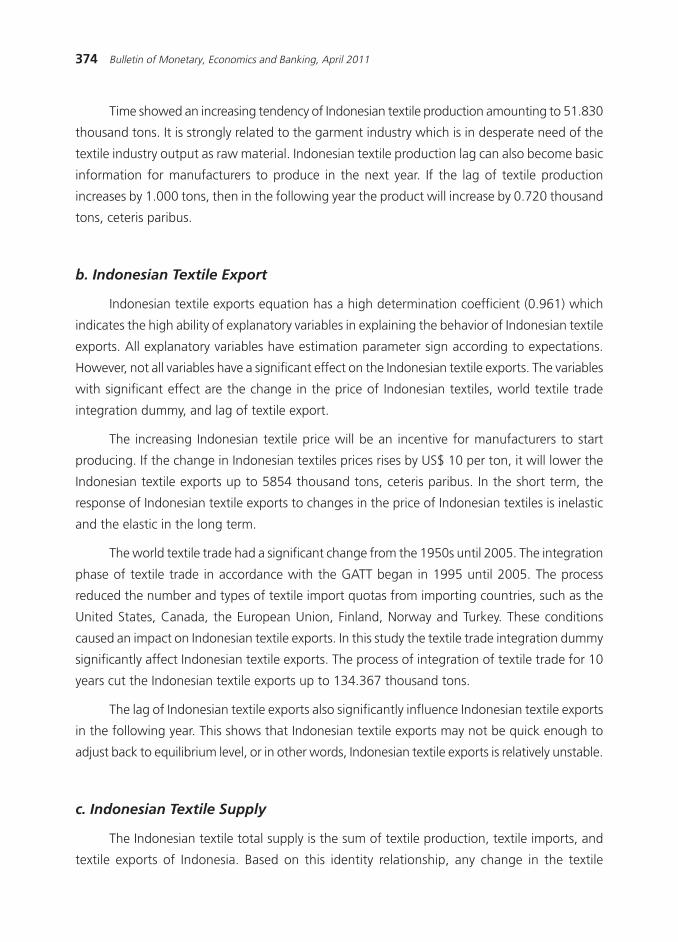
374 Bulletin of Monetary, Economics and Banking, April 2011
Time showed an increasing tendency of Indonesian textile production amounting to 51.830
thousand tons. It is strongly related to the garment industry which is in desperate need of the
textile industry output as raw material. Indonesian textile production lag can also become basic
information for manufacturers to produce in the next year. If the lag of textile production
increases by 1.000 tons, then in the following year the product will increase by 0.720 thousand
tons, ceteris paribus.
b. Indonesian Textile Export
Indonesian textile exports equation has a high determination coefficient (0.961) which
indicates the high ability of explanatory variables in explaining the behavior of Indonesian textile
exports. All explanatory variables have estimation parameter sign according to expectations.
However, not all variables have a significant effect on the Indonesian textile exports. The variables
with significant effect are the change in the price of Indonesian textiles, world textile trade
integration dummy, and lag of textile export.
The increasing Indonesian textile price will be an incentive for manufacturers to start
producing. If the change in Indonesian textiles prices rises by US$ 10 per ton, it will lower the
Indonesian textile exports up to 5854 thousand tons, ceteris paribus. In the short term, the
response of Indonesian textile exports to changes in the price of Indonesian textiles is inelastic
and the elastic in the long term.
The world textile trade had a significant change from the 1950s until 2005. The integration
phase of textile trade in accordance with the GATT began in 1995 until 2005. The process
reduced the number and types of textile import quotas from importing countries, such as the
United States, Canada, the European Union, Finland, Norway and Turkey. These conditions
caused an impact on Indonesian textile exports. In this study the textile trade integration dummy
significantly affect Indonesian textile exports. The process of integration of textile trade for 10
years cut the Indonesian textile exports up to 134.367 thousand tons.
The lag of Indonesian textile exports also significantly influence Indonesian textile exports
in the following year. This shows that Indonesian textile exports may not be quick enough to
adjust back to equilibrium level, or in other words, Indonesian textile exports is relatively unstable.
c. Indonesian Textile Supply
The Indonesian textile total supply is the sum of textile production, textile imports, and
textile exports of Indonesia. Based on this identity relationship, any change in the textile

375Analysis of The Impact of Macroeconomic Policies On Textile Industry And Its Products In Indonesia
production, textile imports, and textile exports caused by the government intervention, among
others, through the instruments of monetary and fiscal policies, will affect the amount of
textiles that are available in Indonesia market. The magnitude of change in Indonesian textiles
supply depends on the elasticity of the textile production, textile imports, and also textile exports
of Indonesia, both directly and indirectly.
d. Indonesian Textile Price
The value of determination coefficient of the Indonesian textiles price equation is 0.833.
This indicates the high ability of explanatory variables in explaining the price behavior of
Indonesian textiles. The estimation parameter sign in the structural equation has also been
in line with the expectations, and the variables which significantly affected the price of
Indonesian textiles are the changes in Indonesian garment prices, and the lag of Indonesian
textile price.
The changes in the price of Indonesian garment significantly affect the price of Indonesian
textiles in a positive manner. If changes in Indonesia»s garment prices rise by US$ 100 per ton,
it will stimulate the Indonesian textile price to increase by US$ 0.819 per ton, ceteris paribus.
The response in the short and long term is the inelastic; this shows that Indonesian textile prices
are less responsive toward the price changes in Indonesia»s garment.
In addition to changes in Indonesia»s garment prices, the lag of Indonesian textiles price
is also very significant. This indicates that the price of Indonesian textiles requires a slower
adjustment to reach the equilibrium level, or in other words the price of Indonesian textiles is
relatively unstable. If the lag of Indonesian textile prices increases by US$ 10 per ton, it will
increase the price of Indonesian textiles next year amounting to US$ 6.889 per ton, ceteris
paribus.
e. Indonesian Textile Demand
Indonesian textile demand equation has a quite high determination coefficient at 0.819.
This situation illustrates the high ability of explanatory variables in explaining the behavior of
demand for Indonesian textiles. Demand for Indonesian textiles is explained by changes in
textile price of Indonesia, lag of Indonesia»s garment prices, lag of wage labor, changes in
interest rates, time trends, and the lag of demand for Indonesian textiles. All estimation parameter
sign meet the expectations. The lag of Indonesia»s garment prices, lag of wage labor in the
textile industry, and lag of demand for Indonesian textile significantly affect the demand for
Indonesian textiles.

376 Bulletin of Monetary, Economics and Banking, April 2011
The lag of Indonesia»s garment prices has the opposite relationship with the demand for
Indonesian textiles. If the lag garment prices rises by US$ 10 per ton, the Indonesian textile
demand would decrease by 0.270 thousand tons, ceteris paribus. In addition, Indonesian textile
demand is less responsive to the lag of price changes of Indonesian garment, either in the short
and long term. The demand for Indonesian textiles is a reflection of demand for textiles by
textile industry itself and in the end the output of textile industry will be used as the input by
the garment industry.
The lag of wage labor in the textile sector contributes in affecting the change of demand
for Indonesian textiles. If the lag of wage labor rises by 1 percent, it will lower demand for
Indonesian textiles by 0.715 percent in the short term and 1.856 percent in the long term.
Textile demand is a derived demand for the garment industry. The information about the lag of
demand for Indonesian textiles plays an important role to estimate the demand for Indonesian
textiles in the following year. If the lag of demand for Indonesian textiles increases by 1000
tons, there will be a tendency to increase the demand for Indonesian textiles in the following
year as much as 0.615 thousand tons, ceteris paribus.
f. The Indonesian Textile Import
Based on the estimation result, only the lag of Indonesian textile imports significantly
influence Indonesian textile imports for the following year. This shows that Indonesian textile
imports require a relatively slower time to adjust back to equilibrium levels.
g. Indonesian Garment Production
The performance of Indonesian garment production can be explained as much as 0.939
by its explanatory variables. The variable estimation parameters sign in the structural equation
have also been in line with expectations. Variables that are significantly influential are the lag of
garment labor wages, time trends, and garment production lag.
Similar to the textile industry, garment industry also employs many workers. There are
several parts in the garment production process, such as sewing, which cannot be entirely
replaced by machine. The high employment of labor will affect the cost of production. Lag of
garment workers wage in this study is very different statistically. If there is an increase of garment
workers»»wages»lag by Rp. 1 million per capita per year, it will reduce the Indonesia»s garment
production as much as 0.055 thousand tons, ceteris paribus. In the short term, the Indonesian
garment production is less responsive, compared to the long term.

377Analysis of The Impact of Macroeconomic Policies On Textile Industry And Its Products In Indonesia
Besides the garment workers»»wages»lag, the time trend is also very real influential on
Indonesian garment production. Garment is a product which is strongly associated with fashion
trends and dynamically changes according to the development of time. Based on time trends,
Indonesia»s garment production increased by 26,869 thousand tons. Also the garment production
lag becomes information to produce the garment the following year. If the lag of Indonesian
garment production increases by 1,000 tons, the Indonesian garment production the following
year will increase by 0.453 thousand tons, ceteris paribus.
h. Indonesian Garment Export
The performance of Indonesian garment exports at 0.952 can be explained by its
explanatory variables. The variable estimation parameter sign in the structural equation has
also been in line with expectations. Indonesia»s garment exports is explained by the ratio of the
world garment price lag with the world textile prices, the price of Indonesian garment products,
ratio of Indonesian garment production with Indonesian garment production lag, lag of rupiah
exchange rate against the US$, the world textile trade integration dummy, and lag of Indonesian
garment exports. From these six variables, only the lag of exchange rate of rupiah against the
US dollar and the lag of Indonesian garment exports give a significant effect.
Exportation of garments is associated with the exchange rate of rupiah against the US$.
The depreciated rupiah will increase the competitiveness of Indonesian garment products. The
lag of rupiah exchange rate against the US$ significantly change the short-term elasticity by
0.310 and the long-term by 1.353. This means that if the lag of the rupiah exchange rate
against US$ is depreciated by 10 percent, the Indonesian garment exports will increase by 3.10
percent in short term and l3.530 percent in long-term or elastic, ceteris paribus.
The coefficient of lag of Indonesia»s garment exports has a positive estimation parameter
outcome at 0.771. This means that if the lag Indonesia»s garment exports increases by 1000
tons, then Indonesia»s garment exports the following year will increase by 0.771 thousand
tons, ceteris paribus.
i. Indonesian Garment Supply
The total supply of Indonesian garment products is the identity equations from Indonesian
garment production, imports, and exports. The magnitude of changes in Indonesian garment
supply depends on the elasticity of the Indonesia garment production, imports and also exports,
either directly or indirectly.

378 Bulletin of Monetary, Economics and Banking, April 2011
j. Indonesian Garment Price
Indonesian garment price equation has a high determination coefficient value at
0.889. This demonstrates the high capability of explanatory variables in explaining the
behavior of Indonesia»s garment prices. The variable estimation parameter sign has also
been in line with the expectations. Indonesia»s garment prices can be simultaneously
explained by the ratio of demand for Indonesian garment with Indonesian garment
production lag, lag of world garment prices, world textile price changes, and lag of the
Indonesian garment price.
The only variable that is significantly influential is the lag of Indonesian garment
price. The information of price lag becomes important to set prices in the following year.
Lag of Indonesian garment prices brings a highly significant effect whose coefficient is
positive at 0.861. This means that if the lag of Indonesia»s garment prices rises by 1 000
tons, then Indonesia»s garment prices will increase by 0.8261 thousand tons at the following
year, ceteris paribus.
k. Indonesian Garment Demand
The performance of Indonesian garment demand is explained simultaneously by the
world garment price, the textile price changes in Indonesia, Indonesia»s GDP per capita, the
changes in secondhand garments imports of Indonesia, the world textile trade integration
dummy, and the lag of demand for Indonesian garment. There are three of these five variables
that significantly influence the change in demand for Indonesian garment.
Price is an important factor affecting the dynamics of the demand, which is aligned
with the results of this research. Indonesia»s garment prices bring statistically significant effect
in a negative manner. Meanwhile, based on its elasticity, the short-term elasticity would be at
0.387 percent and at 0.553 percent for the long term. This can be interpreted in particular,
that any increase in the price of Indonesian garment products as much as US$ 10 per ton, it
will lower the demand for Indonesian garment by 3,870 thousand tons in the short term and
by 5,530 thousand tons in the long run, ceteris paribus.
GDP per capita of Indonesia give a noteworthy effect in a unidirectional relationship
with changes in demand for Indonesian garment. If Indonesia»s GDP per capita increased by
Rp. 1 billion, it will stimulate an increase of demand for Indonesian garment products by
0.011 thousand tons, ceteris paribus. The response of Indonesian garment demand to
Indonesia»s GDP per capita is inelastic, both in the short and long term.

379Analysis of The Impact of Macroeconomic Policies On Textile Industry And Its Products In Indonesia
The textile import quota policies are considered discriminative. Traditional markets, such
as those in the United States, Canada, the European Union, Finland, Norway and Turkey limit
the amount of imports coming from Indonesia. Based on the results of the study, it is noted
that when the world textile trade integration is applied, it will increase the demand for Indonesian
garment products by 66,548 thousand tons, ceteris paribus. Also the lag of demand for
Indonesian garment also significantly affects the demand for Indonesian garment the following
year. If the lag of demand for Indonesian garment products increases by 1,000 tons, it will raise
the demand for Indonesian garment the following year by 0.300 thousand tons, ceteris paribus.
l. Indonesian Import Garment
Indonesian garment imports are described by the Indonesian garment import prices (in
rupiah), the changes in world garment prices, the lag of garment import tariffs, the lag of
Indonesian garment production, the lag of Indonesian total population, Indonesia»s GDP ratio
to the lag of Indonesia»s GDP, and the lag of Indonesian garment imports. Among these variables,
the ones with significant effect are the change of world garment prices, the lag of garment
import tariffs, the lag of Indonesian garment production, and the lag of Indonesian garment
imports.
The coefficient of estimation parameter in the world garment price change is at 0.006
toward the opposite direction. This means that with an increase of the world garment prices by
U.S. $ 10 per ton, the Indonesian garment imports will decrease by 0.064 thousand tons,
ceteris paribus. Meanwhile the response of Indonesian garment imports, both in the short and
long term, is inelastic.
The lag of garment import tariffs is affecting Indonesian garment imports toward the
opposite direction. This means an increase of lag garment import tariff by 1 percent, will lower
the Indonesian garment imports by 2,119 thousand tons, ceteris paribus. In both the short and
long term, the Indonesian garment imports are elastic to the lag of garment import tariffs.
The Indonesian garment imports are also influenced by the lag of Indonesian garment
production. Shall the lag of Indonesian garment production increase by 1000 tons, the Indonesian
garment imports will decrease by 0.221 thousand tons, ceteris paribus. The response of
Indonesian garment import to the lag of Indonesian garment production is elastic, both in the
short and long term.
The other variable that is also statistically significant is the lag of Indonesian garment
imports. The coefficient of lag of Indonesia»s garment imports is positive at 0.615. This means

380 Bulletin of Monetary, Economics and Banking, April 2011
that if the lag of Indonesian garment imports increase by 1000 tons, the Indonesian garment
imports the following year will increase by 0.615 thousand tons, ceteris paribus.
4.2. Economic Model Validation of Indonesian Textile and Textile Products
From the 30 equations that form the model, 27 equations have the RMSPE value
below 50 percent, and 1 equation has RMSPE value between 50 to 100 percent, and 2
RMSPE equations have a value above 100 percent. This means that the predicted value can
well follow the historical trend data. Meanwhile based on the U-Theil, 29 equations have a
U-Theil value below 0.20, and there is an equation which has a U-Theil value above 0.20.
This means that the simulation model follow the actual data quite well. Based on all the
above criteria, then the constructed economic model has a sufficient and valid forecasting
ability to perform simulations of macroeconomic policy alternatives via forecasting simulation
(ex-ante).
Table 2.The Impact of Macroeconomic Policies toward the Change of Endogenous Variable
Average Value Year 2007-2012
Endogenous VariablesEndogenous VariablesEndogenous VariablesEndogenous VariablesEndogenous VariablesThe Change by Simulation (%)
Indonesian Textile Production (PTDt) 0.0000 0.1936 -25.4114 -0.2904 -25.4114 12.8267Indonesian Garment Production (PGDt) -0.0049 -0.0018 -12.6301 0.0013 -12.6298 1.5850Indonesian Textile Demand (DTDt) 0.0000 -0.2822 -73.4549 0.3763 -73.4562 0.8467Indonesian Garment Demand (DGDt) 0.0002 0.1286 -0.2371 -0.0917 3.2676 3.4647Indonesian Textile Supply (STDt) 0.0567 -11.9239 -34.3066 12.4333 -34.1153 29.7464Indonesian Garment Supply (SGDt) 0.0002 -63.9076 -18.7352 21.9497 -18.5225 22.4123Indonesian Textiles Price (HTDRt) 0.0000 0.5344 1.8036 -0.6012 1.7368 -1.5364Indonesian Garment Price (HGDRt) 0.0000 -0.7217 1.2831 0.4812 1.4435 0.3208Indonesian Textile Exports (XTIt) 0.0000 6.0591 -8.9655 0.1478 -8.9655 4.9261Indonesian Textile Imports (MTIt) -0.0021 0.1675 0.5522 13.7351 0.7630 13.5237World Textile Price (HTWRt) -0.0580 -2.2042 2.9582 2.0302 2.9582 2.2622World Garment Price (HGWRt) 0.0000 -11.5351 2.4718 0.2168 2.4718 -18.6904Indonesian Garment Exports (XGIt) -0.0032 21.6763 -4.7985 -0.0237 -4.8009 1.5617Indonesian Garment Imports (MGIt) 0.0789 -5.1755 125.1513 179.8909 126.8318 172.2973World Textile Exports (XTWt) 0.0000 0.1970 -0.2845 0.0031 -0.2845 0.8880World Textile Imports (MTWt) 0.0000 0.0304 -0.0138 0.3367 -0.0083 2.1058World Garment Exports (XGWt) 0.0000 0.3160 -0.0683 -0.0020 -0.0683 0.6573World Garment Imports (MGWt) 0.0000 0.0072 0.0018 0.0045 0.0018 0.0573
11111 22222 33333 44444 55555 66666
Description :Simulation 1 : The bank interest rate falls by 5 percent.Simulation 2 : Adjustment of rupiah exchange rate = Rp. 9 000/US $.Simulation 3 : Wages of textile and garments labor rise respectively by 14.5 percent and 15 percent.Simulation 4 : Liberalization of trade.Simulation 5 : Combination 4, Indonesia»s GDP increases by 8 percent, and Indonesia»s population increases by 1.1 percent.Simulation 6 : Combination 3, 5, Indonesia»s GDP increases by 8 percent, Indonesia»s population increases by 1.1 percent,
GDP of USA increases by 3.1 percent, and China»s GDP increases by 8.5 percent.

381Analysis of The Impact of Macroeconomic Policies On Textile Industry And Its Products In Indonesia
4.3. Simulation Result
Table 2 presents the results of simulation of macroeconomic policies on the development
of textile industry in Indonesia.
a. Reduction of Bank Interest Rate
The policy to lower the bank interest rates by 5 percent is one of the monetary policies
that can increase the production of Indonesian textiles. The textile industry is a capital-intensive
industry compared with the garment industry. However, a mere 5 percent of bank interest rate
cut is not used by textile manufacturers in Indonesia to increase textile production. This does
not bring any change to the Indonesian textile exports. Meanwhile, an Indonesian textile import
has declined by 0.002 percent. In total the Indonesian textiles supply increased by 0.057 percent.
While the decline in Indonesian textile supply does not change the price volatility of Indonesian
textiles therefore Indonesian textile demand was also unchanged.
The Indonesia»s garment prices that did not change, as the output price for the garment
industry, contribute in reducing the Indonesian garment production by 0.005 percent. A decline
in garment production will then encourage the reduction in Indonesia»s garment exports by to
0.003 percent. On the other hand garment imports increase by 0.079 percent. In total, the
Indonesian garment supply slightly increases by 0.0002 percent. A decrease in bank rate by 5
percent will less likely motivate the people to save. This makes the demand of garments increase
by 0.0002 percent.
b. Adjustment of Exchange Rate at Rp. 9,000 to US$
The exchange rate that relatively does not fluctuate will assist manufacturers in calculating
and determining the production costs and business risks. Therefore monetary policy is able to
improve the exports of Indonesian textile and garment, respectively by 6.059 percent and 21.676
percent. At the same time this will also increase textile imports by 0.167 percent and reduce
garments imports by 5.175 percent. The total supply of Indonesian textiles and garments
decreased, respectively by 11.924 percent and 63.908 percent.
This declining supply of Indonesian textile will cause textile price to increase by 0.534
percent, so the demand for Indonesian textiles will decline by 0.282 percent. Indonesian
textile price increases in turn will make the Indonesian garment production decreasing by
0.002 percent.

382 Bulletin of Monetary, Economics and Banking, April 2011
The exchange rate adjustment policies also increase the Indonesian garment exports by
to 21,676 percent. Indonesian garment prices decline by 0.722 percent will stimulate even
more the increase in exportation, reduce the Indonesian garment products by to 5.175 percent,
and increase demand for Indonesian garment by 0.129 percent. Additionally the other impact
is the decline in Indonesia»s garment production by 0.002 percent. In total, Indonesian garment
supply decrease by 63.908 percent.
c. Increase of Labor Wage in Textile and Garment Industry
Textile and garment industry employs many workers, especially the female ones. The
policy to increase labor wages in both sectors respectively 14.5 percent and 15 percent will
push down the textile and garment production. Indonesian textile production decreases by
25.411 percent. Indonesian textile exports will be suppressed by 8.965 percent and Indonesian
textile imports will increase by 0.552 percent. In total, Indonesian textile supply decreases by
34.307 percent.
The decline of Indonesian textile supply will raise the Indonesian textiles price by 1.804
percent. The following impact is the decline of demand for Indonesian textiles by 73.455 percent.
The increase of Indonesian textile price will lower the Indonesian garment production by 12.630
percent. Indonesia»s garment exports at the following step will also experience a decline by
4.798 percent. Indonesian garment imports will increase by 125.151 percent, so that in total;
Indonesian garment supply will decline by 18.735 percent.
Besides Indonesian garment prices rises by 1.283 percent, as an indirect result of the
increase of wage labor. Ultimately this will create the demand for Indonesian garments to
decline by 0.237 percent.
d. Liberalization of Textile and Textile Products Trade
Liberalization of trade with the tariff reduction to zero percent as a form of the trading
policy, eventually gives an impact to the increase of Indonesian textile imports by 13,735 percent.
The decline of domestic textile production amounted to 0.290 percent will further increase the
imports. The increase of Indonesian textile imports will increase the Indonesian textile supply by
12.433 percent. It turns out that the increase in the textile supply push down the Indonesian
textile price by 0.601 percent, in which the demand for Indonesian textiles increases by 0.376
percent. The Indonesian textile prices, which also fall, are responded by Indonesian textile exports
which increase by 0.148 percent.

383Analysis of The Impact of Macroeconomic Policies On Textile Industry And Its Products In Indonesia
Garment import tariff reduction to zero percent will increase Indonesian garment imports
by 179.891 percent, so that in total the Indonesian garment supply increases by 21.950 percent.
On the other hand, an Indonesian garment price, which increases by 0.481 percent, causes the
demand Indonesian garment to decrease by 0.092 percent. The increasing price of Indonesian
garment is an incentive for Indonesian garment manufacturers to increase production, amounting
to 0.001 percent. In addition, the rising Indonesian garment prices also encourage the increase
of exports by 0.024 percent of future
e. The Increase of Labor Wage in Textile and Garment Sector, the Increase ofGDP of Indonesia and the Increase of Total Population of Indonesia
The combination of the increased labor wage policy in the textile and garment sector, the
increase of Indonesian GDP by 8 percent, and the demographic policies through the increased
population by 1.1 percent, makes the Indonesian textile production declines by 25.411 percent,
which subsequently encourages the decline in Indonesian textile exports by 8.965 percent. In
addition, Indonesian textile imports increase by 0.763 percent. In total the Indonesian textile
supply decreases by 34.115 percent. The decline of textile supply will increase the price of
Indonesian textiles by 1.737 percent. In turn, these circumstances cause the demand for
Indonesian textiles to decline by 73.456 percent.
The growth of Indonesian GDP and population naturally encourage the increase of demand
for Indonesian garment by 3.268 percent. This situation put Indonesian garment prices to
improve by 1.443 percent. And also, due to the dominating labor wage in the garment sector
in the production costs, the garment industry output price will also increase.
The increase of the Indonesian textile prices as the garment industry input prices can
reduce the production of Indonesian garment products by 12.630 percent. Meanwhile,
Indonesian garment exports show a decline of 4.801 percent. This is because the increasing
domestic garment prices turn out to be appealing for Indonesian garment manufacturer to
work on the Indonesian market. Additionally, Indonesian garment imports rise by 126.832
percent. In total Indonesian garment supply decreases by 18.522 percent
f. The Increase of Fuel Price, the Liberalization of Textile and TextileProducts, the Increase of GDP of Indonesia, USA and China, and the Increaseof Indonesian Population
The fuel price increase policy by 8.5 percent, the trading liberalization, the Indonesian

384 Bulletin of Monetary, Economics and Banking, April 2011
GDP increase by 8 percent, the increase in Indonesian population by 1.1 Percent, the increase
of GDP of the USA and China by respectively 3.1 percent and 8.5 percent are able to raise the
Indonesian textile production, correspondingly 12.827 percent and 1.585 percent. Therefore,
Indonesian textile exports will also increase by 4.926 percent as well as the Indonesian textile
imports by 13.524 percent. So in total the Indonesian textile supplier will increase by 29.746
percent. This situation causes the Indonesian textile price to decrease by 1.536 percent, so that
the demand for domestic textiles increases by 0.847 percent.
The increase in GDP and population of Indonesia will drive the increase of demand for
Indonesian garments by 3.465 percent, so the Indonesian garment prices shall increase by
0.321 percent. Indonesian garment exportation still shows an increase of 1.562 percent as well
as the importation of Indonesian garments at 172.297 percent. In total, the Indonesian garment
supply increases by 22.412 percent.
The increase of GDP of the United States and China would increase the textile imports of
USA by 1.341 percent and of China by 5746 percent. Therefore, the total world textile imports
will increase by 2.106 percent, which in turns the world textile prices will increase by 2.262
percent. This price increase will have an impact to the Indonesian garment price increase. As for
garment products, the increase in GDP of the United States will encourage the increase of
world total garment imports by 0.057 percent. At the end of the increasing world garment
imports have not been able to increase the world garment prices. This is because the world
total exports increase higher than the imports. The world garment price reduction by 18.690
percent will have an impact on Indonesian textile price declines and the increase of Indonesian
garment prices.
4.4. Discussion
The increase in production of textile and garment industry is generally associated with
the increase in employment. While exports of textile and garment industries are associated
with the acquisition of foreign exchange needed to support the Indonesia»s economic
development. Policies that can reduce the production as well as the exports in textile and
garment industry are the policy of the labor wages increase in textile and garment sectors
respectively by 14.5 percent and 15 percent (simulation 3), the trading liberalization, and the
increase in Indonesia»s GDP and population (simulation 5). One of the production cost
components that plays a major role in the sustainability of the textile and garment production
is the labor. Labors that are required, particularly in the garment industry, are that workers with
certain skills without having to possess a high level of education. Therefore, the increase of

385Analysis of The Impact of Macroeconomic Policies On Textile Industry And Its Products In Indonesia
employment in the textile industry can ultimately reduce the number of unemployed in the
community that in fact occurs as a result of the certain limitations to pursue higher education.
The policies to increase the labor costs which is conducted by the government regulation, such
as the increase of regional minimum wage, will eventually stimulate a reduction in production
and exports, and a rationalization of manpower. Liberalization of trade in textiles and garments
which is marked by the elimination of tariffs to zero percent actually tends to increase the
volume of Indonesian textile and garment imports. However on the other side, the Indonesian
textile exports still show an increase, but not with the Indonesian garment exports. This happens
due to the increasing competition among the world»s textile producers, such as China South
Asian countries.
The policies that are only capable to increase production and export in one sector are the
policy of interest rates increase (simulation 1). This policy reduces the production and export of
Indonesian garment and makes the textile production and export stagnant. Textile industry is
one of the high-risk industries, so that the banks are less interested in providing investment
credit. In general, banks only provide short-term loan or credit (90 percent) and medium term
(10 percent) to the textile industry, while the restructuring of the textile industry machinery
requires a long-term loan between 10 to 15 years. The textile industry is more capital intensive
than the garment industry, so that the restructuring problem is more frequent in the textile
industry. The outdated machinery and technologies may affect the productivity of the textile
industry.
The policies that are still capable to increase the production and exports in both sectors
are shown in the simulation 2, which is the monetary policy through the adjustment of the
Rupiah against US$, and simulation 6, which is a combination of wage policy, liberalization,
and increase of GDP of Indonesia and some developed countries. Since Indonesia adopts the
floating exchange rate regime, the rupiah exchange rate value fluctuates over time. Nevertheless,
the Bank Indonesia still can intervene to stabilize it using the monetary policy instrument. A
stable rupiah will help exporters and importers in calculating and predicting the costs and as
well as future profits.
V. CONCLUSION
The factors that influence the development of Indonesian textile and textile products
industry is as follows:
1. Indonesian textile production is influenced in a negative manner by the lag of world cotton
price and the lag change in labor of the textile sector. Indonesian garment production is

386 Bulletin of Monetary, Economics and Banking, April 2011
influenced by the lag of labor wage in the garment sector.
2. Indonesian textile exports to the world markets are elastic in the long run towards the
changes of Indonesian textile prices. Meanwhile, Indonesian garment exports in the world
markets are affected by the lag of exchange rate against US$.
3. The demand for Indonesian textiles has an elastic response to the lag of labor wage of the
textile sector, and the demand for Indonesian garment is influenced in a positive direction
by the income per capita of Indonesian population of Indonesia.
Based on the conducted policy simulations, it can be concluded that:
1. The policies that can increase the production and exports in textile and garment industry are
(1) the single policy through the adjustment of the rupiah exchange rate against US$ and
(2) the combination of policies to raise the wages, trade liberalization policies, and the
increase of GDP of Indonesian some other developed countries as a potential form of the
world textile market.
2. The policies that reduce the production and export in the textile and garment industry are
(1) the single policy through the increase of labor wage in the textile and garment industry
and (2) the combination of the increase of the labor wage in the textile and garment industry,
the increase in GDP of Indonesia, and the demographic policies through Indonesia»s
population growth.
Overall from the estimation result, of this parameter coefficient and the policy simulations,
shows an increase in the interest rates for investment activities, fuel, and also the labor wage in
the textile and garment sector, which at the same time can reduce the domestic production of
textiles and garments in the future. World cotton prices also affect the decline in Indonesian
textile and garment exports. Meanwhile the exchange rate adjustment will encourage an increase
of Indonesian textiles and garments exports in the period of 2007 to 2012.
This conclusion provides some implications as follows:
1. The increasing production of the Indonesian textile industry may encourage further
employment. Therefore economic incentives are necessary, among which is the reduction
of banking interest rates for investment.
2. The increasing Indonesian textile exports may improve the revenue of the country. The
increasing exports of textiles and clothing can be triggered by the exchange rate adjustments
at Rp 9000/US$. The relatively stable exchange rate of Rp/US$ would help textile
manufacturers in calculating the cost of raw materials and profits.
3. The development of cotton plantation, as one of the main raw material, needs to be realized.
A very high dependence on cotton imports can threaten the Indonesian textile competitiveness
in the world markets.

387Analysis of The Impact of Macroeconomic Policies On Textile Industry And Its Products In Indonesia
REFERENCES
Agustineu, S. DAgustineu, S. DAgustineu, S. DAgustineu, S. DAgustineu, S. D. 2004. Analisis Faktor-Faktor yang Mempengaruhi Output Industri Tekstil di
Jawa Barat. Undergraduate Thesis. Faculty of Economy and Management., Bogor.
BPSBPSBPSBPSBPS. 2009. Statistik Indonesia 2008. Badan Pusat Statistik, Jakarta.
. 2010. Indikator Ekonomi, Buletin Statistik Bulanan. Badan Pusat Statistik, Jakarta.
CICCICCICCICCIC. 2004, Prospek Industri Garmen Indonesia. Indocommercial, No. 350. PT. Capicorn Indonesia
Consultant, Inc, Jakarta.
Dunn, R. M. Jr. Dunn, R. M. Jr. Dunn, R. M. Jr. Dunn, R. M. Jr. Dunn, R. M. Jr. and J. H. Mutti J. H. Mutti J. H. Mutti J. H. Mutti J. H. Mutti. 2004. International Economics. Sixth Edition. Routledge Tailor
and Francis Group, London.
Gonarsyah, IGonarsyah, IGonarsyah, IGonarsyah, IGonarsyah, I. 1987. Landasan Perdagangan Internasional. Department of Socail Sciences and
Agricultural Economy.. Institut Pertanian Bogor, Bogor.
Henderson, J. MHenderson, J. MHenderson, J. MHenderson, J. MHenderson, J. M. and R. E. QuandtR. E. QuandtR. E. QuandtR. E. QuandtR. E. Quandt. 1980. Microeconomic Theory, A Mathematical Approach.
McGraw Hill International Book Company, London.
Houck, J. PHouck, J. PHouck, J. PHouck, J. PHouck, J. P. 1986. Elements of Agricultural Trade Policies. MacMillan Publishing Company, New
York.
Istojo, DIstojo, DIstojo, DIstojo, DIstojo, D. 2002. Analisis Struktur Industri Tekstil dan Produk Tekstil Indonesia terhadap WTO
2005. Thesis of Management Master. Graduate Program of Universitas Gadjah Mada,
Yogyakarta.
Koutsoyiannis, AKoutsoyiannis, AKoutsoyiannis, AKoutsoyiannis, AKoutsoyiannis, A. 1978. Theory of Econometrics: An Introductory Exposition of Econometrics
Methods. Second Edition. Harper & Row Publishers, Inc., Barner & Noble Import Division,
New York.
Krantz, OKrantz, OKrantz, OKrantz, OKrantz, O., 2006, ≈Small European Countries in Economic Internationalisation: An Economic
Historical Perspektive∆. Umea Universitet, Umea-Swedia. Umea Papers in Economic History.
Mlachila, MMlachila, MMlachila, MMlachila, MMlachila, M. and Y. YangY. YangY. YangY. YangY. Yang, 2004, ≈The End of Textiles Quotas: A Case Study of the Impact of
Bangladesh∆. International Monetary Fund, Washington DC. IMF Working Paper No. 04/
108.
PRBPRBPRBPRBPRB. 2009. World Population Data Sheet 2009. Population Reference Bureau and USAID,
Washington DC.
Pracoyo, APracoyo, APracoyo, APracoyo, APracoyo, A. 1995. Pengaruh GATT terhadap Perekonomian Indonesia, Studi Kasus Ekspor Industri
Tekstil. Thesis of Master of Management. The Graduate Program, Universitas Gadjah Mada,
Yogyakarta.

388 Bulletin of Monetary, Economics and Banking, April 2011
Sinaga, B. MSinaga, B. MSinaga, B. MSinaga, B. MSinaga, B. M. 1989. Econometric Model of the Indonesian Hardwood Products Industry: A
Policy Simulation Analysis. PhD, Dissertation. University of The Philippines, Los Banos.
Sunarno, SSunarno, SSunarno, SSunarno, SSunarno, S. 2008. ASEAN, Basis Produksi TPT Dunia. Indonesian Textile Serial Online. http://
indonesiatextile.com/index.php?option=com_content& task=view&id=73&Itemid=50.
Accessed at 17 Maret 2010.
. 2008 Amankan Pasar Dalam Negeri. Indonesia Textile Serial Online. http://
indonesiatextile.com/index.php?option=com_content&task =view&id=76&Itemid=50,
Accessed at 17 Maret 2010.
Thoburn, JThoburn, JThoburn, JThoburn, JThoburn, J., 2010, ≈The Impact of World Recession on the Textile and Garment Industries of
Asia∆. United Nations Industrial Development Organization, Vienna. Working Paper No. 17.
UNCTADUNCTADUNCTADUNCTADUNCTAD. 2005. TNCs and the Removal of Textiles and Clothing Quotas. United Nations
Conference on Trade and Development, Geneva.
VBNVBNVBNVBNVBN. 2011. Vietnam Textile and Garment Export Cross $ 11.2 Biliion in 2010. Vitenam Business
News. Serial Online, http://vietnambusiness.asia/vietnam-textile-and-garment-exports-cross-
11-2b-in-2010/. Accessed at 10 Januari 2011.
WintalaWintalaWintalaWintalaWintala. 1999. Analisis Faktor-Faktor yang Mempengaruhi Ekspor Tekstil Indonesia: Ke Amerika
Serikat, Inggris dan Jepang Tahun 1978-1997. Thesis of Master of Management. The
Graduate Program, Universitas Gadjah Mada, Yogyakarta.
WTOWTOWTOWTOWTO. 2005. International Trade Statistics 2005. World Trade Organization, Geneva.

389Analysis of The Impact of Macroeconomic Policies On Textile Industry And Its Products In Indonesia
Appendix
PTDt : The domestic textil production at the year t (1 000 ton)
PTDt-1 : The domestic textil production at the year t-1 (1 000 ton)
PGDt : The domestic garment production at the year t (1000 ton)
PGDt-1 : The domestic garment production at the year t-1 (1000 ton)
HTDRt : Real price of domestic textil at the year t (USD/ton)
HTDRt-1 : Real price of domestic textil at the year t-1 (USD/ton)
HCWRt-1 : Real price of the world cotton at the year t-1 (cent/pound)
HTWRt : Real price of the world textile at the year t (USD/ton)
HTWRt-1 : Real price of the world textile at the year t-1 (USD/ton)
HMTIRt-1 : Indonesian textile import price at the year t-1 (USD/ton)
HGDRt : Real price of domestic garment at the year t (USD/ton)
HGDRt-1 : Real price of domestic garment at the year t-1 (USD/ton)
HGWRt : Real price of world garment at the year t (USD/ton)
HGWRt-1 : Real price of world garment at the year t-1 (USD/ton)
HMGIRt : Real price of Indonesian garment imports at the year t (USD/ton)
IRRt : Bank real exchange rate at the year t (%/tahun)
IRRt-1 : Bank real exchange rate at the year t-1 (%/tahun)
UTKTRt-1 : Real wage of textile industry labors at the year t-1 (Rp juta)
UTKGRt-1 : Real wage of industrial labors at the year t-1 (1 000 Rp)
BBMRt : Real fuel price at the year t (Rp/liter)
BBMRt-1 : Real fuel price at the year t-1 (Rp/liter)
T : Time trend
XTIt : Indonesian textile exports at the year t (1 000 ton)
XTIt-1 : Indonesian textile exports at the year t-1 (1 000 ton)
XGIt : Indonesian garment exports at the year t (1 000 ton)
XGIt-1 : Indonesian garment exports at the year t t-1(1 000 ton)
ERIRt : Real IDR exchange rate against USD at the year t (Rp/USD)
ERIRt-1 : Real IDR exchange rate against USD at the year t-1 (Rp/USD)
DKG : Integration dummy of world textile trading
STDt : Domestic textile supply at the year t (1 000 ton)
SGDt : Domestic garment supply at the year t (1 000 ton)
MTIt : Indonesian textile imports at the year t (1 000 ton)
MTIt-1 : Indonesian textile imports at the year t-1 (1000 ton)
MGIt : Indonesian garment imports at the year t (1 000 ton)
Table 1.Notes of the Endogenous and Exogenous Variables employed in the model

390 Bulletin of Monetary, Economics and Banking, April 2011
MGIt-1 : Indonesian garment imports at the year t-1 (1 000 ton)
DTDt : Domestic textile demand at the year t (1 000 ton)
DTDt-1 : Domestic textile demand at the year t-1 (1000 ton)
DGDt : Domestic garment demand at the year t (1000 ton)
DGDt-1 : Domestic garment demand at the year t-1 (1 000 ton)
TFTt-1 : Textile import tariff at the year t-1 (%/year)
TFGt : Garment import tariff at the year t (%/year)
GDPIRt : Real GDP of Indonesia at the year t (Rp 1000)
GDPIRt-1 : Real GDP of Indonesia at the year t-1 (Rp 1000)
POPIt : Population of Indonesia at the year t (million people)
POPt-1 : Population of Indonesia at the year t-1 (million people)
MGBt : Second-hand garment import at the year t (1 000 ton)
MGBt-1 : Second-hand garment import at the year t-1 (1 000 ton)
XTWt : World textile exports at the year t (USD/ton)
MTWt : World textile imports at the year t (1 000 ton)
MTWt-1 : World textile imports at the year t-1 (USD/ton)
XTGt : Textile exports of Germany at the year t (1 000 ton)
XTAt : Textile exports of the USA at the year t (1 000 ton)
XTCt : Textile exports of China at the year t (1 000 ton)
XTRt : Remaining of world textile exports at the year t (1 000 ton)
MTLt : Textile imports of Italy at the year t (1 000 ton)
MTAt : Textile imports of the USA at the year t (1 000 ton)
MTCt : Textile imports of China at the year t (1 000 ton)
XGWt : World garment exports at the year t (1 000 ton)
MGWt-1 : World garment imports at the year t-1 (1 000 ton)
XGWt : World garment exports at the year t (1 000 ton)
MGWt : World garment imports at the year t (1 000 ton)
MGWt-1 : World garment imports at the year t-1 (1 000 ton)
XGCt : Garment exports of China at the year t (1 000 ton)
XGTt : Garment exports of Turkey at the year t (1 000 ton)
XGRt : Remaining of world garment exports at the year t (1 000 ton)
MGGt : Garment imports of Germany at the year t (1 000 ton)
MGAt : Garment imports of the USA at the year t (1 000 ton)
MGJt : Garment imports of Japan at the year t (1 000 ton)
MGRt : Remaining of world garment imports at the year t (1 000 ton)
Table 1.Notes of the Endogenous and Exogenous Variables employed in the model