China’s Macroeconomic Analysis & Forecasting:
81
1 China’s Macroeconomic Analysis & Forecasting: 2010-2011 ------China Economy under the Impact of Recycling Liquidity and Neo-Planning Effect Abstract China’s economy has been on the track of steady recovery, owing to the combined impacts of the previous stimulating policies, the rebounding improvement of the external environment, the ongoing consumption boom, and the rising market demands. The economic recovery shows three characteristics: 1) the real economy has been gradually moving downward from the initial high level to the more stable, though the moving rates reflected in the various indicators are far lower than expected. The forces for the economy stabilization have emerged in many aspects, and the basis of the economic recovery has been further solidified. Overall, the development of the real economy has been into the normal zone; 2) while the real economy is still recovering and a rapid growth is yet to come, the continued rising prices induced by the economic bubble- spreading suggests that China has come into the adjustment phase of ―inflation prevention‖ earlier than expected; 3) the dynamic mechanism of China’s economic growth has undergone a great transformation. Specifically, the market demand began to partly alleviate the impact due to the exit of the stimulating policies; the continuous increase of the export and the consumption filled the gap left by the decreasing investment; the increasingly rapid growth in the central and western regions offset the stagnation in the eastern regions; the lasting investment boom in the real estate sector made up for the investment decline in the manufacturing and the infrastructure. In other words, a transformation of the dynamic growth mechanism and a diversification of the growth poles are being effective in all aspects. 2011, for China, is a year with a great extent of complexity, though the overall economy will be relatively stable. The complexity is reflected in the two opposite clusters of the concurrent forces, which intertwine with each other in terms of influencing the whole economy. To be more specific: 1) Leading the forces which stabilize the economy, ―recycling liquidity‖ will become the core of the economic adjustments, under the governmental regulation principle of ―inflation prevention‖; 2) The consistent and increasingly strengthening regulations on the real estate sector will lead to some substantial adjustments on the sales and the prices of the real estates, as well as the investment on them. As a result, the short-termed soft landing of the real estate industry is likely to induce the strengthening of the forces which stabilize the whole economy; 3) The slowdown of the recovering pace, remaining high unemployment and continuous trade imbalance in developed countries, among other reasons, will worsen China’ external environment. In addition, the conflicts on commodity trade and exchange rates and the fluctuation of the currencies will be even worse, and put more pressure on China’s economy; 4) Nevertheless, 2011 is the first year for China’s Twelfth Five-year State Plan on economic and social development. The new plan incubates the strategic revitalization plan for the emerging industries, the regional development plan, the people’s well-being project, the income- multiplying plan, and some new consumption stimulating policies. All of these policies will bring about strong economic stimulating effects, effectively offsetting various inhibitive pressures; 5) the speeding-up of urbanization, the forthcoming of ―the era of high-speed railway‖,
Transcript of China’s Macroeconomic Analysis & Forecasting:

1
China’s Macroeconomic Analysis & Forecasting:
2010-2011 ------China Economy under the Impact of Recycling Liquidity and
Neo-Planning Effect
Abstract
China’s economy has been on the track of steady recovery, owing to the combined impacts
of the previous stimulating policies, the rebounding improvement of the external environment,
the ongoing consumption boom, and the rising market demands. The economic recovery shows
three characteristics: 1) the real economy has been gradually moving downward from the initial
high level to the more stable, though the moving rates reflected in the various indicators are far
lower than expected. The forces for the economy stabilization have emerged in many aspects,
and the basis of the economic recovery has been further solidified. Overall, the development of
the real economy has been into the normal zone; 2) while the real economy is still recovering and
a rapid growth is yet to come, the continued rising prices induced by the economic bubble-
spreading suggests that China has come into the adjustment phase of ―inflation prevention‖
earlier than expected; 3) the dynamic mechanism of China’s economic growth has undergone a
great transformation. Specifically, the market demand began to partly alleviate the impact due to
the exit of the stimulating policies; the continuous increase of the export and the consumption
filled the gap left by the decreasing investment; the increasingly rapid growth in the central and
western regions offset the stagnation in the eastern regions; the lasting investment boom in the
real estate sector made up for the investment decline in the manufacturing and the infrastructure.
In other words, a transformation of the dynamic growth mechanism and a diversification of the
growth poles are being effective in all aspects.
2011, for China, is a year with a great extent of complexity, though the overall economy will
be relatively stable. The complexity is reflected in the two opposite clusters of the concurrent
forces, which intertwine with each other in terms of influencing the whole economy. To be more
specific: 1) Leading the forces which stabilize the economy, ―recycling liquidity‖ will become
the core of the economic adjustments, under the governmental regulation principle of ―inflation
prevention‖; 2) The consistent and increasingly strengthening regulations on the real estate sector
will lead to some substantial adjustments on the sales and the prices of the real estates, as well as
the investment on them. As a result, the short-termed soft landing of the real estate industry is
likely to induce the strengthening of the forces which stabilize the whole economy; 3) The
slowdown of the recovering pace, remaining high unemployment and continuous trade
imbalance in developed countries, among other reasons, will worsen China’ external
environment. In addition, the conflicts on commodity trade and exchange rates and the
fluctuation of the currencies will be even worse, and put more pressure on China’s economy; 4)
Nevertheless, 2011 is the first year for China’s Twelfth Five-year State Plan on economic and
social development. The new plan incubates the strategic revitalization plan for the emerging
industries, the regional development plan, the people’s well-being project, the income-
multiplying plan, and some new consumption stimulating policies. All of these policies will
bring about strong economic stimulating effects, effectively offsetting various inhibitive
pressures; 5) the speeding-up of urbanization, the forthcoming of ―the era of high-speed railway‖,

2
and the plateau effect of income and consumption will be the crucial forces for the economic
stability in 2011. Nevertheless, the release of these forces also has some great uncertainty.
The stability of China’s economy reflects as follows: 1) the inhibitive forces will offset the
promoting forces, resulting in less fluctuations throughout the whole year; 2) Still much room
exists for the policy adjustment, particularly for the fiscal policy adjustment, so as to effectively
control the economic slowdown; 3) the endogenous growth mechanism has formed, and the
market demand has started off. The capability of the market entities to anticipate and resist the
fluctuations has been strengthened. Thus, their self adjustment will be able to buffer against
various exogenous shocks.
We built CMAFM to estimate China’s economy in 2010 and 2011 respectively. Based upon
the model, the major predictions are as follows:
1) GDP in 2010 increased 10.1%, 1 per cent higher than in 2009. That is to say, the economy
significantly rebounded from that in 2009. In 2011 the increasing rate of GDP is expected to
reach 9.6%, showing a tendency of the stable growth.
2) The fixed asset investment in 2010 increased at rate of 23.1%, and is expected to be
22.5% in 2011.
3) The nominal increasing rate of the total consumer goods in 2010 is 18.3%, whose
contribution rate to the GDP, 55.4%, at first time exceeded that of the total investment. In 2011
the nominal increasing rate will be 17.8%, and the actual rate will be equivalent to that in 2010,
and the rate of contribution to the GDP will once again exceed that of the total investment. China
has stepped into the era pulled by consumption.
4) The total volume of trade in 2010 increased 32.4%. More specifically, the increasing rate
of import is 36.1% and that of export, 29.3%. The total trade surplus is 184 billion US dollars,
5.9% less than in 2009. Price-related factors being considered, the calculated contribution of the
international demand to GDP increase is Zero, improved in comparison with the negative
contribution rate in 2009. In 2011, the increasing rate of China’s total trade volume is expected
to slow down, 10% less than in 2010. And the increasing rates of export and import are to be
21.8% and 25.6% respectively. The trade surplus is estimated to be 181 billion US dollars, 1.9%
less than in 2010. Overall, China trade has come into the phase of ―externally rebalancing and
readjustment‖ under the basis of normalization.
5) Due to the inertia effect of the credit, the total credit in 2010 will exceed 7.5 trillion. The
increase rate of M1 is 19.3%, and the rate of M2 is 18.1%, both being slightly higher than the
planned targets. The liquidity is still ample. 2011 is the year of ―recycling liquidity‖. The total

3
credit will be between the ranges from 7 to 7.5 trillion. The increasing rate of M1 and M2 will be
even slowdown, and gradually back to the normal level at 16.9% and 17% respectively.
6) In 2010, the economy rebounded, the productivity had a surplus, the prices were
increasingly getting higher, the liquidity was ample, the international prices for bulk
commodities rose again, and the supply-demand situations of some agricultural products were
getting worse. Under the combined impacts of the above factors, the total price level of the
whole year rose to a great extent, with the estimated CPI in 2010 to be 3.2% and the GDP
deflator to be 3.7%. In 2011, the price level is expected to be fallen slightly; the CPI is estimated
to be 3.0%. In future, 3% of the CPI increasing rate is likely to be normal and mid-termed.
Nevertheless, China does not have the problem of any stagflation.
The main policy suggestions include:
1) The critical part of the economic adjustment in 2011 should be price regulation, plan
enforcement and recovery stabilization.
2) To regulate the spreading of the economic bubbles and the continuous rising of the prices,
the policy of recycling liquidity is the major measure to be taken. Some additional actions may
also include, but not limited to, the governance of the market rules, stabilizing the supply and
demand through different channels, tolerating the moderate price-releasing, the expected
instruction, and so forth. In 2011, the current moderately easy monetary policy should be
switched to neutral-positioned. It is suggested that the increasing rate of M2 be no more than
17%, and the new incremental credit maintained at the size of 7 to 7.5 trillion. In order to achieve
the goal, the central bank may keep around 150 -200 base points of the deposit-reserve ratio and
increase the interest rate moderately at the same time.
3) The regulation on the real estate sector should be persisted. In the short term, the policy
may be focused on the control of the financial flow; whereas in the mid-term the supply
increasing and the mechanism development shall be the essential strategy. Meanwhile, it is
necessary to pay high attention to the variations of the financing chains of the real estate
companies and the adjustment of the path and depth of the future real estates market.
4) To match up with the Twelfth Five-year State Plan, the fiscal policy shall, in contrast
with the generally prudent monetary policy, remain proactive in terms of the total volume. In
2011, the fiscal deficit may be expanded according to the demand. And the major deficit may be
accounted for by the local governmental bonds, on the basis of broadening the local
governments’ authority on bond issuance. The suggestive total volume will be around 0.4 trillion.
As for the future reform, tax reduction and the transformation of the taxation system should be
equally emphasized and enforced.
5) The consumer policy should be focused on the long-term institutional adjustment rather
than the transient stimulations. Income-Multiplying plan should be started off, and the
infrastructure for the low-income consumer groups may as well be actively constructed. The
tools such as some tariffs and special territories for the consumption may be used to promote the
localization of the high-end consumption in China. Moreover, the construction for the civil
transportation infrastructure should also be accelerated to dilute the dominant role of the
automobile sector in the total consumption.
Key words: recycling liquidity; neo-planning effect; China economy

4
Part I The Overall Judement and Prediction
In 2010,China’s economy was back on the track of the steady recovery, owing to the
combined impacts of the previous policy stimulus, the improving external environment, the
ongoing consumption boom, and the rising market demands. The economic recovery achieved
was beyond expectation, reflected in the GDP growth maintained at a stable level, bubbles
spreading and prices going up quarterly, employment situation reverted, and the foreign demand
reduced to normal.
a).In a dynamic developing tendency, the following phenomenon have been witnessed in
China economy: the policy stimulus gradually exited; the new regulations on the real estate
sector were tightened; the local investment and financing tools were checked and sorted; the
structural adjustment was enhanced; the inventory cycle in China was lowered together with
those in the developed countries; the driving forces for the developed economies to recover were
slowing down; and the base effect emerged. As a result, in 2010 China’s economy grew rapidly
earlier and then slowed down later. Nevertheless, the drop of the indices is far slower than
expected. The tendency to the economy stabilization has fully emerged and the foundation for
the economic recovery been further solidified.
b) While the steady recovery of the real economy is yet to come, the continuous rising
prices elicited by the widespread economic bubbles imply that in prevent of the inflation, China
has entered into an adjustment phase, earlier than expected.
c) Although the monetary policies have started to be reverted, the liquidity surplus is still
serious. The real estate prices are rising too fast, unable to be fully controlled. At the meantime,
the transfer and release of the liquidity directly resulted in the going-up prices of many
agricultural products, influenced by the multiple factors intertwined, including the financial
speculation, worsening of the demand-supply relations for some agricultural products, and the
fluctuation of the international food market. The widespread bubble economy brings a great
shock to the whole economy.
d) In 2010, the mechanism of the driving forces for China’s economic growth changed
enormously:the market demand began to partly make up for the exit of the policy stimulus; the
consistent high volume of the export and the consumption filled the gap left by the declined
investment; the continuous rising of the real estate investment compensated the investment
decline in the manufacturing and the infrastructure. All of these will lead to the transformation of
the growth mechanism, the stabilization of the economic growth beyond expectation, and the
diversification of the growth poles for China’s economy in 2011.
e) The unemployment of the rural migrant workers is worsen by the shortage of labors, the
bursting-out of workers’ strikes, and the rapid salary-raise in the foreign owned enterprises,
suggesting the emerge of a structural turning point in China’s labor market. The Lewis Turning

5
Point indicates that the system of the wage composition for Chinese rural migrant workers is
evolving from the traditional living-cost-based pricing to the collective bargaining of labor
market pricing. More importantly, it declares a full kickoff for the market-oriented structural
adjustment in China.
In 2011, the economy will remain in the developing track in 2010. At the meantime, some
new factors will also play roles, such as the overall direction reversion of the monetary policies,
the variation of exterior environment, the start-off of the Twelfth Five-year plan, and so forth.
Thus, China’s economy in 2011 will be developed in a way of complexity as well as of
steadiness accordingly.
a) The main theme of the governmental monetary policy will be preventing the inflation.
Liquidity recycling will be the central issues of the economic regulation, which may chiefly
restrain the inflation in 2011.
b) The continuity and reinforcement of the real estate policies will account for the main
restraint for real states sales and investment, as well as for their prices. The soft landing of the
real estate sector may further strengthen the downward impact for China’s economic growth.
c) The external environment will be even worse in terms of the slowing-down of the
economic recovery, the continued high unemployment rate, and the trade imbalances in the
developed countries. All of these will give more pressure on china’s economy, resulting in the
export decrease, the exchange rate fluctuation, and the large sum of capital passing-in-and-out.
Meanwhile, the policies on trade, exchange rates, and the currency will face the new challenges.
Under the shock of the reevaluation expectation and the international capital flow, China’s
monetary and exchange rates policies will be once again in the serious conflicts, and the
deflation expectation and the accommodative monetary policies in the developed countries will
greatly restrain the adjustment effectiveness for China’s economic policies.
d) Nonetheless, 2011 is the beginning year for the Twelfth Five-year Plan, in which many
new consumption policy stimulus are incubated, including the strategic emerging industries
revitalization plan, the regional development plans, the people’s well-being engineering, the
income multiplying plan, and so forth. The contents of these new plans will bring strong
economic stimulus, effectively offsetting the downward pressures.
e) The speed-up of urbanization, the coming of the high-speed railway era, and the step
effect of income-consumption will become the dominant forces for stabilizing the economy in
2011.
Based upon the above judgment and predictions, we set the following main exogenous
parameters: (1) the central fiscal budget deficit in 2011 is 475 billion Yuan(RMB);(2) the
average exchange rate of Renminbi to US Dollar in 2011 is 6.40:1. According to CMAFM

6
Model, we have predicted China’s economic situation in 2010 and in 2011 respectively. And the
estimation results of the main indicators are as follows:
a) The GDP growth in 2010 reaches 10.1%, one per cent higher than in 2009, demonstrating
the obvious economic recovery in 2010.The essential reasons for the recovery are that the growth
rates of the primary industry and of the second industry are raised by 1.4% and 0.6% respectively.
To be specific, the portion of the second industry in GDP increased one percent than in the same
time of 2009, and 2.1 percent than in 2003.In other words, the economic growth in China
returned to the heavy industry-driven pattern as before crisis. From the dynamic viewpoint, the
GDP growth in 2010 actually slowed down from quarter to quarter. More specifically, the
growth in the fourth quarter dropped to 9%, 2.9% slower than that in the first quarter.
The drop tendency will continue until the second quarter of 2011, and then recover in the
third quarter 2011. The estimated GDP growth in 2011 will be 9.6%, a relatively steady growth.
b) The growth rate of the fixed assets investment in 2011 is 23.1%. The nominal rate
dropped 7 per cent from that in 2009, without taken the price factor in consideration; and the real
rate dropped 11 percent, the price factor deducted. Its contribution to GDP dropped to 44.6%, for
the first time lower than 50%.
In 2011, influenced by many upward and downward driving forces intertwined, the fixed
assets growth rate will further drop, and on average be only 22.5% the whole year.
c) The growth rate of the nominal retail price of the total consumption in 2010 will reach
18.3%, 2.8% higher than in 2009, the price factor deducted. The real growth rate slightly
dropped, but its contribution to GDP reached 55.4%, exceeding that of investment for the first
time.
In 2011, the consumption will keep on the relatively high growth rate, thanks to the various
stimulating policies, the income adjustment, and some other societal factors. The nominal rate
will be 17.8%, with the real rate being the same level as in 2010. Its contribution rate to GDP
growth will exceed that of the investment again, indicating that China has begun to step into the
consumption-pulled era.

7
d) The total trade volume in 2010 significantly grows, 32.4% higher than in 2009. Among
the growth, the import increase by 36.1% and the export increase by 29.3%. The total trade
surplus is 184 billion US dollars, decreased by 5.9% than in 2009. Price factor considered, the
calculated contribution from the exterior demand to GDP growth is zero, improved compared
with its negative contribution in 2009.
Since the slowing down of the economic recovery in the developed countries, the
international trade conflicts, and the worsening of the exchange rate conflict, to name a few, the
growth of the total trade volume in 2011 will drop to 22.4%, 10% percent lower than in 2010.
Among them, the export growth rate will be 21.8%, the import growth rate 25.6%; and the trade
surplus will be 181.1 billion US dollars, 1.9% lower than in 2010. Therefore, China’s trade
begins to enter into the exterior rebalancing adjustment stage, under the basis of normalization.
e) Owing to the inertia effect of the credit terms, the total credit volumes in 2010 will be
over 7.5 trillion. The growth rate of M1 will be 19.3%, and that of M2 18.1%, slightly higher
than planned. The liquidity is still abundant.
2011 will be the year of liquidity recycling. The total credit will be in the range from 7 to
7.5 trillion. The growth rates of M1 and M2 in 2011 will further drop and is estimated to be
16.9% and 17% respectively, gradually to the normal level.
f) In 2010, the total price level had a substantial rise, impacted by the economic rebounding,
the production capacity surplus, the sharp price increase lately, the abundant liquidity, the price
rebounding for the international bulk commodities, and the worsening of the supply-demand
relations for a few agricultural products. Under the comprehensive impacts of these factors, the
CPI for the whole year is estimated to be 3.2%, and the implicit GDP deflator to be 3.7%, raised
by 3.9% and 6.1% respectively, compared with those in 2009.
In 2011, due to the adjustment of the monetary policies and the downturn of the general
economy, the price level will drop slightly. The estimated CPI is 3.0%, which may remain in the
normal level in near future. Nonetheless, China does not have the problem of stagflation. The
indices such as the output gap suggest that in 2010 China’s real GDP growth rate and its absolute
level are basically equal to the level of the potential outputs. China’s economy is still within the
range of the equilibrium between the total supply and the total demand.
8
Sheet 1 The predictive indices for China’s economy in 2010 and 2011
Predictors 2010 2011
1.GDP Real Growth(%) 10.1 9.6
including:The Primary Industrial VA 4.1 4.2
The Second Industrial VA 11.3 10.5
Third Industrial VA 10.1 9.9
2.Total Investment in Fixed Assets(.1 Billon) 276481 341441
(Nominal Growth) (23.1%) (22.5%)
Total Retail Sales of Consumer Goods(.1 Billon) 156958 184897
(Nominal Growth) (18.3%) (17.8%)
3.Export(.1 Billon USD) 15537 18924
(Nominal Growth) (29.3%) (21.8%)
Import(.1 Billon USD) 13691 17113
(Nominal Growth) (36.1%) (25.6%)
4.Growth of M1 Supply(%) 19.3 16.9
Growth of M2 Supply(%) 18.1 17.0
5.Growth of Consumer Price Index(%) 3.2 3.0
Growth of GDP Deflator (%) 3.7 3.5
Estimated in Nov., 2010

9
Part II The general economic situation in 2010
I Stabilizing and normalizing the real economy
In 2010, according to the year-on-year growth of the various indices on the real economy,
China’s economy tends to remain in the high level earlier this year and then drop sharply later in
the year, although the drop is much smaller than expected and the normal growth rate gradually
emerges. Based upon the various chain indices and the data of the output gap, China’s real
economy tends to be strongly stabilized, with the downward forces gradually weakening in the
4th
quarter, and the constant recovery of the real economy further solidified. In consideration of
the comparisons of the various parameters with before and after, China’ real economy has made
up for the gap due to the recent economic decline, and successfully achieved the recovering
growth, and now is stepping into the path of the normal growth.
a) The GDP growth is fast earlier in the year and then slows down later, showing the V-
shaped chained-adjustment pattern. In 2010, the GDP year-on-year growth continuously decline
slightly, from 11.9% in the first quarter to 9% in the 4th
quarter. Nevertheless, according to the
chain index adjusted by the quarters, in 2010 China’s economy declines, after the continuous
recovery in 2009, through the 3rd
quarter, and then rebounded in the 4th
quarter, showing a V-
shaped adjustment pattern, which suggests a tendency of stabilization in the near future. In the
chain tendency graph (see Fig 1), China’s economy, from the 4th
quarter 2008 through the 4th
quarter 2010, still remained in the path of the continuous recovery.
Fig.1 China’s economic growth declined year on year, and was adjusted in a V-shape

10
b) The output gap was narrowed and the total supply and demand tended to be balanced.
From the aspect of the output gap, after the gap was quickly narrowed in 2009, the 2010 output
level were basically balanced compared with the potential output level, and the capacity
utilization is in the normal range. Specifically, in the 1st quarter a positive gap (0.05%) appeared,
in the 2nd
and 3rd quarters the data had some drops, and in the 4th
quarter was around zero, which
indicated that China economy was relatively balanced between the total supply and the total
demand. In other words, China economy has got out of the depression and is being steadily
recovered, though not yet entering into the phase of the stable expansion (see Fig 2).
Fig.2 China’s output gap has stepped into the basically balanced range.
-.03
-.02
-.01
.00
.01
.02
.03
92 94 96 98 00 02 04 06 08 10
c) The industrial added value changed in parallel with GDP. Under the impacts of the exit of
stimulating policies, energy saving and emission reduction, the adjustment of the inventory cycle,
and some other factors, the year-on-year growth of the industrial added value in 2010 was fast at
the beginning and then slow down later in the year, with the month-on-month growth dropping
up to 5 percent. However, the chain growth rate in 2009 appeared a V-shaped adjustment pattern,
falling down in the 2nd and 3rd quarters, yet rebounding in the 4th quarter. The pattern mainly
owed to the recovering of the business in the light industries, the foreign-funded enterprise, and
the private owned entities. As a result, the declining rate of the year-on-year growth is narrowed,
and tended to be normalized. (see Fig 3 )
Fig. 3 The year-on-year growth of the industrial VA in a first-high-then-low pattern and
the chain growth in a V-shaped pattern

11
The data of the output gap on the industrial output and the electrical energy generated in
2010 proved the judgment. To be specific, the industrial output gap basically disappeared and
tended to be balanced. And the electrical energy generated also used to vary in the range around
zero when the heavy industrial growth fluctuated and the output gap emerged. This suggests that
China’s industrial productions are basically in the range of the normal capacity utilization. (See
Fig 4)
Fig. 4 China’s industrial output gap and the electricity generation gap basically
disappeared
d) PMI maintained in the high level and the manufacturing sector tended to thrive. Led by
the production index and the new order index, PMI exceeded the critical value by 50% and
stayed in that level for the continuous twenty months; and in the recent months it even reversed
the downward trend and rose at a faster rate. This indicated that the manufacturing industry was
stepping into the track of the continuous steady growth. However, since the PMI, to a great
extent, synchronized the industrial added value and the GDP index, the upward trend of PMI is
not a good predictor. (see Fig 5)
Fig. 5 PMI Indicator continuously higher than the critical value for 20 months

12
e) Consumption continuously grew at the high level. Largely owing to car sales, furniture
and decoration, jewelry consumption, and home appliances consumption, etc., the nominal
consumption rate remains at 18% the whole year, and the real consumption lies in range of 15-
16%, showing a steady increase maintained at the high level. Specifically, the estimated nominal
consumption growth rate reaches 18.3%, the real rate 15.3%, its real contribution rate to GDP is
56%. Thus consumption has become the essential force for stabilizing China economy in the
tendency of dropping back. (see Fig 6)
Fig. 6 The nominal and the real consumption both remained in the high level
f) The fixed asset investment dropped fast. Under the influence of the substantial decline of
the manufacturing and infrastructure investment, the fixed asset investment increased much
slower, the growth rate dropped by 7%. Nonetheless, the growth rate of the fixed asset
investment still remained in the normal zone, thanks to the real estate industry run in the high
level. The whole year growth rate is estimated to be 23.1%. The investment on residency housing
deducted, however, the increase rate of the non-residency housing investment, manufacturing

13
and infrastructure investment included, fell from 38.9% in 2009 to 17.8% at the end of the year.
This leads to 2.3% drop of the pulling impact of investment to GDP, and the growth contribution
rate drops by 38.1%. (See Fig. 7)
Fig. 7 The high-leveled running of the real estate investment supports the total
investment to fall into the normal operating range
g) The foreign trade turned down from the high level and the growth rate of the trade
surplus improves. Under the impact of the global economic recovery, China’s international trade
has been undergoing great changes. The import and export, under the basis of the recovering
growth, continued to increase to the high level, with the total trade volume estimated to increase
32.4%, among which the increase rate of import reaches 36.1%, and that of export reaches 29.3%,
and the trade surplus reaches 184.6 billion US Dollars. The year-on-year increase is only minus
5.9%, improved from the large decline of the exterior demand in 2009. This directly leads to
2.8% of the raise of the pulling effect of the exterior demand to GDP, with its contribution rate
raised by 34.3%. ( See Fig 8).
Fig. 8 The year-on-year growth of the trade surplus is greatly improved owing to the
consistent high-leveled growing of the Import and the export

14
h) The labor market has been greatly reversed, and some areas are even short of rural
migrant workers. All the at-work labors increase 4.4% in the first three quarters compared with
the previous year, and the employment rate of the industrial enterprises increased 3.1% in the
first three quarters. Meanwhile, in the eastern, central, and western regions the demand-supply
ratios simultaneously rise substantially , reaching 106%, 101% and 98% respectively, all
exceeding the level of 95% during the prosperous period. That is to say, shortage of rural migrant
workers appears both in the coastal regions and the inland regions. (See Fig. 9)
Fig. 9 The labor market has been improved to a great extent.
i) Fiscal avenues, enterprise performance and residential incomes all substantially increased.
Thus, China’s economy, under the basis of the recovering growth, began to step into the classical
growth path. In specific, the fiscal revenues, mainly from the substantial increase of the
consumption tax, automobile purchasing taxes, and customs tariffs, increase at the rate of 20%
the whole year, reversing the decline in 2009. The total fiscal avenue will achieve 8.2 trillion,
800 billion more than the budgeted. The profit of industrial enterprises also greatly increased,
and the sum from Jan, to Sept. already exceeds the whole year income of 2008 and 2009,
increasing year-on-year at the rate of 53.3%. The average compensation for at-work labors also
continuously rebound from 11.6% in 2009 to the current 14%. (See Fig. 10)
Fig. 10 The governmental revenues, enterprise income, and the individual income have all
been significantly improved.
15
j) The electricity generated and the quantity of shipment remains the growth as a normal rate.
This further demonstrated that China’s real economy has been into the track of normalized
growth. From Jan. to Oct., the total electricity generated in China increased year-on-year by
14.94%, slightly higher than the same level of history; the total shipment volume and cargo on
ports increased 14.6% year-on-year, 23% than that before crisis, the average yearly growth rate
being 11.5%, back to the level before crisis. (see Fig. 11)
Fig. 11 the growth of the electricity generated and the cargo on ports demonstrates that
China’s economy has stepped into the normalized growth path.

16
k) Compared with the various indices before crisis, China’s real economy not only made
up for the rate gap due to the economy decline this time, but has stepped into the
normalized growth zone at a fast speed.
First, the industrial added value increased 28% from 2008 to 2010, making the growth rate
of the average industrial added value 14%, the same level as before crisis.
Second, the fiscal revenue from Jan to Oct. exceeded the whole year revenue of 2008 and
2009, making the average yearly growth rate of the fiscal revenue from 2008 to 2010 around
17%, near to the normal growth level.
Third, the total trade volume from Jan. to Oct. exceeded the whole year trade volume in
2009, and the whole year volume 2010 reaching 2.9 trillion US Dollars, increasing yearly 14%
than in 2008, successfully compensating the gap due to the steep decline from 2008 to 2009.
Fourth, the electricity generated from Jan. to Oct. 2010, compared with that in 2008 and
2009, increased 18.2% and 14.9% respectively, virtually compensating the gap of the electricity
generated from 2008 to 2009.
II Still excessive liquidity and the rising prices quarterly
As indicated in the above analysis, the growth rate of China’ s economy in 2010 is gradually
stabilized, and stepping into the normal zone after surpassing the stage of recovering growth. The
total supply and demand are relatively balanced in the course of the synchronized recovering,
demonstrating no trace of the overheating economy.
Nonetheless, beyond the expectation of China’s economy in 2010, the asset prices remain
high though the real economy is not overheated. The price level, propelled by the prices of food
and household-typed commodities, continuously rise and break the target value of the year. The
reasons are not only associated with the worsen supply-demand relations of some agricultural
products, the variation of the international foods market, and the rising of the agricultural

17
production cost, but also related to the excessive liquidity that has been put in, transferred and
released since 2008.
a) Under the large sum of slack monetary policies in 2009, in 2010 the ongoing
liquidity input beyond planning directly resulted in the high money stock in China.
First, due to the inertia effect of the credit, the total credit in 2010 will be near to 8 trillion
Yuan, 6.7% exceeding the planned, and added up to 17.6 trillion Yuan from 2009 to 2010.
Among them, the credit from July to Oct. which exceeded the planned reached 0.3 trillion Yuan.
(See Fig.12)
Fig. 12 Credit supply beyond expectation
Second, the increase rate of the monetary supply declined, though still remaining at the high
level, and broke the target value the government set earlier this year. In 2010, the increase rate of
M1 reduced from 32.4% in 2009 to 19.3, and the increase rate of M2 reduced to 18.1% from
27.7% in 2009, 1.3% and 0.6% percent higher respectively compared with the planned earlier
this year, and remains at the high level in history. The liquidity still maintains relatively slack. In
comparison with those in BRICs, the current monetary supply in China is equivalent to the
indicating price level of 9%, only lower than in Russia where the inflation already emerges. (See
Fig.13)
Fig. 13 the rapidly growing monetary supply

18
Third, the gap between M2 and GDP increasingly widens, reaching the highest level in history
and also the high level of in the world. Taken into consideration of the deepening financing and
the variations of the money flowing speed, the pressure for price rising casued by the monetary
shocks still reach the high level in history. By the end of 2010, the size of M2 will reach 1.86
times the nominal GDP, 16% higher than the average level of the peak period in 2008. Although
the gap between M2 and GDP falls from 21.2% in 2009 to 8.4 in 2010, it is still 75% higher than
the average level from 2002 to 2008. In comparision with those in the BRICs, the rate in China is
equvilant to that in India, higher than In Brazil, but lower than in Russia. (see Fig. 14).
Fig. 14 the Monetary supply is higher relative to GDP
b) Much money stock existed, a large
portion of the money tends to flow to the virtual economy such as real estates, capital
market, luxury commodities, and those capable of being capitalized, rather than to the real
economy as expected.

19
First, the money invested to the real economy gradually decrease, particularly in the field of
the manufacturing. From the aspect of the fixed asset investment, the average increase rate from
Jan. to Oct., 39.2%, reduced to the current 26%. The money invested in the real estate deducted,
the investment on the manufacturing and infrastructure only increased by 16% over the same
period of the previous year. Such asymmetry in terms of the total money increase rate suggests
that the involvement of the money into the real economy is not high enough. ( See Fig.15)
Fig. 15 The money invested into the real economy is not enough.
Second, the fast increase of monetary supply and the negative interest are still the essential
reasons for the continuously rising high prices of the real estate. As in the Fig 16, the monetary
supply has been highly positively related to the index for the real estate in China, whereas highly
negatively related to real interest rate.
Fig. 16 The high monetary supply and low interest rate are the essential reasons for
the high prices of the real estates
Third, regardless of the various regulation measures, the sources of the fund to real estate
are always abundant. In 2009, the investment to the real estate increased 70%, the highest level
in history. And the increase rate from Jan. to Oct. 2010 is 32%, 5.6923 trillion in total. (See Fig.
17)
Fig. 17 The funds are still abundant in the real estate market.

20
Fourth, Liquidity, under the pressure of the regulations on the traditional capital market and
the real estate market, began to shift and release to the market for the agricultural products.
Particularly, the futures market for the agricultural products in China extensively increased from
the end of 2009 to Oct. 2010. The average trading volume per month 2.54 times that in the same
period of 2008 and 2009, and the volume in a single month is even closed to five trillion
Yuan( See Fig 18).
Fig. 18 The money entering into the future market for the agricultural products are
substantially increasing.
Fourth, the liquidity surplus and the expectation of inflation also led to the risk-avoided
investment /consumption, the sales of the luxuries increase substantially. From Jan to Oct., the
sales of the luxuries increased by 29%, 15% higher than the highest level in history.
Fig. 19 The investment and consumption in avoidance of the risks significantly
increase.

21
Fifth, to make matters worse, the hot money pours into the domestic market, speeding the
existing money’s crowding in the capital market, the real estate and the agricultural market.
Since the third quarter, the non-trade and nor-FDI foreign exchange reserve greatly increased and
reached 110 billion US Dollars, the highest level in history, demonstrating the hot money are
pouring in even more rapidly. Meanwhile, the foreign investment, regardless of the frequent
enactment of the regulatory policies on the real estate, swamped in the real estate market. From
Jan to Oct, among all the real estate investment, the foreign investment increased 34.8%,
completely reverted from the overall retreat situation in 2009. This also indicates that the hot
money is obviously targeting at these foam-type industries. (See Fig 20)
Fig. 20 The hot money began to substantially pouring in since the 3rd
quarter.

22
c) Under the impacts of liquidity surplus and the virtualization of the monetary flow,
the prices of the real estate remain in the high level, and the price of other commodities are
continuously rising. Thus the economic bubble began to transfer from the real estate to
other investment goods, especially to the relatively balanced agricultural products.
First, the prices keep rising beyond the governmental target level. Influenced by the
rebounding economy, rising prices, abundant liquidity, the price rebounding of the international
bulk commodities, and the worsen supply-demand relations of some of the agricultural products,
the consumer price level has risen to a great extent the whole year. In 2010, CPI is estimated to
be 3.2%, and the implicit GDP deflator is 3.7%, 3.9% and 6.1% higher respectively than in 2009.
Among them, CPI exceeds 3%, the target value that the government claimed earlier this
year.(See Fig. 21)
Fig.21 The CPI is continuously rising.
Second. The rising of the food prices is the essential drive of the CPI rise. Food prices and
fuels prices deducted, the growth rate of the essential CPI still remains in the normal range of 1%
to 1.5%, suggesting that the rising of the prices is not due to the overall shortage of the supply of
the real economy. In Oct., the food price rises year-on-year by 10.1%, and the non-food price
rises by 1.6%, whereas the essential price only rises by 1.07% (See Fig 22).
Fig. 22 The current essential CPI increases at a relatively lower speed.

23
Third, the real estate price, under the regulation, changes the fast increasing tendency in the
third and fourth quarters 2009, though it still remains in the high level, both from the chain
relative data and from the year-on-year data. The new regulation on the real estate in April 2010
reduced the increase rate of the real estates’ sale prices in 70 large and middle cities, compared
with that in this same period of the previous year, from 12.8% then to 8.6% in Oct. Through Sep.
and Oct., the monthly chain relative ratio still kept rising. (See Fig. 23)
Fig. 23 The CPI and the food prices index keep rising when the price of the real estate is
high.
Fourth, under the continuing and reinforcing influence of the new regulation on the real
estate, many funds have transferred and released to other investment markets, which directly
leads to the sharp rises of precious metals, collectables, and a few agricultural products in turn,
spreading the economic bubbles. Specifically, the prices of the agricultural products increased

24
following the path of garlic-ginger-soybean-apply-seed cotton, etc,… and then spreaded out.
( See Fig 24)
Fig. 24 the prices of part of the agricultural products sharply rose.
Fifth, led by the food prices, the prices of the vegetables and other food are strong
contagious, spreading the price rising. From the relative price ratio with the fixed base of the
foods products, the price level of foods has been basically continuously rising since 2004. The
price level in Jan.1993 set as 100, the general price of food in Sep.2010 has reached 263.8. As
for the sub-item indices, the price of fresh vegetables increase at the fastest rate; though it
slightly fluctuates seasonally within each year since 2004, it generally rise very fast. The price
level in Jan.1993 set as 100, the price of fresh vegetables Sep. 2010 rose 506.7, over 5 times that
in 1993. In addition, the prices of grains, poultry and the related products are also in the high
level, reaching 295 and 298 in Sep. 2010 respectively, almost 3 times the price in 1993.The
general price for eggs are surprisingly not very high, but it is increasing very fast. On the
contrary, the prices of aquatic products, exported food and fresh fruits increase relatively
slowly.( See Fig. 25)
Fig. 25 the overall food prices index and the relative sub-item price indices with the fixed
base

25
0
100
200
300
400
500
600
2004 2005 2006 2007 2008 2009 2010
总 粮 肉蛋 水 菜外 果
III. The balancing of the driving mechanism and the structural
transformation
The essential points of China’s economy in 2010 are not only reflected in the above two
parts summarized as: 1) that the real economy dropped from the high level and steadily
stepped in to the normal zone; 2) and that although the real economy has been over-heated,
the surplus, transfer, and release of the liquidity resulted in the continuous high assets
prices and the spreading of the economic bubbles, and triggered the continuous rising of
the prices; but reflected as well in 3) that the balancing of the driving mechanism for
China’ economic growth and the beginning of the fundamental change of the general
structure will lead to great changes of the economic mechanism in future.
A. In the perspective of the contributions from the three types of demand to GDP growth,
the pull of consumption play the major role, and the de-investment of the government exit are
fast; thus the continuous consumption growth may start off China’s pattern of ―Consumption-
driven economic growth‖. As per the national accounts in Table 2, the contribution of the
consumption to GDP in 2010 continues to rise, whereas the contribution from the investment
keeps dropping. Specifically, the consumption of the whole year pulled GDP growth to 5.6%,
1.2% higher than from the investment; and the contribution rate from consumption is 55.4%,
10.8% higher than from the investment. It is the first time this century that consumption exceeds
investment and became the primary source of the growth.
Table 2 Consumption exceeds investment for the first time and become the first
driving force for the growth

26
2009 2010 2010 2010 2010
1-4 1 1-2 1-3 1-4
Consumption-
driven rate
4.1 6.2 5.7 5.8 5.6
Contribution
47.9 52.1 51.4 54.7 55.4
Investment-
driven rate
7.4 6.9 5.9 5.1 4.5
contribution
86.4 57.9 53.2 48.1 44.6
Net-export-
driven rate
-2.8 -1.2 -0.5 -0.3 0
Contribution
-34.3 -9.9 -4.5 -2.8 0.0
Real GDP
growth
8.7 11.9 11.1 10.6 10.1
B. The exit of the stimulating policies resulted in the slowing down of the growth rate,
but the fast recovery of the market demand supported the stabilization of China’s economy.
The driving mechanism of the economic growth quickly transformed from the government-
orientation to the market-orientation; and from exogenous stimulation-orientation to
endogenous-orientation, though the market demand and investment still need to be further
solidified.
First, while the production of the state-owned and state-holding enterprises declined, the
stock limited companies and the foreign-funded enterprises recovered their production fast,
partly compensating the gap caused by the state-owned enterprises due to the exit of the
stimulating policies.
Fig.26 the production by the stock limited companies and foreign-funded enterprises
compensated the gap left by the state-own enterprise’s fallback

27
Second, the investment owing to the policies decline rapidly, but the recovery in the market
investment compensates the gap of the decline. This has been specifically reflected in the
following three aspects:
1) The projects related to the central government shrink substantially, but the projects related to
local government still remain at the high level. Currently, the increase speed of the projects
related to the central government declined from 18.4% to 10% in 2010, whereas those related to
local governments still keep increase at the speed of 26%. ( See Fig.27)
Fig. 27. The projects invested by the central government declines, whereas the investment
by the local governments increases.
2) The governmental policies-driven investment on the primary industry decreased
substantially, but the market-driven investment mainly on the tertiary sector continuously
increase and remained at the high level. The increase rate of the investment in the primary sector
drop from 49.9% in 2009 to 21% by the end of 2010, whereas the increase rate of the tertiary
sector maintains at about 28%. ( See Fig 28).

28
Fig. 28 The governmental policies-driven investment on the primary industry decreased
substantially
3) Under the impacts of the continuous recovery of the export and the normalized increase
rate, the investment of the export-oriented enterprises began to steadily recover, reflecting the
substantial recovery of the demand of the market investment. Nonetheless, it needs to be noted
that:
(a) The growth of the export-oriented enterprises is far slower than before the crisis, and
most of the enterprises did not invest much for the next round of the economic growth;
(b) The time for large-scaled investment is yet to come, and the overall investment hardly
filled the gap due to the exit of the government investment and the investment from the state-
owned enterprises. The market-driven investment cannot easily guarantee in short term the
stability of the increase of the investment in future.
(c) The increase rate for the private business owners, which signal the investment
environment, continues to decline, and the accumulated increase rate from Jan. to Oct. is only
5%, indicating that China’s economy is yet to reach the prosperity term for investment, and the
shortage of the economic growth poles and the limitation in the investment field, to a great extent,
result in the speculation instead of the action by the private business investors.( See Fig. 29)
Fig. 29 The investment from the merchants in Hong Kong, Macao, and Taiwan
significantly rebounded.

29
3. The industry-dominated economic fluctuation and the heavy industry-dominated
fluctuation patterns have not changed, and the speeding-up of the service sector has not emerged
yet. China’s GDP growth rate per quarter in 2010 dropped 2.9%, mainly because the growth rate
of the second sector declined 8%. The primary sector remains stable, and the third sector slightly
dropped. The essential reason for the second sector’s drop is the substantial drop of the heavy
industry, the extent of the drop from Jan to Oct. reaching 6.8%. (See Fig. 30).
Fig. 30 the heavy industry-dominated patterns have not changed.
(d) Influenced by the regional planning and the speedy gradual transfer of the
industries, the continuous high-speedy growth in the middle and western regions
compensated the gap due to the economic stagnation in the eastern regions. The weight of
China’s economy began to shift to the middle and western regions, and the era of the
multiple-poled economic growth has come.
First, from the perspective of the difference of the growth rates, part of the middle and
western provinces remain the high-speed growth while the growth rate in Eastern regions decline
greatly. For instance, Inner Mongolian keeps maintaining over 16% of the growth rate, whereas

30
the growth rate of the eastern regions declined significantly in 2009 and 2010, and the rate of
recovery is even lower than the average rate in the middle and western regions. (see Fig 31).
Fig.31 The middle and western regions remain the high-speed growth
Second, the weight of GDP began to shift to middle and western regions. From 1991 to
2003, the national economic weight ―drifts‖ to the southeast region of China, and since 2004, the
development of the West, prosperity of the middle regions and the revitalization of the Northeast
gradually pushed the national economic weight to move back westward. Accordingly, the
geographical portion of GDP for middle and western regions constantly increased——46.16% in
2009 and 47.1% estimated in 2010. (See Fig. 32).
Fig. 32 The weight of GDP began to shift to the middle and western regions since 2004.
9091
92
93
94
95
96 9798 99
0001
0203
04
0506
07
0809
阜阳市临泉县
32.6
32.7
32.8
32.9
33.0
33.1
33.2
114.8 114.9 114.9 115.0 115.0 115.1 115.1 115.2 115.2 115.3 115.3
纬度
经度
中国GDP重心演变
Third, the focus of consumption is moving toward north. The change of the growth rate will
definitely lead to the change of the focus of the consumption expenditure. From 1990 to 2003,

31
the focus of the consumption shifted toward southeast; and from 2003 to 2005 it then shifted
toward southwest, mainly because of the change of the consumption structures within the east
region. From 2006 to 2009, the focus of consumption shifted north, primarily owing to the
consumption increase in the middle, west and north east regions; in the end, by 2009 the final
consumption percentage in middle, west and northeast regions has raised to 48.6%, and the
percentage of residents’ consumption also recovered to 48.68% ( see Fig 33 and 34).
Fig. 33 The weight shifts for the final consumption ( 1990-2009)
9091
92
94
9597
98
9900
01
0203
04
0506
070809
驻马店市新蔡县
32.3
32.4
32.5
32.6
32.7
32.8
32.9
33.0
33.1
33.2
114.2 114.3 114.4 114.5 114.6 114.7 114.8 114.9 115.0
纬度
经度
我国最终消费重心演变
Fig. 34 the weight shifts of the residential consumption (1990-2009)
90
91 9293
94
9597
989900
0102
0304
05 060708
09
驻马店市新蔡县
32.0
32.2
32.4
32.6
32.8
33.0
33.2
114.3 114.4 114.5 114.6 114.7 114.8 114.9 115.0
纬度
经度
我国居民消费重心演变

32
Fourth, the focus of the investment substantially drifts westward. From 1999 to 2009, the
focus of the fixed assets investment of the total society showed the Z shape. With the enactment
of the western development, the focus of the fixed assets investment drifted toward northwest;
then with the northeast revitalization and the rising of the middle regions the focus constantly
drifted to northeast; to meet with the circumstance impacted by the financial crisis, the
investment focus speeded up drifting to west (See Fig. 35).
Fig.35 the weight shifts of the Total Investment in Fixed Assets (1999-2009)
全社会固定资产投资重心演变
驻马店市新蔡县99
0001
02 0304
05
0607
0809
32.632.732.832.933.033.133.233.333.433.533.6
114.70 114.75 114.80 114.85 114.90 114.95 115.00 115.05
经度
纬度
From the above analysis, we can see that China economy are spreading and deepening into the
inland regions from the traditional Pearl River Delta and Yangzi River Delta, and form the
characteristics like the flying swan geese in terms of evolving order and strength.( See Fig 36).
Beginning from 1999, the investment focus drifts to the middle and west regions; then in 2004
the GDP focus also emerge to shift to the mid-west and in 2006, actually did so; and then the
focus of the consumption (the final consumption and residential consumption) emerged the
tendency to drift to the mid-west; and in 2008 the consumption actually drifted. After 2008 the
focus of export and import also emerge the tendency to drift to mid-west, but the actual move is
not so obvious.
Fig.36 The pattern of the flying swan geese for the regional weight shifts

33
Notes:A for investment; B for GDP;C for consumption;D for import and export.
t
Weig
ht
shifts
A B C D
1999 2006 2008 2010

34
Part III Economic prospect and risks
As analyzed in Part II, In 2010 China economy has three characteristics:
a) The real economy drops from the high level to the steady situation and the
quarterly dropping extent is smaller than expected. The operation of the real economy
steps into the stage of the normal development.
b) Although the real economy is not overheated, the surplus, transfer and release of
the liquidity leads to the constant high capital price, spreading of the economic bubble, and
the continuous rising of the prices.
c) In China’s economy, there has emerged the balancing of the economic driving
mechanism and the diversification of the growth poles. More specifically, the economic
driving mechanism is characterized by the consumption-drive pattern; the market-driven
endogenous growth forces began to partly fill the gap due to the exit of stimulating policies,
solidifying the foundation for the economic recovery; and the focus of China economy
began to drift toward the mid-west regions entirely, impacted by the regional policies and
speeding-up of the gradual industry transference,. These three structural characteristics
imply that the economic mechanism will change in future.
The three characteristics also incubate many economic risks and challenges:
a) Will the exterior environment reverse? Will the foundation for China’s market-driven
recovery be further solidified?
b) Can the excessive liquidity be easily recycled? Will the economic bubble continue to
spread? Will the price rise even higher?
c) Will the good structural adjustment continue? And does the Twelfth five-year plan affect
the economy in terms of the adjustment, or in terms of the stimulation?
I. The slowing-down, polarizing environment with conflicts and high
uncertainty
The biggest uncertainty China’s economy face in 2011 is the changes of the exterior
environment. These changes lie in a) that the slowing-down of the economic recovery in the
developed countries results in the globally stagnation; b) that the polarizing of the
recoveries of the various nations brings about the conflicts among these nation’s economic
policies; c) and that the variations of the capital flows and the prices of the bulk
commodities are caused by the exchange rate reconstruction. These variations will make

35
the conflicts of exchange rates, monetary policies and trade among different countries
reach the highest level in history.
A. The upper limits of the predictor indices of various countries in the world were all reached
in the first and second quarters of 2010, foreshadowing the slowing-down of the recovery of the
global economy from the third and the fourth quarters of 2010, and this implies that the global
economic recovery will remain the downward trend in 2011. At the mean time, according to the
prediction by IMF, the growth rate of the global economy will drop from 3.742% in 2010 to
3.306% in 2011; whereas the growth, according to the prediction by World Bank, will drop from
3.6% to 3.0%. (See Fig 37)
Fig. 37 The world economy tends to slow down.
B. Because the deep structural
problems for the financial crisis have not been
resolved in the developed countries, investment downturn, high unemployment, weak
consumption, lack of export advantages, and consistent high debt will directly lead to the
slow economic recovery and the weakening of the economic driving forces, and may
probably be spreaded to other countries. Specifically, these problems are reflected as
follows:
First, the deep-rooted problem for European and American financial crisis has not been
resolved, which will directly result in the shrinking credit, tight liquidity, and the financial unrest
in the developed countries in 2011. This will seriously confine the economic recovery and
hereby is specified in the following two aspects:
One is that the US real estate market tended to sharply decline the second time since April,
2011, one disaster after another in the course of deleveraging and removing poisonous assets in
order to confront the subprime crisis. By Oct. 2010, the price and trade volume of the houses in
US have both declined, and the default rate and the rate of supply shortage have further increased

36
to above 4%. 200 million houses were auctioned in banks, and over 300 million households
defaulted on repayment. (See Fig 38, 39);
The other is that the debt ratio of the European countries in the sovereign debt crisis will
continue to rise, making possible the risk of the reemerging of the debt crisis in EURO zone. The
credit swap spreads and the bond yields of European countries involved in debt crisis have
greatly increased to the new peak since the third quarter, although they declined upon the
launching of the European Stabilizing and Relief Funds in May. In November, the ten-month
bond yield in Ireland sharply increased to 8.929%, reaching the highest level since Euro was
established; and meanwhile the bond yields in Portugal also made the highest record. (See Fig.
39, 40, 41)
Fig. 38 US real estate market further declined and remained weak, and the default
rate and the rate of supply shortage maintained in the high level
Fig. 39 The growth of the consumer credits and the enterprise loans still gloomy
Fig.40 The credit swap in the countries suffered from the debt crisis reaches the new highest level.
Fig.41 The bond yields in the countries suffered from the debt crisis rise again.

37
Second, the outputs gaps in the developed countries such as US, Euro Zone, Japan and UK
are still negative in 2011. The amounts are -1.7%, -3.9%, -2.1%, and -5.1% respectively. And the
overall output gap of OECD is -2.6%, 1.2% narrower than in 2010, whereas in 2010 the output
gap of OECD countries is 1.3% narrower than the previous year. This indicates that although the
developed countries’ economies are in the course of recovering, the recovery is slowing down.
( See Fig 42)
Fig.42 the outputs gaps in the developed countries are still negative.
Third, the capacity utilizing rates in the developed countries still have large gaps compared
with the normal level, and the rates in some countries tend to decline. Meanwhile, PMI has
begun to drop since June 2010, directly leading to the drop of the GDP growth rate in US,
JAPAN, and Euro Zone, since the second quarter. ( See Fig 43-45)
Fig. 43 PMI in US, Japan, and Euro Zone began to drop.
38
Fig.44 The capacity utilization in the developed countries are still low.
Fig. 45 The GDP growth began to slow down since the 2nd
quarter.
Fourth, under the influences of the high unemployment, high residential debt, and weak
consumers’ credit, the consumer confidence index in the developed countries began to drop, and
the consumption growth rate began to drop since the second quarter of 2010. For instance, the
U.S. unemployment rate in the 2nd
quarter still remains at 9.5%, and the consumers’ credit

39
increase at the rate of -2.1%. The speed of consumption growth dropped from 5.6% in the first
quarter to 4% in the 2nd
quarter (See Fig. 46-47).
Fig. 46 The US unemployment rate remains high and the consumption depressed.Fig. 47
the Consumer Confidence index in developed countries still recessed.
Fifth, the fiscal deficit and debt in developed countries has reached the highest level in
history, and the fiscal sustainability requires countries in the world to substantially reduce fiscal
deficits. The so incurred synchronized fiscal exits aggravate the impacts and shock to the
economic recovery and the short-term economic growth. In 2009, the global deficit was as high
as 7.2%, whereas the deficit in the developed countries was 8.8%. In order to maintain the fiscal
sustainability, the percentage of the global deficit to the current global GDP should, in the future
3 years, be reduced to 0.7%, 1.3%, and 1.5% respectively. Such reductions will greatly impact on
the economic recovery of the countries worldwide, and the impact will be particularly strong
when many countries make the reduction simutaniously. For example, the World Bank, on the
basis of the G-cubed Model, simulated the impact of fiscal adjustment on the growth to be 0.4%,
0.9% and 1.4% respectively within three years. (See Table 3)
Table 3 The impact of the debt reduction on GDP growth (%)
2009 2010 2011 2012
(GDP change in percentage relative to the base value)
世界(world) 0.0 -0.4 -0.9 -1.4
高收入国家
(High income countries) 0.0 -0.4 -1.0 -1.5
高收入国家(除欧盟五国) 0.0 -0.4 -0.9 -1.4
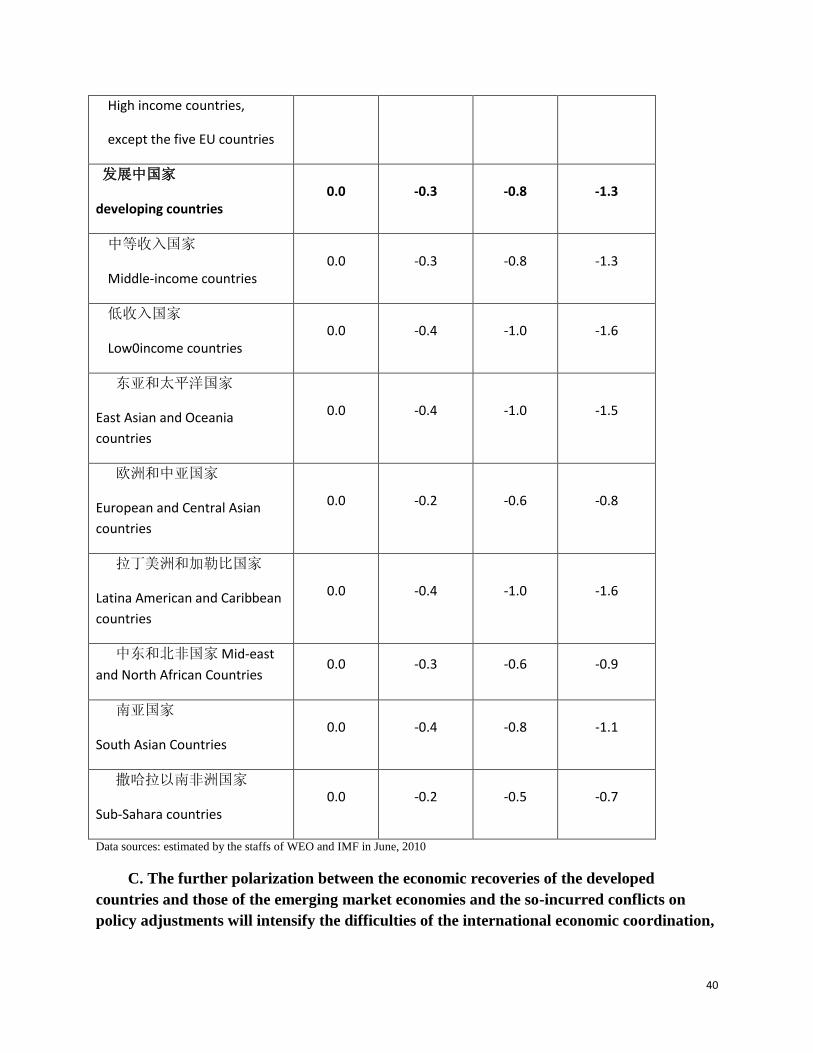
40
High income countries,
except the five EU countries
发展中国家
developing countries 0.0 -0.3 -0.8 -1.3
中等收入国家
Middle-income countries 0.0 -0.3 -0.8 -1.3
低收入国家
Low0income countries 0.0 -0.4 -1.0 -1.6
东亚和太平洋国家
East Asian and Oceania
countries
0.0 -0.4 -1.0 -1.5
欧洲和中亚国家
European and Central Asian
countries
0.0 -0.2 -0.6 -0.8
拉丁美洲和加勒比国家
Latina American and Caribbean
countries
0.0 -0.4 -1.0 -1.6
中东和北非国家 Mid-east
and North African Countries 0.0 -0.3 -0.6 -0.9
南亚国家
South Asian Countries 0.0 -0.4 -0.8 -1.1
撒哈拉以南非洲国家
Sub-Sahara countries 0.0 -0.2 -0.5 -0.7
Data sources: estimated by the staffs of WEO and IMF in June, 2010
C. The further polarization between the economic recoveries of the developed
countries and those of the emerging market economies and the so-incurred conflicts on
policy adjustments will intensify the difficulties of the international economic coordination,

41
and bring the conflicts of policies, of exchange rate and of international trade to new high
latitude in history.
First, the global recovery strongly diverged between the developed countries and the
emerging market economies. The average economic growth rate of the emerging market
economies led by the BRICs countries is as high as 6.7%, whereas that of the developed
countries is only 2.1%; the unemployment rate in developed countries is 8.5%, whereas that of
the emerging economies has dropped from 4.25% in 2009 to 3.2% today; the inflation rate in
developed countries maintains at around 1%, whereas that in emerging countries has reach 5%
on average, and that in Russia , Brazil and India in particular even exceed 5% and closed to a
two-digit number. Such divergence led to the differentiation and conflicts on the economic
policy adjustment in these countries. (See Fig 48-49)
Fig. 48 The divergence of the industrial productions among various countries
Fig. 49 The divergence of the unemployment rates in various countries
Second, the problem of trade
imbalance reemerged after crisis. The
countries with trade deficits, particularly US, has been worse in their deficits since the 2nd
quarter
2010, whereas the trade surplus in the countries with positive trade balances such as China,
German, and Japan are increasingly large, almost reaching the level before crisis. This directly
leads to the significant changes in the US trade policies. (See Fig 50)
Fig. 50 The deficits and trade surplus of various countries began to expand.

42
Third, the developed countries’ expectation on deflation and the emerging market countries’
expectation on inflation directly conflict with each other, leading to the opposite monetary
policies adjustment by the two coalitions. The developed countries led by US and Japan start off
the second round of the quantified slack policies to overcome the problem of tight liquidity in
these countries, whereas China, India, Russia, and some other emerging economies began to
tighten the monetary policies, so as to recycle the liquidity substantially, in prevention of the
continuous inflation. (See Fig 51)
Fig. 51 the serious divegence on the inflation
Fig. 52 the divergence of the monetary conditions index in various countries
Fourth, the devaluation of US Dollars, reevaluation of Renminbi, and the quantifying and
defining of the imbalance of the international revenue and expenditure, all caused by the
43
adjustment of the US trade policies and monetary policies, have not been successfully resolved
in the multilateral system such as G20 and APEC. Such problems will definitely bring the
frictions of exchange rates and international trade to a higher level in history.
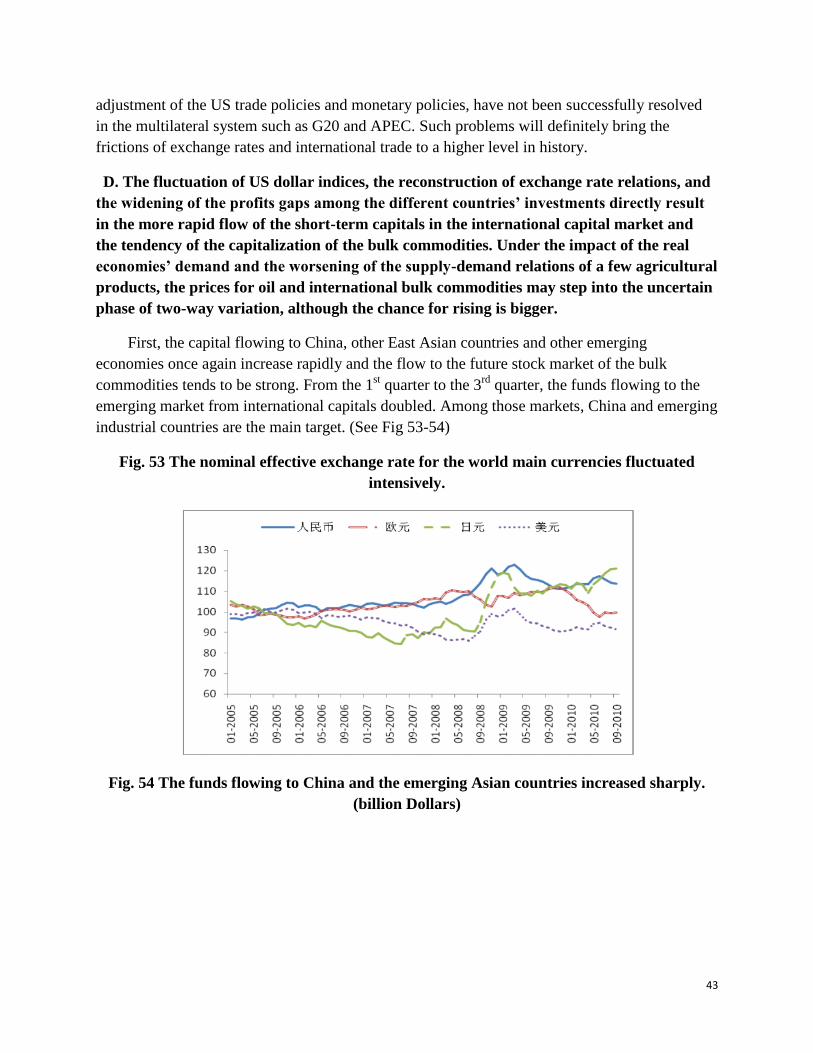
D. The fluctuation of US dollar indices, the reconstruction of exchange rate relations, and
the widening of the profits gaps among the different countries’ investments directly result
in the more rapid flow of the short-term capitals in the international capital market and
the tendency of the capitalization of the bulk commodities. Under the impact of the real
economies’ demand and the worsening of the supply-demand relations of a few agricultural
products, the prices for oil and international bulk commodities may step into the uncertain
phase of two-way variation, although the chance for rising is bigger.
First, the capital flowing to China, other East Asian countries and other emerging
economies once again increase rapidly and the flow to the future stock market of the bulk
commodities tends to be strong. From the 1st quarter to the 3
rd quarter, the funds flowing to the
emerging market from international capitals doubled. Among those markets, China and emerging
industrial countries are the main target. (See Fig 53-54)
Fig. 53 The nominal effective exchange rate for the world main currencies fluctuated
intensively.
Fig. 54 The funds flowing to China and the emerging Asian countries increased sharply.
(billion Dollars)

44
Second, under the impact of the fluctuation of the US dollar index, the risk for the two-way
fluctuation of the prices for the bulk commodities increases. On one hand, in 2010 the price of
bulk commodities continued rising, affected by the globally rising demand, the worsening of the
supply-demand relation of some products, and the rising US Dollars index. For instance, oil price
is closed to USD90.00 per barrel, and the wheat price rose by almost 30%. In future, the price of
bulk commodities will probably continue to rise, giving strong shock to the global economic
recovery. According to the research by OPEC, in 2010, the oil demand increased 132 million
barrels per day, at the rate of 1.6%, reaching 8.578 million barrels. And in 2011, the demand will
continue to grow. The demand per day globally will be 8.695 million barrels and the price will
be USD 100 per barrel. Nonetheless, according to IMF’s research, in 2011 the growth rate of
bulk commodity prices will slow down. For instance, the oil price will only rise about 3%, and
the prices for non-oil raw materials will drop 2%, and the prices for the metals and food
commodities will keep same as those in 2010. These predictions strongly depend on the
anticipation on the global economic recovery and the US Dollar indices. There is still much
uncertainty in terms of whether US economy will rebound beyond expectation, after the second
round of quantitative easing monetary policies and the economic stimulating plan. Thus, the
fluctuation of the commodity prices in 2011 has great risks on both rising and dropping. (See
Fig.55-57)
Fig. 55 The trend of the US Dollar Index & the price of the bulk commodities
Fig. 56 the IMF predictions on the price index of the bulk commodities in 2011

45
美元与大宗商品走势
80
85
90
95
100
105
110
115
1201
0-0
1-0
1
10
-01
-15
10
-01
-29
10
-02
-12
10
-02
-26
10
-03
-12
10
-03
-26
10
-04
-09
10
-04
-23
10
-05
-07
10
-05
-21
10
-06
-04
2010-1-1=100
美元
DJ大宗商品指数
WTI原油价格指数
Fig. 57 The prices of the international bulk agricultural commodities rose sharply.
(USD/MT)
The above risks and uncertainty of the exterior environment directly result in the following
problems China’s economy may face in 2011:
a) The overall slowdown of the global economic recovery will lead to the substantial
slowdown of China’s foreign demand, bringing shocks to the complete recovery of the China’s
external demand—— one of the two foundations for china’s economic stabilization in 2010.
b) The continuous expansive monetary policies of the developed countries and the rapid
flow of the internal capital result in more difficulties for the reversion of China’s monetary
policy and the reduction of the operation effectiveness. The large scale of the hot money not only
will offset the effect of the reversion of the monetary policy, but also may lead to the spreading
of the economic bubble.

46
c) The intensification of the exchange rate conflict and trade conflict will lead to the
worsening of the tension for Renminbi’s revaluation and the international business and
diplomatic relations, aggravating the recession of China’s trade situation.
d) The continuous high price of the international bulk commodities will increase the
difficulties for the governance of China’s inflation.
II the recycling of Liquidity, spreading of the bubble and the uncertainties in
the inflation governance
Recycling of the liquidity, spreading of the bubble, and the governance of the inflation are the
most difficult tasks for china’s economic adjustment in 2011. The difficulties lie in: 1) whether
the liquidity can be substantially recycled as the government planned; 2) that the regulation on
the real estate market has two-way risks, and whether the government can balance the conflict
between the adjusting back the capital price and the economic drop; 3) whether the interlocking
effect of the economic bubbles will continue; 4) and whether the single economic policy tool is
sufficient to handle with the inflation caused by multiple reasons, what the core reason of the
inflation in China, and what is the optimized target for the inflation control.
a) Some factors make it difficult in future for the substantial recycling of liquidity in
China. These factors include the high pressure for commercial banks to deliver credit,
strong inertia effect of the credit loaned, and the increasing percentage and the large stock
of the foreign exchange reserve.
First, the ratio between deposit and loan drops, increased the pressure on banks’ money on
real estates. Meanwhile, as the economy began to fully recover, the performance in all industries
is overall improving, and the impulse is still large on the banks’ money on real estates. This is
clearly demonstrated in the data on the credit loaned from July to Dec. 2010. Such credit-over-
plan phenomenon will probably be even more obvious in 2011.( See Fig 58)
Fig, 58 the rebounded load-credit ratio intensified the banks’ pressure on the payment
for the residential housing.
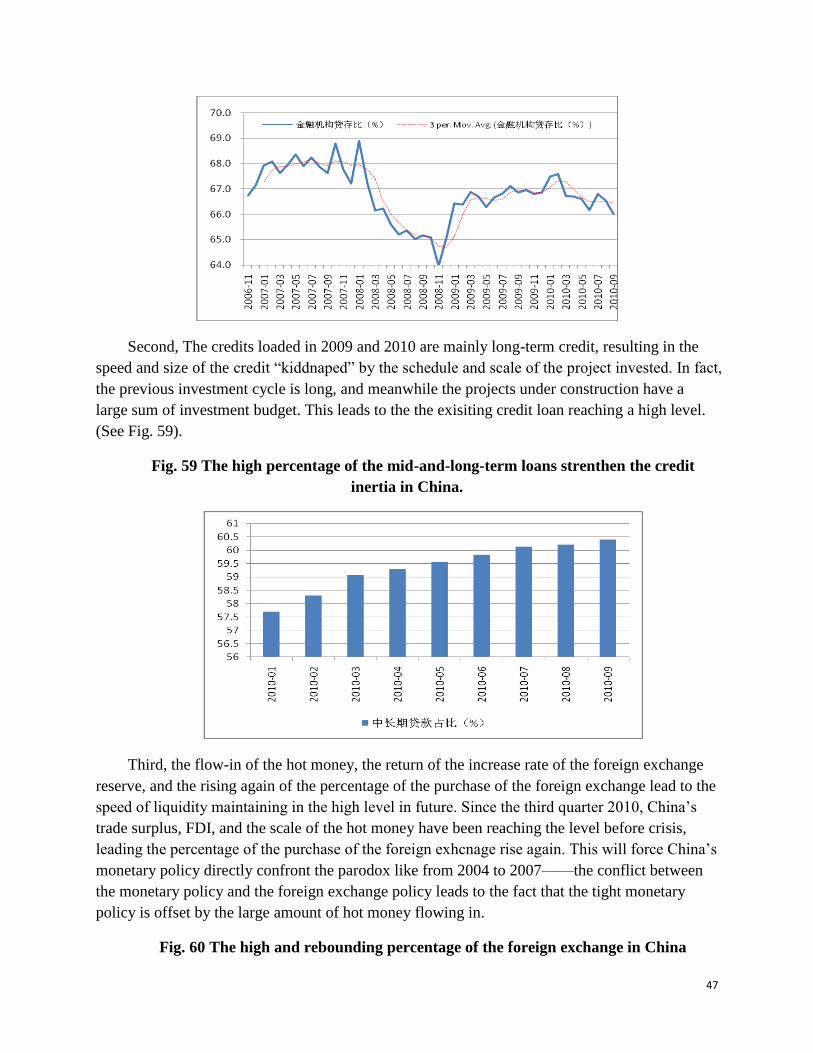
47
Second, The credits loaded in 2009 and 2010 are mainly long-term credit, resulting in the
speed and size of the credit ―kiddnaped‖ by the schedule and scale of the project invested. In fact,
the previous investment cycle is long, and meanwhile the projects under construction have a
large sum of investment budget. This leads to the the exisiting credit loan reaching a high level.
(See Fig. 59).
Fig. 59 The high percentage of the mid-and-long-term loans strenthen the credit
inertia in China.
Third, the flow-in of the hot money, the return of the increase rate of the foreign exchange
reserve, and the rising again of the percentage of the purchase of the foreign exchange lead to the
speed of liquidity maintaining in the high level in future. Since the third quarter 2010, China’s
trade surplus, FDI, and the scale of the hot money have been reaching the level before crisis,
leading the percentage of the purchase of the foreign exhcnage rise again. This will force China’s
monetary policy directly confront the parodox like from 2004 to 2007——the conflict between
the monetary policy and the foreign exchange policy leads to the fact that the tight monetary
policy is offset by the large amount of hot money flowing in.
Fig. 60 The high and rebounding percentage of the foreign exchange in China

48
Fourth, the money stock is still large, thus simply raising the deposit-reserve ratio and opening
market operations may not have much impact. For instance, raising deposit-reserve rate by 0.5%
will cause 350 billion to be frozen. Nonetheless, the stock for credit is 70 trillion; therefore still
has much space for credit.
b) The regulation on the real estate market still faces many conflicts, and in future the
governance of the real estate market will confront two-way risks——retaliatory rising
under the simple deregulation and the serious economy drop due to the continuous strict
regulation.
First, from the aspect of cycle adjustment, China’s real estate market is still in the stage of
expansion. The forces for periodical expansion are still exist and will last for some time, such as
the course of urbanization, demographic structure, the revolutionary change of China’s
residential wealth structure, and the special pattern of China’s housing demand. The short term
factors such as supply-demand imbalance, inflation expectation, the flooding of liquidity, and the
distortion of policy adjustments, determine that in the stage of the periodical expansion the real
estate prices are deviating the balanced price. Thus if the supply of the real states does not
substantially increases, reducing the supply-demand imbalance through cost changing, the
periodical forces will definitely explode after the administrative regulation and perhaps result in
the periodical price fluctuation moving upward to a great extent. Although the administrative
price regulation is reasonable in short term, it can hardly change the periodical fluctuation in the
relative long run. Therefore, simply following out the current regulation measures on real estates,
is unlikely to fundamentally change the expectation and pressure for the price rising. And the
problem of the capital bubbles remains unsolved. ( See Fig 61)
Fig.61 The administrative regulation had little impact on the real estate market in
China.

49
Second, if stricter measures are taken, the capital chain may be broken, investment may
decline, and real estate prices may substantially drop. All these will result in the decline of the
economy. For instance, according to Renmin University’s estimation, the real estate prices will
drop by 30%, driving the increase rate of the real estate investment falling 25%, the increase rate
of the total investment falling about 6%, GDP falling around 2.5%, and the increase rate of the
local public finance falling about 15%.
Table 4 The role of the real estate in China
涉及的增加值占 GDP 比重(The
percentage of the involved VA in GDP)
6-7%
投资总额占全社会投资
Ratio of the real estate investment to
the total investment
19-20%
涉及的信贷占全社会信贷
The ratio of the involved credit to the
social credit
Around 23%
涉及的税收和土地出让金占地方财
政收入 the ratio of the involved
taxation and land transfer fees to the
local fiscal revenue
Over 40%
销售额占 GDP 比重
The percentage of the real estate
sales to GDP
About 13.1%

50
占居民财富总额 the percentage to
the residential total wealth
70%
Third, the games played between the Central government and the local governments on the
lands market and the construction of subsidized housing can hardly revolve, fundementally, the
parodox of current scarcity of the land supply for residence housing, and of the lacking of actual
progress on the construction of subsidized housing. If the quantity of the commercial and the
subsidzed residential housing can not be substantially increased in the market, the problem of the
high price will not be revolved indeed.
Fig. 62 the portion of the investment on the subsidized residential housing continued to
drop
c) In 2011, under the background of the liquidity surplus, the risks not only include
spreading of economic bubbles, worsening of inflation caused by international input, price
rising due to the cost pushing and reform, but also include the risks caused by inflation
panic, oversimplification of the governance, and too strict regulation. The diversification of
the inflation causes and discrepancies on the issue will test the government’s administrative
capability.
First, the inflation and the economic bubble tend to spread. The fundamental cause lies in the
higher liquidity, the weakening capacity for the real economy to absorb the liquidity, lacking of
the normal financing channels to release the liquidity, and the remaining difficulties of liquidity
recycling. As long as the liquidity is not normalized, the cost factor, the international factor, and
the variations of supply-demand relations will become the channels for releasing liquidity in
future. Meanwhile, the rapid development of the capitalization of the bulk commodities directly
results in the strong leveraging effect, news effect, contagious effect, and threshold effect of

51
certain commodity prices. Once the liquidity finds some breach, it will have the strong shock
effect in raising prices
Second, since the multiple causes for the inflation are not yet fully awared, this may lead
to over-simplified governance method. Especially, the current monetary administration relies too
much on the dogma of monetarism, and therefore lays too much stress on monetary policies as
governance tool, without taking many actions on market governance, supply management, and
price coordination. This ended up to the governance lacking of multiple channels, not well
targeted, and separated. Now the causes for the inflation have not reached consensus, and the
experts especially do not agree on whether the inflation falls into the type of demand-pulled, of
cost-pushed, of international-input, of expectation-compelled, or of capital bubble-contagious.
At the meanwhile, there are still a lot of opinion divergences in terms of whether the inflation
exists, what the proper range of price rising, how the current CPI should be analyzed, and so
forth. Such divergences are particularly important to face in inflation control, since different
understandings will determinate different control methods.
Third, since the target of inflation is too low, simply sticking with the price level at 3%
may result in more vicious risks due to the too strict economy regulation.
Fourth, currently all the society becomes scared at the high level of CPI at 4.4%, and such
panic may have the risk to spread. The monetary administration overly proclaims the importance
of the target of the price level at 3%, and lays too much stress on the seriousness of the future
inflation. The public, when facing the new formed agricultural product pricing mechanism and
too fast rising prices, overstate the shock effect of the price rising to the daily life. At the same
time, the mass media blooming becomes the catalyst for the expectation of the price rising to
spread. In fact, the panic is not only the basis for the formation of the expectation of the inflation,
but also the normal advertising tool before large sum of fund enter into the financial market, and
as well as enhances the spread of the economic bubble.
III The offset between the new planned stimulus and the downward
driving forces
In 2011, China’s economy faces many downward economic pressures: 1) the tightening
effect caused by the reversion of the monetary policy; 2) the decline of the external demand due
to the change of the external environment; 3) the decline of the real estate trade and investment
owning to the continuing and strengthening of the new regulation on real estate. 4) The shrink of
the heavy industry caused by the reinforcing of the energy saving and the governance of the
excessive of the production capacity. Nonetheless, the essential force to restrain the above
downward forces is that the new plan, in the first year of the twelfth five-year plan, will have
strong effects of the stimulus. More specifically:

52
A. The strongest stimulus in the twelfth five-year plan is the bylaw and specific program for
the emerging strategic industry plan enacted in 2011. The program is essentially the overall
adjustment on the 5 trillion of the stimulus plan enacted at the end of 2008, and thus is virtually
China’ second stimulus plan. The state council’s decision on cultivating and developing strategic
emerging industries enacted on Oct. 18, 2010, has put the program on the strategic level, the
target of which is that the strategic emerging industries, by 2015, will form the basic pattern of
health development and coordinated growth, further pushing the upgrading of the industrial
structure, and that the added value in these industries will ideally account for 8% of the GDP;
and by 2020, the added value account 15% of GDP, absorbing and promoting more employment .
More specifically, the industries of energy saving and environment protecting, new generation of
information technology, bio-technology, and high-end machinery manufacturing will become the
commanding heights of the national economy; and the industries of new energy, new materials,
and new energy vehicles become the forerunner industries. The innovation capacities
significantly enhanced, with many critical high technology mastered, and China will even
become the world leader in some fields. A number of large companies with world level
competence and innovative SMEs will emerge. The new strategic emerging industries will form
some geographic industry clusters with perfect industry chains, strong innovation capacity, and
distinguished characteristics. To reach these targets, the government needs to substantially
increase the investment in these fields. For instance, the planned investment for new energy is
amounted two or three trillion; the orders for the big plane in the high-end machinery
manufacturing industry have reached around 200 billion; then satellite industry 300 – 400 billion,
and the high-end rail transportation industry one billion.
B. Since the establishment of 7 comprehensive supporting reform experimental areas and 15
national strategic regional plans in the 11th
five year plan, in the 12th
five year plan there will be
more regional plans to be established. For instance, ―the bylaws of the second round of the
western development‖, ―the second round of the rising middle region planning‖, ‖Pan-Bohai
regional planning‖, ― the bylaws of accelerating industrial gradual transfer‖, and some
― comprehensive experimental areas‖. All these are to push the overall diversification of China’s
economic growth poles. As for the effects of these programs in the 11th
five year plan, they have
strong stimulus impacts through the way of ―policy leading and experiment first‖ and ―financial
supporting‖.
C. Surrounding the transit of the economic developing pattern, the economic policies will
set the emphasis on the consumption stimulus and promotion, so as to help consumption
maintain a high growth speed. These actions include: 1) the expansion of the policy of ―home
appliances going to the countryside; 2) high-end consumption facilitation within the domestic
market; 3) promoting the reform of the wage composition mechanism, and accelerating the
growth of household income; 4) the reform in the redistribution area, and adjusting the portion
among nation, enterprise and individuals.

53
D. Another essence in the 12th
five year plan is the social reform and social construction,
and thus the people’s well-being engineering will be speeded up. Specifically, it is reflected as
the following aspects: 1) the acceleration of the construction of the low-incoming housing, in
order to compensate the decline of the investment of the commercial residential housing; 2) the
strengthening of the public service, so as to facilitating the increase of residents’ other
consuming expenditures; 3) surrounding the construction of the social welfare, the fiscal
payment transfer will be expanded, in order to enhance the fiscal transfer expenditure effects.
Of course, there are many contents in the 12th
five year plan, on adjusting the industrial
structure and weakening the economic growth target. Yet in consideration of the current power
division system, fiscal mechanism, interest distribution pattern, and the factor of local
government shifting, the first year of the 12th
five year plan will elicit the proactive expansion,
instead of the proactive transit, from the local government and administration at all levels.
Fig 63 the previous shifts of the local govenremnts bring about the investing effect
clearly.

54
Part IV The complex yet stable economy in 2011
2011, for China, is a year with a great extent of complexity, though the overall economy will
be relatively stable. The complexity is reflected in the following aspects:
A. The complexity is reflected in the two opposite clusters of the concurrent forces, which
intertwine with each other in terms of influencing the whole economy. To be more specific: 1)
Leading the forces which stabilize the economy, ―recycling liquidity‖ will become the core of
the economic adjustments, under the governmental regulation principle of ―inflation prevention‖;
2) The consistent and increasingly strengthening regulations on the real estate sector will lead to
some substantial adjustments on the sales and the prices of the real estates, as well as the
investment on them. As a result, the short-termed soft landing of the real estate industry is likely
to induce the strengthening of the forces which stabilize the whole economy; 3) The slowdown
of the recovering pace, remaining high unemployment and continuous trade imbalance in
developed countries, among other reasons, will worsen China’ external environment. In addition,
the conflicts on commodity trade and exchange rates and the fluctuation of the currencies will be
even worse, and put more pressure on China’s economy; 4) Nevertheless, 2011 is the first year
for China’s Twelfth Five-year State Plan on economic and social development. The new plan
incubates the strategic revitalization plan for the emerging industries, the regional development
plan, the people’s well-being project, the income-multiplying plan, and some new consumption
stimulating policies. All of these policies will bring about strong economic stimulating effects,
effectively offsetting various inhibitive pressures; 5) the speeding-up of urbanization, the
forthcoming of ―the era of high-speed railway‖, and the plateau effect of income and
consumption will be the crucial forces for the economic stability in 2011.
B. The release of all these forces has great extent of uncertainty. 1) Due to various factors,
the recycling of the liquidity is rather difficult, and the risk of not being able to achieve the
expected goal still exists. Thus the monetary policy may nominally tighten and virtually slack; 2)
The adjustment on the real estate market face the two-way risk——the concurrent existence of
the sharp rise of the real estate prices due to the failure of the adjustment and the steep decline of
the investment, trade volume, and the prices of the real estates, and the governmental
administration could not find the balance point between adjustment of the real estate prices and
stabilization of the economy; 3) US economy has the risk of keeping decline, but it is also
possible that under the second round of the stimulus plan, US economy may rebound beyond
expectation, leading possible to the reversion of the US Dollar depreciation, slowdown of the
increase rate of the oil price, money flow back, price rising again, and the steady and recovering
price rising for the bulk commodities; 4) the stimulus effect of the 12th
five year plan should
stimulate the economy, but the transit effect in the short run may have tighten the economy.
Meanwhile, the new plan’s stimulus effect may time–lagged to a great extent.
The stability of China’s economy reflects as follows: 1) the inhibitive forces will offset the
promoting forces, resulting in less fluctuations throughout the whole year; 2) Still much room
exists for the policy adjustment, particularly for the fiscal policy adjustment, so as to effectively
control the economic slowdown; 3) the endogenous growth mechanism has formed, and the
market demand has started off. The capability of the market entities to anticipate and resist the

55
fluctuations has been strengthened. Thus, their self adjustment will be able to buffer against
various exogenous shocks.
In 2011, the complex and yet stable economy is specifically reflected as follows:
I. In 2011, the economy tends to slightly drop under the basis of increase speed
normalization, and the GDP year-on-year growth rate drops earlier this year and then rise
up later this year; whereas the period-on-period growth rate tends to gradually drop
slightly. The economic growth of the whole is estimated to be 9.6%, and the fluctuation
range per quarter is within 2 percent.
Fig. 64 The GDP growth in 2011 is relatively steady.
II. From the aspect of the industry, the primary industry, owing to the increasing
input in agriculture, clearly tends to rise in 2011; and the secondary industry drops
obviously in the first quarter and start to rebound in the second quarter of 2011; whereas
the service industry runs relatively steady the whole year.
Fig. 65 The estimations of the three industries

56
III. Due to the last effect of the declining investment, the drop of the increase rate of
the real estate investment, the continuous investment recession in manufacturing industry,
and the tightening credit policies in 2010, the increase rate of the whole year investment in
2011 further drops. However, thanks to the enactment of the 12th
five-year plan, and the
clearance of the local investment and financing platform basically completed, the drop of
the investment has been effectively restrainted, and the whole year investment onlly drops
0.6% than that of 2010.
From the perspective of the sources of the fund, the investment source for the fixed assets
in China began to decline at the end of 2010, dropping from 39.2% at the beginning of the year
to 25% now; whereas the investing money to be paid increase rapidly, from 16.4% at the end of
2009 to 34.8% now. Therefore, impacted by the reversion of future monetary policies, tightening
credit, and rising interest, the shortage of the investing money will be worsen, and the investment
will substantially decline in the first quarter 2011.
Fig. 66 The pressure for the declining investment is intensified.
Meanwhile, from the estimation results of the quantity of the investment projects and the
planned investment scale of the new projects started off, the projects under construction and the
investment volume the first half of 2011 greatly decline than those in the same period of 2010.
Fig. 67 The leading data indicates the investment will decline in future.

57
Due to the drop of the export, the investment of the Chinese export-oriented enterprises and
manufacturing investment will be in continuous depression, impacted by the export-investment
coordinated mechanism.
Table 5 the relations between the growth of the
Export and growth of the investment
5
15
25
35
45
55
65
2001-10
2002-03
2002-07
2002-11
2003-04
2003-08
2003-12
2004-05
2004-09
2005-02
2005-06
2005-10
2006-03
2006-07
2006-11
2007-04
2007-08
2007-12
2008-05
2008-09
出口累计增速(%) 固定投资累计增速(%) -
Of course, the core reason for the
substantial decline of the investment is still the reversion of the real estate market. Particularly
when the financing chain of the real estate enterprises breaks, the real estate enterprises will
adjust their operation pattern, leading to the investment adjustment in the first and second quarter
2011 and making the investment scale drop.
IV. Under the basis of the continuing of the new regulation policies on real estate, the
adjustment of the monetary policy and the strengthening of the regulation on the real
estate industry, as well as the serious problem due to the broken of the financing chain in

58
real estate industry, cause the complete
adjustment on the market of the real
estate and the substantial decline of the
growth rate of the real estate investment. At
the mean time, under the pressure of the
dumping of some real estate enterprises, the
price of the real estate will close to a
decline of 20%, but will not end up in a
hard landing of the whole real property
market.
Generally speaking, China’s real estate market has not enter into the adjustment phase,
since the capital in the whole real estate market is still abundant, and thus the real estate
enterprises can still rely on the fund reserved before and maintain the high prices. From Jan to
Oct., the fund sources increase at the speed of 32%, keeping at the high level in history; whereas
the accumulated increase rate of the account payable is only 26.9%, lower than the average level
from 2006 to 2008. Meanwhile, from the perspective of the liquidity of the enterprises, the
current liquidity indicator——cash and cash equivalent /( short term debt plus non-current
liability due within this year) is around 1.4, though worse than in 2009, still far higher than that
when the real estate is on sale, 0.8.
Fig. 68 the funds in the real estate sector are still abundant, not yet approaching the
adjusting point.
But such situation will be completely reversed in the 2nd
quarter of 2011. First, the real
estate enterprise will undergo the peak time of repayment, and the increase of the accumulative
account payable will exceed 30%; Second, the fund source will be rapidly worse, due to the
decline of the sale, bar raise of the load threshold, listed companies’ increasing offering, and the
more difficulties of the notes financing, and the fund sources are estimated to substantially

59
negatively increase in the first quarter of 2011. Third, Owing to the changes of the down
payment ratio and mortgage requirements, the various leveraging ratios in the real estate
enterprises all decline. According to the estimation, by the 1st quarter of 2011, the financing
liquidity indicator——cash and cash equivalent/short term debt plus non-current liability may
drop to about 0.9.
Fig. 69 the funds sources will be intensified.
In comparison, while the government strengthen the development of the land and real estate
and rectify the market order, the real estate investment and new projects greatly increase, leading
to the high pressure on the future capital demand, and thus resulting in the rise of the market
demand. In January 2010, the recovery growth of China’s residential housing construction just
finished, and then in March, 2010, the total area of the new-started residential housing and that
of the under-construction ones began to significantly rebound, being into the phase of the
investment acceleration. The accumulative area of the new-started residential housing, from Jan
to Oct., increased period-to-period by 60.8%, 53.9% and 60.4% higher than in 2008 and 2009
respectively. The area of the under-construction ones increased period-to-period by 26.9%, 7.4%
and 11.9% higher than in 2008 and 2009 respectively. The real properties completed in 2011
calculated according to the construction period being around one year, the supply of the
residential housing will greatly increase around March, changing the current situation of
relatively tight supply. And this schedule is coherent with the timetable when the fund in the
whole real estate industry is tight and the operation pattern is adjusted. Thus, the normal
estimation is that March and April, 2011, are the time when the real estate market is adjusted.
Fig. 70 the supply of the residential housing will be increase in future.

60
Nonetheless, what needs to be reminded is, that the current real estate market is unlikely to
crash, nor does the price likely decrease by above 30%. Thus the real estate market will achieve
the soft landing. The essential reasons are: first, the leveraging ratio of the developing investment
is not high, only over five times, about 30% lower than that in the developed countries, therefore,
the tightening of the fund will not lead to the adjustment ad in the financial crisis; second, the
consumption ratio is also not high, decline from the 1.74 in 2009 down to 1.3 now, hardly
eliciting the complete dumping by the residents; third, the enterprises’ assets and liabilities are
still healthy. By the third quarter, the asset-debt ration of the whole real estate industry is about
67%, 3% higher than early this year. Thus, it is unlikely to appear the overall worsening of the
assets-debts ratio, which then leads to the complete readjustment. Therefore, the adjustment of
the real estate market in 2011 is the adjustment pushed by liquidity, similar with the pattern in
the second quarter in 2008.
Fig.71 The leveraging ratio is not high in general

61
Fig. 72 the assets-debts situation in the real estate is good.
V. Due to the combine impacts of the world economy slow down, inventory cycle
reverted in the main developed countries, the worsening of the trade conflicts and exchange
rate conflicts, reevaluation of the Renminbi and the rising of the internal costs, China’
export in 2011 will drop, and the trade surplus will slightly decrease. Nevertheless, owing to
the factors such as the offsets of the second stimulus plan in the developed countries and
the strengthening of China’s trade advantage, the extent of the export fall will be smaller
than the general market expectation. China, under the basis of normal development, starts
to step into the phase of exteriorly rebalancing and adjustment.
Fig. 73 the leading index in US and Euro Zone predicates that the growth of China’s export
will drop.

62
A. the Composite Leading Indices in Europe and US hitting the top target predicate the
pressure on China’s decline export in the 4th
quarter. The OECD Composite Leading Index is a
good predictor for china’s export growth, the former leads the latter about 4 months ahead.
Although the current OECD Composite Leading Index continues to rise, the rising speed has
passed its high point. (See Fig.37) Meanwhile, influenced by the European sovereign debt crisis,
the liquidity, consumption index, and the employment index all revert. Thus, the economic boom
in Euro Zone and US will peak in May and June respectively; and accordingly, the decline of
China’s export will obviously decline after October.
B. the peaking of the inventory investment in developed countries predicates that China’s
export growth will significantly change in the middle of the 4th
quarter. Furthermore, as the
above mentioned, that the export from China, Germany, and the whole east Asian region
simutanuously grew rapidly from Jan. to June, 2010, is mainly because that all of the world,
particularly the developed countries, were then in the phase of stock compensation in the
inventory cycles. Yet the current stock compesation mostly reflected in the finished goods and
raw materials, leading to the substential increase of the export demand fo those finished-good-
exporting countries. Genrally speaking, the stock adjustment in US lead that in China for about
4 months. Thus when the stock compensation in US hit the top in the 4th
quarter 2009, that in
OECD countries hit the high point in the 1st quarter 2010. This means that the stock
compensation in developed countries will significantly fall down in the 2nd
and 3rd
quarters this
year, which will directly result in the significant drop of China’s export in the middle of the 4th
quarter. This shall be demonsteated by the data in Fig. 39. The contribution ratio of stock
investment to the GDP in the OECD countries will drop by 1.4%.
Fig. 74. The contribution of stock invesntment to GDP in OECD countries.
C. Influenced by the slowdown of the world economy, and the worsening of the exchange
rate and trade conflicts, the grow of he world trade will substentially slowdown, which will
directly lead to the slowdown of China’ trade growth. In 2009, the volume of the world trade
decreased by 11.6%, whereas in 2010 it is estimated to increase by 11.4%, and in 2011 increase
by 6.9%, 4.5% back from in 2010. This means China’s exterior demand will significantly drop.

63
Fig. 75 the Growth of the global trade will significantly decline.
D. Renminbi’s exchange rate is forced to be reevaluated and China will return to the
track of exchange rate reform. This will make Renminbi virtually reevluate, giving shocks
to China’s export 4 to 6 months later.
Fig. 76 The Renminbi’s effective exchanging rate index
As shown in Fig 40 & 41, since the 1st quarter 2009 through early November 2010, the actual
real exchange rate and the nominal exchange rate of Renminbi, due to the appreciation of US
dollar and the deflation of EURO, has been directly reevaluated. Since late June 2010,
Renminbi’s exchange rate system has started to be reformed again, pegging Renminbi to a basket
of currencies and allowing fluctuation with the range of 0.5%. According to the estimation by the
Renmin University, the reevaluation will have some shocks to the export by the extent of 6% to
7% from April to June.
Fig. 77 the relation between the exchange rate and the export indicates that the export
to the EU will further decline.

64
E. The gradual exit of China’s stimulus trade policies will also impact China’s export in
future, particularly reflected in the cancellation of the tax refunds on 406 previously taxed items.
Although the adjustment this time is named as the structural adjustment, and mainly focused on
―Two-high industries‖which account for 3% of the total HS codes and about 1% of the total
export in 2009, such adjustment still has very strong signal effects.
F. the wage level in the export-oriented enterprises will also have some impacts on the
export. Especially after the event of FOXCONN, the reversion of the supply-demand relation for
the low-end labor market, and the worsening of the labor disputes compell many foreign owned
enterprises raise their employees’ salaries. And local governments greatly raise the minimum
wage standard, directly having impact on the China’s labor-intensed exporting industry. And
such impact will not immediately emerge when the current production efficiency growth rate is
still high.
Fig.78 the Minimum wage level grew rapidly.
0
5
10
15
20
25
2006年 2007年 2008年 2009年 2010年
最低工资增速 劳均名义GDP增速
But what is noteworthy is that the extent of the export drop in 2011 may be smaller than
expected, and the export drop has some uncertainties.
A. China’s export order index tends to be steady in the second half of the year, yet the order
of the Canton Fair increase lower than expected, showing that the future decline of the export has
some uncertainty. From Jan. 2009, China’s export orders index strongly rebounded and boomed

65
in the 4th
quarter of 2009. However, such situation reversed from March, 2010 and the index
declined by 2.8% from March to June. ( See Fig.) The tendence of such decline is basically
conherent with the situation about the orders placed on the Canton Fairs in 2010. Specifically,
the export orders on the 108th
Canton Fair is slightley more than on the 106th
Fair, and the orders
are mainly short-term ones.
Fig. 79 China’s export order index
B. US, Japan, and European developed countries take some offsetting policies to deal with
the economic decline. US, Japan and UK particularly took the second round of the slack
monetary policies and the relevant fiscal stimulus policies. These policies may cause the
developed countries’ rebound from the economic decline beyond expectation. For instance,
Japan’s GDP growth exceeds the expectation by 3.6% in the 3rd
quarter, and the consumption in
US continues to rise in Oct., and the price level in Europe started to rise under the impact of food
prices and the slack monetary policies.
C. The polarization of the world economic recovery and the diversification of China’s
exporting structure also partly avoid the shock by the decline of the European and
American developed economy. The trades between China and the emerging market
countries and other developing countries maintain in a high amount volume and a steady
growth.
D. The improvement of production efficiency in China effectively offsets the negative
impact due to the Renminbi’s reevaluation and the rise of the labor costs. The further promotion
of China’s international competitative advantge after the crisis also built the foundation for the
stablization of the China’s trade. Shown in the Figure below, the manufacturing labor cost in
China is rising, but the production efficiency ratio rises faster, resulting in the unit labor cost
remaining in the range of declining. Since 2008 the percentage of the trade with China to the
volume in the whole world has consistantly increase to nearly 10%, and the market share in US
also further developed. These all demonstate that China now has the competitative advantage.

66
Fig. 80 the Unit labor cost and its composition in China
Fig.81 The percentage of the Chinese-imported consumer goods in the US market
0
5000
10000
15000
20000
25000
30000
1978 1981 1984 1987 1990 1993 1996 1999 2002 2005 2008-10
10
30
50
70
90
110
130
150
劳动生产率 制造业平均工资 单位劳动成本
Fig. 82 the percentage of China’s international trade in the total world trade
VI. Under the impacts of the
reversion of the monetary policies,
recycling liquidity, the drop of the
vegitable prices, and the expected
approproate adjustement, the price
rising and the spreading of the
ecoomic bubbles will be effectively
restrainted. Nevetheless, the liquidity
cannot be adjusted to the ideal level in the
short run; the liquidity of the real
estate market spills over; various costs rise; and the prices of the international bulk
10
20
30
40
50
1990 1992 1994 1996 1998 2000 2002 2004 2006 2008
Durable goods
Nonurable goods
consumption
%

67
commodities continue to be high. Thus the pressure of the prices still exist in 2011, and the
growth rate the whole year is 3.0%. In future, the CPI growth at the level of 3% may be
normalized.
A. Even if the growth rate of M2 maintained at level of 17%, and the credit set at the
amount of 7 trillion, a relative neutral postion , the liquidity stock in future is still large. The total
deposit will exceed 82 trillion, and the indices such as M2/GDP and the difference between M2
and GDP growth rate are still high. Among them, M2/GDP at the current value will reach 1.92,
remaining the high level in history. If reasoned backward according to the M2/ GDP at the
current value in 2010, the growth rate of M2 in 2011 must be reduced to 14%. But this possiblity
is nearly zero, therefore, the liquidity problem can not be resolved in the short term.
Fig. 83 the liquidity is still high on the basis of the neutral plan in 2011
B. The food prices will remain in th high level, the year-on-year growth will reach the level
f 6-8%. This is mainly determined by the rising of the agricultural production costs, particularly
the rising of the rural migrant worker’s wages, which impact most the opportunity cost of the
agricultural production. At the mean time, the essential reason for the rising of the food prices
are from grain and vegitables. According to the calculation, the inertia coefficeint of the rising
food prices is 0.68, and the its lasting time longer and the influence range wider. The vegitable
prices, however, will be gradually digested within 2 months, and thus the CPI will fall in the
level of about 3% in the future 3 or 4 months.
Table 6 the inertia coefficent of the rising price for the food in China
价格上涨惯性系数(基于环比增长年率计算)
The inertia coefficent of the rising price ( calculated based on the chain
growth)

68
粮食 grain 0.68
肉类 meat 0.64
蛋类 eggs 0.28
水产 aquatic products 0.28
鲜菜 fresh vegetibles 0.00
鲜果 fresh fruits 0.21
C. Since the prices of the internaional bulk commodities and the oil is very likely to keep on
rising, the prices of the imported tend to rise, though there are some reversive factors such as
strong US dollar, capital flow back, China’s domestic demand declining, and so forth. From the
changes of the current price index of the imported commodities, we can see that the growth rate
excceeds 10% although dropping from the high level. Therefore, the imported factor needs some
time to be digested and absorbed.
Fig 84 the growth of the imprted price slow down, yet still in the high level.
Of course, we should treat the pressure of the price rising in 2011 more rationally and
completely, and should not just notice the factors which cause the prices to panic rising, whereas
ignore the following operating characteristics:
a) The current price rising and the so incurred CPI rising is not unique in China. Some
emerging market countries and other Asian countries also face the same problem. Meanwhile,
from the respects of M2 level, CPI and the rising range, China is still in the middle area.

69
Fig. 85 the food prices in Asian countries increase sharply.
b). The current price rising is essentially different from the price risings in the middle and
late 1980s, early and mid-1990s, and 2004-2007. First, the extent of the rising is much smaller;
second, the price form mechanism has new characteristics and varies. Especially under the basis
of the capitalization of the agricultural products, the worsening of a few agricultural products has
strong leveraging effect, news effect and threshold effect, thus changing the traditional price
forming mechanism of the agricultural products and the conducting relation between M2 and
CPI; third, currently the supply-demand of the total society is basically balanced, unlike the price
risings previously or the rising in the time of shortage.
Fig. 86 the prices of the agricultural products increase faster in 1990s

70
c) Now there are still some forces for the downward price. Especially, the overall prices of
the industrial products are in the phase of recovering, and the problem of the capacity surplus
will restrain the fast rising of the industrial products prices.
Table 7 the price recovery in Sep. 2010
种类 type 恢复同等价格水平的时期 the time
period of the same price level recovered
to
工业品 industrial products 2008.2
加工工业 processing industry 2008.10
重工业产品 heavy industrial products 2008.12
采掘业 mining 2009.1
进口商品 imported goods 2009.1
原材料 raw materials 2009.1
d) The essential part of the price rising is owing to the grain of the food type and the
vegetables. Since the inertia of the vegetable’ price rising is small, the price rising will not last
long.
e) The price speculation of the agricultural products is mainly on the spot goods, thus the
high prices will be hardly maintained.
f) The real economy is not overheated, and the bottle-necked industries such as coal,
electricity, oil, and transportation have no suffered shortage or overheat.
g) Part of the cost-pushed and reform-released price rising has some reasonability; the
monetary administration should raise the bar of the target price level to adjust the price properly.
h) Today the inflation pressure for the whole world is not large, and the change tendency for
the international bulk commodities has some uncertainty.
VI. In future the consumer confidence may drop back; the consumption stimulus policies
may has less impact; the consumption of real estate and related commodities may decline; and
the infrastructure to support the consumption of the automobile are not adequate. Nevertheless,
in 2011 the consumption will still remain in the high level, since the income is consistently rising,
further consumption stimulus policies are enacted, and other social reforms are propelled

71
comprehensively. The nominal growth of retailed consumption in the whole society will be
17.8%, though price factor deducted, the real growth of the consumption is equivalent to that in
2010.
The driving forces for the fallback of the consumption are in the following three aspects:
A. Impacted by the fallback of the economic growth, the consumer’s confidence index now
drop accordingly, from 108.5 in June to 104 now, still a large discrepancy from that in the
prosperous time.
Fig 87 the consumer confidence index declines
B. In future, influenced by the decline of the sale of the real estate, the home improvement
and furniture consumptions related to the real estate will probably significantly fall back by the
end of the 1st quarter of 2011.
Fig. 88 the consumption related to real estate develops well.

72
Fig. 89 the sale of the real estate promotes the downstream consumption.
C. Due to the existing large number of the automobiles, the sharp increase of traffic jams in
cities, and the steep rising of the consuming expenses, the consumption of the automobiles is
hardly remained high. In 2011 the growth will probably drop back to the normal range from 20%
to 25%.
Fig. 90 the growth of the car sales drops from the high level
The driving forces for the consumption include the following aspects:
A. The stimulus policies will remain, and the governmental planning consumption, to
expand and guarantee the consumption, will not decline much.

73
In 2011, many consumption stimulus policies and income stimulus policies will remain
valid, and meanwhile many policies will further expand, in order to provide basis for the
continuing impact of the policy impact. These policies include the expansion of the home
appliances going to the countryside, and the start-off of attracting the high-end consumption in
domestic market, and the start-off of the electronic commodities to the countryside.
B. the consistent rising of the incomes for the various classes in China will further start off
the income-consumption stepping effect, driving the market consumption more.
In 2011, the price level and the appreciation of Renminbi considered, the national GDP per
capita exceeding USD4,000 implies that the consumption structure will completely enter into the
era of industrialized consumption, with consumption updated quickly. From the rural side, the
per capita cash income exceeds USD 1000, just past the international standard of adequate food
and clothing and approaching to the critical point of the industrialized consumption; From the
urban side, in 2008 in per capita income reached USD 2500, approaching USD3000 in 2009 and
USD3200 in 2010, the variation point of the updating industrialized consumption; From the
developed area, the per capita GDP in Beijing and Shanghai in 2011 exceeds USD12,000, and
the actual per capita income exceeds USD5,000, signifying the stepping into the stage of the
world level high income, thus in the time point of transferring to the pattern of the post
industrialized consumption.
Table 8 The various classes in China may simultaneously face the critical points of the
income-consumption-stepping-effect
2008 2009 2010
农村家庭人均现金
收入(美元)
Income per capita of
the rural household
(USD)
840 930 1088
城市家庭人均实际
收入(美元)
Income per capita of
2500 2800 3276

74
the urban household
(USD)
京沪城市家庭人均
实际收入(美元)
Income per capita of
the household in
Beijing and Shanghai
(USD)
4200 4700 5499
全国人均 GDP(美
元)
GDP per capita in
China (USD)
3323 3602 4214
京沪人均 GDP(美
元)
GDP per capita in
Beijing and Shanghai
(USD)
9967 10864 12711
C. The 12th
five year plan will speed up the constructions of the civil well-being engineering
and the reform for the income redistribution, and propel the comprehensive reform on social
welfare and public service. All these will have strong and lasting effects on the start-off of the
consumption.
75
Part V Policy Suggestions
From the analysis of the above parts, we can see that 2010 is a year when the fall tends to be
steady and the growth will step into the normalized zone. In 2010, the inner driving force
mechnism for china’s economy growth has been started off and solidified on the path of
continuous recovery. However, the liquidity surplus, the worsening supply-demand relation for
some agricultural products, and the significant rising of the international bulk commodities, all
caused by the 4 trillion stimulus plan, led to the spreading of the economic bubbles, consistent
rising of he prices, and the serious impact on the low-income class, even though China’ s
economy has not been over-heated.
2011, for China, is a year with a great extent of complexity, though the overall economy
will be relatively stable. The complexity is reflected in the two opposite clusters of the
concurrent forces, which intertwine with each other in terms of influencing the whole economy.
On one hand, the economy has the driving forces further pushing upward, owing to the start-off
of the 12th
five year plan, the steady growth of the consumption, and the speed-up of the
urbanization; on the other hand, due to the reversion of the monetary policies, the change of the
real estate market, the slowdown of the global economy, energy saving, the strengthening of the
76
governance of the capacity surplus, the economy also faces the pressure to be downward.
Meanwhile, the continuous existence of the pressure of the price rising and the changes of
various forces make the economy in 2011 even more complex. Therefore, 2011 is also a year
when the effectiveness of the government’s economic regulation will be tested.
First, in 2011 the bull-bear intertwined, yet the basis for the economic recovery is strong,
and the endogenous economic driving forces are solidified. Thus, even though the economic
growth slightly drops than in 2010, we should also adjust the economic growth target to a
moderate level, in order to help control the price rising and the start-off of the 12th
five year plan.
The critical part of the economic adjustment in 2011 should be price regulation, plan
enforcement and recovery stabilization.
Second, to regulate the spreading of the economic bubbles and the continuous rising of the
prices, the policy of recycling liquidity is the major measure to be taken. Some additional actions
may also include, but not limited to, the governance of the market rules, stabilizing the supply
and demand through different channels, tolerating the moderate price-releasing, the expected
instruction, and so forth.
a) In 2011, the current moderately easy monetary policy should be switched to neutral-
positioned. It is suggested that the increasing rate of M2 be no more than 17%, and the new
incremental credit maintained at the size of 7 to 7.5 trillion. In order to achieve the goal, the
central bank may keep around 150 -200 base points of the deposit-reserve ratio and increase the
interest rate moderately at the same time.
b) In consideration of the more pressure for Renminbi’s reevaluation, the impact by the
second round of the slack monetary policies by the US, and the factors of the international
capital variations, interests should be raised too often, nor raised too high each time, so as to
avoid the possible conflict between the price-typed monetary policies tools and the exchange rate
policies. The central bank should rely more on deposit-reserve ratio, open-market operation, and
stress more on the scrutinized regulation and regulation standard, in order to recycle the liquidity.
c) Pay more attention on the impact of the flow-in-and-out of the hot money, and
emphasized the regualtion on the hit money through the multiple channels such as trade,
investment, and the financing exchange. Prepare the reform on regulation method about both the
capital account and financial account, to make the short term capital flow in tranparency under
the appropriate leading. The uncertainty of the hot money’s scale brings more burdon than the
pure impact by the hot money does to China’s economic regulation.
d) the monetary adminstration should pay high attention on the price rsing, but at the same
time, should not exaggerate the impact of the inflation to the economy, in avoidance of the
inflation panic which will propel the spreading of the economic bubbles. The govenment should
further improve the transparency of the supply and demand information on the main
commodities, set up the notification system for the suppya nd demand of the commodities, I
order to allivate the people’s panic on the food supply now.

77
e). In the short term, the government must stop the companies’ speculation and hoarding of
the important commodities, rectifying the market order. Pay more attention to the variations of
the price formation mechanism in this modern era with capitalization of the bulk commodities.
Pay more attention to the leveraging effect, news effect, and the threshold effect after the
changing of the supply-demand relations of some products. Promptly use the reserve and
international market to modrate the short term changes of the supply-demand relations,
preventing the contagous effect due to the price rising of the some products.
f) In the light of the various factors for the price rising of the agricultual products, it is most
important to emphasize more on agricultural production in the long run, so as to speed up the
urbanization and meet the requirement of the industrilization. First, stress more on the
infrastructure for the agricultural development, facilitate the transformation of the agricultural
production way; Second, sustentially raise the subsidies for the agricultrual production, to offset
the high cost of the agricultural production, and reform the subsidy distribution way; Third,
further enhance the reform of the agricultual distribution mechanism.
g) Since the core CPI is not very high in China, the economic problem caused by the CPI
rising is not very serious. The much more serious problem is that welfare of the low income
people is worse. Thus, we should not attribute the civil wellbeing problem due to the inflation to
the more general level; instead, we should improve the construction of the social system, such as
indexing the low-income subsidies impacted by inflation, and indexing the minimum wage
impacted by inflation. In this way, the low-income people’s protective ability to the inflation
impact will be improved, and the enactment of the monetary policies can be considered without
too much concern in the problems of civil wellbeing and life.
h) In light of the fact that China’s economy is in the stage full of changes on labor structure,
industrial structure, and demand structure, the price rising caused by structural adjustment and
deep-rooted reform is somewhat reasonable and necessary. The target of China’s monetary
policy should be adjusted relatively higher, rather than simply copy the past target or that of the
developed countries, and the suggestive value is 4%.
i) The monetary policies should not only stress on the difficulties for recycling liquidity, but
on the much liquidity variation left in the real estate and other capital market. The monetary
policy should restrain the overall volume, and focus on the structural adjustment as well.
j) Properly use the exchange rate policies and trade policies to offset the pressure for future
inflation.
Third, since the fund in the current real estate industry is relatively abundant, and not yet
reaches the adjusting point where financing chain is tight, the regulation on the real estate should
be persisted. Considering about the reversion of the monetary policies is still necessary for
further tightening the capital with the real estate industry. But in the relatively long term, the
situation that demand exceeds supply does not change, and deep-rooted systematic problem is
78
yet to be resolved. After the overall adjustment on the real estate market, the exit of this round of
new regulation, mainly in the way of administrative intervention, may also bring about the
rebounding rising of the real estate prices. Thus, the regulation on the real estate must be based
upon the consistent and steady operation, and gradually enact the institutional policies to achieve
the goal of ―stabilizing demand, expanding supply, crushing economic bubbles, and correcting
distortions‖, and finally change the shortage of real estate supply fundamentally. Therefore, the
government should not only carry out the construction of the subsidized residential housing, but
also allow more lands to be legible for housing and expand the real estate investment; whereas
the systematic reform such as the real estate transaction tax should be pushed gradually.
Specifically:
A) The goal of the real estate adjustment should be changed and not diversified. In the short
term, the policy may be focused on the control of the financial flow; whereas in the mid-term the
supply increasing and the mechanism development shall be the essential strategy.
B) It is necessary to pay high attention to the variations of the financing chains of the real
estate companies and the adjustment of the path and depth of the future real estate market.
C) The construction of the subsidized residential housing must be significantly changed in
structure. More specifically, build the low-rent housing and public-rent housing as the main
subsidized projects; encourage the local government to pursue innovation in the construction of
the subsidized residential housing, and substantially raise the portion of the central fiscal fund
used in the above construction.
d) Although the reform on the government’s fiscal and taxation system is the key to a
reasonable price-formation mechanism for the real estate, it is still important to adjust the
supply-demand relation in the market. The government should not only change the improper
policies in the land market, but also change the no-action policy in the subsidized residential
housing. The real estate taxation is the general direction, but its enactment may be postponed, as
the steep decline of the real estate investment will result in the total imbalance.
Fourth, to match up with the Twelfth Five-year State Plan, the fiscal policy shall, in contrast
with the generally prudent monetary policy, remain proactive in terms of the total volume.
a) In 2010, the fisical surplus is large, and should be partly put into the buffer fund, and
partly used to support various social reform in the 12th
five year plan, but not suitable simply for
the infrastructure construction or other project investment.
b) In 2011, the fiscal deficit may be expanded according to the demand. And the major
deficit may be accounted for by the local governmental bonds, on the basis of broadening the
local governments’ authority on bond issuance. The suggestive total volume will be around 0.4
trillion.

79
c) While reinforcing the the clearance of the local financing platform, the government
should particularly reform the taxation system as the experimental project. For instance, local
governments should be allowed to issue municipal bunds, as a pilot program to explore the
transformation of the taxation system.
d) The tax reduction and the transformation of the taxation system should be equally
emphasized and enforced. In income structure, first the corporate income tax and individual
income tax levy system should be improved, and the portion of the two kinds of taxes in the total
government income should be raised, making automatic stabilizer more effectively prevent the
economic fluctuation, and be a more powerful regulation tool to manage fluctuations. Second,
raise the tax rate of some carbon-contained products to 30%, and reduce those of other products
to the recomposed value added tax rate. Thus, while the portion of the value added tax is reduced,
the global pollutants such as carbon dioxide and the local pollutants such as SO2 are also
reduced. Third, the inheritance taxation and gift tax must be established.
e) To balance the multiple goals in the new era, we also need to make the adjustment
accordingly to the expenditure structure. As the main content of the automatic stabilizer, the
unemployment insurance must be significantly enhanced. The portion of the unemployment
insurance expenditure in GDP needs to be raised from 0.07& in the period of the 11th
five year
plan to 0.5% in 12th
five –year plan. The improvement of unemployment insurance system not
only will stabilize the economy, but will also improve the income distribution. Besides, to
improve the income distribution, the government also needs to significantly the portion of
societal support expenditures, particular of low-income security in city and rural areas, in the
total fiscal expenditures.
f) The central government should reduce the size of the transfer payment, and transform
itself from the policy maker to the public service provider. To balance the above goals, in the
period of 12th
five year plan, the fiscal relationship between the central government and local
ones, still need many adjustments. The enterprise income tax, individual income tax, and the
unemployment security must be in the charge of the central government, in order to make the
automatic stabilizer work better, and to make taxation and expenditure the effective regulation
tools. It is necessary to establish a nationwide unified medial-insured, unemployment security,
and societal support system charged by the central government. The role of the central
government also needs to be transformed from the policy maker to the public service provider.
To accomplish the transformation, the transfer payment from the central government to the local
governments should also be eliminated accordingly.
Fifth, the consumer policy should be focused on the long-term institutional adjustment
rather than the transient stimulations.
a) It is strategically meaningful in terms of how the Income-Multiplying plan will be started
off.

80
b) The positive meaning of the wage increase should be faced properly, whereas the irritable
transition syndrome should be avoided, in prevention of the negative effect of the salary increase.
The reform on wage formation system, driven by the market, should enhanced.
c) The infrastructure for the low-income consumer groups shall be actively explored, such
as the intranet reconstruction in the campaign of the home appliances going to the countryside,
and the redevelop of the telecommunication facilities in the process of carrying out the program
of the electronic products going to the countryside.
d) The reform on the localization of high-end consumption should be actively pursued. The
tools such as some tariffs and special territories for the consumption may be used to promote the
localization of the high-end consumption in China.
e) Moreover, the construction for the civil transportation infrastructure should also be
accelerated to dilute the dominant role of the automobile sector in the total consumption.
Sixth, the transition period is often characterized by recovery without innovation,
diversification of the driving forces for economic growth, and uncertainty for the emerging
industries. The government should not take too many administrative actions, hastily searching
for the driving force source for the next period in a short term, and forcibly encouraging the
industries without techinical and market foundations. On the contrary, they should focus on the
system reform and innovation, and invest more on the human capital at the same time, so as to
set basis for the searching of the new growth point and industrial direction. In the 12th
five year
plan, the polices, based more on marketm should be taken in order to revitalize the industry and
support the science and technology innovation.
Seventh, The failures of the various administrative rebuilding of the industrial structures
since the new century have proved that any structual readjustment, if not considering the change
of the international labor division and the factors in the mid-termed industry reconstructure, will
doom to fail. The coming of the Lewis Turning Point in China starts off the marketization of the
wage formation system for the low-end labor in China, and as a result, China’s marketization of
the structual readjsutment. The government should highly value the importance of the change of
the turning point, and the actions about the structural reform should serve the system of such
turning point. Therefore, the priority of the current reform should be to enhance the the social
security system for low-end labors, to fully implement the Labor Law, and to speed up the
supporting reforms to the urbanization.
Eight, since the future economic decline are not only due to the periodic shrink of the total
demand, but also to the impacts from the supply side in the investment inflation and decline in
last period, The economy policies should include the normal policies about demand to prevent
the total demand to decline sharply. More importantly, the policies in cosideration of the supply
should also be started off, to upgrade the outdated capacity and clear the surplus capacity in the

81
level of supply management, so as to avoid the various interest conflicts when adjusting the
capacity in the booming period.