1. Introduction - Web viewGlebe Markets and the Glebe Street Fair37. 9.1 Awareness of and Attendance...
49
The Glebe Precinct Intercept Study Prepared for: The City of Sydney
Transcript of 1. Introduction - Web viewGlebe Markets and the Glebe Street Fair37. 9.1 Awareness of and Attendance...
The Glebe Precinct Intercept Study
Prepared for:The City of Sydney
May 2015

The Glebe Precinct Intercept Study May 2015
Table of Contents
1. Introduction.............................................................................................................................4
2. Key Messages...........................................................................................................................5
3. Methodology............................................................................................................................7
4. Description of Glebe.................................................................................................................9
5. Precinct Visitor Demographics................................................................................................10
5.1 Age and Gender Profile........................................................................................................... 105.2 Household Income...................................................................................................................115.3 Household Structure................................................................................................................125.4 People Living within Household..............................................................................................135.5 Occupation.............................................................................................................................. 145.6 Incidence of Working in Glebe................................................................................................15
6. The Glebe Visit......................................................................................................................16
6.1 Place of Residence...................................................................................................................166.2 Mode of Transport Used......................................................................................................... 176.3 Where Visitors Travelled From................................................................................................186.4 Frequency of Visitation............................................................................................................206.5 Reason for Infrequent Visitation of Glebe...............................................................................226.6 General Purpose of Visit..........................................................................................................236.7 Specific Reason for Visiting......................................................................................................246.8 Shops and Services Used.........................................................................................................256.9 Plans to Visit Shops or Businesses in Glebe.............................................................................266.10 Frequency of Eating in Glebe.................................................................................................27
7. Perceptions of Glebe and Suggested Improvements..............................................................28
7.1 Description of Glebe................................................................................................................287.2 Suggestions to Improve Glebe.................................................................................................297.3 Other Shops or Services Needed.............................................................................................307.4 Perceived Adequacy of Public Transport.................................................................................31
8. Visitation of Other Shopping Precincts...................................................................................32
8.1 Shopping Precincts that Visited in the Last Six Months...........................................................328.2 Other Areas for Product and Services Available in Glebe........................................................338.3 Incidence of visiting Glebe to specifically visit Broadway........................................................35
2

The Glebe Precinct Intercept Study May 2015
8.4 Spend Level at Broadway Shopping Centre.............................................................................36
9. Glebe Markets and the Glebe Street Fair...............................................................................37
9.1 Awareness of and Attendance at the Glebe Market................................................................379.2 Frequency of Attending the Glebe Markets – By Usage..........................................................389.3 Incidence of Visiting the Markets and the Shops and Restaurants on the Same Visit.............399.4 Attendance at the Glebe Fair...................................................................................................40
3

The Glebe Precinct Intercept Study May 2015
1. Introduction
Glebe is a suburb in the Inner West of Sydney, roughly 3km South-West of the Sydney CBD. Glebe Point Road is the main thoroughfare through Glebe and runs from Parramatta Road in the South to Rozelle Bay in the North. The majority of the areas shopping precinct is positioned along Glebe Point Road and Broadway.
The City of Sydney was seeking to obtain a better understanding of the precinct and the people who use the area in order to help guide both the City of Sydney and Glebe businesses in their strategic decision making.
Information needs were based around understanding people who use the area and the businesses that service them more effectively. This entailed examining the people visiting, shopping or using the Glebe precinct via a Customer Intercept Survey which was undertaken by Woolcott Research.
This report details the finding of the Customer Intercept Survey that was conducted between the Wednesday 4th of March and Saturday the 21st of March 2015.
This report provides a profile for customers visiting Glebe including;
A demographic profile of Glebe respondents; Shopping patterns including store types visited / and frequency of visitation of Glebe; Perceptions of the precinct; Suggestions for overall precinct improvement; Use of the competitive shopping strips/areas; and Awareness and attendance of the Glebe Markets.
4

The Glebe Precinct Intercept Study May 2015
2. Key Messages
The respondent profile in Glebe was diverse, with a wide range of visitors evident, typified by a skew towards younger people aged 20 to 39 years old (51%). This young respondent base was also reflected by close to a quarter of respondents (24%) currently students, with most living in share households (28%) and a smaller proportion living with their parents (11%).
Despite this young skew there was still evidence of diversity within the respondent base in Glebe with nearly a third of respondents aged over 50 (28%). A large proportion of these respondents either lived with a partner (37%) or in a household with four or more people (32%). Many of this demographic group were employed in professional jobs (23%), with this trend even more prominent on Saturday (33%).
Overall it can be seen that quite a large proportion of respondents were locals who frequented the Glebe area fairly regularly. Over half of all respondents indicated that they lived in the Glebe itself (53%), with the majority being ‘heavy’ users of the Glebe area - visiting the Glebe precinct once a week or more (70%). Visitors typically walked to where they were they were going in Glebe (60%), while public transport was another commonly used method of transport (24%).
The majority of respondents were in Glebe for a specific need or purpose (61%), however a similar proportion also indicated they had planned to visit local shops and business during their trip (64%).
One of the key reasons for visiting Glebe was for the food options available, and this is reinforced by almost two fifths of respondents being classified as ‘heavy’ consumers of Glebe’s food options (24% of those who lived outside the area also fit into this category).
Overall the perceptions of Glebe were very positive, as respondents most commonly describing the area as having a community and village feel, with friendly people – while still being lively and energetic.
Results suggested that most visitors were happy with the current look and feel of the area, with relatively few calls for change. Given the opportunity to suggest improvements however, parking was the main issued raised (12%) – while over a third of respondents couldn’t nominate any potential change (36%). Prompted suggestions for additional shops and services were also limited with no significant options raised by respondents.
Broadway Shopping Centre was seen to be the main ‘alternative’ to the shops available within the Glebe precinct. However, only one in five respondents indicated they were there to visit Broadway on that trip, highlighting the fact that visitors also frequented shop and cafes along Glebe Point Road as well, and were there for that specific purpose.
5

The Glebe Precinct Intercept Study May 2015
The Glebe Markets were a clear drawcard to the area with very high awareness present amongst respondents (91%), with four out of five visitors who were surveyed also having attended the markets in the past. This ultimately meant there was a high conversion rate between those who knew about the Glebe Markets and those that actually attended (89%).
Frequency of attendance of the Glebe Markets tended to be relatively low with the majority visiting less than once a month. Even so, the large majority indicated that they also visited local shops and business when they did attend they Glebe Markets, suggesting that these businesses also benefit from the markets.
6

The Glebe Precinct Intercept Study May 2015
3. Methodology
The Glebe Customer Intercepts interviews were conducted over a four week period between the Wednesday the 25th of February and Saturday the 21st of March. A total of n=405 intercept interviews were conducted over this period.
Interviewing was carried out in five locations along Glebe Point Road, with loose targets established for to each location to ensure a representative sample of visitors across all days and times. Interviewers were primarily positioned at the following locations (though were permitted to move if traffic levels were insufficient during their interviewing shift):
1. Glebe Point Road (Outside Toxteth Hotel)
2. Glebe Point Road and Bridge Street
3. Glebe Point Road and St Johns Road
4. Glebe Point Road and Mitchell St
5. Glebe Point Road and Francis Street
Interviews took place on Wednesdays and Saturdays during the interview period and occurred in shifts between 11am - 2pm and 3pm-6pm.
The number of interviews planned for and collected from each interviewing location are detailed in the table overleaf:
7

The Glebe Precinct Intercept Study May 2015
Table 1: Interview Quotas
8
The Glebe Precinct Intercept Study May 2015
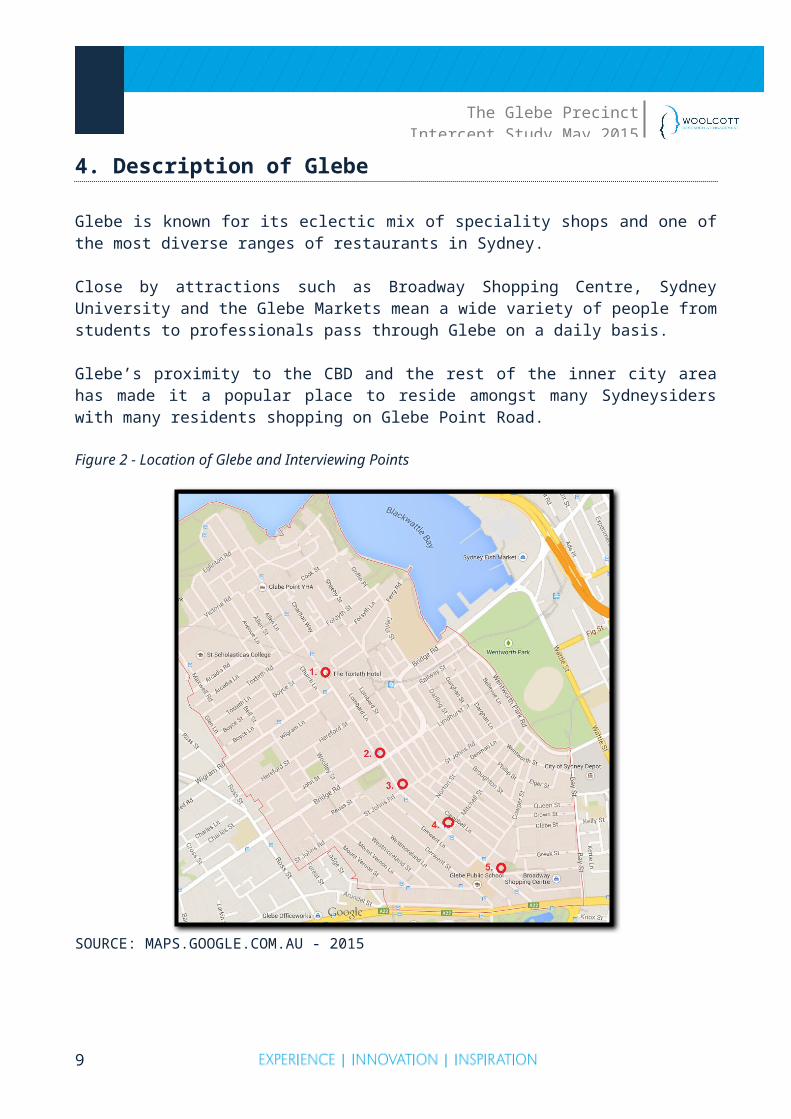
4. Description of Glebe
Glebe is known for its eclectic mix of speciality shops and one of the most diverse ranges of restaurants in Sydney.
Close by attractions such as Broadway Shopping Centre, Sydney University and the Glebe Markets mean a wide variety of people from students to professionals pass through Glebe on a daily basis.
Glebe’s proximity to the CBD and the rest of the inner city area has made it a popular place to reside amongst many Sydneysiders with many residents shopping on Glebe Point Road.
Figure 2 - Location of Glebe and Interviewing Points
SOURCE: MAPS.GOOGLE.COM.AU - 2015
9

The Glebe Precinct Intercept Study May 2015
5. Precinct Visitor Demographics
5.1 Age and Gender Profile
The majority of survey respondents were female (57%), however this may be a function of the fact that females are typically more likely to participate in research of this nature. Males represented 43% of all respondents, marginally less so on Saturday (40%).
In terms of age, a relatively large proportion of respondents were younger, with 51% of aged between 20 and 39 years. This is quite significant when compared to the population of 20-39 year olds in Greater Sydney (37%).
Respondents over 50 years of age represented less than a third of visitors (28%).
There was little difference in the visitor profile between Wednesdays and Saturdays, with the exception of slightly more 30-39 year olds visiting Glebe on a Saturday, and fewer under 20 year olds resulting.
Figure 1: Age and Gender Profile
Male Female
43
57
44
56
40
60
Q1. Into which of these age groups do you fall into?Qx. RECORD GENDERBase: All respondents (n=405)
10
Under 20 20-29 30-39 40-49 50-59 60-69 70+
8
32
19
1311 11
6
11
30
14 15
10 118
5
34
25
10 11 11
4
Total Wednesday Saturday

The Glebe Precinct Intercept Study May 2015
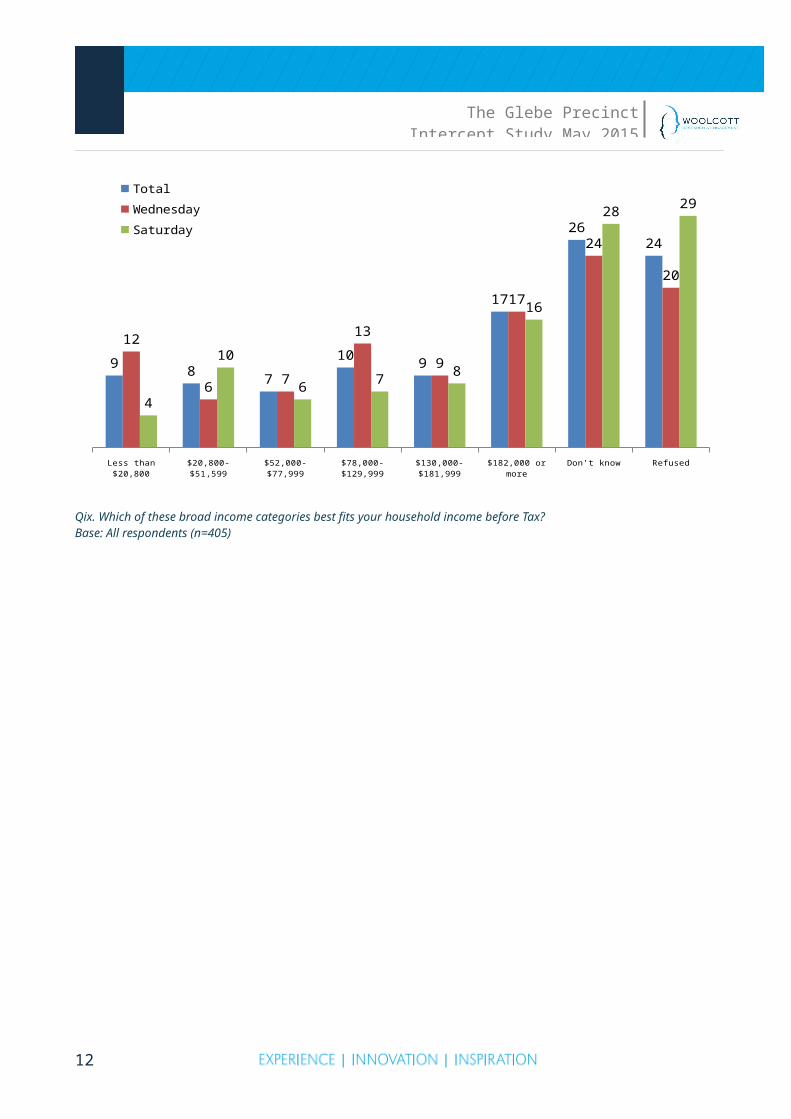
5.2 Household Income
Respondents were asked to indicate which of the broad income categories best fit their household income before tax. Interestingly, the majority either didn’t know (26%) or refused (24%). Amongst those who were able to nominate a bracket, a quarter reported an income of over $130,000, 17% claimed an income of between $52,000 and $129,999 and 24% a household income of less than $52,000.
Figure 2: Household Income
Less than $20,800 $20,800-$51,599 $52,000-$77,999 $78,000-$129,999 $130,000-$181,999 $182,000 or more Don’t know Refused
9 8 7
10 9
17
2624
12
6 7
13
9
17
24
20
4
10
6 7 8
16
28 29Total
Wednesday
Saturday
Qix. Which of these broad income categories best fits your household income before Tax?Base: All respondents (n=405)
11
The Glebe Precinct Intercept Study May 2015
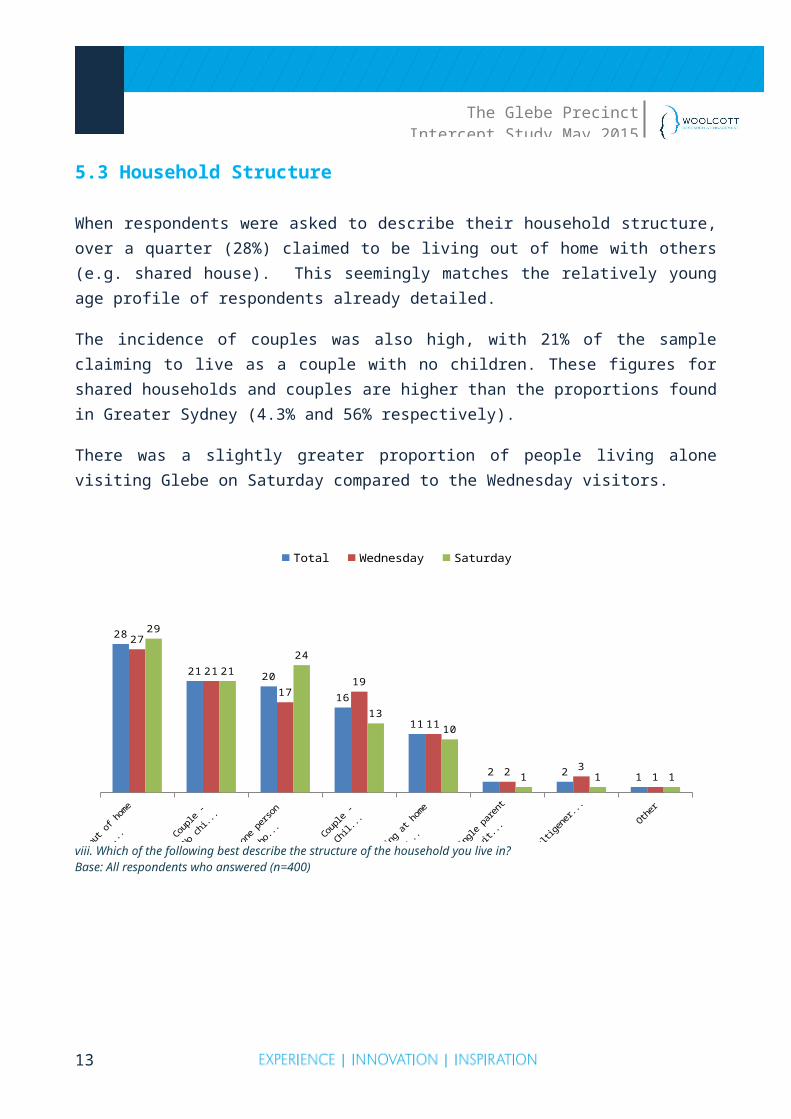
5.3 Household Structure
When respondents were asked to describe their household structure, over a quarter (28%) claimed to be living out of home with others (e.g. shared house). This seemingly matches the relatively young age profile of respondents already detailed.
The incidence of couples was also high, with 21% of the sample claiming to live as a couple with no children. These figures for shared households and couples are higher than the proportions found in Greater Sydney (4.3% and 56% respectively).
There was a slightly greater proportion of people living alone visiting Glebe on Saturday compared to the Wednesday visitors.
viii. Which of the following best describe the structure of the household you live in?Base: All respondents who answered (n=400)
12
Living out of home
with others (e.g. share house)
Couple - No children
Lone person household
Couple - Children
Living at home with parents
Single parent with children
Multigenerational Other
28
21 20
16
11
2 2 1
27
21
1719
11
2 31
29
2124
1310
1 1 1
Total Wednesday Saturday
Figure 3: Household Structure
The Glebe Precinct Intercept Study May 2015
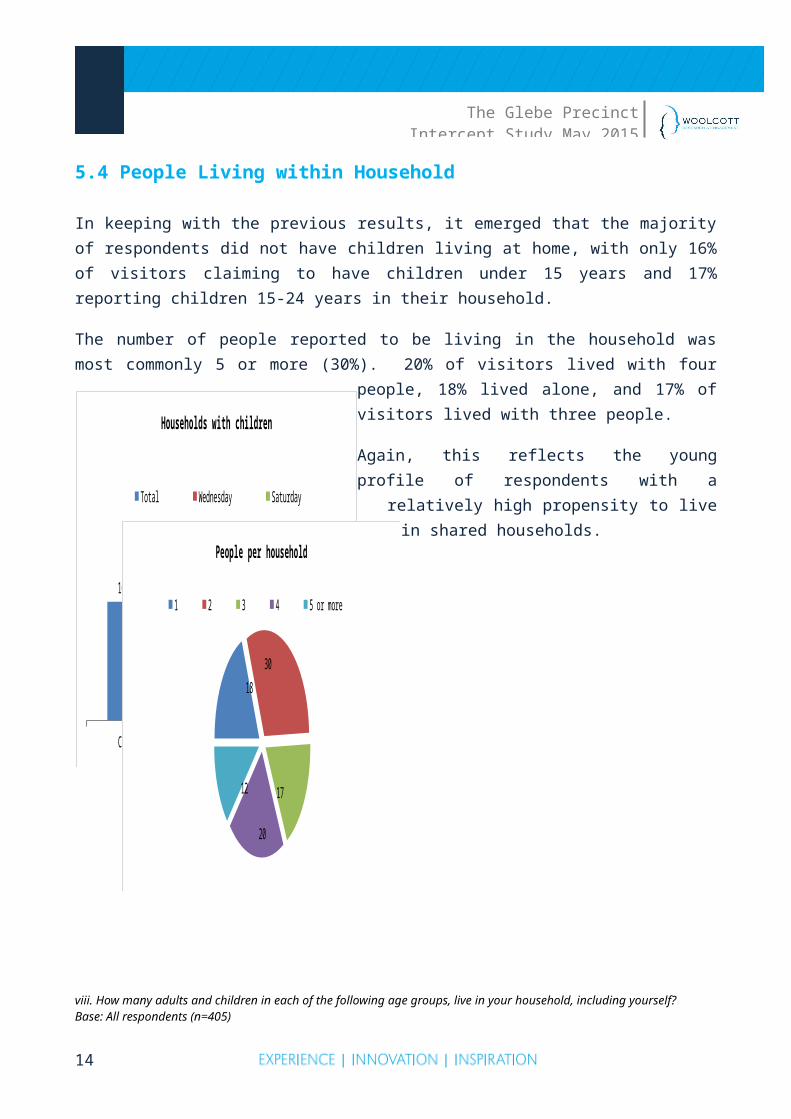
5.4 People Living within Household
In keeping with the previous results, it emerged that the majority of respondents did not have children living at home, with only 16% of visitors claiming to have children under 15 years and 17% reporting children 15-24 years in their household.
The number of people reported to be living in the household was most commonly 5 or more (30%). 20% of visitors lived with four people, 18% lived alone, and 17% of visitors lived with three people.
Again, this reflects the young profile of respondents with a relatively high propensity to live in shared
households.
13
18
30
17
20
12
People per household
1 2 3 4 5 or more
Figure 4 People living within the household
Children Under 15 15 to 24 years
16 171619
15 15
Households with children
Total Wednesday Saturday
The Glebe Precinct Intercept Study May 2015
viii. How many adults and children in each of the following age groups, live in your household, including yourself?Base: All respondents (n=405)
14

The Glebe Precinct Intercept Study May 2015
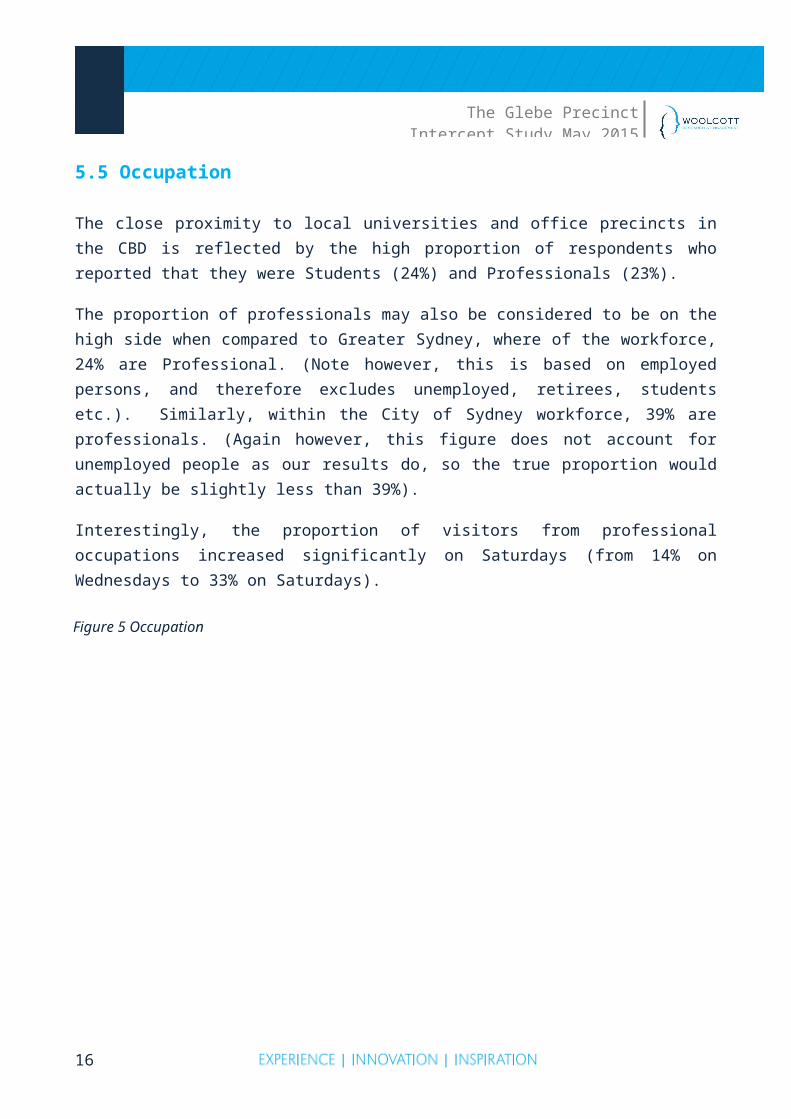
5.5 Occupation
The close proximity to local universities and office precincts in the CBD is reflected by the high proportion of respondents who reported that they were Students (24%) and Professionals (23%).
The proportion of professionals may also be considered to be on the high side when compared to Greater Sydney, where of the workforce, 24% are Professional. (Note however, this is based on employed persons, and therefore excludes unemployed, retirees, students etc.). Similarly, within the City of Sydney workforce, 39% are professionals. (Again however, this figure does not account for unemployed people as our results do, so the true proportion would actually be slightly less than 39%).
Interestingly, the proportion of visitors from professional occupations increased significantly on Saturdays (from 14% on Wednesdays to 33% on Saturdays).
ii. What is your occupation?Base: All respondents who answered (n=395)
5.6 Incidence of Working in Glebe
15
Other
Retired / Superannuated
Unemployed
Home duties
Admin
Retail / Customer Service
Technician / Trade worker / Labourer
Restaurant /bar / cafe
Manager
Professsional
Student
9
13
4
3
3
3
6
6
6
23
24Figure 5 Occupation
The Glebe Precinct Intercept Study May 2015
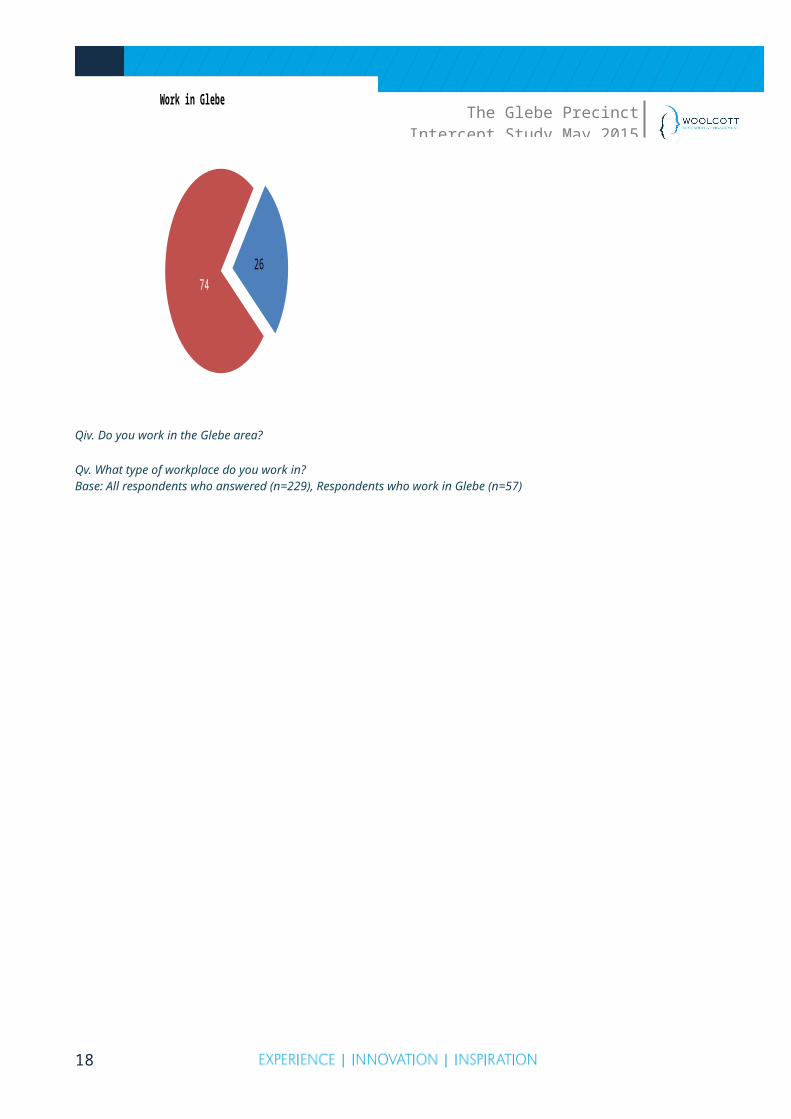
More than a quarter (26%) of respondents indicated that they worked in the Glebe area, most commonly in office jobs (25% of those who worked in the area).
Almost a fifth (18%) were working in restaurants, with the next most common occupation being in
retail (12%). 14% worked from home and 11% claimed to work at University.
Qiv. Do you work in the Glebe area?
Qv. What type of workplace do you work in?Base: All respondents who answered (n=229), Respondents who work in Glebe (n=57)
16
Figure 6: Incidence of working in Glebe
2674
Work in Glebe
Yes No

The Glebe Precinct Intercept Study May 2015
6. The Glebe Visit
6.1 Place of Residence
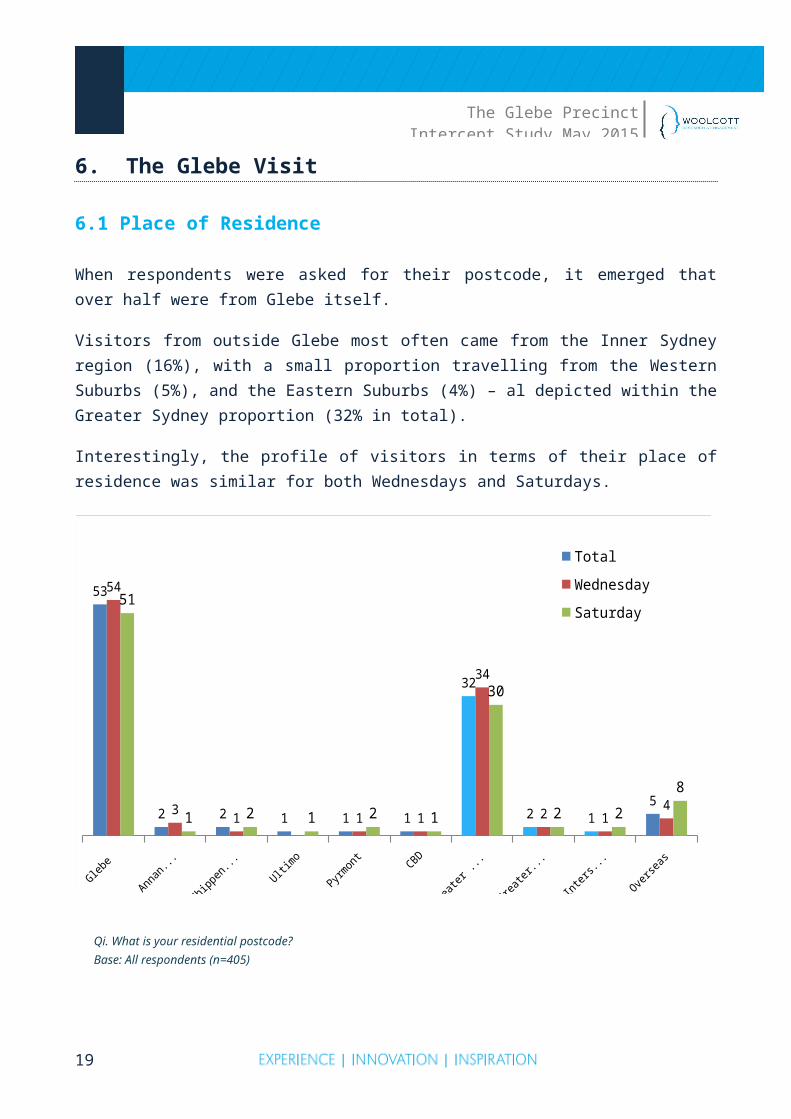
When respondents were asked for their postcode, it emerged that over half were from Glebe itself.
Visitors from outside Glebe most often came from the Inner Sydney region (16%), with a small proportion travelling from the Western Suburbs (5%), and the Eastern Suburbs (4%) – al depicted within the Greater Sydney proportion (32% in total).
Interestingly, the profile of visitors in terms of their place of residence was similar for both Wednesdays and Saturdays.
Qi. What is your residential postcode?Base: All respondents (n=405)
17
Figure 7: Place of residence
Glebe Annandale Chippendale Ultimo Pyrmont CBD Greater Sydney
Greater NSW Interstate Overseas
53
2 2 1 1 1
32
2 15
54
31 1 1
34
2 14
51
1 2 1 2 1
30
2 2
8
Total
Wednesday
Saturday
The Glebe Precinct Intercept Study May 2015
6.2 Mode of Transport Used
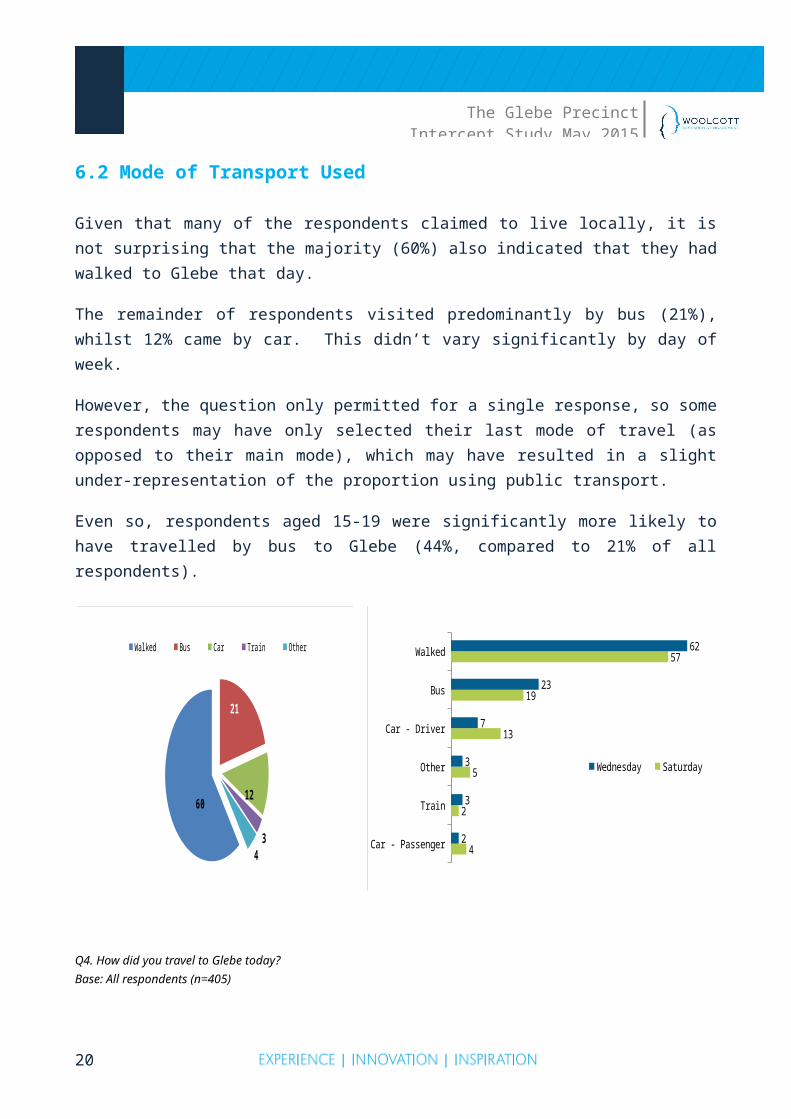
Given that many of the respondents claimed to live locally, it is not surprising that the majority (60%) also indicated that they had walked to Glebe that day.
The remainder of respondents visited predominantly by bus (21%), whilst 12% came by car. This didn’t vary significantly by day of week.
However, the question only permitted for a single response, so some respondents may have only selected their last mode of travel (as opposed to their main mode), which may have resulted in a slight under-representation of the proportion using public transport.
Even so, respondents aged 15-19 were significantly more likely to have travelled by bus to Glebe (44%, compared to 21% of all respondents).
Q4. How did you travel to Glebe today?Base: All respondents (n=405)
18
Car - Passenger
Train
Other
Car - Driver
Bus
Walked
4
2
5
13
19
57
2
3
3
7
23
62
Wednesday Saturday
60
21
12
34
Walked Bus Car Train OtherFigure 8: Mode of transport used
The Glebe Precinct Intercept Study May 2015
6.3 Where Respondents Travelled From
Day of the week
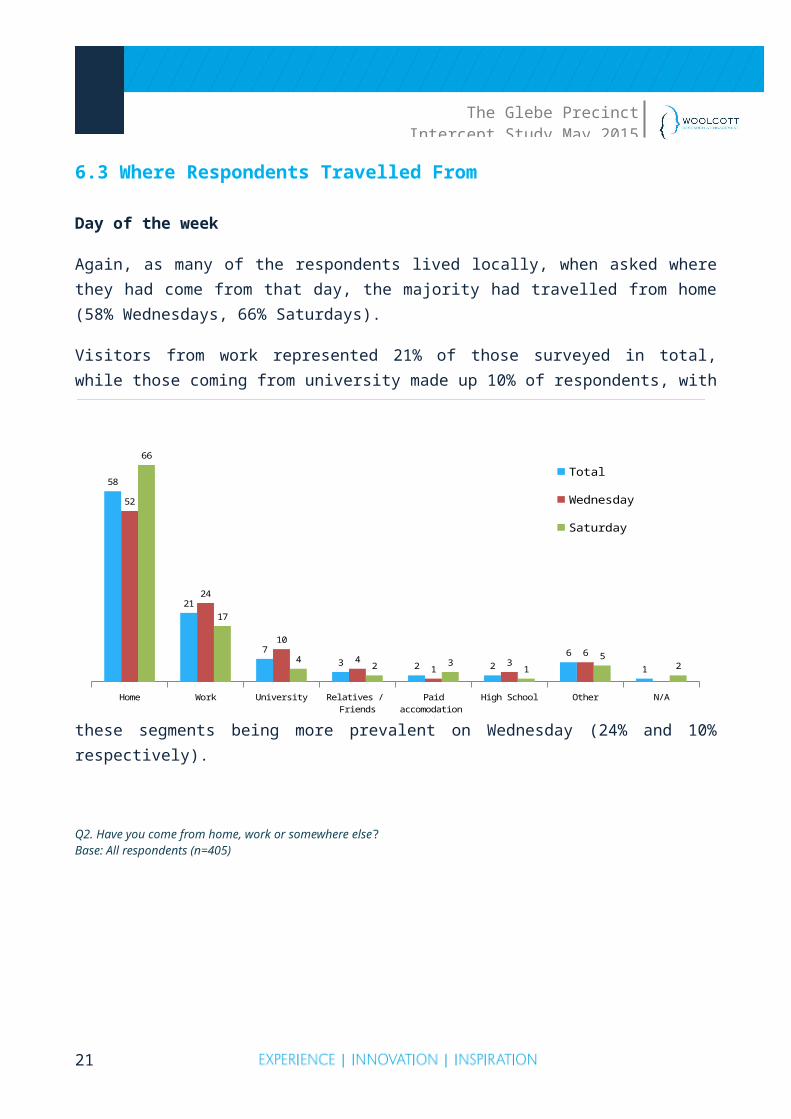
Again, as many of the respondents lived locally, when asked where they had come from that day, the majority had travelled from home (58% Wednesdays, 66% Saturdays).
Visitors from work represented 21% of those surveyed in total, while those coming from university
made up 10% of respondents, with these segments being more prevalent on Wednesday (24% and 10% respectively).
Q2. Have you come from home, work or somewhere else?Base: All respondents (n=405)
19
Home Work University Relatives / Friends
Paid accomodation (e.g hotel)
High School Other N/A
58
21
73 2 2
6
1
52
24
10
41
36
66
17
42 3
15
2
Total
Wednesday
Saturday
Figure 9: Where respondents were coming from
The Glebe Precinct Intercept Study May 2015
Interview Location
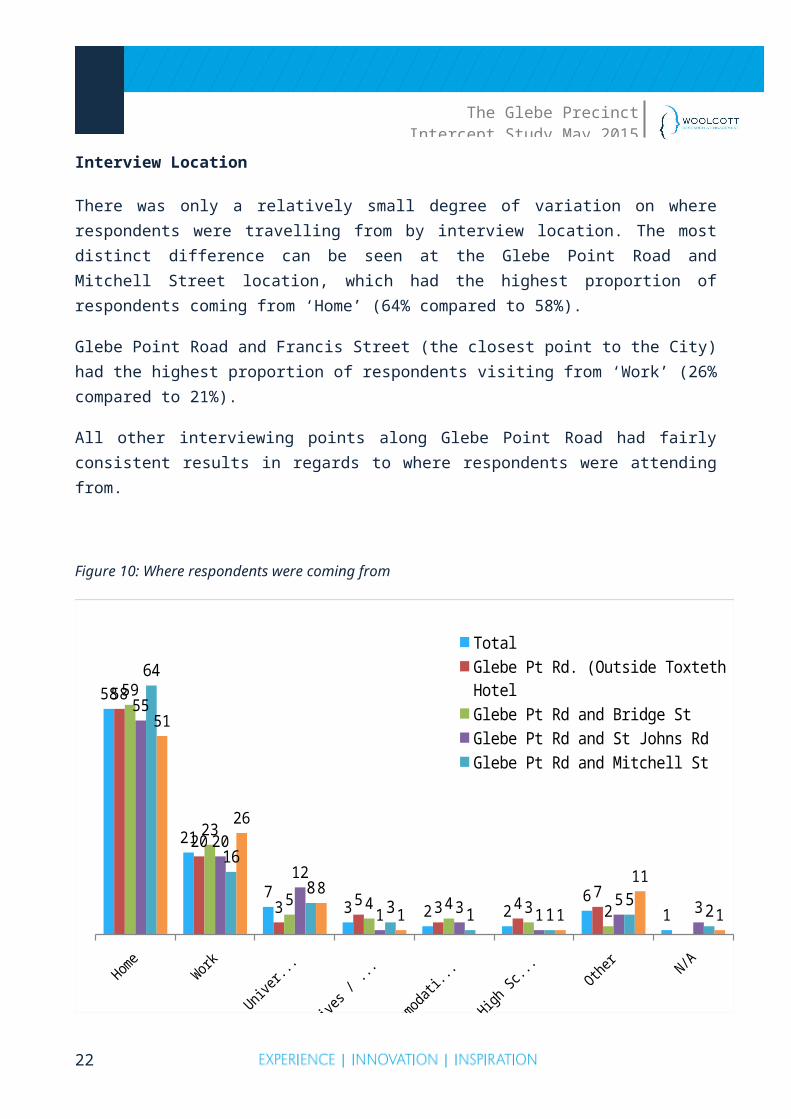
There was only a relatively small degree of variation on where respondents were travelling from by interview location. The most distinct difference can be seen at the Glebe Point Road and Mitchell Street location, which had the highest proportion of respondents coming from ‘Home’ (64% compared to 58%).
Glebe Point Road and Francis Street (the closest point to the City) had the highest proportion of respondents visiting from ‘Work’ (26% compared to 21%).
All other interviewing points along Glebe Point Road had fairly consistent results in regards to where respondents were attending from.
Figure 10: Where respondents were coming from
HomeWork
Universit
y
Relatives /
Friends
Paid accomodation
(... High SchoolOther
N/A
58
21
73 2 2
61
58
20
3 5 3 47
59
23
5 4 4 3 2
55
20
12
1 3 15 3
64
16
83 1 1
52
51
26
8
1 1
11
1
TotalGlebe Pt Rd. (Outside Toxteth HotelGlebe Pt Rd and Bridge StGlebe Pt Rd and St Johns RdGlebe Pt Rd and Mitchell StGlebe Pt Rd and Francis St
Q2. Have you come from home, work or somewhere else?Base: All respondents (n=405)
20
The Glebe Precinct Intercept Study May 2015
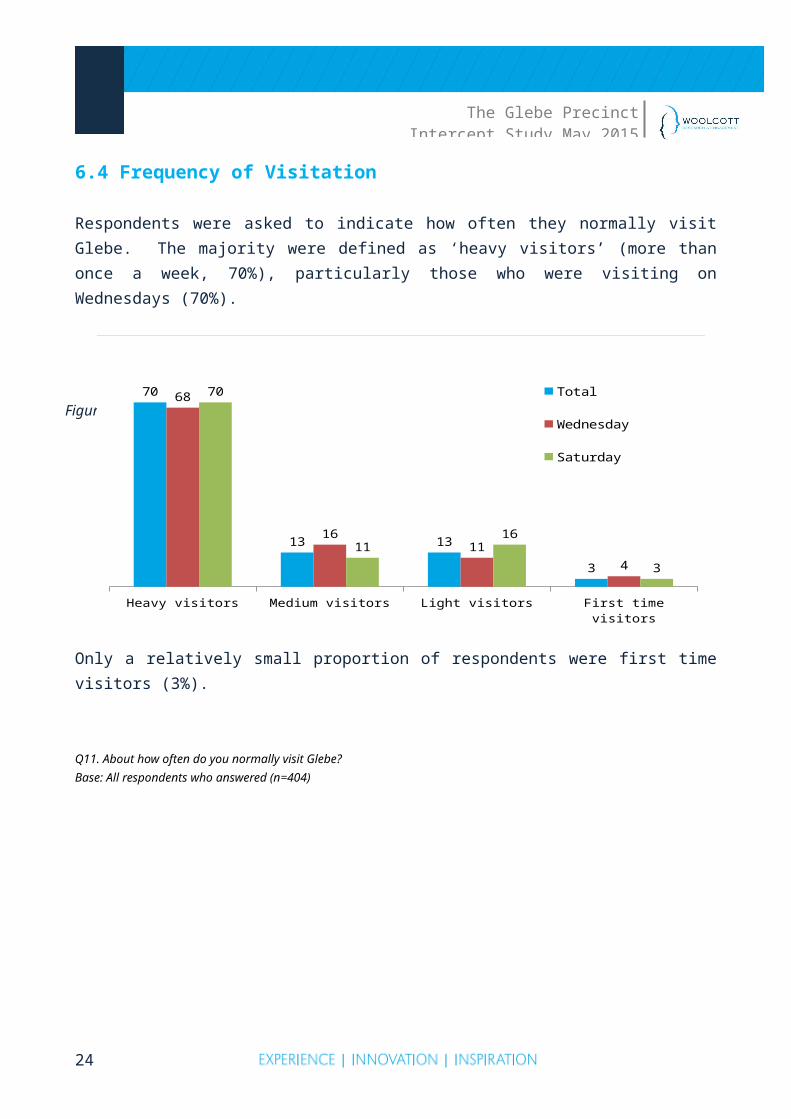
6.4 Frequency of Visitation
Respondents were asked to indicate how often they normally visit Glebe. The majority were defined as ‘heavy visitors’ (more than once a week, 70%), particularly those who were visiting on
Wednesdays (70%).
Only a relatively small proportion of respondents were first time visitors (3%).
Q11. About how often do you normally visit Glebe?Base: All respondents who answered (n=404)
21
Heavy visitors Medium visitors Light visitors First time visitors
70
13 13
3
68
1611
4
70
1116
3
Total
Wednesday
Saturday
Figure 11: Frequency of Visitation Summary
The Glebe Precinct Intercept Study May 2015
Figure 12: Frequency of Visitation
2-3 times a d
ay Daily
2-3 times a w
eek
About once
a week
About once
a fortn
ight
About once
a month
About once
in 2 months
About once
in 6 months
Less F
requen
tly
This i
s the first
time
10
47
13
6 7 5 4 2 2 3
12
46
118 8
5 3 2 14
7
48
15
47 6 5
2 3 3
Total Wednesday
Saturday
Q11. About how often do you normally visit Glebe?Base: All respondents who answered (n=404)
22

The Glebe Precinct Intercept Study May 2015
6.5 Reason for Infrequent Visitation of Glebe
As most lived locally, there were only small proportions (57 people) who were visiting less than
once a month. When asked their reasons for visiting Glebe infrequently, the biggest barrier to emerge was that they did not live in locally or even in Sydney (68%).
Other common reasons stated were, ‘inconvenience’, (14%) and ‘I can find everything I need somewhere else/closer to home’ (14%).
Q12. Why don’t you visit Glebe more often?Base: Respondents who visited once a month or less (n=57)
23
Don't live in Sydney / Local
Inconvenient I can find everything I need somewhere
else / closer to home
Parking problems Public transport problems
68
14 14
2 2
82
14
4 4
55
14
24
3
Total
Wednesday
Saturday
Figure 13: Reason for infrequent visitation
The Glebe Precinct Intercept Study May 2015
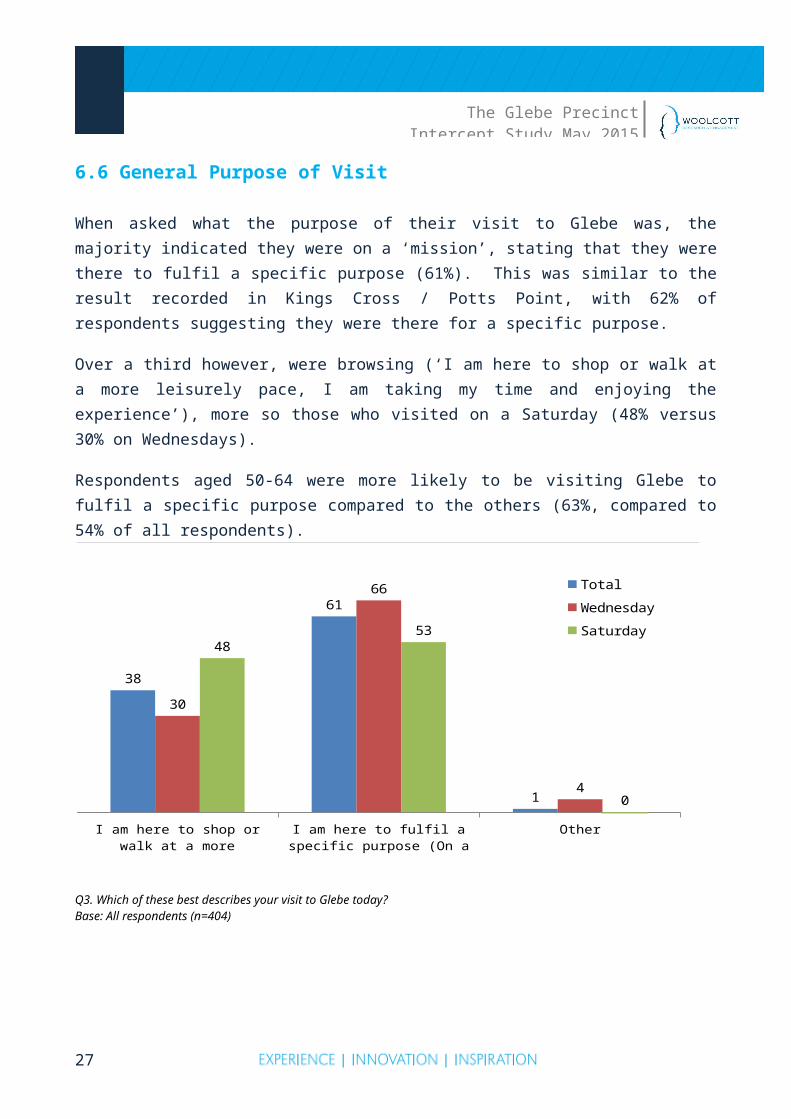
6.6 General Purpose of Visit
When asked what the purpose of their visit to Glebe was, the majority indicated they were on a ‘mission’, stating that they were there to fulfil a specific purpose (61%). This was similar to the result recorded in Kings Cross / Potts Point, with 62% of respondents suggesting they were there for a specific purpose.
Over a third however, were browsing (‘I am here to shop or walk at a more leisurely pace, I am taking my time and enjoying the experience’), more so those who visited on a Saturday (48% versus 30% on Wednesdays).
Respondents aged 50-64 were more likely to be visiting Glebe to fulfil a specific purpose compared to the others (63%, compared to 54% of all respondents).
Q3. Which of these best describes your visit to Glebe today?Base: All respondents (n=404)
24
I am here to shop or walk at a more leisurely pace, I am taking my time and enjoying the experience
I am here to fulfil a specific purpose (On a mission)
Other
38
61
1
30
66
4
4853
0
Total Wednesday
Saturday
%
Figure 14: General purpose of visit

The Glebe Precinct Intercept Study May 2015
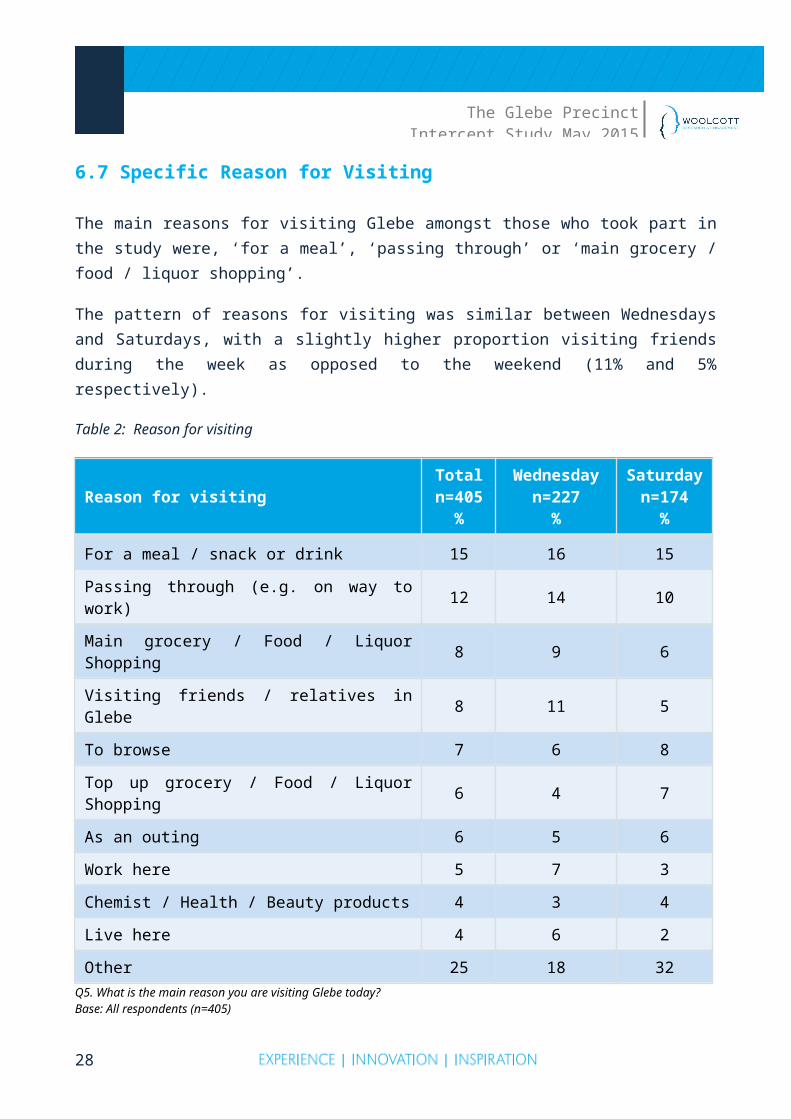
6.7 Specific Reason for Visiting
The main reasons for visiting Glebe amongst those who took part in the study were, ‘for a meal’, ‘passing through’ or ‘main grocery / food / liquor shopping’.
The pattern of reasons for visiting was similar between Wednesdays and Saturdays, with a slightly higher proportion visiting friends during the week as opposed to the weekend (11% and 5% respectively).
Table 2: Reason for visiting
Reason for visitingTotaln=405
%
Wednesdayn=227
%
Saturdayn=174
%
For a meal / snack or drink 15 16 15
Passing through (e.g. on way to work) 12 14 10
Main grocery / Food / Liquor Shopping 8 9 6
Visiting friends / relatives in Glebe 8 11 5
To browse 7 6 8
Top up grocery / Food / Liquor Shopping 6 4 7
As an outing 6 5 6
Work here 5 7 3
Chemist / Health / Beauty products 4 3 4
Live here 4 6 2
Other 25 18 32Q5. What is the main reason you are visiting Glebe today?Base: All respondents (n=405)
25

The Glebe Precinct Intercept Study May 2015
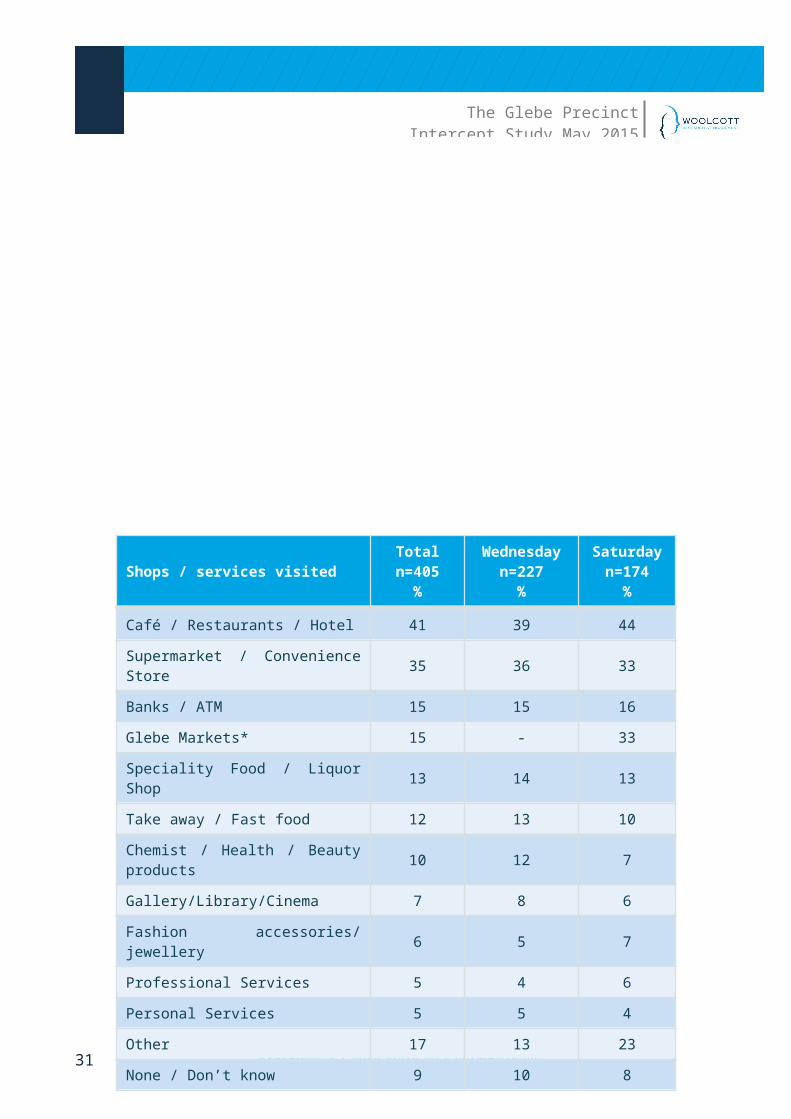
6.8 Shops and Services Used
While only 15% indicated that their main reason for visiting Glebe was for a meal (see Table 2), 41% of visitors had been to or intended to visit a café or restaurant or hotel. This was more the case on Saturday (44%).
Over a third (35%) of visitors were there to use supermarkets or convenience stores, with respondents interviewed at Bridge St and St Johns Road being most likely to have indicated this. The closest spot to Broadway (Francis Street) actually had the lowest proportion using a supermarket or convenience store. Considering IGA Glebe is located between (Bridge St and St Pauls Road) it may indicate that more of our respondents were referring to use of the IGA to do their Supermarket shopping.
The Glebe Markets were also a popular attraction with 33% of Saturday respondents having visited or planning to visit on the Saturday.
Table 3: Shops and Services Used
Q6. Which shops and services have you used / will use today in Glebe? MULTIPLE RESPONSEBase: All respondents who answered (n=401) *Note: Saturday Only
26
Shops / services visitedTotaln=405
%
Wednesdayn=227
%
Saturdayn=174
%
Café / Restaurants / Hotel 41 39 44
Supermarket / Convenience Store 35 36 33
Banks / ATM 15 15 16
Glebe Markets* 15 - 33
Speciality Food / Liquor Shop 13 14 13
Take away / Fast food 12 13 10
Chemist / Health / Beauty products 10 12 7
Gallery/Library/Cinema 7 8 6
Fashion accessories/ jewellery 6 5 7
Professional Services 5 4 6
Personal Services 5 5 4
Other 17 13 23
None / Don’t know 9 10 8
The Glebe Precinct Intercept Study May 2015
6.9 Plans to Visit Shops or Businesses in Glebe
Around two thirds of all Glebe respondents planned to visit shops or businesses around Glebe, with incidence of this being highest on Wednesdays (67%).
Those aged 15-19 were less likely to indicate that they visit shops and businesses during their trip to Glebe (61% did not, compared to 36% of all respondents).
Figure 15: Plans to Visit shops or businesses in Glebe
64
36
Yes No
Q10. Do you also plan to visit any of the shops or businesses around Glebe today?Base: All respondents who answered (n=391)
27
The Glebe Precinct Intercept Study May 2015
6.10 Frequency of Eating in Glebe
Almost 40% of visitors were classified as ‘heavy users’ of the restaurants, cafes, hotels and fast food outlets in Glebe, with almost a third (31%) of respondents claiming that they ate in Glebe 2-3 times a week.
‘Medium’ users of the eateries around Glebe comprised a further 40% of respondents with relatively few respondents claiming to be first time (2%) or never to have consumed.
The Saturday visitors were more likely to be ‘heavy’ visitors of the Glebe eateries than the Wednesday crowd (46% vs 32%).
Figure 16: Frequency of eating in Glebe
2-3 times a day
Daily
2-3 times a w
eek
About once a w
eek
About once a fo
rtnight
About once a m
onth
About once in
2 months
About once in
6 months
Less fre
quently
First ti
meNever
1
6
31
1614
10
4 4 3 2
7
15
26
18 17
11
53 3 3
8
1
7
38
1411
9
35 5
26
Total
Wednesday
Saturday
Q13. About how often do you dine in or take away from a restaurant \ café \ hotel \ bar \ fast food outlet in Glebe?Base: All respondents who answered (n=404)
28
Heavy user Medium user Light user

The Glebe Precinct Intercept Study May 2015
7. Perceptions of Glebe and Suggested Improvements
7.1 Description of Glebe
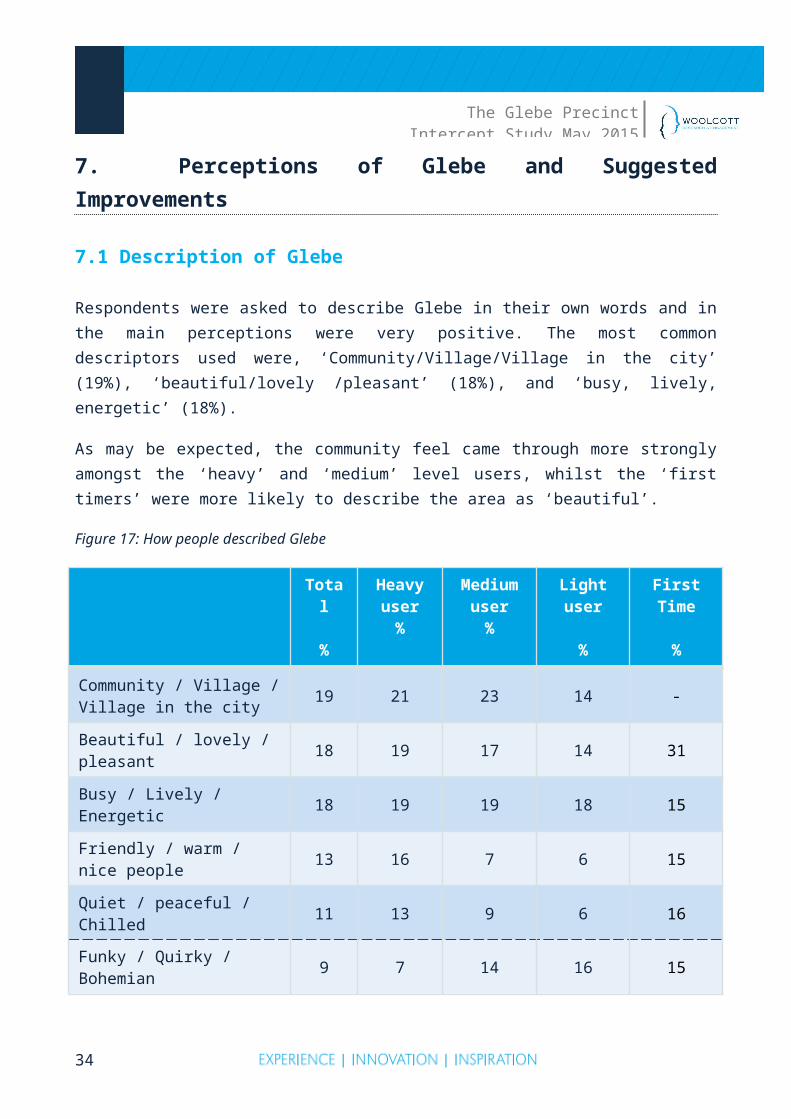
Respondents were asked to describe Glebe in their own words and in the main perceptions were very positive. The most common descriptors used were, ‘Community/Village/Village in the city’ (19%), ‘beautiful/lovely /pleasant’ (18%), and ‘busy, lively, energetic’ (18%).
As may be expected, the community feel came through more strongly amongst the ‘heavy’ and ‘medium’ level users, whilst the ‘first timers’ were more likely to describe the area as ‘beautiful’.
Figure 17: How people described Glebe
Total
%
Heavy user
%
Medium user
%
Light user
%
First Time
%
Community / Village / Village in the city 19 21 23 14 -
Beautiful / lovely / pleasant 18 19 17 14 31
Busy / Lively / Energetic 18 19 19 18 15
Friendly / warm / nice people 13 16 7 6 15
Quiet / peaceful / Chilled 11 13 9 6 16
Funky / Quirky / Bohemian 9 7 14 16 15
Trendy / Hipster / Alternative 9 7 14 14 -
Diverse / mixed / Eclectic 7 8 4 8 8
Good / great / fantastic 7 8 7 4 15
Convenient / Handy 7 7 4 6 8Q17. What descriptive words would you use to describe Glebe?Base: All respondents (n=405)
NOTE: The dotted line above is used to highlight responses greater than 10% (amongst the total sample). This is typically what is looked for with open-ended questions of this nature to indicate that a certain response has come through with a degree of consistency.
29

The Glebe Precinct Intercept Study May 2015
7.2 Suggestions to Improve Glebe
When prompted to nominate changes to the area, the outcomes suggest that respondents were generally quite happy with things as they were, with well over a third of respondents when asked how to improve the area, stating ‘nothing/keep it how it is’ (19%) or being unable to nominate a change - ‘don’t know’ (17%).
The main suggestions to encourage visitors to shop or visit the area more often were to improve; parking, transport, and the food offerings.
Q14. What changes to this area can you suggest that would encourage you to shop or visit Glebe more often? Base: All respondents (n=405)
30
Table 4: Suggestion to improve Glebe
The Glebe Precinct Intercept Study May 2015
7.3 Other Shops or Services Needed
When asked what other shops or services were needed in the area, again the results indicate that the area is well catered for, as there were no common suggestions to emerge, and almost one in four (36% were unable to nominate anything (“don’t know”).
The most popular shops or service types to emerge (though at a low level) were the suggestion for more ‘Banks/ATM’s’ (6%). Other suggestions mentioned included, a ‘post office’ (4%), ‘Supermarket Coles or Woolworths’ (4%), and ‘clothes shops’ (4%).
Q7. What other types of shops or services does this area need?Base: All Respondents (n=405)
31
Table 5: Other shops and services needed

The Glebe Precinct Intercept Study May 2015
7.4 Perceived Adequacy of Public Transport
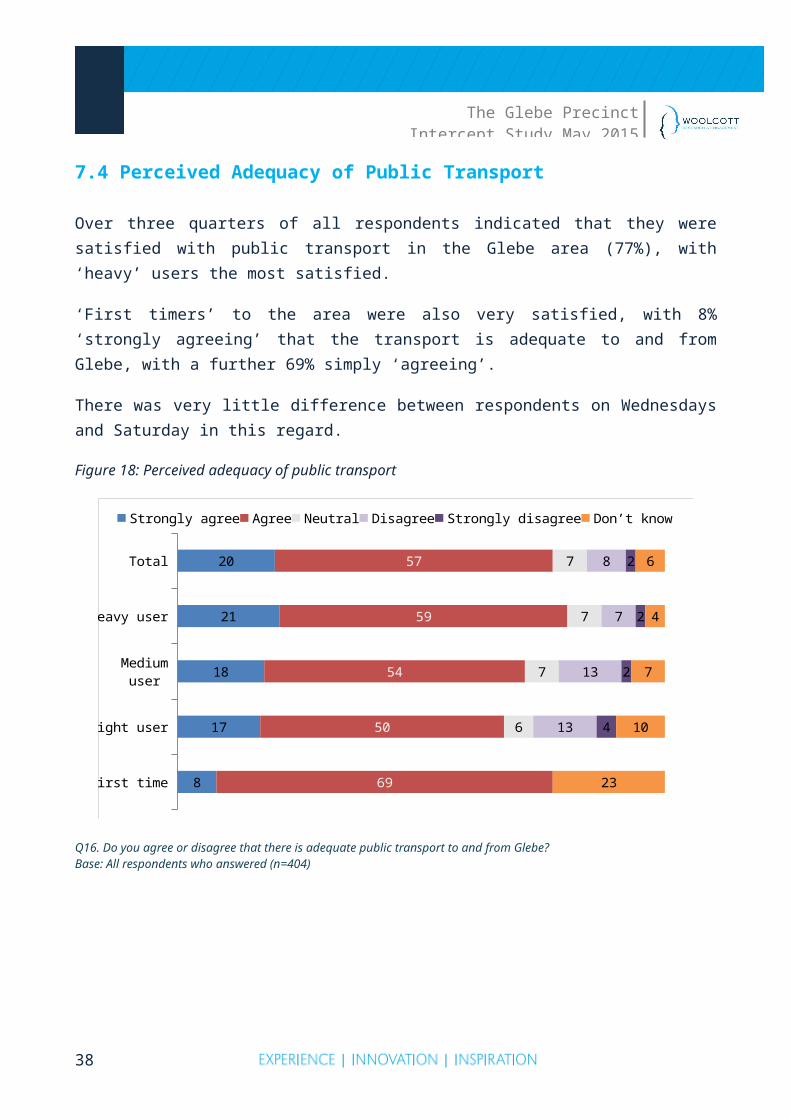
Over three quarters of all respondents indicated that they were satisfied with public transport in the Glebe area (77%), with ‘heavy’ users the most satisfied.
‘First timers’ to the area were also very satisfied, with 8% ‘strongly agreeing’ that the transport is adequate to and from Glebe, with a further 69% simply ‘agreeing’.
There was very little difference between respondents on Wednesdays and Saturday in this regard.
Figure 18: Perceived adequacy of public transport
First time
Light user
Medium user
Heavy user
Total
8
17
18
21
20
69
50
54
59
57
23
10
7
4
6
6
7
7
7
13
13
7
8
4
2
2
2
Strongly agree Agree Neutral Disagree Strongly disagree Don’t know
Q16. Do you agree or disagree that there is adequate public transport to and from Glebe?Base: All respondents who answered (n=404)
32

The Glebe Precinct Intercept Study May 2015
8. Visitation of Other Shopping Precincts
8.1 Shopping Precincts that Visited in the Last Six Months
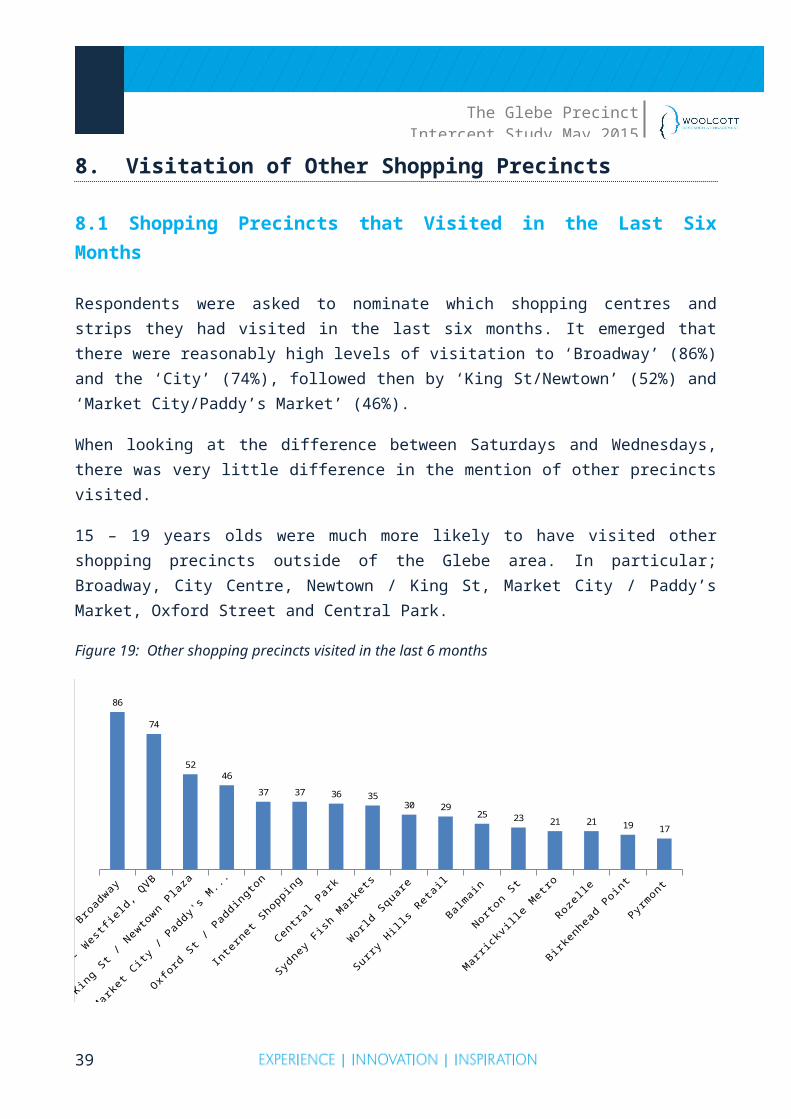
Respondents were asked to nominate which shopping centres and strips they had visited in the last six months. It emerged that there were reasonably high levels of visitation to ‘Broadway’ (86%) and the ‘City’ (74%), followed then by ‘King St/Newtown’ (52%) and ‘Market City/Paddy’s Market’ (46%).
When looking at the difference between Saturdays and Wednesdays, there was very little difference in the mention of other precincts visited.
15 – 19 years olds were much more likely to have visited other shopping precincts outside of the Glebe area. In particular; Broadway, City Centre, Newtown / King St, Market City / Paddy’s Market, Oxford Street and Central Park.
Figure 19: Other shopping precincts visited in the last 6 months
Broadway
City - W
estfield, Q
VB
King S
t / N
ewto
wn Plaza
Marke
t City
/ Paddy's M
arket
Oxford
St / P
addin
gton
Intern
et Sh
opping
Centra
l Par
k
Sydney
Fish M
arket
s
World
Square
Surry
Hill
s Ret
ail
Balmain
Norton St
Marrickv
ille M
etro
Rozelle
Birken
head Poin
t
Pyrmont
86
74
5246
37 37 36 3530 29
25 23 21 21 19 17
18a. Which of the following shopping centres \ strips have you visited in the last six months? MULTIPLE RESPONSEBase: All respondents who answered (n=400)
33
The Glebe Precinct Intercept Study May 2015
8.2 Other Areas for Product and Services Available in Glebe
Respondents were asked to suggest where else they would shop for the types of things they purchased or planned to purchase that day. In terms of alternative providers, ‘Broadway’ emerged to be the main competitor, with 36% mentioning this centre.
The next most cited precinct was the ‘City’ (19%), followed by ‘Newtown’ (15%). Interestingly, 35% were unable to nominate an ‘alternative’.
The Wednesday respondents were more likely to nominate ‘alternatives’ to Glebe for products and services than the Saturday visitors, suggesting that the markets on a Saturday may be seen as unique to the area, with products that cannot be sourced elsewhere.
Figure 20: Other areas for products and services available in Glebe
Broadway
City - W
estfiel
d, QVB
King S
t / N
ewto
wn Plaza
Mark
et City
/ Pad
dy's Mar
ket
Central P
ark
Surry
Hill
s Ret
ail
Oxford
St / P
addin
gton
Norton St
Balmain
Inte
rnet
Shoppin
g
Marri
ckvill
e Met
ro
Sydney
Fish
Mar
kets
World
Square
Birken
head Poin
t
Rozelle
Other
Don't Know
36
19
15
7 7 7 6 6 5 4 4 4 3 3 2
28
35
Q18c. Where else would you shop for the types of things you purchased or will purchase today in Glebe?Base: Respondents who answered (n=341)
34

The Glebe Precinct Intercept Study May 2015
Table 6: Other areas for products and services - by visitor day
Shopping AreaWednesday
n=192%
Saturdayn=149
%
Broadway Shopping Centre 40 32
City Centre 24 13
King St\Newtown Plaza 17 11
Market City\Paddy’s Market 10 4
Central Park 9 5
Surry Hills Retail 8 5
35

The Glebe Precinct Intercept Study May 2015
Norton St\Norton Plaza 8 4
Oxford St\Paddington 8 3
Marrickville Metro\Marrickville Rd 7 1
Balmain 6 3
Sydney Fish Markets 6 1
Birkenhead Point 6 -
World Square 5 1
Rozelle 3 1
Internet Shopping 6 2
Don’t know 8 7
Q18c. Where else would you shop for the types of things you purchased or will purchase today in Glebe?Base: Respondents who answered (n=341)
36

The Glebe Precinct Intercept Study May 2015
8.3
Incidence of Visiting Glebe to Specifically Visit Broadway
Visitors were asked to indicate whether they were in Glebe that day to specifically visit Broadway. Around one in five visitors (21%) claimed that they were, with the incidence slightly higher amongst the Saturday sample (23%).
Q8. Are you here to specifically visit the Broadway shopping centre today?Base: Q8. All Respondents (n=405)
37
Yes
19
23
WednesdaySaturday
2179
Yes No
Figure 21: Incidence of visiting Glebe for the purpose of going to Broadway
The Glebe Precinct Intercept Study May 2015
8.4 Spend Level at Broadway Shopping Centre
Those who were specifically visiting Glebe to shop at Broadway were asked to indicate approximately how much they were likely to spend that day.
Anticipated spend levels did not appear to be overly high, with over half of respondents indicating a spend level of under $50. This relatively low spend level may have resulted from the fact that respondents interviewed closest to Broadway were least likely to have been visiting a Supermarket – so not many large supermarket spends would be included in these figures (these shoppers may be more likely to park in the centre and not venture out). As such, other areas (such as the food court or cinema) may be resulting in these lower spend levels.
Figure 22: Spend level at Broadway Shopping Centre
Nothing Less that $20 $20-$49 $50-$99 $100-$199 $200-$499 $500 or more
4
31
20
27
12
2 12
43
1618
16
5
17
24
37
75
2
Total
Wednesday
Saturday
Q9. Approximately how much are you likely to spend at Broadway today?Base: Respondents who specifically visited Broadway Shopping Centre (n=85)
38
The Glebe Precinct Intercept Study May 2015
9. Glebe Markets and the Glebe Street Fair
9.1 Awareness of and Attendance at the Glebe Market
Almost all respondents had heard of the Glebe Markets (91%), with awareness levels highest amongst those who were very familiar with the area (the ‘heavy’ users).
81% of respondents had also been to the Markets at some point, with attendance more likely amongst ‘heavy’ users of the area (86%).
Figure 23: Awareness of and attendance at the Glebe Markets
Aware of the Glebe Markets Been to the Glebe Markets
91
81
95
8682
70
85
75
46
31
TotalHeavy usersMedium usersLight usersFirst time
15a. Have you heard of the Glebe Markets which are held every Saturday in the grounds of the Glebe Public School?15b. Have you ever been to the Glebe Markets?Base: 15a. All respondents who answered (n=404)
39

The Glebe Precinct Intercept Study May 2015
9.2 Frequency of Attending the Glebe Markets – By Usage
Respondents who had visited them were asked to approximate how often they visited the Glebe Markets. Around half claimed to visit the Markets about once a month or more often (46%), with nearly one in ten (8%) visiting ‘every week’.
No surprisingly, frequency of visitation was marginally higher amongst ‘heavy’ users of the area.
Respondents aged 15-19 were more likely to visit ‘every fortnight’ than other age groups (30%, compared with 13% of all respondents).
Figure 24: Frequency of attending the Glebe Markets - by usage
Every week Every fortnight About once a month Less frequently
813
25
55
1016
27
47
8
23
69
313
85
100
Total Heavy users
Medium users Light users
First time
15c. Approximately how often do you visit the Glebe Markets?Base: Respondents who had visited the markets (n=325)
40

The Glebe Precinct Intercept Study May 2015
9.3 Incidence of Visiting the Markets and the Shops and Restaurants on the Same Visit
It is highly likely that visitors to the market also visit nearby shops and restaurants, with 70% of those who had been to the Glebe Markets also indicating that they typically also visit the restaurants and shops nearby.
Figure 25: Incidence of visiting shops and restaurants nearby when visiting the Markets
Only visit the markets Also visit nearby shops and restaurants
30
70
31
69
22
78
24
76
50* 50*
Total Heavy usersMedium usersLight usersFirst time
15d. When you visit the Glebe Markets, do you only attend the markets, or do you also tend to visit the shops and restaurants nearby?
Base: Respondents who had visited the markets (n=325) *WARNING: SMALL BASE SIZE
41

The Glebe Precinct Intercept Study May 2015
9.4 Attendance at the Glebe Fair
Respondents were asked if they had ever attended the Glebe Street Fair (which is on the third Sunday of November each year). Almost half of all respondents indicated that they had visited the Glebe Street Fair - and this was most likely amongst respondents who lived in the area (57%).
The fact that 65% of respondents had last been in 2014 suggests that it could be an annual event for many.
Older respondents were significantly more likely to have visited the Glebe Street Fair (61% of the 35-49 year olds had, 63% of the 50-64 year olds had, and 62% of those aged 65+ had, compared with 44% for all respondents).
Figure 26: Incidence of ever attending the Glebe Street Fair
Total Reside in Glebe Reside elsewhere
47
57
31
19. Have you ever attended the Glebe Street Fair - which is on the third Sunday of November each year?20. If so, when was the last time you attended?Base: All respondents (n=405)
42
Table 7: Last time attended the Glebe St Fair
Last Year Attended
n=186%
2014 65
2013 12
2012 8
2011 3
2010 3
2006 – 09 2
2000 – 05 4
Don’t know / NA 5