1 · Halil Kiymaz, Rollins University Bento Lobo, University of Tennessee Dominik Mahr, Maastricht...
110
________________________________________________________________________ 1
Transcript of 1 · Halil Kiymaz, Rollins University Bento Lobo, University of Tennessee Dominik Mahr, Maastricht...

________________________________________________________________________ 1

1

2
ABOUT THIS JOURNAL
Journal of Business, Economics and Finance (JBEF) is a peer-reviewed, quarterly and
publically available journal. The journal aims to provide a research source for all
practitioners, policy makers and researchers working in the area of business, economics
and finance. The Editor of JBEF invites all manuscripts that include theoretical and/or
implementive research on topics related to the interest areas of the Journal.
The topics covered but not limited to;
� Business
� Human Resources Management
� Marketing Strategies
� Strategic Management
� Organizational Behaviour
� Consumer Preferences
� Financial Markets
� Investment and Portfolio
Management
� Banking
� Money and Capital Markets
� Financial Accounting
� Auditing and Reporting
� General Economics
� Labor Economics
� Poverty
� Behavioral Finance
� Emerging Markets
� Health Management
� Logistics
� International Trade
ABSTRACTING AND INDEXING
CALL FOR PAPERS
The next issue of JBEF will be published in June, 2012.
JBEF wellcomes manuscripts via e-mail.
e-mail: [email protected]
web : www.jbef.org

2
EDITORIAL BOARD
Editor in Chief: Dilek Teker
Ramazan Aktas, TOBB Economy and Technolgy University
Sudi Apak, Beykent University
Niyazi Berk, Bahcesehir University
Thomas S. Coe, Quinnipiac University
Meltem Kiygi Calli, Okan University
Metin Ercan, Bosphrous University
Metin Kamil Ercan, Gazi University
Umit Erol, Bahcesehir University
Ihsan Ersan, Istanbul University
Ozer Ertuna, Okan University
Orhan Goker, Istanbul University
Murat Karagöz, Fatih University
Mehmet Baha Karan, Hacettepe University
Yalcin Karatepe, Ankara University
Halil Kiymaz, Rollins University
Bento Lobo, University of Tennessee
Dominik Mahr, Maastricht University
Halil Seyidoglu, Dogus University
Berna Taner, Dokuz Eylül University
Cagdas Sirin, Bahcesehir University
Mehmet Sukru Tekbas, Istanbul University
Suat Teker, Okan University
Oktay Tas, Istanbul Technical University
Ugur Yozgat, Marmara University

3
CONTENT
Title and Author/s
Page
Market Structure Of Nepalese Banking Industry…………………………..………………Dinesh Prasad Gajurel and Radhe Shyam Pradhan
5-20
Déjà Vu? A Comparison Of The 1980s And 2008 Financial Crises………………………….. Diane Scott Docking
21-36
Dynamic Relation Between Economic Growth, Foreign Exchange and Tourism Incomes : An Econometric Perspective on Turkey…………………………..………………………
Yalcin Arslanturk
37-46
Impact Of Workplace Quality On Employee’s Productivity:Case Study of a Bank in Turkey…….. Demet Leblebici
47-60
Small-Firm Uniqueness And Signaling Theory…………………………..………………. James C. Brau and J. Troy Carpenter
61-75
The Short Term Performance Of Initial Public Offerings In Istanbul Stock Exchange: 2010 -2011 Application…………………………..…………………………..………... Tekiner Kaya
76-91
Corporate Governance As A Quantitative Indicator And A Study On Istanbul Stock Exchange
Corporate Governance Index In Turkey…………………………..……………………... Yildiz Ayanoglu Pekcan, Sibel Atan and Can Mert Sivacioğlu
92-110
Corporate Governance As A Quantitative Indicator And A Study On Istanbul Stock Exchange
Corporate Governance Index In Turkey…………………………..……………………... Samuel O. Onyuma, Robert K. Mugo and John K. Karuiya
111-133
Journal of Business, Economics & Finance (2012), Vol.1 (1) Gajurel & Pradhan, 2012
____________________________________________________________________________________________________
________________________________________________________________________
5
CONCENTRATION AND COMPETITION IN NEPALESE BANKING
Dinesh Prasad Gajurel1 and Prof. Radhe Shyam Pradhan
2
1School of Economics and Finance, University of Tasmania, Private Bag 85, Hobart, TAS 7001, Australia.
Tel: +61 3 6226 2308. E-mail: [email protected] 2Central Department of Management, Tribhuvan University, Kathmandu, NEPAL
e-mail: [email protected]
KEYWORDS
Market Competition, Banking, Panzar-
Rosse Approach
ABSTRACT
This paper examines the evolution of market concentration and tests the market competition
of Nepalese banking industry for an unbalanced panel of 15-25 banks for the period of 2001-
2009. The market concentration is measured by Hirschman-Herfindahl indices and
concentration ratios, and market competition is tested under Panzar-Rosse approach. The
concentration measures indicate decreasing trend and low level of market concentration in
Nepalese banking industry over the sample period. The test of market
competition/contestability by using Panzar-Rosse approach rejects both the hypotheses for
monopoly and perfect competition indicating monopolistic market behaviors among the
Nepalese banks. In addition, the market for interest-based income is found to be more
competitive than that of the market for fee-based income. The results further indicate that the
size of bank has positive, and equity capitalization has negative impact on revenue
generation. The results are robust across different specifications and across different
estimation techniques.
1. INTRODUCTION
Nepalese banking industry has changed significantly over the past few decades as a result of liberalization,
deregulation, advancement in information technology and globalization. The financial sector liberalization
resulted into entry of new banks in the market; deregulation widened the scope of activities and delimited the
banking activities; advancement in technology resulted into new ways and tools to perform banking activities; and
globalization added more pressure on competitiveness of individual banks. Moreover, the banks, nowadays, are
entering into non-banking markets and other financial institutions are entering into the banking markets that have
traditionally been served by the banks. These factors have changed the structure and market behavior of Nepalese
banking industry. From theoretical perspective, neoclassical organizational economic theories state that the
structure of industry affects conducts (pricing behaviors) of firms and conducts, in turn affect the performance.
The structure of industry is more subject to number of competing firms within an industry, nature of products and
services they are providing, barriers to entry and exit and the likes. The structure-conduct-performance (SCP)
hypothesis states that concentration encourages collusive behavior of firms by reducing the cost of collusion.
Hence high concentration may impair the competition. In contrast to the SCP hypothesis, the efficient structure
hypothesis states the market behavior of firm largely depends on the efficiency of the firm. The efficient firm may
have some competitive advantages hence it can increase its market share and realize better performance. From
market contestability perspective, the theories further state that, a number of factors such as restrictions on entry,
cost of exit, competition from non-banking financial institutions, development of capital markets, play an
important role in determining the level of market competition. The collusive behavior may exist and thrive even in
the presence of a large number of banks when the market is less contestable.
In literature, there are two empirical approaches to examine the market structure and competition. From structural
approach, bank concentration measures such as number of banks, market share of banks etc. are used to explain
the market behavior (Bain, 1951). From non- structural approach, different frameworks are developed to assess
the market behavior and competition. The main non-structural models are Iwata model (Iwata, 1974), Bresnahan
and Lau model (Bresnahan, 1982; Lau, 1982) and Panzar and Rosse model (Rosse and Panzar, 1977; Panzar and
Journal of Business, Economics & Finance (2012), Vol.1 (1) Gajurel & Pradhan, 2012
____________________________________________________________________________________________________
________________________________________________________________________
6
Rosse, 1987). The basic premise of non-structural approach is that the firms within an industry behave differently
depending on the market structure in which they operate (Baumol, 1982). With this background, this paper aims
at examining the evolution of market structure, particularly market competition in Nepalese banking industry
using both structural and non-structural measures. The rest of the paper is organized as follows. The section two
provides a brief overview of Nepalese banking industry. Section three briefly reviews some empirical studies on
Market competition that used PR model; section four describes the empirical methodology; section five presents
and analyzes the empirical results and finally section six concludes the paper.
2. AN OVERVIEW OF NEPALESE BANKING INDUSTRY
Nepal has a short history of the modern banking practices that starts from the establishment of Nepal Bank
Limited as a first commercial bank in 1937. The establishment of Nepal Rastra Bank in 1956 as a central bank
gave new dimension to Nepalese financial system. Nepal adopted financial sector liberalization process during
1980s. As a result, many joint-venture and private banks entered into the market. By the end of mid-July 2009, 26
commercial banks were in operation in Nepal. Of the 26 commercial banks, 3 were state-owned and 23 were
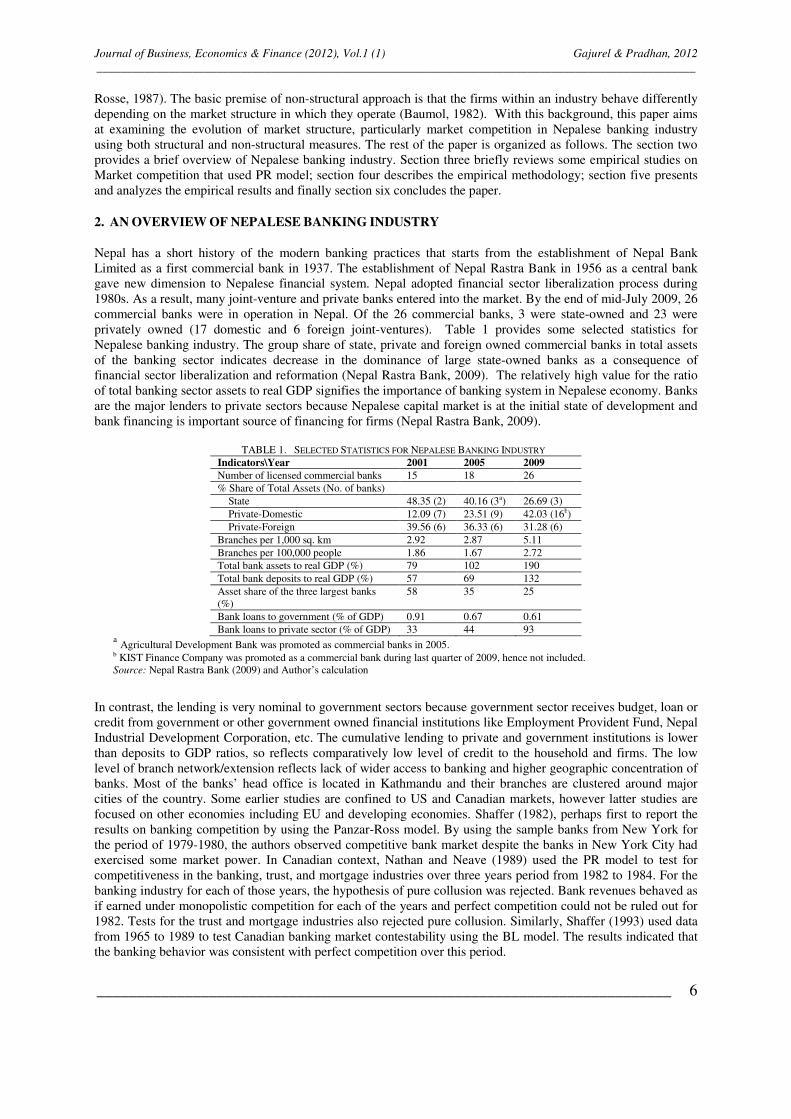
privately owned (17 domestic and 6 foreign joint-ventures). Table 1 provides some selected statistics for
Nepalese banking industry. The group share of state, private and foreign owned commercial banks in total assets
of the banking sector indicates decrease in the dominance of large state-owned banks as a consequence of
financial sector liberalization and reformation (Nepal Rastra Bank, 2009). The relatively high value for the ratio
of total banking sector assets to real GDP signifies the importance of banking system in Nepalese economy. Banks
are the major lenders to private sectors because Nepalese capital market is at the initial state of development and
bank financing is important source of financing for firms (Nepal Rastra Bank, 2009).
TABLE 1. SELECTED STATISTICS FOR NEPALESE BANKING INDUSTRY
Indicators\Year 2001 2005 2009
Number of licensed commercial banks 15 18 26
% Share of Total Assets (No. of banks)
State 48.35 (2) 40.16 (3a) 26.69 (3)
Private-Domestic 12.09 (7) 23.51 (9) 42.03 (16b)
Private-Foreign 39.56 (6) 36.33 (6) 31.28 (6)
Branches per 1,000 sq. km 2.92 2.87 5.11
Branches per 100,000 people 1.86 1.67 2.72
Total bank assets to real GDP (%) 79 102 190
Total bank deposits to real GDP (%) 57 69 132
Asset share of the three largest banks
(%)
58 35 25
Bank loans to government (% of GDP) 0.91 0.67 0.61
Bank loans to private sector (% of GDP) 33 44 93 a Agricultural Development Bank was promoted as commercial banks in 2005.
b KIST Finance Company was promoted as a commercial bank during last quarter of 2009, hence not included.
Source: Nepal Rastra Bank (2009) and Author’s calculation
In contrast, the lending is very nominal to government sectors because government sector receives budget, loan or
credit from government or other government owned financial institutions like Employment Provident Fund, Nepal
Industrial Development Corporation, etc. The cumulative lending to private and government institutions is lower
than deposits to GDP ratios, so reflects comparatively low level of credit to the household and firms. The low
level of branch network/extension reflects lack of wider access to banking and higher geographic concentration of
banks. Most of the banks’ head office is located in Kathmandu and their branches are clustered around major
cities of the country. Some earlier studies are confined to US and Canadian markets, however latter studies are
focused on other economies including EU and developing economies. Shaffer (1982), perhaps first to report the
results on banking competition by using the Panzar-Ross model. By using the sample banks from New York for
the period of 1979-1980, the authors observed competitive bank market despite the banks in New York City had
exercised some market power. In Canadian context, Nathan and Neave (1989) used the PR model to test for
competitiveness in the banking, trust, and mortgage industries over three years period from 1982 to 1984. For the
banking industry for each of those years, the hypothesis of pure collusion was rejected. Bank revenues behaved as
if earned under monopolistic competition for each of the years and perfect competition could not be ruled out for
1982. Tests for the trust and mortgage industries also rejected pure collusion. Similarly, Shaffer (1993) used data
from 1965 to 1989 to test Canadian banking market contestability using the BL model. The results indicated that
the banking behavior was consistent with perfect competition over this period.
Journal of Business, Economics & Finance (2012), Vol.1 (1) Gajurel & Pradhan, 2012
____________________________________________________________________________________________________
________________________________________________________________________
7
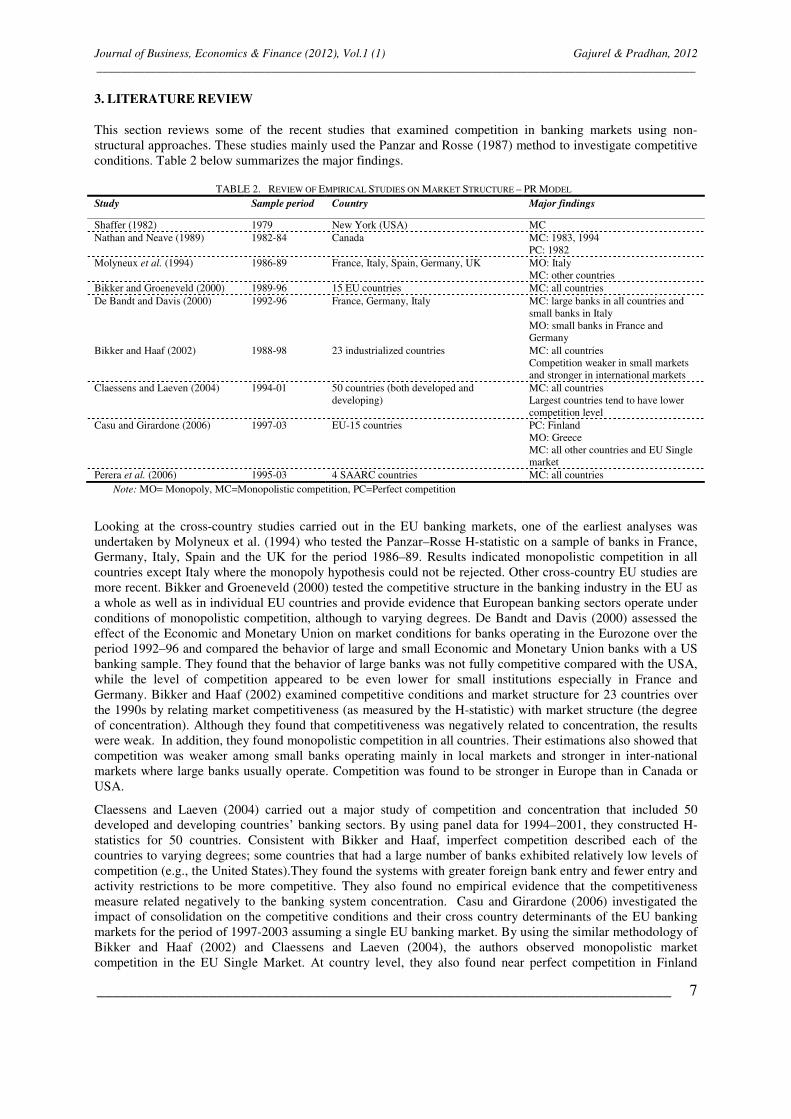
3. LITERATURE REVIEW
This section reviews some of the recent studies that examined competition in banking markets using non-
structural approaches. These studies mainly used the Panzar and Rosse (1987) method to investigate competitive
conditions. Table 2 below summarizes the major findings.
TABLE 2. REVIEW OF EMPIRICAL STUDIES ON MARKET STRUCTURE – PR MODEL
Study Sample period Country Major findings
Shaffer (1982) 1979 New York (USA) MC
Nathan and Neave (1989) 1982-84 Canada MC: 1983, 1994
PC: 1982
Molyneux et al. (1994) 1986-89 France, Italy, Spain, Germany, UK MO: Italy
MC: other countries
Bikker and Groeneveld (2000) 1989-96 15 EU countries MC: all countries
De Bandt and Davis (2000) 1992-96 France, Germany, Italy MC: large banks in all countries and
small banks in Italy
MO: small banks in France and
Germany
Bikker and Haaf (2002) 1988-98 23 industrialized countries MC: all countries
Competition weaker in small markets
and stronger in international markets
Claessens and Laeven (2004) 1994-01 50 countries (both developed and
developing)
MC: all countries
Largest countries tend to have lower
competition level
Casu and Girardone (2006) 1997-03 EU-15 countries PC: Finland
MO: Greece
MC: all other countries and EU Single
market
Perera et al. (2006) 1995-03 4 SAARC countries MC: all countries
Note: MO= Monopoly, MC=Monopolistic competition, PC=Perfect competition
Looking at the cross-country studies carried out in the EU banking markets, one of the earliest analyses was
undertaken by Molyneux et al. (1994) who tested the Panzar–Rosse H-statistic on a sample of banks in France,
Germany, Italy, Spain and the UK for the period 1986–89. Results indicated monopolistic competition in all
countries except Italy where the monopoly hypothesis could not be rejected. Other cross-country EU studies are
more recent. Bikker and Groeneveld (2000) tested the competitive structure in the banking industry in the EU as
a whole as well as in individual EU countries and provide evidence that European banking sectors operate under
conditions of monopolistic competition, although to varying degrees. De Bandt and Davis (2000) assessed the
effect of the Economic and Monetary Union on market conditions for banks operating in the Eurozone over the
period 1992–96 and compared the behavior of large and small Economic and Monetary Union banks with a US
banking sample. They found that the behavior of large banks was not fully competitive compared with the USA,
while the level of competition appeared to be even lower for small institutions especially in France and
Germany. Bikker and Haaf (2002) examined competitive conditions and market structure for 23 countries over
the 1990s by relating market competitiveness (as measured by the H-statistic) with market structure (the degree
of concentration). Although they found that competitiveness was negatively related to concentration, the results
were weak. In addition, they found monopolistic competition in all countries. Their estimations also showed that
competition was weaker among small banks operating mainly in local markets and stronger in inter-national
markets where large banks usually operate. Competition was found to be stronger in Europe than in Canada or
USA.
Claessens and Laeven (2004) carried out a major study of competition and concentration that included 50
developed and developing countries’ banking sectors. By using panel data for 1994–2001, they constructed H-
statistics for 50 countries. Consistent with Bikker and Haaf, imperfect competition described each of the
countries to varying degrees; some countries that had a large number of banks exhibited relatively low levels of
competition (e.g., the United States).They found the systems with greater foreign bank entry and fewer entry and
activity restrictions to be more competitive. They also found no empirical evidence that the competitiveness
measure related negatively to the banking system concentration. Casu and Girardone (2006) investigated the
impact of consolidation on the competitive conditions and their cross country determinants of the EU banking
markets for the period of 1997-2003 assuming a single EU banking market. By using the similar methodology of
Bikker and Haaf (2002) and Claessens and Laeven (2004), the authors observed monopolistic market
competition in the EU Single Market. At country level, they also found near perfect competition in Finland
Journal of Business, Economics & Finance (2012), Vol.1 (1) Gajurel & Pradhan, 2012
____________________________________________________________________________________________________
________________________________________________________________________
8
whereas monopoly competition in Greece. Furthermore, they found little or no evidence on relationship between
competition and concentration which was in contrast to the findings of Bikker and Haaf (2002) and concluded
that concentration measures may not be a reliable indicator for bank competitive environment. Perera et al.
(2006) examined the nature of competition and structure in South Asian banking markets. The study also
assessed whether traditional interest-based product market segments are more competitive than those that also
include fee- and commission-based products. The results from Panzar–Rosse specification tests showed that
bank revenues appear to be earned under conditions of monopolistic competition during the period 1995 to 2003.
In Bangladesh and Pakistan competition is greater in the traditional interest-based product markets while Indian
and Sri Lankan domestic commercial banks seem to face more competitive pressure in the fee-based product
market from other financial intermediaries. There is scarcity of studies on market structure in Nepalese context.
This study is perhaps the first of its type that employs both structural and non-structural measure to assess the
market concentration and contestability. The results of this study have significant policy implications to enhance
the health of Nepalese banking system.
4. DATA AND METHODOLOGY
4.1 Data
This study considers all the commercial banks operating in Nepal for the sample period of nine years from 2001
to 2009. There are minimum of 15 banks (for 2001) and maximum of 25 banks (for 2009) in each year during
sample period. The KIST bank was promoted as commercial banks in 2009. Hence it is not included in study.
The nine year sample period is regarded as sufficient to capture characteristics of Nepalese banking industry.
The choice of sample period is also confined by the availability of data. Although there are other financial
institutions (development banks, finance companies, saving and credit institutions/cooperatives) that provide
banking and near banking or limited banking activities, still the share of commercial banks on total financial
institutions’ asset is more than eighty percent over the sample period (Nepal Rastra Bank, 2009:12). Therefore,
the sample used in this study may rightly represent Nepalese banking industry.
This study is mainly based on accounting (secondary) data of commercial banks. The required data have been
extracted from annual reports and financial statements of the banks available in Securities Board (SEBO)
database and Nepal Rasta Bank (NRB) database.
4.2 Methodology
In line with earlier empirical studies in banking market competition (Molynuex et al., 2006), market
concentration, as measured by “k-bank”, say largest three banks, largest five banks concentration ratios and the
Hirschman-Herfindahl index (HHI), are used as indicators to determine the level of market concentration in
Nepalese banking industry. “k-bank” concentration ratio is the sum of “k” largest banks’ market share. The
higher “k-bank” concentration ratio indicates higher market power of k-banks in market and high degree of
concentration and low degree of market competition. This study uses three-bank and five-bank concentration
ratios.
Similarly, HHI is computed as the sum of square of market share of each firm within an industry. Generally,
increasing HHI indicates a decrease in market competition and increase in the market power of larger firms. A
decreasing HHI suggests increase in market competition. HHI captures the number of firms in the industry
which is not considered in “k-bank” concentration ratio.
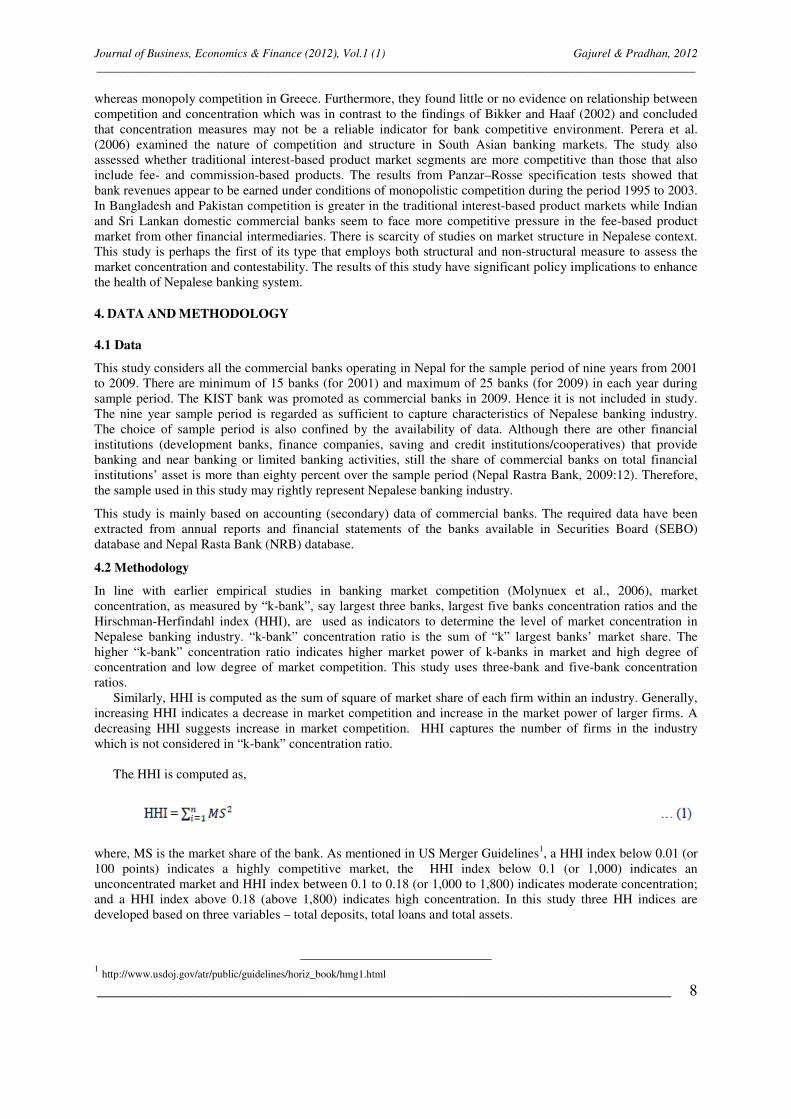
The HHI is computed as,
where, MS is the market share of the bank. As mentioned in US Merger Guidelines1, a HHI index below 0.01 (or
100 points) indicates a highly competitive market, the HHI index below 0.1 (or 1,000) indicates an
unconcentrated market and HHI index between 0.1 to 0.18 (or 1,000 to 1,800) indicates moderate concentration;
and a HHI index above 0.18 (above 1,800) indicates high concentration. In this study three HH indices are
developed based on three variables – total deposits, total loans and total assets.
1 http://www.usdoj.gov/atr/public/guidelines/horiz_book/hmg1.html
Journal of Business, Economics & Finance (2012), Vol.1 (1) Gajurel & Pradhan, 2012
____________________________________________________________________________________________________
________________________________________________________________________
9
The Panzar-Rosse method: Following the empirical literature on competition in banking markets (Bikker and
Haff, 2002: Casu and Girardone, 2006; Perera et al., 2006), this study employs the reduced-form revenue
equation as specified by Panzar and Rosse (1987). The Panzar and Rosse (1987) model is one of the most widely
used techniques to study competitive conditions in the banking. Assuming long-run market equilibrium, this
approach assesses the impact of changes in factor prices on the revenue under the different market structure. The
individual bank prices differently in response to the change in its factor inputs cost. The magnitude of changes
helps to determine the degree of market competition in the market.
The reduced-form revenue model2 is:
lnREVNit = a + b1lnINTCit + b2lnLCit + b3lnOTHCit + b4lnLOANit + b5lnTAit + b6lnEQUTYit +eit
…(2)
where REVN it is the ratio of total interest revenue to total assets for bank i at time t, INTCit is the total interest
expenses to total deposit, LCit is the ratio of personal/staff expenses to total assets, OTHCit is the ratio of total
other operating expenses to total assets, LOANit is the ratio of total loans to total assets, TAit is total assets,
EQUTYit is the ratio of equity to total assets, and eit is the stochastic error term that capture time-varying and
bank-specific random components. The first three independent variables are the factor input prices for funds,
labor and capital respectively and latter three are bank-specific control variables. Since the PR model follows the
log-linear form, the sum of factor price elasticities is termed as “H-statistic”. The value of H-statistic depends on
the competitive environment and corresponding behaviors of banks. Goddard et al. (2001) linked value of H-
statistic with competitive environment. Under perfect competition, the value of H-statistic is 1 that means, 1.0
percent change in cost will lead to a 1.0 percent change in revenues. On the other hand, under the monopoly
market structure, the value of H-statistic is 0 because in monopoly market, increase in factor inputs’ cost
increases the marginal cost, reduces the outputs and ultimately decrease in revenue. The value of H between 0
and 1 indicates the monopolistic competition in the market; the higher value indicates higher degree of
competition.
In addition, following the Perara et al. (2006), second specification of equation (2) is developed for total revenue
of banks as dependent variable with same independent variables. And total revenue is the sum of interest income,
commission and discount income, forex income and other operating income. Therefore, the original model is
regarded as interest-based market model and second specification is regarded as total market model. The
equation (2) is estimated using the fixed effects estimators. The use of fixed effect estimator is motivated from
the fact that the banks in a country face same supervisory and macroeconomic environment.
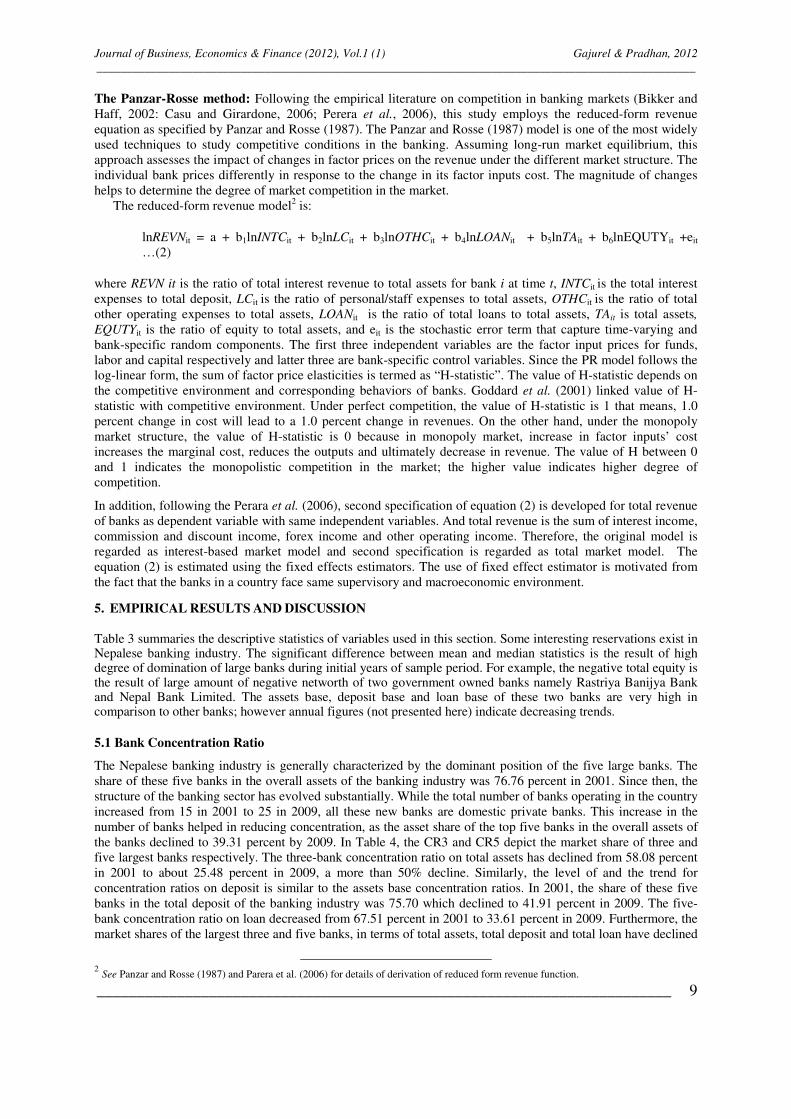
5. EMPIRICAL RESULTS AND DISCUSSION
Table 3 summaries the descriptive statistics of variables used in this section. Some interesting reservations exist in Nepalese banking industry. The significant difference between mean and median statistics is the result of high degree of domination of large banks during initial years of sample period. For example, the negative total equity is the result of large amount of negative networth of two government owned banks namely Rastriya Banijya Bank and Nepal Bank Limited. The assets base, deposit base and loan base of these two banks are very high in comparison to other banks; however annual figures (not presented here) indicate decreasing trends.
5.1 Bank Concentration Ratio
The Nepalese banking industry is generally characterized by the dominant position of the five large banks. The
share of these five banks in the overall assets of the banking industry was 76.76 percent in 2001. Since then, the
structure of the banking sector has evolved substantially. While the total number of banks operating in the country
increased from 15 in 2001 to 25 in 2009, all these new banks are domestic private banks. This increase in the
number of banks helped in reducing concentration, as the asset share of the top five banks in the overall assets of
the banks declined to 39.31 percent by 2009. In Table 4, the CR3 and CR5 depict the market share of three and
five largest banks respectively. The three-bank concentration ratio on total assets has declined from 58.08 percent
in 2001 to about 25.48 percent in 2009, a more than 50% decline. Similarly, the level of and the trend for
concentration ratios on deposit is similar to the assets base concentration ratios. In 2001, the share of these five
banks in the total deposit of the banking industry was 75.70 which declined to 41.91 percent in 2009. The five-
bank concentration ratio on loan decreased from 67.51 percent in 2001 to 33.61 percent in 2009. Furthermore, the
market shares of the largest three and five banks, in terms of total assets, total deposit and total loan have declined
2 See Panzar and Rosse (1987) and Parera et al. (2006) for details of derivation of reduced form revenue function.
Journal of Business, Economics & Finance (2012), Vol.1 (1) Gajurel & Pradhan, 2012
____________________________________________________________________________________________________
________________________________________________________________________
10
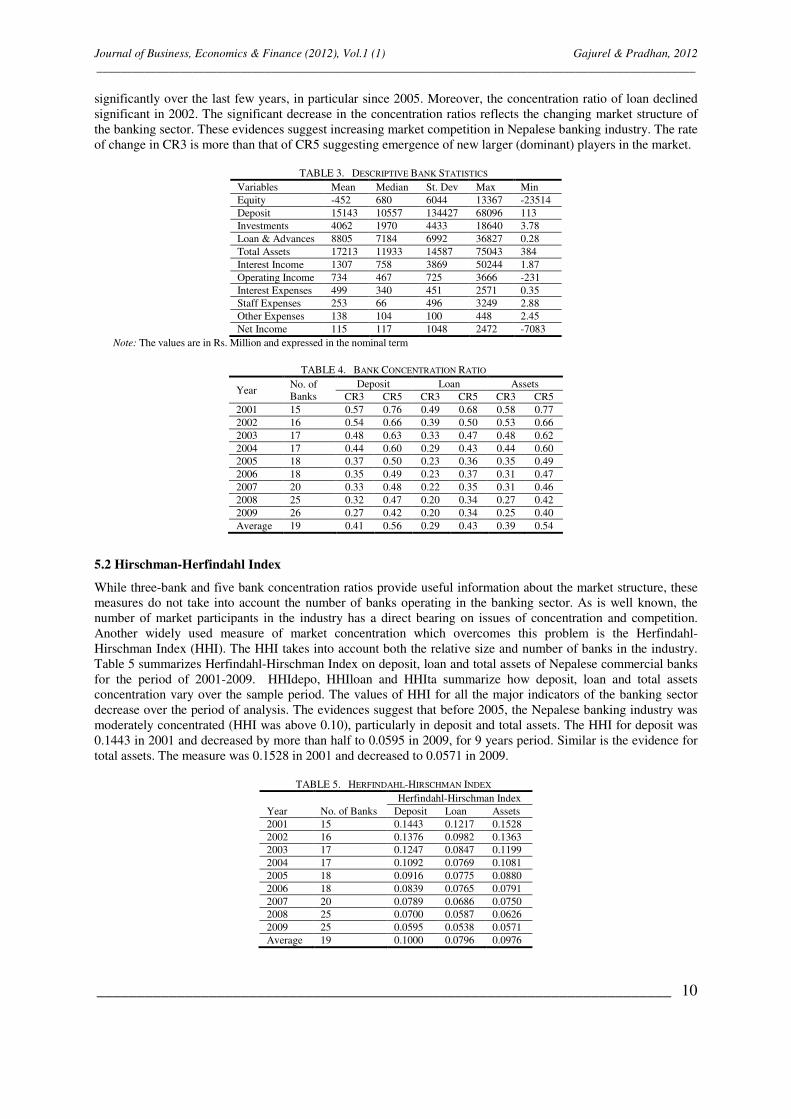
significantly over the last few years, in particular since 2005. Moreover, the concentration ratio of loan declined
significant in 2002. The significant decrease in the concentration ratios reflects the changing market structure of
the banking sector. These evidences suggest increasing market competition in Nepalese banking industry. The rate
of change in CR3 is more than that of CR5 suggesting emergence of new larger (dominant) players in the market.
TABLE 3. DESCRIPTIVE BANK STATISTICS
Variables Mean Median St. Dev Max Min
Equity -452 680 6044 13367 -23514
Deposit 15143 10557 134427 68096 113
Investments 4062 1970 4433 18640 3.78
Loan & Advances 8805 7184 6992 36827 0.28
Total Assets 17213 11933 14587 75043 384
Interest Income 1307 758 3869 50244 1.87
Operating Income 734 467 725 3666 -231
Interest Expenses 499 340 451 2571 0.35
Staff Expenses 253 66 496 3249 2.88
Other Expenses 138 104 100 448 2.45
Net Income 115 117 1048 2472 -7083
Note: The values are in Rs. Million and expressed in the nominal term
TABLE 4. BANK CONCENTRATION RATIO
Year No. of
Banks
Deposit Loan Assets
CR3 CR5 CR3 CR5 CR3 CR5
2001 15 0.57 0.76 0.49 0.68 0.58 0.77
2002 16 0.54 0.66 0.39 0.50 0.53 0.66
2003 17 0.48 0.63 0.33 0.47 0.48 0.62
2004 17 0.44 0.60 0.29 0.43 0.44 0.60
2005 18 0.37 0.50 0.23 0.36 0.35 0.49
2006 18 0.35 0.49 0.23 0.37 0.31 0.47
2007 20 0.33 0.48 0.22 0.35 0.31 0.46
2008 25 0.32 0.47 0.20 0.34 0.27 0.42
2009 26 0.27 0.42 0.20 0.34 0.25 0.40
Average 19 0.41 0.56 0.29 0.43 0.39 0.54
5.2 Hirschman-Herfindahl Index
While three-bank and five bank concentration ratios provide useful information about the market structure, these
measures do not take into account the number of banks operating in the banking sector. As is well known, the
number of market participants in the industry has a direct bearing on issues of concentration and competition.
Another widely used measure of market concentration which overcomes this problem is the Herfindahl-
Hirschman Index (HHI). The HHI takes into account both the relative size and number of banks in the industry.
Table 5 summarizes Herfindahl-Hirschman Index on deposit, loan and total assets of Nepalese commercial banks
for the period of 2001-2009. HHIdepo, HHIloan and HHIta summarize how deposit, loan and total assets
concentration vary over the sample period. The values of HHI for all the major indicators of the banking sector
decrease over the period of analysis. The evidences suggest that before 2005, the Nepalese banking industry was
moderately concentrated (HHI was above 0.10), particularly in deposit and total assets. The HHI for deposit was
0.1443 in 2001 and decreased by more than half to 0.0595 in 2009, for 9 years period. Similar is the evidence for
total assets. The measure was 0.1528 in 2001 and decreased to 0.0571 in 2009.
TABLE 5. HERFINDAHL-HIRSCHMAN INDEX
Year No. of Banks
Herfindahl-Hirschman Index
Deposit Loan Assets
2001 15 0.1443 0.1217 0.1528
2002 16 0.1376 0.0982 0.1363
2003 17 0.1247 0.0847 0.1199
2004 17 0.1092 0.0769 0.1081
2005 18 0.0916 0.0775 0.0880
2006 18 0.0839 0.0765 0.0791
2007 20 0.0789 0.0686 0.0750
2008 25 0.0700 0.0587 0.0626
2009 25 0.0595 0.0538 0.0571
Average 19 0.1000 0.0796 0.0976

Journal of Business, Economics & Finance (2012), Vol.1 (1) Gajurel & Pradhan, 2012
____________________________________________________________________________________________________
________________________________________________________________________
11
There is significant decline in HHI for loan from 2001 to 2002, from 0.1217 to 0.0982. The annual figure of HH
indices show that that the break point for loan market is 2002 and for deposit and total assets is 2005. Among
three segments presented here, the market is less concentrated in loan market segment indicating higher
competition in loan market as evident from lower HHI for loan. Figure 1 captures the trend of Herfindahl-
Hirschman Indices for the sample period. The overall results suggest less concentrated or unconcentrated (as
suggested by US Merger Guidelines) banking market in Nepal. The similar and highly correlated HH indices
confirm it3. Putting all together, the process of economic liberalization, financial sector liberalization over last
decades in economy brought structural changes in the industry. The process of deregulation and reform led to
rapid expansion of number of banks, and their assets, deposit and loan bases. In this background, there is a
remarkable decline in degree of market concentration in the banking sector, as measured by three-bank and five-
bank concentration ratios and the Herfindahl - Hirschman index (HHI) indicating that market competition
(competitive market) in Nepalese banking industry has increased over the last decade.
FIGURE 1: TREND OF MARKET CONCENTRATION
5.3 Test of Market Structure: Panzor and Rosse Model
Among the non-structural models, one of the widely used techniques to study competitive conditions in the
banking industry is the Panzar and Rosse (1987) model. The Panzar-Rosse (PR) model assesses the impact of
changes in factor prices on the revenue under the different market structure. The magnitude of changes helps to
determine the degree of market competition in the market. Table 6 presents the Pearson correlation matrix of
variables used in Panzar-Rosse model. From the table, it reveals that there is lower correlation among explanatory
variables; hence multicolinearity may not be the serious problem while estimating the parameters.
3 The correlation coefficient of HHI between total assets and deposit is 0.995 and total assets and loan is 0.949.

Journal of Business, Economics & Finance (2012), Vol.1 (1) Gajurel & Pradhan, 2012
____________________________________________________________________________________________________
________________________________________________________________________
12
TABLE 6. CORRELATION MATRIX
REVN INTC LC OTHC LOAN TA EQTY
REVN 1.00
INTC 0.49 1.00
LC 0.44 -0.13 1.00
OTHC 0.24 -0.11 0.23 1.00
LOAN 0.22 0.08 -0.12 -0.19 1.00
TA -0.12 -0.47 0.11 -0.43 0.25 1.00
EQTY -0.19 0.11 0.23 0.06 -0.30 -0.45 1.00
Note: REVN is the ratio of interest income divided by total assets; INTC is the interest expenses divided by total deposit; LC is the staff expenses divided by total assets; INTC is the ratio of interest expenses to total deposit and borrowed funds; LC is the ratio of staff expenses to total assets; OTHC is the ratio of other operating expenses to total assets. LOAN is the ratio of loan to total assets; TA is the total assets; and EQUTY is the ratio of equity to total assets.
The fixed effect estimates for both models are reported in Table 7. The models are statistically significant and
have reasonably sound explanatory power evident from adjusted R-square values. All the coefficients, except for
the LOAN, are statistically significant. The sum of elasticity of factor prices is 0.685 in Model I and 0.5969 in
Model II suggesting monopolistic competition in Nepalese banking industry. The Wald tests for perfect
competition (H=1) and for monopoly (H=0) that reject the null hypotheses reconfirms the conclusion. The higher
value of H-statistic in Model I indicates that there is higher competition among Nepalese banks in interest income
based market than that of in non-interest income market. An analysis of the sign and significance of the
regression coefficients, particularly price of inputs in table 6, indicate that the price elasticity of funds, labor and
capital are positive and statistically significant in both the models. In interest-based product market (Model I), the
impact of cost for funds seems to be high and the labor cost seems to be low. However, these results vary in total
market (Model II) where cost of capital seems to be low compared with other input prices. The results are
consistent with (Molyneux et al., 1994; Bikker and Haaf, 2002; Casu and Girardone, 2006). In addition, for
interest based market, cost of funds has higher influence on revenue (income); the elasticity is 0.3872 for Model I
and 0.2297 for Model II.
Regarding other bank-specific variables in regression, the coefficient of lending activities, measured by loan to
total assets is positive, suggesting positive effect of lending activities on revenue of the banks. However the
coefficient is not statistically significant at normal level.
TABLE 7. FIXED EFFECTS ESTIMATES OF PR MODEL
Model I Model II
Interest-based
product market Total market
Coefficient S. Error P-value Coefficient S. Error P-value
INTC 0.387 0.029 0.000 0.230 0.035 0.000
LC 0.128 0.040 0.002 0.196 0.049 0.000
OTHC 0.169 0.042 0.000 0.171 0.051 0.001
LOAN 0.011 0.007 0.110 0.009 0.008 0.270
TA 0.046 0.015 0.003 0.044 0.018 0.015
EQUTY -0.110 0.023 0.000 -0.090 0.028 0.002
CONSTANT -1.372 0.272 0.000 -0.942 0.331 0.005
Adj. R-Squared 0.646 0.579
F-statistic 43.79 14.48
p-value of F-stat. 0.000 0.000
H-statistic 0.685 0.597
Wald test for H=1
F-statistic 29.94 33.18
p-value of F-stat. 0.000 0.000
Wald test for H=0
F-statistic 141.5 72.78
p-value of F-stat. 0.0000 0.000
No. of observations 130 130
Note: In Model I, dependent variable is log of total interest income to total assets and in Model II dependent variable is the log of sum of interest income, commission and discount income, and other operating income to total assets. All the independent variables are measured in log scale. The H-Statistic (in bold) is the sum of first three coefficients. In Wald test, the given statement is the null hypothesis. The log-linear function of model and equilibrium test limited the sample size to 130 observations. For variable description see Table 6.
The size of the bank plays significant and equal role in generating revenue in interest-based market and total
market as signified by the positive and statistically significant coefficient. The marginal propensity of revenue
(interest income) with respect to asset base is approximately 4.5 percent (0.045) indicating some scale economies
Journal of Business, Economics & Finance (2012), Vol.1 (1) Gajurel & Pradhan, 2012
____________________________________________________________________________________________________
________________________________________________________________________
13
on revenue generation. The sign of equity capitalization is negative and statistically significant in both models.
The result is consistent with banking theories; the bank with higher risk propensity uses less equity hence
generates more income (Molyneux et al., 1994); and suggests that revenue propensity decreases as equity ratio
increases. The magnitude of equity ratio is greater for interest-based product market than that for total market. The
evidences from PR reduced form revenue models confirm the evidences from general measure of market
competition, the concentration ratio (“Three-bank”, “Five-bank” concentration ratio and HHI), i.e., Nepalese
banking industry is competitive, at least monopolistic competitive behavior among banks.
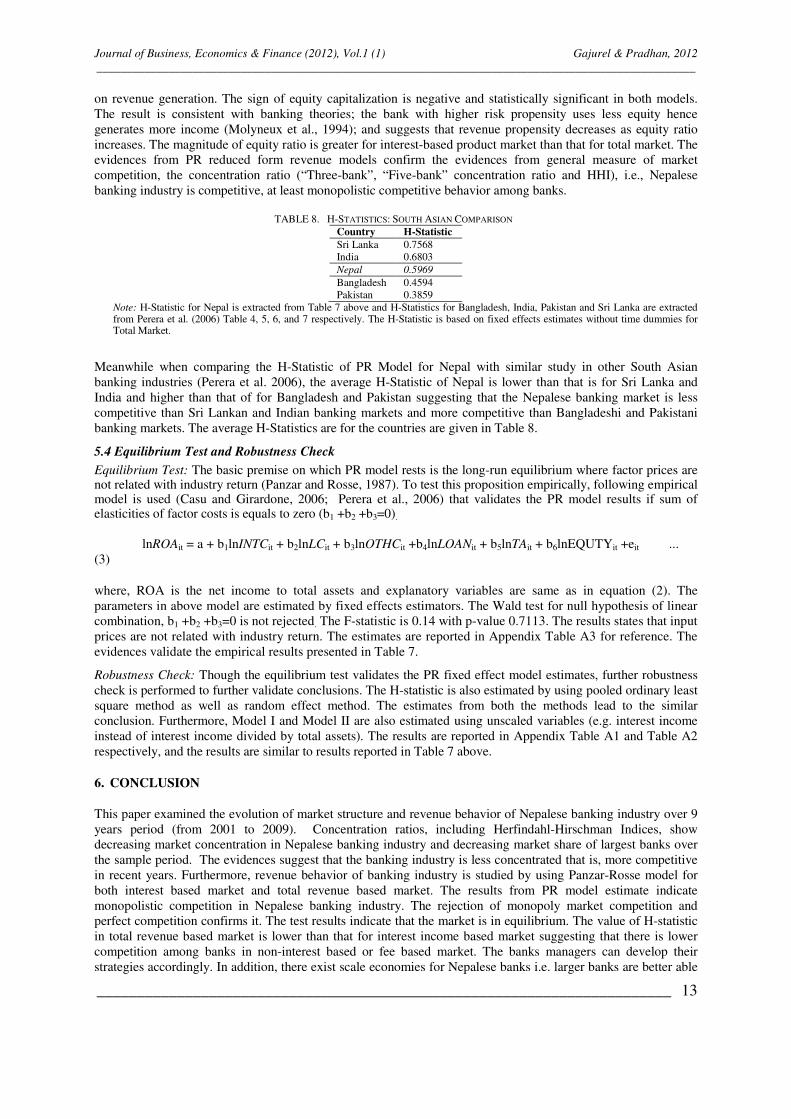
TABLE 8. H-STATISTICS: SOUTH ASIAN COMPARISON
Country H-Statistic
Sri Lanka 0.7568
India 0.6803
Nepal 0.5969
Bangladesh 0.4594
Pakistan 0.3859
Note: H-Statistic for Nepal is extracted from Table 7 above and H-Statistics for Bangladesh, India, Pakistan and Sri Lanka are extracted from Perera et al. (2006) Table 4, 5, 6, and 7 respectively. The H-Statistic is based on fixed effects estimates without time dummies for Total Market.
Meanwhile when comparing the H-Statistic of PR Model for Nepal with similar study in other South Asian
banking industries (Perera et al. 2006), the average H-Statistic of Nepal is lower than that is for Sri Lanka and
India and higher than that of for Bangladesh and Pakistan suggesting that the Nepalese banking market is less
competitive than Sri Lankan and Indian banking markets and more competitive than Bangladeshi and Pakistani
banking markets. The average H-Statistics are for the countries are given in Table 8.
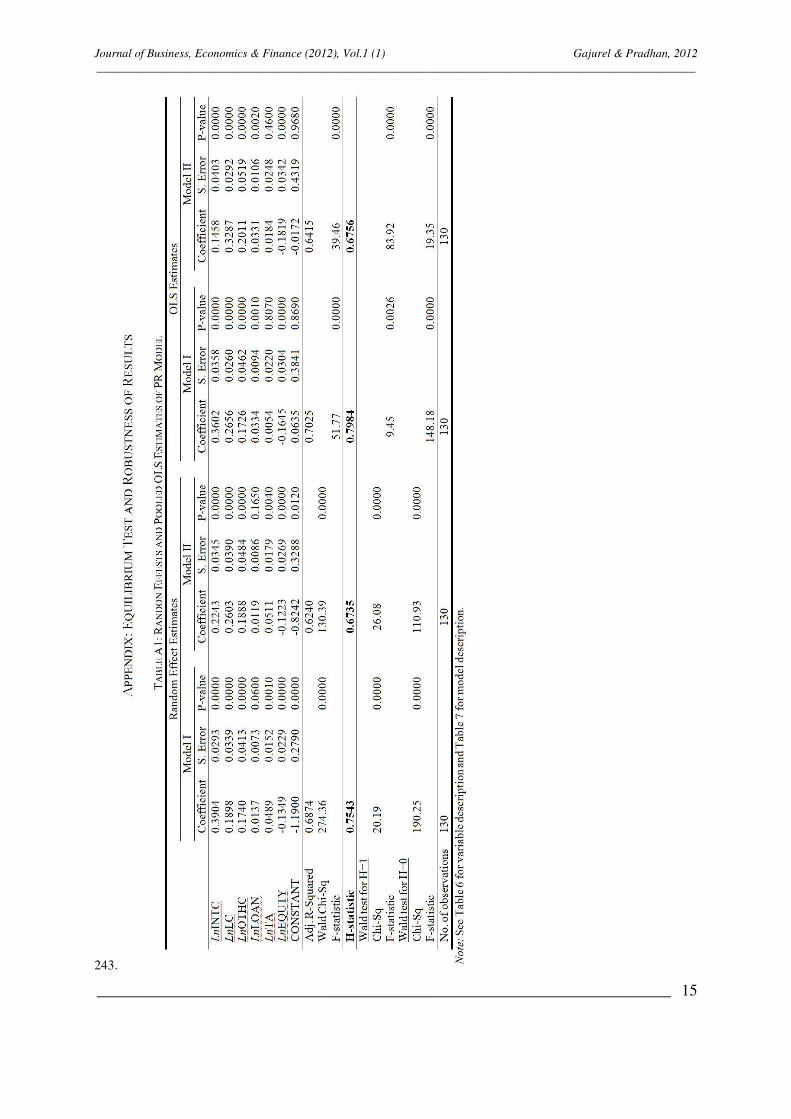
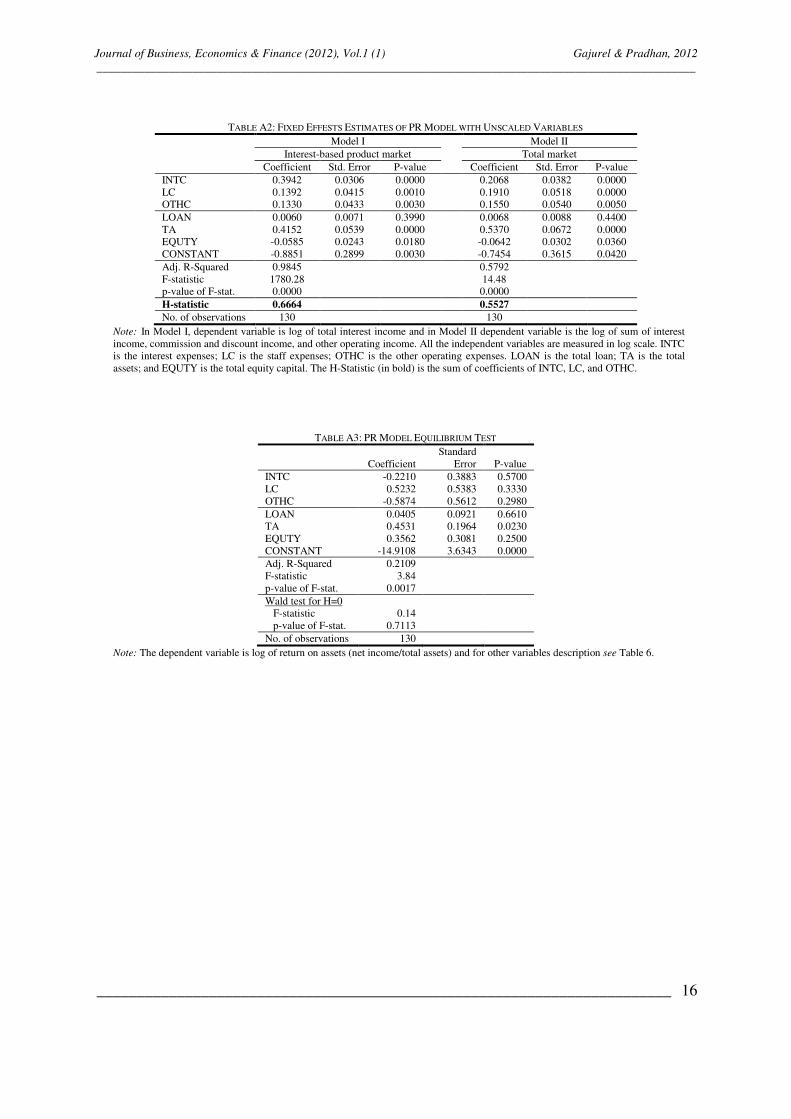
5.4 Equilibrium Test and Robustness Check
Equilibrium Test: The basic premise on which PR model rests is the long-run equilibrium where factor prices are not related with industry return (Panzar and Rosse, 1987). To test this proposition empirically, following empirical model is used (Casu and Girardone, 2006; Perera et al., 2006) that validates the PR model results if sum of elasticities of factor costs is equals to zero (b1 +b2 +b3=0).
lnROAit = a + b1lnINTCit + b2lnLCit + b3lnOTHCit +b4lnLOANit + b5lnTAit + b6lnEQUTYit +eit ...
(3)
where, ROA is the net income to total assets and explanatory variables are same as in equation (2). The
parameters in above model are estimated by fixed effects estimators. The Wald test for null hypothesis of linear
combination, b1 +b2 +b3=0 is not rejected. The F-statistic is 0.14 with p-value 0.7113. The results states that input
prices are not related with industry return. The estimates are reported in Appendix Table A3 for reference. The
evidences validate the empirical results presented in Table 7.
Robustness Check: Though the equilibrium test validates the PR fixed effect model estimates, further robustness
check is performed to further validate conclusions. The H-statistic is also estimated by using pooled ordinary least
square method as well as random effect method. The estimates from both the methods lead to the similar
conclusion. Furthermore, Model I and Model II are also estimated using unscaled variables (e.g. interest income
instead of interest income divided by total assets). The results are reported in Appendix Table A1 and Table A2
respectively, and the results are similar to results reported in Table 7 above.
6. CONCLUSION
This paper examined the evolution of market structure and revenue behavior of Nepalese banking industry over 9
years period (from 2001 to 2009). Concentration ratios, including Herfindahl-Hirschman Indices, show
decreasing market concentration in Nepalese banking industry and decreasing market share of largest banks over
the sample period. The evidences suggest that the banking industry is less concentrated that is, more competitive
in recent years. Furthermore, revenue behavior of banking industry is studied by using Panzar-Rosse model for
both interest based market and total revenue based market. The results from PR model estimate indicate
monopolistic competition in Nepalese banking industry. The rejection of monopoly market competition and
perfect competition confirms it. The test results indicate that the market is in equilibrium. The value of H-statistic
in total revenue based market is lower than that for interest income based market suggesting that there is lower
competition among banks in non-interest based or fee based market. The banks managers can develop their
strategies accordingly. In addition, there exist scale economies for Nepalese banks i.e. larger banks are better able

Journal of Business, Economics & Finance (2012), Vol.1 (1) Gajurel & Pradhan, 2012
____________________________________________________________________________________________________
________________________________________________________________________
14
to generate more revenue. Therefore the individual banks can take advantage of scale economies. However, there
is negative impact of equity capital on revenue generation in Nepalese banking- the banks with higher equity base
are likely to generate lower revenue comparing with banks with lower equity capital base. It indicates that there is
risk-return trade-off between equity capital and revenue. The results are robust to different model specifications
and different estimation techniques. Nevertheless, as indicate by the value of H-statistic, there is room for
improvement in competitive behavior of Nepalese commercial banks. Hence, the regulators should give continuity
to the ongoing financial sector liberalization and reformation that help to increase competitive market behavior
among banks.
ACKNOWLEDGEMENT
Authors thank to participants at Campus for Finance Research Conference at WHU Otto Beisheim School of Management, Vallendar, Germany, anonymous referee and editor for their valuable comments and to Dr. Shrimal Parera, Monash University, Australia and Prof. Dr. Dev Raj Adhikari, Tribhuvan University, Nepal for their motivation.
REFERENCES
Bain, J. (1951). Relation of profit rate to industry concentration. Quarterly Journal of Economics, 65, 293-324.
Baumol, W. (1982). Contestable markets: an unrising in the theory of industry structure. American Economic Review, 72, 1-
15.
Bikker, J. and Groeneveld, J. (2000). Competition and concentration in the EU banking industry. Kredit und Kapital, 33,
62–98.
Bikker, J. and Haaf, K (2002). Competition, concentration and their relationship: An empirical analysis of the banking
industry. Journal of Banking & Finance, 26, 2191-2214.
Bresnahan, T. (1982). The oligopoly solution concept is identified. Economics Letters, 10, 87–92.
Casu, B. and Girardone, C. (2006). Bank competition, concentration and efficiency in the Single European Market. The
Manchester School, 74(4), 441-468.
Claessens, S. and Laeven, L. (2004). What drives bank competition? Some international evidence. Journal of Money,
Credit, and Banking, 36, 563–584.
Claessens, S., Demirguc-Kunt, A., Huizinga, H. (2001). How does foreign entry affect the domestic banking market?
Journal of Banking and Finance, 25, 891-911.
de Bandt, O, and Davis, E. (2000). Competition, contestability and market structure in European banking sectors on the eve
of EMU. Journal of Banking and Finance, 24, 1045–66.
Iwata, G. (1974). Measurement of conjectural variations in oligopoly. Econometrica, 42, 947–966.
Kohn, M. (1994). Financial Institutions and Markets. New Delhi: Tata McGraw-Hill Publishing Company.
Lau, L. (1982). On identifying the degree of competitiveness from industry price and output data. Economics Letters, 10, 93–
99.
Molyneux, P., Lloyd-Williams, D. and Thornton, J. (1994). Competitive conditions in European banking. Journal of
Banking and Finance, 18, 445–459.
Nathan, A. and Neave, E. (1989). Competition and contestability in Canada’s financial system: empirical results, Canadian
Journal of Economics, 22, 576–594.
Nepal Rastra Bank (2009). Banking and Financial Statistics No. 53, Kathmandu: Nepal Rastra Bank.
Panzar, J. and Rosse, J. (1987). Testing for monopoly equilibrium. Journal of Industrial Economics, 35, 443-456.
Parera. S., Skully, M. and Wichramanayake, J. (2006). Competition and structure of South Asian banking: a revenue
behavior approach. Applied Financial Economics, 16, 789-801.
Rosse, J. and Panzar, J. (1977). Chamberlin vs Robinson: An empirical test for monopoly rents. Bell Laboratories
Economic Discussion Paper 90.
Schaffer, S. (1982). A non-structural test for competition in financial markets. In Bank Structure and Competition,
Conference Proceedings, Federal Reserve Bank of Chicago, 225-243
Journal of Business, Economics & Finance (2012), Vol.1 (1) Gajurel & Pradhan, 2012
____________________________________________________________________________________________________
________________________________________________________________________
15
243.
Journal of Business, Economics & Finance (2012), Vol.1 (1) Gajurel & Pradhan, 2012
____________________________________________________________________________________________________
________________________________________________________________________
16
TABLE A2: FIXED EFFESTS ESTIMATES OF PR MODEL WITH UNSCALED VARIABLES
Model I Model II
Interest-based product market Total market
Coefficient Std. Error P-value Coefficient Std. Error P-value
INTC 0.3942 0.0306 0.0000 0.2068 0.0382 0.0000
LC 0.1392 0.0415 0.0010 0.1910 0.0518 0.0000
OTHC 0.1330 0.0433 0.0030 0.1550 0.0540 0.0050
LOAN 0.0060 0.0071 0.3990 0.0068 0.0088 0.4400
TA 0.4152 0.0539 0.0000 0.5370 0.0672 0.0000
EQUTY -0.0585 0.0243 0.0180 -0.0642 0.0302 0.0360
CONSTANT -0.8851 0.2899 0.0030 -0.7454 0.3615 0.0420
Adj. R-Squared 0.9845 0.5792
F-statistic 1780.28 14.48
p-value of F-stat. 0.0000 0.0000
H-statistic 0.6664 0.5527
No. of observations 130 130
Note: In Model I, dependent variable is log of total interest income and in Model II dependent variable is the log of sum of interest
income, commission and discount income, and other operating income. All the independent variables are measured in log scale. INTC
is the interest expenses; LC is the staff expenses; OTHC is the other operating expenses. LOAN is the total loan; TA is the total
assets; and EQUTY is the total equity capital. The H-Statistic (in bold) is the sum of coefficients of INTC, LC, and OTHC.
TABLE A3: PR MODEL EQUILIBRIUM TEST
Coefficient
Standard
Error P-value
INTC -0.2210 0.3883 0.5700
LC 0.5232 0.5383 0.3330
OTHC -0.5874 0.5612 0.2980
LOAN 0.0405 0.0921 0.6610
TA 0.4531 0.1964 0.0230
EQUTY 0.3562 0.3081 0.2500
CONSTANT -14.9108 3.6343 0.0000
Adj. R-Squared 0.2109
F-statistic 3.84
p-value of F-stat. 0.0017
Wald test for H=0
F-statistic 0.14
p-value of F-stat. 0.7113
No. of observations 130
Note: The dependent variable is log of return on assets (net income/total assets) and for other variables description see Table 6.

Journal of Business, Economics & Finance (2012), Vol.1 (1) Docking, 2012 ____________________________________________________________________________________________________
________________________________________________________________________
17
DÉJÀ VU?
A COMPARISON OF THE 1980S AND 2008 FINANCIAL CRISES
Diane Scott Docking, Ph.D.
Northern Illinois University, Department of Finance, DeKalb, IL 60115, [email protected] , 815-753-6396
KEYWORDS
Dodd-Frank, Wall Street Reform and Consumer Protection Act, Subprime mortgage crisis, Savings and loan crisis
ABSTRACT
The 2008 subprime mortgage crisis was caused by many of the same factors as the 1980s Savings and Loan crisis. There were numerous, concomitant, interrelated forces that caused these two crises. Just as the government did after the Savings and Loan crisis, they passed legislation to prevent a future crisis: the Dodd-Frank Wall Street Reform and Consumer Protection Act of 2010. Many of the items in this bill were also in the regulations passed after the Savings and Loan crisis. This article studies the similarities between the causes of the 1980s and 2008 crises and the resulting regulations – noting those actions that worked and those that did not.
1. INTRODUCTION
The New York Times Headlines:
“What’s New in Real Estate Brokerage; A Gaggle of Gimmicks to Entice Buyers”
“Further Tight Credit Means Problems for Housing”
“Mortgage Defaults Increase”
“Study Finds Housing Crisis in Rural America”
“Banks’ Bad Real Estate Loans Spur Rising Worry of Failures”
“Inquiry Finds a Pattern in Mortgage Frauds”
“Fed is Wary on New Bank Products”
“New Securities Tied to Assets”
“Bonuses on Wall Street May Be the Fattest Ever”
“The Market Plunge: Upheaval in the Financial World – Investors’ Hopes Sink as Stocks Slip”
“U.S. Bailouts: Caution Urged”
“Chrysler Corporation’s $1.5 Billion Bailout”
“Unemployment Increases to 10.4%”
“Oil Prices Surge on Open Market”
“Regulation of Banking on the Rise: Trend Reflects Necessity and Not Ideology”
Recent headlines? No! These poignant headlines are from 1979 – 1989! Similar headlines have been seen in recent years as the U.S. again faces challenges in the financial services industry and the economy that were faced during the savings and loan/banking crisis of the 1980s. The 2008 subprime mortgage crisis was caused by
Journal of Business, Economics & Finance (2012), Vol.1 (1) Docking, 2012 ____________________________________________________________________________________________________
________________________________________________________________________
18
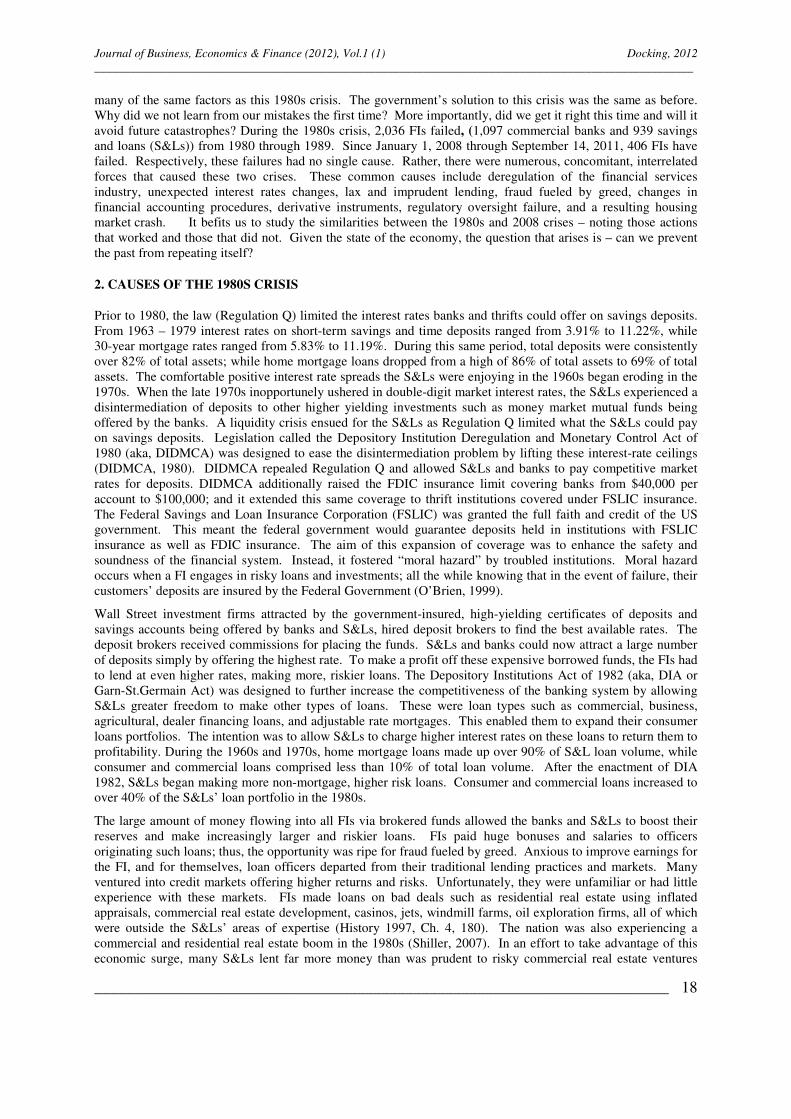
many of the same factors as this 1980s crisis. The government’s solution to this crisis was the same as before. Why did we not learn from our mistakes the first time? More importantly, did we get it right this time and will it avoid future catastrophes? During the 1980s crisis, 2,036 FIs failed, (1,097 commercial banks and 939 savings and loans (S&Ls)) from 1980 through 1989. Since January 1, 2008 through September 14, 2011, 406 FIs have failed. Respectively, these failures had no single cause. Rather, there were numerous, concomitant, interrelated forces that caused these two crises. These common causes include deregulation of the financial services industry, unexpected interest rates changes, lax and imprudent lending, fraud fueled by greed, changes in financial accounting procedures, derivative instruments, regulatory oversight failure, and a resulting housing market crash. It befits us to study the similarities between the 1980s and 2008 crises – noting those actions that worked and those that did not. Given the state of the economy, the question that arises is – can we prevent the past from repeating itself?
2. CAUSES OF THE 1980S CRISIS
Prior to 1980, the law (Regulation Q) limited the interest rates banks and thrifts could offer on savings deposits. From 1963 – 1979 interest rates on short-term savings and time deposits ranged from 3.91% to 11.22%, while 30-year mortgage rates ranged from 5.83% to 11.19%. During this same period, total deposits were consistently over 82% of total assets; while home mortgage loans dropped from a high of 86% of total assets to 69% of total assets. The comfortable positive interest rate spreads the S&Ls were enjoying in the 1960s began eroding in the 1970s. When the late 1970s inopportunely ushered in double-digit market interest rates, the S&Ls experienced a disintermediation of deposits to other higher yielding investments such as money market mutual funds being offered by the banks. A liquidity crisis ensued for the S&Ls as Regulation Q limited what the S&Ls could pay on savings deposits. Legislation called the Depository Institution Deregulation and Monetary Control Act of 1980 (aka, DIDMCA) was designed to ease the disintermediation problem by lifting these interest-rate ceilings (DIDMCA, 1980). DIDMCA repealed Regulation Q and allowed S&Ls and banks to pay competitive market rates for deposits. DIDMCA additionally raised the FDIC insurance limit covering banks from $40,000 per account to $100,000; and it extended this same coverage to thrift institutions covered under FSLIC insurance. The Federal Savings and Loan Insurance Corporation (FSLIC) was granted the full faith and credit of the US government. This meant the federal government would guarantee deposits held in institutions with FSLIC insurance as well as FDIC insurance. The aim of this expansion of coverage was to enhance the safety and soundness of the financial system. Instead, it fostered “moral hazard” by troubled institutions. Moral hazard occurs when a FI engages in risky loans and investments; all the while knowing that in the event of failure, their customers’ deposits are insured by the Federal Government (O’Brien, 1999).
Wall Street investment firms attracted by the government-insured, high-yielding certificates of deposits and savings accounts being offered by banks and S&Ls, hired deposit brokers to find the best available rates. The deposit brokers received commissions for placing the funds. S&Ls and banks could now attract a large number of deposits simply by offering the highest rate. To make a profit off these expensive borrowed funds, the FIs had to lend at even higher rates, making more, riskier loans. The Depository Institutions Act of 1982 (aka, DIA or Garn-St.Germain Act) was designed to further increase the competitiveness of the banking system by allowing S&Ls greater freedom to make other types of loans. These were loan types such as commercial, business, agricultural, dealer financing loans, and adjustable rate mortgages. This enabled them to expand their consumer loans portfolios. The intention was to allow S&Ls to charge higher interest rates on these loans to return them to profitability. During the 1960s and 1970s, home mortgage loans made up over 90% of S&L loan volume, while consumer and commercial loans comprised less than 10% of total loan volume. After the enactment of DIA 1982, S&Ls began making more non-mortgage, higher risk loans. Consumer and commercial loans increased to over 40% of the S&Ls’ loan portfolio in the 1980s.
The large amount of money flowing into all FIs via brokered funds allowed the banks and S&Ls to boost their reserves and make increasingly larger and riskier loans. FIs paid huge bonuses and salaries to officers originating such loans; thus, the opportunity was ripe for fraud fueled by greed. Anxious to improve earnings for the FI, and for themselves, loan officers departed from their traditional lending practices and markets. Many ventured into credit markets offering higher returns and risks. Unfortunately, they were unfamiliar or had little experience with these markets. FIs made loans on bad deals such as residential real estate using inflated appraisals, commercial real estate development, casinos, jets, windmill farms, oil exploration firms, all of which were outside the S&Ls’ areas of expertise (History 1997, Ch. 4, 180). The nation was also experiencing a commercial and residential real estate boom in the 1980s (Shiller, 2007). In an effort to take advantage of this economic surge, many S&Ls lent far more money than was prudent to risky commercial real estate ventures
Journal of Business, Economics & Finance (2012), Vol.1 (1) Docking, 2012 ____________________________________________________________________________________________________
________________________________________________________________________
19
which many S&Ls were not qualified to assess (Seidman, 1997). Total percentage of commercial real estate loans in an S&Ls’ loan portfolio rose from 17.3% in 1980 to 38.1% in 1986 to 30.2% in 1989. In addition, because of the high interest rates and escalating home prices many families were unable to afford home purchases. In an attempt to qualify buyers for a residential mortgage, banks began increasing the debt payment to income ratio from the traditional 25% to 33% (Brooks, 1982). This upward movement was dangerous to unsuspecting borrowers!
In addition to the precarious changes in residential home ownership, the expected changes in the tax law combined with the glut of office space available began to depress commercial real estate prices (Bleakley, June 17, 1985). Prior to 1986, primarily passive investors provided the funding for commercial real estate ventures. The Tax Reform Act of 1986 reduced the value of these investments for passive investors by restricting the extent to which losses could be deducted against ordinary income (Auerbach & Slemrod, 1997). The Tax Reform Act of 1986 ended the benefits of this tax shelter and thus encouraged the holders of loss-generating properties to try to unload them, which contributed further to the problem of sinking real estate values (Auerbach & Slemrod, 1997). This contributed to the end of the real estate boom of the early to mid 1980s and facilitated the S&L crisis. Between 1986 and 1991, the number of new homes constructed dropped from 1.18 to 0.84 million and existing home sales dropped from 3.48 million to 2.87 million. Although home prices were still increasing during this period, they were doing so at a decreasing rate. The median price of new single-family homes actually decreased 1.90% in 1991. When both the commercial and residential real estate markets started their decline in 1986, the FIs went with them. From 1986 through 1991, 2,123 FIs failed (1,098 banks and 1,025 S&Ls). The government’s increasing of deposit insurance coverage virtually guaranteed that desperate S&L owners and managers would engage in ever more risky investments, knowing that if they were successful, the institution would be saved, and if unsuccessful, their depositors would still be bailed out.
Homeowners began defaulting on mortgages in large numbers as early as 1979. Delinquencies were 2.79% of total loans in 1979, up from 0.62% the year before. Delinquencies reached their 3.88% peak in 1983. Loan charge-offs as a percent of total loans increased steadily from 0.27% in 1979 to 1.6% in 1991. The Mortgage Bankers Association reported a record number of borrowers had been delinquent 30-days or more and a still near-record number were losing their homes to foreclosure in the first quarter of 1985 (Kilborn, 1985). Experts cited the following factors as causes for the delinquencies: a high unemployment rate of 7.2%, a decline in the rate of increases in home prices, lax lending standards, and in some areas of the country, actual price declines in home values (Kilborn, 1985). The crashing of the stock market in October 1987 only made matters worse. DIDMCA and Garn-St.Germain acts introduced new risks and speculative opportunities for the troubled institutions. In summary, the elimination of regulations designed to prevent lending excesses and minimize failures backfired on the industry. The banking problems of the 1980s came primarily from unsound real estate lending (Seidman, 1997). Asset securitization, into which the financial industry now ventured, was another cause of the 1980’s crisis. Loan participations, where S&Ls sold loans to other banks, allowed the S&Ls to spread their loan default risk to other institutions. Investment bankers like Goldman Sachs, Solomon Brothers, and Morgan Stanley were buying other types of loans secured by leases, automobiles, real estate properties, credit card receivables, and commercial properties from FIs. They then packaged them into collateralized debt obligations (CDOs), and sold them to investors (Bleakley, June 4, 1985; Bleakley, June 17, 1985; Sloane, 1985). The Federal National Mortgage Association (FNMA) also purchased first and second mortgages from the originating banks and thrifts, then packaged them into mortgage-backed securities (MBSs) and collateralized mortgage obligations (CMOs) which they sold to investors (Bennett, 1985). This securitization process made millions of dollars in new money available for more lending. The institution that generated the mortgages continued to service the loans and received substantial fees for doing so. MBSs and CMOs issues increased from $452.4 million in 1970 to $451,487.55 million by 1991. Novel risk-management techniques are also cited as a contributing factor to the 1980’s crisis. The interest rate swap, a new technique to manage risk, was being used by many banks. Banking regulators grew concerned about these hedging devices, despite assurances by the bankers that the swaps were safe and that the banks’ exposure was limited, (Bleakley, February 7, 1985).
Regulators failing to close insolvent institutions in a timely manner also exacerbated the crisis. Too many S&Ls were failing at the same time, the FSLIC was broke; and instead of cutting their losses and closing S&Ls who could not meet minimum capital requirements, the government lowered the minimum capital standards. This is like saying we have too few medical doctors, so let us lower the passing grade for becoming a licensed physician. In the hope of providing S&Ls time to recover, the Federal Home Loan Bank Board (FHLBB), the oversight board for S&Ls, lowered capital reserve requirements from 5% to 4% in November 1980 and to 3% in January 1982 (History 1997, Ch. 4, 173). When these measures failed to forestall insolvencies, the Garn-St.Germain Act of 1982 authorized a new capital assistance program – the Net Worth Certificate Program.
Journal of Business, Economics & Finance (2012), Vol.1 (1) Docking, 2012 ____________________________________________________________________________________________________
________________________________________________________________________
20
Under this program, the qualifying distressed institutions would record an asset and a corresponding capital account on their balance sheets:
Dr) Receivable from FSLIC Cr) Net Worth Certificate The Net Worth Certificate was included in regulatory capital, thus bringing the S&L in compliance with required capital reserve ratios. However, a major problem was that the receivable from the FSLIC was worthless because their funds were depleted (Garcia et al, 1983). The FHLBB also encouraged healthier banks and thrifts to acquire these failing S&Ls. Changes in the accounting practice for “goodwill” were implemented to make such acquisitions more attractive for the acquiring institution (History 1997, Ch. 4, 174). In July 1982, the FHLBB changed the existing ten-year amortization restriction on goodwill to no more than 40 years. Goodwill is created when the purchase price exceeds the market value of the assets of the acquired thrift.
A brief synopsis of the example provided in History of the Eighties – Lessons for the Future (History 1997, Ch. 4, 174) follows:
Suppose a failing thrift has asset of $100,000,000 and deposits of $100,000,000 and $0 equity. Upon being purchased, its assets are discounted to their fair market value of $75,000,000. The liabilities usually remain at book value. For simplicity’s sake, the acquiring bank simply assumes the assets and liabilities of the failed thrift. The healthy bank records:
Dr) Assets (at current market value) $75,000,000
Dr) Goodwill (shortfall) $25,000,000
Cr) Liabilities (at book value) $100,000,000
After the assumption, the goodwill is amortized as an expense over a set period. Amortizing the goodwill over ten years increases expenses $2,500,000 per year; whereas, amortizing it over forty years only increases expenses $625,000 per year, a boost to earnings of $1,375,000 per year.
Since the FHLBB allowed goodwill to be included as an asset for regulatory capital purposes, amortizing it over a longer period of time increased regulatory capital, which was also favorable for the acquiring institution. Still, these steps were not enough. What followed were massive bank and S&L failures. Between 1980 and 1994, over 1,600 banks and 1,300 S&Ls were closed or received FDIC financial assistance. In retrospect, the government proved itself to be ill equipped to deal with the S&L crisis. The proponents of deregulation acknowledged that the laxer rules should have been accompanied by stricter supervision (Roberts and Cohen, 1990). The rate of bank examinations per billion dollars in assets dropped by 55% from 1980 – 1984 (Roberts and Cohen, 1990). The lack of effective audits of the S&Ls by public accounting firms and regulatory agencies spurred the crisis. Government regulators often ineptly oversaw the thrift industry and too often delayed intervention (Reinstein and Steih, 1995). Many institutions, which ultimately closed with big losses, were known as problem situations for more than a year (Reinstein and Steih, 1995). Losses could have been much less had regulators closed failing institutions sooner; but the regulators had adopted a policy of forbearance; that is, they postponed legal action hoping the situation would eventually cure itself. The FSLIC was penniless. Thus, insured depositors at insolvent institutions could not be repaid. The U.S. government and the taxpayers had to come to the rescue because of the sheer number and volume of losses. This was a clear example of systemic risk and allowing the industry to get “too big to fail.”
2.1. The Government’s Solution to the 1980s Crisis.
The U.S. Government’s solution to the 1980s crisis was twofold: taxpayer bailout and regulatory reform. A comprehensive study conducted by the U.S. Treasury resulted in two major acts: the Financial Institutions Reform, Recovery, and Enforcement Act of 1989 (aka, FIRREA) and the Federal Depository Insurance Corporation Improvement Act of 1991 (aka, FDICIA). The overall objective of these regulations was to resolve the current financial crisis with the ultimate goal of minimizing future taxpayer losses. The particular directives address five areas: 1) financial stability restoration, 2) regulatory structure reform, 3) regulatory supervision and enforcement powers, 4) consumer and investor protection, and 5) operations reform.
Journal of Business, Economics & Finance (2012), Vol.1 (1) Docking, 2012 ____________________________________________________________________________________________________
________________________________________________________________________
21
• Financial Stability Restoration
To restore economic stability, FIRREA established the Resolution Trust Company (RTC) to purchase the toxic assets of insolvent thrifts and banks and to dispose of them for whatever they were worth (FIRREA, 1989). FDICIA recapitalized the FDIC through government loans and higher FDIC insurance premiums (FDICIA, 1991). This act now requires a risk-based process for assessing FDIC insurance premiums and determining capital requirements; thus institutions holding riskier assets must pay higher insurance premiums and carry more capital (FDICIA, 1991). To enhance the safety and stability of the system, the FDIC increased insurance coverage from $0 to $100,000 for self-directed individual retirement accounts (FDICIA, 1991).
• Regulatory Structure Reform
FIRREA restructured the S&L industry by disbanding the FHLBB and replacing it with the Office of Thrift Supervision (OTS) (FIRREA, 1989). The FSLIC is renamed to the Savings Association Insurance Fund (SAIF) and moved under the auspices of the FDIC, which also controls the newly named Bank Insurance Fund (BIF) (FIRREA, 1989).
• Regulatory Supervision and Enforcement Powers
The scope of FDICIA, 1991 covered: 1) ceasing the regulatory practice of forbearance – in essence the “too big to fail” policy – by setting mandatory rules for regulators to take prompt corrective action at the hint of a bank problem, 2) allowing the Federal Reserve to step in earlier in the event of a bank failure, 3) requiring failed banks be closed using the least-cost method, and 4) requiring all federally insured depository institutions have an annual examination and follow stricter reporting requirements (FDICIA, 1991). To further augment the powers of the banking regulatory agencies, FIRREA allows regulators to restrict an institution's growth and activities, rescind contracts (including salary and employment), forcefully apply enforcement actions, and remove or prohibit certain personnel from engaging in banking activities on an industry-wide basis (FIRREA, 1989).
• Consumer and Investor Protection
Shoddy lending practices were curbed to protect consumers and investors. FIRREA established the Credit Standards Advisory Committee (CSAC) to review and monitor the credit standards and lending practices of insured depository institutions (FIRREA, 1989). Appraisers must now be licensed and State-certified. FIs that knowingly obtain appraisal services from a person who is neither licensed nor certified suffer severe civil penalties (FIRREA, 1989). FDICIA also established an Affordable Housing Program Office (AHPO) to aid qualifying families in home foreclosure circumstances by encouraging loan renewals and restructurings (FDICIA, 1991). More severe standards for extensions of credit secured by real estate or real estate construction projects were mandated (FDICIA, 1991).
Bank savings depositors are further protected by mandatory disclosures of interest rates, terms of account, and other information (FDICIA, 1991).
• Operations Reform
Additional reforms were directed at rectifying accounting, operational, and managerial shortfalls at banks. FIRREA toughened goodwill amortization from forty years to a mere five years (FIRREA, 1989). It also prohibited any financial institution not meeting minimum capital standards from increasing its deposit accounts through the services of a deposit broker (FIRREA, 1989). FIDICIA further caps, to reasonable levels, the interest rate paid on brokered deposits (FDICIA, 1991). Lastly, FIRREA directed the Federal Financial Institutions Examination Council (FFIEC) to develop and administer risk management training seminars for bank managers (FIRREA, 1989).
It took over $189 billion of taxpayer money to bail out failed S&Ls and recapitalized the FDIC insurance fund (FDIC Annual Report 2008). Because of the massive costs, the financial industry became more concerned about the “forbearance” and “too big to fail” issues. Banking regulators declined to close and liquidate large failing banks because they had no way to shut down a large institution with its numerous connections to other financial institutions without creating a financial panic (Cocheo, 1990). Therefore, the government established a special committee – the Deposit Insurance Reform Committee – to examine these issues and develop solutions (Cocheo, 1990). The government and the bankers agreed that “too big to fail” had to go because neither the country nor the industry could afford it (Cocheo, 1990). Although FDICIA 1991 was an attempt to eradicate these bad practices, the “too big to fail” norm did not cease. In fact, further deregulation allowed banks to grow ever larger and more complex.

Journal of Business, Economics & Finance (2012), Vol.1 (1) Docking, 2012 ____________________________________________________________________________________________________
________________________________________________________________________
22
3. CAUSES OF THE 2008 CRISIS
Elements of the 1980s crisis can be seen in today’s disarray in the automotive industry, residential and commercial real estate, and the declining stock market. The 2008 crisis had many causes. One chief cause was the earlier deregulation of the banking industry. This allowed for the development of ‘super-center banks’. A synopsis of these deregulating acts follows. The Community Reinvestment Act of 1977 (CRA) required financial institutions to meet the credit and deposit needs of the communities in which they were located, including low-income neighborhoods (CRA, 1977). Failure to receive a satisfactory CRA rating would restrict a bank’s merger, acquisition and branching activities. Many banks used the CRA as an excuse to make subprime loans, saying they were simply serving their communities. Yet, the CRA specifically stated that loans were to be made in accordance with safe and sound operations and for banks not to make high-risk loans that might bring losses to the bank. The Riegle-Neal Interstate Banking and Branching Efficiency Act of 1994 (Riegle-Neal) permitted adequately capitalized and managed bank holding companies (BHCs) to acquire out of state banks, thus allowing inter-state banking (Riegle-Neal, 1994). Now banks could have branches in all fifty states if they so desired.
The Glass-Stegall Act of 1933 had effectively separated commercial banking from investment banking and other securities and insurance activities (Banking Act of 1933). This was enacted as a consequence of the 1929 stock market crash and the ensuing 1930s depression. The Financial Services Modernization Act of 1999 (Gramm-Leach-Bliley Act aka, GLBA) effectively repealed the Glass-Stegall Act. GLBA allowed a financial behemoth to develop – the “financial holding company.” The new financial holding companies (FHCs) were allowed to engage in underwriting and selling insurance and securities, conducting both commercial and merchant banking, investing in and developing real estate and other "complimentary activities.” Super-center banks were created that became “too big to fail” because of all of their interrelated activities. Recall that a factor in the 1980s crisis was to increase FDIC insurance coverage for deposit accounts (DIDMCA, 1980). However counterintuitive this seems, the Federal Deposit Insurance Reform Act of 2005 (FDIRA) further raised insurance limits from $100,000 to $250,000 for self-managed retirement accounts (FDIRA, 2005). This act merged the Bank Insurance Fund (BIF) and Savings Association Insurance Fund (SAIF) into a single Deposit Insurance Fund (DIF) and empowered Federal Regulators to adjust, periodically, deposit insurance limits for inflation.
The 2008 subprime mortgage crisis began in 2003. Decreasing interest rates attracted homebuyers to the market stimulating a housing boom. This along with beliefs of ever-increasing housing prices turned this boom into an unsustainable bubble. Graph 1 (see Appendix) shows the trend in various mortgage interest rates from January 1986 through December 2010. Interest rates had dropped from the 7% to 9% range in 2000 to the 3% to 6% range in 2003, but then began rising in 2005. Graph 2 (see Appendix) shows the upward trend in home sales and home prices from 2000 to 2005. But then as mortgage interest rates began to rise in 2005, home sales and prices began to fall. Graph 2 (see Appendix) shows that, new and existing family home sales increased from 5.494 million units in 2000 to 7.460 million units by 2005, but then began declining. The median existing family home price was $146,008 in 2000, rose to a high of $221,883 in 2005, but then began declining. Many bankers and mortgage brokers, motivated by greed, participated in predatory lending. They enticed borrowers into securing mortgages that carried high fees and interest rates knowing the likelihood of foreclosure. Mortgage brokers who earned large commissions while bearing no risk were eager to make loans to people who had neither money nor sufficient income for paying back these loans. This desire for large commissions, even by making bad loans, was similar to the events of the 1980s.
Similarly, the bankers originating these loans laid off the risk by securitizing the loans and selling them to Wall Street investment banks. MBS issues increased over 373% from $583,339.72 million in 2000 to $2,764,288.11 million in 2003. These investment banks packaged them into mortgage-backed securities (MBSs) that they sold. Investors were only too eager to buy these AAA-rated securities backed by subprime mortgages. Unfortunately, the investors faced two unknown problems: 1) the credit ratings were inaccurate and 2) they were unaware of the types of mortgages collateralizing these securities. The mortgage qualification guidelines were relaxed in order to produce more mortgages and more MBSs. Lending standards all but disappeared. Lenders were offering more loans to higher-risk borrowers, making loans with a loan-to-value ratio of 100% or greater and accepting zero percent down loans (Kirchhoff and Keen, 2007). In 2005, 43% of first-time homebuyers purchased their homes with no-money-down loans, according to a study released by the National Association of Realtors (Kirchhoff and Keen, 2007). Normally, banks refused to finance home mortgages for people with poor credit history or no income. Now, proof of income was no longer needed; next, proof of employment was not required, and then proof of any assets owned became unnecessary. Mortgage underwriting standards declined precipitously owing to the use of automated underwriting systems that allowed loans to be made without appropriate review and documentation (Browning, 2007). Automated underwriting systems used by the now

Journal of Business, Economics & Finance (2012), Vol.1 (1) Docking, 2012 ____________________________________________________________________________________________________
________________________________________________________________________
23
defunct Countrywide Financial allowed them to double their monthly subprime loan approvals in 2004 (Ward, 2004; Browning, 2007). In 2007, 40% of all subprime loans resulted from automated underwriting (Browning, 2007).
Bankers also became very creative in the types of loans they offered: no-money down loans, interest-only loans, adjustable-rate mortgages (ARMs) with attractive teaser rates, and payment option loans. An estimated one-third of ARMs originated between 2004 and 2006 had ‘teaser’ rates below 4% (Arnold, 2007). Unrealistically low interest rates, effortless credit, combined with a conviction that home prices would continue to escalate, enticed many subprime borrowers to obtain these adjustable-rate mortgages. These rates increased significantly after some initial period, as much as doubling the monthly payment (Arnold, 2007). Borrowers who could not make the higher payments tried to refinance their mortgages. Unfortunately, refinancing became more difficult. The resulting housing market pressure was increasing even more as home prices had begun to decline. Table 1 (see Appendix) provides a conservative example of what happened to monthly payments when mortgage interest rates reset after the ARM lock-in period expired. Using a 2003 median home price of approximately $178,000, zero percent down, and a 30-year-3-1 ARM rate of 3.75% in June 2003, the monthly principal and interest payments are approximately $824. After 3 years, the borrower has two options: 1) allow the interest rate to reset to the 1-year ARM rate, or 2) refinance into a 30-year fixed rate mortgage (FRM). If the borrower allows the rates to reset to the 1-year ARM rate, monthly mortgage payments increase over 27%. Of course, the reset rate could have been higher or lower depending on the loan terms. The other choice for the borrower is to refinance into a 30-year FRM at 6.82%. Unknown to many subprime borrowers, prepayment penalties from 1% – 5% were buried in the original loan documents. Assuming a 3% prepayment penalty is rolled into the amount to be refinanced, monthly mortgage payments increase almost 37%.
Bankers and mortgage brokers are not the only ones to blame for the subprime fiasco. The public took advantage of these absurd lending scenarios. Mortgage fraud by borrowers also increased enormously. In 2006, as much as 70% of defaulting loans had fraudulent misrepresentations by the borrowers on their original loan applications (Cowen, 2008). Borrowers grossly overstated their incomes and falsified documents; while, the loan officers failed to insist on adequate documentation of income and collateral before approving the loans (Cowen, 2008). Easy credit and escalating house prices had also led to a building boom and eventually to a surplus of unsold new homes, which caused U.S. housing prices to peak in mid-2006 (Shiller, 2007). By September 2008, average U.S. housing prices had declined by over 20% from their mid-2006 peak (Shiller, 2007). Median home prices declined approximately 22% from 2006 to 2009. Consequently, this major decline in home prices left many borrowers with zero or negative equity in their homes, meaning their homes were now appraising at less than their mortgages. As of March 2008, an estimated 8.8 million borrowers — 10.8% of all homeowners — had negative equity in their homes (Andrews and Uchitelle, 2008). The stock market crash in October 2007, the ensuing recession, rising unemployment, falling house prices, and stricter credit standards were making it impossible for these borrowers to refinance out of the ARMs into a fixed-rate loan (Arnold, 2007). Consequently, many borrowers defaulted on their loans or simply walked away leaving the houses to the banks.
As foreclosures increased, the supply of homes for sale increased. Loan delinquencies in 2006 increased from 1.32% of total loans to 3.49% by 2010. Loan charge-offs in 2006 increased from 0.393% of total loans to 2.665% in 2010. This supply outstripping demand forced housing prices to decrease even further. Housing prices declined between 6.06% and 11.89% in 2009. MBSs backed with subprime mortgages lost most of their value. Accounting standards required that these MBSs be marked down to their current market value. The result was a significant decline in the regulatory capital of FIs, which held these MBSs in their investment portfolios. The 1980s scenario was being replayed. A continuing contributor from the 1980s was the further development of swaps to manage risk. Basically an insurance policy, the credit default swap (CDS) appeared on the scene. The buyer of a CDS makes regular premium payments to the seller, for coverage in the event of a loss on the debt instrument insured. Many institutions who owned subprime mortgaged-backed securities had purchased CDSs from American International Group, Inc. (AIG); thus guaranteeing that if the MBSs became worthless AIG would repay to them their lost principal. When so many MBSs became worthless, AIG did not have the cash or capital to make good on its insurance promises.
Another cause of the 2008 crisis, like the 1980s, was a failure of the various regulatory bodies (e.g., OTS, OCC, FDIC, Federal Reserve, SEC, etc.) to adequately police the industry. Regulators failed in three ways: 1) when deficiencies found at an institution were asked to be corrected by the institution, the regulators failed to follow up and make certain that those deficiencies were indeed corrected; 2) regulators failed to impose formal enforcement action as required by law; and 3) regulators relied too much on the institutions to track their own
Journal of Business, Economics & Finance (2012), Vol.1 (1) Docking, 2012 ____________________________________________________________________________________________________
________________________________________________________________________
24
corrective progress. A solution to the 1980s crisis was FDICIA of 1991, which required stricter capital ratios. Regulators, unfortunately, placed undue reliance on bank capital ratios, and failed to monitor other things. For example, several banks were “well capitalized” (like WAMU) in the call report the quarter before their closing (Sisk, 2009). The current financial crisis has highlighted the importance of strong, prompt oversight to help ensure the safety and soundness of financial institutions.
3.1. The Government’s Solution to the 2008 Crisis.
Like the U.S. Government’s solution to the 1980s crisis, its solution to the 2008 crisis was twofold: taxpayer bailout and regulatory reform. Two acts, the Emergency Economic Stabilization Act of 2008 (EESA) and the Dodd-Frank Wall Street Reform and Consumer Protection Act of 2010 (Dodd-Frank), were ratified with the express intentions of resolving the current financial crisis, protecting consumers, and minimizing future taxpayer losses. Many of the provisions in these two acts were the same as those in FIRREA and FDICIA. Once again, the particular directives can be categorized with regard to the same five intentions as before: 1) financial stability restoration 2) regulatory structure reform, 3) regulatory supervision and enforcement powers, 4) consumer and investor protection, and 5) operations reform. The major provisions of these acts are as follows:
• Financial Stability Restoration
To prevent a collapse of the entire financial system, Congress enacted measures similar to those enacted to deal with the 1980s crisis. First, Congress provided $700 billion to the Treasury Department’s Troubled Assets Relief Program (TARP) to purchase toxic credit securities and loans, such as subprime MBSs, from troubled financial institutions (EESA, 2008). EESA also authorizes the Secretary of the Treasury to deposit into the Treasury all revenues and proceeds from the sale of these troubled assets (EESA, 2008). TARP’s functions are similar to those of the RTC established in 1989 to deal with insolvent thrifts. EESA further allows the US Treasury to inject capital into banks to enhance lending. In exchange for loans or TARP money, the Treasury holds an interest in the bank in the form of dividend paying preferred stock, which can be included in the bank’s Tier 1 capital (EESA 2008). Additionally, the EESA temporarily increased FDIC insurance to $250,000. This increase became permanent with the Dodd-Frank Act of 2010. As has been seen many times before, this action was taken to allay depositors’ fears about the safety and soundness of the financial system.
• Regulatory Structure Reform
A solution to the 1980s crisis was a restructuring of the financial services industry. Another attempt is made at restructuring the industry in an attempt to resolve the current crisis and to prevent future ones. The elements of this restructuring proposed by EESA and Dodd-Frank follow:
• Establishes the Congressional Oversight Panel to review and report to Congress on the status of the financial markets and regulatory system (EESA, 2008).
• Establishes the Office of the Special Inspector General for TARP to conduct oversight of the purchase, management, and sale of assets by the Secretary, including the management of any program established under this Act (EESA, 2008).
• Restructures the bank and thrift industries by abolishing the OTS and transferring its powers to the Office of the Comptroller of the Currency (OCC) (Dodd-Frank, 2010).
• Creates the Federal Insurance Office to examine insurance-related operations of financial entities (Dodd-Frank, 2010).
• Creates the Financial Stability Oversight Council (FSOC) consisting of heads of all regulatory bodies and chaired by the Secretary of the Treasury. The FSOC’s purpose is to identify and respond to emerging financial system risks posed by large, complex companies and products before they can threaten the nation’s economic stability. It recommends to the Federal Reserve strict rules for capital, leverage, liquidity and risk management as companies grow in size and complexity. It also has the power to break up a company if that company threatens financial stability of the economy (Dodd-Frank, 2010).
• Creates Office of Financial Research to collect data and conduct research on: 1) system-wide systemic risk levels, 2) improvements in risk management techniques, 3) disruptions and failures in the financial markets, and 4) other matters requested by the FSOC (Dodd-Frank, 2010).
• Establishes the office of Credit Ratings at the SEC to oversee Nationally Recognized Statistical Ratings Organizations (NRSRO) such as Moody’s, Standards & Poor’s, etc. It requires NRSROs to disclose their
Journal of Business, Economics & Finance (2012), Vol.1 (1) Docking, 2012 ____________________________________________________________________________________________________
________________________________________________________________________
25
methodologies and ratings track record, and to be examined annually by the SEC. Ratings analysts must pass qualifying exams and maintain continuing education. NRSROs can be held liable for reckless ratings. The SEC can deregister a NRSRO if it provides bad ratings over time (Dodd-Frank, 2010).
• Regulatory Supervision and Enforcement Powers
Many of the provisions below are similar, if not the same, as those enacted by FIRREA and FDICIA. Regulators, once again, are being reminded to perform their duties and enforce current regulations as well as new ones. Dodd-Frank requires examiners to take prompt corrective action to resolve problems of FHCs and to liquidate those that threaten the financial stability of the economy (Dodd-Frank, 2010). The “too big to fail” policy is to be permanently laid to rest. Taxpayers will nevermore bail out failed companies. Failing financial companies are expected to be resolved through the bankruptcy process (Dodd-Frank, 2010). To discourage companies from getting too big or too complex, Dodd-Frank imposes tough capital and leverage requirements. For example, for FHCs that are not well-capitalized, regulators may restrict growth, impose higher capital standards, limit debt to equity ratios to 15:1, and restrict executive compensation among other constraints (Dodd-Frank, 2010).
The new legislation is an attempt to roll back the liberties of GLBA and Riegle-Neal. Large, complex financial companies must prepare dissolution plans or “funeral plans” for their rapid and orderly shutdown should the company go under (Dodd-Frank, 2010). Plans are to aid regulators in understanding the structure of the companies they oversee and serve as a roadmap for shutting them down if the company fails. Failure to submit acceptable funeral plans can result in higher capital requirements, restrictions on growth and activities, divestment, and monetary penalties (Dodd-Frank 2010). Recall that the Riegle-Neal Act of 1994 permitted both well and adequately capitalized and managed BHCs to expand via mergers and acquisitions. Now, Dodd-Frank only allows well capitalized and well managed BHCs to expand via mergers and acquisitions (Dodd-Frank, 2010).
• Consumer and Investor Protection
Shoddy lending practices are once again being curbed to protect consumers and investors. EESA establishes the Financial Stability Oversight Board (FSOB) to assist families in preserving home ownership, stabilizing financial markets, and protecting taxpayers (EESA, 2008). It further authorizes the Treasury Secretary to use loan guarantees and credit enhancements to facilitate loan modifications to prevent avoidable foreclosures (EESA, 2008).
Dodd-Frank establishes the independent Consumer Financial Protection Bureau (CFPB) to protect consumers from abusive credit practices. This new bureau makes and enforces laws intended to ensure the fair, equitable and nondiscriminatory access to credit. The bureau will oversee the new Office of Financial Literacy (OFL), which will develop educational programs for consumers (Dodd-Frank, 2010).
Lastly, Dodd-Frank mandates that issuers of MBSs and other asset-backed securities will not be able to shop around and pick the NRSRO agency they think will give them the highest rating. It requires issuers to disclose more information about the quality of the underlying assets and maintain an economic interest in that asset (Dodd-Frank, 2010). Likewise, banks must use independent third-party appraisers for certain government-insured loans.
• Operations Reform
Once again, there are additional reforms directed at rectifying accounting, operational, and managerial shortcomings. FIs receiving TARP monies are subject to limits on executive compensation during the period the U.S. Treasury holds an equity or debt position in them (EESA, 2008). EESA also suspended applying the Financial Accounting Standards Board Statement Number 157 (about fair value accounting) to financial and depository institutions. However, fair value accounting for all financial institutions was reinstated September 27, 2008.
Other safeguards include:
• Limiting a company’s trading in certain financial instruments, such as hedge funds and private equity funds, with its own money and for its own accounts; i.e. proprietary trading (Dodd-Frank, 2010).
• Requiring companies engaging in hedge funds, derivatives, and asset-backed securities, to have a vested interest or “skin in the game.” It requires them to retain at least 5% of the credit risk (Dodd-Frank, 2010).

Journal of Business, Economics & Finance (2012), Vol.1 (1) Docking, 2012 ____________________________________________________________________________________________________
________________________________________________________________________
26
• Bringing transparency and accountability to the derivatives markets by giving the SEC and Commodity Futures Trading Commission (CFTC) the authority to regulate all over-the-counter (OTC) derivatives, requiring that OTC derivatives be traded on an open exchange. Furthermore, parties in swap transactions must have adequate capital to meet future responsibilities (Dodd-Frank, 2010).
• Eliminating predatory lending practices. Lenders must ensure that borrowers have the means to repay loans. It also prohibits pre-payment penalties on loans and requires a worst case scenario disclosure on ARMs (Dodd-Frank, 2010).
• Giving shareholders a voice on executive compensation. Requires disclosures by SEC listed companies comparing executive compensation with stock performance over a five-year period (Dodd-Frank, 2010).
• Allowing interest to be paid on business checking accounts (Dodd-Frank, 2010).
4. CONCLUSION
In 2009, Bloomberg estimated the current bailout could potentially cost the U.S. taxpayers over $9.7 trillion (Pittman & Ivry, 2009). Once again the government has decided “too big to fail” must go. But will it?
Why did the government bailout some institutions and not others? In hindsight, allowing Lehman Brothers to fail was not a good idea because its failure led to the collapse of other institutions. Angela Knight, chief executive of the British Bankers’ Association concurs:
“. . . , if Lehman had not collapsed the shock to the global economy and the world financial system would possibly not have been as great as it was. The world financial system may not have suddenly come to a halt and the government interventions that had to follow may not have had to have been quite as big as they were. You have to remember that when Lehman Brothers collapsed, everything came to a complete halt. Financial markets stopped. If they had intervened there would have been the ability to handle the issues that were created by Lehman Brothers over a longer period of time. The subsequent crisis might not have been as bad and the losses as a result of it might not have been so great.”
George Magnus, senior economic adviser for USB believes: “The only question surrounding the failure of Lehman’s a year ago is how, not whether, it should have been allowed to fail. Because we know that its failure precipitated the closest thing to a systemic banking collapse any of us have seen, it is clear that the authorities got their decision badly wrong.” The government was unaware of the many microscopic linkages between various financial companies. Because of deregulation, FHCs had become so big and so inter-related that once one failed, they all started to crumble – the contagion effect of systemic risk. Under our current system, letting banks fail, as opposed to seizing and restructuring them – is a bad idea for the same reason that it is a bad idea to stand aside while office buildings in the City of Chicago burn in a fire. In both cases, the damage has a tendency to spread. In the 1930s, the U.S. government stood aside as banks failed; the result was the Great Depression. In the 1980s, regulators did not step in soon enough and over 2,800 banks/thrifts failed at a tremendous cost to the taxpayers. In 2008, the U.S. government stood aside as Lehman Brothers imploded. Within days, credit markets had frozen and the stock market plunged into an abyss. Once again legislation has been passed to prevent a future crisis reoccurrence. The Dodd-Frank Wall Street Reform and Consumer Protection Act of 2010 reiterated and refreshed needed action such as, putting an end to the “too big to fail” policy, protecting consumers against unethical lending practices, and enforcing regulations. Other items in this bill are new. Overall, the government is trying to get back to the basics of protecting consumers and investors. Will we get it right this time? Let us hope so. The question remains: have we learned anything from our financial mistakes or will we be doomed to repeat them? Only time will tell. In this particular case, history shows us that the U.S. has not learned from their mistakes. The government tends to be more reactive than proactive.

Journal of Business, Economics & Finance (2012), Vol.1 (1) Docking, 2012 ____________________________________________________________________________________________________
________________________________________________________________________
27
REFERENCES
Andrews, E.L. & L. Uchitelle. 2008. Rescues Weighed as Homeowners Wallow in Debt. The New York Times February 22:A1.
Arnold, C. 2007. Economists Brace for Worsening Subprime Crisis. National Public Radio August 7. Retrieved from http://www.npr.org/templates/story/story.php?storyId=12561184
Auerbach, A.J. & J. Slemrod. 1997. The Economic Effects of the Tax Reform Act of 1986. Journal of Economic
Literature 35(2):589-632.
Banking Act of 1933 (aka, Glass-Steagall Act of 1933). H.R.5661. (1933) (enacted Public Law No.:. 73-66). Retrieved from http://www.archive.org/details/FullTextTheGlass-steagallActA.k.a.TheBankingActOf1933
Bennett, R.A. 1985. Putting the Homestead Deeper into Hock. The New York Times November 24:3:1.
Berg, E.N. 1986. Fed is Wary on New Bank Products. The New York Times May 12:D7.
Bleakley, F.R. 1985. Rate Swaps Draw Concern. The New York Times February 7:D1.
Bleakley, F.R. 1985. Hot New Game in Financing. The New York Times June 4:D1.
Bleakley, F.R. 1985. Goldman’s Rise in Real Estate. The New York Times June 17:D1.
Brooks, A. 1982. Foreclosing on a Dream. The New York Times September 12:6:68.
Browning, L. 2007. The Subprime Loan Machine. The New York Times March 23:C1.
Cocheo, S. 1990. The fall of “too big to fail.” ABA Banking Journal May 82: 29 – 32.
Community Reinvestment Act of 1977. H.R. 6655. (1977) (enacted Public Law No.: 95-128) available at http://thomas.loc.gov/cgi-bin/bdquery/z?d095:HR06655:@@@D&summ2=m&.
Cowen, T. 2008. So We Thought. But Then Again. The New York Times January 13:BU6.
Depository Institutions Act of 1982. H.R.6267. (1982) (enacted Public Law No.: 97-320). Retrieved from http://thomas.loc.gov/cgi-bin/bdquery/D?d097:457:./temp/~bdQxou::|/home/LegislativeData.php?n=BSS;c=97
Depository Institutions Deregulation Monetary Control Act of 1980. H.R.4986. (1980) (enacted Public Law No.: 96-221). Retrieved from http://www.bos.frb.org/about/pubs/deposito.pdf and http://thomas.loc.gov/cgi-bin/bdquery/z?d096:HR04986:|TOM:/bss/d096query.html|
Dodd-Frank Wall Street Reform and Consumer Protection Act of 2010. H.R.4173. (2010) (enacted Public Law No.: 111-203). Retrieved from http://thomas.loc.gov/cgi-bin/bdquery/z?d111:H.R.4173:
Emergency Economic Stabilization Act of 2008. H.R.1424. (2008) (enacted Public Law No.: 110-343). Retrieved from http://thomas.loc.gov/cgi-bin/bdquery/z?d110:H.R.1424:
“Evaluation of Federal Regulatory Oversight of Washington Mutual Bank,” by Offices of Inspector General: Department of the Treasury and Federal Deposit Insurance Corporation, Report No. EVAL-10-002, April 2010. http://www.fdicoig.gov/reports10/10-002EV.pdf
Federal Deposit Insurance Corporation. 2008. FDIC 2008 Annual Report. Retrieved from http://www.fdic.gov/about/strategic/report/2008annualreport/75years_5.html
Federal Deposit Insurance Reform Act of 2005. Retrieved from http://www.govtrack.us/congress/bill.xpd?bill=h109-1185&tab=summary
Federal Depository Insurance Corporation Improvement Act of 1991. S.543. (1991) (enacted Public Law No.: 102-242). Retrieved from http://thomas.loc.gov/cgi-bin/bdquery/z?d102:s.00543:
Financial Institutions Reform, Recovery, and Enforcement Act of 1989. H.R.1278. (1989) (enacted Public Law No.: 101-73). Retrieved from http://thomas.loc.gov/cgi-bin/bdquery/z?d101:H.R.1278:
Financial Services Modernization Act of 1999 (aka, Gramm-Leach-Bliley Act of 1999). S.900. (1999) (enacted Public Law No.: 106-102). Retrieved from http://thomas.loc.gov/cgi-bin/bdquery/z?d106:SN00900:
Garcia, Gillian, Baer, Herbert, Brewer, Elijah, D.R. Allardice, T.F. Cargill, J. Dobra, . . . L.R. Mote. 1983. The Garn-St.Germain Depository Institutions Act of 1982. Economic Perspectives 7:3-31.
History of the Eighties – Lessons for the Future, Volume I: An Examination of the Banking Crises of the 1980s and Early 1990s, Chapter 4: The Savings and Loan Crisis and Its Relationship to Banking 1997:166-188, published by FDIC, Division of Research and Statistics, Washington D.C., 1997. Retrieved from http://www.fdic.gov/bank/historical/history/

Journal of Business, Economics & Finance (2012), Vol.1 (1) Docking, 2012 ____________________________________________________________________________________________________
________________________________________________________________________
28
Kilborn, P.T. 1985. Delinquent Mortgages Set Record in Quarter. The New York Times June 25:D1,D17.
Kirchhoff, S. and J. Keen. 2007. In 2005, Half of Minorities Purchased Their Homes with Subprime Loans; Today, Delinquency Rates are Soaring in Minority Neighborhoods. USA Today April 26:1B.
O’Brien, T.L. 1999. Risk Takers' Safety Net The New York Times May 1:B11.
Office of Thrift Supervision. 2010. Office of Thrift Supervision 2009 Fact Book: A Statistical Profile of the Thrift Industry. Office of Thrift Supervision, Washington D.C. Retrieved from www.ots.treas.gov/-files/481165.pdf
Pittman, M. and B. Ivry. 2009. U.S. Taxpayers Risk $9.7 Trillion on Bailout Programs. Bloomberg February 9. Retrieved from http://www.bloomberg.com/apps/news?pid=washingtonstory&sid=aGq2B3XeGKok
‘Predatory lending’ available at http://www.hud.gov/offices/hsg/sfh/pred/predlend.cfm.
Reinstein, A. and P.W. Steih. 1995. Implications of the Savings and Loan Debacle: Lessons for the Banking Industry. Review of Business 17(1):16-21.
Riegle-Neal Interstate Banking and Branching Efficiency Act of 1994. H.R.3841. (1994) (enacted Public Law No.: 103-328). Retrieved from http://thomas.loc.gov/cgi-bin/bdquery/z?d103:h.r.03841:
Roberts, S.V. and G. Cohen. 1990. Villains of the S&L Crisis. U.S. News & World Report October 1:109(13):53-57.
Savings Lehman’s: A good idea? The Independent September 15, 2009. Retrieved from http://www.independent.co.uk/news/business/analysis-and-features/saving-lehmans-a-good-idea-1787432.html.
Seidman, L.W. 1997. History of the Eighties – Lessons for the Future, Volume II: Symposium Proceedings, January 16, 1997, Panel 3: Lessons of the 1980s: What Does the Evidence Show?, 55-64, published by FDIC, Division of Research and Statistics, Washington D.C., 1997. Retrieved from http://www.fdic.gov/bank/historical/history/
Shiller, R.J. 2007. Historic Turning Points in Real Estate. Cowles Foundation Discussion Paper No. 1610, Cowles Foundation for Research in Economics at Yale University June:1-28. Retrieved from http://cowles.econ.yale.edu/
Sisk, M. 2009. Lessons From the S&L Bailout. U.S. Banker January 11:9(1):15.
Sloane, L. 1985. New Securities Tied to Assets. The New York Times July 20:1:32.
Ward, J. 2004. Countrywide Extends Its Automated Underwriting System. Bank Systems and Technology June 4:1(6):46.

Journal of Business, Economics & Finance (2012), Vol.1 (1) Docking, 2012 ____________________________________________________________________________________________________
________________________________________________________________________
29
Appendix of Tables and Graphs
Sources of Tables and Graphs may be found at the end of this Appendix.
Initial Loan Reset Option 1 Reset Option 2
30-year-3-1-ARM
at June 2003
30-year-1-ARM
at June 2006
30-year-FRM
at June 2006
Median home price (see Graph 2) $178,000
Down payment $0
Loan balance $178,000 $167,802 $172,836 **
Prepayment penalty 3% n/a n/a $5,034 *
Future value $0 $0 $0
Number of years 30 27 30
Annual interest rate (see Graph 1) 3.75% 6.06% 6.82%
Monthly payment $824.35 $1,053.35 $1,129.06
$ change in payment $229.01 $304.72
% change in payment 27.78% 36.96%
Sources for Tables and Graphs:
Graph 1: Graph is created from data found at various websites. Mortgage interest rates may be found at http://www.hsh.com/mortgage_rate_trends/National/ and http://www.federalreserve.gov/releases/H15/data.htm. Inflation rates may be found at http://www.usinflationcalculator.com/inflation/historical-inflation-rates/ . Note that not all rates available for all years.
Graph 2: Graph is created from data provided by K. Fears at realtors.org; and data found at the U.S. Census Bureau, "New Residential Construction" found at http://www.census.gov/compendia/statab/hist_stats.html. Not all data available for all years.
Journal of Business, Economics & Finance (2012), Vol.1 (1) Arslanturk & Atan, 2012
____________________________________________________________________________________________________
________________________________________________________________________
30
DYNAMIC RELATION BETWEEN ECONOMIC GROWTH, FOREIGN EXCHANGE AND TOURISM
INCOMES:
AN ECONOMETRIC PERSPECTIVE ON TURKEY
Yalçın Arslantürk1 and Sibel Atan2
1Department of Tourism Guidance, Faculty of Tourism, Gazi University, Turkey, [email protected]
2Department of Econometrics, Faculty of Economics and Administrative Sciences, Gazi University, Turkey, [email protected]
KEYWORDS
Tourism incomes, foreign exchange, growth, Granger causality, Vector Auto Regressive (VAR) Models
ABSTRACT
The growth trends in the tourism of Turkey have gained impetus since the early 1980s. Since then, tourism has held its indispensable position among the drives of economic growth and governments have introduced incentives to increase tourism receipts. The main objective of this study is to find out the relation among growth, foreign exchange and tourism receipts. To serve this purpose, we use data set of 1987 and 2009 period then using cointegration and Granger causality, The Granger causality results show that there is a causal relationship running from tourism incomes to economic growth, which supports the premise that tourism benefits economic growth.
1. INTRODUCTION
There is no doubt that tourism especially international tourism movements have managed to become one of the most important sectors of all. International tourism movements hold its righteous place in that they fix balance of payments, provide the necessary financial tools for the technological equipment used in the manufacturing process, increasing the employment and leading to economic growth. The tourism movements began to gain momentum in the 1980s in parallel to the world tourism movements. Following the 1980s, tourism was regarded as a propelling force for economic growth and hence economic resources were allocated to tourism in order to boost economic growth. Nowadays, for Turkey, as a result of the investments following the 1980s in tourism sector, it is an undeniable fact that tourism is one of the foremost sectors in Turkey. The objective of this paper is to measure the impact of tourism in economic growth and foreign exchange regimes to be implemented in order to sustain and further growth and to see whether the policies designed to support tourism are effective. The changes over the foreign exchange rates have considerable effect on economic growth. In order to serve this purpose, using the data period of 1987-2009, this paper sets out to investigate impact of tourism receipts and foreign exchange rate on the Gross National Domestic Product (hereafter referred to as GDP).
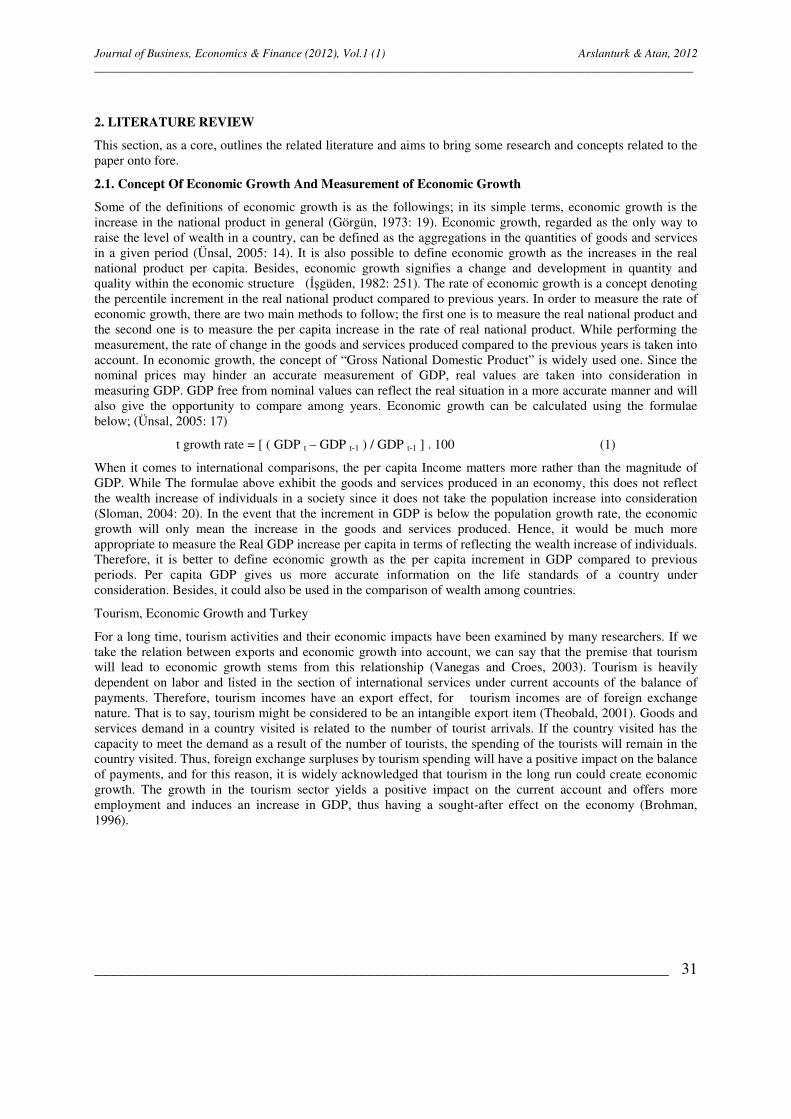
Journal of Business, Economics & Finance (2012), Vol.1 (1) Arslanturk & Atan, 2012
____________________________________________________________________________________________________
________________________________________________________________________
31
2. LITERATURE REVIEW
This section, as a core, outlines the related literature and aims to bring some research and concepts related to the paper onto fore.
2.1. Concept Of Economic Growth And Measurement of Economic Growth
Some of the definitions of economic growth is as the followings; in its simple terms, economic growth is the increase in the national product in general (Görgün, 1973: 19). Economic growth, regarded as the only way to raise the level of wealth in a country, can be defined as the aggregations in the quantities of goods and services in a given period (Ünsal, 2005: 14). It is also possible to define economic growth as the increases in the real national product per capita. Besides, economic growth signifies a change and development in quantity and quality within the economic structure (İşgüden, 1982: 251). The rate of economic growth is a concept denoting the percentile increment in the real national product compared to previous years. In order to measure the rate of economic growth, there are two main methods to follow; the first one is to measure the real national product and the second one is to measure the per capita increase in the rate of real national product. While performing the measurement, the rate of change in the goods and services produced compared to the previous years is taken into account. In economic growth, the concept of “Gross National Domestic Product” is widely used one. Since the nominal prices may hinder an accurate measurement of GDP, real values are taken into consideration in measuring GDP. GDP free from nominal values can reflect the real situation in a more accurate manner and will also give the opportunity to compare among years. Economic growth can be calculated using the formulae below; (Ünsal, 2005: 17)
t growth rate = [ ( GDP t – GDP t-1 ) / GDP t-1 ] . 100 (1)
When it comes to international comparisons, the per capita Income matters more rather than the magnitude of GDP. While The formulae above exhibit the goods and services produced in an economy, this does not reflect the wealth increase of individuals in a society since it does not take the population increase into consideration (Sloman, 2004: 20). In the event that the increment in GDP is below the population growth rate, the economic growth will only mean the increase in the goods and services produced. Hence, it would be much more appropriate to measure the Real GDP increase per capita in terms of reflecting the wealth increase of individuals. Therefore, it is better to define economic growth as the per capita increment in GDP compared to previous periods. Per capita GDP gives us more accurate information on the life standards of a country under consideration. Besides, it could also be used in the comparison of wealth among countries.
Tourism, Economic Growth and Turkey
For a long time, tourism activities and their economic impacts have been examined by many researchers. If we take the relation between exports and economic growth into account, we can say that the premise that tourism will lead to economic growth stems from this relationship (Vanegas and Croes, 2003). Tourism is heavily dependent on labor and listed in the section of international services under current accounts of the balance of payments. Therefore, tourism incomes have an export effect, for tourism incomes are of foreign exchange nature. That is to say, tourism might be considered to be an intangible export item (Theobald, 2001). Goods and services demand in a country visited is related to the number of tourist arrivals. If the country visited has the capacity to meet the demand as a result of the number of tourists, the spending of the tourists will remain in the country visited. Thus, foreign exchange surpluses by tourism spending will have a positive impact on the balance of payments, and for this reason, it is widely acknowledged that tourism in the long run could create economic growth. The growth in the tourism sector yields a positive impact on the current account and offers more employment and induces an increase in GDP, thus having a sought-after effect on the economy (Brohman, 1996).
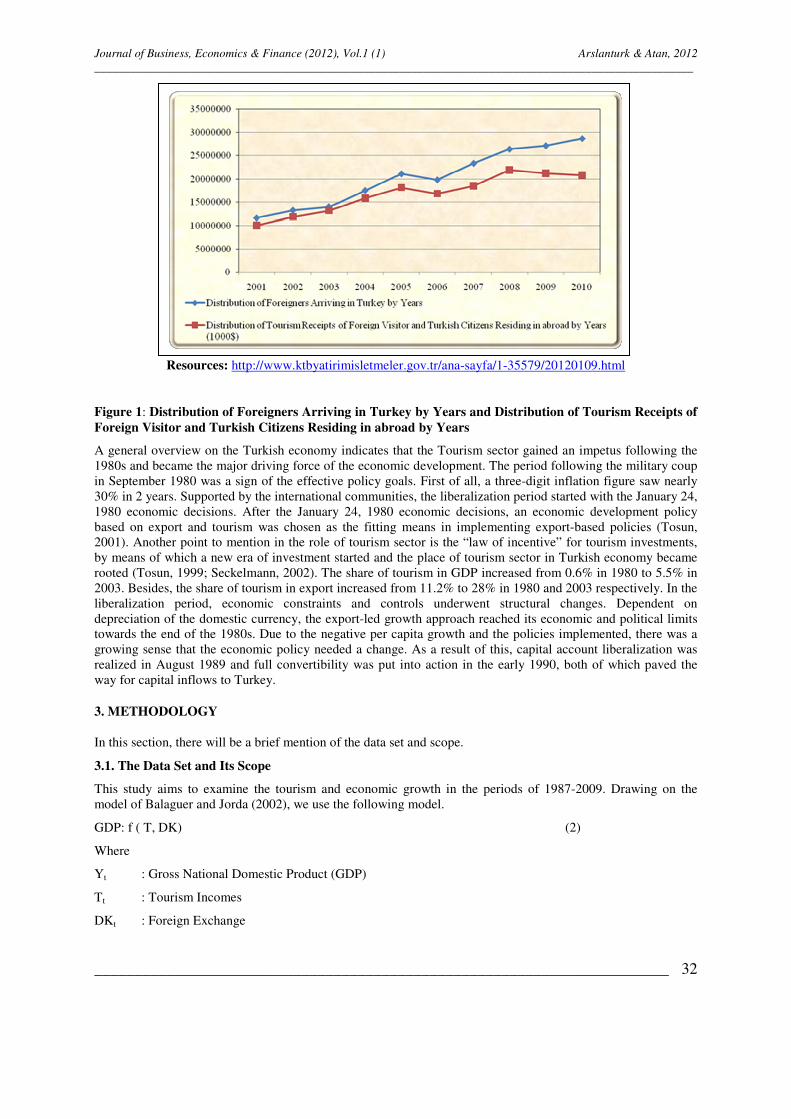
Journal of Business, Economics & Finance (2012), Vol.1 (1) Arslanturk & Atan, 2012
____________________________________________________________________________________________________
________________________________________________________________________
32
Resources: http://www.ktbyatirimisletmeler.gov.tr/ana-sayfa/1-35579/20120109.html
Figure 1: Distribution of Foreigners Arriving in Turkey by Years and Distribution of Tourism Receipts of
Foreign Visitor and Turkish Citizens Residing in abroad by Years
A general overview on the Turkish economy indicates that the Tourism sector gained an impetus following the 1980s and became the major driving force of the economic development. The period following the military coup in September 1980 was a sign of the effective policy goals. First of all, a three-digit inflation figure saw nearly 30% in 2 years. Supported by the international communities, the liberalization period started with the January 24, 1980 economic decisions. After the January 24, 1980 economic decisions, an economic development policy based on export and tourism was chosen as the fitting means in implementing export-based policies (Tosun, 2001). Another point to mention in the role of tourism sector is the “law of incentive” for tourism investments, by means of which a new era of investment started and the place of tourism sector in Turkish economy became rooted (Tosun, 1999; Seckelmann, 2002). The share of tourism in GDP increased from 0.6% in 1980 to 5.5% in 2003. Besides, the share of tourism in export increased from 11.2% to 28% in 1980 and 2003 respectively. In the liberalization period, economic constraints and controls underwent structural changes. Dependent on depreciation of the domestic currency, the export-led growth approach reached its economic and political limits towards the end of the 1980s. Due to the negative per capita growth and the policies implemented, there was a growing sense that the economic policy needed a change. As a result of this, capital account liberalization was realized in August 1989 and full convertibility was put into action in the early 1990, both of which paved the way for capital inflows to Turkey.
3. METHODOLOGY
In this section, there will be a brief mention of the data set and scope.
3.1. The Data Set and Its Scope
This study aims to examine the tourism and economic growth in the periods of 1987-2009. Drawing on the model of Balaguer and Jorda (2002), we use the following model.
GDP: f ( T, DK) (2)
Where
Yt : Gross National Domestic Product (GDP)
Tt : Tourism Incomes
DKt : Foreign Exchange

Journal of Business, Economics & Finance (2012), Vol.1 (1) Arslanturk & Atan, 2012
____________________________________________________________________________________________________
________________________________________________________________________
33
(3)
In this paper, we use the data set covering 1987 – 2009, for the dependent and independent variables. The data set was obtained from Turkish Statistical Institute and Association of Turkish Travel Agencies. In econometric analyses, E-views 7.0 software was employed. Used as the dependent variable, GDP was obtained through expenditure method and measured in current prices. Tourism incomes, independent variable, were measured in Turkish lira. As for foreign exchange, the Turkish lira value of the USA dollar was used. To start with, we use the logarithm of the variables in the model set and they are linearized.
logGDP = + logT + logDK + t (4)
4. RESULTS
The most important point to consider in studies in which time series are used is to turn non-stationary series into stationary series. Otherwise, the relations between the variables could yield spurious results. Hence, the stationary test should be conducted in the first place. The stationary of the variables are examined through ADF test and the results are reported in Table 1. For ADF equation, the fitting lag length is maximum 3 lags, selected with SC (Schwarz Criterion) criterion.
Table 1: ADF Test Results for the Variable
Variable Model Lag
Length
ADF
Statistics
Critical
Value
LOGGDP A 3 -4.149484* -3.644963
LOGT B 0 -3.366527* -3.004861
LOGDK A 0 -6.298447* -3.658446
A: ADF model with no deterministic component B: ADF model with a constant
C: ADF model with both a constant and trend
* Stationary at 5% significance level
When the results in Table 1 are examined, all the variables considered are stationary I (0). Hence, the estimate results of the model described in the 4th equation is given in Table 2.
Table 2: OLS Estimate Results of the Model
Variable Coefficient Std.
Error
t
Statistic Prob.
C 63447.98 2472.687 25.65953 0.0000
LOGT 2.177842 0.656451 3.317602 0.0034
LOGDK -6073.360 8700.774 -0.698025 0.4932
R2 = 0.782786 F-statistic = 36.03761 Prob (F-statistic) = 0.000000
As seen in Table 2, tourism incomes increase GDP. In other words, increases in tourism income contribute to economic growth in a positive manner. When it comes to foreign exchange, it affects GDP in a negative manner. In order to examine the causality between the variables, a Granger-causality test was applied. To start with, the lag length of the VAR model should be known. Table 3 reports the lag length of the VAR.
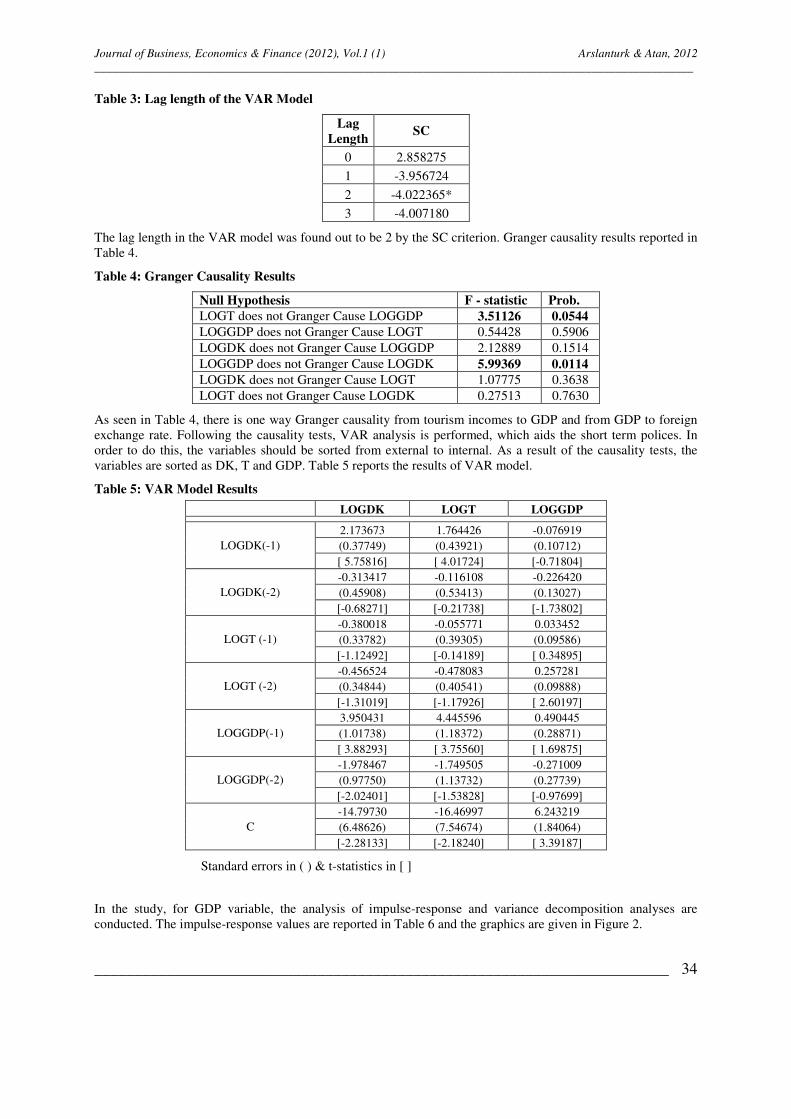
Journal of Business, Economics & Finance (2012), Vol.1 (1) Arslanturk & Atan, 2012
____________________________________________________________________________________________________
________________________________________________________________________
34
Table 3: Lag length of the VAR Model
Lag
Length SC
0 2.858275
1 -3.956724
2 -4.022365*
3 -4.007180
The lag length in the VAR model was found out to be 2 by the SC criterion. Granger causality results reported in Table 4.
Table 4: Granger Causality Results
Null Hypothesis F - statistic Prob.
LOGT does not Granger Cause LOGGDP 3.51126 0.0544
LOGGDP does not Granger Cause LOGT 0.54428 0.5906 LOGDK does not Granger Cause LOGGDP 2.12889 0.1514
LOGGDP does not Granger Cause LOGDK 5.99369 0.0114
LOGDK does not Granger Cause LOGT 1.07775 0.3638
LOGT does not Granger Cause LOGDK 0.27513 0.7630
As seen in Table 4, there is one way Granger causality from tourism incomes to GDP and from GDP to foreign exchange rate. Following the causality tests, VAR analysis is performed, which aids the short term polices. In order to do this, the variables should be sorted from external to internal. As a result of the causality tests, the variables are sorted as DK, T and GDP. Table 5 reports the results of VAR model.
Table 5: VAR Model Results
LOGDK LOGT LOGGDP
LOGDK(-1) 2.173673 1.764426 -0.076919 (0.37749) (0.43921) (0.10712) [ 5.75816] [ 4.01724] [-0.71804]
LOGDK(-2) -0.313417 -0.116108 -0.226420 (0.45908) (0.53413) (0.13027) [-0.68271] [-0.21738] [-1.73802]
LOGT (-1) -0.380018 -0.055771 0.033452 (0.33782) (0.39305) (0.09586) [-1.12492] [-0.14189] [ 0.34895]
LOGT (-2) -0.456524 -0.478083 0.257281 (0.34844) (0.40541) (0.09888) [-1.31019] [-1.17926] [ 2.60197]
LOGGDP(-1) 3.950431 4.445596 0.490445 (1.01738) (1.18372) (0.28871) [ 3.88293] [ 3.75560] [ 1.69875]
LOGGDP(-2) -1.978467 -1.749505 -0.271009 (0.97750) (1.13732) (0.27739) [-2.02401] [-1.53828] [-0.97699]
C -14.79730 -16.46997 6.243219 (6.48626) (7.54674) (1.84064) [-2.28133] [-2.18240] [ 3.39187]
Standard errors in ( ) & t-statistics in [ ]
In the study, for GDP variable, the analysis of impulse-response and variance decomposition analyses are conducted. The impulse-response values are reported in Table 6 and the graphics are given in Figure 2.
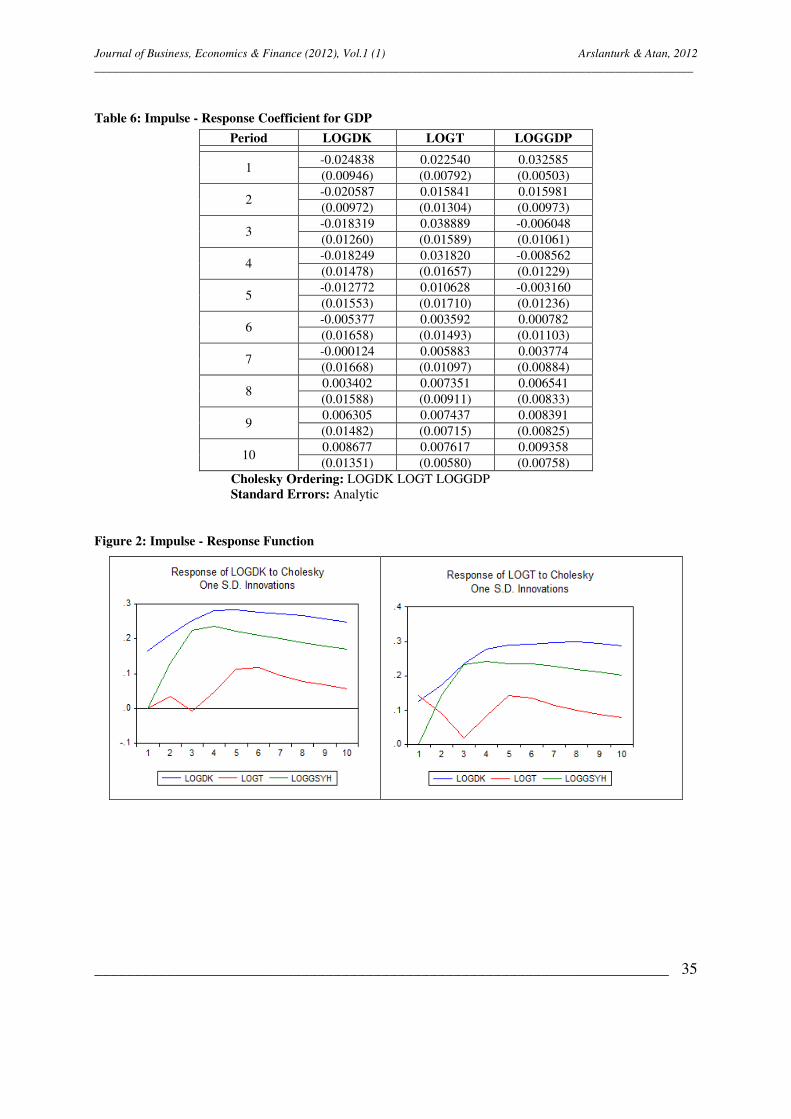
Journal of Business, Economics & Finance (2012), Vol.1 (1) Arslanturk & Atan, 2012
____________________________________________________________________________________________________
________________________________________________________________________
35
Table 6: Impulse - Response Coefficient for GDP
Period LOGDK LOGT LOGGDP
1 -0.024838 0.022540 0.032585 (0.00946) (0.00792) (0.00503)
2 -0.020587 0.015841 0.015981 (0.00972) (0.01304) (0.00973)
3 -0.018319 0.038889 -0.006048 (0.01260) (0.01589) (0.01061)
4 -0.018249 0.031820 -0.008562 (0.01478) (0.01657) (0.01229)
5 -0.012772 0.010628 -0.003160 (0.01553) (0.01710) (0.01236)
6 -0.005377 0.003592 0.000782 (0.01658) (0.01493) (0.01103)
7 -0.000124 0.005883 0.003774 (0.01668) (0.01097) (0.00884)
8 0.003402 0.007351 0.006541 (0.01588) (0.00911) (0.00833)
9 0.006305 0.007437 0.008391 (0.01482) (0.00715) (0.00825)
10 0.008677 0.007617 0.009358 (0.01351) (0.00580) (0.00758)
Cholesky Ordering: LOGDK LOGT LOGGDP Standard Errors: Analytic
Figure 2: Impulse - Response Function
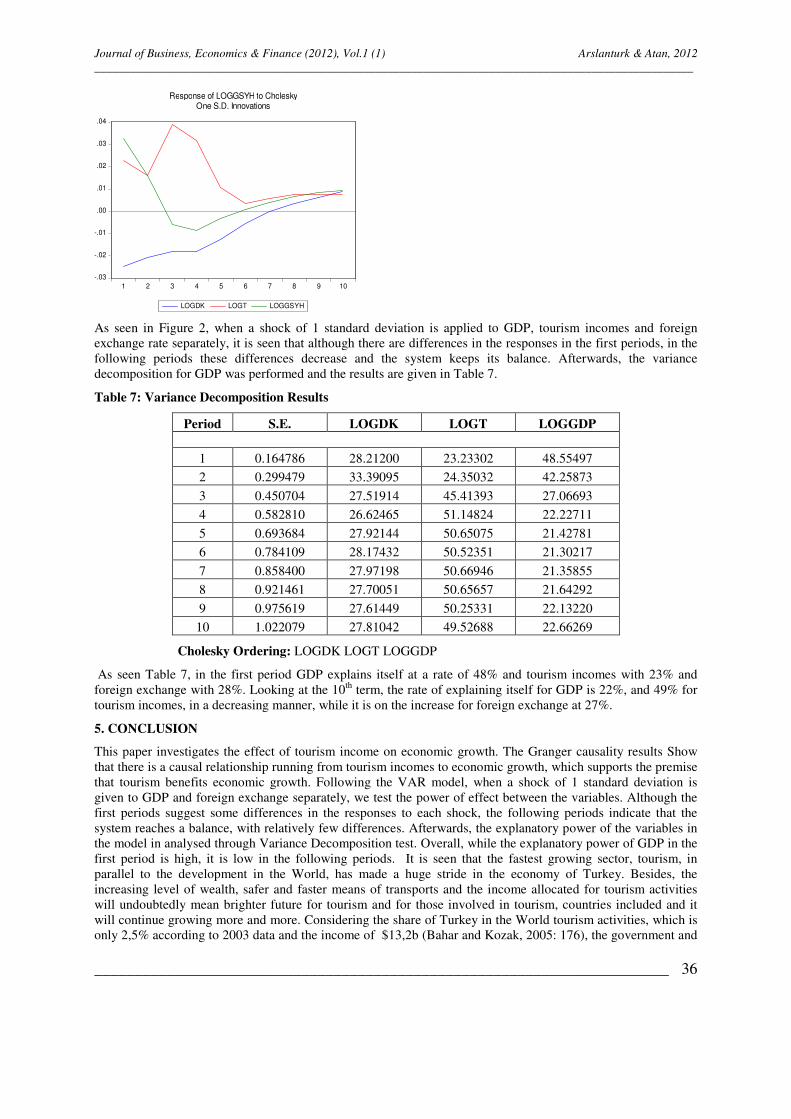
Journal of Business, Economics & Finance (2012), Vol.1 (1) Arslanturk & Atan, 2012
____________________________________________________________________________________________________
________________________________________________________________________
36
-.03
-.02
-.01
.00
.01
.02
.03
.04
1 2 3 4 5 6 7 8 9 10
LOGDK LOGT LOGGSYH
Response of LOGGSYH to CholeskyOne S.D. Innovations
As seen in Figure 2, when a shock of 1 standard deviation is applied to GDP, tourism incomes and foreign exchange rate separately, it is seen that although there are differences in the responses in the first periods, in the following periods these differences decrease and the system keeps its balance. Afterwards, the variance decomposition for GDP was performed and the results are given in Table 7.
Table 7: Variance Decomposition Results
Period S.E. LOGDK LOGT LOGGDP
1 0.164786 28.21200 23.23302 48.55497
2 0.299479 33.39095 24.35032 42.25873
3 0.450704 27.51914 45.41393 27.06693
4 0.582810 26.62465 51.14824 22.22711
5 0.693684 27.92144 50.65075 21.42781
6 0.784109 28.17432 50.52351 21.30217
7 0.858400 27.97198 50.66946 21.35855
8 0.921461 27.70051 50.65657 21.64292
9 0.975619 27.61449 50.25331 22.13220
10 1.022079 27.81042 49.52688 22.66269
Cholesky Ordering: LOGDK LOGT LOGGDP
As seen Table 7, in the first period GDP explains itself at a rate of 48% and tourism incomes with 23% and foreign exchange with 28%. Looking at the 10th term, the rate of explaining itself for GDP is 22%, and 49% for tourism incomes, in a decreasing manner, while it is on the increase for foreign exchange at 27%.
5. CONCLUSION
This paper investigates the effect of tourism income on economic growth. The Granger causality results Show that there is a causal relationship running from tourism incomes to economic growth, which supports the premise that tourism benefits economic growth. Following the VAR model, when a shock of 1 standard deviation is given to GDP and foreign exchange separately, we test the power of effect between the variables. Although the first periods suggest some differences in the responses to each shock, the following periods indicate that the system reaches a balance, with relatively few differences. Afterwards, the explanatory power of the variables in the model in analysed through Variance Decomposition test. Overall, while the explanatory power of GDP in the first period is high, it is low in the following periods. It is seen that the fastest growing sector, tourism, in parallel to the development in the World, has made a huge stride in the economy of Turkey. Besides, the increasing level of wealth, safer and faster means of transports and the income allocated for tourism activities will undoubtedly mean brighter future for tourism and for those involved in tourism, countries included and it will continue growing more and more. Considering the share of Turkey in the World tourism activities, which is only 2,5% according to 2003 data and the income of $13,2b (Bahar and Kozak, 2005: 176), the government and

Journal of Business, Economics & Finance (2012), Vol.1 (1) Arslanturk & Atan, 2012
____________________________________________________________________________________________________
________________________________________________________________________
37
the forerunners in tourism sector should do more than their bits in order to get the bigger share Turkey deserves, hence increasing the economic growth and the wealth of the country.
REFERENCES
Bahar, O. and Kozak, M. ( 2005). Turizm Ekonomisi, Ankara, Detay Yayınevi
Balaguer, L., Cantavella-Jorda, M., (2002), Tourism as a Long-run Economic Growth Factor: the Spanish Case, Applied Economics, 34, pp:877 – 884.
Brohman, J., 1996. New directions in tourism for Third World Development. Annals of Tourism Research 23, 48–70.
Görgün S. (1973). Maliye Politikası, 1. Basım, İstanbul: Çağlayan Basımevi.
İşgüden, T. (1982), Makro İktisat, 2. Basım, İstanbul: Bilim Teknik Yayınevi.
Seckelmann, A., (2002). Domestic tourism — a chance for regional development in Turkey? Tourism Management 23, 85–92.
Sloman, J. (2004), Makro İktisat, Ahmet ÇAKMAK (Translated), 1. Basım, İstanbul: Bilim Teknik Yayınevi.
Theobald, W.F.,( 2001). Global Tourism, Second Ed. Butterworth & Heinemann, Oxford.
Tosun, C., 1999. An analysis of the economic contribution of inbound international tourism in Turkey. Tourism Economics 5, 217–250.
Tosun, C., (2001). Challenges of sustainable tourism development in the developing world: the case of Turkey. Tourism
Management (22) 289–303.
Unsal, Erdal M., (2005), Makro İktisat, 6. Basım, Ankara: İmaj Yayıncılık.
Vanegas, M., Croes, R.R., (2003). Growth, development and tourism in a small economy: evidence from Aruba. The
International Journal of Tourism Research 5, 315–330 September/October.
http://www.ktbyatirimisletmeler.gov.tr/ana-sayfa/1-35579/20120109.html, [Accessed on 06th of December 2011 at 14.15]
Journal of Business, Economics & Finance (2012), Vol.1 (1) Leblebici, 2012
____________________________________________________________________________________________________
________________________________________________________________________
38
IMPACT OF WORKPLACE QUALITY ON EMPLOYEE’S PRODUCTIVITY:
CASE STUDY OF A BANK IN TURKEY
Demet Leblebici PhD Candidate, Okan University, Turkey. [email protected]
KEYWORDS
Workplace environment, absenteeism,
employee’s productivity.
ABSTRACT
The workplace environment plays a crucial role for the employees. Nowadays employees
may have a large number working alternatives, then the environment in workplace becomes a
critical factor for accepting and/or keeping the jobs. The quality of environment in workplace
may simply determine the level of employee’s motivation, subsequent performance and
productivity. How well employees get along with the organization influence the employee’s
error rate, level of innovation and collaboration with other employees, absenteeism and
ultimately time period to stay in the job. This paper presents the analysis of working
environment of a foreign private bank in Turkey and examines the relationship between the
workplace physical conditions and employee’s productivity.
1. INTRODUCTION
Nowadays the relationship between employees and employers may be seen upside down. Since there the number
of job opportunities available for employees has been increasing in a growing worldwide economy, not just
employees but also employers need to readjust themselves in order to cope up with the dynamics of business life.
Therefore, HR executives need to consider new strategies for recruiting and retaining best fit talents for their
organizations. Higher salaries and compensation benefits may seem the most likely way to attract employees.
However, quality of the physical workplace environment may also have a strong influence on a company’s
ability to recruit and retain talented people Some factors in workplace environment may be considered keys
affecting employee’s engagement, productivity, morale, comfort level etc. both positively and negatively.
Although convenient workplace conditions are requirements for improving productivity and quality of outcomes,
working conditions in many organizations may present lack of safety, health and comfort issues such as
improper lightening and ventilation, excessive noise and emergency excess. People working under inconvenient
conditions may end up with low performance and face occupational health diseases causing high absenteeism
and turnover. There are many organizations in which employees encounter with working conditions problems
related to environmental and physical factors. Pech and Slade (2006) argued that the employee disengagement is
increasing and it becomes more important to make workplaces that positively influence workforce. According to
Pech and Slade the focus is on symptoms of disengagement such as distraction, lack of interest, poor decisions
and high absence, rather than the root causes. The working environment is perhaps a key root causing
employee’s engagement or disengagement. Another research indicates that improving the working environment
reduces complaints and absenteeism while increasing productivity (Roelofsen, 2002).Wells (2000) states that
workplace satisfaction has been associated with job satisfaction. In recent years, employees comfort on the job,
determined by workplace conditions and environment, has been recognized as an important factor for measuring
their productivity. This is particularly true for those employees who spend most of the day operating a computer
terminal. As more and more computers are being installed in workplaces, an increasing number of businesses has
been adopting ergonomic designs for offices and plant installations. Ergonomics, also called biomechanics, has
become popular because of demand of workers for more human comfort.
Journal of Business, Economics & Finance (2012), Vol.1 (1) Leblebici, 2012
____________________________________________________________________________________________________
________________________________________________________________________
39
The paper presents the analysis of the working environment of a private foreign bank in Turkey. The objective of
this research is to investigate if there exists any relation between workplace conditions and employee’s
performance. A survey study is implemented on the employees of the bank. The paper is divided into five
sections as follows. The next section explains the related literature. The methodology of the research is explained
in the third part. The next section illustrates the findings. The final sections presents the conclusions.
2. RELATED LITERATURE
Many executives are under the mistaken impression that the level of employee performance on the job is
proportional to the size of the employee’s compensation package. Although compensation package is one of the
extrinsic motivation tool (Ryan andDeci, 2000) it has a limited short term effect on employees’ performance. A
widely accepted assumption is that better workplace environment motivates employees and produces better
results. Office environment can be described in terms of physical and behavioral components. These
components can further be divided in the form of different independent variables. An organization’s physical
environment and its design and layout can affect employee behavior in the workplace. Brill (1992) estimates that
improvements in the physical design of the workplace may result in a 5-10 percent increase in employee
productivity. Stallworth and Kleiner (1996) argue that increasingly an organization’s physical layout is designed
around employee needs in order to maximize productivity and satisfaction. They argue that innovative
workplaces can be developed to encourage the sharing of information and networking regardless to job
boundaries by allowing communication freely across departmental groups. Statt (1994) argues that the modern
work physical environment is characterized by technology; computers and machines as well as general furniture
and furnishings. To achieve high levels of employee productivity, organizations must ensure that the physical
environment is conducive to organizational needs facilitating interaction and privacy, formality and informality,
functionality and cross-disciplinarily. Consequently, the physical environment is a tool that can be leveraged
both to improve business results (Mohr, 1996) and employee well-being (Huang, Robertson and Chang, 2004).
Ensuring adequate facilities are provided to employees, is critical to generating greater employee commitment
and productivity. The provision of inadequate equipment and adverse working conditions has been shown to
affect employee commitment and intention to stay with the organization (Weiss, 1999; Wise, Darling-Hammond
and Berry, 1987) as well as levels of job satisfaction and the perception of fairness of pay (Bockerman and
Ilmakunnas, 2006). From a safety perspective, Gyekye (2006) indicates that environmental conditions affect
employee safety perceptions which impact upon employee commitment.
Extensive scientific research conducted by Roelofsen (2002) has also yielded indications suggesting that
improving working environment results in a reduction in a number of complaints and absenteeism and an
increase in productivity. The indoor environment has the biggest effect on productivity in relation to job stress
and job dissatisfaction. As suggested by Govindarajulu (2004), in the twenty-first century, businesses are taking
a more strategic approach to environmental management to enhance their productivity through improving the
performance level of the employees. It is evident in the research findings of Patterson et al., (2003) that the more
satisfied workers are with their jobs the better the company is likely to perform in terms of subsequent
profitability and particularly productivity. Sekar (2011) argues that the relationship between work, the workplace
and the tools of work, workplace becomes an integral part of work itself. The management that dictate how,
exactly, to maximize employee productivity center around two major areas of focus: personal motivation and the
infrastructure of the work environment. (Sekar, C.(2011). There are various literature that defines different
factors that influence the performance of the employees. Haynes (2008) explains the behavioral office
environment behavioral components of the office environment that have the greatest impact on office
productivity. In all of the work patterns, it was found that interaction was perceived to be the component to have
the most positive effect on productivity, and distraction was perceived to have the most negative. As people are
the most valuable resource of an organization, and that the management of people makes a difference to
company performance (Patterson et al., 1997). The workplace environment factors which lead to engagement or
disengagement are illustrated in Figure 1. The factors encourage employees to communicate with each other in
the workplace.
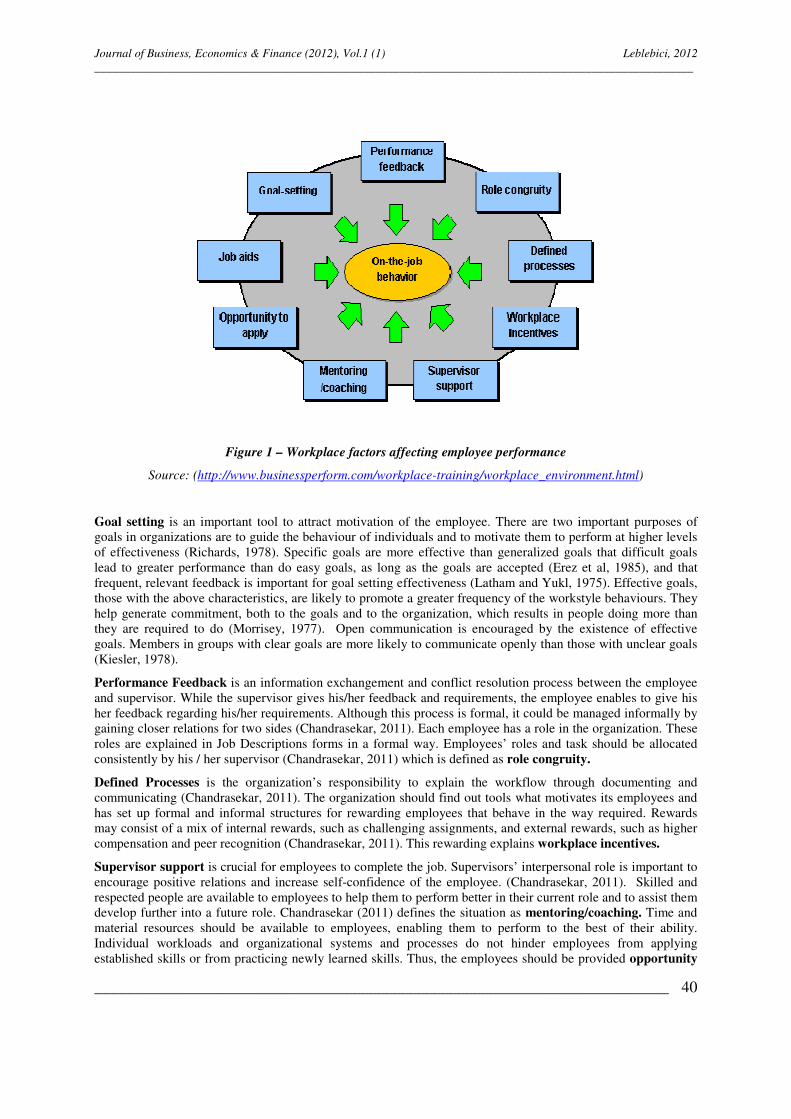
Journal of Business, Economics & Finance (2012), Vol.1 (1) Leblebici, 2012
____________________________________________________________________________________________________
________________________________________________________________________
40
Figure 1 – Workplace factors affecting employee performance
Source: (http://www.businessperform.com/workplace-training/workplace_environment.html)
Goal setting is an important tool to attract motivation of the employee. There are two important purposes of
goals in organizations are to guide the behaviour of individuals and to motivate them to perform at higher levels
of effectiveness (Richards, 1978). Specific goals are more effective than generalized goals that difficult goals
lead to greater performance than do easy goals, as long as the goals are accepted (Erez et al, 1985), and that
frequent, relevant feedback is important for goal setting effectiveness (Latham and Yukl, 1975). Effective goals,
those with the above characteristics, are likely to promote a greater frequency of the workstyle behaviours. They
help generate commitment, both to the goals and to the organization, which results in people doing more than
they are required to do (Morrisey, 1977). Open communication is encouraged by the existence of effective
goals. Members in groups with clear goals are more likely to communicate openly than those with unclear goals
(Kiesler, 1978).
Performance Feedback is an information exchangement and conflict resolution process between the employee
and supervisor. While the supervisor gives his/her feedback and requirements, the employee enables to give his
her feedback regarding his/her requirements. Although this process is formal, it could be managed informally by
gaining closer relations for two sides (Chandrasekar, 2011). Each employee has a role in the organization. These
roles are explained in Job Descriptions forms in a formal way. Employees’ roles and task should be allocated
consistently by his / her supervisor (Chandrasekar, 2011) which is defined as role congruity.
Defined Processes is the organization’s responsibility to explain the workflow through documenting and
communicating (Chandrasekar, 2011). The organization should find out tools what motivates its employees and
has set up formal and informal structures for rewarding employees that behave in the way required. Rewards
may consist of a mix of internal rewards, such as challenging assignments, and external rewards, such as higher
compensation and peer recognition (Chandrasekar, 2011). This rewarding explains workplace incentives.
Supervisor support is crucial for employees to complete the job. Supervisors’ interpersonal role is important to
encourage positive relations and increase self-confidence of the employee. (Chandrasekar, 2011). Skilled and
respected people are available to employees to help them to perform better in their current role and to assist them
develop further into a future role. Chandrasekar (2011) defines the situation as mentoring/coaching. Time and
material resources should be available to employees, enabling them to perform to the best of their ability.
Individual workloads and organizational systems and processes do not hinder employees from applying
established skills or from practicing newly learned skills. Thus, the employees should be provided opportunity

Journal of Business, Economics & Finance (2012), Vol.1 (1) Leblebici, 2012
____________________________________________________________________________________________________
________________________________________________________________________
41
to apply. The work environment is set up so that templates, guides, models, checklists and other such workplace
aids are readily available to help minimize error rates and customer dissatisfaction. Therefore, Chandrasekar
(2011) discusses the necessity of job aids.
There are various literatures that illustrate the relation between some of these factors and the productivity of the
employee. There are different productivity definitions in literature. Rolloos (1997) defined the productivity as,
“productivity is that which people can produce with the least effort”. Productivity is also defined by Sutermeister
(1976) as, “output per employee hour, quality considered”. Dorgan (1994) defines productivity as, “the
increased functional and organizational performance, including quality”. Productivity is a ratio to measure how
well an organization (or individual, industry, country) converts input resources (labor, materials, machines etc.)
into goods and services. In some case, the productivity is measured considering performance increase as when
there is less absenteeism, fewer employee leaving early and less breaks; whereas increase in performance can be
measured by the number of units produced per employee per hour. In this study, subjective productivity
measurement method is used. The measures of this method are not based on quantitative operational information.
Instead, they are based on personnel’s subjective assessments. Wang and Gianakis (1999) have defined
subjective performance measure as an indicator used to assess individuals’ aggregated perceptions, attitudes or
assessments toward an organizations product or service. Subjective productivity data is usually collected using
survey questionnaires. Clements-Croome and Kaluarachchi (2000) discusses that subjective data can also be
descriptive or qualitative collected by interviews.
3. RESEARCH METHODOLOGY
Many organizations have been trying new designs and techniques to construct office buildings, which can
increase productivity, and attract more employees. Many authors have noted that, the physical layout of the
workspace, along with efficient management processes, is playing a major role inboosting employees’
productivity and improving organizational performance (Uzee, 1999; Leaman and Bordass, 1993; Williams et al.
1985). An independent research firm; Gensler conducted a research on US workplace environment. In March
2006, a survey was conducted by taking a sample size of 2013. The research was related to; workplace designs,
work satisfaction, and productivity. 89 percent of the respondents rated design, from important to very important.
Almost 90 percent of senior officials revealed that effective workplace design is important for the increase in
employees’ productivity. The final outcome of the survey suggested that businesses can enhance their
productivity by improving their workplace designs. A rough estimation was made by executives, which showed
that almost 22 percent increase can be achieved in the company’s performance if their offices are well designed.
But practically, many organizations still do not give much importance to workplace design. As many as
40percent of the employees believe that their companies want to keep their costs low that is why their
workplaces have bad designs; and 46 percent of employees think that the priority list of their company does not
have workplace design on top. When data was summarized, almost one out of every five employees rated their
workplace environment from, ‘fair to poor’. 90 percent admitted that their attitude about work is adversely
affected by the quality of their workplace environment. Yet again 89 percent blamed their working environment
for their job dissatisfaction (Gensler, 2006). Similarly, The American Society of Interior Designers (ASID, 1999)
carried out an independent study and revealed that the physical workplace design is one of the top three factors,
which affect performance and job satisfaction. The study results showed that 31 percent of people were satisfied
with their jobs and had pleasing workplace environments. 50 percent of people were seeking jobs and said that
they would prefer a job in acompany where the physical environment is good. Brill et al. (1984) ranked factors,
which affect productivity according to their importance.
The factors are sequenced based on the significance: furniture, noise, flexibility, comfort, communication,
lighting, temperature and the air quality. Springer Inc (1986). Leaman (1995) conducted a survey which is
briefly highlighted here. Author attempted to find the relationship between indoor environment, dissatisfied
employees and their productivity. The results revealed that the productivity of the work is affected because the
people were unhappy with temperature, air quality, light and noise levels in the office. Similar to the literature,
this paper focuses on to figure out the relation between workplace conditions and employee’s performance. The
research is investigated dimensions of workplace environment in terms of physical as well as behavioral
components. The analysis is implemented to a private foreign bank in Turkey which has been operating for 4
years on consumer credits basis with 300 Head Count. In the study both primary and secondary data is used.
Secondary data represents the factors that are frequently used in literature. These factors that are accepted to
influence the performance were explained in the previous section in details. The primary data is the inferences

Journal of Business, Economics & Finance (2012), Vol.1 (1) Leblebici, 2012
____________________________________________________________________________________________________
________________________________________________________________________
42
drawn from the results of the survey which is conducted among 50 employees. The survey is employed to the
call center personel of the bank who mostly are affected from the workplace conditions than the other employees
due to their job requirements. A well designed questionnaire was conducted to collect the primary data. The data
which is collected by survey is subjected to some basic statistical techniques for analyzing the workers’ opinions
towards the workplace and its impact on performance.
Figure 2. Productivity Cycle of Employees
Figure 2 exhibits the productivity cycle of the employees which constitutes the conceptual framework of this
study. The conceptual framework of this study is constructed around the following three research questions..
• Is there any relationship between the components of office environment and the performance level of
employees?
• Which component of office environment? Behavioral or physical has the greater impact on productivity of
the employees.
• Which elements of the two components of the office environment have the significant effect on the
performance level of employees?
The dependent variable and independent variables of the study are as follows:
Dependent Variable
� Productivity of the Employees
Independent Variables
� Physical Components of Environment
� Comfort Level: Ventilation, heating, natural lighting, artificial lighting, decor, cleanliness, overall
comfort, physical security.
� Office Layout: Informal meeting areas, formal meeting areas, quiet areas, privacy, personal storage,
general storage, work area – desk and circulation space
� Behavioral Components of Environment
� Level of Interaction and Distraction: Social interaction, work interaction, creative physical environment,
overall atmosphere, position relative to colleagues, position relative to equipment, overall office layout
and refreshments.
Thus, this research study explores the following research hypothesis.
H0: There is no relationship between office environment and productivity of the employees
H1: There is a relationship between office environment and productivity of employees.
H2: It is the behavioral components of office environment that have a greater effect on productivity, than the
physical components.
H3: It is the comfort level has the significant impact on the performance level of employees than office layout.
Productivity of Employees
Office Layout
Comfort Level Interaction
vs
Distraction
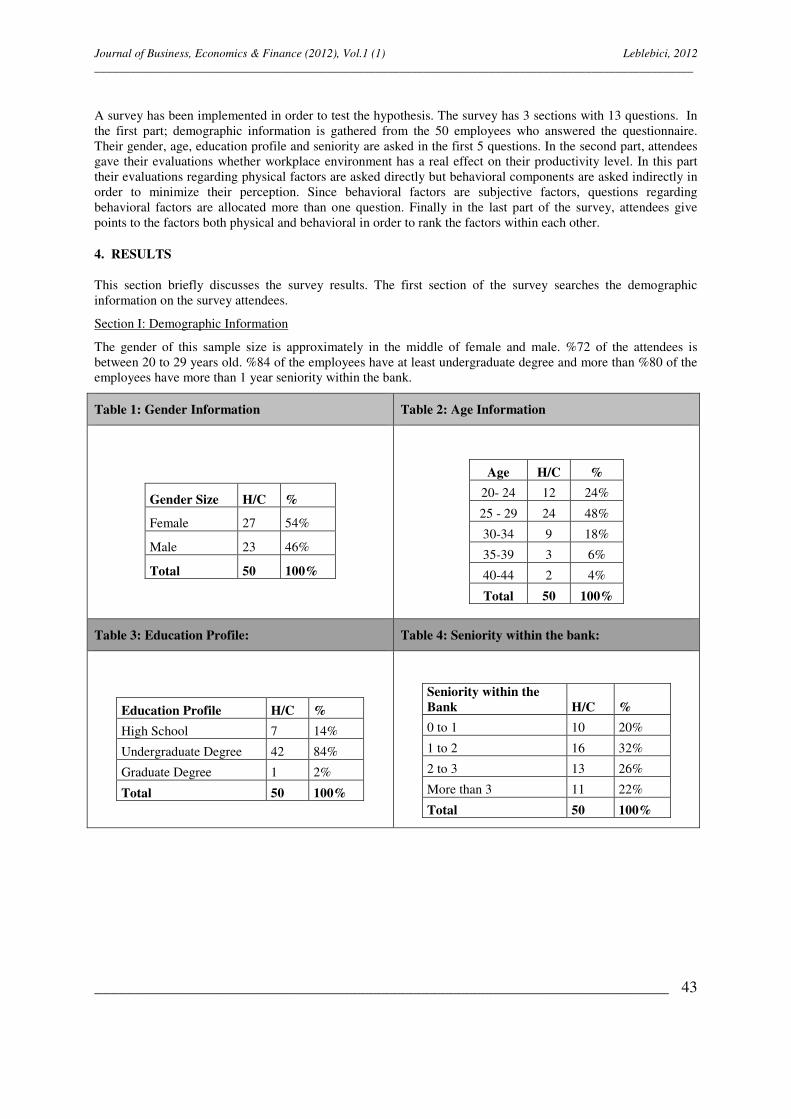
Journal of Business, Economics & Finance (2012), Vol.1 (1) Leblebici, 2012
____________________________________________________________________________________________________
________________________________________________________________________
43
A survey has been implemented in order to test the hypothesis. The survey has 3 sections with 13 questions. In
the first part; demographic information is gathered from the 50 employees who answered the questionnaire.
Their gender, age, education profile and seniority are asked in the first 5 questions. In the second part, attendees
gave their evaluations whether workplace environment has a real effect on their productivity level. In this part
their evaluations regarding physical factors are asked directly but behavioral components are asked indirectly in
order to minimize their perception. Since behavioral factors are subjective factors, questions regarding
behavioral factors are allocated more than one question. Finally in the last part of the survey, attendees give
points to the factors both physical and behavioral in order to rank the factors within each other.
4. RESULTS
This section briefly discusses the survey results. The first section of the survey searches the demographic
information on the survey attendees.
Section I: Demographic Information
The gender of this sample size is approximately in the middle of female and male. %72 of the attendees is
between 20 to 29 years old. %84 of the employees have at least undergraduate degree and more than %80 of the
employees have more than 1 year seniority within the bank.
Table 1: Gender Information Table 2: Age Information
Gender Size H/C %
Female 27 54%
Male 23 46%
Total 50 100%
Age H/C %
20- 24 12 24%
25 - 29 24 48%
30-34 9 18%
35-39 3 6%
40-44 2 4%
Total 50 100%
Table 3: Education Profile: Table 4: Seniority within the bank:
Education Profile H/C %
High School 7 14%
Undergraduate Degree 42 84%
Graduate Degree 1 2%
Total 50 100%
Seniority within the
Bank H/C %
0 to 1 10 20%
1 to 2 16 32%
2 to 3 13 26%
More than 3 11 22%
Total 50 100%

Journal of Business, Economics & Finance (2012), Vol.1 (1) Leblebici, 2012
____________________________________________________________________________________________________
________________________________________________________________________
44
Section II: Appraising Workplace Environment Factors
Table 5: The effect of relations with Superiors at the Workplace for Productivity
Score Responses H/C Percentage
1 Strongly Agree 50 100%
2 Agree 0 0%
3 Partially Agree 0 0%
4 Disagree 0 0%
5 Strongly Disagree 0 0%
Total 50 100%
A supervisor support is crucial for employees to complete the job. Furthermore, interpersonal role of the
supervisor is important to encourage positive relations and increase self-confidence of the employee. 100 % of
survey attendees strongly agree that relations with superiors at the workplace affect their production.
Table 6: Fair Treatment at the Workplace:
Feeling as treated fairly is important for all employees in the workplace. Fair treatment motivates all employees
to do and develop their tasks with full of interest. Table 6 shows that 94% of employees strongly agree that fair
treatment plays a crucial role in motivation.
Table 7: Communication System at the Workplace:
Score Responses H/C Percentage
1 Strongly Agree 45 90%
2 Agree 4 8%
3 Partially Agree 1 2%
4 Disagree 0 0%
5 Strongly Disagree 0 0%
Total 50 100%
Communication promotes trust and loyalty among the employees and encourages better team work and
relationship shows communication system at the workplace.90% of employee strongly agree with the importance
of the communication at the workplace.
Score Responses H/C Percentage
1 Strongly Agree 47 94%
2 Agree 3 6%
3 Partially Agree 0 0%
4 Disagree 0 0%
5 Strongly Disagree 0 0%
Total 50 100%

Journal of Business, Economics & Finance (2012), Vol.1 (1) Leblebici, 2012
____________________________________________________________________________________________________
________________________________________________________________________
45
Table 8: Environmental Factors – Physical Factors- are Conductive to Work:
It is the responsibilities of the companies to provide safe, healthy, friendly working conditions. Besides this;
lightning, ventilation, heating, ergonomics are crucial factors for employees .58% of employees strongly agree
that environmental factors are important for them. Majority of employees agree that there exists a strong relation
between physical factors and motivation.
Section III: Influence of workplace environment on Employee’s Performance
Table 9: Behavioral Factors Affecting the Employee’s Productivity at the workplace:
Factors Mean Value Rank
Interpersonal Relationships 4,32 2
Emotional Factors 4,76 1
Job Assignment 4,26 3
Overtime Duty 3,40 4
Extended work 2,48 5
Employee’s attitude at the workplace is affected by factors like interpersonal relations, emotional factors, job
assignment, overtime duty and extended work.The emotional factor is one of the leading factor that affect the
employees’ attitude with a mean of 4,76. Interpersonal relations is regarded second with mean of 4, 32. Since
interpersonal relations at workplace does not serve a critical role in development and maintenance of trust and
positive feelings among employees in the organization.
Table 10: Physical Aspects Influencing Employee’s Performance at the Workplace
Factors Mean Value Rank
Furntiture and Furnishing 3,42 1
Office Space 3,26 2
Interior Surface 2,18 3
Storage of Materials 1,14 4
Furniture and furnishing is one of the leading physical aspects – comfort level - that influence the employee’s
performance at the workplace with mean value of 3,42. Majority of employees ensures in bank that good
condition and proper furnishing should be maintained in order to make them feel sophisticated while they work.
The results show that furniture and furnishing is the most effective physical workplace environment factor which
increases or decrease employee’s performance. Office space is ranked as second leading physical aspect with
mean of 3, 26 by the employees. Employees ensure that poor arrangement of office space, wastes time and
energy by failing to provide the means for effective work habits. Interior surface has been given third rank with
Score Responses H/C Percentage
1 Strongly Agree 29 58%
2 Agree 11 22%
3 Partially Agree 6 12%
4 Disagree 3 6%
5 Strongly Disagree 1 2%
Total 50 100%

Journal of Business, Economics & Finance (2012), Vol.1 (1) Leblebici, 2012
____________________________________________________________________________________________________
________________________________________________________________________
46
mean of 2, 18. Interior surface acts as practical, aesthetic and conductive to intended purposes such as raising
productivity, improving life style employees. Since it is ranked by third it signifies that employees are
comfortable with interior surface. Storage of materials has been given the lowest significance with the mean
value of 1,14. Adequate storage facilities for materials are provided by the bank in order to arrange the materials
properly. Thus it has weaker influence on work performance.
Table 11: Satisfaction of Employees towards the Physical Factors Provided:
The physical layout of an office is extremely important when it comes to maximizing productivity. Table 5
shows the appraisements of employees towards to the importance of the space and facilities provided to do their
job. 78% respondents are dissatisfied with the space and facilities.
Table 12: Satisfaction of Employees towards the Behavioral Factors:
Score Responses H/C Percentage
1 Strongly Agree 30 60%
2 Agree 14 28%
3 Partially Agree 3 6%
4 Disagree 2 4%
5 Strongly Disagree 1 2%
Total 50 100%
30 employees out of 50 with 60% agree that they are satisfied with the behavioral environmental factors which
they face with in the workplace. Only 6% of the attendees give unfavorable answers to the question.
Table 13: Satisfaction of Employees towards overall Workplace Environment
Score Respondents %
Yes 42 84%
No 8 16%
Total 50 100%
Overall satisfaction has been exhibited in Table 13. Only just 16% of employees are dissatisfied with the overall
working conditions of the bank. 86% of the staff are happy to be a part of the company.
Score Responses H/C Percentage
1 Strongly Satisfied 1 2%
2 Satisfied 7 14%
3 Partially Satisfied 3 6%
4 Dissatisfied 39 78%
5 Strongly Dissatisfied 0 0%
Total 50 100%

Journal of Business, Economics & Finance (2012), Vol.1 (1) Leblebici, 2012
____________________________________________________________________________________________________
________________________________________________________________________
47
The survey results finalize hypothesis which is set before the implementation of the survey.
5. CONCLUSION
The research is investigated dimensions of workplace environment in terms of physical as well as behavioral
components. The analysis is implemented to a private foreign bank in Turkey which has 300 employees. In the
study both primary and secondary data is used. Secondary data represents the factors that are frequently used in
literature. These factors that are accepted to influence the performance were explained in the previous section in
details. The primary data is the inferences drawn from the results of the survey which is conducted among 50
employees. The survey is employed to the call center personel of the bank who mostly are affected from the
workplace conditions than the other employees due to their job requirements. The first part of the survey
includes demographic questions. The outputs show that the gender of this sample size is approximately in the
middle of female and male. %72 of the attendees are between 20 to 29 years old. %84 of the employees have at
least undergraduate degree and more than %80 of the employees have more than 1 year seniority within the
bank. Second part of the survey gives us some clues regarding the effects of environmental factors on
employee’s productivity from the employees’ perceptions. Questions regarding relation with the supervisors, fair
treatment and communication within the bank are asked to the attendees in order to be ensure that behavioral
environmental component are significant for them. Almost all the attendees give strongly agree replies that
relation with the supervisors, fair treatment and communications is important.
Added to behavioral, also attendees evaluated the importance of physical factors. Surprisingly only 58% of
employees give strongly agree replies to the question. It is the first clue that behavioral factor is more important
than physical factors for the employees. In the third part, components are evaluated one by one in order to rank
within each other. For the behavioral part emotional factors and relations are gotten the first two highest ranks.
Comfort level of the offices is more important factor than the office lay out for the employees as physical
environmental factors. In this part of the survey, satisfaction of the employees’ towards the physical and
behavioral environmental factors is evaluated. Employees are not satisfied with the physical factors which the
bank provided for them. But on the other hand, employees’ satisfaction towards the behavioral environmental
factors is remarkably high. At the last question, overall satisfaction towards the workplace environment is asked
to the employees, They give favorable results, almost all of them declared that they are satisfied with the
workplace environment.
Finally, survey results show that while the employees are unhappy with the physical conditions of the workplace,
they have remarkable satisfaction with the workplace by having strong behavioral workplace conditions.
According to the survey results it is proven that workplace environment affects employee performance but
behavioral workplace environment has greater effect on employees’ performance.
Hypothesis Statement Status
H0 There is no relationship between office environment and
productivity of the employees
Do Not Accept
H1 There is a relationship between office environment and
productivity of employees.
Accept
H2 It is the behavioral components of office environment
that have a greater effect on productivity, than the
physical components.
Accept
H3 It is the comfort level has the significant impact on the
performance level of employees than office layout Accept

Journal of Business, Economics & Finance (2012), Vol.1 (1) Leblebici, 2012
____________________________________________________________________________________________________
________________________________________________________________________
48
6. LIMITATIONS AND RECOMMENDATIONS
Questionnaire design and results depend on employees’ perception which has been implemented in order to
analysis the effects of workplace environment towards to employees’ performance, Since there is no
performance management measures in the bank, the real effects of workplace environment on employees’
performance (productivity) could not be measured systematically. In addition to this, 50 employees of the bank
out of 300 who work in the same department have conducted to the survey. Survey results could be altering if the
survey would conduct to the other department’s employees. Also, analysis could be extended by investigating
the gender differences towards the effects of workplace environment and productivity survey.
REFERENCES
American Society of Interior Designers (1999) “Recruiting and retaining qualified employees by design.”
White paper
Bockerman, P., and Ilmakunnas, P. (2006). Do Job Disamenities raise wages or ruin job dissatisfaction?
International Journal of Manpower, 27(3), 290-302.
Brill, M. M. Konar E, (1984) Using Office Design to Increase Productivity. Vol. 1, 1984: Vol.2, 1984. Buffalo,
N.Y.: Workplace Design and Productivity. Buildings/IAQ, pp.495 500.
Brill, M. (1990). Workspace design and productivity. Journal of Healthcare Forum, 35 (5), pp. 51-3.
Chandrasekar. K. (2011). Workplace Environment and its Impact on Organizational Performance in Publcı
Sector Organizations, International Journal Of Enterprise Computing and Business Systems, Vol:1,Issue:1
Clements-Croome, D., Kaluarachchi, Y. (2000) An Assessment of the Influence of the In-door Environmenton
the Productivity of Occupants in Offices Design, Construction and Operation of Healthy Buildings ,pp.6781.
Dorgan, C.E. (1994) productivity Link to the Indoor Environment Estimated Relative to ASHRAE 62-
1989Proceedings of Health Buildings ‘94, Budapest, pp.461 472.
Erez, M., Earley, P. C. and Hulin, C. L. (1985). The impact of participation on goal acceptance and
performance: A two step model. Academy of Management Journal, 28, 50-66
The Gensler Design + Performance Index, The U.S. Workplace Survey (2006), www.gensler.com
Gyekye, S. A. (2006). Safety Management: Perceptions of Workplace Safety. Professional Safety, 51(7), 34-41.
Govindarajulu N, Bonnie, F. Daily. (2004). Motivating Employees for Environmental Improvement. Industrial
Management and Data Systems, 104 (4), pp. 364-372.
Haynes. B. P. (2008). An Evaluation of the Impact of the Office Environment on Productivity. Journal of
Facilities, 26 (5/6), pp. 178-19.
Huang, Y. H., Robertson, M. M., and Chang, K. I. (2004). The role of environmental control on
environmental satisfaction, communication, and psychological stress: effects of office ergonomics training.
Environment and Behavior, 36(1), 617-638.
Kiesler, S. (1978), InterPersonal Processes in Groups and Organizations, AHM Publishing, Arlington Heights,
IL.
Latham, G. P. and Yukl, G. A. (1975). Assigned versus participative goal setting with educated and
uneducated wood workers. Journal of Applied Psychology, 60, 299-302.
Leaman, A, Bordass, B (1993), Building design, complexity and manageability. Facilities 11(9), 16-27.
Leaman, A. (1995). Dissatisfaction and office productivity. Journal of Facilities Management , 13(2), 3-19.
Morrisey, G.L. (1977), Management by Objectives and Results for Business and Industry, Addison-Wesley,
Reading, MA.
Mohr, R. (1996). Office Space is a Revenue Enhancer, Not an Expense. National Real Estate Investor, 38(7),
46-47.

Journal of Business, Economics & Finance (2012), Vol.1 (1) Leblebici, 2012
____________________________________________________________________________________________________
________________________________________________________________________
49
Patterson M G, West M A, Lawthorn R and Nickell, S (1997). Impact of People Management Practices on
Business Performance, (Issues in People Management No 22), Institute of Personnel and Development, London
Ryan, R. M., and Deci, E. L. (2000). Self-determination theory and the facilitation of intrinsic motivation,
social development, and well-being. American Psychologist, 55, 68–78.
Richards, M.D. (1978), Organization Goal Structures, West Publishing, St Paul, MN.
Roeloelofsen P. (2002). The impact of office environments on employee Performance: The design of the
workplace as a strategy for productivity enhancement. Journal of Facilities Management; 1 (3), ABI/INFORM
Global pp. 247 – 264.
Rolloos, M. (1997) Een gezond binnenmilieu betaalt zichzelf terug Praktijkboek Gezonde Gebouwen.October,
A2001-3 18. As cited in Chandrasekar, 2011
Sekar,C.(2011): Workplace Environment and its impact on organizational performance in public sector
organizations , International Journal of Enterprise Computing and Business System International Systems, Vol. 1
Issue 1 January 2011.
Statt (1994) D. A. Psychology and the World of Work. (Washington Square, NY: New York University Press,
457 p.). Psychology, Industrial.
Stallworth, J.O.E. and Kleiner, B.H. (1996). Recent developments in office design. Journal of Facilities, 14
(1/2), pp. 34-42.
Springer, T. (1986) Improving Productivity in the Workplace: Reports from the Field. St.Charles, IL: Springer
Associates, Inc. 1986
Sutermeister, R.A. (1976) People and Productivity, 3rd edn, New York.
Uzee, J (1999), the inclusive approach: creating a place where people want to work.Facility Management
Journal of the International Facility Management Association 26-30.
Wang, X. and Gianakis, G. A. (1999). Public Officials’ Attitudes toward Subjective Performances Measures.
Public Productivity and Management Review. Vol 22. No. 4, 537 - 553.
Weiss, E. M. (1999). Perceived Workplace Conditions and First-year Teachers Morale, Career Choice
Commitment and Planned Retention: A Secondary Analysis. Teaching and Teacher Education, 15, 861-879.
Journal of Business, Economics & Finance (2012), Vol.1 (1) Brau & Carpenter, 2012 ____________________________________________________________________________________________________
________________________________________________________________________
50
SMALL-FIRM UNIQUENESS AND SIGNALING THEORY
James C. Brau1 and J. Troy Carpenter 2 1Professor of Finance, Brigham Young University, [email protected] 2Research Associate and Computing Analyst, Brigham Young University
KEYWORDS
IPO, Small firm uniqueness, SB-2, signaling, initial public offering
ABSTRACT
The purpose of this paper is two-fold. First, we develop a theory of small firm uniqueness. Instead of using an exogenous definition of firm size typical of the extant literature, we allow firms to choose whether they are a “small firm” through the instrument of the SEC’s SB-2 program. Second, we test empirical hypotheses that follow from the theory. We find strong empirical evidence in support of the small-firm uniqueness theory.
1. INTRODUCTION
Are small firms unique—different from the traditional large corporations studied in the extant literature? Ang (1991) is one of the first to offer the small-firm uniqueness hypothesis. We extend his argument through both theory and empirics. To effectively address this research question, two crucial objectives must be achieved. First, to justify testing, a thoughtful theory must be built to validate whether the question adds value to the field. We rely on the entrepreneurial finance and mainline finance literature to build such a theory. Second, an empirical instrument must be found that can reasonably define a small firm. The SB-2 program offers a unique instrument (that to our knowledge has not been used before) to define small firms. With the SB-2 instrument, we are able to design new empirical models to test predictions of the small-firm uniqueness theory. The SB-2 program does not base its definition of size on annual sales, market capitalization, number of employees, or any of the other traditional measures. Instead, we only examine firms with less than $25 million in annual sales and market capitalization. These size firms have the options of participating in the SB-2 (i.e., small business) offering prospectus program or in offering a mainline IPO (using the SEC’s S-1 prospectus program). In our tests, we match SB-2 firms with S-1 firms by traditional measures of size so the instrument of the SB-2 program is the instrument of separation.
Extending the IPO lockup theory of Brau, Lambson, and McQueen (2005), we argue that if small firms are unique from non-small firms, various signals will create a separating equilibrium between the two types of firms and small firms will have distinct factors from non-small firms. From the extant literature, we draw four measures of signaling: lockup length, auditor prestige, underwriter reputation, and venture capital backing (Brau and Johnson (2009) among many others). Our empirical analysis, using both pooled and paired-sample matching, indicates that small firms are unique. For example, small firms have on average 170- to 178-day longer lockup periods. This difference is startling, considering the typical S-1 firm has a boilerplate number of 180 days in lockup (Brau, Carter, Christophe, and Key (2004)). Non-small firms use a Big-Six auditor 95% of the time to go public, compared to 58% of SB-2 IPOs. For the underwriter reputation measurement, non-small firms’ underwriters have a reputation that is 10 times better than small firm underwriters. Finally, non-small firm IPOs in our sample are backed by venture capitalists 69% of the time, compared to only 22% for small-firm IPOs. In multivariate tests, controlling for possible confounding effects, all of these findings persist. In sum, our tests strongly support the notion that the SB-2 instrument is effective in defining small firms from large firms and in providing evidence in favor of the small-firm uniqueness hypothesis.
Journal of Business, Economics & Finance (2012), Vol.1 (1) Brau & Carpenter, 2012 ____________________________________________________________________________________________________
________________________________________________________________________
51
2. LITERATURE REVIEW
For our purposes, assume that two types of firms exist, small firms and non-small firms.1 We base our theory of small firm uniqueness on three theoretical concepts, signaling theory, agency theory, and asymmetric information.
2.1 Ipo Lockup Period Length and Signaling Theory
Signaling theory advances the notion that certain firms can take actions that are too costly for mimickers to take. For example, pertaining to IPOs, Brau, Lambson, and McQueen (2005) show that the retained ownership and the IPO lockup period can serve as such signals. Consider their Equations 2 and 3,
(2) ),(22 Lkg , subject to
(3) .,)()()( 22222bbgbgg Lkrrkr
Where β is the fraction of firms retained by insiders in the IPO, L is the lockup length, μg is defined as μb + C + (B-C) where μb is the value of a mimicking firm, C is the investment required to substantiate the signal, B is the return of the investment, (so B-C is the net present value), σ2(L,α) is the idiosyncratic risk of the post-lockup payment due to uncertainty of the firm’s project where α denotes greater variance, )()( 222 rrbg is the information risk, and k follows from the assumption of standard mean-variance utility of insiders. As can be seen from this constrained maximization problem, IPO issuers choose β and L to maximize their utility. So, good firms will choose β and L that are too high for mimickers to accept and thus a separating equilibrium is achieved.2 Just as with retained ownership and lockup length, non-small firms may be able to send signals that small firms cannot send. Thus, signaling theory suggests that non-small firms may be able to send signals that small firms cannot send. This general theoretical statement generates four specific, empirical hypotheses.
First, following Courteau (1995) and Brau, Lambson, and McQueen (2005) the length of the lock up period may be a separating equilibrium for small firms vis-à-vis non-small firms. Previous empirical literature provides evidence that the length of the lockup is viewed as a positive signal (e.g., Field and Hanka (2001). The longer the lockup, the greater the probability any negative news withheld by an issuing firm will be revealed to the market. On average, the great majority of IPOs have a lockup period of exactly 180 days in the US (Field and Hanka (2001)). Among mainline IPO studies, any variation from the boilerplate 180 sends a significant signal (Brau, Lambson, and McQueen (2005)). If small firms are unique in the sense that they cannot send the same signals that non-small IPOs can send, and if small firms are of greater risk, then the signaling theory outlined above specifically predicts our first testable hypothesis:
H1: Small-firm IPOs have higher average lockup lengths than non-small-firm IPOs.
2.2 Third-Party Certification and Signaling Theory
Another component of signaling theory is the role of third-party certifiers in the IPO process (see Brau and Johnson (2009)). The theoretical link is as follows. Issuing firms can hire prestigious third-party certifiers, such as auditors and underwriters as a positive signal to the market. These third-party certifiers possess valuable reputation capital ((Dunbar (2000) and Karpoff, Lee, and Martin (2008)). Consistent with the argument that underwriters have considerable reputation capital at stake, Dunbar (2000) documents significant investment bank market share impacts (both positive and negative) depending on how underwritten securities perform. Additionally, Karpoff, Lee, and Martin (2008) find significant reputation damages (the market cap drop is 12 times the sum of all penalties imposed through the legal and regulatory process) to parties involved in negative SEC enforcement.
If small firms differ from non-small firms based on signaling theory, then the loss of reputation capital of the third-party is the cost that creates the separating equilibrium. Prestigious third-parties are not willing to take the risk of losing reputation capital on certain firms, in our testable case, small firms.
1 In the next section we will cover our definition of small firm, along with those previously used in the literature. 2 For a complete derivation of the theoretical economic model, see Brau, Lambson, and McQueen (2005), especially Appendix A.
Journal of Business, Economics & Finance (2012), Vol.1 (1) Brau & Carpenter, 2012 ____________________________________________________________________________________________________
________________________________________________________________________
52
2.3 Auditor Prestige and Signaling Theory
Firms must report three years of audited financial statements in the IPO offering prospectus. Previous literature argues that engaging a prestigious auditor to do this is a signal of firm quality (Titman and Trueman (1986), Beatty (1989), Datar, Feltham, and Hughes (1991), Teoh and Wong (1993), and Michaely and Shaw (1995)). Firms that have high quality accounting standards can certify this via the prestigious accounting firms (Daily, Certo, Dalton, Roengpitya (2003) and Brau and Johnson (2009)). As an example of how prestigious auditors can impact the IPO process, consider the work on earnings management by Teoh, Welch, and Wong (1998A), Teoh, Wong, and Rao (1998), DuCharme, Malatesta, and Sefcik (2004), Teoh and Wong (2002), Darrough, and Rangan (2005), and Brau and Johnson (2009). Firms conducting an IPO can work within the Financial Accounting Standards Board's (FASB) Generally Accepted Accounting Principles (GAAP) to legally and strategically manage accruals to make their financial statements look as strong as possible. Under GAAP, the accrual accounting system provides managerial discretion as to recognizing both the timing and amount of revenues and expenses (Teoh, Welch, and Wong, 1998A, B). Brau and Johnson (2009) provide evidence that prestigious auditors are significantly correlated with more conservative earnings management. Couple this finding with that of Teoh, Welch, and Wong (1998A) who show that IPOs with conservative-earnings management significantly outperform IPOs with aggressive-earnings management and one can see how a prestigious auditor can serve as a positive signal of IPO firm quality.
Relying on the theoretical development above, if signaling theory can discern if small firms differ uniquely from non-small firms, then we arrive at our second testable hypothesis:
H2: Small-firm IPOs will have lower-prestige auditors vis-à-vis non-small-firm IPOs.
2.4 Underwriter Prestige and Signaling Theory
Along with prestigious auditors, firms may hire highly-ranked investment banks to underwrite the IPO issue.3 Underwriters can serve as either brokers (a best efforts issue) or as dealers (firm commitment issue) (Chua, 1995, and Guenther, 1992). In a best efforts issue, the underwriter works to arrange buyers for the original IPO shares, but the underwriter never takes possession of the shares. In this sense, a best efforts issue is like a real estate broker, who will find a buyer and seller for a property, but will never own the property during the transaction. In a firm commitment issue, the underwriter purchases the shares at a discount from the issuing firm, owns them temporarily, and then sells them into the primary market. In a firm commitment, the underwriter is more like a car dealer, who must buy the vehicles, own them temporarily, and then sell them. Although in the 1970s and 1980s, best efforts issues were fairly common, by the 1990s, firm commitments dominated the IPO landscape. When an IPO firm hires a prestigious underwriter for a firm commitment issue, a positive signal is sent that the underwriter will take the risk of owning the shares during the offering process. Even though the time of ownership is not great, the risk of ownership is real (Booth and Smith, 1986) and Beatty and Ritter, 1986)). Previous studies have shown that prestigious underwriters have measurable impacts on the initial underpricing and long-run performance of IPOs, adding evidence that they can serve as a positive signal (Carter and Manaster, 1990; Carter, Dark, and Singh, 1998; and Bruton, Chahine, and Filatotchev, 2009). Thus, signaling theory offers this testable hypothesis:
H3: Small-firm IPOs will have lower-prestige underwriters vis-à-vis non-small-firm IPOs.
2.5 Venture-Capital Backing and Signaling Theory
A final third-party certifier that can serve as a signal is the backing of a venture capitalist (Megginson and Weiss, 1991; Barry, Muscarella, Peavy, and Vetsuypens, 1990; Brav and Gompers, 1997; and Cyr, Johnson and Welbourne, 2000). For an entrepreneurial firm to obtain VC financing, it must successfully make it through multiple screens. As practitioners and academics know alike, obtaining VC financing is very difficult. The presence of VC backing thus can serve as another separating equilibrium according to signaling theory. Firms that possess VC backing send a positive signal to the market (Cyr, Johnson, and Welbourne, 2000; Brau and Johnson, 2009). Several studies and much of the extant literature examine and present venture capitalists as value-added investors who assume an active role in their entrepreneurial enterprises (Bygrave and Timmons, 1992). They are highly incentivized to add value to the companies they back because their compensation is tied to that firm’s performance. They are motivated to provide the necessary resources, including their knowledge of raising capital, suppliers, and customers to assure the success of the venture. 3 See Ellis, Michaely, and O’Hara (1999) for an excellent overview of the IPO process.
Journal of Business, Economics & Finance (2012), Vol.1 (1) Brau & Carpenter, 2012 ____________________________________________________________________________________________________
________________________________________________________________________
53
In sum, VC-backed firms signal that they have taken an action that non-VC-backed firms cannot or do not choose to make. Thus, signaling theory predicts:
H4: Small-firm IPOs have less VC-backing than non-small-firm IPOs.
2.6 Small Firm Instrumentation
A debate has existed in the entrepreneurship literature pertaining to the definition of “small” or “entrepreneurial” firms for decades (see Ang, 1991; Osteryoung and Newman, 1993; and Constand, Osteryoung, and Pace, 1994). The one similarity between all of the definitions of small firms is that they are defined by exogenous sources, such as the SBA, analysts, researchers, or banks. What if there was a way to allow firm insiders to self-select or classify their own firms as either a small firm or not a small firm? The SB-2 program allows this precise choice, which makes the definition of a small firm an endogenous decision of insiders.
Consider two firms, one a small firm and one a non-small firm. We follow the literature by parsing firms into small firms for the sake of entrepreneurial study. It is important to note, however, that the actual size of a firm may not be the defining characteristic of a “small firm”. The SBA defines a small business as having less than a certain number of employees depending on industry classification. For example, in the manufacturing sector, the SBA classifies a small firm as one with less than 500 to 1000 employees depending on the type of product manufactured. In the wholesale sector, the maximum number of employees may range from 100 to 500 depending on the product being provided4. While this objective cutoff allows for precise definitions of small firms, it ignores other dimensions of size, such as market capitalization, sales, assets, etc. Perhaps more importantly, it also ignores the vision and intent of the principals of the firm. Constand, Osteryoung, and Pace (1994) attempt to substantiate the efficacy of the SBA’s employee-based definition of a small business. The primary approach of their study is to test for relationships between a firm’s number of employees and a variety of financial and operating ratios. Constand, et al. (1994) find that employee count explains less than two percent of the variation in firm characteristics. They conclude that there is little evidence that supports using the number of employees as a method of defining a small business Constand et al.’s lack of support for the standard SBA definition of a smaller firm motivates our proposal of a new approach.
Although we believe we are the first to use the SB-2 as an instrument to define firm size, we are not the first to study small firm uniqueness in an entrepreneurial finance setting. Ang (1991) presents a conceptual discussion with most of his comparisons between privately-held and publicly traded firms. Ang builds his theory of small-business uniqueness based on agency theory, asymmetric information, failure costs, taxes, and transaction costs. Using a combination of these theories, he defines seven possible identifiers that may help classify a firm as a “small firm”. From Ang, “For the sake of being able to present a more interesting analysis and to stimulate discussions, a business is classified as small if it possesses most of the following characteristics: a) no publicly traded securities, b) owners have undiversified personal portfolios, c) limited liability is absent or ineffective, d) first generation owners are entrepreneurial and prone to risk taking, e) the management team is not complete, f) experiences high cost of market and institutional imperfections, g) relationships with stockholders are less formal, and h) it has high degree of flexibility in designing compensation schemes” (1991). While informative, Ang’s list is difficult to quantify, particularly into one instrument. The SB-2 program presents a unique laboratory for us to test the small-firm uniqueness hypothesis. We extend the premise that small firms are unique from non-small firms by comparing firms that raised capital using the SB-2 program to firms that used the traditional S-1 IPO program.
2.6.1 Direct comparison of SB-2 and S-1 IPOs
The empirical implication of our paper is to determine if SB-2 IPOs differ from mainline S-1 IPOs based upon the four previously-discussed testable predictions of signaling theory. One possibility is that SB-2 IPOs are simply firms that would like to be mainline (i.e., use the S-1 form), but are not strong enough to do so. Another possibility is that SB-2 IPOs are of equivalent quality to S-1 IPOs but wish to take advantage of the “streamlined” SB-2 process. In this section, we test to determine if such theories have efficacy. As previously discussed, signaling theory suggests that better firms can signal their higher quality by engaging prestigious third-party certifiers (i.e., auditors, underwriters, and VCs). We proxy for prestigious auditors by creating a dummy variable that equals one if the firm used a Big Six accounting firm to audit the IPO prospectus financial statements. We consider Arthur Andersen, Coopers and Lybrand, Deloitte and Touche, Ernst and Young, KPMG, and PriceWaterhouseCoopers as the Big Six auditors. We include international arms and predecessors as part of the Big Six. We retrieve the identification of the auditor from Security Data Company’s New Issues 4 http://www.sba.gov/content/what-sbas-definition-small-business-concern

Journal of Business, Economics & Finance (2012), Vol.1 (1) Brau & Carpenter, 2012 ____________________________________________________________________________________________________
________________________________________________________________________
54
Database (SDC). A few key articles that have studied auditor impact on firm quality are Titman and Trueman (1986), Beatty (1989), Datar, Feltham, and Hughes (1991), Teoh and Wong (1993), and Michaely and Shaw (1995). Our measure of underwriter prestige, UW Rank, is a modification of Brau and Johnson’s (2009) measure which creates a ranking of 1–100 based on the number of IPOs each lead underwriter facilitated in a given year. We define the lead underwriter using SDC. For deals with more than one lead underwriter, we average the scores of the co-lead underwriters. Examples of articles that examine underwriter reputation and quality certification are Booth and Smith (1986), Beatty and Ritter (1986), Carter and Manaster (1990), and Carter, Dark, and Singh (1998).
The other certification variable, venture capital backing, takes the value of one if the IPO had VC-backing prior to the issue date and zero otherwise. We use SDC to classify an IPO as VC or non-VC backed. Articles that discuss the impact of VC-backing include Megginson and Weiss (1991), Barry, Muscarella, Peavy, and Vetsuypens (1990), Brav and Gompers (1997), and Cyr, Johnson and Welbourne (2000). The non-certification variable we use to proxy for a signal in the IPO is the lockup length. We retrieve the number of days in lock up from SDC. Prior literature documents that the typical lockup length is 180 days for the large majority of IPOs (Field and Hanka (2001) and Brau, Carter, Christophe, and Key (2004)).
2.6.2 Control Variables
Empirically, we must control for other factors which may explain the signaling theory variables so we do not attribute explanatory power to the SB-2 instrument when it is actually some other effect. We rely on previous literature to identify these proxies. The objective is to control for factors which may measure quality or some other impact on the signaling variables, as opposed to the classification of being an SB-2 or SB-1 IPO. We introduce these control variables only briefly, as they are not the focus of the paper and we provide citations for the interested reader. Measures that have been used as proxies for firm quality previously have been Sales (Purnanandan and Swaminathan (2004)), Cash flows (Livnat and Lopez-Espinosa (2008)), the Exchange the firm is listed on (Bradley and Jordan (2002)), Return on assets (ROA) (Chen, Novy-Marx, and Zhang (2010)), Age of the firm (Loughran and Ritter (2004)), firm Debt ratios (Cotter and Peck (2001)), the state of incorporation (Delaware corp) (Boulton (2010)), IPO offer size (i.e., the public float) (Bradley and Jordan (2006)), internet-IPO offering (Loughran and Ritter (2004), and dual-class IPO offering (Smart and Zutter (2003)). We retrieve sales, cash flows, ROA, total debt, total assets, and state of incorporation from Compustat for the fiscal year immediately prior to the IPO date. The listing exchange, VC-backing status, offer size, and lockup length are retrieved from SDC’s New Issues database. We create a dummy variable for Exchange which equals one if the firm listed on the NYSE, AMEX, or Nasdaq’s National Market and zero otherwise. Age is computed as the IPO date minus the firm founding date. IPO dates are taken from SDC and founding dates are taken from Jay Ritter’s data website based on Loughran and Ritter (2004). For subsequent regression models, we use the natural logarithm of one plus the firm age. Internet-IPO flag and Dual-Class IPO flag are from Jay Ritter’s data webpage and based on Loughran and Ritter (2004).
3. METHODOLOGY AND DATA
Our initial sample of SB-2 and S-1 IPOs is drawn from SDC’s New Issues database. From 1/1/1993 through 12/31/2008, SDC reports 4,411 IPOs. These dates are chosen because they represent the period in which the SB-2 program is in place and for which CRSP data is available to create one-year abnormal returns. Next, we merge the sample with Compustat data to obtain the pre-IPO sales level, the qualifier for the SB-2 program. We are able to successfully match 4,118 of our SDC firms with Compustat data. Our initial desired sample is all SB-2 and S-1 firms with less than $25 million in sales in the fiscal year immediately before the IPO. Firms that have less than $25 million in sales at the IPO can theoretically choose between filing an SB-2 or an S-1 form with the SEC.5 After removing IPOs with greater than $25 million in sales, we are left with 1,930 observations. We then successfully merge all 1,930 of these observations with CRSP data. We exclude all financial firms which leaves 1,899 IPOs in our final pooled sample with 1,356 S-1 IPOs and 543 SB-2 IPOs. We perform all of our analyses using the pooled subsamples of all SB-2s and all S-1 IPOs.
5 Firms under $25 million in sales could also choose to file Form SB-1. SB-1 filings, however, are not comparable to S-1 filings because SB-1’s are restricted to raising a maximum of $10 million in any 12-month period.
Journal of Business, Economics & Finance (2012), Vol.1 (1) Brau & Carpenter, 2012 ____________________________________________________________________________________________________
________________________________________________________________________
55
Next, we construct a pair-matched sample of SB-2 IPOs and S-1 IPOs based on size and industry.6,7 We repeat all of our tests using the pair-matched samples. In our tables, we report the pooled and pair-matched results to ameliorate any possible size-effect between SB-2 and S-1 IPOs. Because firm size (i.e., sales) is often used as a measure of firm quality (Purnanandan and Swaminathan, 2004), we want to make sure we isolate any SB-2-effects from any possible size-effects. Table 1, Panel A reports the frequency distribution for the pooled and pair-matched samples of 1,356 S-1 IPOs and 543 SB-2 IPOs, respectively. For mainline S-1 IPOs, 1999 was the most populated year with 245 (18.1% of S-1 sample) occurring. The second and third most populated years were 2000 with 205 IPOs (15.1%), and 1996 with 201 IPOs (14.8%). The least populated year for S-1s is 2008 seeing only four IPOs (0.3%). Recall, these counts are not the total number of S-1 IPOs during these years; they represent the number of S-1 IPOs with less than $25 million in revenues. The right two columns of Panel A report the frequency for the pair-matched S-1 benchmark sample. We will leave inspection to the reader. Note that we formed our pair-match bases on size (sales) and industry (2-digit Kahle and Walking (1996) class). As such, the years do not perfectly align between the SB-2 and S-1 pair-matched sample. For this reason, we include year dummies in our multivariate models and compute year cluster-adjusted t-statistics for robustness.
Table 1, Panel B reports a similar distribution for SB-2 IPOs. The 1993–1996 years show high frequencies of issues ranging from 82 IPOs (15.1%) in 1993 to 128 IPOs (23.6%) in 1996. In fact, if we compare 1995 for S-1 and SB-2 IPOs, the count is 119 S-1s and 100 SB-2s. The SB-2 program seems to have started out with vigor beginning in 1993 and peaking in 1996. From 1996 to 2002, we see a monotonic decrease in the number of SB-2 IPOs. From 2001 to 2008, the number of SB-2 IPOs only range from 0–6 issues per year, with 2008 seeing zero issues. Table 2, Panels A and B report the sample frequency based on industry. We base our industry categories on Kahle and Walkling (1996). The table shows that choice of offering program (SB-2 or S-1) does not seem conditioned on industry. Both samples report Manufacturing and Services as the highest frequency industries with manufacturing comprising 42.3% of the S-1sample and 45.5% of the SB-2 sample. Services make up 43.4% of the S-1sample and 35.7% of the SB-2 sample. The other six industry groups are fairly evenly distributed within and between the S-1 and SB-2 samples. The pair-matched S-1’s and SB-2’s have identical industry frequencies as a result of our matching algorithm.
4. RESULTS
4.1 Univariate Analyses
4.1.1 Signaling Theory Variables
The univariate tests for Hypotheses 1-4 are reported in Table 3. All of the proxies except for Lockup Length are predicted to have a negative sign for the difference in means and medians (i.e., SB-2 minus S-1) if SB-2 IPOs are of lesser-quality than S-1 IPOs. The Lockup Length prediction is positive based on Brau, Lambson, and McQueen (2005). Big Six, UW Rank (underwriter reputation), and VC all have the predicted negative sign and are significantly different for both means and medians. Lockup length has the predicted positive sign and is significant for both means and medians.
4.1.2 Control Variables
In Table 4, Sales, Exchange, Book/Market, Delaware Corp, Offer Size, Internet IPO, and Dual Share Class all have negative sign and are significantly different for both means and medians for SB-2 IPOs minus S-1 IPOs. Cash Flow, ROA, and Debt/Assets have positive and significant differences in means and/or medians. In the aggregate, it appears that even though both samples include only “small firms” (less than $25 million in sales prior to the IPO), SB-2 IPOs are fundamentally different than S-1 IPOs. Eight of the proxies indicate SB-2 IPOs are of lesser quality vis-à-vis S-1 IPOs, whereas three proxies indicate they are of superior quality as measured by traditional proxies.
6 We thank Keith Gamble who served as a discussant for this paper for this suggestion. 7 We match each SB-2 company to the S-1 company closest in size (sales) within the same industry. We represent size using Compustat annual sales (REVT). Industry classification follows the Kahle and Walking (1996) methodology.
Journal of Business, Economics & Finance (2012), Vol.1 (1) Brau & Carpenter, 2012 ____________________________________________________________________________________________________
________________________________________________________________________
56
4.2 Multivariate Analysis
Tables 5 and 6 report the multivariate results of four limited dependent variable models for both the pair-matched and pooled samples. For Lockup Length and UW Rank, we use Tobit methods because both variables are truncated on the left tail of the distribution at zero. For Big Six and VC, we use logistic regression because the dependent variable for both is binary in nature (i.e., equaling either 1 or 0). The general model is:
Signaling variable (Lockup Length or Big Six or UW Rank or VC) =
β1log(Sales) + β2Cash Flow + β3Exchange + β4ROA + β5log(Age) + β6Debt/Assets + β7Delaware Corp + β8Offer Size + β9Internet IPO + β10Dual Share Class + β(years)Years + β(industries)Industry1(A-I) + ε, (2)
The multivariate results demonstrate that SB-2’s have significantly longer Lockup Lengths (114 days, pair-matched sample; 124 days, pooled sample), indicating at least by signaling theory (e.g., Arthurs, Busenitz, Hoskisson, and Johnson (2009)), they are of lower quality than S-1 IPOs. For completeness, we discuss the other four control variables which are statistically significant in both the pair-matched (Table 5) and pooled (Table 6) samples although they are not the focus of our testing. In the Lockup Tobit model, the negative sign in log(sales), indicates that companies with more sales tend to spend less time in lockup. The negative sign in Exchange, the variable for listing on the Nasdaq, American, or NYSE, indicates that companies listing on these exchanges also have less time in lockup. The positive sign on ROA indicates that companies with more return on assets spend more time in lockup. The other control variables are not statistically significant. In each of the following models, we report all control variables in the tables and leave the detailed inspection to the interested reader.
The multivariate results in both the pair-matched and pooled samples also confirm the significance of the SB-2 variable on Big Six, Underwriter Rank, and VC. Even after employing all of the control variables, many of which are statistically significant, we find that SB-2s are negatively correlated (p < 0.0001 in both samples) with all three dependent variables. Our results indicate that small companies employ less prestigious auditor and underwriters and are less likely to have venture capital backing. In the aggregate, the models reported in Tables 5 and 6 demonstrate that SB-2 and S-1 IPOs are significantly different from one another along the four signaling proxies. Hypotheses 1–4 are strongly supported. We have identified several dimensions in which proxies measuring greater quality suggest that higher-quality firms choose an S-1 filing in lieu of the SB-2 program, despite being small enough to qualify for the SB-2 program. The results of the head-to-head comparison tests in this section suggest that firms that complete an IPO using an S-1 may signal they are superior firms, relative to SB-2 issuers.
5. CONCLUSION
The purpose of this paper has been to test the small firm uniqueness hypothesis—the notion that small firms are materially different than non-small firms. We do so using the instrument of the SEC’s SB-2 IPO program. We believe we are the first to use the SB-2 vehicle to make such a distinction. Firms that have less than $25 million in sales the year before the IPO may raise an unlimited amount of capital through a public offering by filing form SB-2 instead of the traditional form S-1. We compare SB-2 IPOs, which we use to designate as small firms, to S-1 IPOs, which we designate as non-small firms. Our empirical analysis, using both pooled and paired-sample matching, indicates that small firms are unique. We find that small firms have on average 170 to 178-day longer lockup periods. Non-small firms use a Big-Six auditor 95% of the time to go public, compared to 58% of SB-2 IPOs. As for underwriter reputation, non-small firms’ underwriters have reputations that are 10 times better than small firm underwriters. Finally, non-small firm IPOs in our sample are backed by venture capitalists 69% of the time, compared to only 22% for small firm IPOs. In multivariate tests, controlling for possible confounding effects, all of these findings persist. In sum, our tests strongly support the notion that the SB-2 instrument is effective in defining small firms from large firms and in providing evidence in favor of the small-firm uniqueness hypothesis.

Journal of Business, Economics & Finance (2012), Vol.1 (1) Brau & Carpenter, 2012 ____________________________________________________________________________________________________
________________________________________________________________________
57
REFERENCES Ang, J., (1991). Small business uniqueness and the theory of financial management. Journal of Small Business Finance 1, 1–13.
Arthurs, J., Busenitz, L., Hoskisson, R., & Johnson, R., (2009). Signaling and initial public offerings: The use and impact of the lockup period. Journal of Business Venturing 24, 360–372.
Barry, C., Muscarella, C., Peavy, J., & Vetsuypens, M., (1990). The role of venture capital in the creation of public companies. Journal of Financial Economics 27, 447–471.
Beatty, R., (1989). Auditor reputation and the pricing of initial public offerings. Accounting Review 64, 693–709.
Beatty, R., & Ritter, J., (1986). Investment banking, reputation, and the underpricing of initial public offerings. Journal of Financial Economics 15, 213–232.
Booth, J., & Smith, R., (1986). Capital raising, underwriting and the certification process. Journal of Financial Economics 15, 261–281.
Boulton, T., (2010). The impact of the corporate control market on IPO decisions. Miami University working paper.
Bradley, D., & Jordan, B., (2002). Partial adjustment to public information and IPO underpricing. Journal of Financial and Quantitative Analysis, 37, 595–616.
Brau, J., & Johnson, P., (2009). Earnings management in IPOs: Post-engagement third-party mitigation or issuer signaling? Advances in Accounting 25, 125–135.
Brau, J., Lambson, V., & McQueen, G., (2005). Lockups Revisited. Journal of Financial and Quantitative Analysis 40(3), 519–530.
Brau, J., Carter, D., Christophe, S., & Key, K., (2004). Market Reaction to the Expiration of IPO Lockup Provisions. Managerial Finance 30(2), 87–103.
Brav, A., & Gompers, P., (1998). Myth or reality? The Long-Run Underperformance of Initial Public Offerings: Evidence from Venture and Nonventure Capital-Backed Companies. Journal of Finance 1997(5), 1791–1821.
Bruton, G., Chahine, S., & Filatotchev, I., (2009). Founders, private equity investors, and underpricing in entrepreneurial IPOs. Entrepreneurship: Theory and Practice 33, 909–928.
Bygrave, W. & Timmons, J. (1992). Venture Capital at the Crossroads. Harvard Business School Press, Boston.
Carter, R., Dark, F., & Singh, A., (1998). Underwriter reputation, initial returns, and the long-run performance of IPO stocks. Journal of Finance 53, 285–311.
Carter, R., & Manaster, S., (1990). Initial public offerings and underwriter reputation. Journal of Finance 45, 1045–1068.
Chen, L., Novy-Marx, R., & Zhang, L., (2010). An alternative three-factor model. Journal of Finance, forthcoming.
Chua, L., (1995). A Reexamination of the Costs of Firm Commitment and Best Efforts IPOs. Financial Review 30(2), 337–365.
Constand, R., Osteryoung, J., & Pace D., (1994). An Empirical Investigation Into the Size of Small Business. Journal of Small Business Finance 4(1), 75–86.
Cotter, J., & Peck, S., (2001). The structure of debt and active equity investors: The case of the buyout specialist. Journal of Financial Economics 59, 101–147.
Courteau, L., (1995). Under-diversification and retention commitments in IPOs. Journal of Financial and Quantitative Analysis 30, 487–517.
Cyr, L., Johnson, E., & Welbourne, T., (2000). Human resources in initial public offering firms: Do venture capitalists make a difference? Entrepreneurship: Theory and Practice 25, 77–93.
Daily, C., Certo, S., Dalton, D., & Roengpitya, R., (2003). IPO underpricing: A meta-analysis and research synthesis. Entrepreneurship: Theory and Practice 27, 271–295.
Datar, S., Feltham, G., & Hughes, J. S., (1991). The role of audits and audit quality in valuing new issues. Journal of Accounting and Economics 14, 3–50.
Darrough, M., & Rangan, S., (2005). Do insiders manipulate earnings when they sell their shares in an initial public offering? Journal of Accounting Research 43, 1−33.
DuCharme, L., Malatesta, P., & Sefcik, S., (2004). Earnings management, stock issues, and shareholder lawsuits. Journal of Financial Economics 71, 27−49.
Dunbar, C., (2000). Factors affecting investment bank initial public offering market share. Journal of Financial Economics 55, 3–41.
Journal of Business, Economics & Finance (2012), Vol.1 (1) Brau & Carpenter, 2012 ____________________________________________________________________________________________________
________________________________________________________________________
58
Ellis, K., Michaely, R., & O’Hara, M., (1999). A guide to the initial public offering process. Corporate Finance Review 3, 14–18.
Field, L., & Hanka, G., (2001). The expiration of IPO share lockups. Journal of Finance 56, 471–500.
Guenther, A., (1992). The Pricing Of Best Efforts New Issues. Journal of Finance 47(2), 781–790.
Kahle, K., & Walkling, R., (1996). The Impact of Industry Classifications on Financial Research. Journal of Financial and Quantitative Analysis 31, 309–336.
Karpoff, J., Lee, D., & Martin, G., (2008). The cost to firms of cooking the books. Journal of Financial and Quantitative Analysis 43, 581−611.
Livnat, J., & Lopez-Espinosa, G., (2008). Quarterly accruals or cash flows in portfolio construction? Financial Analysts Journal 64, 67–79.
Loughran, T., & Ritter, J. R., (2004). Why has IPO underpricing changed over time? Financial Management Autumn, 5–37.
Megginson, W., & Weiss, K., (1991). Venture capital certification in initial public offerings. Journal of Finance 46, 879–903.
Michaely, R., & Shaw, W., (1995). Does the choice of auditor convey quality in an initial public offering? Financial Management 24, 15–30.
Newman, D., & Osteryoung, J., (1993). A Definition of Small Businesses. Journal of Small Business Finance 220–231.
Purnanandan, A., & Swaminathan, B., (2004). Are IPO’s really underpriced? Review of Financial Studies 17, 811–848.
Smart, S., & Zutter, C., (2003). Control as a motivation for underpricing: A comparison of dual- and single-class IPOs. Journal of Financial Economics 69, 85–110.
Teoh, S., & Wong, T., (1993). Perceived auditor quality and the earnings response coefficient. Accounting Review 68, 346–366.
Teoh, S., & Wong, T., (2002). Why new issues and high-accrual firms underperform: the role of analysts' credulity. Review of Financial Studies 15, 869−900.
Teoh, S., Welch, I., & Wong, T., (1998A). Earnings management and the long-run market performance of initial public offerings. Journal of Finance 53, 1935−1974.
Teoh, S., Welch, I., & Wong, T., (1998B). Earnings management and the underperformance of seasoned equity offerings. Journal of Financial Economics 50, 63−99.
Teoh, S., Wong, T., & Rao, G., (1998). Are accruals during initial public offerings opportunistic? Review of Accounting Studies 3, 175−208.
Titman, S., & Trueman, B., (1986). Information quality and the valuation of new issues. Journal of Accounting and Economics 8, 159–172.
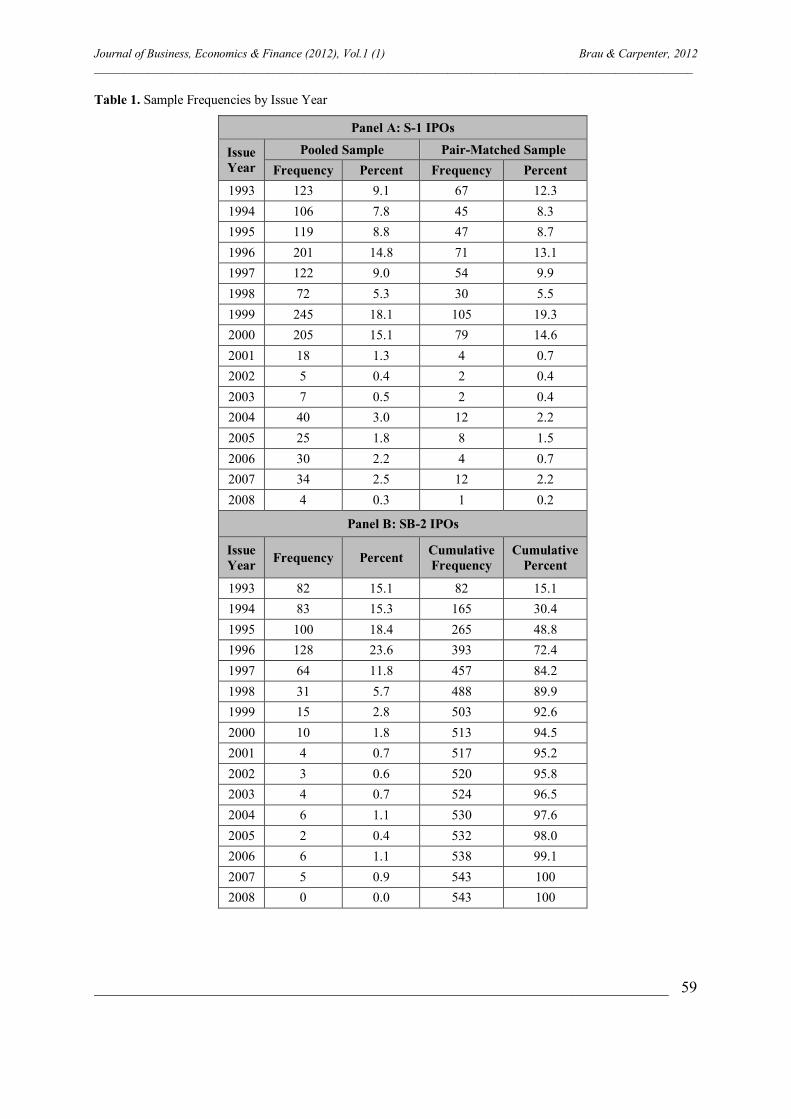
Journal of Business, Economics & Finance (2012), Vol.1 (1) Brau & Carpenter, 2012 ____________________________________________________________________________________________________
________________________________________________________________________
59
Table 1. Sample Frequencies by Issue Year
Panel A: S-1 IPOs
Issue Year
Pooled Sample Pair-Matched Sample Frequency Percent Frequency Percent
1993 123 9.1 67 12.3 1994 106 7.8 45 8.3 1995 119 8.8 47 8.7 1996 201 14.8 71 13.1 1997 122 9.0 54 9.9 1998 72 5.3 30 5.5 1999 245 18.1 105 19.3 2000 205 15.1 79 14.6 2001 18 1.3 4 0.7 2002 5 0.4 2 0.4 2003 7 0.5 2 0.4 2004 40 3.0 12 2.2 2005 25 1.8 8 1.5 2006 30 2.2 4 0.7 2007 34 2.5 12 2.2 2008 4 0.3 1 0.2
Panel B: SB-2 IPOs
Issue Year Frequency Percent Cumulative
Frequency Cumulative
Percent
1993 82 15.1 82 15.1 1994 83 15.3 165 30.4 1995 100 18.4 265 48.8 1996 128 23.6 393 72.4 1997 64 11.8 457 84.2 1998 31 5.7 488 89.9 1999 15 2.8 503 92.6 2000 10 1.8 513 94.5 2001 4 0.7 517 95.2 2002 3 0.6 520 95.8 2003 4 0.7 524 96.5 2004 6 1.1 530 97.6 2005 2 0.4 532 98.0 2006 6 1.1 538 99.1 2007 5 0.9 543 100 2008 0 0.0 543 100
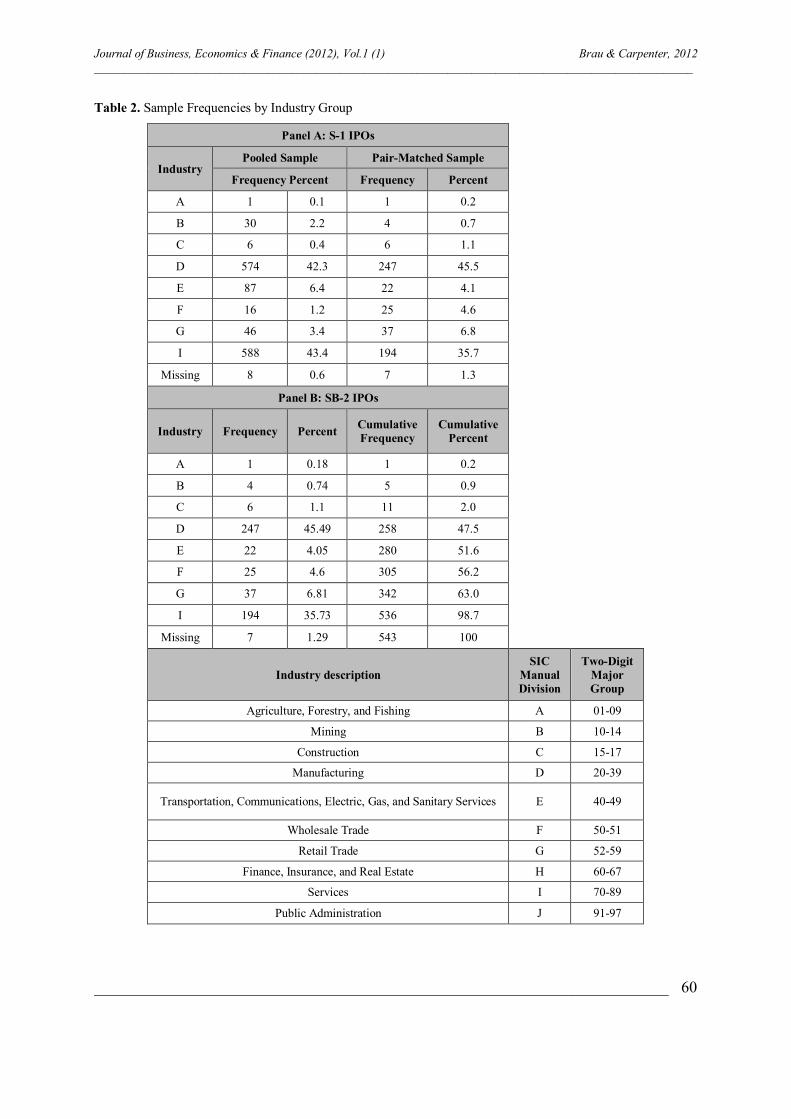
Journal of Business, Economics & Finance (2012), Vol.1 (1) Brau & Carpenter, 2012 ____________________________________________________________________________________________________
________________________________________________________________________
60
Table 2. Sample Frequencies by Industry Group
Panel A: S-1 IPOs
Industry Pooled Sample Pair-Matched Sample
Frequency Percent Frequency Percent
A 1 0.1 1 0.2
B 30 2.2 4 0.7
C 6 0.4 6 1.1
D 574 42.3 247 45.5
E 87 6.4 22 4.1
F 16 1.2 25 4.6
G 46 3.4 37 6.8
I 588 43.4 194 35.7
Missing 8 0.6 7 1.3
Panel B: SB-2 IPOs
Industry Frequency Percent Cumulative Frequency
Cumulative Percent
A 1 0.18 1 0.2
B 4 0.74 5 0.9
C 6 1.1 11 2.0
D 247 45.49 258 47.5
E 22 4.05 280 51.6
F 25 4.6 305 56.2
G 37 6.81 342 63.0
I 194 35.73 536 98.7
Missing 7 1.29 543 100
Industry description SIC
Manual Division
Two-Digit Major Group
Agriculture, Forestry, and Fishing A 01-09
Mining B 10-14
Construction C 15-17
Manufacturing D 20-39
Transportation, Communications, Electric, Gas, and Sanitary Services E 40-49
Wholesale Trade F 50-51
Retail Trade G 52-59
Finance, Insurance, and Real Estate H 60-67
Services I 70-89
Public Administration J 91-97
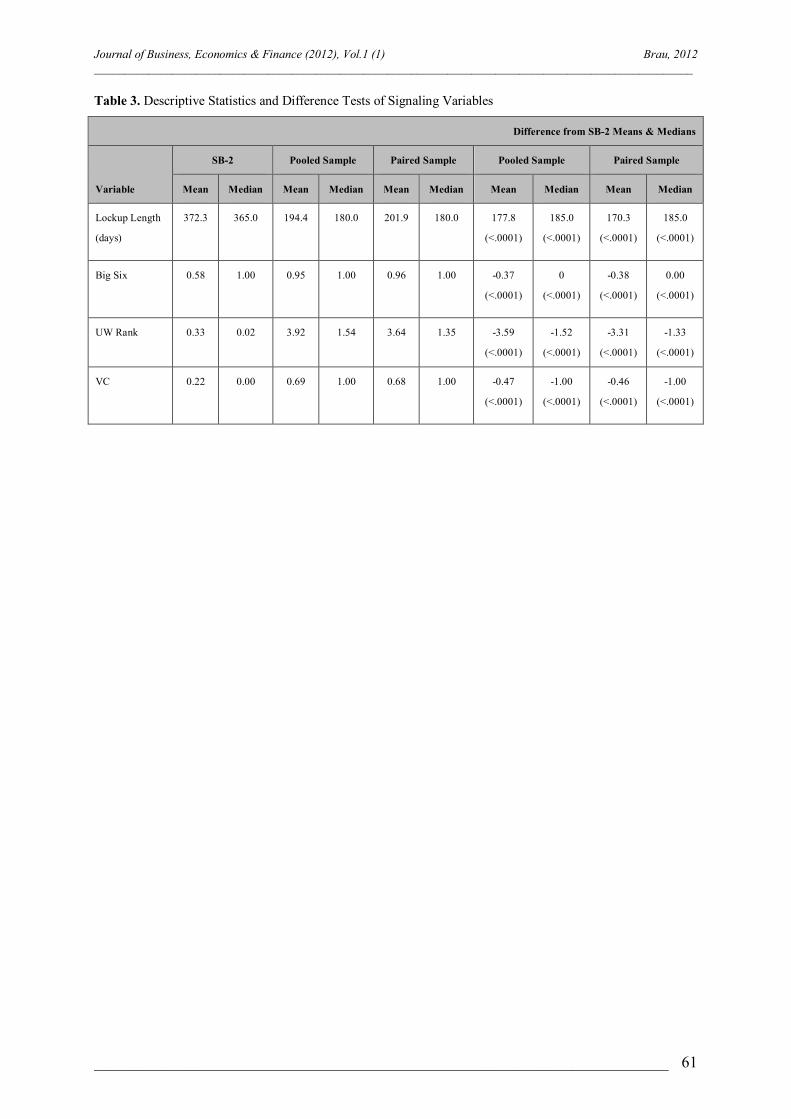
Journal of Business, Economics & Finance (2012), Vol.1 (1) Brau, 2012 ____________________________________________________________________________________________________
________________________________________________________________________ 61
Table 3. Descriptive Statistics and Difference Tests of Signaling Variables
Difference from SB-2 Means & Medians
Variable
SB-2 Pooled Sample Paired Sample Pooled Sample Paired Sample
Mean Median Mean Median Mean Median Mean Median Mean Median
Lockup Length
(days)
372.3 365.0 194.4 180.0 201.9 180.0 177.8
(<.0001)
185.0
(<.0001)
170.3
(<.0001)
185.0
(<.0001)
Big Six 0.58 1.00 0.95 1.00 0.96 1.00 -0.37
(<.0001)
0
(<.0001)
-0.38
(<.0001)
0.00
(<.0001)
UW Rank 0.33 0.02 3.92 1.54 3.64 1.35 -3.59
(<.0001)
-1.52
(<.0001)
-3.31
(<.0001)
-1.33
(<.0001)
VC 0.22 0.00 0.69 1.00 0.68 1.00 -0.47
(<.0001)
-1.00
(<.0001)
-0.46
(<.0001)
-1.00
(<.0001)
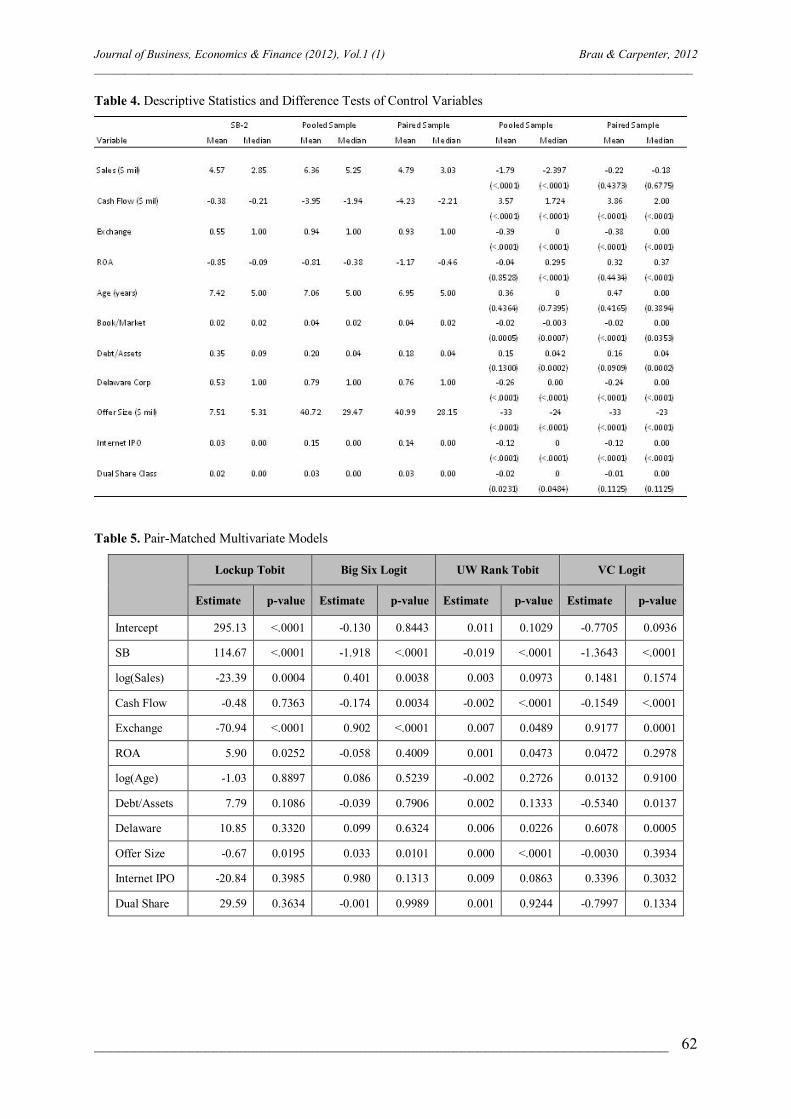
Journal of Business, Economics & Finance (2012), Vol.1 (1) Brau & Carpenter, 2012 ____________________________________________________________________________________________________
________________________________________________________________________
62
Table 4. Descriptive Statistics and Difference Tests of Control Variables
Table 5. Pair-Matched Multivariate Models
Lockup Tobit Big Six Logit UW Rank Tobit VC Logit
Estimate p-value Estimate p-value Estimate p-value Estimate p-value
Intercept 295.13 <.0001 -0.130 0.8443 0.011 0.1029 -0.7705 0.0936
SB 114.67 <.0001 -1.918 <.0001 -0.019 <.0001 -1.3643 <.0001
log(Sales) -23.39 0.0004 0.401 0.0038 0.003 0.0973 0.1481 0.1574
Cash Flow -0.48 0.7363 -0.174 0.0034 -0.002 <.0001 -0.1549 <.0001
Exchange -70.94 <.0001 0.902 <.0001 0.007 0.0489 0.9177 0.0001
ROA 5.90 0.0252 -0.058 0.4009 0.001 0.0473 0.0472 0.2978
log(Age) -1.03 0.8897 0.086 0.5239 -0.002 0.2726 0.0132 0.9100
Debt/Assets 7.79 0.1086 -0.039 0.7906 0.002 0.1333 -0.5340 0.0137
Delaware 10.85 0.3320 0.099 0.6324 0.006 0.0226 0.6078 0.0005
Offer Size -0.67 0.0195 0.033 0.0101 0.000 <.0001 -0.0030 0.3934
Internet IPO -20.84 0.3985 0.980 0.1313 0.009 0.0863 0.3396 0.3032
Dual Share 29.59 0.3634 -0.001 0.9989 0.001 0.9244 -0.7997 0.1334
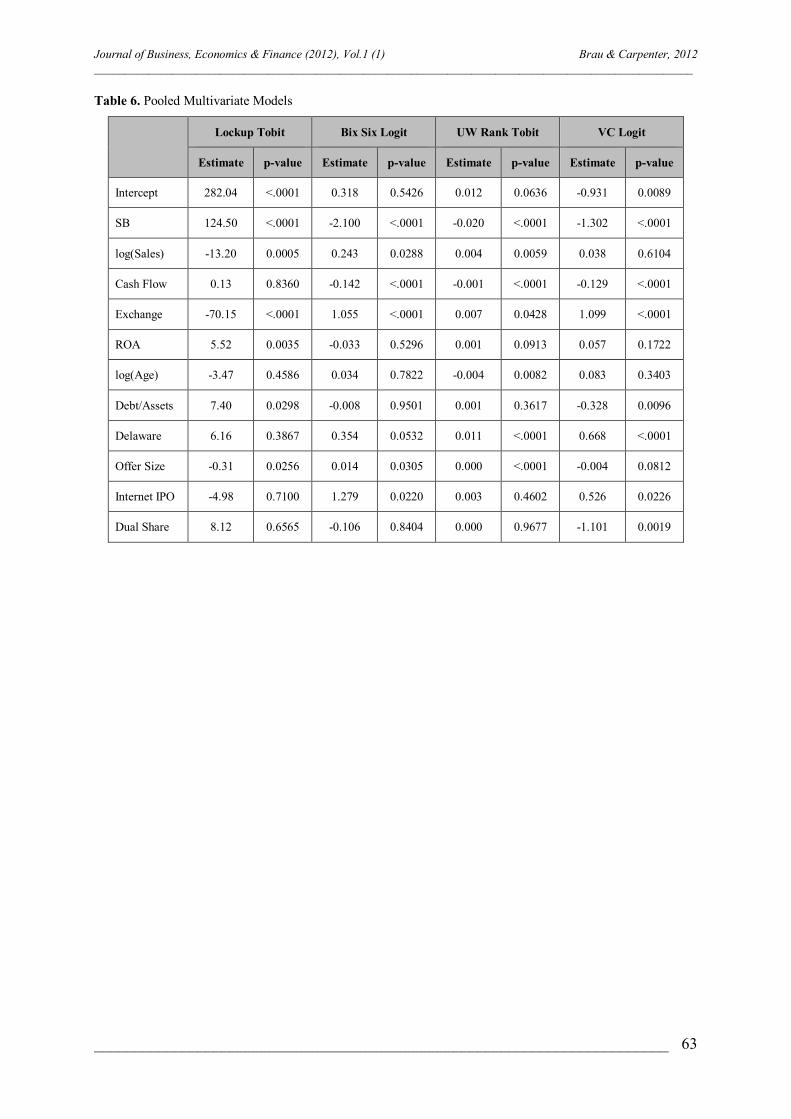
Journal of Business, Economics & Finance (2012), Vol.1 (1) Brau & Carpenter, 2012 ____________________________________________________________________________________________________
________________________________________________________________________
63
Table 6. Pooled Multivariate Models
Lockup Tobit Bix Six Logit UW Rank Tobit VC Logit
Estimate p-value Estimate p-value Estimate p-value Estimate p-value
Intercept 282.04 <.0001 0.318 0.5426 0.012 0.0636 -0.931 0.0089
SB 124.50 <.0001 -2.100 <.0001 -0.020 <.0001 -1.302 <.0001
log(Sales) -13.20 0.0005 0.243 0.0288 0.004 0.0059 0.038 0.6104
Cash Flow 0.13 0.8360 -0.142 <.0001 -0.001 <.0001 -0.129 <.0001
Exchange -70.15 <.0001 1.055 <.0001 0.007 0.0428 1.099 <.0001
ROA 5.52 0.0035 -0.033 0.5296 0.001 0.0913 0.057 0.1722
log(Age) -3.47 0.4586 0.034 0.7822 -0.004 0.0082 0.083 0.3403
Debt/Assets 7.40 0.0298 -0.008 0.9501 0.001 0.3617 -0.328 0.0096
Delaware 6.16 0.3867 0.354 0.0532 0.011 <.0001 0.668 <.0001
Offer Size -0.31 0.0256 0.014 0.0305 0.000 <.0001 -0.004 0.0812
Internet IPO -4.98 0.7100 1.279 0.0220 0.003 0.4602 0.526 0.0226
Dual Share 8.12 0.6565 -0.106 0.8404 0.000 0.9677 -1.101 0.0019
Journal of Business, Economics & Finance (2012), Vol.1 (1) Kaya, 2012 ____________________________________________________________________________________________________
________________________________________________________________________ 64
THE SHORT TERM PERFORMANCE OF INITIAL PUBLIC OFFERINGS IN ISTANBUL STOCK EXCHANGE: 2010 -2011 APPLICATION
Tekiner Kaya Ankara University, Department of Business, Turkey.
KEYWORDS
Initial public offering, Short term abnormal return, Underpricing.
ABSTRACT
Initial public offering (IPO) is one of the ways for companies to obtain funds from investors in market. In that process, investors may obtain abnormal returns in a very short time or big loses in long term based on the pricing of IPO. This empirical study investigates the performances of all IPOs in Istanbul Stock Exchange (ISE) offered between January 2010 and June 2011. Event study methodology was used to measure the short term performance of 32 IPOs and daily, end of week, month, 3 months and 6 months basis time windows were employed. Emprical findings are not in line with previous studies. The results bring out that IPOs provide positive abnormal return only at the end of third day of trading. In addition, no significance relation found among IPOs short term performance and IPO firms’ age, sector operated in, size, and shares sold to foreign investors.
1. INTRODUCTION
The initial public offerings (IPO) which is defined as selling the stocks to the investors at the capital markets to increase their funds are one of the interesting areas in finance. In literature, there are lots of studies on this area. These are generally focused on the reasons of the abnormal returns and performances of IPOs after trading. Findings, which had been found in different markets, sometimes conflict each other. This makes public offerings “a kind of puzzle” in finance area. In literature, finding of empirical studies declare that IPOs provide abnormal returns in short term. In other words, it is concluded that the stocks which will be offered market have been underpriced. On the other hand, it is difficult to determine the exact price of the stock which is not trading in stock exchanges yet. The agencies which ensure the sales of stocks want IPOs underpriced. By the way, Investors who buys IPO in determined lower price have the chance to obtain abnormal returns. However, the price of the valued stocks is expected to be balanced immediately in an efficient market. Based on the study done by Lougrahran and Ritter (1995), long-run returns report that offered equities under-perform benchmark portfolios by approximately 30% over the five year period following listing. In short term, the findings (Ibbotson, 1975 and Weinsten, 1978) state that, the situation of the IPO’s are coming into value immediately in case of the IPO’s offering price is lower than the market price. This shows that the capital market is efficient. When we consider the studies and findings on IPO’s performance in short term, it can be declared that by investing IPO on the advised price, it is possible to obtain abnormal returns in short term, in spite of being the fact that negative return in long term (Copeland at all. 2001). There are three actors that have big roles on pricing stocks: the company that will be offered, investor of the IPO and the agency. IPO companies generally want to sell its stocks with high price that will maximize its cash flow in a typical public offering. The second actor, investors, aims to invest the underpriced stocks which have the abnormal return potential. The final actor, agency, has the role of intervention between investor and the IPO company. The underpricing and high pricing are also undesirable situations for the agency. If the agency determines low price for IPO, while the investors are satisfied, the IPO companies may have bad impression for the agency and the agency may not be preferred in coming public offerings. On the other hand, an investor who has abnormal return expectation can not be able to earn enough. This means the public offering is not satisfactory. In this study, it is aimed to find out the short term performance of the IPOs in Istanbul Stocks Exchange (ISE) between January 2010 and June 2011. The secondary aim of the study is to introduce the effect of the company size, sector operated, the foreigners’ ratio at public offering and company age on IPO performance in short term.
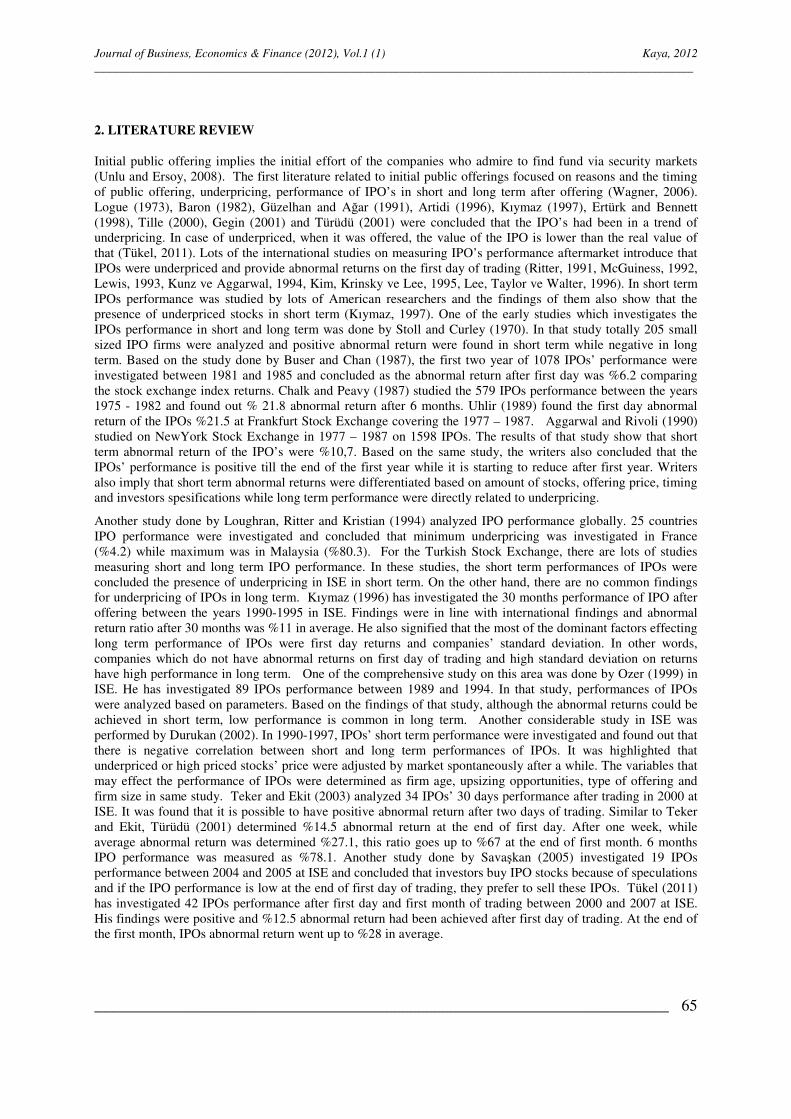
Journal of Business, Economics & Finance (2012), Vol.1 (1) Kaya, 2012 ____________________________________________________________________________________________________
________________________________________________________________________ 65
2. LITERATURE REVIEW
Initial public offering implies the initial effort of the companies who admire to find fund via security markets (Unlu and Ersoy, 2008). The first literature related to initial public offerings focused on reasons and the timing of public offering, underpricing, performance of IPO’s in short and long term after offering (Wagner, 2006). Logue (1973), Baron (1982), Güzelhan and Ağar (1991), Artidi (1996), Kıymaz (1997), Ertürk and Bennett (1998), Tille (2000), Gegin (2001) and Türüdü (2001) were concluded that the IPO’s had been in a trend of underpricing. In case of underpriced, when it was offered, the value of the IPO is lower than the real value of that (Tükel, 2011). Lots of the international studies on measuring IPO’s performance aftermarket introduce that IPOs were underpriced and provide abnormal returns on the first day of trading (Ritter, 1991, McGuiness, 1992, Lewis, 1993, Kunz ve Aggarwal, 1994, Kim, Krinsky ve Lee, 1995, Lee, Taylor ve Walter, 1996). In short term IPOs performance was studied by lots of American researchers and the findings of them also show that the presence of underpriced stocks in short term (Kıymaz, 1997). One of the early studies which investigates the IPOs performance in short and long term was done by Stoll and Curley (1970). In that study totally 205 small sized IPO firms were analyzed and positive abnormal return were found in short term while negative in long term. Based on the study done by Buser and Chan (1987), the first two year of 1078 IPOs’ performance were investigated between 1981 and 1985 and concluded as the abnormal return after first day was %6.2 comparing the stock exchange index returns. Chalk and Peavy (1987) studied the 579 IPOs performance between the years 1975 - 1982 and found out % 21.8 abnormal return after 6 months. Uhlir (1989) found the first day abnormal return of the IPOs %21.5 at Frankfurt Stock Exchange covering the 1977 – 1987. Aggarwal and Rivoli (1990) studied on NewYork Stock Exchange in 1977 – 1987 on 1598 IPOs. The results of that study show that short term abnormal return of the IPO’s were %10,7. Based on the same study, the writers also concluded that the IPOs’ performance is positive till the end of the first year while it is starting to reduce after first year. Writers also imply that short term abnormal returns were differentiated based on amount of stocks, offering price, timing and investors spesifications while long term performance were directly related to underpricing.
Another study done by Loughran, Ritter and Kristian (1994) analyzed IPO performance globally. 25 countries IPO performance were investigated and concluded that minimum underpricing was investigated in France (%4.2) while maximum was in Malaysia (%80.3). For the Turkish Stock Exchange, there are lots of studies measuring short and long term IPO performance. In these studies, the short term performances of IPOs were concluded the presence of underpricing in ISE in short term. On the other hand, there are no common findings for underpricing of IPOs in long term. Kıymaz (1996) has investigated the 30 months performance of IPO after offering between the years 1990-1995 in ISE. Findings were in line with international findings and abnormal return ratio after 30 months was %11 in average. He also signified that the most of the dominant factors effecting long term performance of IPOs were first day returns and companies’ standard deviation. In other words, companies which do not have abnormal returns on first day of trading and high standard deviation on returns have high performance in long term. One of the comprehensive study on this area was done by Ozer (1999) in ISE. He has investigated 89 IPOs performance between 1989 and 1994. In that study, performances of IPOs were analyzed based on parameters. Based on the findings of that study, although the abnormal returns could be achieved in short term, low performance is common in long term. Another considerable study in ISE was performed by Durukan (2002). In 1990-1997, IPOs’ short term performance were investigated and found out that there is negative correlation between short and long term performances of IPOs. It was highlighted that underpriced or high priced stocks’ price were adjusted by market spontaneously after a while. The variables that may effect the performance of IPOs were determined as firm age, upsizing opportunities, type of offering and firm size in same study. Teker and Ekit (2003) analyzed 34 IPOs’ 30 days performance after trading in 2000 at ISE. It was found that it is possible to have positive abnormal return after two days of trading. Similar to Teker and Ekit, Türüdü (2001) determined %14.5 abnormal return at the end of first day. After one week, while average abnormal return was determined %27.1, this ratio goes up to %67 at the end of first month. 6 months IPO performance was measured as %78.1. Another study done by Savaşkan (2005) investigated 19 IPOs performance between 2004 and 2005 at ISE and concluded that investors buy IPO stocks because of speculations and if the IPO performance is low at the end of first day of trading, they prefer to sell these IPOs. Tükel (2011) has investigated 42 IPOs performance after first day and first month of trading between 2000 and 2007 at ISE. His findings were positive and %12.5 abnormal return had been achieved after first day of trading. At the end of the first month, IPOs abnormal return went up to %28 in average.
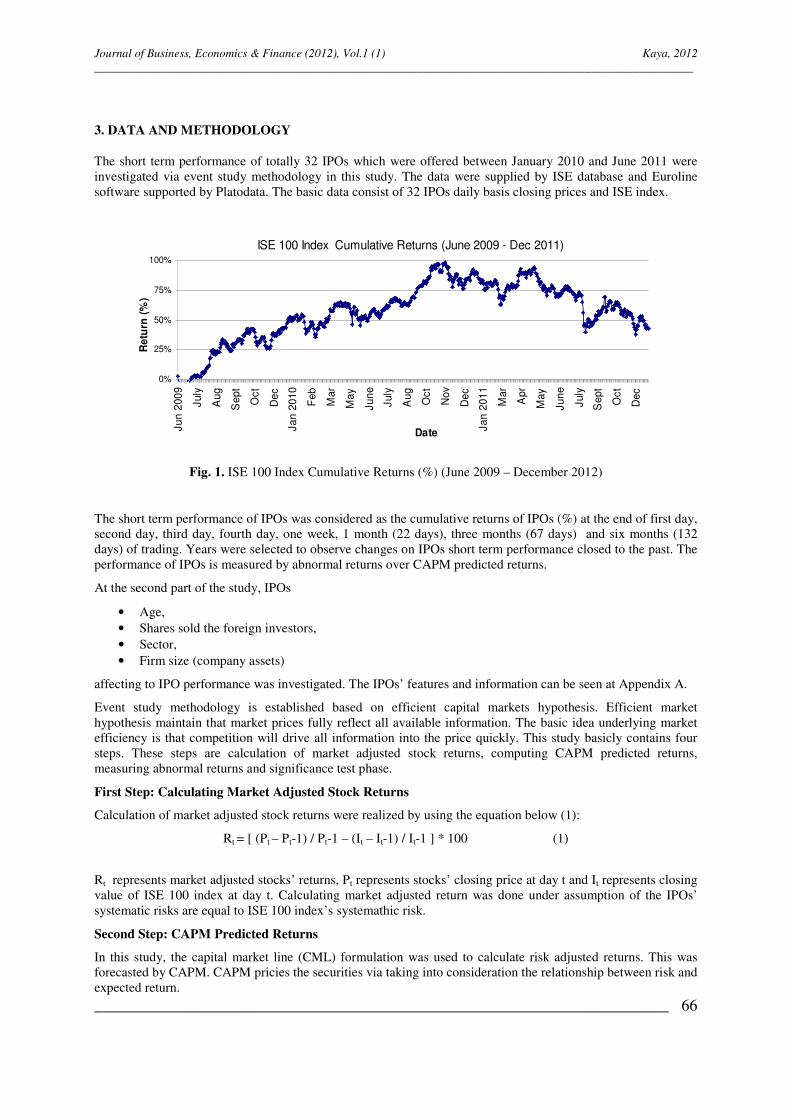
Journal of Business, Economics & Finance (2012), Vol.1 (1) Kaya, 2012 ____________________________________________________________________________________________________
________________________________________________________________________ 66
3. DATA AND METHODOLOGY
The short term performance of totally 32 IPOs which were offered between January 2010 and June 2011 were investigated via event study methodology in this study. The data were supplied by ISE database and Euroline software supported by Platodata. The basic data consist of 32 IPOs daily basis closing prices and ISE index.
ISE 100 Index Cumulative Returns (June 2009 - Dec 2011)
0%
25%
50%
75%
100%
Ju
n 2
00
9
July
Au
g
Se
pt
Oct
De
c
Ja
n 2
01
0
Fe
b
Mar
Ma
y
Jun
e
July
Au
g
Oct
Nov
De
c
Ja
n 2
01
1
Mar
Apr
Ma
y
Jun
e
July
Se
pt
Oct
De
c
Date
Re
turn
(%
)
Fig. 1. ISE 100 Index Cumulative Returns (%) (June 2009 – December 2012)
The short term performance of IPOs was considered as the cumulative returns of IPOs (%) at the end of first day, second day, third day, fourth day, one week, 1 month (22 days), three months (67 days) and six months (132 days) of trading. Years were selected to observe changes on IPOs short term performance closed to the past. The performance of IPOs is measured by abnormal returns over CAPM predicted returns.
At the second part of the study, IPOs
• Age, • Shares sold the foreign investors, • Sector, • Firm size (company assets)
affecting to IPO performance was investigated. The IPOs’ features and information can be seen at Appendix A.
Event study methodology is established based on efficient capital markets hypothesis. Efficient market hypothesis maintain that market prices fully reflect all available information. The basic idea underlying market efficiency is that competition will drive all information into the price quickly. This study basicly contains four steps. These steps are calculation of market adjusted stock returns, computing CAPM predicted returns, measuring abnormal returns and significance test phase.
First Step: Calculating Market Adjusted Stock Returns
Calculation of market adjusted stock returns were realized by using the equation below (1):
Rt = [ (Pt – Pt-1) / Pt-1 – (It – It-1) / It-1 ] * 100 (1)
Rt represents market adjusted stocks’ returns, Pt represents stocks’ closing price at day t and It represents closing value of ISE 100 index at day t. Calculating market adjusted return was done under assumption of the IPOs’ systematic risks are equal to ISE 100 index’s systemathic risk.
Second Step: CAPM Predicted Returns
In this study, the capital market line (CML) formulation was used to calculate risk adjusted returns. This was forecasted by CAPM. CAPM pricies the securities via taking into consideration the relationship between risk and expected return.
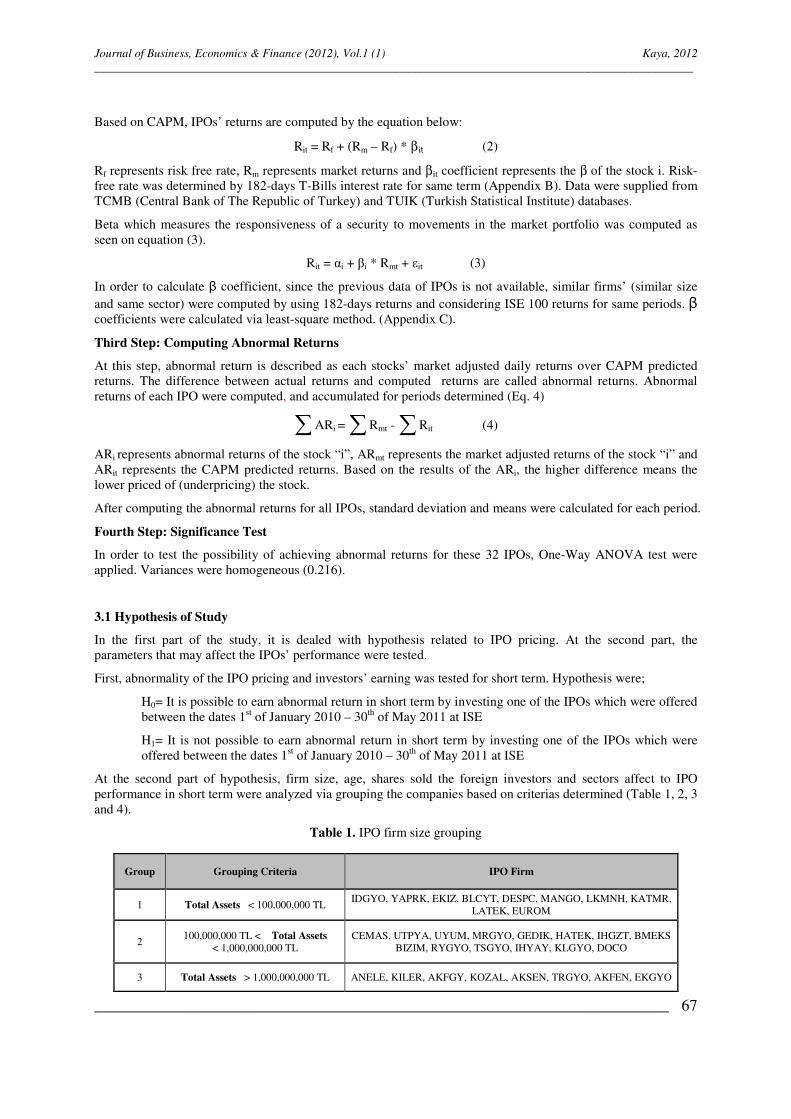
Journal of Business, Economics & Finance (2012), Vol.1 (1) Kaya, 2012 ____________________________________________________________________________________________________
________________________________________________________________________ 67
Based on CAPM, IPOs’ returns are computed by the equation below:
Rit = Rf + (Rm – Rf) * βit (2)
Rf represents risk free rate, Rm represents market returns and βit coefficient represents the β of the stock i. Risk-free rate was determined by 182-days T-Bills interest rate for same term (Appendix B). Data were supplied from TCMB (Central Bank of The Republic of Turkey) and TUIK (Turkish Statistical Institute) databases.
Beta which measures the responsiveness of a security to movements in the market portfolio was computed as seen on equation (3).
Rit = αi + βi * Rmt + εit (3)
In order to calculate β coefficient, since the previous data of IPOs is not available, similar firms’ (similar size and same sector) were computed by using 182-days returns and considering ISE 100 returns for same periods. β coefficients were calculated via least-square method. (Appendix C).
Third Step: Computing Abnormal Returns
At this step, abnormal return is described as each stocks’ market adjusted daily returns over CAPM predicted returns. The difference between actual returns and computed returns are called abnormal returns. Abnormal returns of each IPO were computed, and accumulated for periods determined (Eq. 4)
∑ ARi = ∑ Rmt - ∑ Rit (4)
ARi represents abnormal returns of the stock “i”, ARmt represents the market adjusted returns of the stock “i” and ARit represents the CAPM predicted returns. Based on the results of the ARi, the higher difference means the lower priced of (underpricing) the stock.
After computing the abnormal returns for all IPOs, standard deviation and means were calculated for each period.
Fourth Step: Significance Test
In order to test the possibility of achieving abnormal returns for these 32 IPOs, One-Way ANOVA test were applied. Variances were homogeneous (0.216).
3.1 Hypothesis of Study
In the first part of the study, it is dealed with hypothesis related to IPO pricing. At the second part, the parameters that may affect the IPOs’ performance were tested.
First, abnormality of the IPO pricing and investors’ earning was tested for short term. Hypothesis were;
H0= It is possible to earn abnormal return in short term by investing one of the IPOs which were offered between the dates 1st of January 2010 – 30th of May 2011 at ISE
H1= It is not possible to earn abnormal return in short term by investing one of the IPOs which were offered between the dates 1st of January 2010 – 30th of May 2011 at ISE
At the second part of hypothesis, firm size, age, shares sold the foreign investors and sectors affect to IPO performance in short term were analyzed via grouping the companies based on criterias determined (Table 1, 2, 3 and 4).
Table 1. IPO firm size grouping
Group Grouping Criteria IPO Firm
1 Total Assets < 100,000,000 TL IDGYO, YAPRK, EKIZ, BLCYT, DESPC, MANGO, LKMNH, KATMR,
LATEK, EUROM
2 100,000,000 TL < Total Assets
< 1,000,000,000 TL CEMAS, UTPYA, UYUM, MRGYO, GEDIK, HATEK, IHGZT, BMEKS
BIZIM, RYGYO, TSGYO, IHYAY, KLGYO, DOCO
3 Total Assets > 1,000,000,000 TL ANELE, KILER, AKFGY, KOZAL, AKSEN, TRGYO, AKFEN, EKGYO

Journal of Business, Economics & Finance (2012), Vol.1 (1) Kaya, 2012 ____________________________________________________________________________________________________
________________________________________________________________________ 68
Table 2. Grouping IPO firms based on ages
Group Grouping Criteria IPO Firm
1 Firm age < 12 RYGYO, IDGYO, TSGYO, KLGYO, YAPRK, IHYAY, BIZIM, MANGO, IHGZT, BLCYT
2 12 < Firm age < 20 LATEK, UYUM, AKSEN, DOCO, AKFGY, EUROM, TRGYO, LKMNH, DESPC, KILER
3 Firm age > 20 GEDIK, EKGYO, UTPYA, BMEKS, MRGYO, ANELE, KOZAL, KATMR, EKIZ, AKFEN, CEMAS, HATEK
Table 3. Grouping IPOs based on the ratios of shares sold the foreign investors (%)
Group Grouping Criteria
(Shares sold the foreign investors - %) IPO Firm
1 Ratio < 10% LATEK, MANGO, IHGZT, CEMAS, KATMR, EUROM, HATEK, YAPRK, BLCYT, GEDIK, IHYAY, EKIZ, LKMNH, IDGYO, TRGYO
2 10%< Ratio < 40% MRGYO, AKSEN, RYGYO, UTPYA, DESPC, ANELE, UYUM, KLGYO, BMEKS
3 Ratio > 40% KOZAL, TSGYO, AKFGY, KILER, AKFEN, DOCO, EKGYO, BIZIM
Table 4. Sector operated in
Group Sector IPO Firm
1 Training, health and social services LKMNH, DOCO
2 Energy and construction ASKEN, ANELE, UTPYA
3 Food, beverages and tobacco MANGO, UYUM, YAPRK
4 Holding and investment corporates AFKEN, EUROM
5 Paper, paper products, press and publication KOZAL, IHGZT, IHYAY
6 Chemical, petroleum, rubber and plastics HATEK, EKIZ,
7 Metal goods, machine and equipment manuf.
CEMAS, KATMR
8 Retail KILER, BIZIM, BMEKS
9 Technology DESPC
10 Transportation, communication and warehousing
LATEK
11 Investment partnership TSGYO, IDGYO, RYGYO, MRGYO, TRGYO, EKGYO, KLGYO, AKFGY, GEDIK, BLCYT
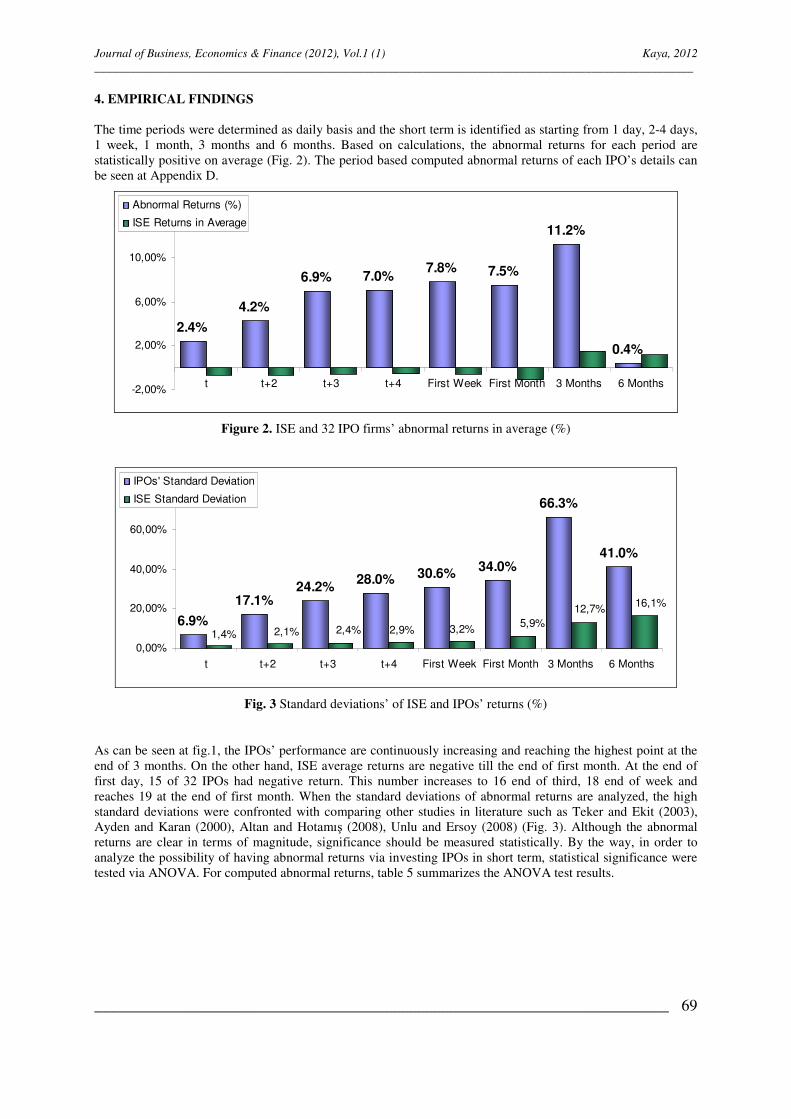
Journal of Business, Economics & Finance (2012), Vol.1 (1) Kaya, 2012 ____________________________________________________________________________________________________
________________________________________________________________________ 69
4. EMPIRICAL FINDINGS
The time periods were determined as daily basis and the short term is identified as starting from 1 day, 2-4 days, 1 week, 1 month, 3 months and 6 months. Based on calculations, the abnormal returns for each period are statistically positive on average (Fig. 2). The period based computed abnormal returns of each IPO’s details can be seen at Appendix D.
0.4%
11.2%
7.5%7.8%7.0%6.9%
4.2%
2.4%
-2,00%
2,00%
6,00%
10,00%
14,00%
t t+2 t+3 t+4 First Week First Month 3 Months 6 Months
Abnormal Returns (%)
ISE Returns in Average
Figure 2. ISE and 32 IPO firms’ abnormal returns in average (%)
3,2%
41.0%
66.3%
34.0%30.6%28.0%
24.2%17.1%
6.9%2,9%2,4%2,1%1,4%
16,1%12,7%
5,9%
0,00%
20,00%
40,00%
60,00%
80,00%
t t+2 t+3 t+4 First Week First Month 3 Months 6 Months
IPOs' Standard Deviation
ISE Standard Deviation
Fig. 3 Standard deviations’ of ISE and IPOs’ returns (%)
As can be seen at fig.1, the IPOs’ performance are continuously increasing and reaching the highest point at the end of 3 months. On the other hand, ISE average returns are negative till the end of first month. At the end of first day, 15 of 32 IPOs had negative return. This number increases to 16 end of third, 18 end of week and reaches 19 at the end of first month. When the standard deviations of abnormal returns are analyzed, the high standard deviations were confronted with comparing other studies in literature such as Teker and Ekit (2003), Ayden and Karan (2000), Altan and Hotamış (2008), Unlu and Ersoy (2008) (Fig. 3). Although the abnormal returns are clear in terms of magnitude, significance should be measured statistically. By the way, in order to analyze the possibility of having abnormal returns via investing IPOs in short term, statistical significance were tested via ANOVA. For computed abnormal returns, table 5 summarizes the ANOVA test results.
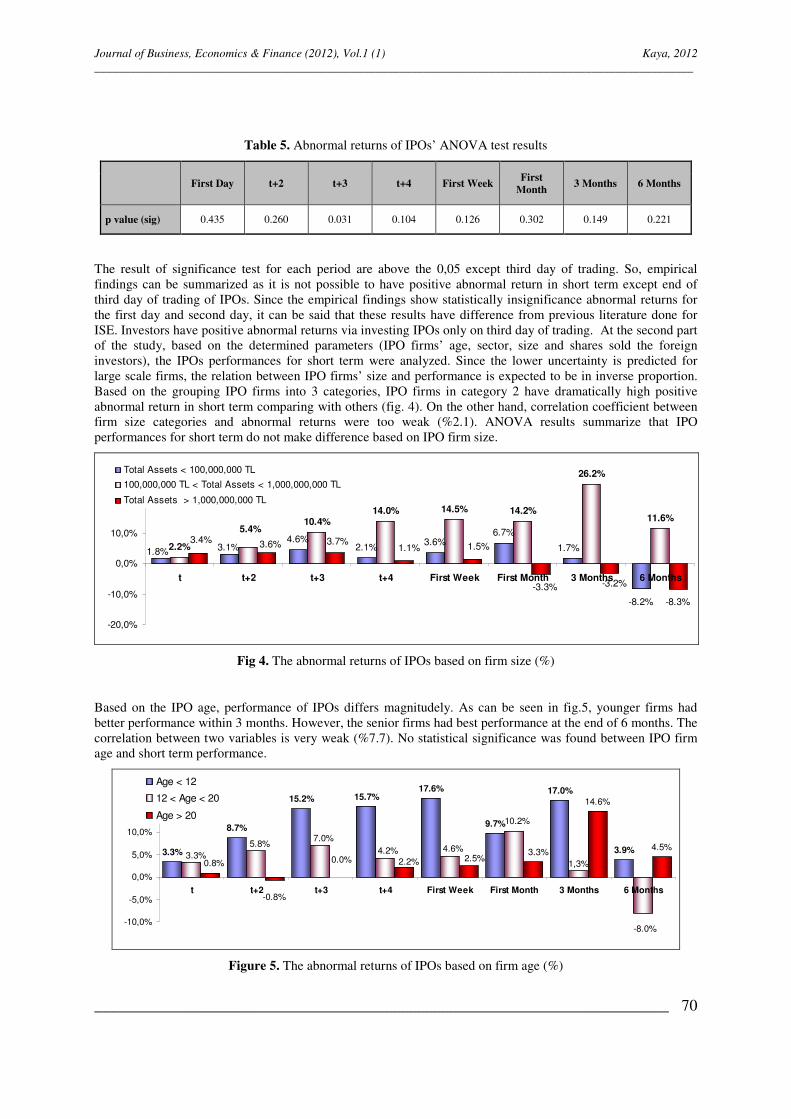
Journal of Business, Economics & Finance (2012), Vol.1 (1) Kaya, 2012 ____________________________________________________________________________________________________
________________________________________________________________________ 70
Table 5. Abnormal returns of IPOs’ ANOVA test results
First Day t+2 t+3 t+4 First Week
First Month
3 Months 6 Months
p value (sig) 0.435 0.260 0.031 0.104 0.126 0.302 0.149 0.221
The result of significance test for each period are above the 0,05 except third day of trading. So, empirical findings can be summarized as it is not possible to have positive abnormal return in short term except end of third day of trading of IPOs. Since the empirical findings show statistically insignificance abnormal returns for the first day and second day, it can be said that these results have difference from previous literature done for ISE. Investors have positive abnormal returns via investing IPOs only on third day of trading. At the second part of the study, based on the determined parameters (IPO firms’ age, sector, size and shares sold the foreign investors), the IPOs performances for short term were analyzed. Since the lower uncertainty is predicted for large scale firms, the relation between IPO firms’ size and performance is expected to be in inverse proportion. Based on the grouping IPO firms into 3 categories, IPO firms in category 2 have dramatically high positive abnormal return in short term comparing with others (fig. 4). On the other hand, correlation coefficient between firm size categories and abnormal returns were too weak (%2.1). ANOVA results summarize that IPO performances for short term do not make difference based on IPO firm size.
6.7%3.6%
2.1%4.6%
1.7%3.1%1.8%
-8.2%
2.2%
10.4%14.0% 14.5% 14.2%
26.2%
11.6%5.4%
1.5%3.7%3.6%3.4%
-8.3%
-3.2%-3.3%
1.1%
-20,0%
-10,0%
0,0%
10,0%
20,0%
30,0%
t t+2 t+3 t+4 First Week First Month 3 Months 6 Months
Total Assets < 100,000,000 TL
100,000,000 TL < Total Assets < 1,000,000,000 TL
Total Assets > 1,000,000,000 TL
Fig 4. The abnormal returns of IPOs based on firm size (%)
Based on the IPO age, performance of IPOs differs magnitudely. As can be seen in fig.5, younger firms had better performance within 3 months. However, the senior firms had best performance at the end of 6 months. The correlation between two variables is very weak (%7.7). No statistical significance was found between IPO firm age and short term performance.
3.9%
17.0%
9.7%
17.6%15.7%15.2%
8.7%
3.3%
10.2%
-8.0%
1,3%
4.6%4.2%
7.0%5.8%
3.3%4.5%
14.6%
3.3%2.5%2.2%0.0%0.8%
-0.8%
-10,0%
-5,0%
0,0%
5,0%
10,0%
15,0%
20,0%
t t+2 t+3 t+4 First Week First Month 3 Months 6 Months
Age < 12
12 < Age < 20
Age > 20
Figure 5. The abnormal returns of IPOs based on firm age (%)
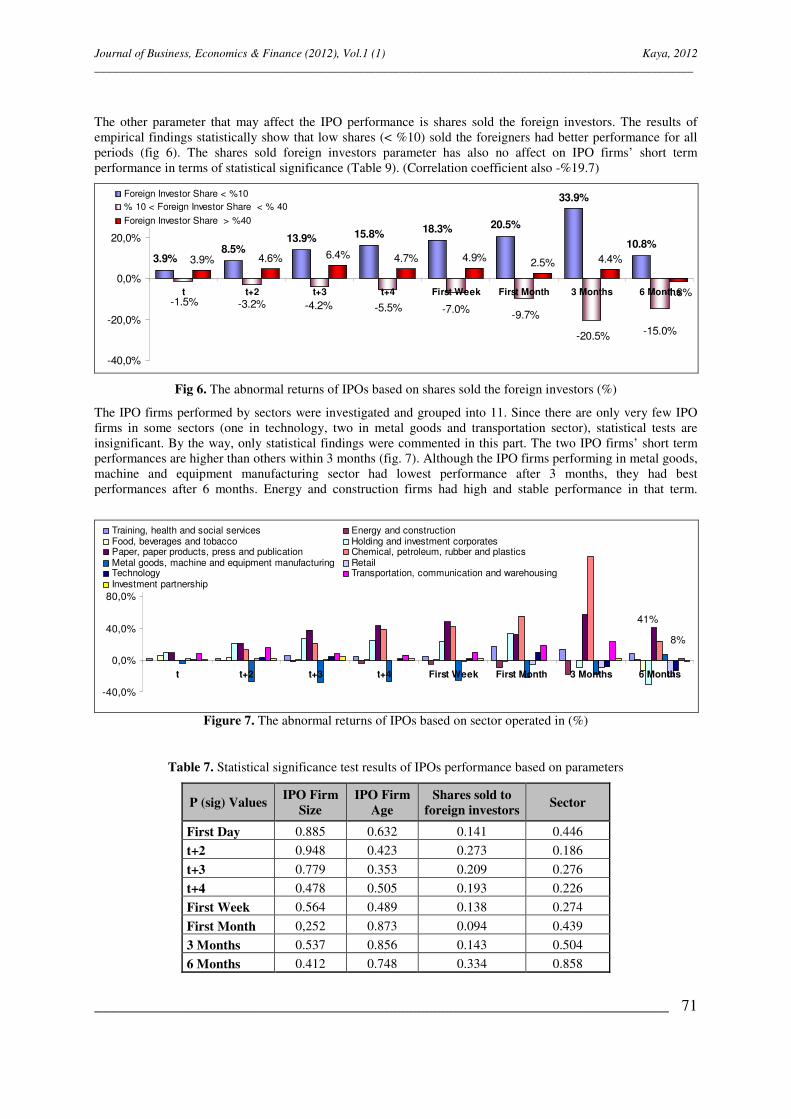
Journal of Business, Economics & Finance (2012), Vol.1 (1) Kaya, 2012 ____________________________________________________________________________________________________
________________________________________________________________________ 71
The other parameter that may affect the IPO performance is shares sold the foreign investors. The results of empirical findings statistically show that low shares (< %10) sold the foreigners had better performance for all periods (fig 6). The shares sold foreign investors parameter has also no affect on IPO firms’ short term performance in terms of statistical significance (Table 9). (Correlation coefficient also -%19.7)
8.5%13.9% 15.8% 18.3% 20.5%
33.9%
10.8%
3.9%
-1.5% -3.2% -4.2% -5.5%
-20.5%
-7.0%-9.7%
-15.0%
-1.8%
4.4%2.5%4.9%4.7%6.4%4.6%3.9%
-40,0%
-20,0%
0,0%
20,0%
40,0%
t t+2 t+3 t+4 First Week First Month 3 Months 6 Months
Foreign Investor Share < %10
% 10 < Foreign Investor Share < % 40
Foreign Investor Share > %40
Fig 6. The abnormal returns of IPOs based on shares sold the foreign investors (%)
The IPO firms performed by sectors were investigated and grouped into 11. Since there are only very few IPO firms in some sectors (one in technology, two in metal goods and transportation sector), statistical tests are insignificant. By the way, only statistical findings were commented in this part. The two IPO firms’ short term performances are higher than others within 3 months (fig. 7). Although the IPO firms performing in metal goods, machine and equipment manufacturing sector had lowest performance after 3 months, they had best performances after 6 months. Energy and construction firms had high and stable performance in that term.
41%
8%
-40,0%
0,0%
40,0%
80,0%
120,0%
160,0%
t t+2 t+3 t+4 First Week First Month 3 Months 6 Months
Training, health and social services Energy and constructionFood, beverages and tobacco Holding and investment corporatesPaper, paper products, press and publication Chemical, petroleum, rubber and plasticsMetal goods, machine and equipment manufacturing RetailTechnology Transportation, communication and warehousingInvestment partnership
Figure 7. The abnormal returns of IPOs based on sector operated in (%)
Table 7. Statistical significance test results of IPOs performance based on parameters
P (sig) Values IPO Firm
Size IPO Firm
Age Shares sold to
foreign investors Sector
First Day 0.885 0.632 0.141 0.446
t+2 0.948 0.423 0.273 0.186
t+3 0.779 0.353 0.209 0.276
t+4 0.478 0.505 0.193 0.226
First Week 0.564 0.489 0.138 0.274
First Month 0,252 0.873 0.094 0.439
3 Months 0.537 0.856 0.143 0.504
6 Months 0.412 0.748 0.334 0.858
Journal of Business, Economics & Finance (2012), Vol.1 (1) Kaya, 2012 ____________________________________________________________________________________________________
________________________________________________________________________ 72
5. CONCLUSION
In literature, it is generally found out that investors who invest IPOs have positive abnormal returns without influencing related countries’ features or time period of study. This may be explained in two ways: IPOs might be underpriced or the price of IPO is not relalistic aftermarket. The statistical results of this study show that 15 of 32 IPO firms had negative performance after first day. This number increased up to 19 as of end of first month. These results are not in line with previous studies which were done for ISE and found absolute positive abnormal returns. One of the reasons behind this result may be price marjin/range regulations at ISE. Eventhough statistically abnormal returns were found, investors only had significant positive abnormal returns at the end of third day of trading. Considering the periods, till the end of third month, the abnormal returns moved in increasing trend. After than, it starts to decrease as similar to the study done by Karan and Ayden (2000). Another finding of the study was that the performance of IPOs does not differ based on firm size, age, sector operated and foreigners ratio in offerings in short term. But statistically it is possible to touch some empirical findings such as, young firms, IPO firms whose shares less than %10 had been sold to foreign investors had better performance than others in short term. In case the foreigners share is high (up to %40), IPOs had a stable performance in short term. For the periods under consideration, high standard deviations of abnormal returns comparing with previous studies highlight the importance of portfolio selection for investors.
REFERENCES
Aggarwal, R. And Rivoli, P., (1990), “ Fads In The Initial Public Offering Market?”, Financial Management, vol:5, 45-57.
Altan, M., Hotamış, T.N., (2008), “Türkiye’de Halka İlk Arzı Yapılan Hisse Senetlerinin Kısa Dönem Fiyat Performans Analizi (2000-2006), KMU İİBF Dergisi, Year: 10, 14.
Bildik, R., ve Yılmaz M.K., (2006), “The Market Performance of Initial Public Offerings in the İstanbul Stock Exchange”, Social Science Electronic Publishing, Inc, JEL Classifications, Working Paper Series.
Copeland, T.E., Weston, J.F., Shadtri, K, (2001), Financial Theory and Corporate Policy, Chapter 10, Forth Edition, Pearson/Addison Wesley.
Daştan, D., (2008), “Halka Arzda Fiyatlandırma: 2004 – 2007 İMKB Örneği”, M.S Thesis, Ankara Üniversitesi.
Durukan, M.B., 2002, “The Relationship Between IPO Returns and Factors Influencing IPO Performance: Case of Istanbul Stock Exchange”, Managerial Finance 28, 18-38.
Ibbotson, R.G., (1975), “Price performance of common stock new issues”, Journal of Financial Economics, 3, 235-272.
Karan, M.B., Ayden, T., (2000), “İMKB’de İlk Halka Arzların Uzun Vadeli Fiyat Performanslarının Ölçülmesi”, Gazi University İİBF Dergisi, 3, 87-96.
Kıymaz, H., (1996), “Halka İlk Kez Arz Edilen Hisse Senetlerinin Performansları: İMKB İmalat Sektörü Uygulaması”, İşletme ve Finans Dergisi, İsletme ve Finans Yayınları, No.4, 121-143.
Kıymaz, H., (1997), “İMKB’de Halka Arz Edilen Mali Sektör Hisselerinin Uzun Dönem Performansları: 1990 – 1995 Uygulaması, Hazine Dergisi, 7, 1-18.
Ljungqvist, A.P., (2004), “IPO Underpricing”, Handbooks in Finance: Emprical Corporate Finance Chapter 3, Newyork.
Loughran, T., Ritter, J. R., & Kristian, R., (1995)., Initial public offerings: International insights. Pacific-Basin Finance Journal, 2, 165−199.
Özer, B., 1999, “Price Performance of Initial Public Offerings in Turkey”, SPK Yayınları, 128, Ankara.
Sağlam, G.Y., ve Çelik, A.E., (2011), “İMKB’de Düşük Fiyatlandırma ve Aracılık Türü, Arz Yılı, Aracı Kurum Etkileri Üzerine Bir Araştırma”, Doğuş Üniversitesi Dergisi, 12(2), 289-303.
Savaşkan, O., (2005 ), Halka Arz Fiyatının Belirlenmesinde Kullanılan Yöntemler, Halka Arz Sonrası Hisse Senedi Performansı, SPK Yeterlilik Etüdü, İstanbul.
Teker, S. ve Ö. Ekit., (2003), “The Performance of IPOs in İstanbul Stock Exchange in Year 2000”, Doğuş Üniversitesi Dergisi, 4 (1), 117-128.

Journal of Business, Economics & Finance (2012), Vol.1 (1) Kaya, 2012 ____________________________________________________________________________________________________
________________________________________________________________________ 73
Türüdü, E., (2001), Ülkemizde İlk Kez Halka Arz Edilen Hisse Senetlerinin Fiyat Performansı ve Diğer Ülkelerle Karşılaştırılması, Yayınlanmamış Yüksek Lisans Tezi, GaziÜniversitesi, Sosyal Bilimler Enstitüsü, Ankara.
Ünlü, U. ve Ersoy, E., (2008), “İlk Halka Arzlarda DüĢük Fiyatlama ve Kısa Dönem Performansın Belirleyicileri: 1995- 2008 İMKB Örneği”, Dokuz Eylül Üniversitesi İİBF Dergisi, 2, 243-258.
Wagner, N., (2006), “Nasdaq IPOs Around the Market Peak In 2000”, Initial Public Offerings: An International Perspective, Quantitative Finance Series, 3-11.
Weinsten, M., (1978), The seasoning process of new corporate bonds, Journal of finance, 1343-1354.
http://www.imkb.org.tr
http://www.tcmb.gov.tr/
http://www.tuik.gov.tr/ APPENDIX A.
IPO companies’ features offered between January 2010 and June 2011
No IPO Firm Name of Trading at ISE
Type of Public
Offering
Offering Ratio (%)
Offering Price (TL)
Issue Date
Shares Sold to Foreign Investors
(%)
Firm Value (TL)
Firm Age
Sector Assets (TL) (year: 2011)
1 KOZA ALTIN İŞL.
KOZAL New common
shares 30.0 36.80 12.02.2010 40.00 4,407,250,000 27
Paper, paper products, press and publication
1,164,195,917
2 TSKB GYO TSGYO
Sales of major shareholders
and new common
shares
38.3 1.05 09.04.2010 48.00 84,000,000 6 Real asset investment partnership
337,178,826
3 LATEK LOJİSTİK TİCARET
LATEK
Sales of major shareholders
and new common
shares
26.7 3.96 27.04.2010 0.00 62,015,000 13 Transportation, communication
and warehousing 68,889,310
4 AKFEN HOLDİNG
AKFEN
Sales of major shareholders
and new common
shares
7.1 12.50 14.05.2010 56.00 1,152,360,000 36 Holding and investment corporates
3,719,066,000
5 AKSA ENERJİ ÜRETİM
AKSEN
Sales of major shareholders
and new common
shares
5.5 4.90 21.05.2010 18.35 1,819,125,000 15 Electricity, gases
and water 2,384,600,207
6 MANGO GIDA SANAYİ VE TİCARET
MANGO Sales of major shareholders
34.0 3.60 24.05.2010 0.00 33,000,000 12 Food, beverages
and tobacco 51,587,155
7 İHLAS GAZETECİLİK
IHGZT New common
shares 33.0 1.65 14.06.2010 0.00 120,000,000 12
Paper, paper products, press and publication
244,652,034
8
ANEL ELEKTRİK PROJE TAAH VE TİC.
ANELE
Sales of major shareholders
and new common shares
39.5 5.30 16.06.2010 29.44 213,400,000 26 Construction 550,241,351
9 EURO YATIRIM MENKUL DEĞERLER
EUROM New common
shares 25.0 1.71 21.06.2010 0.00 54,000,000 16
Holding and investment corporates
80,690,947
10 İDEALİST GAYRİMENKUL
IDGYO New common
shares 25.0 1.27 01.07.2010 3.56 36,100,000 5
Real asset investment partnership
9,448,189
11 ÇEMAŞ DÖKÜM SANAYİİ
CEMAS
Sales of major shareholders
and new common shares
40.0 2.14 02.07.2010 0.00 107,250,000 36
Metal goods, machine and equipment
manufacturing
113,794,375
12
REYSAŞ GAYRİMENKUL YATIRIM ORTAKLIĞI
RYGYO Sales of major shareholders
38.5 1.00 12.07.2010 20.38 124,100,000 4 Real asset investment partnership
297,077,075

Journal of Business, Economics & Finance (2012), Vol.1 (1) Kaya, 2012 ____________________________________________________________________________________________________
________________________________________________________________________ 74
13 EKİZ YAĞ VE SABUN SANAYİİ
EKIZ
Sales of major shareholders
and new common shares
28.6 6.65 20.07.2010 0.22 19,954,087 33
Chemical, petroleum, rubber and
plastics
42,670,150
14
GEDİK YATIRIM MENKUL DEĞERLER
GEDIK New common
shares 15.0 1.58 29.07.2010 0.00 86,112,000 21
Investment partnership
163,083,460
15
MARTI GAYRİMENKUL YATIRIM ORTAKLIĞI
MRGYO Sales of major shareholders
49.1 1.42 24.09.2010 13.57 64,900,000 25 Real asset investment partnership
160,202,294
16
TORUNLAR GAYRİMENKUL YATIRIM ORTAKLIĞI
TRGYO
Sales of major shareholders
and new common shares
25.2 7.30 21.10.2010 5.31 893,760,000 16 Real asset investment partnership
3,203,839,000
17 İHLAS YAYIN HOLDİNG
IHYAY New common
shares 28.8 1.30 05.11.2010 0.05 134,000,000 9
Paper, paper products, press and publication
342,508,308
18
KATMERCİLER ARAÇ ÜSTÜ EKİPMAN SANAYİ VE TİCARET
KATMR
Sales of major shareholders
and new common shares
24.0 6.00 11.11.2010 0.00 70,500,000 27
Metal goods, machine and equipment
manufacturing
59,549,723
19
UYUM GIDA ve İHTİYAÇ MADDELERİ SANAYİ ve TİCARET
UYUM Sales of major shareholders
30.0 8.75 22.11.2010 31.27 142,800,000 14 Food, beverages
and tobacco 143,438,381
20
EMLAK KONUT GAYRİMENKUL YATIRIM ORTAKLIĞI
EKGYO Sales of major shareholders
25.0 1.70 02.12.2010 75.00 5,025,000,000 22 Real asset investment partnership
7,115,450,000
21
DO&CO RESTAURANTS AND CATERİNG AG
DOCO
Sales of major shareholders
and new common shares
31.9 43.18 02.12.2010 70.00 628,488,000 15 Restaurant and accommodation
439,420,000
22
DESPEC BİLGİSAYAR PAZARLAMA VE TİCARET
DESPC
Sales of major shareholders
and new common shares
21.8 7.15 08.12.2010 23.68 47,035,000 17 Technology 51,151,853
23 HATEKS TEKSTİL İŞLETMELERİ
HATEK
Sales of major shareholders
and new common shares
15.5 4.25 17.01.2011 0.00 131,040,000 39 Textile, clothing
and leather 182,371,934
24
KİLER ALIŞMERİŞ HİZMETLERİ GIDA
KILER
Sales of major shareholders
and new common shares
15.0 6.10 27.01.2011 54.90 360,781,600 18 Retail 602,636,000
25
LOKMAN HEKİM SAĞLIK TUR. EĞİTİM HİZ. VE İNŞ.
LKMNH Sales of major shareholders
20.0 4.13 01.02.2011 3.14 39,200,000 16 Training, health
and social services
57,625,213
26 BİZİM TOPTAN SATIŞ MAĞAZALARI
BIZIM New common
shares 40.0 25.00 03.02.2011 80.00 802,000,000 11 Retail 279,646,707
27
ÜTOPYA TURİZM İNŞAAT İŞLETMECİLİK TİC.
UTPYA
Sales of major shareholders
and new common shares
22.0 3.86 24.02.2011 22.55 68,500,000 22 Construction 137,287,403
28 BİMEKS BİLGİ İŞLEM VE DIŞ TİC.
BMEKS
Sales of major shareholders
and new common shares
31.7 4.50 14.04.2011 36.00 142,800,000 22 Retail 251,722,878
29 KİLER G. MENKUL YAT. ORTAKLIĞI
KLGYO
Sales of major shareholders
and new common shares
34.5 6.10 20.04.2011 34.80 224,000,000 7 Real asset investment partnership
422,104,942
30 AKFEN G. MENKUL YAT. ORTAKLIĞI
AKFGY
Sales of major shareholders
and new common shares
29.4 2.28 11.05.2011 50.00 268,640,000 15 Real asset investment partnership
747,542,000
31 YAPRAK SÜT VE BESİ ÇİFTLİKLERİ
YAPRK
Sales of major shareholders
and new common shares
26.1 6.00 13.05.2011 0.00 32,660,000 8 Food, beverages
and tobacco 16,387,766
32 BİLİCİ YATIRIM SAN. VE TİC.
BLCYT Sales of major shareholders
33.1 2.70 17.05.2011 0.00 67,500,000 12 Investment partnership
46,597,952
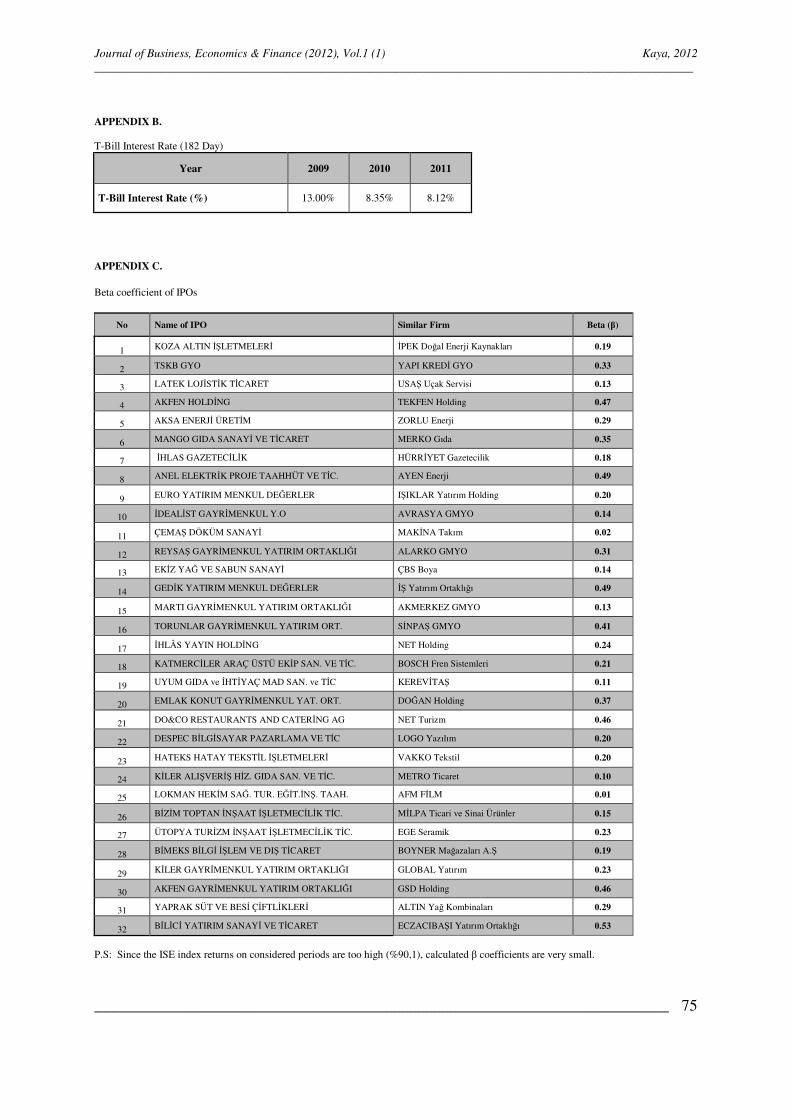
Journal of Business, Economics & Finance (2012), Vol.1 (1) Kaya, 2012 ____________________________________________________________________________________________________
________________________________________________________________________ 75
APPENDIX B. T-Bill Interest Rate (182 Day)
Year 2009 2010 2011
T-Bill Interest Rate (%) 13.00% 8.35% 8.12%
APPENDIX C.
Beta coefficient of IPOs
No Name of IPO Similar Firm Beta (β)
1 KOZA ALTIN İŞLETMELERİ İPEK Doğal Enerji Kaynakları 0.19
2 TSKB GYO YAPI KREDİ GYO 0.33
3 LATEK LOJİSTİK TİCARET USAŞ Uçak Servisi 0.13
4 AKFEN HOLDİNG TEKFEN Holding 0.47
5 AKSA ENERJİ ÜRETİM ZORLU Enerji 0.29
6 MANGO GIDA SANAYİ VE TİCARET MERKO Gıda 0.35
7 İHLAS GAZETECİLİK HÜRRİYET Gazetecilik 0.18
8 ANEL ELEKTRİK PROJE TAAHHÜT VE TİC. AYEN Enerji 0.49
9 EURO YATIRIM MENKUL DEĞERLER IŞIKLAR Yatırım Holding 0.20
10 İDEALİST GAYRİMENKUL Y.O AVRASYA GMYO 0.14
11 ÇEMAŞ DÖKÜM SANAYİ MAKİNA Takım 0.02
12 REYSAŞ GAYRİMENKUL YATIRIM ORTAKLIĞI ALARKO GMYO 0.31
13 EKİZ YAĞ VE SABUN SANAYİ ÇBS Boya 0.14
14 GEDİK YATIRIM MENKUL DEĞERLER İŞ Yatırım Ortaklığı 0.49
15 MARTI GAYRİMENKUL YATIRIM ORTAKLIĞI AKMERKEZ GMYO 0.13
16 TORUNLAR GAYRİMENKUL YATIRIM ORT. SİNPAŞ GMYO 0.41
17 İHLÂS YAYIN HOLDİNG NET Holding 0.24
18 KATMERCİLER ARAÇ ÜSTÜ EKİP SAN. VE TİC. BOSCH Fren Sistemleri 0.21
19 UYUM GIDA ve İHTİYAÇ MAD SAN. ve TİC KEREVİTAŞ 0.11
20 EMLAK KONUT GAYRİMENKUL YAT. ORT. DOĞAN Holding 0.37
21 DO&CO RESTAURANTS AND CATERİNG AG NET Turizm 0.46
22 DESPEC BİLGİSAYAR PAZARLAMA VE TİC LOGO Yazılım 0.20
23 HATEKS HATAY TEKSTİL İŞLETMELERİ VAKKO Tekstil 0.20
24 KİLER ALIŞVERİŞ HİZ. GIDA SAN. VE TİC. METRO Ticaret 0.10
25 LOKMAN HEKİM SAĞ. TUR. EĞİT.İNŞ. TAAH. AFM FİLM 0.01
26 BİZİM TOPTAN İNŞAAT İŞLETMECİLİK TİC. MİLPA Ticari ve Sinai Ürünler 0.15
27 ÜTOPYA TURİZM İNŞAAT İŞLETMECİLİK TİC. EGE Seramik 0.23
28 BİMEKS BİLGİ İŞLEM VE DIŞ TİCARET BOYNER Mağazaları A.Ş 0.19
29 KİLER GAYRİMENKUL YATIRIM ORTAKLIĞI GLOBAL Yatırım 0.23
30 AKFEN GAYRİMENKUL YATIRIM ORTAKLIĞI GSD Holding 0.46
31 YAPRAK SÜT VE BESİ ÇİFTLİKLERİ ALTIN Yağ Kombinaları 0.29
32 BİLİCİ YATIRIM SANAYİ VE TİCARET ECZACIBAŞI Yatırım Ortaklığı 0.53
P.S: Since the ISE index returns on considered periods are too high (%90,1), calculated β coefficients are very small.
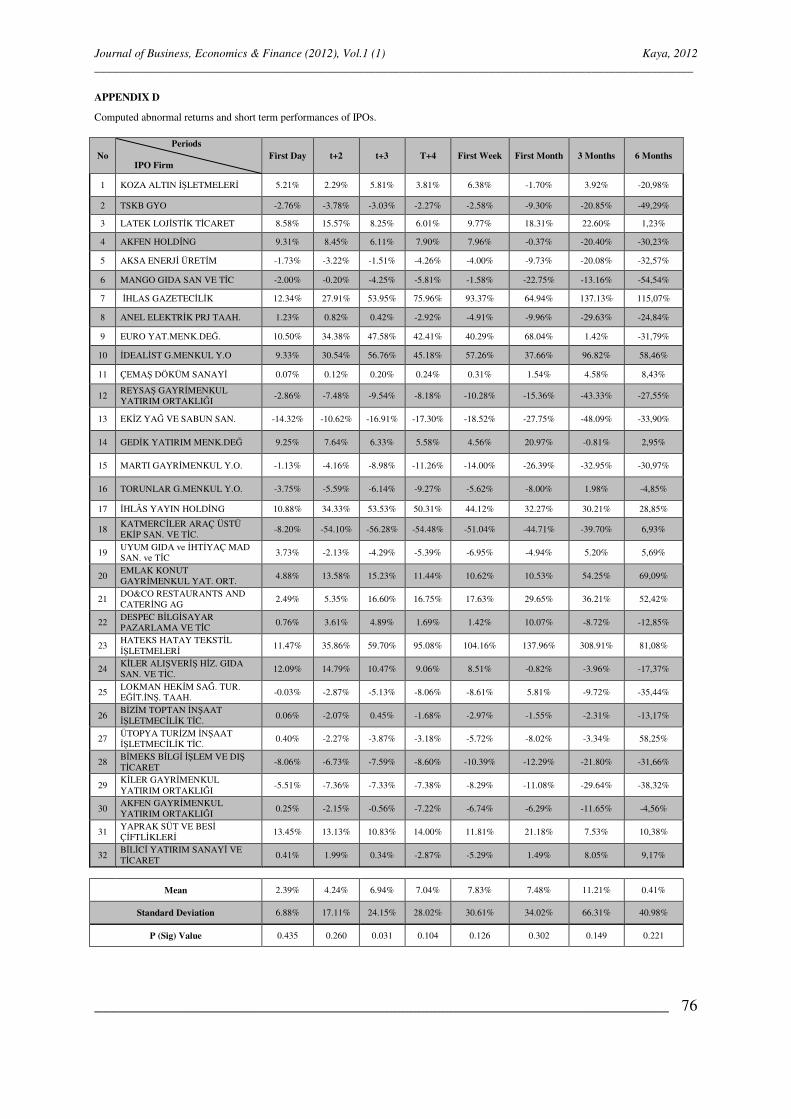
Journal of Business, Economics & Finance (2012), Vol.1 (1) Kaya, 2012 ____________________________________________________________________________________________________
________________________________________________________________________ 76
APPENDIX D
Computed abnormal returns and short term performances of IPOs.
No Periods IPO Firm
First Day t+2 t+3 T+4 First Week First Month 3 Months 6 Months
1 KOZA ALTIN İŞLETMELERİ 5.21% 2.29% 5.81% 3.81% 6.38% -1.70% 3.92% -20,98%
2 TSKB GYO -2.76% -3.78% -3.03% -2.27% -2.58% -9.30% -20.85% -49,29%
3 LATEK LOJİSTİK TİCARET 8.58% 15.57% 8.25% 6.01% 9.77% 18.31% 22.60% 1,23%
4 AKFEN HOLDİNG 9.31% 8.45% 6.11% 7.90% 7.96% -0.37% -20.40% -30,23%
5 AKSA ENERJİ ÜRETİM -1.73% -3.22% -1.51% -4.26% -4.00% -9.73% -20.08% -32,57%
6 MANGO GIDA SAN VE TİC -2.00% -0.20% -4.25% -5.81% -1.58% -22.75% -13.16% -54,54%
7 İHLAS GAZETECİLİK 12.34% 27.91% 53.95% 75.96% 93.37% 64.94% 137.13% 115,07%
8 ANEL ELEKTRİK PRJ TAAH. 1.23% 0.82% 0.42% -2.92% -4.91% -9.96% -29.63% -24,84%
9 EURO YAT.MENK.DEĞ. 10.50% 34.38% 47.58% 42.41% 40.29% 68.04% 1.42% -31,79%
10 İDEALİST G.MENKUL Y.O 9.33% 30.54% 56.76% 45.18% 57.26% 37.66% 96.82% 58,46%
11 ÇEMAŞ DÖKÜM SANAYİ 0.07% 0.12% 0.20% 0.24% 0.31% 1.54% 4.58% 8,43%
12 REYSAŞ GAYRİMENKUL YATIRIM ORTAKLIĞI
-2.86% -7.48% -9.54% -8.18% -10.28% -15.36% -43.33% -27,55%
13 EKİZ YAĞ VE SABUN SAN. -14.32% -10.62% -16.91% -17.30% -18.52% -27.75% -48.09% -33,90%
14 GEDİK YATIRIM MENK.DEĞ 9.25% 7.64% 6.33% 5.58% 4.56% 20.97% -0.81% 2,95%
15 MARTI GAYRİMENKUL Y.O. -1.13% -4.16% -8.98% -11.26% -14.00% -26.39% -32.95% -30,97%
16 TORUNLAR G.MENKUL Y.O. -3.75% -5.59% -6.14% -9.27% -5.62% -8.00% 1.98% -4,85%
17 İHLÂS YAYIN HOLDİNG 10.88% 34.33% 53.53% 50.31% 44.12% 32.27% 30.21% 28,85%
18 KATMERCİLER ARAÇ ÜSTÜ EKİP SAN. VE TİC.
-8.20% -54.10% -56.28% -54.48% -51.04% -44.71% -39.70% 6,93%
19 UYUM GIDA ve İHTİYAÇ MAD SAN. ve TİC
3.73% -2.13% -4.29% -5.39% -6.95% -4.94% 5.20% 5,69%
20 EMLAK KONUT GAYRİMENKUL YAT. ORT.
4.88% 13.58% 15.23% 11.44% 10.62% 10.53% 54.25% 69,09%
21 DO&CO RESTAURANTS AND CATERİNG AG
2.49% 5.35% 16.60% 16.75% 17.63% 29.65% 36.21% 52,42%
22 DESPEC BİLGİSAYAR PAZARLAMA VE TİC
0.76% 3.61% 4.89% 1.69% 1.42% 10.07% -8.72% -12,85%
23 HATEKS HATAY TEKSTİL İŞLETMELERİ
11.47% 35.86% 59.70% 95.08% 104.16% 137.96% 308.91% 81,08%
24 KİLER ALIŞVERİŞ HİZ. GIDA SAN. VE TİC.
12.09% 14.79% 10.47% 9.06% 8.51% -0.82% -3.96% -17,37%
25 LOKMAN HEKİM SAĞ. TUR. EĞİT.İNŞ. TAAH.
-0.03% -2.87% -5.13% -8.06% -8.61% 5.81% -9.72% -35,44%
26 BİZİM TOPTAN İNŞAAT İŞLETMECİLİK TİC.
0.06% -2.07% 0.45% -1.68% -2.97% -1.55% -2.31% -13,17%
27 ÜTOPYA TURİZM İNŞAAT İŞLETMECİLİK TİC.
0.40% -2.27% -3.87% -3.18% -5.72% -8.02% -3.34% 58,25%
28 BİMEKS BİLGİ İŞLEM VE DIŞ TİCARET
-8.06% -6.73% -7.59% -8.60% -10.39% -12.29% -21.80% -31,66%
29 KİLER GAYRİMENKUL YATIRIM ORTAKLIĞI
-5.51% -7.36% -7.33% -7.38% -8.29% -11.08% -29.64% -38,32%
30 AKFEN GAYRİMENKUL YATIRIM ORTAKLIĞI
0.25% -2.15% -0.56% -7.22% -6.74% -6.29% -11.65% -4,56%
31 YAPRAK SÜT VE BESİ ÇİFTLİKLERİ
13.45% 13.13% 10.83% 14.00% 11.81% 21.18% 7.53% 10,38%
32 BİLİCİ YATIRIM SANAYİ VE TİCARET
0.41% 1.99% 0.34% -2.87% -5.29% 1.49% 8.05% 9,17%
Mean 2.39% 4.24% 6.94% 7.04% 7.83% 7.48% 11.21% 0.41%
Standard Deviation 6.88% 17.11% 24.15% 28.02% 30.61% 34.02% 66.31% 40.98%
P (Sig) Value 0.435 0.260 0.031 0.104 0.126 0.302 0.149 0.221
Journal of Business, Economics & Finance (2012), Vol.1 (1) Pekcan & Atan & Sivacioglu, 2012 ____________________________________________________________________________________________________
________________________________________________________________________
77
CORPORATE GOVERNANCE AS A QUANTITATIVE INDICATOR AND A STUDY ON ISTANBUL
STOCK EXCHANGE CORPORATE GOVERNANCE INDEX IN TURKEY
Yildiz Ayanoglu Pekcan1 and Sibel Atan2 and Can Mert Sivacioglu3 1Assoc. Prof. , Gazi Uni., Faculty of Economics and Administrative Sci., Department of Business Administration, [email protected]
2Assist. Prof., Gazi Uni., Faculty of Economics and Administrative Sciences, Department of Econometrics, [email protected]
3Master of Science Degree, Gazi University, Social Sciences Institute, Department of Finance, [email protected]
KEYWORDS
Corporate governance, ISE corporate governance index (XKURY), regression, granger causality analysis
ABSTRACT
The purposes of this study are to determine the direction and the magnitude of the interrelations of the Corporate Governance Index (XKURY as denoted by ISE) and other three indexes of ISE, and to analyze and find out whether any one of these indices may be used as a positive indicator for an investment to be made in XKURY index. XKURY index consists of the stocks of the listed companies of ISE those are rated as satisfactorily applying the corporate governance principles in accordance with the criteria set by the Capital Markets Board of Turkey. As a result of an analysis based on 683 observations, statistically significant relationships have been established and interpreted between the XKURY index returns and the returns of the other three indices described above, which constitutes a quantitative indicator of corporate governance practices. It has been found that the corporate governance index had a very strong and positive correlation with other indices it has been compared. The econometrical analyses carried out in the study had concluded that it will not be possible to use any of the indices of ISE as a positive indicator for an investment to be made in XKURY index, by following their movements.
1. INTRODUCTION
Although the term corporate governance itself is relatively new, the elements surrounding the multi-faceted corporate governance have used to be in the agenda since the first half of the 20th century. Shleifer and Vishny (1997) are defining the corporate governance saying “corporate governance deals with the ways in which suppliers of finance to corporations assure themselves of getting a return on their investment.” (Shleifer and Vishny, 1996). According to OECD the corporate governance is defined as being an understanding where the interests of the shareholders, managers, employees, customers, creditors, fund suppliers and the state are best dealt by the joint-stock companies, in addition to their main goal of obtaining profits and distributing it to shareholders (OECD, 1998). But it is, however, worth noting that the ultimate goal intended to be achieved by good conduct of corporate governance principles is not maximizing the value of the company. The corporate governance is an understanding of business administration that considers the interests of all stakeholders within the framework of transparency, equality, accountability and responsibility, in line with the financial objectives.
John and Senbet, (1998) are defining the corporate governance more comprehensively by saying “it deals with the mechanisms that the stakeholders of a joint-stock company, whose shares are publicly traded, apply control over the people within the organization and the management to ensure the protection of their interests” (Kose, Senbet, 1998). It is also worth adding that the expression stakeholder comprises not only the shareholders of the company but the bond holders as well as the employees of the company, suppliers of the materials and the services (sellers), customers and all other parties that have an interest in the company one way or the other. Reviewing various definitions of corporate governance makes it clear that all of them are talking about conflicts of interest between the insiders and the outsiders arising from separation of the ownership and control from each other. An increasing interest in corporate governance has been observed in the recent past. At first, implemented mechanisms of the management activities have been investigated; these discussions had become

Journal of Business, Economics & Finance (2012), Vol.1 (1) Pekcan & Atan & Sivacioglu, 2012 ____________________________________________________________________________________________________
________________________________________________________________________
78
more intense following the financial scandals and business bankruptcies and certain obvious accounting frauds alleged that done by the managers much more recently (such as Enron, WorldCom). Number of arrangements has been deemed necessary as a result of encountered conflicts of interests of the company executives with the shareholders’, the conflicts among the shareholders themselves about management of the company and the conflicts of interests of the company with the factors outside the company; thus the principles of corporate governance have been determined. The most common interest conflict among the aforementioned interest groups is the one between the shareholders and the company executives. It is inevitable to agree with Adam Smith for his judgment “it will be quite optimistic to expect a company executive’s managing money of the others with due care and attention as if it were his own money, without frittering away or making use of it as a means to provide personal profit for himself” (Smith, 2006). In solving this chronic problem, the corporate governance is a commitment provided for the shareholders that the company executives will not let the wrong redirection of resources and will transfer the investments in rational projects by means of set out rules and brought in constraints. Secondary interest conflict is the one encountered between the minority shareholders and the shareholders have the power to control. The shareholder with a large share of stocks may so direct the resources to increase his own wealth by acting as a company executive himself, or influencing the management from outside. In such a case, proper implementation of corporate governance guarantees that the investments of the minority shareholders will be protected in the maximum extent via rational decisions to be taken and such exploitation will not occur in the corporations those apply the corporate governance principles. The third kind of interest conflict is: interests of the company as a whole being in conflict with the interests of the non-company factors. In this context, the corporate governance again guarantees to all the other factors that a transparent, responsible, equitable, accountable way of management has been adopted and the interests of all concerned are protected in the maximum extent.
In the last two decades, military blocs have left their places to trade unions in the world. In this structure the effect of the private sector has been increased not arithmetically but geometrically. Everything haven’t happened smoothly without any flaw during expansion of the private sector to such extent though, Asian and Russian crises first, then major accounting scandals caused by the companies such as Enron, Arthur Andersen, WorldCom, Parmalat have increased the need of the investors' to have confidence in the private sector. All of these mentioned have embodied the emergence of the concept of corporate governance. Developed corporate governance as a result of bad experiences is important; because:
• It is the guarantee of observance of the rights of all interest groups. • It makes provision of funds cheap and easy with obtained trust and reputation as a result of proper
applications of it. • Ensures the fund providers that rational use of resources will be made and added value will be produced.
The corporate governance trend that has begun in the 90s due to all these aforementioned developments and their contributions became a concrete structure in the year 1999 with issuance of the OECD Principles of Corporate Governance with participation of 30 countries. OECD had issued the principles collected under the following main headings in order to be used as a template by the countries while publishing their own corporate governance principles: (OECD, 1998).
• The requirements for an effective corporate governance framework (It is a template for the necessary legal arrangements),
• Shareholder rights and the Basic functions of ownership, • Fair treatment of shareholders, • The role of stakeholders in the corporate governance (Covers the related parties out of the company), • Making public disclosure and transparency, and • Responsibilities of the board of directors.
If it is attempted to draw a general framework for corporate governance practices in the world these practices may be divided into two distinctive groups such as the Continental European corporate governance practices and Anglo-Saxon practices (Sivacioglu, 2008). Following general characteristics may be found in the countries applying the Continental European model: predominance of the banks in the financial markets, and a concentrated shareholding structure is observed, presence of relatively illiquidity of the capital markets and weak shareholder activism are other common characteristics. Continental European countries except the Baltic States and Japan may be shown as the samples of the countries those adopted such an interpretation of the corporate governance concept.
Journal of Business, Economics & Finance (2012), Vol.1 (1) Pekcan & Atan & Sivacioglu, 2012 ____________________________________________________________________________________________________
________________________________________________________________________
79
The basic feature in the Anglo-Saxon model is presence of a well developed stock culture of the people in such countries, which consist of USA in the first order, then the United Kingdom and Ireland, as being the samples of applying countries. Dispersed ownership structure, liquidity of the capital markets, sophisticated market for corporate control and extensive shareholder activism may be specified as the other main features of this application. On the other hand, due to the nature of it, certain weaknesses have been observed such as a limited shareholder-manager relationship and being open to hostile takeovers. In fact the differences in forming the countries' economic policies constitute the basis for this polarization. The effects of a competition-based economic program are observed in the Anglo-Saxon model. For the Continental European model it can be said that the governments both do act as a regulatory organ for the industry and also as a performer of the industrial activities to achieve national objectives. While the main conflict is experienced between the majority and minority shareholders in Europe, it is between the company executives and shareholders in the Anglo-Saxon model.
Although the benefits of Continental European models are discussed instead of the Anglo-Saxon style corporate governance systems, the general tendency is the other way around. In recent years, a new situation has developed, where the companies who fulfill the corporate governance practices satisfactorily are treated in the national stock exchanges under a separate index or in a secondary stock exchange. In this context, there are such applications in five countries in the world including Turkey (Sıvacıoğlu, 2008).
• Turkey - ISE Corporate Governance Index • South African Republic - Johannesburg Stock Exchange Socially Responsible Investing Index • South Korea - Korea Corporate Governance Stock Price Index • Brazil - Nova Mercado • Italy - Milano Stock Exchange STAR Exchange (Segmento Titoli con Alti Requisiti)
In the following sections of the study, applications of the corporate governance in Turkey have been mentioned briefly and a quick literature review has been made before the presentation of the data and the method used in the research. Although some researchers have an opinion that Turkey has not behaved as fast as required in respect of corporate governance, the conclusion of the observances accumulated during the research have been carried out for this study is: Turkey has behaved just in time, for ISE has been in a state of a baby just recently started creeping with its six-year history, 34 million USD trading volume and 9.9 billion USD total capitalization. It is impossible to teach a baby to run who is not capable of standing up (Sivacioglu, 2008). One of the most important steps taken on corporate governance in Turkey is publishing of the Capital Markets Board (CMB). The principles prepared according to the realities of Turkey with the reasoning “One size does not fit all”, have been revised in 2005.
When the principles are examined, the following points stand out: (CMB, 2005)
• Document defines that compliance status of the publicly traded companies should be rated by the authorized institutions.
• When examined together with the current legal regulations as a whole it becomes apparent that a management approach is adopted ahead of the current situation. With such structure of it, it has a guiding nature.
The national corporate governance philosophy of Turkey has been formed under four main headings:
• Shareholders • Public Disclosure and Transparency • Stakeholders • Board of Directors
Another important step with respect to Corporate Governance is obligation to publish the Corporate Governance Compliance Report of the publicly traded companies. With this application, expansion rate of corporate governance and interest has shown in the topic have been increased due to the requirement of publication of the report. However, the most significant development in Turkey is acquiring operational capacity of the ISE Corporate governance index. XKURY index has been calculated from the date of August, 31. The number of publicly traded companies had exceeded five. Aforementioned rating firms are as follows: TCR Corporate Governance and Credit Rating Co. Inc., Saha Corporate Governance and Credit Rating Services Co. Inc., Kobirate International Credit Rating and Corporate Governance Services Co. Inc., Risk Metrics Group Inc., JCR Avrasya Rating Co. Inc. The initial value of the index is 48082.17 as of August, 29, 2007. After this date the number of companies in the index has reached to 27 as of June 2010 by addition of companies rated as
Journal of Business, Economics & Finance (2012), Vol.1 (1) Pekcan & Atan & Sivacioglu, 2012 ____________________________________________________________________________________________________
________________________________________________________________________
80
satisfactory; these companies are: Anadolu Efes, Arcelik, Asya Katılım Bankası, Aygaz, Coca Cola Icecek, Dentas Ambalaj, Doğan Holding, Doğan Yayın Holding, Hürriyet Gazetecilik, İş Finansal Kiralama, Logo Yazılım, Otokar, Park Elektrik Madencilik, Petkim, Şekerbank, Türkiye Sınai Kalkınma Bankası, TAV Havalimanları, Tofaş Otomobil Fabrikası, Turcas Petrol, Tüpraş, Türk Prysmian Kablo, Türk Telekom, Türk Traktör, Vestel, Yapı ve Kredi Bankası, Vakıf Yatırım Ortaklığı ve Gayri Menkul Yatırım Ortaklığı.
2. LITERATURE REVIEW
In recent years, a significant amount of experimental work has been done on various corporate governance issues, especially following the scandals and emergence of large-scale corporate bankruptcies such as Enron, WorldCom, and Adelphia. However, the literature of the corporate governance go back to 1776 (Smith) and 1932 (Berle and Means) in the academic studies. We think that the research in this area can be divided into two main groups:
• First, the area which is more theoretical trying to determine how and what should be the corporate governance structure that will lead to increased effectiveness of various corporate governance mechanisms and reduced cost of representation, and
• The empirical area trying to associate the corporate governance measures with the economic performances and growth of the companies managed within the scope of the framework in question, their stock prices and expected returns, the cost of equity capital as well as various valuation measures of those companies empirically.
Research work dealt with and referred to in this study have been examined under the headings of “the work performed abroad” and “studies carried out in Turkey” within the scope of the above described criterion.
2.1. Studies Performed Abroad And Their Results
Corporate governance is a universal form of management shaped by the dynamics of each country's own despite being implemented based on the same elements. The studies investigating such differences arising from the legal regulations of the countries in general focus on the following points;
The number one issue investigated in this type of researches is the shareholders' rights. The first indicator is equal voting right of each share. Second indicator is ease of the use of the right to vote. Other indicators are protection of minorities and the percentage of votes required for extraordinary general assembly. The lower this ratio is, the more effective is the corporate governance in that country. According to the research by La Porta et al (1996) while this ratio is 1 percent in the USA, it is 10 percent in Turkey and 33 percent in Mexico. Another indicator is whether it is mandatory to distribute dividends. Based on these indicators, as the USA being in the first order, the countries where Common law legal systems (British based legal system) are valid were found to be protecting shareholders more strongly than the others. It is worth noting that the weakest in this respect are the countries who adopted the French legal system, including Turkey. This research in general falls under the coverage of the second area described above; therefore, latest main findings are reviewed in this empirical area in the current section.
In 2000, researcher Johnson et al has measured the relationship between the deficiencies in corporate governance and the stock and financial asset prices for 25 countries. He has identified that during financial crisis the capital flows were very rapid and having very negative effects for the countries with weak corporate governance practices. In such cases currencies of these countries are very negatively affected by the crises (Johnson et al, 2000). Gompers, Ishii and Metrick (2001), have formed a 24-parameter "Corporate Governance Index" for rating 1500 companies, and concluded that an investor provides a better return of about 8.5 percent by selling the stocks of the companies (Gompers, Ishii, and Metrick, 2001). Bai et al has examined the problems of corporate governance in China in their studies published in 2002. The study concludes that the well-managed companies in corporate governance have reached higher stock market values. Chinese investors are willing to pay a premium of a significant rate for better corporate governance standards; this rate reaches up to 20% for well-managed companies (Bai et al, 2002). In 2003, Brockman and Chung have made use of the data of 31 Hong Kong and 64 Chinese origin, total 95 companies listed in the Hong Kong stock exchange and studied the investor protection and the liquidity of the companies. They have found that the buying-selling price gap is narrower and the trading volume is higher for the companies HK origin than the Chinese origin companies. They have found that the cause of this situation associated with high-quality corporate governance practices targeted investor protection (Brockman and Chung, 2003).
In their studies published in 2004, Beiner et al has formed a corporate governance index on the basis of a research made on all companies listed in the Swiss Stock Exchange and found that 1 point increase in the index

Journal of Business, Economics & Finance (2012), Vol.1 (1) Pekcan & Atan & Sivacioglu, 2012 ____________________________________________________________________________________________________
________________________________________________________________________
81
caused an average increase of 8.5% in the market capitalization. In his study published in 2009, Cheffins has examined the experienced meltdown of unprecedented scale since the fall of 1930 in the prices of stocks in the USA and the collapse resulted in removing of 37 companies from the S&P 500 iconic index in 2008, and questioned whether there was a share of corporate governance weakness in the event. The data covers 37 companies removed from the S&P 500 index, using the Factiva newswire database of Dow Jones. The news about these companies has been published in the newspapers such as New York Times, the Wall Street Journal and Financial Times and magazines such as The Economist, Forbes, and Fortune had been relied on. As the conclusion of his study of the sample of companies at “ground zero” of the stock market meltdown, the general argument of the author is that existing corporate governance arrangements in the United States do not have weaknesses requiring any radical legal changes and the corporate governance mechanism had successfully passed this tough test (Cheffins, 2009).
In his work published in 2010, Bhasin has carried out a research on the Reliance Industries Limited to find out in what extent did the disclosure, one of the basic requirements of corporate governance, fulfilled in practice, in India, the country that has the largest number of listed companies in the world. He found out that the company’s performance was “very good” with 85 points. Company's annual report for the fiscal year 2008-2009 has been used as the source of data and disclosures examined in-depth to conclude. The “case study” approach as the research method and the “point valuation system” in the constructed model have been used. The primary data has been obtained via interviews with some of the company executives. Secondary data has been collected by screening the publications in relation with the Reliance Group especially the ones related to corporate governance applications of the company as well as the corporate governance report of the company. It is expected that the Reliance Group, the largest and well-known company of India, will constitute a model for the other companies in the country (Bhasin, 2010).
In their study dated 2010, Shipilov et al have put forward a theory arguing that an institutional logic plays a role in adopting new corporate governance practices, while adopting in multi-waves, the practices that are close to the logic of the initially adopted practice are adopted at once, however in case of entirely new kind of practice the results obtained by the other institutions applying this new practice are waited. They have sought support for this theory by analyzing adoptions of practices following the board of directors’ reform in Canada. As the research method, the general assemblies of the 217 listed companies in Canada TSX index have been collected between the years 1999 and 2005. Thus, the interlocking boards were determined and the chosen time interval has constituted an ideal period for observing. The conclusion of their research shows that adoptions of the corporate governance practices in the companies having an interlocking board structure are more rapid as they have predicted (Shipilov, Greve, Rowley and Timothy, 2010).
The conclusions and the results may be summarized as following: stock market performances of the companies are higher for those implementing the principles of corporate governance. In general, returns on equities of the companies are high for those applying the principles of corporate governance.
2.2. Studies Conducted In Turkey And Their Results
Studies on corporate governance in Turkey are summarized below;
The first one of these studies, the study on ISE dated 2001, is the most comprehensive research work questioning the level of corporate governance in Turkey, and dealing with the degree of implementation of the principles of corporate governance and reflection of these principles in the performances of companies (Varış et al, 2010).
The study examined the corporate governance practices of companies traded on the Istanbul Stock Exchange (ISE) and the relationship between the market and their financial performances. According to the results of the study both the financial and market return performances of the companies are higher those applying the corporate governance principles and standards more than the others.
The study of the CLSA, published in 2001, is interesting for Turkey because 17 Turkish companies are included among the 495 companies from 25 countries within the scope of the research; and 10 Turkish companies out of 17 have achieved to be included among the unsuccessful 100, and 2 out of these to be included among the unsuccessful 25 companies which are Doğan Yayın Holding and Vestel Elektronik (CLSA, 2001). Churaev (2003) has examined the impacts of the corporate governance issues on the values of the Turkish companies. Corporate governance ratings of the companies under XU30 index has been measured against their stock performances, financial structure of the companies’, and return performances. While the corporate governance performance rate increases the average of the adjusted cumulative return increases.
Journal of Business, Economics & Finance (2012), Vol.1 (1) Pekcan & Atan & Sivacioglu, 2012 ____________________________________________________________________________________________________
________________________________________________________________________
82
Study of the Gürbüz and Ergincan dated (2004), has established relations between the stock market performances, financial structures and profitability of the companies and a corporate governance index, which is obtained in accordance with the Articles of Associations of the companies and partnership indices (Ergincan and Gürbüz, 2004). Stock market performances of the companies implementing the corporate governance principles better, were found more successful and their equity profits higher than the others. It has been observed that such companies also can find loans with much more appropriate conditions. Corporate Governance Forum of Turkey and Standard & Poor’s have conducted the project together that had focused on issues of transparency and disclosure, which are important indicators of corporate governance. Project has lasted for and the findings have been published in 3 consecutive years.
The research work dated 2005, has constituted basis for the studies in the following years as being the methodology (Ararat, Balic and Bradley, 2005). Data that has been obtained from the annual reports and the web sites of the companies had been used in the analyses and the evaluations had been presented in three sub-categories. These sub-categories and notes of the 52 companies in these categories for the first year are as following:
• Ownership Structure and Investor Relations 4/10 • Financial Transparency and Information Disclosure 7/10 • Board of Directors, Management Structure and Process 3/10
Where, the overall average is 5 out of 10 for this research, the high note obtained in the financial transparency may be attributed to the successful legal regulations.
Similar results have been obtained for the 2006 stage of the same project, and the success in the financial reporting has also been achieved in that year (Ararat, Balic, and Kochetygova, 2007). The most striking result for the year 2006 is the significant progress in the banking sector compared to previous year. This situation has been connected to developments in the financial sector and positioning of the foreign banks in Turkey. The study that has been completed in 2007 has concluded that the rate of improvement for all three areas have been slowed down (Ararat and Balic, 2007). However, a positive development has been found for the last year of the project that was the narrowed gap of the levels of implementing the corporate governance of the traced companies.
Kaymak and Bektaş in their study dated 2008 had aimed to find out whether the regulated “western-style” corporate governance practices have come out to the surface in the characteristics of the boards of directors of the Turkish banks and if so whether such characteristics affected the performance or not. The financial data and data related to the board of directors on the Internet page of the Banks Association of Turkey has been collected for 27 commercial banks for the period between the years 2001 and 2004, analyses of performance and board of directors have been carried out based on this data. While presence of the insiders in the board has found a positive impact on return on assets, the CEO’s being also the chairman of the board and ownerships of the board members of the company have found adverse effects in the study, where 27 banks of Turkey (attracting large amounts of foreign investment as being an emerging market) have been evaluated with their performances between 2001 - 2004 (Kaymak and Bektaş, 2008).
Selekler, Gökşen and Yıldırım, Öktem in their study dated 2009 are investigating the effects of national and international pressures exercised upon a developing economy to improve the corporate governance, in terms of institutional theory. Policy makers recently have criticized the groups of family companies those are in a dominant position in emerging economies because of their weak governance structures. The agreed upon joint recommendation to the groups of family companies is to increase the number of the independent and outsider directors in their board of directors. Therefore, the changes have been made in the compositions of the board of directors of their affiliates by the six of the largest family groups of companies between 2002 and 2006 have been analyzed in the study using one-way ANOVA and t-tests as statistical tools. No statistically significant change has been found in the compositions of the boards of directors within the period of research (Selekler, Gökşen and Yıldırım, Öktem, 2009).
The study dated 2009, carried out by Bektaş and Kaymak, examines the relationships between their performances and the board structures and concentrations and types of the ownerships of the Turkish banks, resource dependency point of view. Total 27 banks’ financial and corporate data has been compiled from the Internet page of the Banks Association of Turkey and analyzed, 3 are state-owned banks, 18 are private banks and 6 were foreign-owned banks out of these 27 banks. However, due to unavailability of data such as board of directors, whether the CEO is also the chairman of the board, number of the insiders-outsiders on an annual basis between the years 2001 and 2004, only 2004 data were used. While analyzing the long-term effects of the decisions of the board of directors, ownership rates of the board members have been measured between 1994 and

Journal of Business, Economics & Finance (2012), Vol.1 (1) Pekcan & Atan & Sivacioglu, 2012 ____________________________________________________________________________________________________
________________________________________________________________________
83
2004. The conclusion reached by the researchers is that the size of the board of directors and CEO’s being also the chairman of the board do not significantly affect the returns on assets of the Turkish banks, whereas ownerships of the board members have a negative association with the performance. They identified that the analysis of by whom the board of directors is composed showed that it had a curvilinear relationship with the performance implying that high performance regardless of whether the majority composed of outsiders or insiders (Kaymak and Bektaş, 2009).
3. DATA AND METHODOLOGY
This section is on the data collection and the method used in the research. To perform performance analysis of ISE Corporate Governance Index, the chosen period starts on 31.08.2007 the date on which the index started to be calculated, and ends on 31.05.2010 (including that day). In order to directly measure the returns of the Return Index, sections in the ISE Monthly Bulletins were used. To ensure that the measurement should allow comparing in a logical framework, periodic return performance measurements have been made also for the XU30, XU100. Considering that quarterly, monthly or weekly observations will not statistically be sufficient, the Return Indices of ISE indices are compiled daily, for a total of 683 trading days of ISE between the dates August, 31, 2007 and May, 31, 2010. The period chose to perform the measurements and comparisons. Following model has been structured according to these variables:
XKURY = α0 + α1XU30 + u1 (1)
XKURY = β0 + β1XU100 + u2
XKURY = θ0 + θ1XUTUM + u3
For every series adequate number of lags has been specified to eliminate the autocorrelation problem. In the series of daily observations, the number of lags has started from k = 22, representing one-month period in terms of trading days (Perron, 1989). From this stage on, a 22-day period has been used for entire analyses in the study. The results obtained were ascertained whether they were causal or not.
For determining the lag length the Akaike information criterion (AIC) has been used. The lag length has been found as being 1 according to AIC.
(2)
Granger causality test was applied to reveal the causal relationships between variables besides the simple correlation relationships. Granger causality test is a method used to determine the direction of relations of causality between variables formulated by Clive Granger in 1969 (Granger, 1969).
According to this test, if the inclusion of information on the variable x into the model provides contribution to prediction of the variable y, then the x variable is the cause of y.
The Granger causality test for the model presented above is carried out as follows. In case the following hypothesis of H1 is accepted, then x is not a reason for y.
H1: b21 = b22 = ... = b2q = 0 (3)
In case the following hypothesis of H2 is accepted, then y is not a reason for x.
H2: d11 = d12 = ... = d1q = 0 (4)
In case both hypotheses H1 and H2 are rejected, then it becomes clear that there is a two-sided causality between x and y. In this case, the feedback effects may be mentioned. The above hypothesis tests may be tested using Wald test:

Journal of Business, Economics & Finance (2012), Vol.1 (1) Pekcan & Atan & Sivacioglu, 2012 ____________________________________________________________________________________________________
________________________________________________________________________
84
(5)
In the equation (5) HKTS stands for the error sum of squares of the restricted model, HKT error sum of squares of the unrestricted model, r number of constraints, n number of observations, and k number of parameters in the model. If the calculated F value is greater than the table (critical) value of the F, then H1 and H2 hypotheses are rejected. At the third stage of the study causal relationships between variables have been tested using vector autoregressive (VAR) technique. Furthermore, to determine the dynamic causal relationships between variables and in order to test the consistency of the results to be obtained as a result of the Granger causality tests estimations of the impulse-response functions were also used. The VAR model deals with all the variables selected in unison and examine them in the integrity of a system. In the VAR model endogenous and exogenous variable distinction is not made between the variables. Existence of a theory is not assumed affecting the formation of the model, at the stage of the creation of econometric model. It is not allowed that the restrictions and assumptions alleged by the theory disturb the model definition. A pre-constraint is not imposed on the relationships between variables. In this manner, the negative effects of the pre-assumptions those a model builder needs to make at the model building stage are eliminated on a large scale.
The four-variable VAR model can be expressed in a standard way as follows:
(6)
in equations above, P stands for the lengths of lags, and v for random error terms having zero means, its covariance’s with its own lagged values are zero, variances are constant and normally distributed. In the VAR model, the assumption of the errors being unrelated to their own lagged values does not impose any constraint to the model, for it enables to overcome the autocorrelation problem by increasing the lag lengths of the variables. VAR models can be applied in two manners as being restricted and unrestricted VAR models. The “F tests” that shows the Granger-causality, the “variance decomposition” and “impulse-response functions” that shows the interactions between variables are the methods used in the VAR analysis to obtain the results. The variance decomposition separates the change on one of the endogenous variables, defined in equality (6), as being shocks those affecting all internal variables respectively; thence, it becomes possible to get informed about the dynamic nature of the model. The purpose of the variance decomposition is to detect the effect of each random shock on the error variance of the predictions for future periods. Prediction error variance can be expressed as each variable's contribution to the error variance for a period of length h. Then, by proportioning each variance, to the total variance, the relative weight is found as a percentage. Interpretation of the results obtained by the variance decomposition is also very important. Considering the equality number (6), if a shock at v1t does not affect the prediction error variance of x, regardless of length of the forecast period, x can be considered exogenous because x is acting independent from y. On the contrary, if a shock at v1t affects the prediction error variance of x pretty much, x is considered as an endogenous variable. In our study, 22 periods (days) have been used as the length of
Journal of Business, Economics & Finance (2012), Vol.1 (1) Pekcan & Atan & Sivacioglu, 2012 ____________________________________________________________________________________________________
________________________________________________________________________
85
the period of shock representing the 22 trading days within a month. The order of the variables also affects the results in the variance decomposition.
In the final stage of the study, impulse-response functions have been formed. Impulse-response functions show the effects of one (1) standard-deviation shock, generated in one of the random error terms, on the current and future values of the endogenous variables. In VAR analysis, the impulse-response functions have a great role in detecting the symmetrical relations and determining the dynamic interactions between the examined variables. Whichever is the most influential variable, in the relationships between the variables in a model, can be decided by using variance decomposition. However, whether this variable that is found effective, can be used as being the policy tool or not can be decided by using impulse-response functions. The Monte Carlo technique has been used in calculation of standard errors of the impulse-response functions in the study. According to this technique, a random sample is chosen from the asymptotic distribution of the VAR coefficients, calculated by Hamilton (Hamilton, 1994). The impulse-response coefficients are obtained by making use of these coefficients, obtained by simulation. This process is repeated certain number of times and the sampling distribution of the impulse-response coefficients are found. Standard deviations are obtained by using this distribution. The standard deviations, obtained as described, will give the standard errors of the impulse-response functions. At this stage, the graphics of the impulse-response functions have been examined in terms of the responses of the variables, in the model, to the shock imposed on the XKURY index, in order to compare the results obtained by Granger causality tests.
4. EMPIRICAL RESULTS
In the study, the relations on the return basis between the XKURY Index and the other three indices -subject to the research- have been revealed based on the observations. During the study, at first, separate periodic return calculations have been made for the XKURY, XU30, XU100 and XUTUM indices. The variables affecting the XKURY index has been defined as being the indices XU30, XU100 and XUTUM. In the first stage of the study stationary tests of the entire variables have been performed. Following model has been used for augmented Dickey-Fuller (ADF) test for stationary. Table 1 shows the ADF test results according to the levels of the variables and I. differences.
Table 1:
ADF Test Results According to the Levels of the Variables and 1st Differences
*L, logarithm of the variable (α0.05 = -3.42; α0.10 = -3.13)
All variables are 1st order difference stationary as can be seen from Table 1. In the second stage, primarily correlation analyze was applied in order to determine the direction and degree of the relationship between the variables. Table 2 shows the calculated values of the Pearson correlation between variables.
Variable* ADF
(According to Level)
ADF
(According to I. Difference)
LXKURY -0.89 -23.38*
LXU30 -1.49 -6.07*
LXU100 -1.54 -6.15*
LXUTUM -1.49 -6.01*

Journal of Business, Economics & Finance (2012), Vol.1 (1) Pekcan & Atan & Sivacioglu, 2012 ____________________________________________________________________________________________________
________________________________________________________________________
86
Table 2. Results of Pearson Correlation between Variables
XKURY variable has a very strong in level of correlation in the same direction (positive) with the XU30, XU100 and XUTUM variables. The Granger casualty results obtained in the study are shown in Table 3.
Table 3. VAR Granger Causality / Wald F Test Analysis Results
Number of Observations: 683 - Dependent Variable: XKURY
Variable Chi-Square Degrees of Freedom
Significance (P)
XU30 0.022 1 0.883
XU100 1.827 1 0.177
XUTUM 0.946 1 0.331
XU30 – XKURY 1.306 1 0.253
XU100 – XKURY 1.040 1 0.308
XUTUM – XKURY 1.357 1 0.244
According to the Granger causality test results given in Table 3, neither XKURY variable is the Granger-cause of the other variables, nor are the other variables the Granger-cause of XKURY conclusion has been reached.
Results of the variance decomposition those have been obtained with the VAR model, defined in equation set (6), are given in Table 4.
XKURY XU30 XU100 XUTUM
XKURY 1 (+) Very Strong (+) Very Strong (+) Very Strong
XU30 0.999 1 (+) Very Strong (+) Very Strong
XU100 0.949 0.960 1 (+) Very Strong
XUTUM 0.998 0.999 0.953 1

Journal of Business, Economics & Finance (2012), Vol.1 (1) Pekcan & Atan & Sivacioglu, 2012 ____________________________________________________________________________________________________
________________________________________________________________________
87
Table 4. Results of the Variance Decomposition
Period (Day)
Standard Error
D (XKURY) D (XU100) D (XU30) D (XUTUM)
1 810.42 100.00 0.00 0.00 0.00
2 817.13 99.22 0.03 0.62 0.14
3 817.26 99.19 0.03 0.64 0.15
4 817.27 99.19 0.03 0.64 0.15
5 817.27 99.19 0.03 0.64 0.15
6 817.27 99.19 0.03 0.64 0.15
7 817.27 99.19 0.03 0.64 0.15
8 817.27 99.19 0.03 0.64 0.15
9 817.27 99.19 0.03 0.64 0.15
10 817.27 99.19 0.03 0.64 0.15
11 817.27 99.19 0.03 0.64 0.15
12 817.27 99.19 0.03 0.64 0.15
13 817.27 99.19 0.03 0.64 0.15
14 817.27 9919 0.03 0.64 0.15
15 817.27 99.19 0.03 0.64 0.15
16 817.27 99.19 0.03 0.64 0.15
17 817.27 99.19 0.03 0.64 0.15
18 817.27 99.19 0.03 0.64 0.15
19 817.27 99.19 0.03 0.64 0.15
20 817.27 99.19 0.03 0.64 0.15
21 817.27 99.19 0.03 0.64 0.15
22 817.27 99.19 0.03 0.64 0.15
Cholesky ranking: D (XKURY) D (XU100) D (XU30) D (XUTUM)

Journal of Business, Economics & Finance (2012), Vol.1 (1) Pekcan & Atan & Sivacioglu, 2012 ____________________________________________________________________________________________________
________________________________________________________________________
88
When the results of the variance decomposition, given in Table 4, are examined, all of the changes on the prediction error variance of the XKURY index in the first period are explained by the variable itself. There is no contribution of other variables. In the second period, while the share of the variable itself is 99.22% in the changes on the prediction error variance of the XKURY index; XU30 index’s share is 0.6%; XUTUM index’s share is 0.14% and XU100 index’s share is 0.03%. Consequently, it is concluded that another variable, other than the index itself, is not able to explain XKURY index over time. The VAR impulse-response functions are shown below in Graphic 1.
Graph 1. Graphics of Impulse-Response Functions
Response of the XKURY to XKURY
Response of the XU30 to XKURY
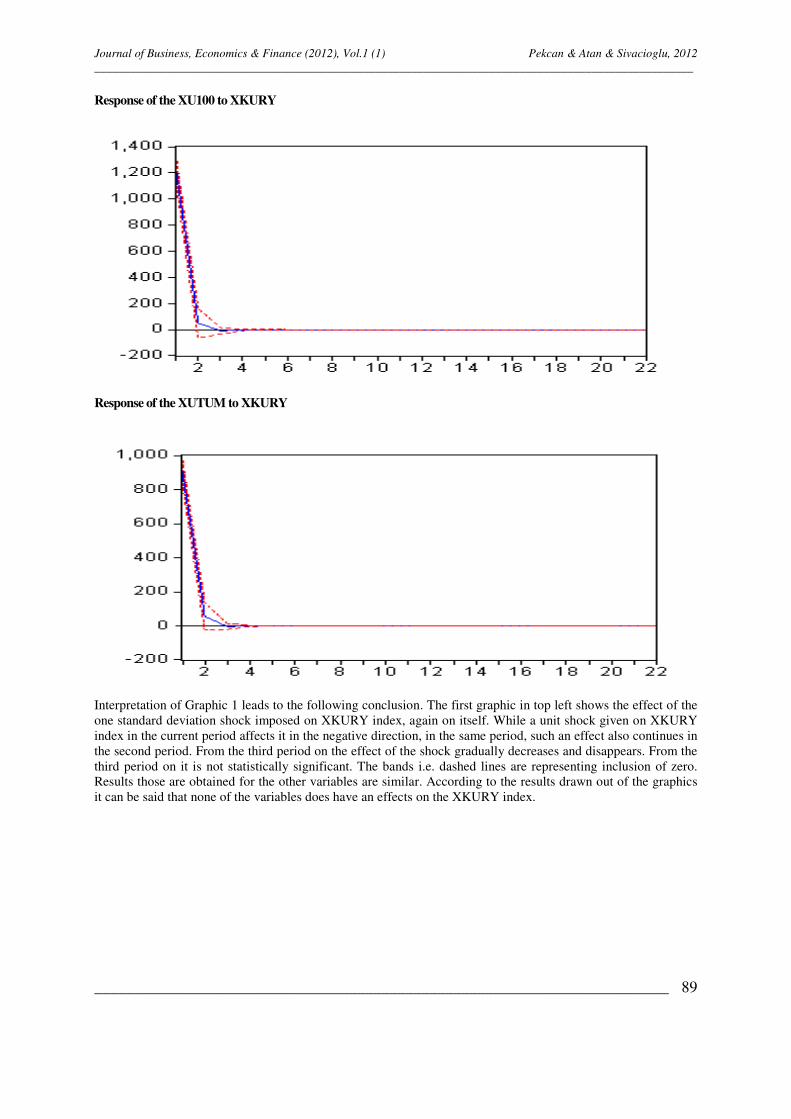
Journal of Business, Economics & Finance (2012), Vol.1 (1) Pekcan & Atan & Sivacioglu, 2012 ____________________________________________________________________________________________________
________________________________________________________________________
89
Response of the XU100 to XKURY
Response of the XUTUM to XKURY
Interpretation of Graphic 1 leads to the following conclusion. The first graphic in top left shows the effect of the one standard deviation shock imposed on XKURY index, again on itself. While a unit shock given on XKURY index in the current period affects it in the negative direction, in the same period, such an effect also continues in the second period. From the third period on the effect of the shock gradually decreases and disappears. From the third period on it is not statistically significant. The bands i.e. dashed lines are representing inclusion of zero. Results those are obtained for the other variables are similar. According to the results drawn out of the graphics it can be said that none of the variables does have an effects on the XKURY index.
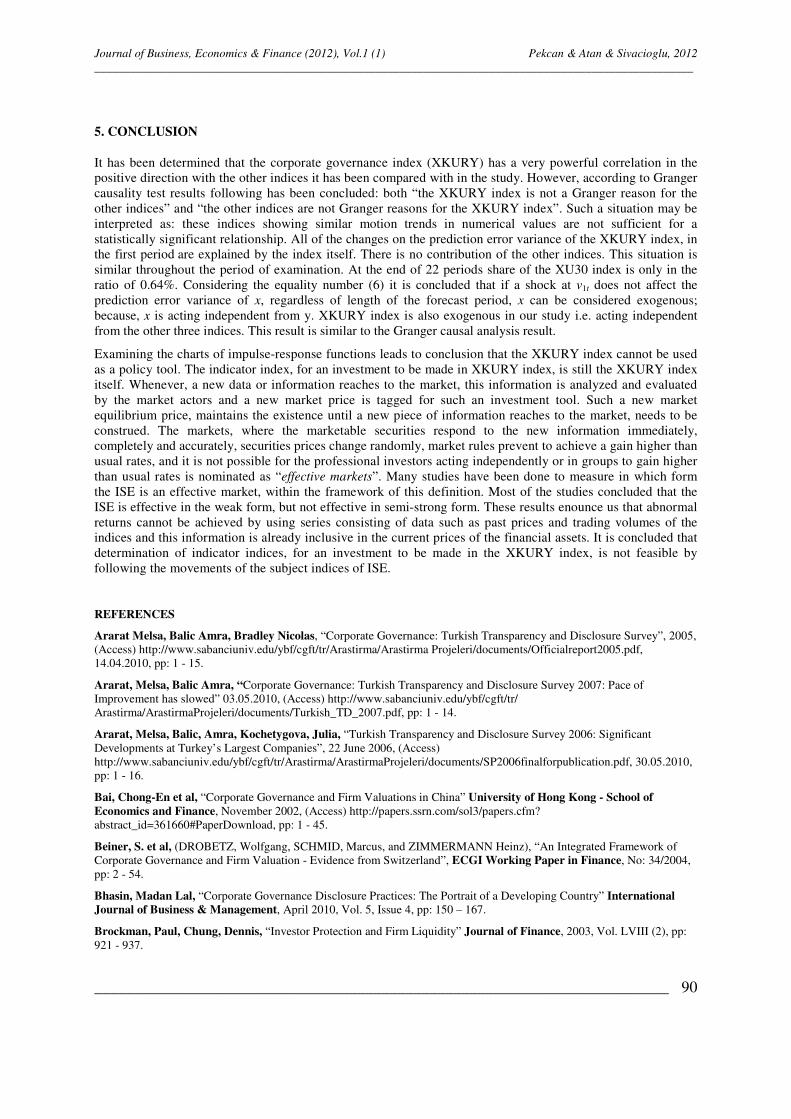
Journal of Business, Economics & Finance (2012), Vol.1 (1) Pekcan & Atan & Sivacioglu, 2012 ____________________________________________________________________________________________________
________________________________________________________________________
90
5. CONCLUSION
It has been determined that the corporate governance index (XKURY) has a very powerful correlation in the positive direction with the other indices it has been compared with in the study. However, according to Granger causality test results following has been concluded: both “the XKURY index is not a Granger reason for the other indices” and “the other indices are not Granger reasons for the XKURY index”. Such a situation may be interpreted as: these indices showing similar motion trends in numerical values are not sufficient for a statistically significant relationship. All of the changes on the prediction error variance of the XKURY index, in the first period are explained by the index itself. There is no contribution of the other indices. This situation is similar throughout the period of examination. At the end of 22 periods share of the XU30 index is only in the ratio of 0.64%. Considering the equality number (6) it is concluded that if a shock at v1t does not affect the prediction error variance of x, regardless of length of the forecast period, x can be considered exogenous; because, x is acting independent from y. XKURY index is also exogenous in our study i.e. acting independent from the other three indices. This result is similar to the Granger causal analysis result.
Examining the charts of impulse-response functions leads to conclusion that the XKURY index cannot be used as a policy tool. The indicator index, for an investment to be made in XKURY index, is still the XKURY index itself. Whenever, a new data or information reaches to the market, this information is analyzed and evaluated by the market actors and a new market price is tagged for such an investment tool. Such a new market equilibrium price, maintains the existence until a new piece of information reaches to the market, needs to be construed. The markets, where the marketable securities respond to the new information immediately, completely and accurately, securities prices change randomly, market rules prevent to achieve a gain higher than usual rates, and it is not possible for the professional investors acting independently or in groups to gain higher than usual rates is nominated as “effective markets”. Many studies have been done to measure in which form the ISE is an effective market, within the framework of this definition. Most of the studies concluded that the ISE is effective in the weak form, but not effective in semi-strong form. These results enounce us that abnormal returns cannot be achieved by using series consisting of data such as past prices and trading volumes of the indices and this information is already inclusive in the current prices of the financial assets. It is concluded that determination of indicator indices, for an investment to be made in the XKURY index, is not feasible by following the movements of the subject indices of ISE.
REFERENCES
Ararat Melsa, Balic Amra, Bradley Nicolas, “Corporate Governance: Turkish Transparency and Disclosure Survey”, 2005, (Access) http://www.sabanciuniv.edu/ybf/cgft/tr/Arastirma/Arastirma Projeleri/documents/Officialreport2005.pdf, 14.04.2010, pp: 1 - 15.
Ararat, Melsa, Balic Amra, “Corporate Governance: Turkish Transparency and Disclosure Survey 2007: Pace of Improvement has slowed” 03.05.2010, (Access) http://www.sabanciuniv.edu/ybf/cgft/tr/ Arastirma/ArastirmaProjeleri/documents/Turkish_TD_2007.pdf, pp: 1 - 14.
Ararat, Melsa, Balic, Amra, Kochetygova, Julia, “Turkish Transparency and Disclosure Survey 2006: Significant Developments at Turkey’s Largest Companies”, 22 June 2006, (Access) http://www.sabanciuniv.edu/ybf/cgft/tr/Arastirma/ArastirmaProjeleri/documents/SP2006finalforpublication.pdf, 30.05.2010, pp: 1 - 16.
Bai, Chong-En et al, “Corporate Governance and Firm Valuations in China” University of Hong Kong - School of Economics and Finance, November 2002, (Access) http://papers.ssrn.com/sol3/papers.cfm? abstract_id=361660#PaperDownload, pp: 1 - 45.
Beiner, S. et al, (DROBETZ, Wolfgang, SCHMID, Marcus, and ZIMMERMANN Heinz), “An Integrated Framework of Corporate Governance and Firm Valuation - Evidence from Switzerland”, ECGI Working Paper in Finance, No: 34/2004, pp: 2 - 54.
Bhasin, Madan Lal, “Corporate Governance Disclosure Practices: The Portrait of a Developing Country” International Journal of Business & Management, April 2010, Vol. 5, Issue 4, pp: 150 – 167.
Brockman, Paul, Chung, Dennis, “Investor Protection and Firm Liquidity” Journal of Finance, 2003, Vol. LVIII (2), pp: 921 - 937.

Journal of Business, Economics & Finance (2012), Vol.1 (1) Pekcan & Atan & Sivacioglu, 2012 ____________________________________________________________________________________________________
________________________________________________________________________
91
Cadbury Committee, “Report of the Committee on the Financial Aspects of Corporate Governance”, Gee Publishing, London, 1992.
Cheffins, Brian R., “Did Corporate Governance "Fail" During the 2008 Stock Market Meltdown? The Case of the S&P 500”, Business Lawyer; November 2009, Vol. 65 Issue 1, pp. 1 - 65
Churaev, Kamil, “The Impacts of Corporate Governance Issues on Values of Turkish Companies”, Unpublished Master's Thesis, 2003, Istanbul.
Clsa, “Corporate Governance in Emerging Markets” CG Watch Report, 2001: 1 (Access) www.clsa.com.
Hamilton, J. D. (1994), “Time Series Analysis”, NJ: Princeton University Press. Princeton,
Granger, C. W. J. (1969), “Investigating Causal Relations by Econometric Models and Cross-Spectral Methods”, Econometrica, 37 (3), August, pp: 424 - 438.
Gompers, P., Ichii, J., Metrick, A., “Corporate Governance and Equity Prices”, Working Papers Series, 2001, No: 8449, NBER, pp: 44 - 68.
Gürbüz, Osman, A., Ergincan, Yakup, Corporate Governance, Its State in Turkey and Suggestions for Its Development, Literatür Yayıncılık, Istanbul. 2004.
Johnson, Simon et al, “Corporate Governance in the Asian Financial Crisis”, Journal of Financial Economics, 2000, 58, pp: 141 - 186.
John, Kose, Senbet, Lemma W., “Corporate Governance and Board Effectiveness”, Journal of Banking and Finance, 1998, Issue 22, pp: 371 - 403.
Kaymak, Turhan; Bektaş, Eralp, “East Meets West? Board Characteristics in an Emerging Market: Evidence from Turkish Banks”. Corporate Governance: An International Review, November 2008, Vol. 16, Issue 6, pp: 550 – 561.
Kaymak, Turhan, Bektaş, Eralp, “Governance Mechanisms and Ownership in an Emerging Market: The Case of Turkish Banks” Emerging Markets Finance and Trade, November-December 2009, Vol. 45, Issue 6, pp: 20 – 32.
La Porta, Rafael et al, (LOPEZ-de-SILANES, Florencio, SHLEIFER, Andrei, VISHNY, Robert), “Law and Finance”, National Bureau of Economic Research Working Paper, No: 5661, Cambridge, 1996, pp: 3 - 34.
OECD, Business Sector Advisory Group on Corporate Governance, 1998.
OECD, Corporate Governance Principles, 1998.
OECD, OECD Principles of Corporate Governance, OECD Publishing, Paris, 2004.
Perron, Phillip, (1989), “The Great Crash, the Oil Price Shock, and the Unit Root Hypothesis”, Econometrica, Vol. 57, Issue: 6; pp: 1361 - 1401.
Selekler, Göksen, Nisan, Öktem, Yildirim, Özlem “Countervailing Institutional Forces: Corporate Governance in Turkish Family Business Groups”; Journal of Management and Governance, 2009, Vol. 13, Issue 3, pp: 193 – 213.
Shipilov, Andrew V., Greve, Henrich, Rowley, Timothy J., “When Do Interlocks Matter? Institutional Logics and the Diffusion of Multiple Corporate Governance Practices” Academy of Management Journal, 2010, Vol. 53, Issue 4, pp: 846 – 864.
Shleifer, Andrei, Vishny, Robert W., “A Survey of Corporate Governance” National Bureau of Economic Research, Working Papers, No. 5554, April 1996, Journal of Finance, June 1997, Vol. LII (2). pp: 737 - 783.
Sivacioğlu, Can Mert, “Corporate Governance, Measurable Effects on Capital Markets and an Application” Unpublished Master's Thesis, 2008, Ankara.
Smith, Adam, “Wealth Of Nations” Culture Publications of Isbank of Turkey / Hasan Ali Yücel Classics Series, November 2006, Istanbul.
CMB, “CMB Corporate Governance Principles”, February 2005 (corrected second release) (Access) www.spk.gov.tr/displayfile.aspx?action=display8file&pageid=159&fn=159.pdf
Variş, Meral, et al, “Capital Markets Corporate Governance Principles”, ISE Magazine, Special Issue, Year 5, Issue 129, pp: 129 - 168.

Journal of Business, Economics & Finance (2012), Vol.1 (1) Onyuma & Mugo & Karuiya, 2012 ____________________________________________________________________________________________________
________________________________________________________________________
92
DOES CROSS-BORDER LISTING (STILL) IMPROVE FIRM FINANCIAL PERFORMANCE
IN EASTERN AFRICA?
Samuel O. Onyuma1 and Robert K. Mugo2 and John K. Karuiya3
1Department of Business Management & Economics, Egerton University (Laikipia University College), [email protected] 2Department of Accounting & Finance, Kabarak University 3Department of Accounting, Finance & Management Science, Egerton University (Nakuru Campus College)
KEYWORDS
Cross Border Listing; Financial Performance, East Africa Stock Exchanges, Stock market Integration.
ABSTRACT
Corporations can raise their development capital domestically or through cross-borders listing. Literature reveals that cross-listing of shares enhances firm’s visibility and value, and lessens information asymmetry. However, there is scanty empirical evidence on how it affects a firm’s financial performance. The objective of this study was to examine whether cross-border listing affects firm’s financial performance in Eastern Africa. Financial data spanning three years before and after cross-listing was collected from financial statements of three Kenyan firms which have cross-listed their shares in USE, DSE, and RSE between 2001 and 2011. Using financial ratio analysis, liquidity, profitability, gearing and investor ratios were computed three years before and after cross-listing. The results show a low positive financial performance in terms of liquidity upon cross-listing. Market confidence as measured by P/E ratio also improved. This implied that regional cross-listing may increase firm’s investor confidence. Although profitability and gearing ratios improved in absolute terms post cross-listing, this improvement was not statistically significant. In fact, the investor ratios like dividend yield reduced, but such reduction was not statistically significant. Overall, the findings provide some evidence that firms may benefit from cross-listing in terms of liquidity and confidence. Our analysis has uncovered no clear evidence of material value creation to shareholders of cross-listed firms, except improved market confidence. Firm managers and securities markets policy makers in EAC should give thorough considerations to these issues as they seek a regional approach to capital raising and stock market development.
1. INTRODUCTION
Corporations require resources to enable them serve the needs of their customers effectively. This implies that their owners have to go an extra mile to find the funds necessary to sustain their customers. Most common types of long-term financing for firms include long term debt, common stock, preferred stock and retained earnings. Thus firms may borrow or use their own available savings. However, as they continue to expand they resort to borrowing. Equity or debts are the only options at their disposal yet most prefer to use equity because it forms a permanent source of funding that cannot be easily cancelled. When firms raise equity they may raise it within their own boundaries, or beyond their national boundaries to raise the required resources. The former is referred to as listing, while the latter is known as cross-listing. Listing is the admission of a company into a stock market after meeting certain regulatory requirements set by the regulatory authority of that particular country. For a company to be listed it has to be a public company. Cross-listing refers to the listing of ordinary shares of a firm on a different exchange other than its home stock exchange. It is therefore where a firm lists its shares for trading on at least two stock exchanges located in different countries. To accommodate a wide variety of firms, exchanges have designed several different listing categories, each with a different set of requirements and, to the extent that investors are knowledgeable about this structure, varying potential benefits. There are two broad types of cross-border Listing. First is the ordinary listing. Besides the ordinary listing abroad being prestigious, it is also the one for which requirements are the most stringent. Companies seeking a listing their equity overseas must satisfy several requirements to qualify for listing according to standards set for overseas companies by the
Journal of Business, Economics & Finance (2012), Vol.1 (1) Onyuma & Mugo & Karuiya, 2012 ____________________________________________________________________________________________________
________________________________________________________________________
93
exchanges. When approached by any firm for listing, the exchange conducts an investigation of the firm. The exchange requires the company to provide various pieces of information, to meet certain criteria such as minimum levels market capitalization and certain accounting variables (income, etc.) and also request the firm to recast its financial statements and other disclosures in the format prescribed by the exchange. The rigor of the investigation of the firm performed by the exchange prior to listing, and the accessibility to investors of the information contained in the various financial statements provided by the firm subsequent to listing depends on the listing standards set by the exchange. The other type is depositary receipts. Firms wishing to list shares on the foreign market have also the option of participating in Depositary Receipts program. Depositary Receipts are negotiable bank-issued financial securities representing publicly traded security - equity (usually) or debt, of a company listed in one market which is traded on another market. Such a receipt therefore allows investors to hold shares in equity of other countries without need to go directly into the foreign markets.
Although conventional wisdom has long held that firms cross-list their shares on other developed exchanges buy their access to more investors, greater liquidity, a higher share price, and a lower cost of capital, the strategy seems not to make much sense perhaps because capital markets have become more liquid and integrated and investors more global, or perhaps because the benefits of cross-listing were over stated from the beginning. With integration, firms would raise as much capital as they desire, and profits would consequently go up. This is however not the case, the world markets are segmented making companies to carefully evaluate where they will raise their much needed funds. However, it is not clear why there are many firms listed on the Kenyan Bourse, and only a few have cross-listed across the borders. Also, it has not been established empirically what the real effects of cross-border listing on a firm’s financial performance. The literature is also thin in East African Community (EAC) on cross-listing calling for the need to vouch the possible impact of cross-listing on firms’ financial health. The objective of the study was therefore to evaluate the effects of cross-border listing on financial performance of Kenyan listed firms that have cross-listed in the East African stock market. The rest of this article is structured as follows: Section 2 presents the key literature describing the structure of regional cross-listings in Africa, particularly east Africa, and the benefits of cross-listing for both home and host countries. Section 3 describes the method used, and finally, Section 5 which presents the result and discussion followed by conclusion and suggested implications for policy.
2. LITERATURE REVIEW
2.1 The Nature of East African Stock Exchanges
There are currently four (4) securities exchanges forming the EAC securities market. The Nairobi Securities Exchange (NSE), formed in 1954, is one of the active capital markets in Africa. The NSE is sub-Saharan Africa's fourth-largest bourse with 58 listed companies and 24 brokerage firms. Trading takes place on Mondays through Fridays between 10.00am and 3.00pm. NSE was a regional security market up to 1972 when it lost its regional character following the nationalization, exchange control and other inter-territorial restrictions introduced in neighbouring Tanzania and Uganda. Currently, the ceiling on foreign investment is 40 percent for institutions and 5 percent for individuals (Onyuma, 2012). This market is regulated by the Capital Markets Authority, which operates under the jurisdiction of the Ministry of Finance.
The NSE successfully installed an automated trading system (ATS) in November 2007 and central securities depositories (CSD) in November 2004. The exchange is also undergoing restructuring of its governance system through demutualization, which is expected to be completed by the end of the second quarter of 2012. Characterized by its liquidity, market capitalization and turnover, the NSE may be classified as both emerging market and frontier market. NSE is therefore a model market in view of its high returns, vibrancy and well developed market structure. It therefore, raises interest and sets a precedent for comparison with other emerging markets in Eastern Africa and the world at large (Nyambura, 2005). The second largest exchange in EAC is Dar es Salaam Stock Exchange (DSE). The DSE was incorporated in September 1996 as a private limited company. Trading takes place four days a week: Tuesdays, Wednesdays, Thursdays and Fridays between 10.00am and 12.00 noon. The exchange has also put in place a CSD similar to the one installed by the NSE. There are nine firms listed on the DSE, three being the cross-listed firms from the NSE. Thirdly, the Uganda Securities Exchange (USE), which was launched in June 1997, is run under the jurisdiction of the Capital Markets Authority, which reports to the Central Bank of Uganda (Onyuma, 2012). The Exchange's doors opened to trading in January 1998. Trading occurs Monday to Friday. There is no capital gains tax and restrictions on foreign investors. There currently ten listed, four of which are cross-listed from the NSE. The automation of the USE is still hampered by the political constraints as Parliament is yet to legislate a law to regulate the same.
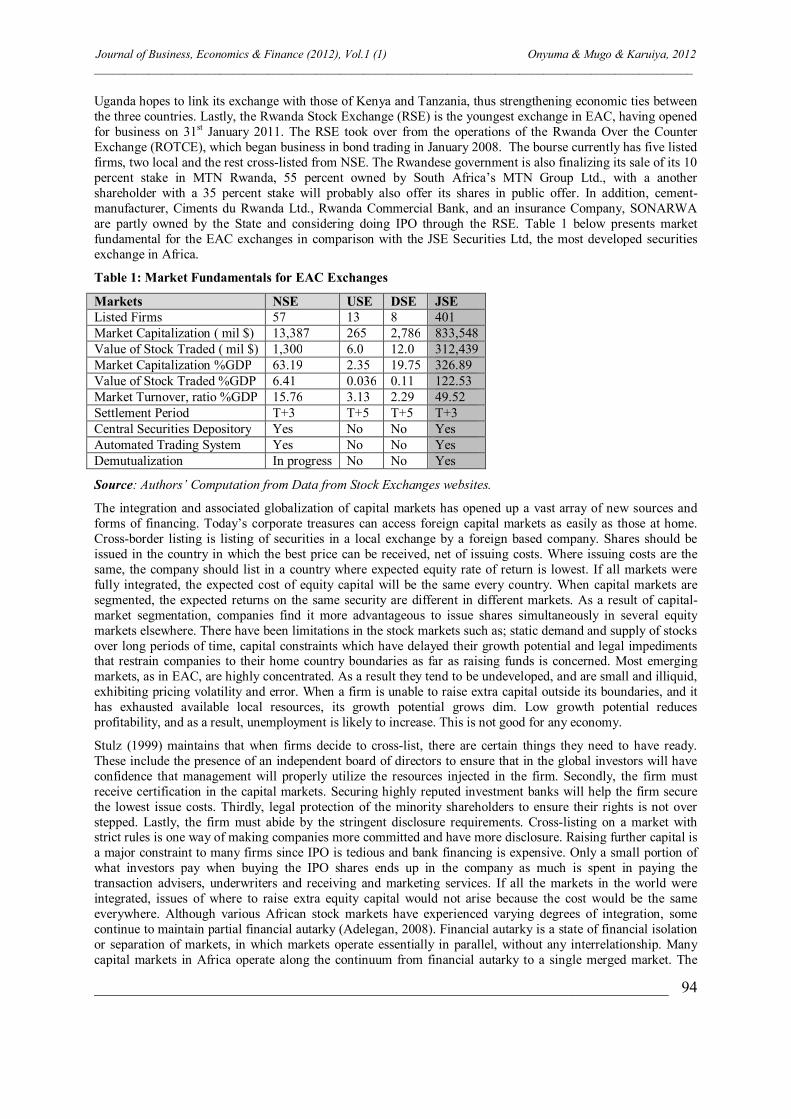
Journal of Business, Economics & Finance (2012), Vol.1 (1) Onyuma & Mugo & Karuiya, 2012 ____________________________________________________________________________________________________
________________________________________________________________________
94
Uganda hopes to link its exchange with those of Kenya and Tanzania, thus strengthening economic ties between the three countries. Lastly, the Rwanda Stock Exchange (RSE) is the youngest exchange in EAC, having opened for business on 31st January 2011. The RSE took over from the operations of the Rwanda Over the Counter Exchange (ROTCE), which began business in bond trading in January 2008. The bourse currently has five listed firms, two local and the rest cross-listed from NSE. The Rwandese government is also finalizing its sale of its 10 percent stake in MTN Rwanda, 55 percent owned by South Africa’s MTN Group Ltd., with a another shareholder with a 35 percent stake will probably also offer its shares in public offer. In addition, cement-manufacturer, Ciments du Rwanda Ltd., Rwanda Commercial Bank, and an insurance Company, SONARWA are partly owned by the State and considering doing IPO through the RSE. Table 1 below presents market fundamental for the EAC exchanges in comparison with the JSE Securities Ltd, the most developed securities exchange in Africa.
Table 1: Market Fundamentals for EAC Exchanges
Markets NSE USE DSE JSE Listed Firms 57 13 8 401 Market Capitalization ( mil $) 13,387 265 2,786 833,548 Value of Stock Traded ( mil $) 1,300 6.0 12.0 312,439 Market Capitalization %GDP 63.19 2.35 19.75 326.89 Value of Stock Traded %GDP 6.41 0.036 0.11 122.53 Market Turnover, ratio %GDP 15.76 3.13 2.29 49.52 Settlement Period T+3 T+5 T+5 T+3 Central Securities Depository Yes No No Yes Automated Trading System Yes No No Yes Demutualization In progress No No Yes
Source: Authors’ Computation from Data from Stock Exchanges websites.
The integration and associated globalization of capital markets has opened up a vast array of new sources and forms of financing. Today’s corporate treasures can access foreign capital markets as easily as those at home. Cross-border listing is listing of securities in a local exchange by a foreign based company. Shares should be issued in the country in which the best price can be received, net of issuing costs. Where issuing costs are the same, the company should list in a country where expected equity rate of return is lowest. If all markets were fully integrated, the expected cost of equity capital will be the same every country. When capital markets are segmented, the expected returns on the same security are different in different markets. As a result of capital-market segmentation, companies find it more advantageous to issue shares simultaneously in several equity markets elsewhere. There have been limitations in the stock markets such as; static demand and supply of stocks over long periods of time, capital constraints which have delayed their growth potential and legal impediments that restrain companies to their home country boundaries as far as raising funds is concerned. Most emerging markets, as in EAC, are highly concentrated. As a result they tend to be undeveloped, and are small and illiquid, exhibiting pricing volatility and error. When a firm is unable to raise extra capital outside its boundaries, and it has exhausted available local resources, its growth potential grows dim. Low growth potential reduces profitability, and as a result, unemployment is likely to increase. This is not good for any economy.
Stulz (1999) maintains that when firms decide to cross-list, there are certain things they need to have ready. These include the presence of an independent board of directors to ensure that in the global investors will have confidence that management will properly utilize the resources injected in the firm. Secondly, the firm must receive certification in the capital markets. Securing highly reputed investment banks will help the firm secure the lowest issue costs. Thirdly, legal protection of the minority shareholders to ensure their rights is not over stepped. Lastly, the firm must abide by the stringent disclosure requirements. Cross-listing on a market with strict rules is one way of making companies more committed and have more disclosure. Raising further capital is a major constraint to many firms since IPO is tedious and bank financing is expensive. Only a small portion of what investors pay when buying the IPO shares ends up in the company as much is spent in paying the transaction advisers, underwriters and receiving and marketing services. If all the markets in the world were integrated, issues of where to raise extra equity capital would not arise because the cost would be the same everywhere. Although various African stock markets have experienced varying degrees of integration, some continue to maintain partial financial autarky (Adelegan, 2008). Financial autarky is a state of financial isolation or separation of markets, in which markets operate essentially in parallel, without any interrelationship. Many capital markets in Africa operate along the continuum from financial autarky to a single merged market. The
Journal of Business, Economics & Finance (2012), Vol.1 (1) Onyuma & Mugo & Karuiya, 2012 ____________________________________________________________________________________________________
________________________________________________________________________
95
main forms of stock market integration are (Onyuma, 2006): internationalization through free foreign direct investment and portfolio capital flows; and regional integration through full merger and cross-listing of stocks like in the case of Bourse Regionale des Valeurs Mobilieres (BRVM), which was established by the 8 West African Economic and Monetary Union (WAEMU) countries and began operations in September 1998, and the BVMAC established by the 6 CEMAC countries and began operation in 2008 (Onyuma, 2012). Regional cross-listings of stocks exist in South Africa, Botswana, Namibia, Nigeria, Ghana, Kenya, Tanzania, Uganda, and Zambia (Adelegan, 2008). Full integration has a number of merits and demerits. Such integration can bring about efficiency in allocation of resources, lower inter-market barriers and operating costs, the formation of larger and more liquid markets, more diversified and better risk sharing, innovation, economies of scale and scope, market access, competition, and completeness (Faruque, 2007). However, full regional integration brings with it contagion and spill over risks in addition to typical financial risk - liquidity risk, credit risk, market, and operational risks(Chan-Lau, 2010). With a single market and close financial links, any unfavourable event in any market/country will affect the other markets/countries. Difficulties in consolidating trading and post-trading infrastructures, legal differences, and standardization barriers are additional impediments to full integration of stock markets.
Partial integration brings efficiency in resource allocation, improved liquidity, portfolio diversification, better risk sharing, and stock market development. It is also likely to entail lower financial contagion and spill over risk (Adelegan, 2009). While interoperability, alliances, and joint ventures involve integration of market infrastructures and processes, which are cumbersome and difficult to achieve, cross-listing of stocks does not involve such integration of market infrastructures or trading practices. Thus, regional integration through regional cross-listing, may thus, facilitates cross-border equity investment by firms and operations between stock exchanges under existing market arrangements. From the firms’ websites, Kenyan companies that have undertaken cross-border listing have strong financial base respect to profitability, branch networking, and good growth potential. Although seven companies out of the 58 listed on the NSE have undertaken cross-border listing of their shares in markets in Uganda, Tanzania and Rwanda, none of the listed firms from these other exchanges has cross-listed on the NSE.
2.2 Worldwide Trends in Cross Listing
This study draws its roots from the market segmentation theory that advocates that firms consider markets where the costs of operations are cheapest. The costs may be different due to tax rate differentials, interest rate parities, inflation, reporting standards, exchange rate differentials and regulatory requirements. Firms will undertake cross-listing in countries where the cost of equity is least with the aim of improving their profitability prospects. Firms considering issuing securities in another country consider the issuing costs. The securities are issued in essentially segmented markets, each of which finds its own equilibrium independently. Also referred to as Euro-Equity shares elsewhere, cross-listing started during the last two decades in the United States (US). In the US, euro-equity issues have become popular because of the anonymity enjoyed with bearer shares. It has grown rapidly in absolute size and proportion of shares sold in other countries being substantial. During the past two decades, the pace of globalization in capital markets has accelerated and broadened in scope to make easier ownership and trading in securities from around the world. The pace of international cross-listing around the world has decelerated dramatically during the last few years. This is due to combination of global macro-economic, political and regulatory factors. Cross listings as a fraction of their own total listing the order from the highest is; Mexico (53%), Swiss Exchange (31%), and Euronext (25.1%). Thus world cross-listing reached peak in 1999, and since then have remained steady.
Conchrane et al. (1996) notes that in USA, market price reactions around foreign listings since the growth in the demand for equity financing has spurred increased cross-border listings as individuals and institutions invest their funds in foreign equities to diversify their portfolios and to earn higher risk-adjusted yields. Cross-listing of stocks in the USA has increased dramatically over the past twenty years. Karolyi (2004) reports that at the end of 2003 there were over 2000 foreign firms listed in the USA, more than twice the amount listed in 1990. The total value of trading across world markets reached its peak in 1999 and has remained steady across all major stock exchanges through to 2004. The fraction trading comprised of foreign listings also levelled off at a median of 5.8% in 2004, though this was double the figure noted in 1995. London Stock Exchange (LSE) has maintained the largest absolute amount of $2.2 billion in trading foreign listing. It is the second largest in terms of the fraction of dollar trading (53%) after the Swiss Exchange (93.53%). The Swiss Exchange benefitted greatly from Virt-X, a facility for trading European blue-chip stocks initiated in 2001. Other notably large markets in dollar terms are NYSE and NASDAQ.
Journal of Business, Economics & Finance (2012), Vol.1 (1) Onyuma & Mugo & Karuiya, 2012 ____________________________________________________________________________________________________
________________________________________________________________________
96
2.2.1 Cross-border Listing in Africa
The African Stock Exchanges Association (ASEA) was formed achieve common listing requirements, disclosure standards applicable to advanced capital markets. It is aimed at encouraging the development of stock exchanges in all African countries and finally integrates African exchanges through technology.
The regional cross-border listing trail was blazed by the JSE Securities Exchange of South Africa when it cross-listed on the Namibia Stock Exchange (NSX) on the first day of trading of the NSX in October 1992. Subsequently, South Africa has cross-listed 28 firms on the NSX. There has also been regional cross-listing between stock markets in Botswana and South Africa since 1997; Malawi and South Africa in 1999; Nigeria and South Africa first in 2001 and later in 2006 (MNET/Super Sport, a JSE primary listed company was cross-listed on the Nigerian Stock Exchange in 2001and delisted in 2003); Zambia and South Africa in 2003; and Ghana and South Africa in 2004. Triple listing of stocks has also commenced, with the three East African Exchanges of Kenya, Uganda and Tanzania in 2004; and Ghana, Nigeria, and WAEMU (Bourse Régionale des Valeurs Mobilières) exchanges in 2006 (Onyuma, 2006).
There have been further agreements to cross-list among stock markets in the African region. South African exchange has signed a MoU with Botswana, Egypt, Ghana, Kenya, Namibia, Nigeria, and Uganda. Nigerian market has signed a MoU with Ghana and WAEMU, while the NSE has signed MoUs with Ghana, Nigeria, Tanzania, Uganda, and WAEMU. Pagano et al. (2002) argue that company size and especially the industry’s market-to-book ratio increase the likelihood of a company going public or cross-listing. Larger firms may be able to take the advantage of economies of scale in the offering process. Firms that are older and have a longer operating history should be easier to value; hence old firms are more likely to go public. East African Stock markets have a plan to merge, and form one stock exchange.
It is now easier to cross-list in the East African Bourse due to the following incentives: First there are no requirements of Reporting Accountants Report. Second, only a summarized information memorandum is required. Third incentive is that an abridged financial statement for the last five years is acceptable. Fourth, provision of the latest annual or interim accounts submitted to the home exchange would be accepted as the latest financial statements. Finally, standard initial cross-listing fee of US$5,000 against previous US$21,126 has been set for firms listing their equities across Kenya and Uganda borders (Onyuma, 2012).
However, only companies in the Main Investment Market Segment in their home country are allowed to cross-list their securities in the East African Bourse. This noble act, if successful, will provide employment opportunities for the residents of the region. Cross listing plans in Kenya started in 1997 when an agreement was reached among the capital authorities of Kenya, Tanzania and Uganda. This agreement was under the East African Security Regulatory Authorities (EASRA) (Kuria, 2008).
Cross border listing has gained significance over the past few years since the signing of the East Africa Community treaty in 1999. The development of cross listing across national stock markets in Tanzania, Kenya, Uganda and Rwanda is a milestone in the EAC’s drive for regional integration. The three East African Stock Exchanges, namely Nairobi securities Exchange (NSE), Uganda Securities Exchange (USE) Dar es Salaam Stock Exchange (DSE), and the Rwanda Stock Exchange have established a working relationship among them in the spirit of integrating and developing capital markets in the East African Community (EAC). The exchanges operate under the umbrella of East African Stock Exchanges Association (EASEA). EASEA is a member of Capital Markets Development Committee (CMDC) of the EAC. Other members of the CMDC include East African Securities Regulatory Association (EASRA) and East African Stock Exchange Brokers Association (EASBA). The three associations have the common objective of integrating the three markets in order to achieve growth of the market with the ultimate aim of economic union in the EAC. The three markets are aiming at achieving this objective in a systematic, coordinated manner that will facilitate the availability of listed securities in the three markets simultaneously. To this end EASEA has determined mass cross listing as the key activity that will achieve this objective. The East African Member States Securities and Regulatory Authorities (EASRA) comprising capital market authorities of Kenya, Tanzania, and Uganda ware established on March 5, 1997 through the signing of an MOU. It was set up with the objective of establishing a framework for mutual cooperation in the area of capital market development, harmonization of securities laws, and promotion of information-sharing and cooperation among members. The geography of cross listing has changed considerably with both Kenya Airways (KQ) and East Africa Breweries Limited (EABL), Jubilee Insurance Holding (JIH), Equity Bank (EB), Kenya Commercial Bank (KCB), Nation Media Group (NMG), and Centum Investment Company Ltd. (Centum) which are Kenyan firms, listing in Uganda, Tanzania and Rwanda. Consequently, cross
Journal of Business, Economics & Finance (2012), Vol.1 (1) Onyuma & Mugo & Karuiya, 2012 ____________________________________________________________________________________________________
________________________________________________________________________
97
listing in East Africa has become a way of high quality innovative firms to distinguish themselves from others. But with the NSE announcing mass cross listing in East Africa, this trend is likely to change with cross listing firms citing more monetary and non-monetary benefits that will accrue to them if they list in Rwanda, Tanzania and Uganda. There are four securities exchanges in EAC region. The stock market in Kenya is called the NSE, that in Uganda is known as USE, the one in Tanzania is called DSE, while the market in Rwanda is the RSE – formerly, Rwandan Over- the-Counter Market. Of these markets, the NSE is the oldest and more developed market with a running central securities depository (CSD) and an automated trading system (ATS). Before exploring the benefits and likely consequences to be faced by companies cross listing in East Africa, it is paramount that we understand the history and extend to which the security markets integrate in these three countries.
There are currently seven (7) Kenyan companies listed on the Uganda Securities Exchange (USE) and five (5) listed on the Dar-es-Salaam Stock Exchange (DSE). These companies contribute an estimated 84 percent and 65 percent of market capitalization on the USE and the DSE respectively1. The EABL, KQ, JHL, KCB, and NMG which are cross-listed on the USE and the DSE; EB and Centum are also cross-listed on the USE. Two Kenyan cross-listing on the RSE include Centum, and KCB. In fact, Nation Media Group is cross listed in all the three markets. The NSE however does not yet have any firm with a primary listing on the other EAC Exchanges listed on its trading platform. With a view to offering Kenyan investors access to the economic growth potential of the EAC Partner States, the NSE is targeting two regional cross-listings into Kenyan market by the end of the first quarter of 2012. By cross listing on the NSE, issuing companies from the other EAC Partner States can look forward to increased liquidity, and deep pools of capital. Last but by no means least, cross-listing provides a public profile in the Kenyan market through which the listed company can market their goods and services. Table 2 below presents the NSE listed firms which have cross-listed on the other EAC exchanges and dates in which they cross-listed.
Table 2: Regional Cross-Border Listings in the EAC Market
Company Primary Listing
Date of Cross Listing
Bourse where cross listed
EABL NSE 27th March 2001 USE Kenya Airways NSE 28th March 2002 USE Kenya Airways NSE 1st October 2004 DSE EABL NSE 29th June 2005 DSE Jubilee Insurance Holdings NSE 14th February 2006 USE Jubilee Insurance Holdings NSE 27th June 2006 DSE KCB NSE 29th Nov. 2008 USE KCB NSE 8th June 2009 RSE Equity Bank Ltd NSE 18th June 2009 USE Centum Investments NSE 11th February 2010 USE Nation Media Group NSE 2nd November 2010 RSE Nation Media Group NSE 19th October 2010 RSE Nation Media Group NSE 21st February 2011 RSE
Source; Authors’ Compilation from Stock Exchanges and Companies’ websites.
2.3 Potential Benefits of Cross-listing
Capital market development literature indicate that regional integration is important for stock market development in smaller emerging countries (Demirguic-Kunt et al., 2008, Tahari et al, 2007, Shah et al., 2008). Proponents of cross-listing have argued that regional integration can bring greater efficiency, synergies, and economies of scale; attract the foreign flow of funds; foster risk sharing and portfolio diversification; act as an impetus to financial sector reforms, thereby broadening the competitiveness of regional financial systems and minimizing the risks of financial instability; facilitate capital market development; and lead to economic growth
1 See, The Exchange, a magazine of EASEA, Issue No. 1 (May) 2011, page 21.
Journal of Business, Economics & Finance (2012), Vol.1 (1) Onyuma & Mugo & Karuiya, 2012 ____________________________________________________________________________________________________
________________________________________________________________________
98
(Faruqee, 2007; Adelegan, 2008). Developed markets like in Europe have experienced many approaches to integration, including interoperability, alliances, mergers, joint ventures, and horizontal and vertical approaches. A certain level of success has been recorded, although the multiplicity of the European system has continuously created barriers to efficient cross-border trading, clearing and settlement.
Regional integration has been undertaken by African capital markets with attendant financial flows in various forms including that of cross-border listing of stocks (Onyuma, 2006). Theoretical asset pricing models have predicted an increase in stock prices upon cross-listing. Decisions on regional cross-listing are taken by firms, while market regulators, policy makers and stock exchanges facilitate the regional approach to cross-listing by signing MoUs and putting in place the necessary conditions to harness the benefits of regional cross-listing and develop their capital markets. These conditions include (Adelegan, 2009): sound legal and regulatory frameworks, macroeconomic and political stability, harmonization of listing rules, accounting laws and disclosure requirements across the region, strong money markets, and incentives for listed firms and other market participants and efforts towards monetary union.
If regional cross-listing is beneficial to the firms and to the countries of both primary listing (home country) and secondary listing (host country), then policy makers of the countries of primary and secondary listings need the right policy handles to encourage facilitate and steer regional cross-listing efforts by firms. Through complementary policy based efforts, policy makers can set the stage for the regional cross listing of stocks and harness the numerous benefits that are associated with it. In addition to providing the avenue for cross-border trading in stocks, the home firm and country of primary listing can therefore, enjoy a number of benefits including: greater access to lower cost equity finance from a wider investor base – if cross-listing is accompanied by an initial public offering, the financing of the firm is increased and its cost of capital is reduced as equity increases. An optimal gearing level of equity and debt will result in the lowest weighted average cost of capital (Onyuma, 2006) –; enhanced business reputations through openness and more stringent financial disclosure; a reduction in transaction costs for investors through gains in market liquidity as a result of cross-listings (Claessens et al., 2002); mitigation of market segmentation through a reduction in barriers to foreign investors that arise from regulation and lack of information; and addressing of information asymmetries and enhanced corporate governance (Faruquee, 2007).
Cross-listing is also beneficial for the firm and country of secondary listing. In addition to increasing stock market liquidity, cross-listing also: provides an avenue for portfolio diversification for a wider investor base; improves the employment level through gains from the expansion of operations in the country of secondary listing; enhances both the business reputation of the cross-listed firm and other national listed firms; reduces spreads on interest rates and debt securities by increasing the number of investors in the stock market, thereby reducing the concentration of investors in the money market; increases the availability and accuracy of public information and lowers information asymmetries; and enhances corporate governance, and market transparency and quality. Regional cross-listings in sub-Saharan Africa have been associated with expansion and the setting-up of operations in the host countries. In almost all cases, firms are large with a strong base in their home countries, and they first established operations in their host countries before deciding to cross-list. In fact, almost all the cases, the listing requirements include a condition that a firm must have established an operational base for about three years before it can be listed or cross-listed on the stock exchange of the host country. Many cross-listings are undertaken to expand operations in the host countries. Almost all the firms that are cross-listed (about 98 percent) have set up operations in the host countries (Onyuma, 2012). For example, EABL, with Kenya as the home country, has a subsidiary Uganda Breweries Ltd in Uganda, its host country of cross-listing. It acquired a financial state in Uganda Breweries in 1959. Upon cross-listing in 2001, EABL purchased the entire issued ordinary share capital of International Distillers Uganda Ltd from Selviac Nederland B.V costing Sh. 300 million, and a brewery in Tanzania. Jubilee Insurance Group has subsidiaries in Uganda and Tanzania; Kenya Airways owns 49 percent of Precision Air of Tanzania; KCB also has subsidiaries in Uganda and Rwanda; Ecobank Transnational has operations in the Cote D’Ivoire (WAEMU) the home country and in Ghana and Nigeria, the host countries; Investec and Ellerine have operations in South Africa and Botswana; and the 28 firms that are cross-listed in South Africa and Namibia have an operational base in both countries. The only exception is Oando PLC, listed in its home country Nigeria, but registered as an external firm and listed on the JSE, South Africa. Cross-listing in Africa has been generally accompanied by an initial public offering and/or secondary market listing.
Regional cross-listings in Africa have either been policy driven or market driven (Adelegan, 2009). Some of the government policy induced regional cross-listings are the cross-listings between the Johanesburg Stock Exchange (JSE) and Namibia Stock Exchange (NSX); and those in the EAC stock exchanges (NSE and USE and

Journal of Business, Economics & Finance (2012), Vol.1 (1) Onyuma & Mugo & Karuiya, 2012 ____________________________________________________________________________________________________
________________________________________________________________________
99
DSE). Cross-listing of many JSE listed firms, on the NSX has been motivated by the imposition of capital controls on portfolio flows and by the domestic investment requirements set by the Namibian authorities in an attempt to keep the large surpluses of the country’s pension and insurance funds invested in Namibia. By cross-listing, JSE firms were able to qualify as Namibian investments. Similarly, the cross-listing of East African Breweries on the USE and DSE was linked to ensuring market access for beer trade throughout the EAC region. The market driven cross-listings, on the other hand, include the West African triple cross-listing of Ecobank on the BRVM, the Nigerian Stock Exchange (NiSE), and Ghana Stock Exchange (GSE); the cross-listing of Oando on the NiSE and the JSE; and the cross-listing of Shoprite on the JSE and Lusaka Stock Exchange (LuSE) in Zambia. Irrespective of the reason for the regional cross-listing, it is beneficial to both the host and home countries.
2.4 Possible Effect of Cross-Border Listing
A body of literature has studied the impact of the international cross-listing of stocks by firms from emerging economies on the local capital market (Domowitz et al. 1998; Hargis and Ramanlal, 1998; Miller, 1999; Hargis, 2000; Claessens et al, 2002; Jayakumar, 2002; and Levine and Schmukler, 2003). Domowitz et al. (1998) examine the impact of international cross-listing where investors acquire costly information and highlight the importance of intermarket information linkages using data from the Mexican stock market. Findings from the home countries show that the impact of cross-listing reflects the costs of order flow fragmentation and the benefits of increased competition; and cross-listing is associated with positive excess returns that accrue largely to stocks open to foreign investors prior to cross-listing.
Miller (1999) notes abnormal returns around the announcement date of American Depository Receipts (ADR) and also finds that market reaction is related to choice of exchange, geographical location and avenue for raising equity capital. Previous studies have concentrated on stock price reactions to first international cross-listing, especially ADR, and have been silent on the impact of regional cross-listing on firm value (Jayaraman et al 1993). Switzer (1987) discusses market reactions to cross-border listing announcements for Canadian listings on the US markets, (Miller, 1996) for a small sample of non-US firms on the US markets, and Lau et al. (1994) discusses about US firms listings in other stock exchanges. About post-listing performance, studies have been done in numerous countries by (Switzer, 1986) for Canadian listings on US markets, (Miller, 1986) for non-US listings on the US markets. Inder et al. (2004) assessed whether cross-listing leads to a higher firm growth and found externally financed firm grew following cross-listing. The cross-listed firms exhibited greater externally financed firm growth in comparison to a matched sample of non cross-listed firms. After cross listing, cross-listed firms experience higher externally financed growth rates than the matched sample of non cross-listed firms. Cross-listing can therefore act as a mechanism through which firms can improve their access to lower cost of external financing and consequently use the funds to invest in viable projects it can enable more investor recognition, enhances liquidity, mitigates the costs due to market segmentation, and affirms a strong commitment to stringent rules backed by stringent enforcement.
Burns and Bill (2006) assessed the issue of cross-listing and legal bonding, and whether cross-listing in the USA leads to complete legal bonding or whether reputational bonding and the protection of minority interests in the acquirer’s country are still important factors in investors’ decision to hold shares in cross-listed firms. They found that compared to US firms, cross-listed firms are less likely to use equity in takeovers of USA target firms and that it does not provide complete bonding. Cross-listed firms from countries with poorer legal protections are less likely to finance with equity and pay higher premiums than cross-listed firms from countries with better legal protections. Results suggest that while cross-listing reduces barriers to investment, there are limits to its ability to completely ignore both legal environment and the importance of monitoring of financial intermediaries. According to King and Segal (2004), firms choose to cross-list their shares because it represents an opportunity to improve a firm’s corporate governance. Cross-listing is a vehicle through which a firm’s management can ‘bond’ themselves to a legal system with more protections against management self dealing or excessive consumption of private benefits of control (Burns and Bill, 2006). This is true for firms that originate from relatively less-developed country with weaker institutions. For instance firms from Africa which cross-list on the American market has to maintain the standards of the American system. This in essence will improve their governance practices. The firm conducting the issue will have more source of funding, and the funds will be relatively cheap. The shares of the firm will become more liquid because there will be a wider market in which to trade from. Increased liquidity will improve a company’s market capitalization. Karolyi (2004) noted that corporate managers that have initiated cross listings for their firms cite liquidity as a main motivator. Information based traders seek to camouflage their information by timing their trading when the markets are thick with other
Journal of Business, Economics & Finance (2012), Vol.1 (1) Onyuma & Mugo & Karuiya, 2012 ____________________________________________________________________________________________________
________________________________________________________________________
100
liquidity traders. This means that since all are similarly motivated, they are strategic in selecting their trading location in the thickest of the competing markets. This explains the predictions about clustering of trading volume around market open and closes, about clustering of trading volumes in some markets.
Cross- listing of stocks are positively viewed by investors because the action taken by the management circumvent many of the regulatory restrictions, costs, and information problems that represents barriers to cross-border equity investing. Cross-listing further allows foreign investors to trade shares in their own currency (Alexander et al, 1987). This enables them to save any transaction costs associated with dealing in a foreign currency and dealing with foreign exchange regulations. For instance, Ugandans and Tanzanians do not worry about the exchange rate differentials when they decide to buy a share of the cross-listed Kenyan firms. A cross listed firm will not only have access to a broader investors' base but may also benefit from tax holidays such as no with-holding tax on dividends paid to foreign investors. Media interest in the hosting country will additionally lead to visibility and familiarization of the firm in that country. Burns and Bill (2006) notes that firms that undertake cross-listing achieve their objective of raising extra funds, while at the same time protecting their minority shareholders from the risks of takeovers. This means that a firm can retain its shareholders, but at the same time raise capital offshore.
Cross listing improves firm’s access to lower cost of external financing. Cross-listing is a mechanism through which firms can improve their access to lower-cost external financing and consequently can invest in potentially profitable projects (Inder et al, 2006). These authors note that cross-listing contributes to firm’s value as it limits the ability of controlling shareholders to extract private benefits of control. Companies will as a result have better ability to raise capital at a lower cost and pursue potential profitable projects. It implies therefore that cross-listing will improve a firm’s growth potential. Cross-listing may serve to counter the effects of market segmentation. Stulz (1999) points out that these barriers serve to segment domestic capital markets. The upshot here is that domestic investors in segmented domestic capital markets require a risk premium for bearing all the risk of the economic activities of that country (Inder et al, 2006). When firms from these segmented markets cross-list, theory anticipates the stock prices for these firms to rise and consequently their cost of capital to decline as an additional built-in risk premium compensating for these barriers dissipates (Foerster and Karolyi, 1996).
Kuria (2008) determined the short-term and long-term effects of cross-border listing announcements on companies listed at the NSE and their post listing performance, and reported that cross-listing announcements have statistically significant negative effects on stock returns. In fact, the non cross-listed firms had higher daily turnover ratios than cross-listed firms, an indicator of increased activity hence liquidity. Moreover, Mugo (2010) and Mugo et al., (2011) have reported that cross listing “may” affect firm liquidity and P/E ratios. However, a closer look at these findings reveals fatal interpretational errors as the changes were never tested for significance. Unlike the developed market, studies on cross-listing are thin. Recent work by Adelegan (2008; 2009) examined the effect of cross-listing on stock returns and stock market development in Sub-Saharan Africa and found positive abnormal returns around the announcement date, and leading to stock market development. This suggests that firms benefit from the regional cross-listing of stocks outside their home country. However, there is no study of effect of regional cross-listing of stocks on financial performance in EAC. This study, tries to fill this gap. Although regional cross-listing can promote stock market development, the decision to cross-list is taken by the firm. Thus, it is desirable to examine the impact of such a decision on firm financial performance. Firms generally are profit maximizers, and so decisions taken by firms are geared towards improving the firm’s financial performance.
3. METHODOLOGY & DATA
The population of interest for this study comprised corporations with primary listing in the NSE, and have undertaken cross-listing within the EAC stock markets. Although seven listed firms in Kenya have cross-listed, only three firms had data spanning over three years post cross-listing. These include KQ, EABL, and JIH. Therefore, a census was carried out covering all the three cross-listed companies. Therefore, the three constituted the sample.
3.1 Data Collection
Using a data collection schedule, secondary data was obtained from the firms’ published financial statements available on their websites and also from Capital Markets Authority (CMA). This included profits before tax, current assets, current liabilities, fixed assets, turnover, debt level and equity shares outstanding.

Journal of Business, Economics & Finance (2012), Vol.1 (1) Onyuma & Mugo & Karuiya, 2012 ____________________________________________________________________________________________________
________________________________________________________________________
101
3.2 Data Analysis
Financial ratio analysis was used to compute current ratios, gearing ratios, profitability ratios, and investor ratios. A correlation analysis was conducted to establish whether the findings indicated a strong positive or negative correlation. Any value that was greater than 0.5, regardless of the sign, indicated a strong correlation while any value that was lesser than 0.5 indicated a weak correlation. This type of inference has also been applied by other previous works such as Jayakumar (2002) and Kiilu (2006). The financial ratios computed included the following:
3.2.1 Profitability Ratios
i. ROCE is the return on capital employed computed as earnings before interest and taxes divided by capital employed: (EBIT/CE).
ii. GPM is the gross profit margin computed as profit before operating expenses divided by the net sales: (GP/NS)
iii. ROI is the return on investment which measures the return on the proprietor’s investment in a company – the total share capital plus the reserves that they indirectly own, computed as: (EAT/TSC).
3.2.2 Liquidity Ratios
i. CR is the current ratio which measures liquidity by dividing total current assets by total current liabilities. It is computed as (TCA/TCL). Under normal situations, a ration of 2:1 is deemed adequate
ii. QR is the quick ratio, another measure of liquidity developed to cover some aspects that current ratio do not address. It argues that for the purposes of raising quick cash, inventories should be disregarded. Generally, a ratio of 1:1 is deemed adequate. It measures liquidity by dividing current assets except inventory by total current liabilities as follows: It is computed as: (CA-I)/TCL.
3.2.3 Gearing Ratios
These ratios measure the contribution of financing by owners compared to financing by the firms creditors.
i. DER is the debt-equity ratio which shows the relationship between owners’ funds and the borrowed funds. It is the total debt divided by total shareholder’s equity. The larger the portion of owners equity, the lesser the risk faced by creditors. It is computed as: (TD/TSE).
ii. ER is the equity ratio which represents the relationship between owner’s equity and total capital employed, and computed as: (SHE/TCE).
3.2.4 Investor / valuation Ratios
i. DY is the dividend yield which is the divided per share divided by market price per share, and computed as: DPS/MP
ii. EPS is the earnings per share determined by dividing profit after taxes and preference share dividend by the total ordinary shares outstanding. It is computed as: EATP/OSO
iii. PER is the price-earnings ratio which measures how long it will take before recovering the cost of the investments. In essence, it shows the number of times the earnings are covered by the share market price. The ration is determined by dividing the market price per share by earning per share, thus computed as: MPS/EPS. This is number of times the earnings are covered by the share market price. It measures how long it will take before recovering the cost of the investments. It is the reverse of earnings yield.
4. RESULTS AND DISCUSSION
4.1 Results
All the EAC countries have a basic legal and regulatory framework for their stock market, as well as a basic legal framework and code of corporate governance. However, the legal and regulatory frameworks for host countries (Uganda, Tanzania , Rwanda) seems to be lower than those of the home country, Kenya with a modern computerized depository and share trading system running.
Journal of Business, Economics & Finance (2012), Vol.1 (1) Onyuma & Mugo & Karuiya, 2012 ____________________________________________________________________________________________________
________________________________________________________________________
102
4.1.1 Description of Cross-listed Firms under Analysis
The following three firms had data spanning more than three years following cross-listing in EAC. They therefore form the cross-listed firms under consideration and results presented below stem from analysis of data for EABL, KQ and JHL. East African breweries Ltd. is a public limited liability company incorporated under the laws of the Republic of Kenya (see www.eabl.com). It has 150 million authorized ordinary shares of KShs.10/- representing an Authorized share capital of KShs.1.5 Billion and 108.989 million issued and fully paid shares representing an Issued share capital of KShs.1, 089,893,110. Founded in 1922, East African Breweries Ltd is the group holding company for the largest brewing concern in East Africa with an annual turnover of US $325 million. East African Breweries Ltd owns 100% shares in Kenya Breweries, Central Glass and Kenya Maltings. In Uganda, it owns 93% of Uganda Breweries Ltd and in Tanzania, 86% of Kibo Breweries. The first cross border listing in the East African market occurred with the listing of East African Breweries Ltd on the USE in 2001.
Kenya Airways was first listed in 1996 on the Nairobi Stock Exchange. Incorporated in 1977 as a company wholly owned by the Government of Kenya following the collapse of East African Airways, the company was privatized-first in 1995 when 26% of the shares of the company were sold to KLM Royal Dutch Airlines and then in 1996 involving an initial public offering of the Company’s shares in the biggest share offering in Kenya’s history, which was oversubscribed by 82% (see www.kenya-airways.com). Since then the company’s share has attained ‘blue chip’ status on the NSE owing to, among other factors, a high level of corporate disclosure, earnings growth and the share’s relatively high liquidity. Presently KQ is a public limited liability company incorporated under the laws of the Republic of Kenya. It has 1billion authorized ordinary shares of KShs.5/- representing an authorized share capital of KShs.5 Billion and 461,615 million issued and fully paid shares representing an Issued share capital of KShs.2, 308,077,420. The decision to cross list KA’s shares on the Uganda Securities Exchange was made as part of the company’s pursuit of its strategy to be a major player in the African region. This move enhanced the Company’s profile both regionally and internationally. Kenya Airways was the second company to be cross listed on the USE in 2002.
Jubilee Holdings Limited is already quoted on the Nairobi Stock Exchange, and was be the first Insurance Company to be quoted on the USE. It has been in operation since 1937 and boasts of a presence in the three East African countries. Its Ugandan operations were revived in 1992 by the formation of The Jubilee Insurance Company of Uganda Limited together with the Aga Khan Fund for Economic Development, the International Finance Corporation and the Development Finance Company of Uganda Limited. Today Jubilee is considered one of the leading insurance companies in Uganda (see www.jubileeinsurance.com).
4.1.2 Pre and Post Financial Performance of Cross-listed Companies
It is evident from Table 3 below that the profitability and liquidity ratios of EABL improved after it first cross-listed in year 2001. The firm’s current and quick ratios outperformed the recommended 2 and 1 times parameter. However, it can also be noted that the ratios that deal with the shares outstanding declined-these ratios measure the relative return on shareholders. Due to increased share capital, the gearing of the firm reduced after it cross-listed. The Return on Capital Employed and Return on Investments ratios improved marginally after EABL cross-listed. Due to dilution of share capital, we find the yield ratios reducing drastically. This is because the increase in profitability was not commensurate with the increase in the shares outstanding. The price-earnings ratio also improved. When the P/E ratio is high, it implies that shareholders have more confidence in the firm thus willing to wait for long years to recoup their earnings. When it is low, it may imply that the investments made by the management are so good such that they take fewer years to recoup the initial capital outlay.
Secondly, the liquidity of KQ deteriorated after it first cross-listed in year 2002. This is in respect to current ratio and quick ratio. The return on capital employed and investments ratios also reduced drastically. Debt and equity ratios however increased in this period as there were more shares that were floated, probably due to increased borrowing needs. The profitability ratio measured by the gross profit margin however increased in during the same period. Although price to earning ration went up, the Earnings and Dividend Yields however reduced drastically.
There was a great improvement on the liquidity of Jubilee Insurance Holdings after it cross-listed. A significant improvement on the returns ratios was also noted in year 2008. Due to increase in its proportion of issued shares, its equity ratio also improved. This also led to decrease of the yield ratios as there was a dilution effect. Due to more funds at the disposal, the profitability and return ratios increased over the same period.
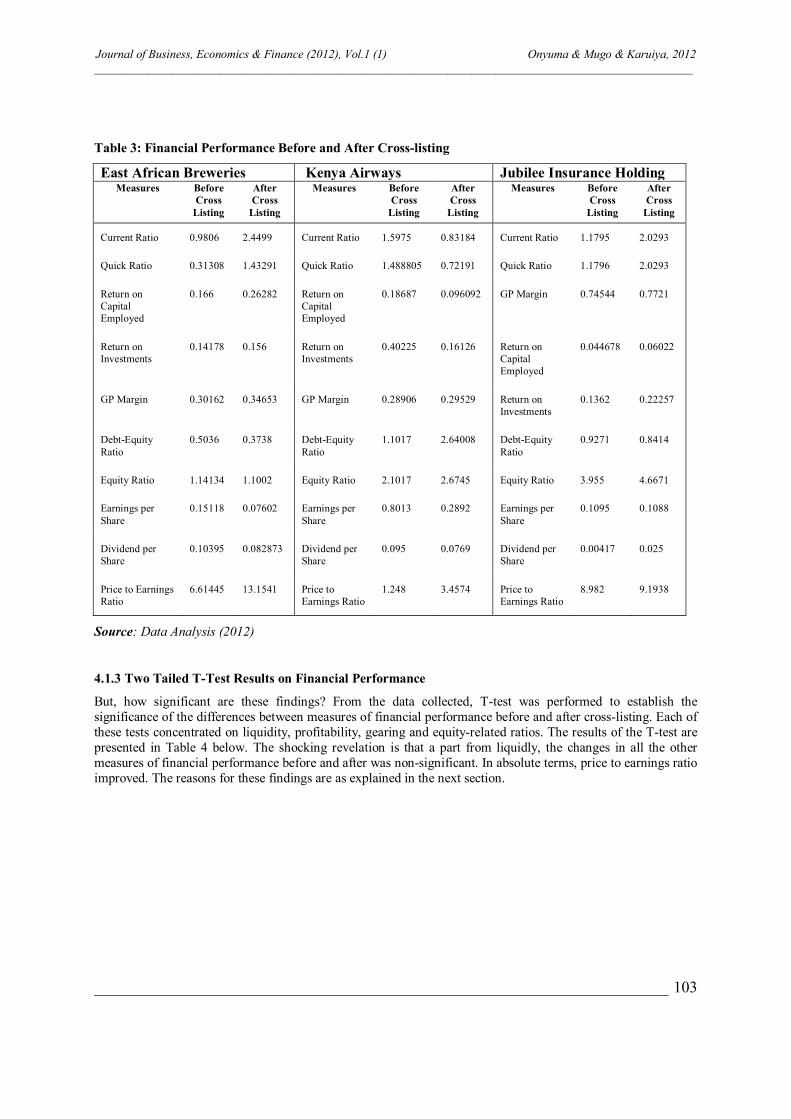
Journal of Business, Economics & Finance (2012), Vol.1 (1) Onyuma & Mugo & Karuiya, 2012 ____________________________________________________________________________________________________
________________________________________________________________________
103
Table 3: Financial Performance Before and After Cross-listing
East African Breweries Kenya Airways Jubilee Insurance Holding Measures Before
Cross Listing
After Cross
Listing
Measures Before Cross
Listing
After Cross
Listing
Measures Before Cross
Listing
After Cross
Listing
Current Ratio 0.9806 2.4499 Current Ratio 1.5975 0.83184 Current Ratio 1.1795 2.0293
Quick Ratio 0.31308 1.43291 Quick Ratio 1.488805 0.72191 Quick Ratio 1.1796 2.0293
Return on Capital Employed
0.166 0.26282 Return on Capital Employed
0.18687 0.096092 GP Margin 0.74544 0.7721
Return on Investments
0.14178 0.156 Return on Investments
0.40225 0.16126 Return on Capital Employed
0.044678 0.06022
GP Margin 0.30162 0.34653 GP Margin 0.28906 0.29529 Return on Investments
0.1362 0.22257
Debt-Equity Ratio
0.5036 0.3738 Debt-Equity Ratio
1.1017 2.64008 Debt-Equity Ratio
0.9271 0.8414
Equity Ratio 1.14134 1.1002 Equity Ratio 2.1017 2.6745 Equity Ratio 3.955 4.6671
Earnings per Share
0.15118 0.07602 Earnings per Share
0.8013 0.2892 Earnings per Share
0.1095 0.1088
Dividend per Share
0.10395 0.082873 Dividend per Share
0.095 0.0769 Dividend per Share
0.00417 0.025
Price to Earnings Ratio
6.61445 13.1541 Price to Earnings Ratio
1.248 3.4574 Price to Earnings Ratio
8.982 9.1938
Source: Data Analysis (2012)
4.1.3 Two Tailed T-Test Results on Financial Performance
But, how significant are these findings? From the data collected, T-test was performed to establish the significance of the differences between measures of financial performance before and after cross-listing. Each of these tests concentrated on liquidity, profitability, gearing and equity-related ratios. The results of the T-test are presented in Table 4 below. The shocking revelation is that a part from liquidly, the changes in all the other measures of financial performance before and after was non-significant. In absolute terms, price to earnings ratio improved. The reasons for these findings are as explained in the next section.
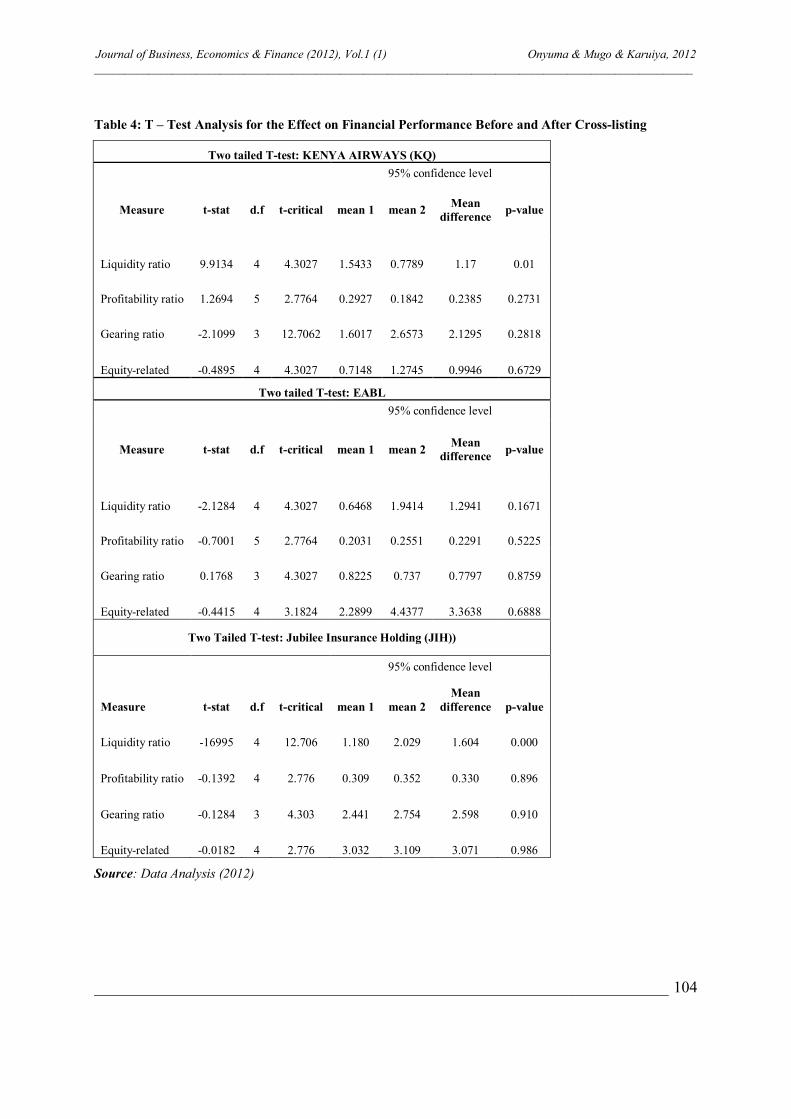
Journal of Business, Economics & Finance (2012), Vol.1 (1) Onyuma & Mugo & Karuiya, 2012 ____________________________________________________________________________________________________
________________________________________________________________________
104
Table 4: T – Test Analysis for the Effect on Financial Performance Before and After Cross-listing
Two tailed T-test: KENYA AIRWAYS (KQ)
95% confidence level
Measure t-stat d.f t-critical mean 1 mean 2 Mean difference p-value
Liquidity ratio 9.9134 4 4.3027 1.5433 0.7789 1.17 0.01
Profitability ratio 1.2694 5 2.7764 0.2927 0.1842 0.2385 0.2731
Gearing ratio -2.1099 3 12.7062 1.6017 2.6573 2.1295 0.2818
Equity-related -0.4895 4 4.3027 0.7148 1.2745 0.9946 0.6729
Two tailed T-test: EABL
95% confidence level
Measure t-stat d.f t-critical mean 1 mean 2 Mean difference p-value
Liquidity ratio -2.1284 4 4.3027 0.6468 1.9414 1.2941 0.1671
Profitability ratio -0.7001 5 2.7764 0.2031 0.2551 0.2291 0.5225
Gearing ratio 0.1768 3 4.3027 0.8225 0.737 0.7797 0.8759
Equity-related -0.4415 4 3.1824 2.2899 4.4377 3.3638 0.6888
Two Tailed T-test: Jubilee Insurance Holding (JIH))
95% confidence level
Measure t-stat d.f t-critical mean 1 mean 2 Mean
difference p-value
Liquidity ratio -16995 4 12.706 1.180 2.029 1.604 0.000
Profitability ratio -0.1392 4 2.776 0.309 0.352 0.330 0.896
Gearing ratio -0.1284 3 4.303 2.441 2.754 2.598 0.910
Equity-related -0.0182 4 2.776 3.032 3.109 3.071 0.986
Source: Data Analysis (2012)
Journal of Business, Economics & Finance (2012), Vol.1 (1) Onyuma & Mugo & Karuiya, 2012 ____________________________________________________________________________________________________
________________________________________________________________________
105
4.2 Why Cross-Border Listing may not Affect Firms’ Financial Performance?
A closer look at the benefits that accrue to a firm will perhaps shed more light on why cross listing in East Africa is not a viable investment. Cross-listing is followed by a substantial divestment by the controlling shareholders or surrender of control to outsiders (Mikkelson et al. 1997). Firms which have cross-listed are no longer owned by citizens of one country. Moreover, strong financial performance following cross-listings may be observed for firms from countries that are substantially integrated in the world markets. For instance, Canadian firms experience a dramatic long-run capital market reaction to USA cross-listings as European and Asian firms, given the long standing evidence of USA equity market integration. However, market segmentation hypothesis cannot explain the time series pattern of listings. Since listings have continued to grow, it is expected that with greater integration of markets overtime, the overall benefits should diminish since the cost of capital for companies is increasingly determined globally. Evidence also show that segmented markets cannot explain why share price reactions are largest for exchange-listed firms (Miller, 1999) nor can it explain why listing share-price declines are smaller for listings associated with capital raising activity (Foerster and Karolyi, 1996). For any potential cross listing, the driving force is to access new and different investors. This will increase company’s capital base hence securing it. The East African security markets offer this, but listing alone will not guarantee that trading and ease of conversion of shares of the company into cash will improve. A listing firm will have to consider other drivers such as the availability of service providers, competitiveness between the East African security markets and the efficiency of the stock exchange in which it cross-lists. The cost of equity capital of a cross listed firm will, generally, be relatively lowered due to a decline in the transaction costs or an improvement in the quality of information available to investors hence favourable to the firm’s profitability. However, this depends on the industrial structure in which the firm operates. Firms that are operating in highly competitive markets and are industry’s followers will gain less or nothing, while companies that operate as a monopoly or are industry’s leaders will have much to gain from cross-listing. Also, there are enormous costs to be incurred as a result of cross-listing by companies. Maintaining an additional listing also generates extra costs like fees for the stock exchange and additional reporting requirements.
Moreover, a cross listed firm will not only have access to a broader investors' base but may also benefit from tax holidays such as no with-holding tax on dividends paid to foreign investors. However, in this age of electronic trading providing easy access to foreign markets, that argument for foreign listing can give firms a broader shareholder base no longer makes sense. Moreover, a foreign listing is neither a condition, nor a guarantee for attracting foreign shareholders. It may improve access to private investors, but as capital markets become increasingly more global, institutional investors typically invest in stocks they believe are attractive, irrespective of where they are listed. For instance, CalPERS, a large global equity investor holds over 2,400 listed stocks in its portfolio, but less than 10 percent of them have cross listing in USA. In fact, due to better trading liquidity in the home market, the institutional investors often prefer to buy a stock there rather than the cross-listed stock. Furthermore, media interest in the hosting country will additionally lead to visibility and familiarization of the firm in that country. Cross-listed companies are also likely to get more media coverage perhaps due to their large size. However, after correcting for size, Tobbs and Goedhart (2008) found that cross-listed European firms in USA are covered by only 2 more analysts than non-cross-listed. Such a small increase is unlikely to have any financial significance, after all major media houses, like Nation Media Group and The Standard, and stock brokers, like Dyer & Blair in Kenya have also established their branches in other EAC countries.
In addition, cross-listing of companies is also expected to improve their profitability since more market access in cross listed country is likely to bring in more revenue. They are also likely to borrow less because they have access to another pool of capital. Again, this will depend on the cost structure of the company and the cost of doing business in that country, in addition to the intended use of the capital raised. Davis-Friday et al. (2003) have showed that for Mexican firms, on average, cross-listed (ADR) firms are smaller, more highly levered and less profitable than non-cross-listed firms. Besides, companies which cross-list are expected to access a large pool of capital that can be used to develop the company and improve its financial performance. This is possible where companies cannot easily attract large amounts of new equity capital in their home country. However, as investors increasingly come to trade around the world, local stock markets have provided a sufficient supply of equity capital to firms in he developed economies. Cross-listing therefore does not appear to confer a compelling benefit. In fact, three out of four of USA cross-listings of firms from developed economies through 420 ADRs on NASDAQ, NYSE and AMEX between 1970 and 2008 have never involved any raising of capital in USA share transactions (Tollmunen and Torstila, 2005). They only provided foreign firms with acquisition currency
Journal of Business, Economics & Finance (2012), Vol.1 (1) Onyuma & Mugo & Karuiya, 2012 ____________________________________________________________________________________________________
________________________________________________________________________
106
for USA and thus doubled their acquisition of USA firms within five years of cross-listing. Conventional wisdom may imply that cross-listing may improve liquidity of the cross-listed shares. The improved relations between the cross-listed firm and the EAC market participants in which it will list should improve the liquidity of the firm’s shares, increase investor recognition hence giving the firm greater prestige and improving access to capital. It will also help a firm to easily switch to another country’s offerings when the demand of its share is low in the parent country. Although liquidity is difficult to measure, the trading volumes of cross listed shares (ARDs) of European firms in the USA typically account for only 3 percent of these firms’ total traded volumes. Tobbs and Goedhart (2008) have however reported that in USA, such cross-listing do not much improve liquidity. Cross-listed firms become subject to scrutiny of various regulatory authorities, thus facing several challenges such as complying with multiple regulators in the three countries and lacking harmonized legislations and disparities in physical infrastructure such as the ICT platform that are different in each country. This may pose a problem to the firm in that it may find it corporate policies conflicting between different countries. This will be a problem in that strong corporate culture cannot be established. There is usually a cost associated with these challenges. In fact, if the lower cost of capital from eliminating investment barriers, is the main incentive, all firms for which capital would fall sufficiently to justify the costs of overseas listing would embrace this trend. Investors, on the other hand, will enjoy greater protection from the increased number of regulators who will help keep the company’s management in check. Additionally, the investor will be able to diversify his investments in the increased number of listed firms and reduce his risks. The level of corporate governance in developed markets is assumed to be better than in developing markets. For instance, UK and USA capital markets may once have had higher corporate governance standards than their counterparts in other part of the world. Those higher standards lent credence to the argument that firms apply for cross-listing in developed markets would inevitably disclose more and better information, give shareholders greater influence, and protect minority investors more fully thereby improving these firms’ ability to create value for shareholders. However, many economies have radically improved their own corporate governance requirements. Consequently, the governance advantages once derived from a second listing in the developed markets hardly exist today for firms based in developing markets. The irony is that Kenyan firms are coming from a more developed market to less developed securities market, no wonder they do not derive any improved financial performance.
Lel and Miller (2006) have examined a primary outcome of corporate governance, the ability to identify and terminate poorly performing CEOs, to test the effectiveness of USA investor protections in improving the corporate governance of cross-listed firms. They found that firms from weak investor protection regimes that are cross-listed on a major USA exchange are more likely to terminate poorly performing CEOs than non-cross-listed firms. However, cross-listings on exchanges that do not require the adoption of the most stringent investor protections like OTC and private placements are not associated with a higher propensity to shed poorly performing CEOs. Michael et al. (2004) explain that some members of a company like managers and large shareholders who have control may enjoy private benefits (control benefits) but not minority shareholders. There can be non-pecuniary, such as the ability to direct company’s resources, or use of a position for the enhancement of one’s human capital. This is why managers, out of their own ambitions, build their own empires causing an agency conflict with the shareholders. The recent financial crisis has put to question not only the governance and regulatory levels in more developed financial systems. Both developed and developing markets were together affected. Although foreign capital flow may promote growth, however during periods of volatility, more foreign capital flows have been associated with slower firm growth (Mody and Murshidi, 2011). It is clear that Kenyan firms which are cross-listing to other EAC markets are moving from a more developed market with relatively higher level of corporate governance to ones with weak legal institutions and less developed financial markets. In fact, the global institutional investors such as fund managers holding cross-listed stocks usually overreact during financial crisis and contagion, engaging in momentum trading, exacerbating volatility, and aiding in transmitting crises across countries even in the absence of fundamental linkages (Gelos, 2011). The recent global crisis has highlighted the volatility of international capital flows, and the current surge in flows to emerging markets has reignited the debate on reforms to the international financial architecture as appropriate policy response. Although conventional wisdom has long held that firms cross-list their shares on other developed exchanges buy their access to more investors, greater liquidity, a higher share price, and a lower cost of capital, the strategy seems not to make much sense perhaps because capital markets have become more liquid and integrated and investors more global, or perhaps because the benefits of cross-listing have all along been over stated. Probably that is why between May 2002 and may 2008 two-hundred and twenty nine foreign firms have terminated their cross-listing from NYSE, NASDAQ, and LSE (international main market) as requirements for deregistering was made easy through a requirement that if less than 5 percent of global trading in their shares takes place on US stock exchanges (Tollmunen and Torstila, 2005; Tobbs and Goedhart, 2008). The trend is the same for Tokyo stock exchange. On the average, these firms estimated that on the average, they would save,
Journal of Business, Economics & Finance (2012), Vol.1 (1) Onyuma & Mugo & Karuiya, 2012 ____________________________________________________________________________________________________
________________________________________________________________________
107
upon delisting, $20 million each in annual service and compliance costs. This sum may, however, exclude the time firm executive spend monitoring compliance and disclosure in cross-listed countries. In fact, on announcement of such delisting from cross-listing, there has been no negative share price response.
4.3 Areas of Policy Considerations
This study has presented some evidence on the effect of cross-border listing on the financial performance of listed firms in EAC stock markets. It was shown that cross listing leads to improvement in a variety of firm fundamentals as it is associated with improved liquidity, earnings, and price to earnings ratio. It was reported that firms benefit less from cross-listing of shares outside their home market. Our analysis so far has uncovered no clear evidence of material value creation to shareholders of cross-listed companies. The study found neither anything suggesting that cross listing has significant impact on their financial performance nor any systematically less borrowing for asset investment. Nonetheless, we did uncover some positive findings only relating to improved market confidence as shown by positive changes in the price-to-earnings ratio for all the cross-listed firms. Every EAC company needs to know that it has access to capital markets beyond the geographical boundaries of their country and it can list in all the three East African capital markets. They should also know that cross listing of firms will promote genuine regionalization with an opportunity for stakeholders in the region to own a part of a successful regional company. But it may not inject strong financial performance.
For these reasons, policy makers and stock market authorities in EAC should provide incentives to encourage corporate firms to cross-listing since it may just promote the integration of the regions capital markets. Cross-border listings are the building blocks for the construction of regional markets. As such, full integration of capital markets requires harmonization of laws, and unification of currency, which in turn help standardize pricing of stocks, and reduce investors transaction and information costs when forming regional portfolio allocation. Fast track policies aimed at integrating the markets, harmonizing trading practices, and trading engines, improving governance structures and attracting foreign investors and listing. To foster an increase in regional cross-listings therefore, appropriate and complementary strategies are needed by exchanges, listed firms, and policy makers. For firms to pursue regional cross-listings that are market driven, they need to improve on corporate governance, minimize information asymmetry, increase their net worth and harmonize their accounting and reporting format with international standards. First, policy makers need to give due consideration to taking the necessary steps to further integrate EAC stock markets. This would enable easy access of regional capital markets by firms, and not necessarily consider cross-listing. The introduction of policy measures that focus on shareholder protection and information, and the proper code and regulation of corporate governance are paramount. Strong investor protection and transparency are prerequisites for capital inflows. Such measures are important if the stock markets are to make external capital available to firms.
In addition, efforts should also be made aimed at improving the regional flow of information and coordination and communication infrastructure to facilitate market integration as opposed to cross-listing. Daily and hourly dissemination of information about the stock market should be undertaken. This could elicit interest both on regional and domestic investors. Moreover, the regional countries should work towards harmonization of their different currencies.2 However, the EAC member countries should avoid hasty implementation of a monetary union (Onyuma, 2006) but first bridge their disparate economic strengths by the weaker economies raising their per capita income levels, and harmony in the management of the economies to avoid the recent shocks seen in the eurozone where over expenditure in Greece is pooling down other states.3 Introduction of regional integration policies geared at removing legal, regulatory barriers.
2 Kenya currently has the strongest currency in the EAC, with its shilling trading at Sh.87 to $1, Uganda’s is Sh.2, 220, while Tanzania’s is Sh.1,515. 3Currently, Kenya’s per capita income is $770, Rwanda’s is $460, while Burundi’s is $150.

Journal of Business, Economics & Finance (2012), Vol.1 (1) Onyuma & Mugo & Karuiya, 2012 ____________________________________________________________________________________________________
________________________________________________________________________
108
REFERENCES
Adelegan, O.J, (2008) Can a Regional Cross-Listing Accelerate Stock Market Development? Empirical Evidence from Sub-Saharan Africa, IMF Working Paper 08/281 (Washington: International Monetary Fund).
Adelegan1, O. J. (2009) Impact of the Regional Cross-Listing of Stocks on Firm Value in Sub-Saharan Africa. IMF Policy Discussion Paper No.WP/09/99 May. Washington, DC: IMF.
Alexander G., C. Eun, and S. Janakiramanan. (1987). Asset Pricing and Dual Listing on Capital Market. A Note. Journal of Finance.
Burns, Natasha, and Francis B. Bill. 2006. Cross Listing and Legal Bonding: Evidence from mergers and acquisitions University of Georgia. New York. Available at; http://www.ceistorvergay.it/conferenzconvergin/banking&finance.
Chan-Lau, Jorge A. (2010) Regulatory Capital Charges for Too-Connected-to-Fail Institutions: A Practical Proposal. IMF Working Paper No. 98. Washington, DC: IMF.
Claessens, S., D. Klingebiel, and S. Schmukler, (2002) Explaining the Migration of Stocks from Exchanges in Emerging Economies to International Centers,” Center for Economic Policy Research Working Paper No. 3301.
Demirguc-Kunt, A., T. Beck, and P. Honohan, (2008) Finance for All? Policies and Pitfalls in Expanding Access,” A World Bank Policy Research Report, (Washington: The World Bank).
Dobbs, R. and Goedhart, M. H. (2008) Why Cross-listing Shares Doesn’t Create Value. The McKinsey Quarterly on Perspectives on Corporate Finance & Strategy, No.29 (Autum):18-23.
Domowitz, I., J. Glen, and A. Madhavan (1998) International Cross-Listing and Order Flow Migration: Evidence from an Emerging Market. The Journal of Finance, Vol. 53, No. 6, (Dec.). pp. 2001–2027.
Faruqee, H. (2007) Equity Market Integration. In Decressin J.H. Faruqee and W. Fonteyne eds., Integrated Europe’s Financial market, (Washington: International Monetary Fund).
Forester, S. and G. Karolyi 1996. The Effects of Market Segmentation And Liquidity On Asset Prices. Evidence from Foreign Stocks Listing in the USA, Ohio State University Working Paper.
Gelos, G. (2011) International Mutual Funds, Capital Flow Volatility, and Contagion–A Survey. IMF Working Paper No. 92: Washington, DC: IMF.
Hargis, K, and Ramanlal, P. (1998) When Does Internationalization Enhance the Development of Domestic Stock Markets? Journal of Financial Intermediation, vol.7(3), pp. 263–292.
Hargis, K. (2000) International Cross-Listing and Stock Market Development in Emerging Economies. International Review of Economics and Finance, 9, pp. 101–122.
Inder, Khurana , Xiumin Martin, Raynolde Pereira. 2006. Cross-listing and firms growth. University of Missouri. Columbia. Available at; www.2wu-wien.ac.af
Inder, Khurana, Raynolde Pereira, and Xiu Xiumin. (2004) Does cross-listing lead to a higher firm growth? University of Missouri. Columbia. Available at; http//www.fma.org/Chicago/papers-cross listing
Jayakumar, V. (2002) Impact of International Cross-listing on Local Exchanges: Evidence from Chile. International Review of Finance, 3:3/4, pp. 189-211.
Jayaraman, N, Shastri, K, and Tandon, K. (1993) The Impact of International Cross Listings on Risk and Return: The Evidence from American Depositary Receipts. Journal of Banking and Finance, vol. 17, pp. 91–103.
Karolyi, G. A (2004). Why Do Companies List Shares Abroad? A Survey Of The Evidence And Its Managerial Implications In Financial Markets, Institutions And Instruments. Blackwell Publishers.
King, M. R. and Segal, D. (2004) International Cross-Listing and the Bonding Hypothesis. Bank of Canada Working Paper No. 2004-17.
Kiilu, D. 2006. Comparison of Financial and Non Financial Performance of Companies Before and After Going Public. Unpublished MBA Project. Egerton University.
Kuria H. Mwangi. (2008). Short-term and Long-term effects of cross-border listing announcements on companies listed at the NSE and their post listing performance. Unpublished MBA Project. University of Nairobi.
Lau, S., D. Diltz and V. Apilando (1994) Valuation of International Stock Exchange Listings. Journal of Banking and Finance.
Lel, Ugur and Miller, Darius P. (2006) International Cross-listing, Firm Performance and Top Management Turnover: A Test of the Bonding Hypothesis. Federal Reserve System International Finance Discussion Papers No. 877 (September): FRSIF.

Journal of Business, Economics & Finance (2012), Vol.1 (1) Onyuma & Mugo & Karuiya, 2012 ____________________________________________________________________________________________________
________________________________________________________________________
109
Levine, R and S. Schmukler (2003) Migration, Spillover and Trade Diversion: The Impact of Internationalization on Stock Market Liquidity, University of Minnesota working paper.
Miller, D. 1996. Why do firms list in the US? An empirical analysis of the depository receipt market. University of California at Irvine Working Paper.
Miller, D., (1999) The Market Reaction to International Cross-Listings: Evidence from Depository Receipts”, Journal of Financial economics, 51, pp. 103–123.
Mody, Ashoka and Murshid, Antu Panini (2011) Growth from International Capital Flows: The Role of Volatility Regimes. IMF Working Paper No. 90: Washington, DC: IMF.
Mugo, R. K. (2010) An Assessment of the Effects of Cross-Border Listing on Firm’s Financial Performance. The Case of Kenyan Listed Companies. Unpublished MBA Project. Egerton University.
Mugo, R. K., Onyuma, S. O. and Karuitha, J. K. (2011) Regional Cross-Border Listing and Firm’s Financial Performance in Eastern Africa. Paper Presented at the 7th International Conference of Moi University.
Onyuma, S. O. (2012) Paradigm Shift in Stock Exchanges: Automation, Competition, Governance, Integration and Regulation of Stock Markets. Senegal: CODESREA (forthcoming).
Onyuma, S.O. (2006) Regional Integration of Stock Exchanges in Africa. African Review of Money, Finance & Banking. Supplementary Issue: 97-122.
Pagano, M., A.A. Roell, and J. Zechner, (2002) The geography of equity listing: Why do European Companies List Aabroad? Journal of Finance 57, 2651–2694.
Shah, H., A. Carvajal, G. Bannister, J. Chan-Lau, and I. Guerra, (2008) Equity and Private Debt Markets in Central America, Panama, and the Dominican Republic. IMF Working Paper 07/288, Washington DC: IMF.
Tahari, A., P. Brenner, E.D Vrijer, M. Moretti, A.S. Senhadji, G. Sensenbrenner, and J. Sole, (2007) Financial Sector Reforms, Prospects for Financial Integration in Maghreb Countries,” IMF Working Paper 07/125 (Washington: International Monetary Fund).
Tollmunen, Pasi and Torstila, Sami (2005) Cross-listing and M&A Activity: Transatlantic Evidence. Financial Management, Vol. 34(1):123-42.